The Synergy Model of Quality Tools and Methods and Its Influence on Process Performance and Improvement


Abstract
:1. Introduction
2. Literature Review
3. Materials and Methods
- To rank the causes from the largest to the smallest value,
- To determine the percentage of causes based on the formula Structure (S) by Formula (3),
- 3.
- To determine the cumulative structure of causes, based on the formula Cumulative structure (CS) by Formula (4),
- 4.
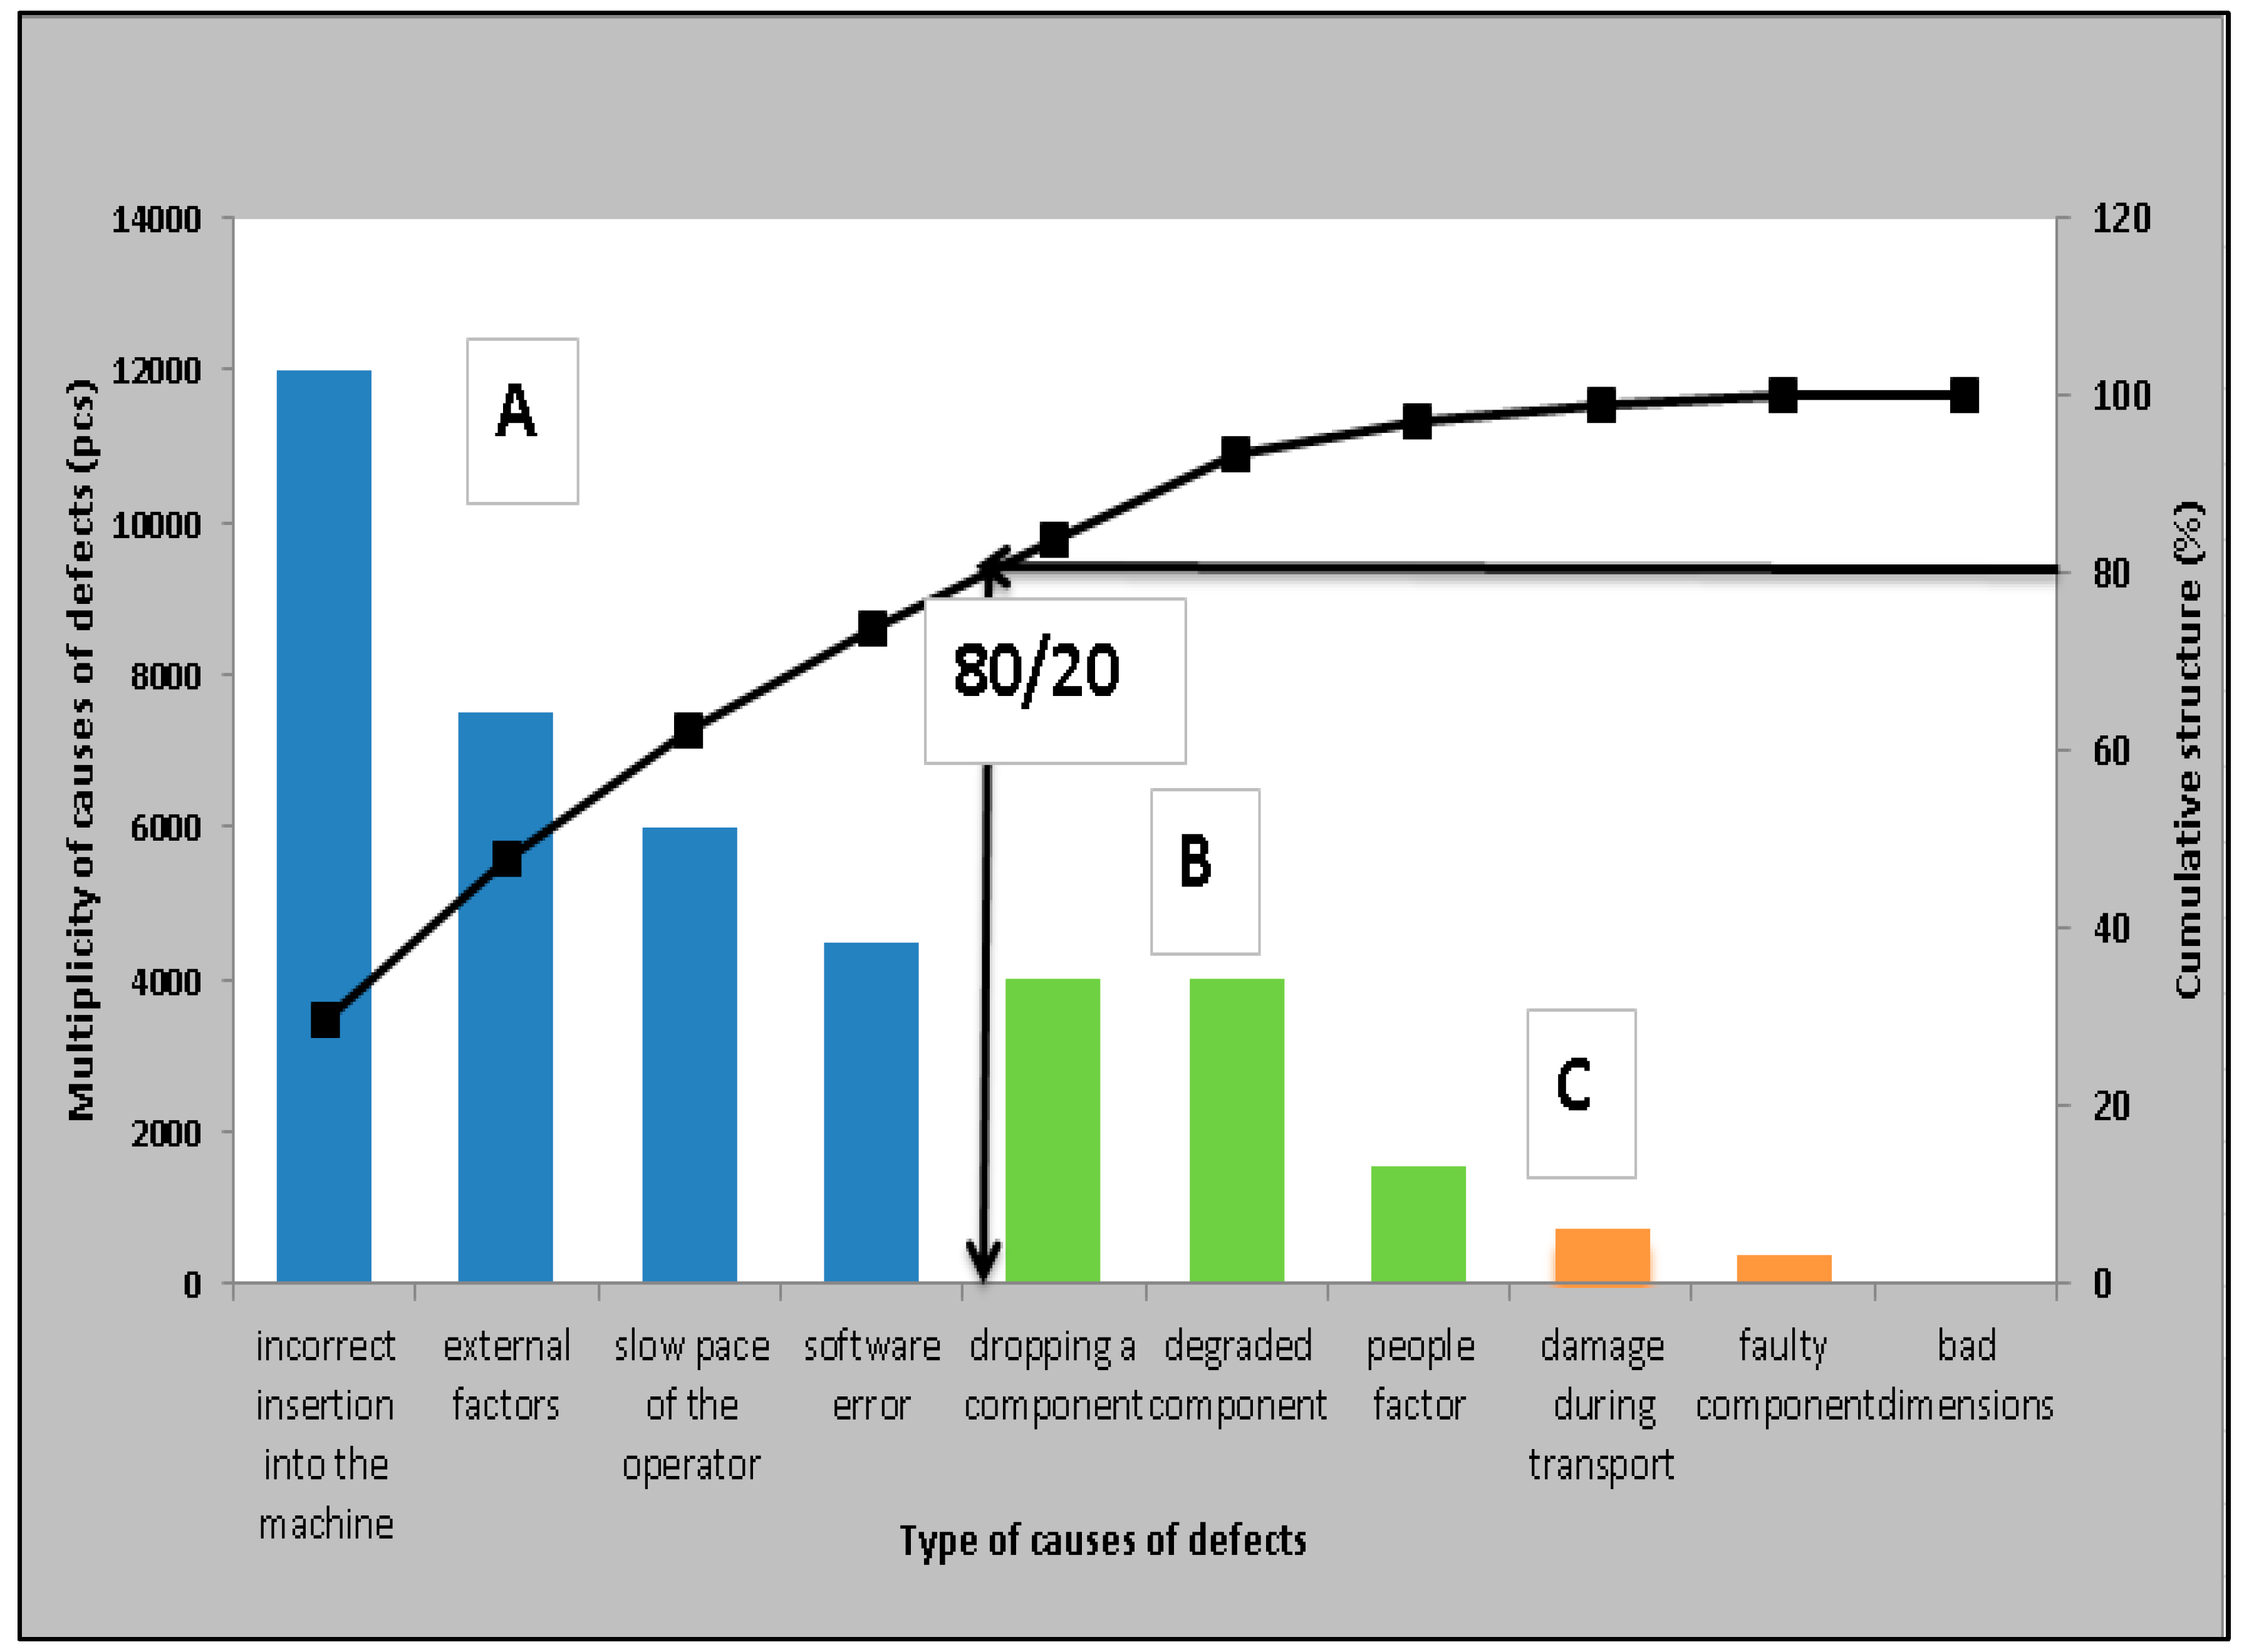
- To set category of causes (affinity diagram)—A, B, C—by rules 80/20; Category (A) represents various analyzed items for condition less than 80% of cumulative structure, Category (B) represents various analyzed items for condition less than 98% of cumulative structure, Category (C) represents various analyzed items for condition greater than 98% of cumulative structure.
- 5.
- To create a bar graph of the number of causes,
- 6.
- To create Lorenz curve of cumulative percentage.
4. Results
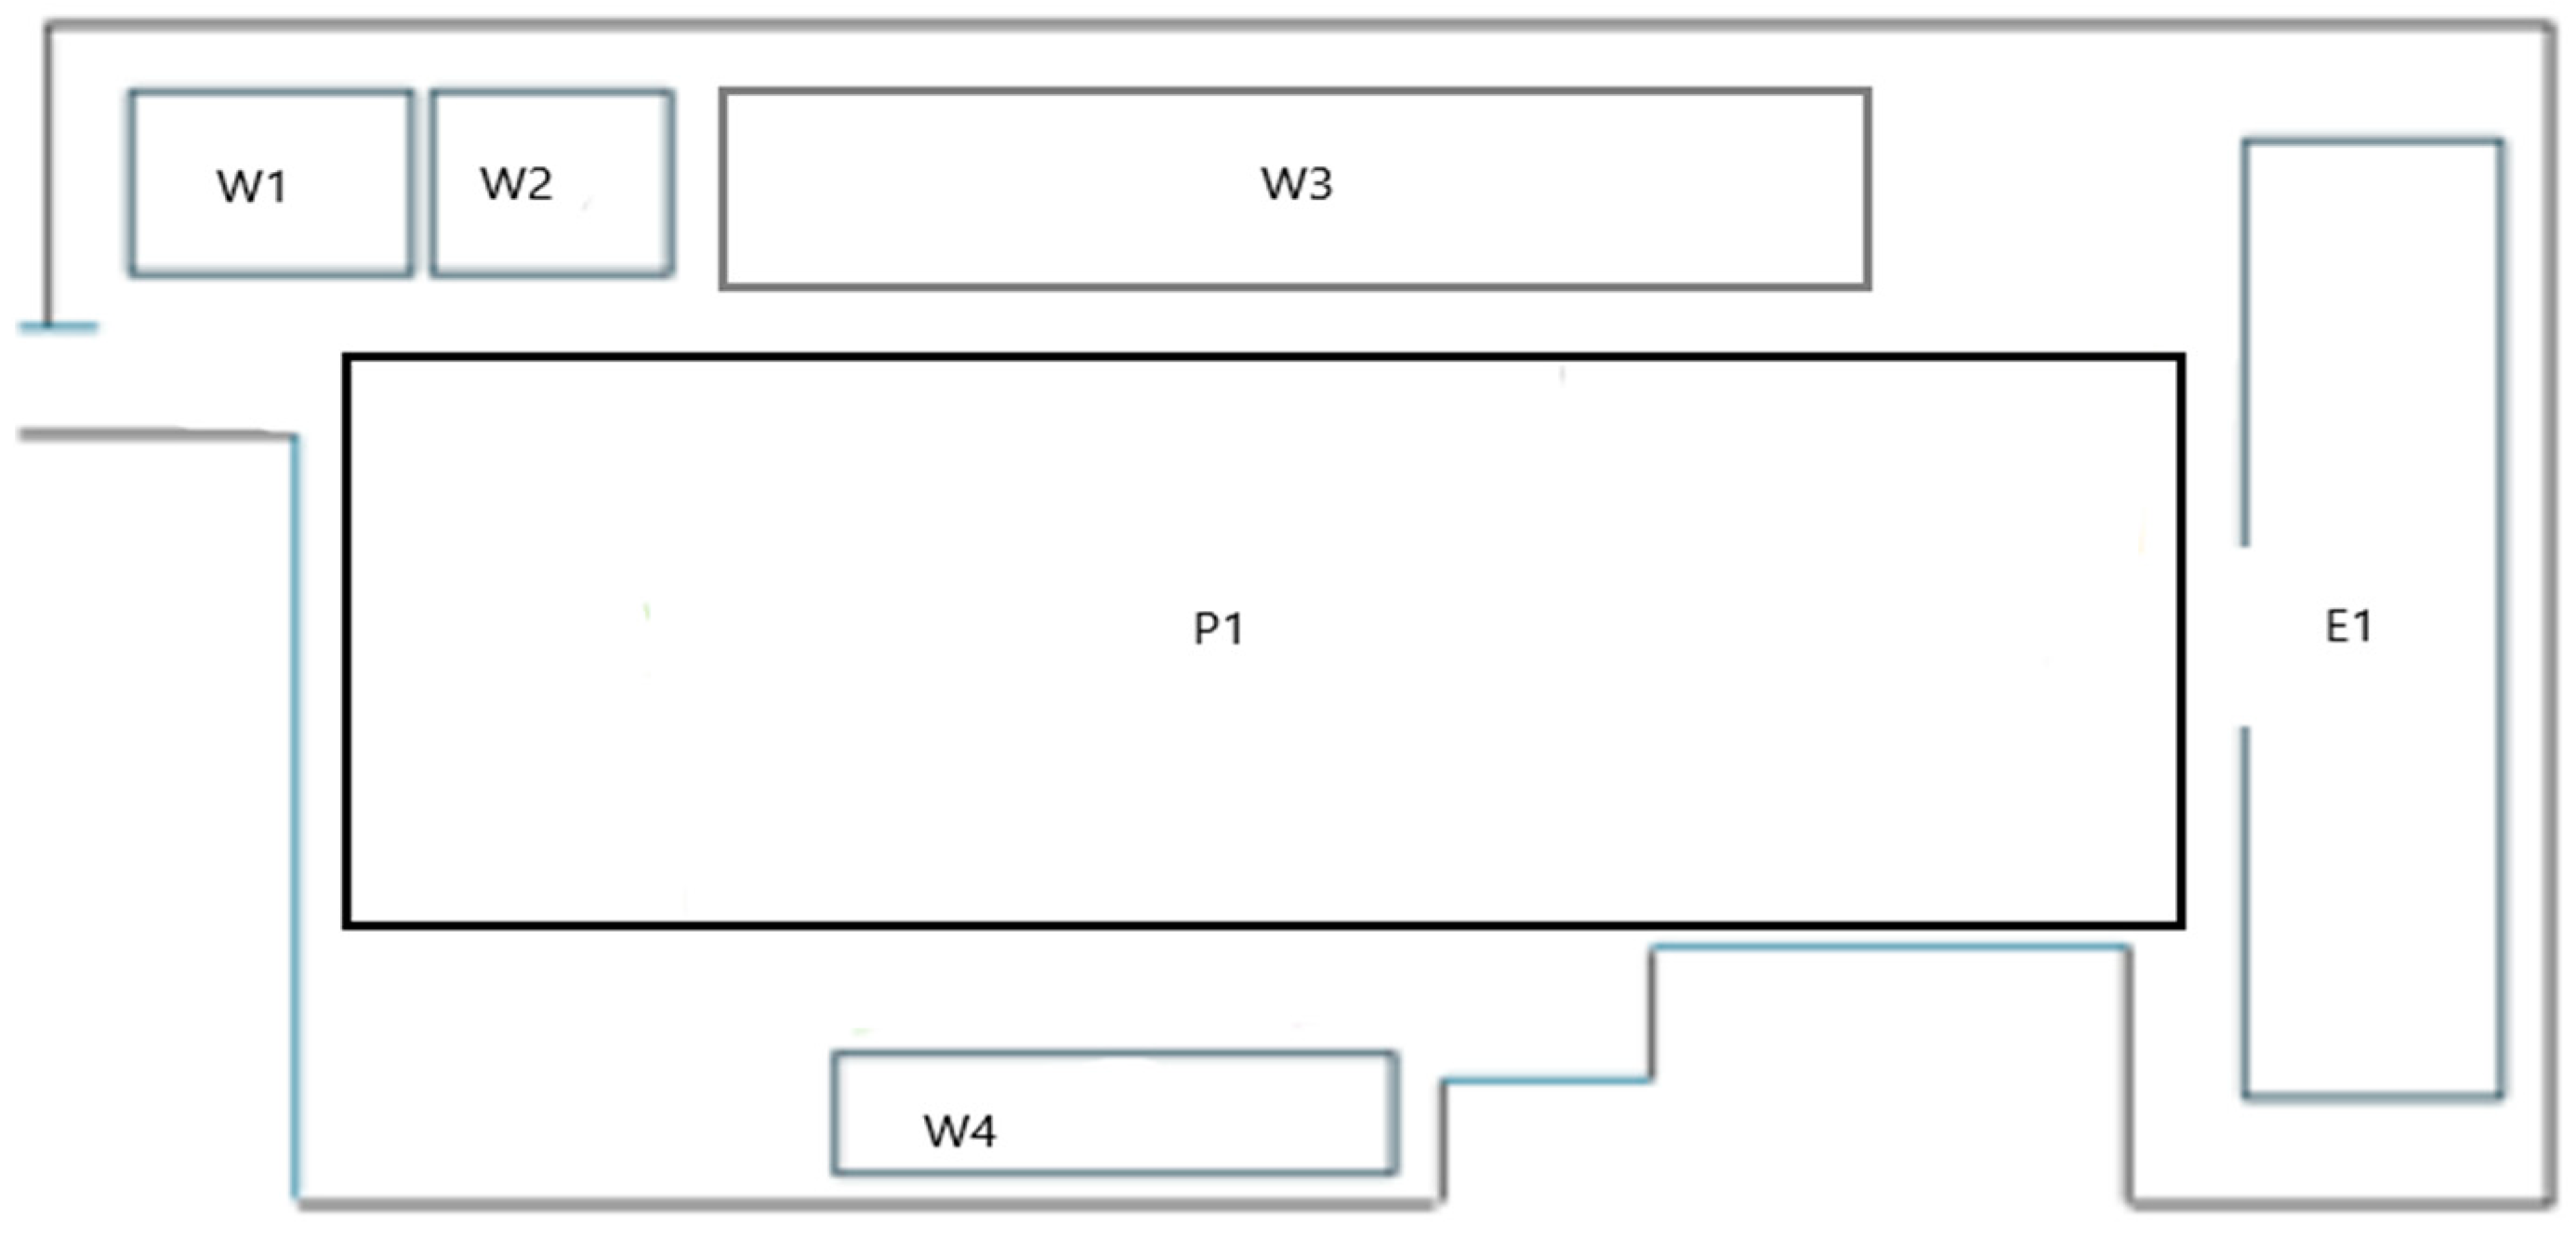
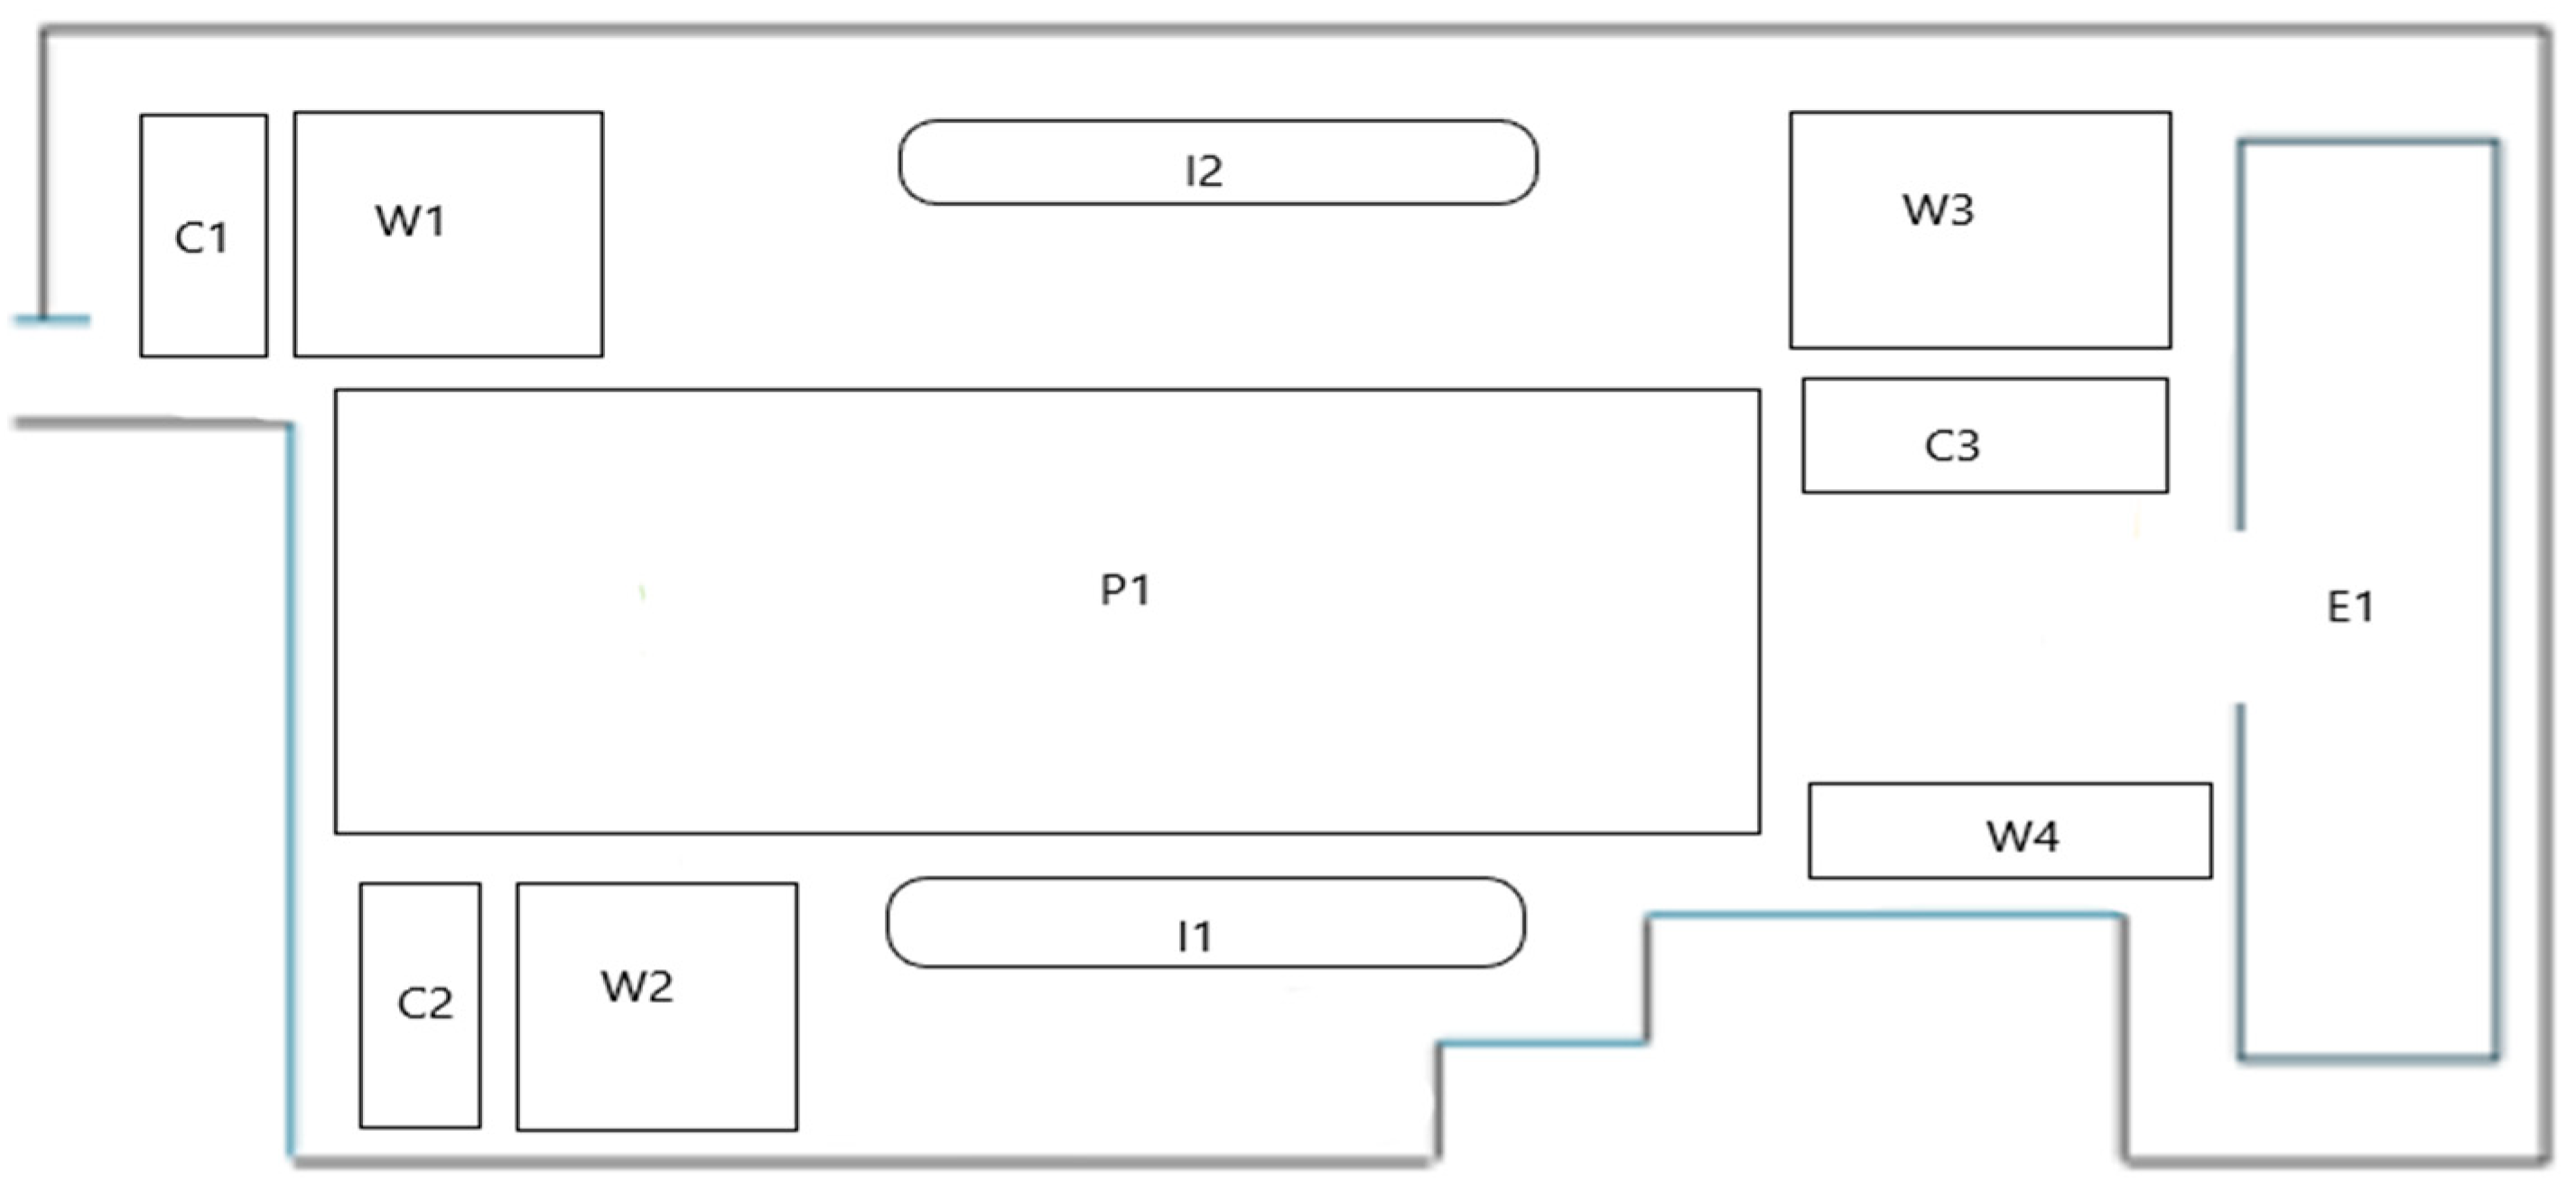
4.1. Process Analysis in Divisions
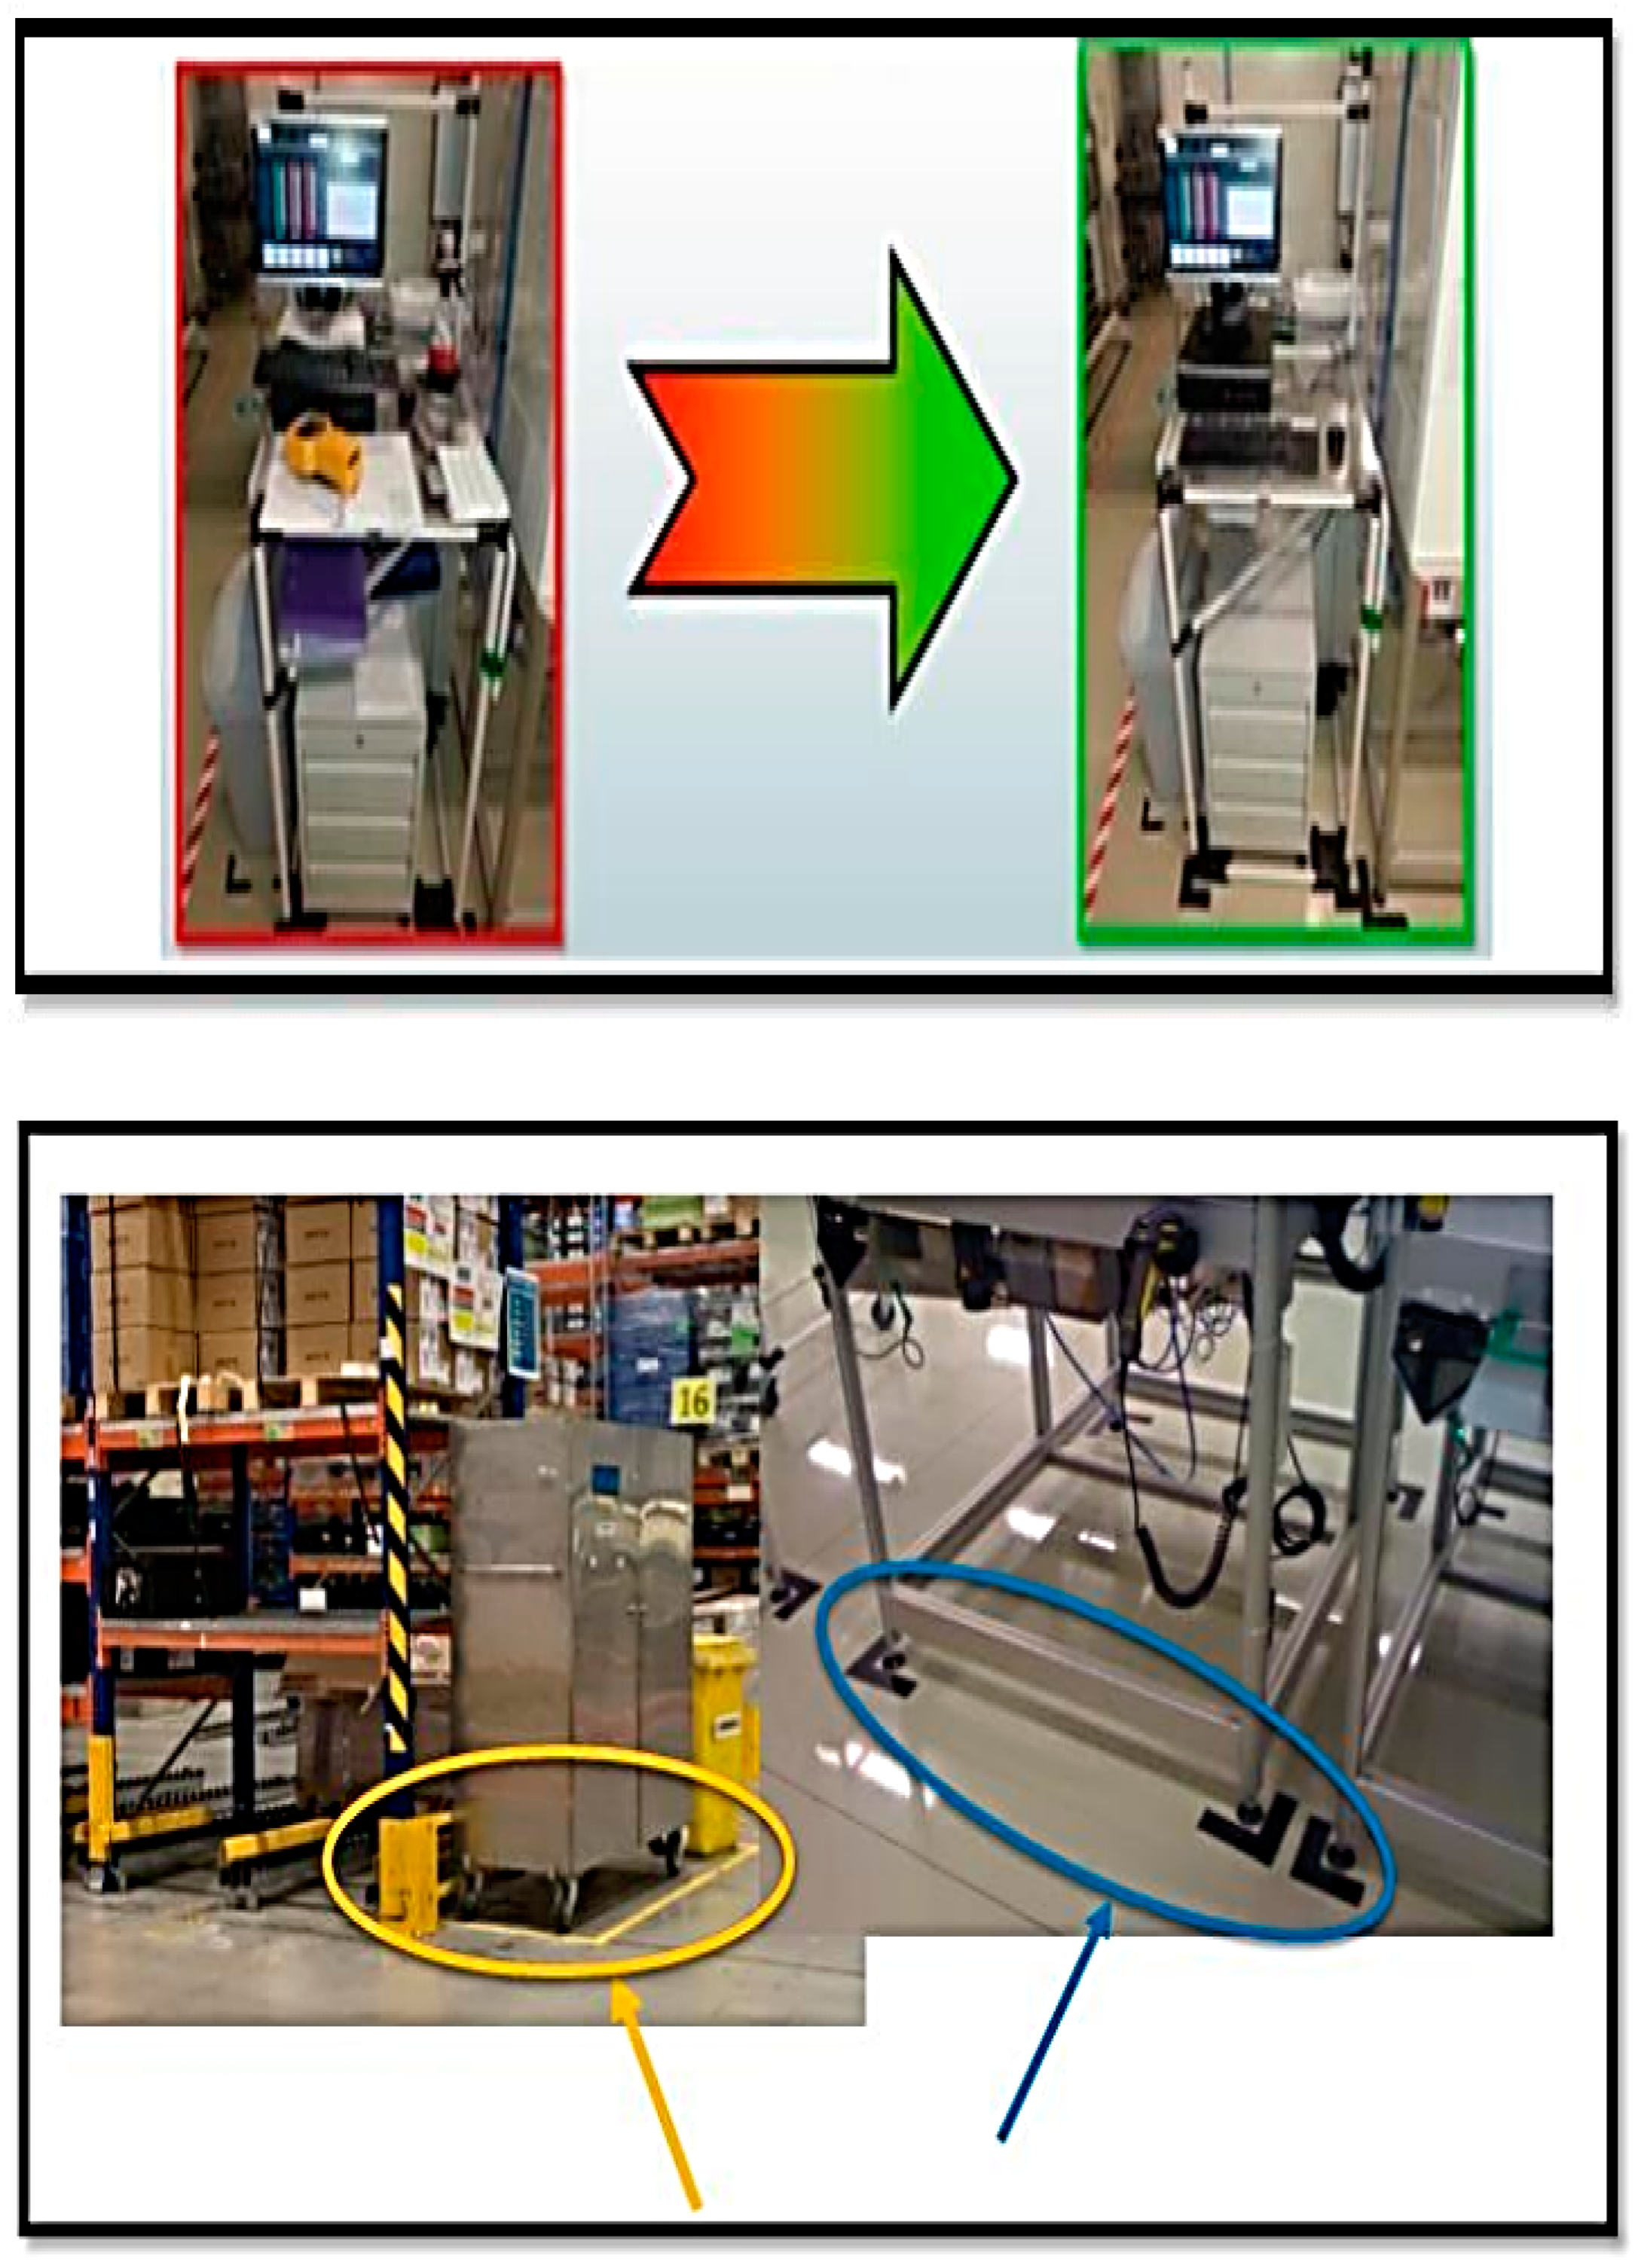
4.2. Implementation of Quality Tools and Methods in Processes
5. Discussion
6. Conclusions
Author Contributions
Funding
Data Availability Statement
Conflicts of Interest
References
- Teplická, K.; Khouri, S.; Beer, M.; Rybarova, J. Evaluation of the Performance of Mining Processes after the Strategic Innovation for Sustainable Development. Processes 2021, 9, 1374. [Google Scholar] [CrossRef]
- Sokovic, M.; Jovanovic, J.; Krivokapic, Z.; Vujovic, A. Basic Quality Tools in Continuous Improvement Process. J. Mech. Eng. 2009, 55, 333–341. [Google Scholar]
- Mach, P.; Guáqueta, J. Utilization of the Seven Ishikawa tools (old tools) in the Six sigma strategy. In Proceedings of the 24th International Spring Seminar on Electronic Technology—ISSE 2001, Calimanesti-Caciulata, Romania, 5–9 May 2001; pp. 51–55. [Google Scholar] [CrossRef]
- Herbert, D.; Curry, A.; Angel, L. Use of quality tools and techniques in services. Serv. Ind. J. 2003, 23, 61–80. [Google Scholar] [CrossRef]
- Zasadzien, M.; Zarnovsky, J. Improvement of selected logistics processes using quality engineering tools. Manag. Syst. Prod. Eng. 2018, 26, 55–59. [Google Scholar] [CrossRef]
- de Sena, W.N. The use of quality control tools by school management: The PDCA cycle and the 5W2H tool. Rev. Gestao E Secr. 2023, 14, 12634–12648. [Google Scholar] [CrossRef]
- McDermott, O.; Antony, J.; Sony, M.; Fernandes, M.M.; Koul, R.; Doulatabadi, M. The use and application of the 7 new quality control tools in the manufacturing sector: A global study. TQM J. 2022, 35, 2621–2639. [Google Scholar] [CrossRef]
- Pavletic, D.; Sokovic, M. Quality improvement model at the manufacturing process preparation. Int. J. Qual. Res. 2009, 3, 309–315. [Google Scholar]
- Škvareková, E.; Taušová, M.; Seňová, A.; Wittenberger, G.; Novaková, J. Statistical evaluation of quantities measured in the detection of soil air pollution of the environmental burden. Appl. Sci. 2021, 11, 3294. [Google Scholar] [CrossRef]
- Fang, H.; Yumin, H.; Wei, F.; Shanyi, J. Manufacturing process improvement for subcontracting production. In Proceedings of the 10th IFAC Conference on Manufacturing Modelling, Management and Control MIM, Nantes, France, 22–24 June 2022; Volume 55, pp. 1398–1403. [Google Scholar] [CrossRef]
- Zhou, H.; Li, L. The impact of supply chain practices and quality management on firm performance: Evidence from China’s small and medium manufacturing enterprises. Int. J. Prod. Econ. 2020, 230, 107816. [Google Scholar] [CrossRef]
- Buer, S.V.; Semini, M.; Strandhagen, J.O.; Sgarbossa, F. The complementary effect of lean manufacturing and digitalisation on operational performance. Int. J. Prod. Res. 2021, 59, 1976–1992. [Google Scholar] [CrossRef]
- Javaid, M.; Haleem, A.; Singh, R.P.; Suman, R. Significance of Quality 4.0 towards comprehensive enhancement in manufacturing sector. Sens. Int. 2021, 2, 100109. [Google Scholar] [CrossRef]
- Teplická, K.; Hurná, S.; Kádárová, J. Comparison of using managerial instruments in industry companies in Slovakia and Czech Republic. TEM J. 2019, 8, 1191–1197. [Google Scholar] [CrossRef]
- Chen, Y.Y.; Guo, J.; Yao, Y.; Yang, J.Y.; Yang, Z.J. Discussion on human factor control of sensor manufacturing process in computer information acquisition system based on total process management. In Proceedings of the 4th International Conference on Informatics Engineering and Information Science, Tianjin, China, 19–21 November 2022; p. 12131. [Google Scholar] [CrossRef]
- Kebede Adem, M.; Virdi, S.S. The effect of TQM practices on operational performance: An empirical analysis of ISO 9001: 2008 certified manufacturing organizations in Ethiopia. TQM J. 2021, 33, 407–440. [Google Scholar] [CrossRef]
- Das, A.; Paul, H.; Swierczek, F.W.; Laosirihongthong, T. A measurement instrument for TQM implementation in the Thai manufacturing industry. Int. J. Innov. Technol. Manag. 2006, 3, 361–377. [Google Scholar] [CrossRef]
- Abbas, J. Impact of total quality management on corporate sustainability through the mediating effect of knowledge management. J. Clean. Prod. 2020, 244, 118806. [Google Scholar] [CrossRef]
- Ikumapayi, O.M.; Akinlabi, E.T.; Mwema, F.M.; Ogbonna, O.S. Six sigma versus lean manufacturing. Overview. Mater. Today: Proc. 2020, 26, 3275–3281. [Google Scholar] [CrossRef]
- Potkany, M.; Gejdos, P.; Lesnikova, P.; Schmidtova, J. Influence of quality management practices on the Business performance of Slovak manufacturiong eterprises. Acta Polytech. Hung. 2020, 17, 161–180. [Google Scholar] [CrossRef]
- Markulik, Š.; Turisova, R.; Nagyova, A.; Vilinsky, T.; Kozel, R.; Vaskovicova, K. Production Process Optimization by Reducing Downtime and Minimization of Costs. AHFE 2021, 273, 220–227. [Google Scholar] [CrossRef]
- Yang, J.; Li, S.; Wang, Z.; Dong, H.; Wang, J.; Tang, S. Using deep learning to detect defects in manufacturing: A comprehensive survey and current challenges. Materials 2020, 13, 5755. [Google Scholar] [CrossRef]
- Potkany, M.; Zavadsky, J.; Hlawiczka, R.; Gejdos, P.; Schmidtova, J. Quality Management Practices in Manufacturing Enterprises in the Context of Their Performance. J. Compet. 2022, 14, 97–115. [Google Scholar] [CrossRef]
- Suchánek, P.; Richter, J.; Králová, M. Customer satisfaction, product quality and performance of companies. Rev. Econ. Perspect. 2015, 14, 329–344. [Google Scholar] [CrossRef]
- Lachvajderová, L.; Kádárová, J. Industry 4.0 Implementation and Industry 5.0 Readiness in Industrial Enterprises. Manag. Prod. Eng. Rev. 2022, 13, 102–109. [Google Scholar] [CrossRef]
- Dumitrascu, O.; Dumitrascu, M.; Dobrotǎ, D. Performance evaluation for a sustainable supply chain management system in the automotive industry using artificial intelligence. Processes 2020, 8, 1384. [Google Scholar] [CrossRef]
- Lukač, J.; Teplická, K.; Čulková, K.; Hrehová, D. Evaluation of the Financial Performance of the Municipalities in Slovakia in the Context of Multidimensional Statistics. J. Risk Financ. Manag. 2021, 14, 570. [Google Scholar] [CrossRef]
- Bilan, Y.; Hussain, H.I.; Haseeb, M.; Kot, S. Sustainability and economic performance: Role of organizational learning and innovation. Sustainability 2020, 31, 93–103. [Google Scholar] [CrossRef]
- Nudurupati, S.S.; Garengo, P.; Bititci, U.S. Impact of the changing business environment on performance measurement and management practices. Int. J. Prod. Econ. 2021, 232, 146–153. [Google Scholar] [CrossRef]
- Zhang, W.; Tang, F. Analysis of performance management in small and medium enterprises. IERI Procedia 2012, 128, 8–12. [Google Scholar] [CrossRef]
- Zheng, L.; Ulrich, K.; Sendra-Garcia, J. Qualitative comparative analyses: Configurational paths to innovation performance. J. Bus. Res. 2021, 128, 83–93. [Google Scholar] [CrossRef]
- Junior, M.L.; Godinho Filho, M. Variations of the Kanban system: Literature review and classification. Int. J. Prod. Econ. 2010, 125, 13–21. [Google Scholar] [CrossRef]
- Akturk, M.S.; Erhun, F. An overview of design and operational issues of Kanban systems. Int. J. Prod. Res. 1999, 37, 3859–3881. [Google Scholar] [CrossRef]
- Sudarsan, D.; Sivakumar, G.D. Implementation of kanban to improve efficiency of a manufacturing system subject to bottlenecks. Int. J. Manuf. Technol. Manag. 2020, 34, 467–480. [Google Scholar] [CrossRef]
- Boca, G.D.; Isitan, A. Transfer from traditional Kanban to Kanban 4.0 in smart factory. Rev. Manag. Econ. Eng. 2021, 20, 210–227. [Google Scholar]
- Pekarcikova, M.; Trebuna, P.; Kliment, M.; Rosocha, L. Material flow optimization through e-Kanban system simulation. Int. J. Simul. Model. 2020, 19, 243–254. [Google Scholar] [CrossRef]
- Teplická, K.; Čulková, K.; Zelezník, O. Application of Bayes principle optimum—Optimization model for managerial decision and continual improvement. Pol. J. Manag. Stud. 2015, 12, 170–179. [Google Scholar]
- Shahriar, M.M.; Parvez, M.S.; Islam, M.A.; Talapatra, S. Implementation of 5S in a plastic bag manufacturing industry: A case study. Clean. Eng. Technol. 2022, 8, 100488. [Google Scholar] [CrossRef]
- Baumeister, J.; Finkbeiner, B.; Gumhold, S.; Schledjewski, M. Real-time visualization of stream-based monitoring data. In International Conference on Runtime Verification; Springer International Publishing: Berlin/Heidelberg, Germany, 2022; pp. 325–335. [Google Scholar]
- Kumar, R.; Singh, K.; Jain, S.K. Agile manufacturing: A literature review and Pareto analysis. Int. J. Qual. Reliab. Manag. 2020, 37, 207–222. [Google Scholar] [CrossRef]
- Wuni, I.Y. Mapping the barriers to circular economy adoption in the construction industry: A systematic review, Pareto analysis, and mitigation strategy map. Build. Environ. 2022, 223, 109453. [Google Scholar] [CrossRef]
- Isniah, S.; Purba, H.H.; Debora, F. Plans do check action (PDCA) method: Literature review and research issues. J. Sist. dan Manaj. Ind. 2020, 4, 72–81. [Google Scholar] [CrossRef]
- Ghatorha, K.S.; Sharma, R.; Singh, G. Lean manufacturing through PDCA: A case study of a press manufacturing industry. In Proceedings of the International Conference on Industrial and Manufacturing Systems (CIMS-2020) Optimization in Industrial and Manufacturing Systems and Applications, 26–28 June 2020; Springer International Publishing: Berlin/Heidelberg, Germany, 2022; pp. 167–187. [Google Scholar]
- Sumasto, F.; Maharani, C.P.; Purwojatmiko, B.H.; Imansuri, F.; Aisyah, S. PDCA Method Implementation to Reduce the Potential Product Defects in the Automotive Components Industry. Indones. J. Ind. Eng. Manag. 2023, 4, 87. [Google Scholar] [CrossRef]
- Teplicka, K.; Straka, M. Sustainability of Extraction of Raw Material by a Combination of Mobile and Stationary Mining Machines and Optimization of Machine Life Cycle. Sustainability 2020, 12, 10454. [Google Scholar] [CrossRef]
- Guo, H.; Zhu, Y.; Zhang, Y.; Ren, Y.; Chen, M.; Zhang, R. A digital twin-based layout optimization method for discrete manufacturing workshop. Int. J. Adv. Manuf. Technol. 2021, 112, 1307–1318. [Google Scholar] [CrossRef]
- Maganga, D.P.; Taifa, I.W.R. Quality 4.0 transition framework for Tanzanian manufacturing industries. TQM J. 2023, 35, 1417–1448. [Google Scholar] [CrossRef]
- Teplická, K.; Culková, K.; Manová, E. Using of operation analysis models in selected industrial firm. Acta Montan. Slovaca 2012, 17, 151–157. [Google Scholar]
- Kot, S.; Haque, A.; Baloch, A. Supply chain management in SMEs: Global perspective. Montenegrin J. Econ. 2020, 16, 87–104. [Google Scholar] [CrossRef]
- Femandes, A.C.; Vilhena, E.; Oliveira, R.; Sampanio, P.; Carvahlho, M.S. Supply chain quality management impact on organization performance: Results from an international survey. Int. J. Qual. Reliab. Manag. 2021, 5, 159–164. [Google Scholar] [CrossRef]
- Nagyová, A.; Pačaiová, H.; Markulík, Š.; Turisová, R.; Kozel, R.; Džugan, J. Design of a Model for Risk Reduction in Project Management in Small and Medium-Sized Enterprises. Symmetry 2021, 13, 763. [Google Scholar] [CrossRef]
- Kádárová, J.; Durkácová, M.; Teplická, K.; Kádár, G. The proposal of an innovative integrated BSC–DEA model. In Proceedings of the 2nd Global Conference on Business, Economics and Management and Tourism (BEMTUR), Prague, Czech Republic, 30–31 October 2014; pp. 1503–1508. [Google Scholar]
- Teplická, K.; Hurná, S. New approach of costs of quality according their trend of during long period in industrial enterprises in SMEs. Manag. Syst. Prod. Eng. 2021, 29, 20–26. [Google Scholar] [CrossRef]
- Potkány, M.; Hajduková, A.; Teplická, K. Target costing calculation in the wood working industry to support demand at a time of global recession. Drewno 2012, 55, 89–104. [Google Scholar]
- Menon, A.P.; Lahoti, V.; Gunreddy, N.; Chadha, U.; Selvaraj, S.K.; Nagalakshmi, R.; Jayakumar, K.; Karthikeyan, B. Quality control tools and digitalization of real-time data in sustainable manufacturing. Int. J. Interact. Des. Manuf. 2022, 1, 1–13. [Google Scholar] [CrossRef]


| Processes | Plan 2022 | Reality 2022 | Plan 2023 | Reality 2023 |
|---|---|---|---|---|
| Document management (number of documents) | 15 | 15 | 13 | 13 |
| Fulfillment of management goals (number of goals) | 29 | 28 | 28 | 28 |
| Material input inspection (number of inspections) | 380 | 280 | 300 | 200 |
| Spare parts production and location (number SP) | 523 | 430 | 500 | 400 |
| Production (number of defect products) | 100 | 83 | 90 | 70 |
| Product packaging (number of returnable packs) | 3000 | 2500 | 2500 | 2000 |
| Promotion (marketing costs in €) | 35,600 | 35,000 | 36,000 | 36,600 |
| Internal system audits (number of audits) | 25 | 26 | 25 | 27 |
| Type of Process | Limit |
|---|---|
| Effective process | Ke ≥ 0.85 |
| Mostly effective process | 0.85 > Ke ≥ 0.70 |
| Ineffective process | Ke < 0.70 |
| Type of Process | Limit |
|---|---|
| Functional process | If ≥ 1 |
| Mostly functional process | 1 > If ≥ 0.90 |
| Nonfunctional process | If < 0.90 |
| Processes | Ke (0) | Ke (1) | If | Effectiveness (0) (1) | Functionality (2023/2022) |
|---|---|---|---|---|---|
| Document management (number of documents) | 1 | 1 | 1 | Effective | Functional |
| Fulfillment of management goals (number of goals) | 0.97 | 1 | 1.03 | Effective | Functional |
| Material input inspection (number of inspections) | 0.74 | 0.67 | 0.91 | Mostly effective | Mostly functional |
| Spare parts production and location (number SP) | 0.82 | 0.80 | 0.97 | Mostly effective | Mostly functional |
| Production (number of defective products) | 0.83 | 0.78 | 0.93 | Mostly effective | Mostly functional |
| Product packaging (number of packages) | 0.83 | 0.80 | 0.96 | Mostly effective | Mostly functional |
| Promotion (marketing costs in €) | 0.98 | 1.02 | 1.03 | Effective | Functional |
| Internal system audits (number of audits) | 1.04 | 1.08 | 1.04 | Effective | Functional |
| Causes | Number of Defect | Kv | Multiplicity | Structure (%) | Cumulative Structure (%) |
|---|---|---|---|---|---|
| Incorrect insertion into the machine | 3000 | 4 | 12,000 | 29.52 | 29.52 |
| External factors | 2500 | 3 | 7500 | 18.45 | 47.97 |
| Slow pace of the operator | 1500 | 4 | 6000 | 14.76 | 62.73 |
| Software error | 897 | 5 | 4485 | 11.03 | 73.77 |
| Dropping a component | 4000 | 1 | 4000 | 9.84 | 83.61 |
| Degraded component | 2000 | 2 | 4000 | 9.84 | 93.45 |
| People factor | 310 | 5 | 1550 | 3.81 | 97.26 |
| Damage during transport | 370 | 2 | 740 | 1.82 | 99.08 |
| Faulty component | 180 | 2 | 360 | 0.89 | 99.97 |
| Bad dimensions | 130 | 0,1 | 13 | 0.03 | 100 |
| (A) Category | (B) Category | (C) Category |
|---|---|---|
| Multiplicity 29,985 | Multiplicity 9550 | Multiplicity 1113 |
| Cumulative structure (%) < 80% | Cumulative structure (%) < 98% | Cumulative structure (%) > 98% |
| Cumulative structure 73.77 (%) | Cumulative structure 97.26 (%) | Cumulative structure 99.08–100 (%) |
| Number of items (causes) 4 | Number of items (causes) 3 | Number of items (causes) 3 |
| Incorrect insertion into the machine | Dropping a component | Damage during transport |
| External factors | Degraded component | Faulty component |
| Slow pace of the operator | People factor | Bad dimensions |
| Software error |
| Processes | 2021 | Effectiveness 2022–2023 | Functionality 2023 | Implemented Quality Tools and Methods | Improvements |
|---|---|---|---|---|---|
| Material input inspection | Ineffective Nonfunctional | Mostly effective | Mostly functional | Flowchart Visualization Kanban | Material flow, Material control Claim process, Transport, Costs Material order, Downtime |
| Spare parts production and location | Ineffective Nonfunctional | Mostly effective | Mostly functional | 5S method | Ergonomic location Mark the space |
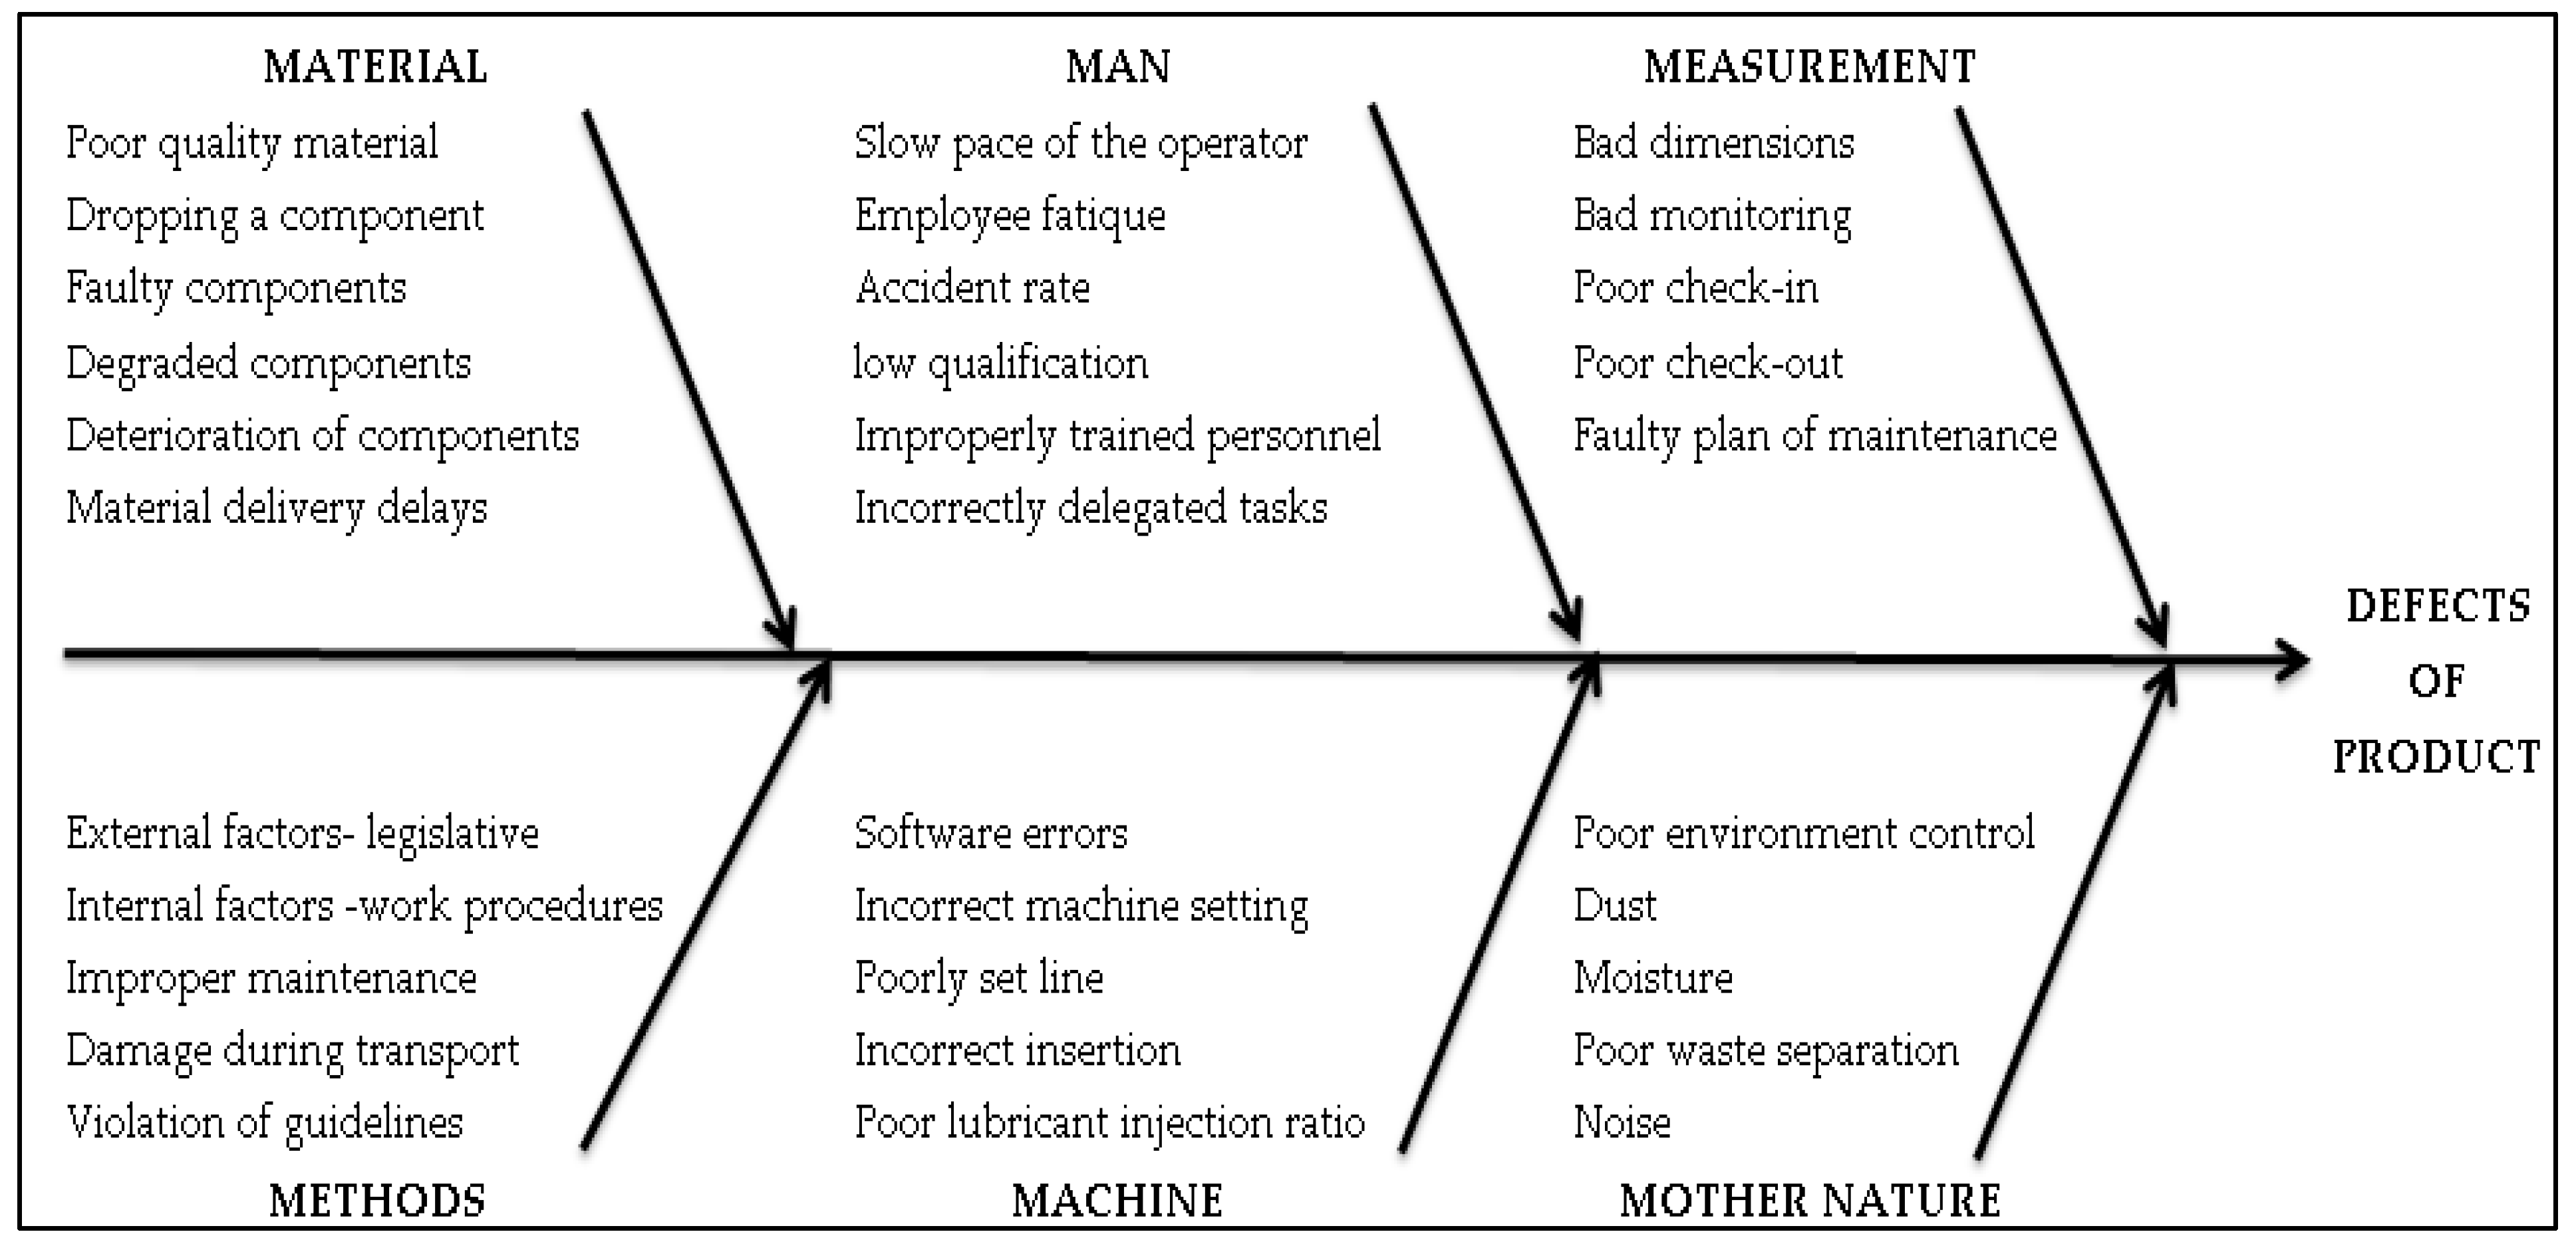
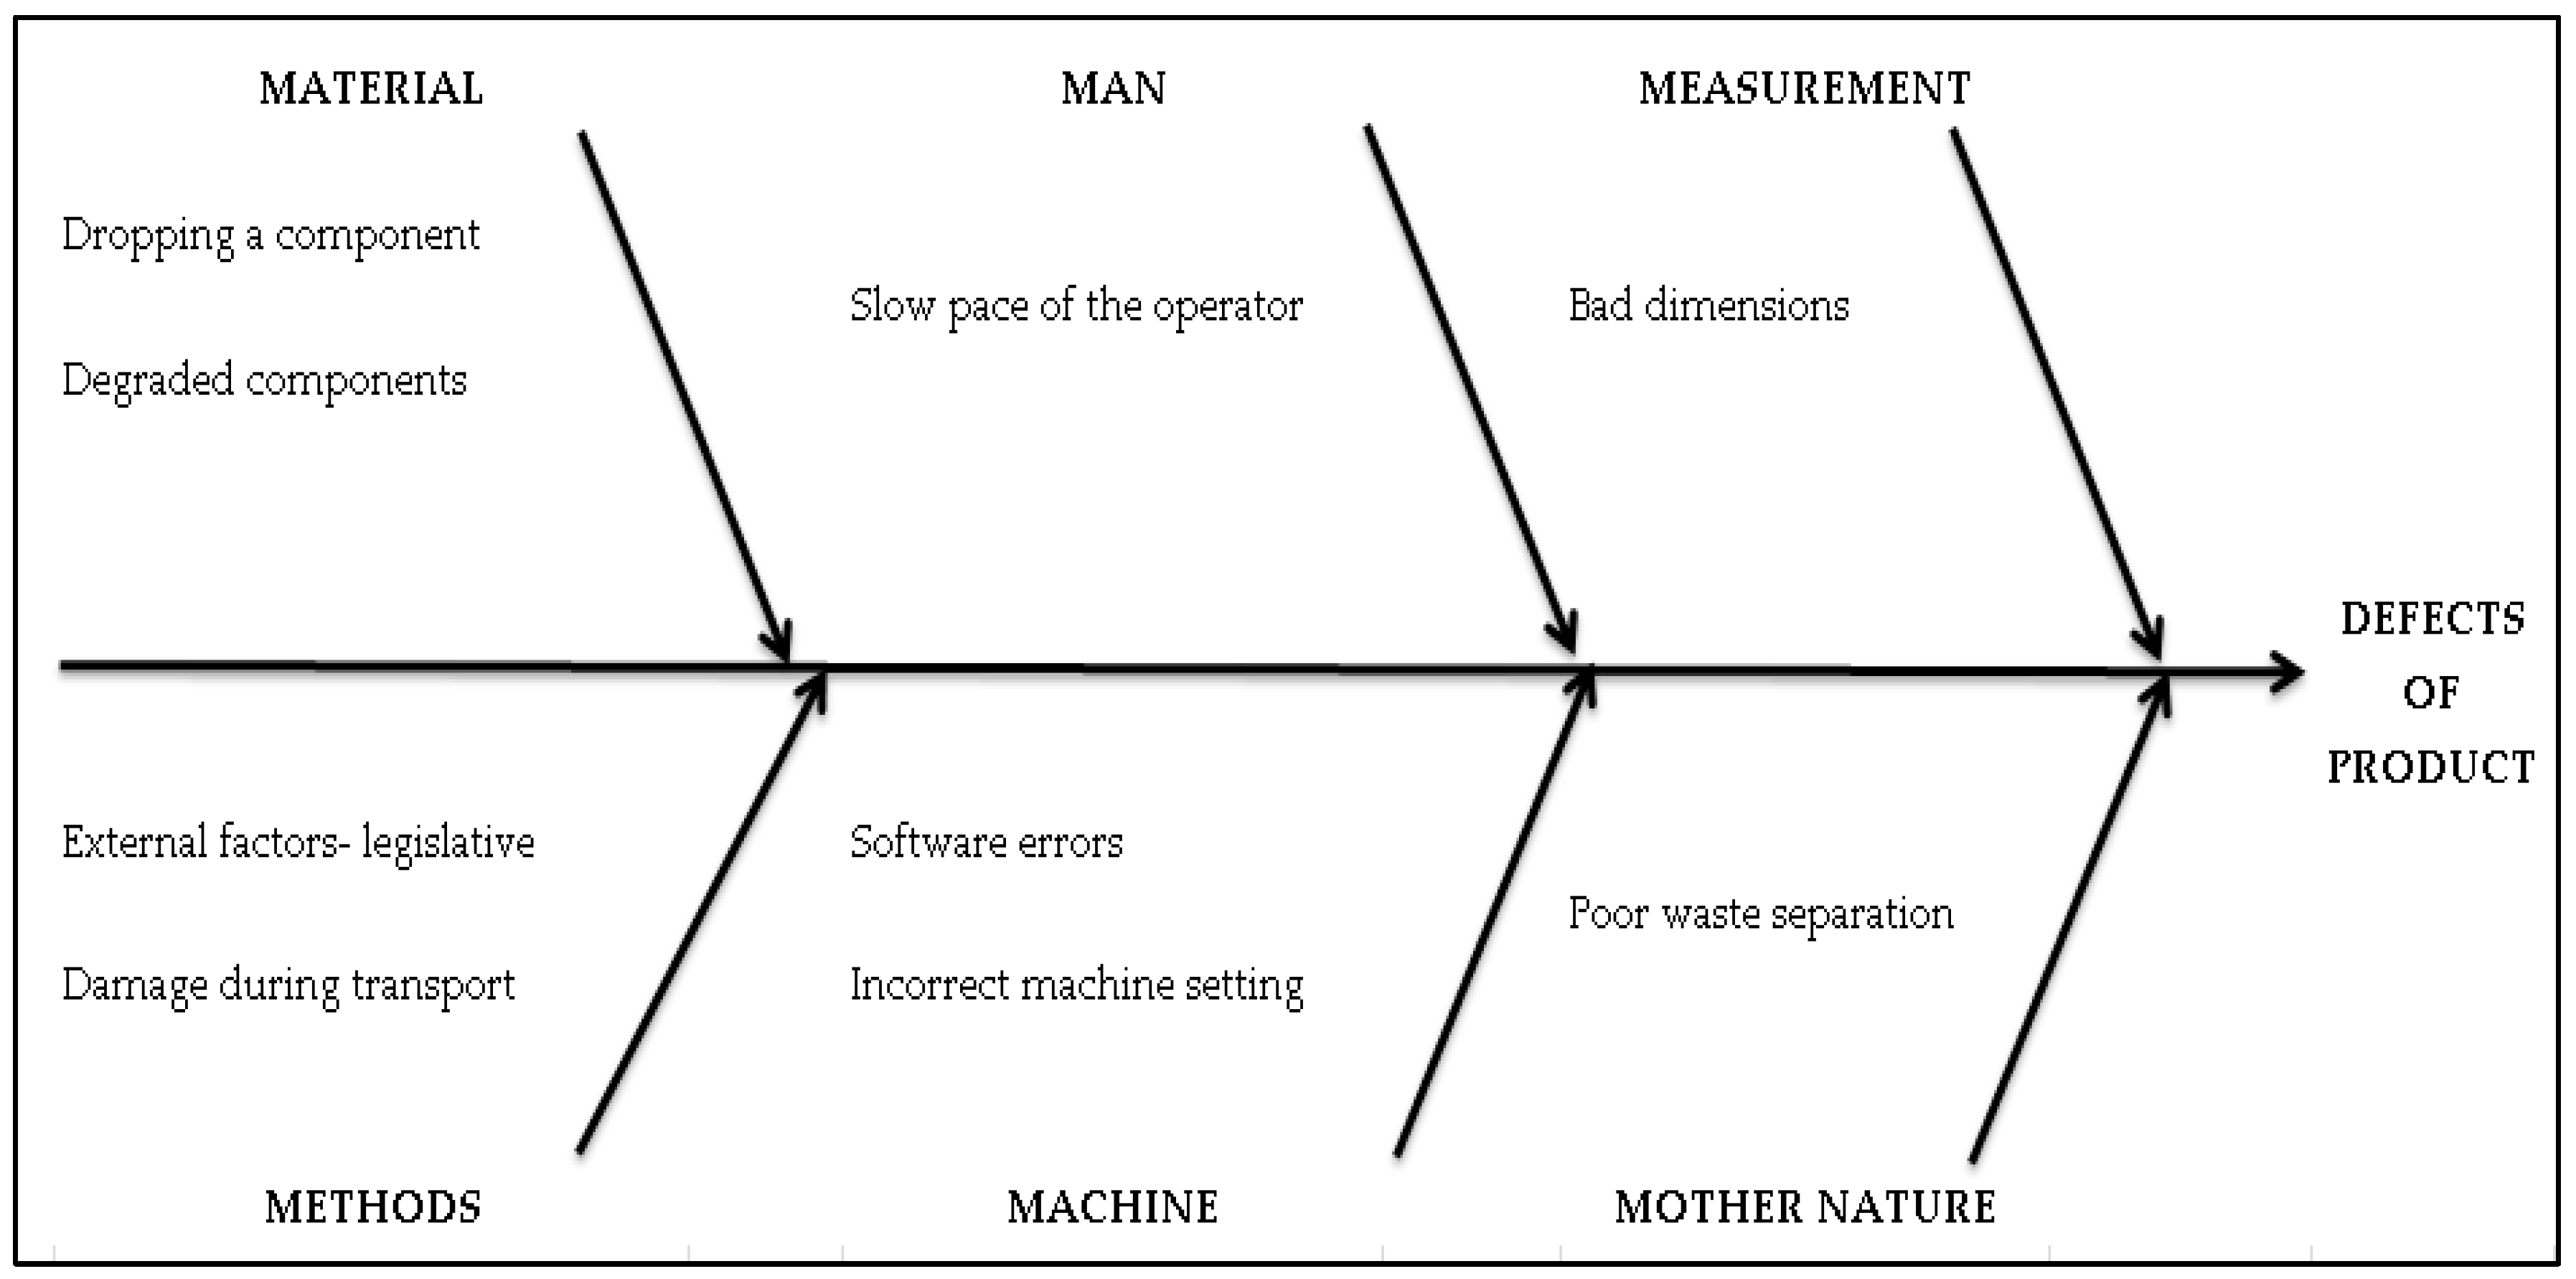
| Production | Ineffective Nonfunctional | Mostly effective | Mostly functional | 5S method OPL Ishikawa diagram Layout Pareto analysis Affinity diagram | Defects, Downtime, Layout Working condition Costs Employee training |
| Product packaging | Ineffective Nonfunctional | Mostly effective | Mostly functional | 5S method | Returnable packing Material of packing |
Disclaimer/Publisher’s Note: The statements, opinions and data contained in all publications are solely those of the individual author(s) and contributor(s) and not of MDPI and/or the editor(s). MDPI and/or the editor(s) disclaim responsibility for any injury to people or property resulting from any ideas, methods, instructions or products referred to in the content. |
© 2024 by the authors. Licensee MDPI, Basel, Switzerland. This article is an open access article distributed under the terms and conditions of the Creative Commons Attribution (CC BY) license (https://creativecommons.org/licenses/by/4.0/).
Share and Cite
Wittenberger, G.; Teplická, K. The Synergy Model of Quality Tools and Methods and Its Influence on Process Performance and Improvement. Appl. Sci. 2024, 14, 5079. https://doi.org/10.3390/app14125079
Wittenberger G, Teplická K. The Synergy Model of Quality Tools and Methods and Its Influence on Process Performance and Improvement. Applied Sciences. 2024; 14(12):5079. https://doi.org/10.3390/app14125079
Chicago/Turabian StyleWittenberger, Gabriel, and Katarína Teplická. 2024. "The Synergy Model of Quality Tools and Methods and Its Influence on Process Performance and Improvement" Applied Sciences 14, no. 12: 5079. https://doi.org/10.3390/app14125079
APA StyleWittenberger, G., & Teplická, K. (2024). The Synergy Model of Quality Tools and Methods and Its Influence on Process Performance and Improvement. Applied Sciences, 14(12), 5079. https://doi.org/10.3390/app14125079