
Research on the Deformation Mechanism of Railway Subgrade under Buried Strike–Slip Fault Dislocation
Abstract
:1. Introduction
2. Model Tests of Fault Dislocation
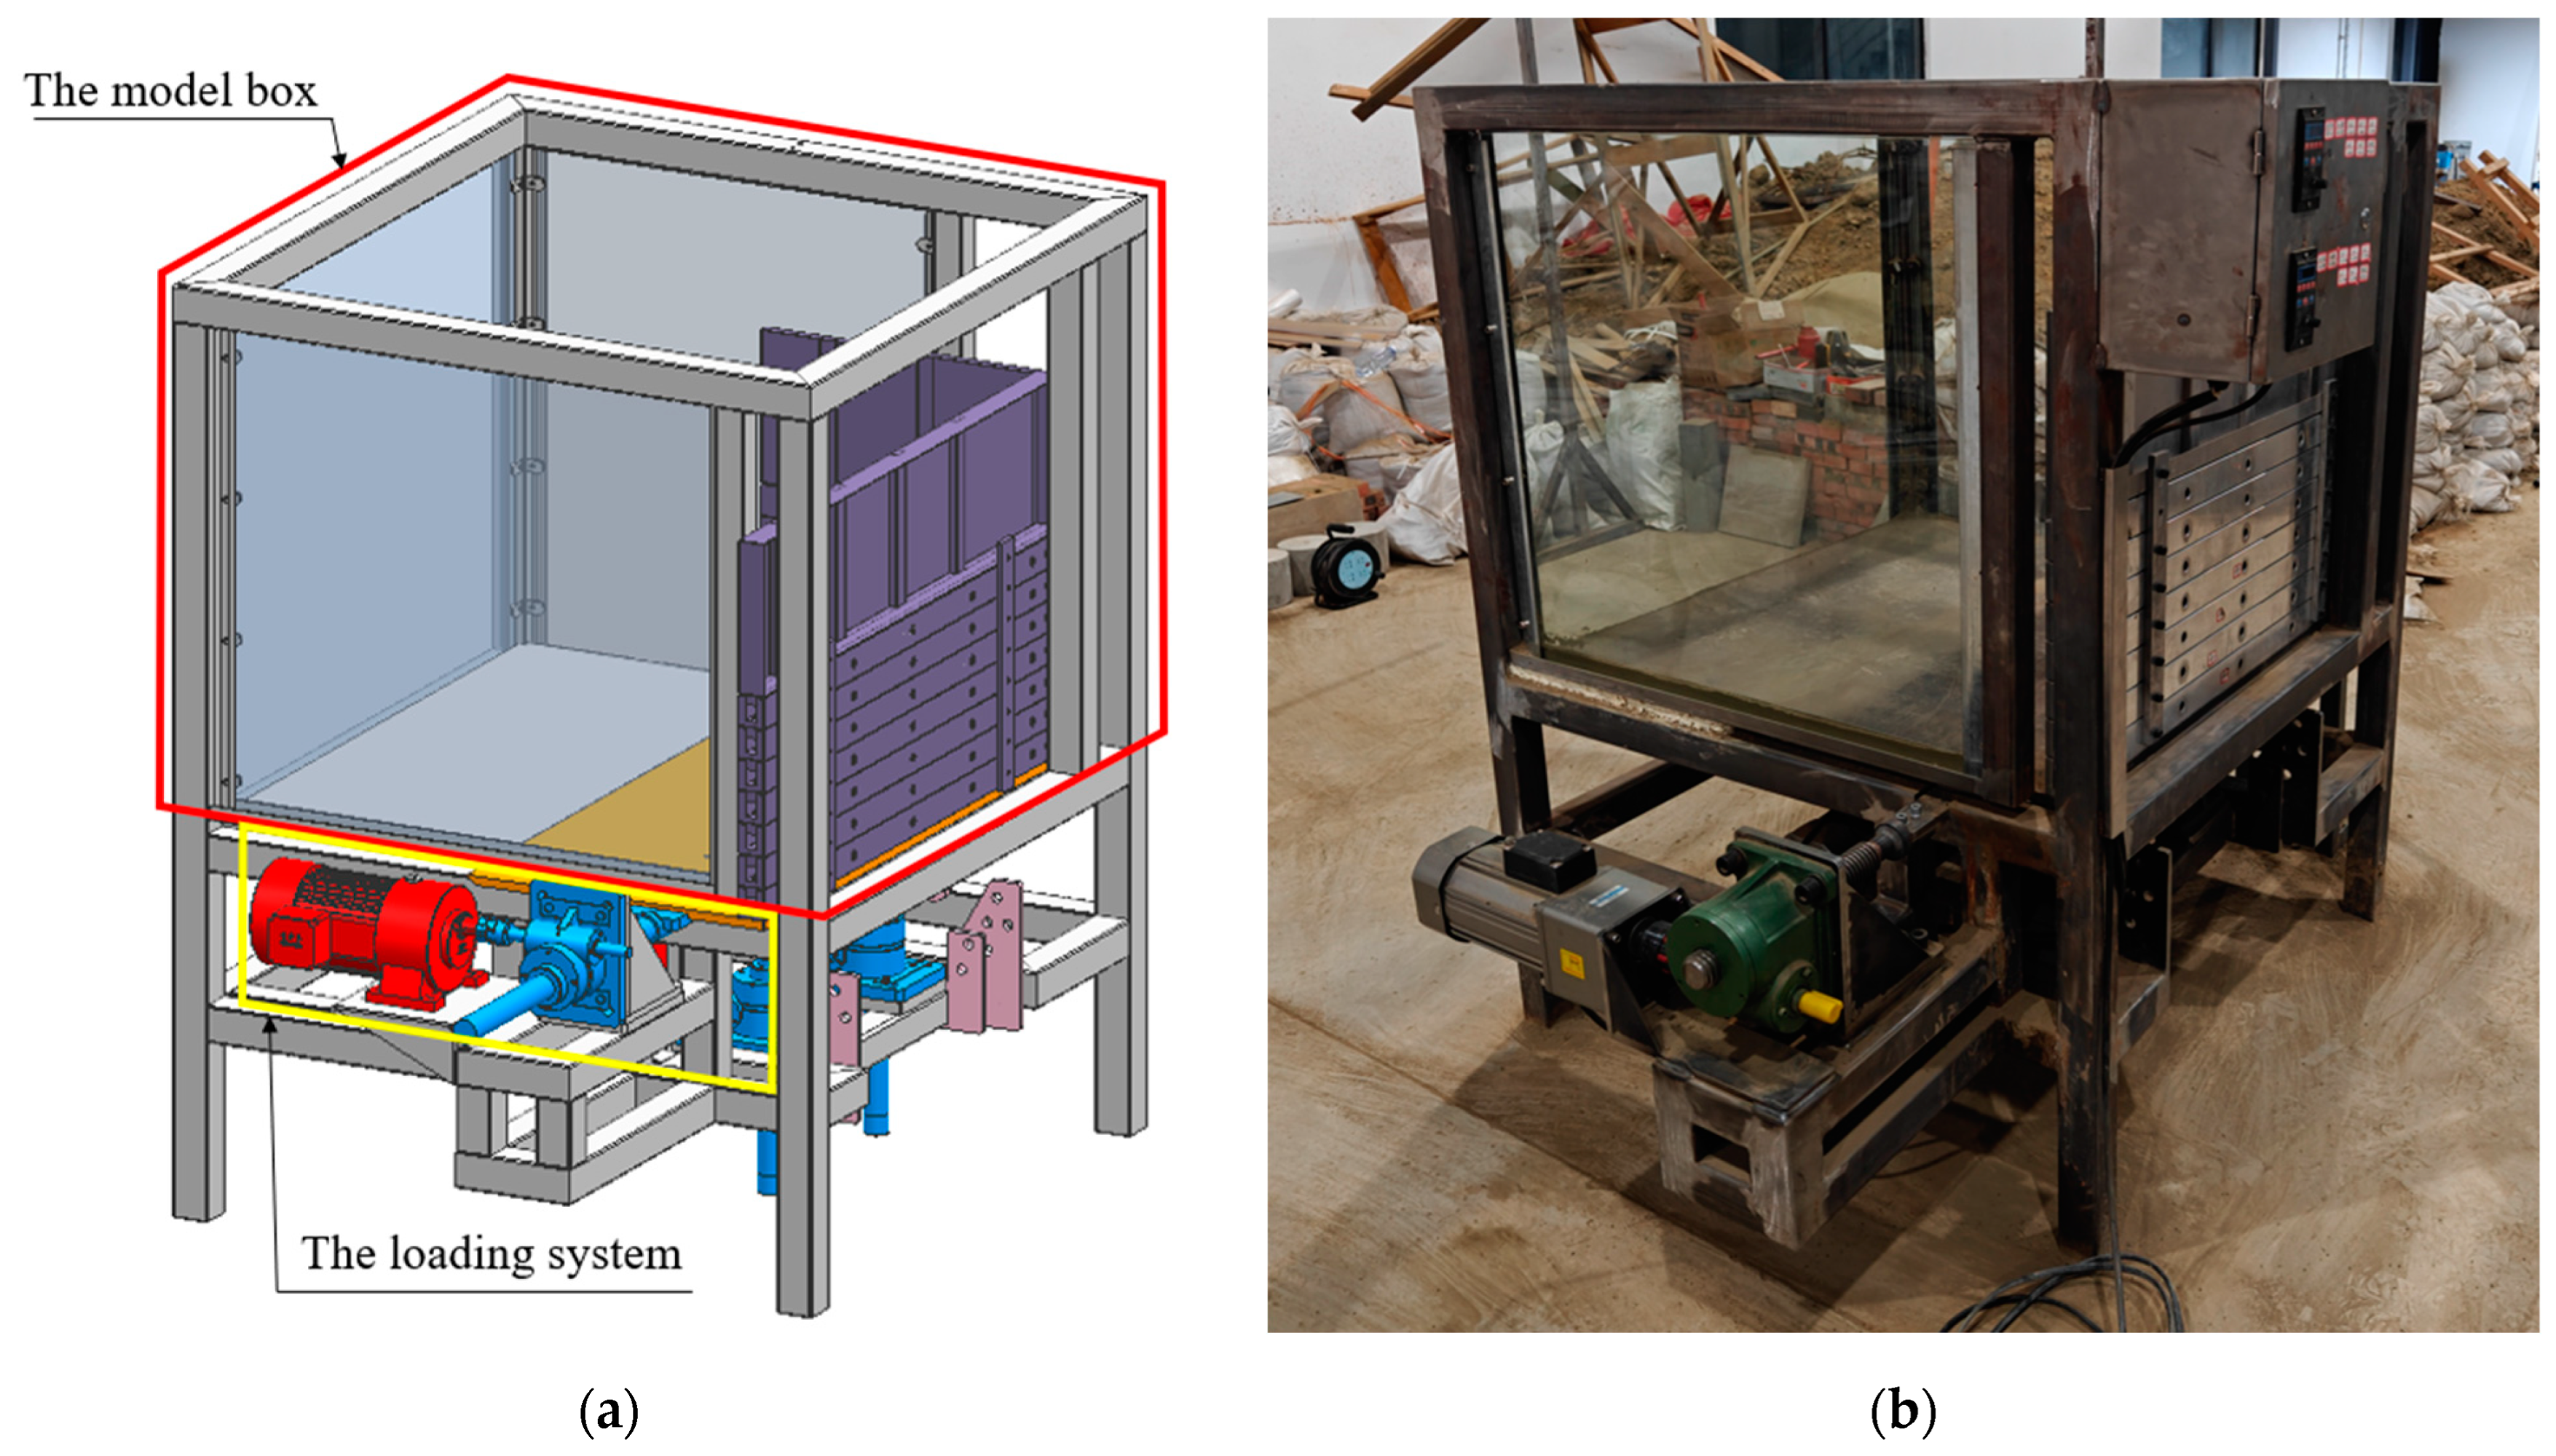
2.1. Development of Test Modeling Equipment
2.2. Material Selection and Similar Design
2.3. Model Establishment
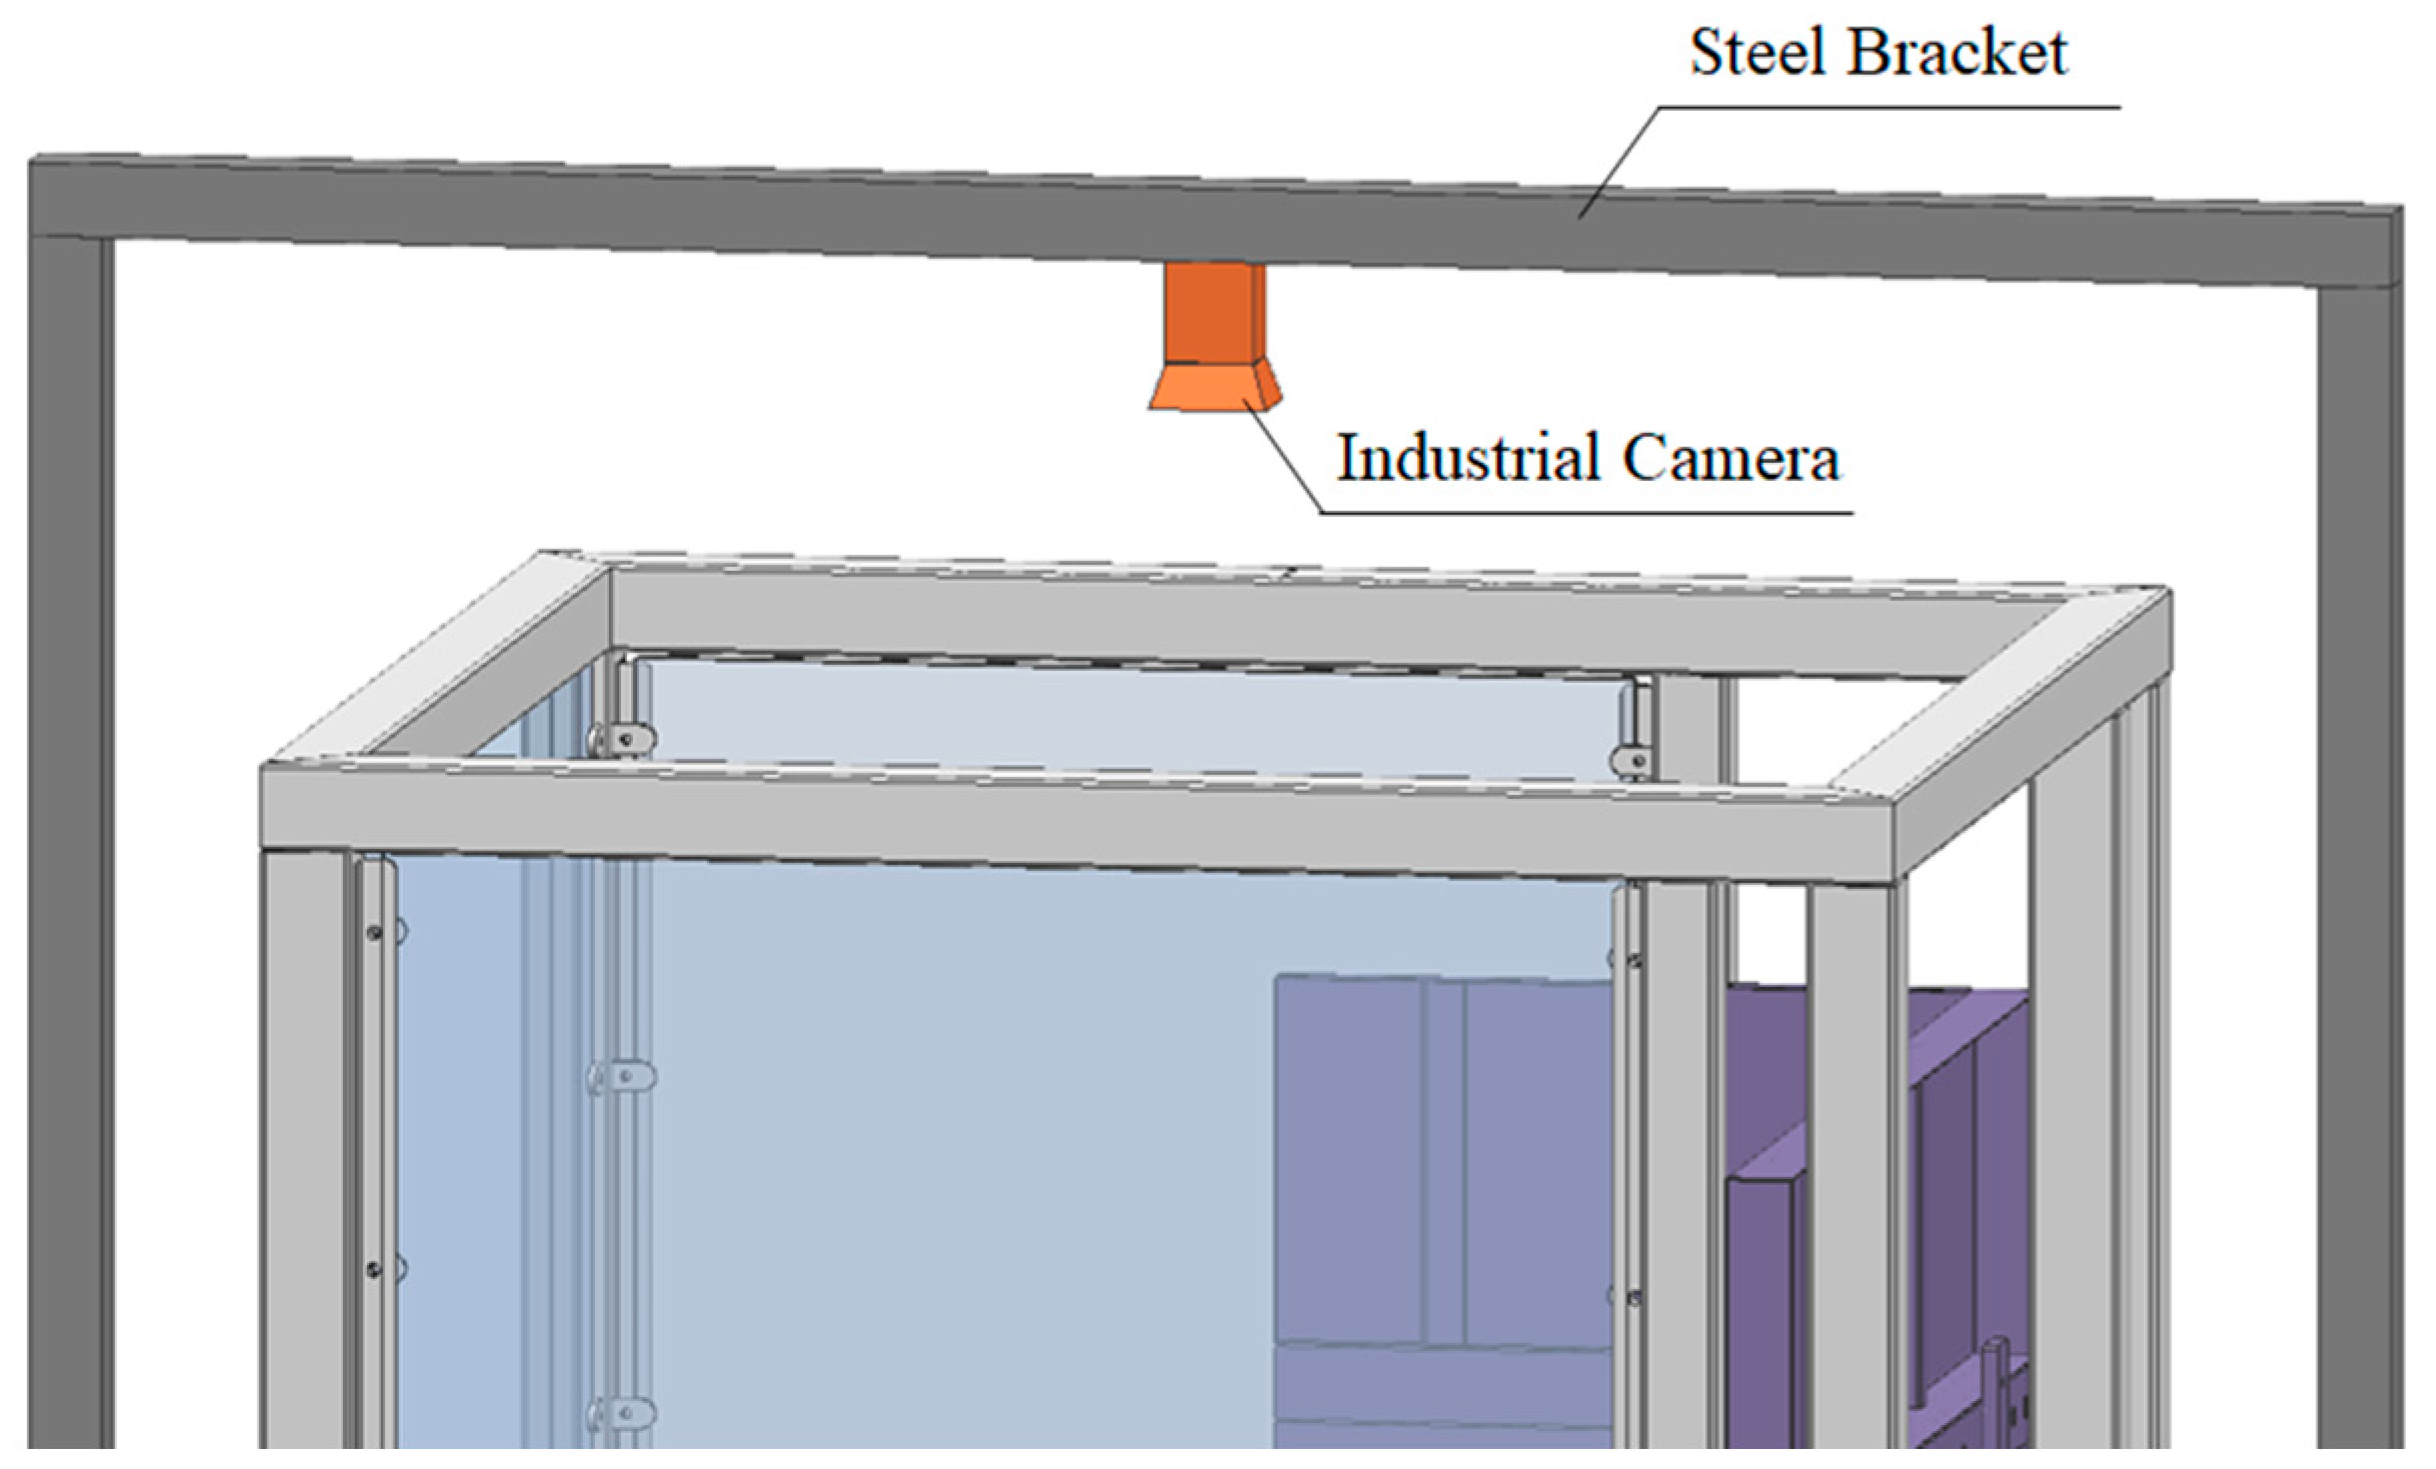
2.4. Monitoring System Deployment and Testing Process
3. Analysis of Test Results
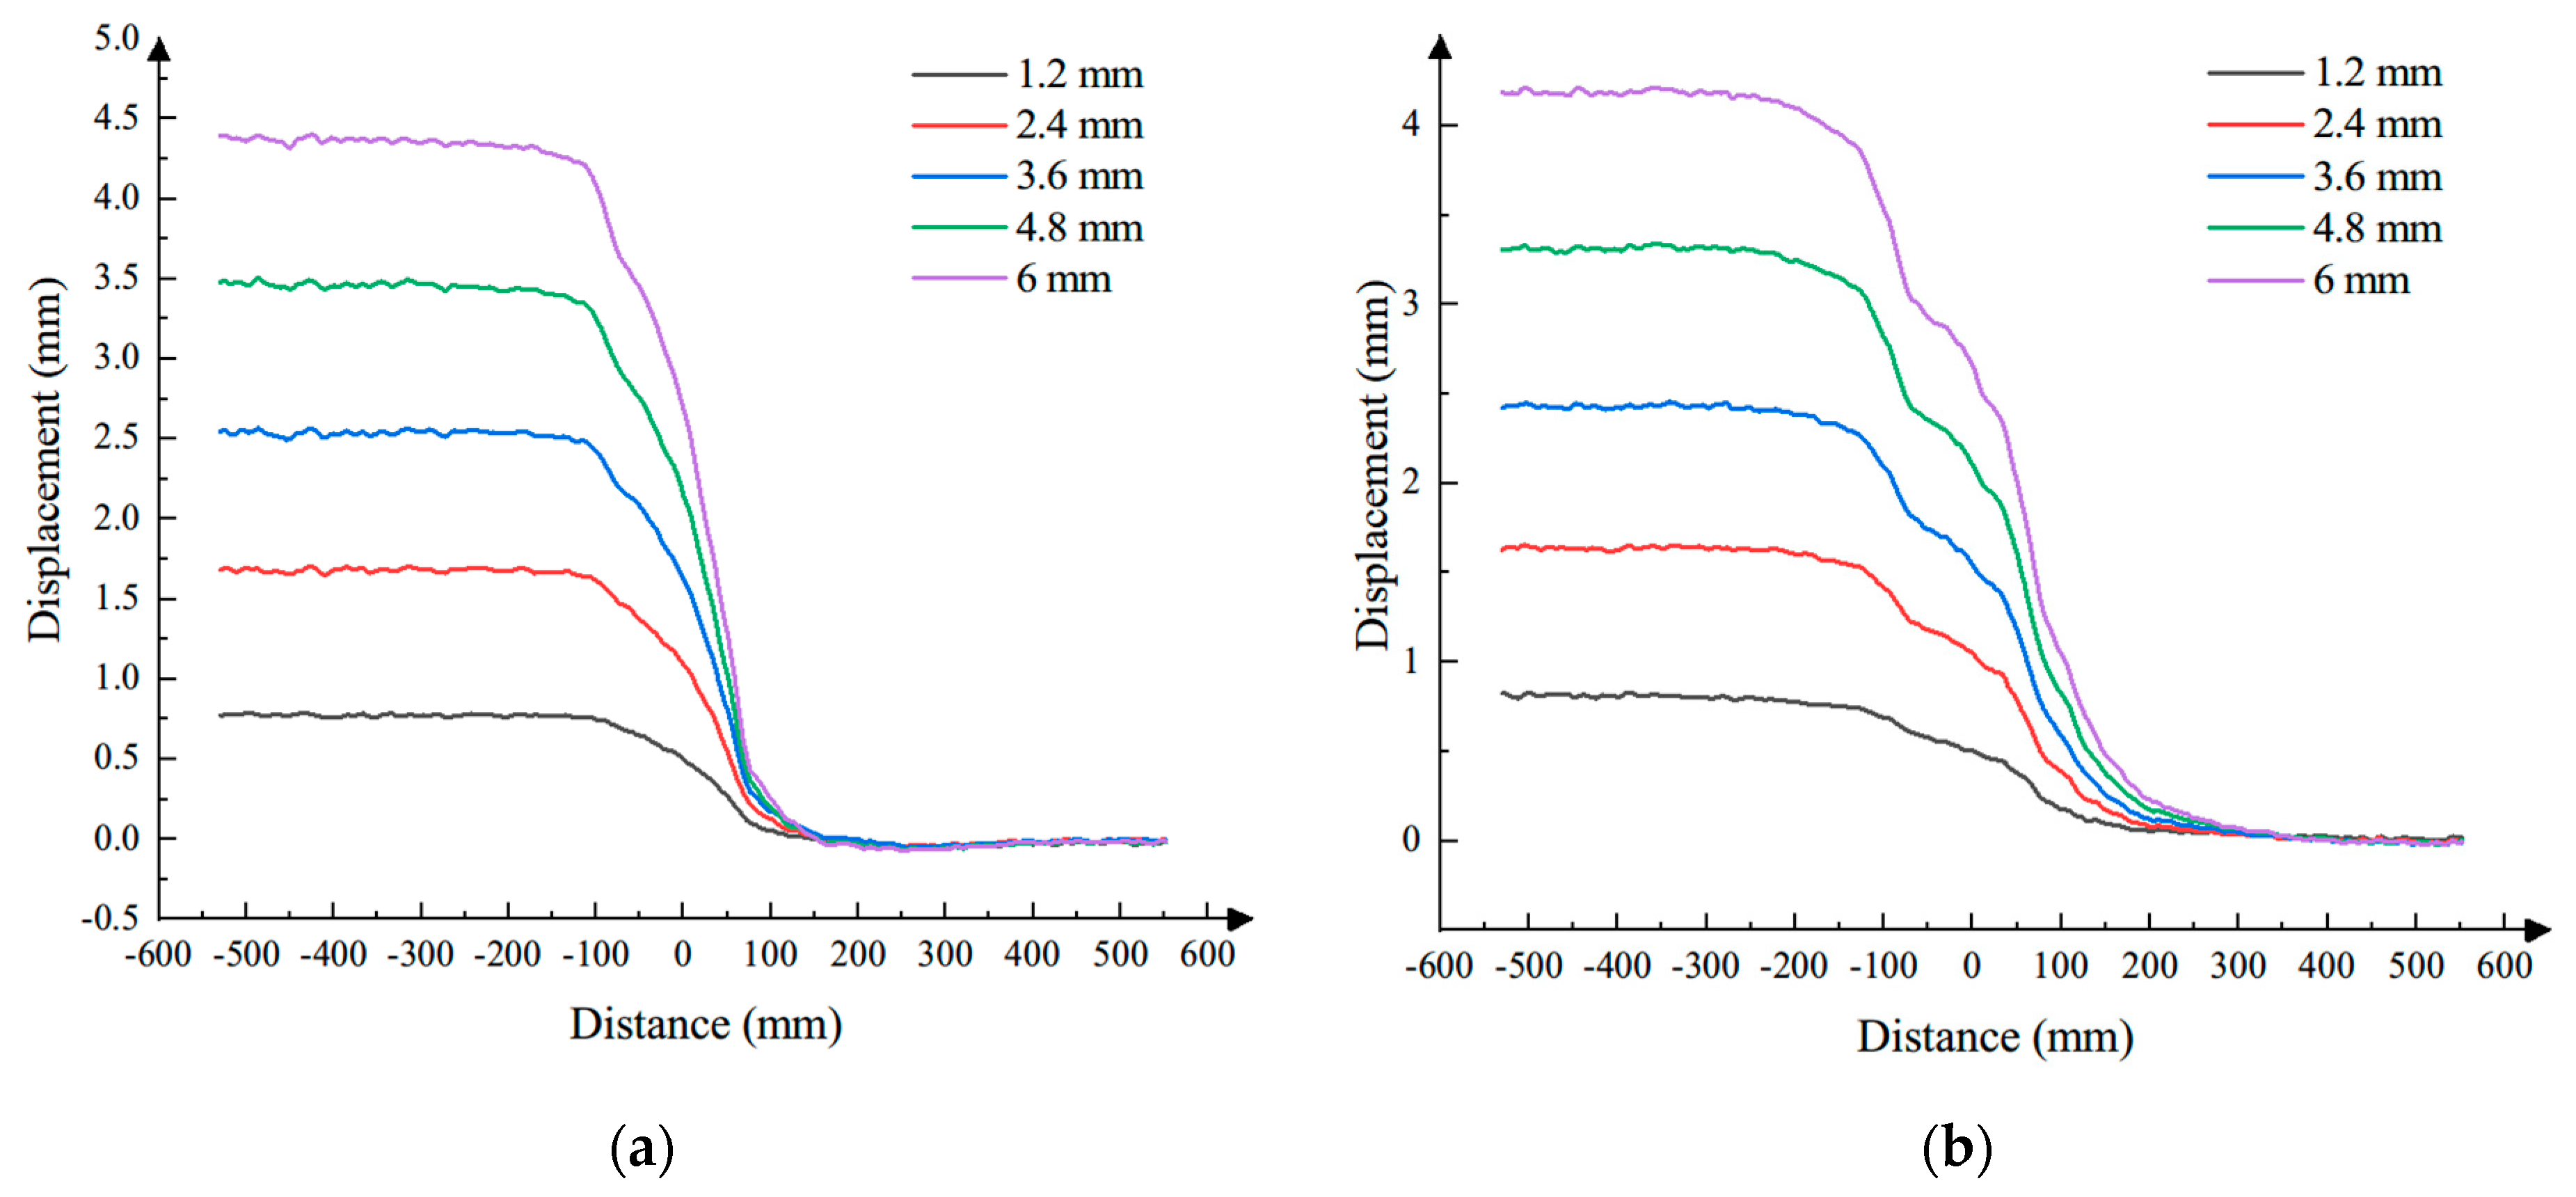
3.1. The Deformation of Flat Site without Subgrade
3.2. The Deformation of Subgrade
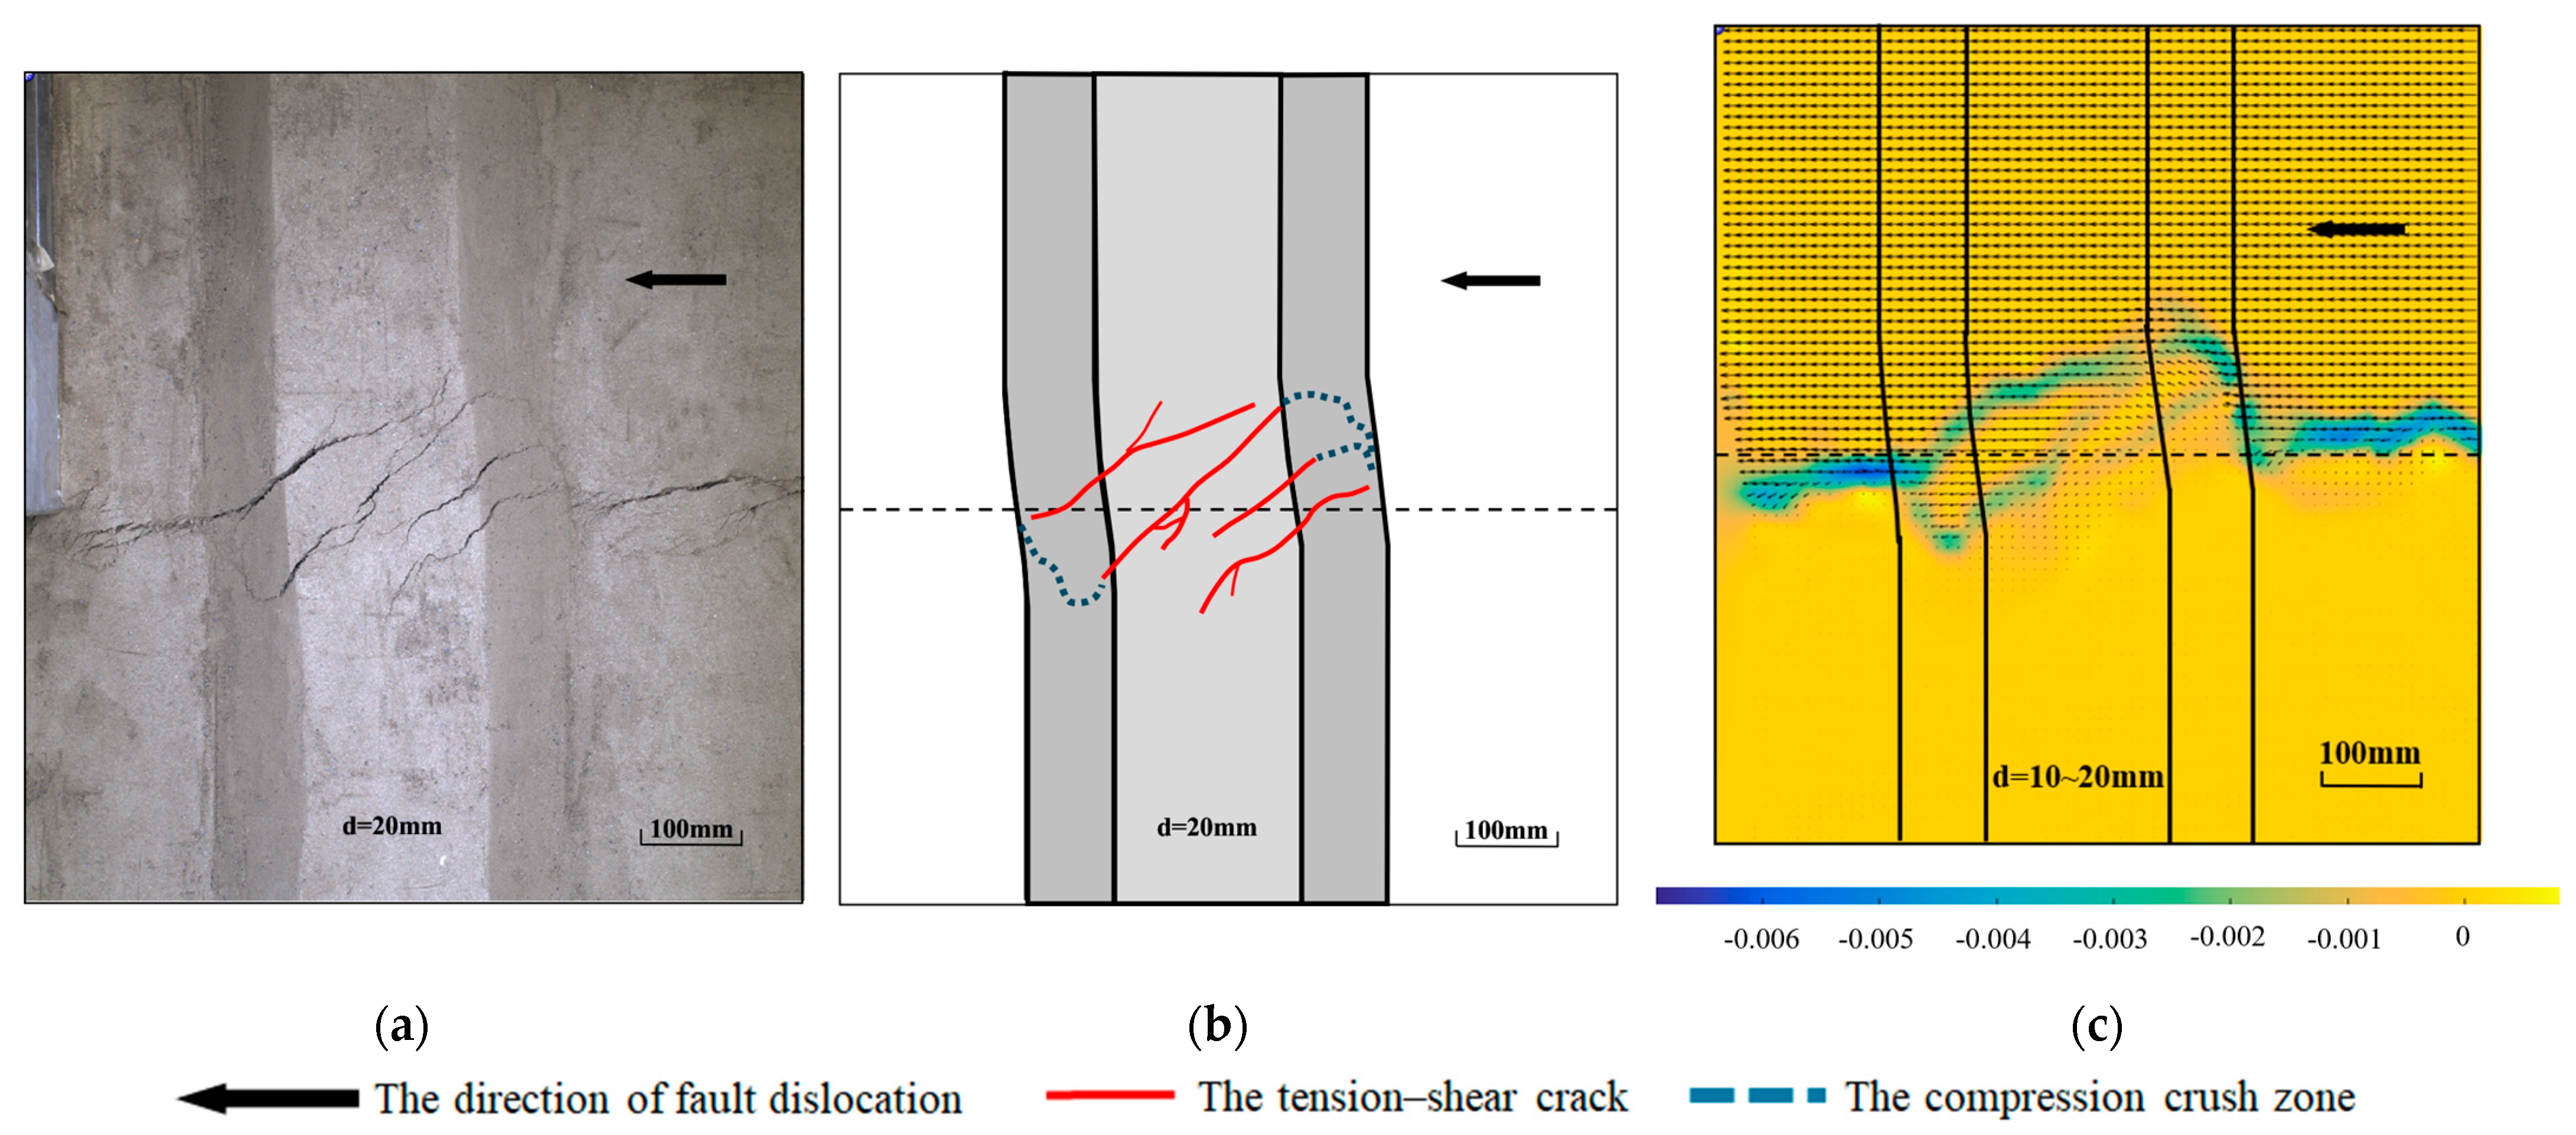
3.2.1. The Deformation Induced by Slight Fault Dislocation
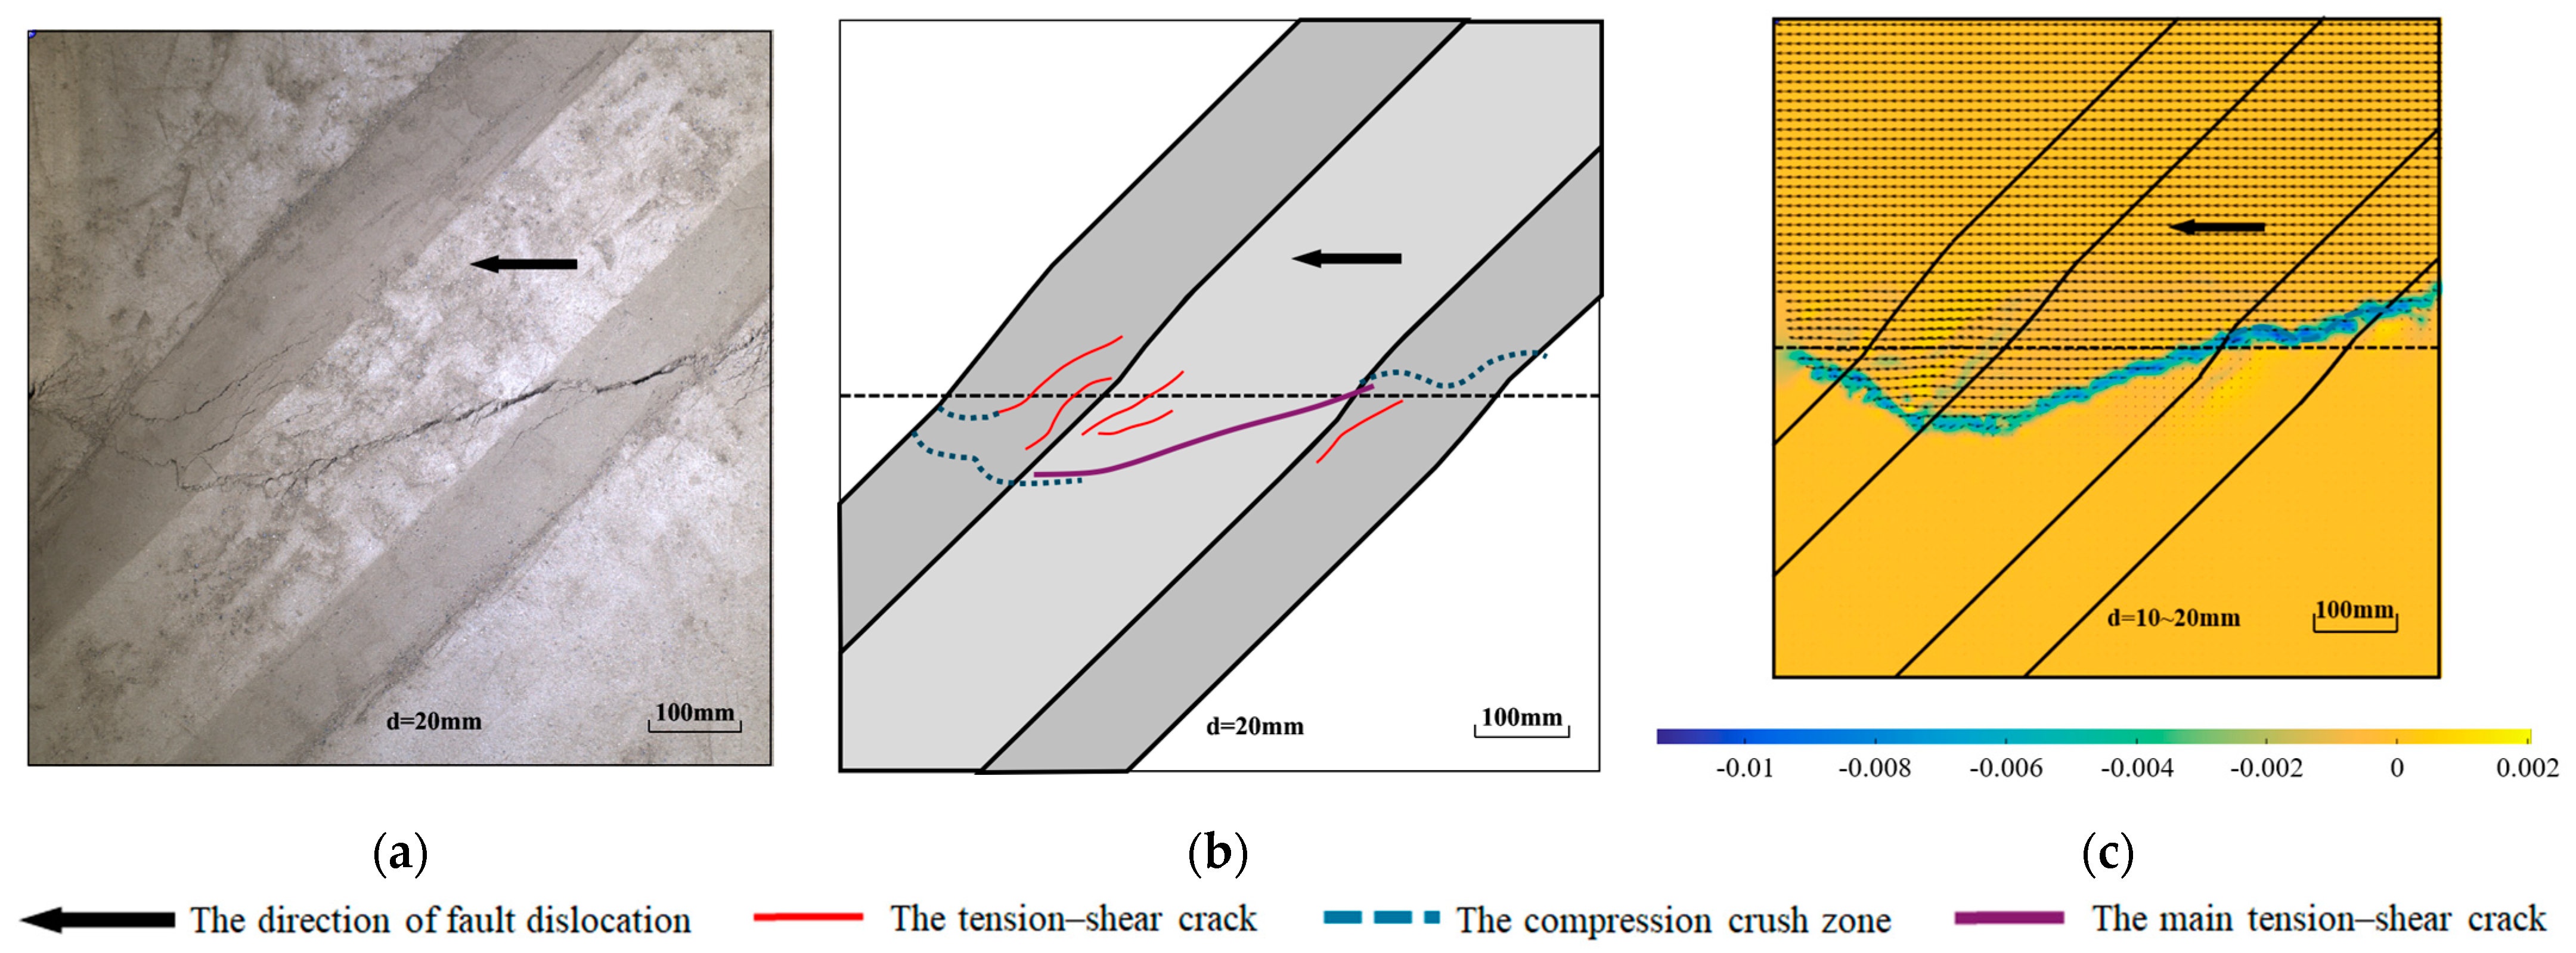
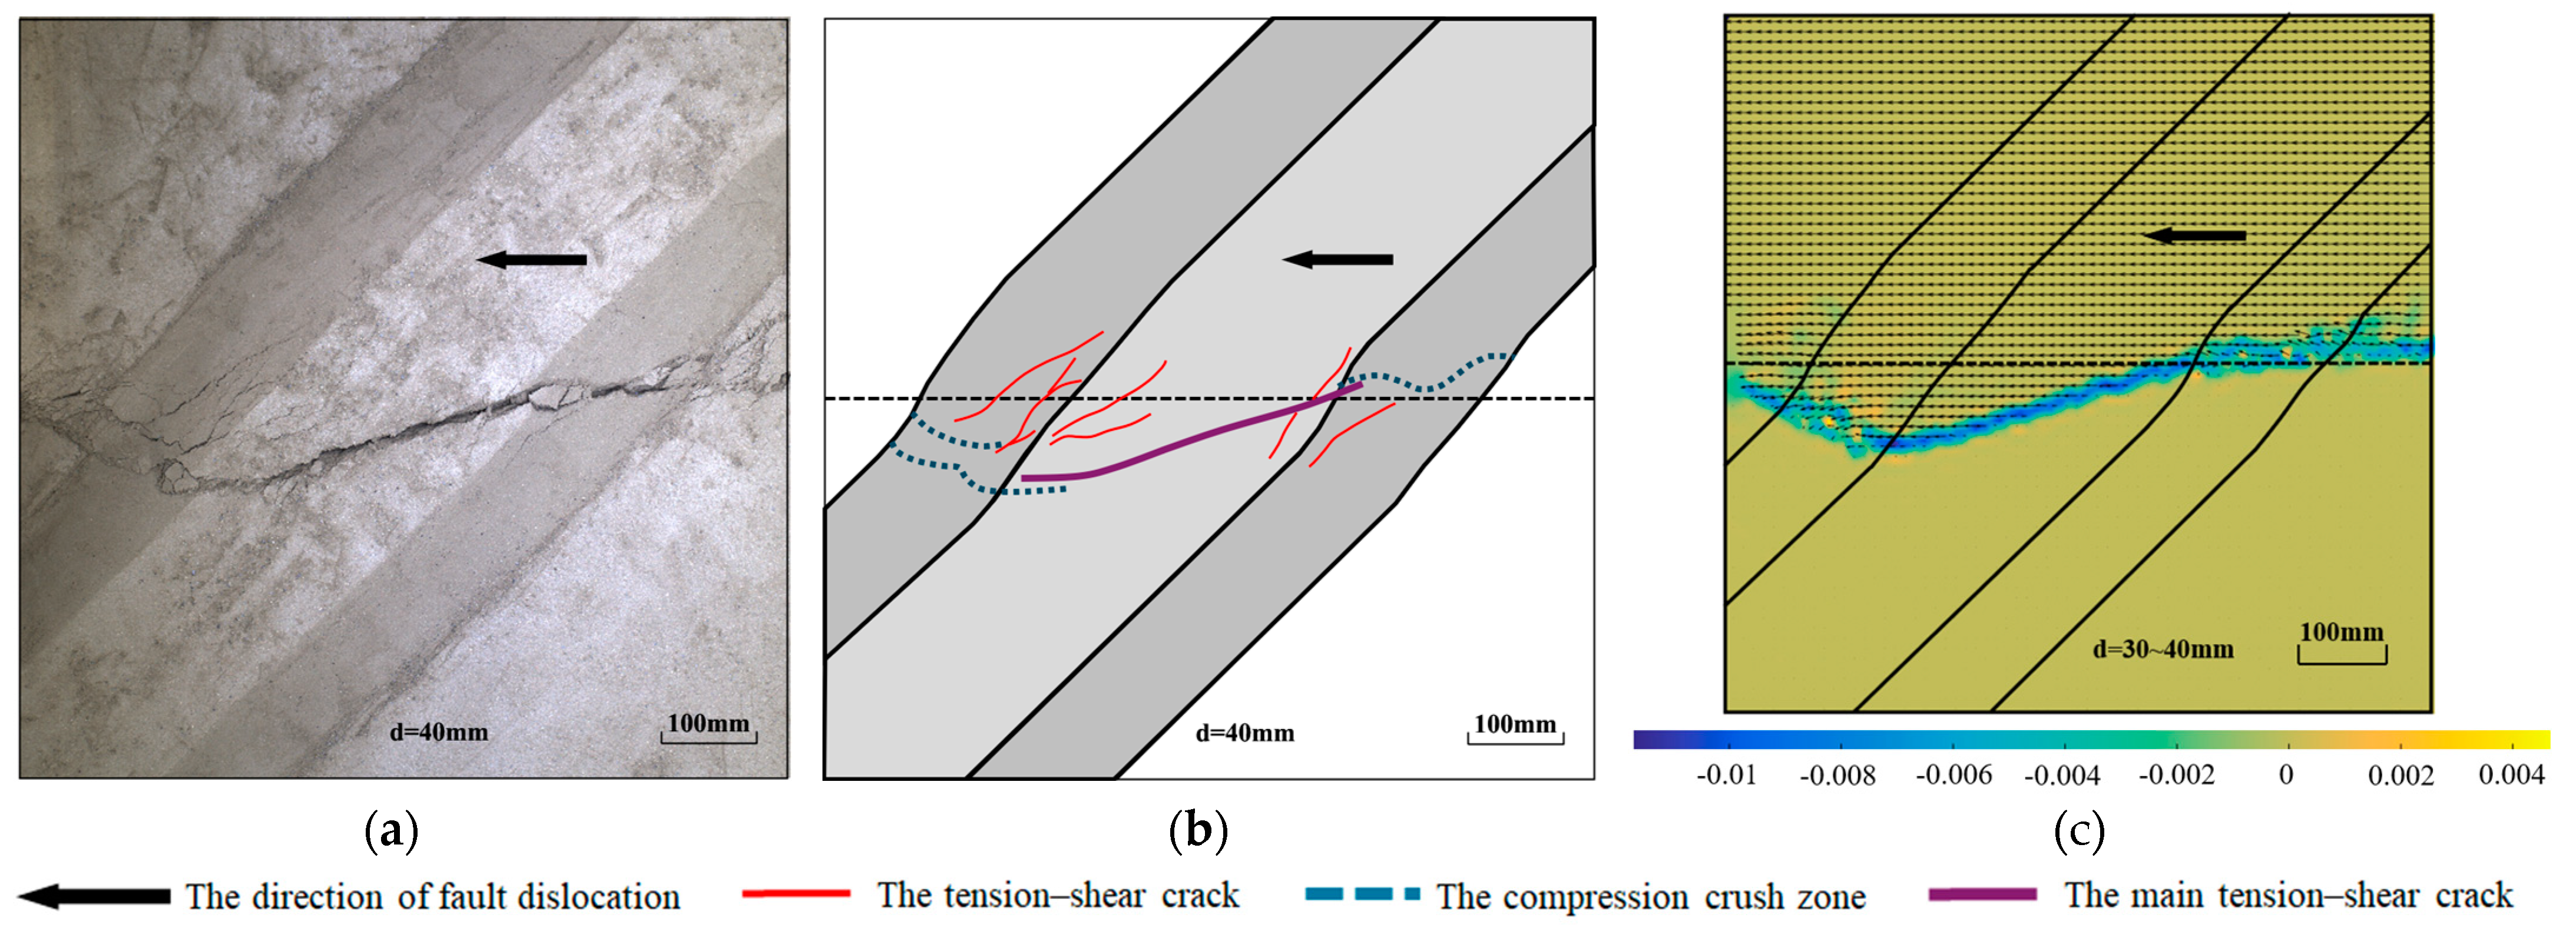
3.2.2. The Deformation Induced by Severe Fault Dislocation
4. Numerical Simulation Calculation of Fault Dislocation
4.1. Establishment of Numerical Simulation Models
4.2. Model Assumptions and Calculation Parameters
5. Analysis of Numerical Simulation Results
5.1. Stress Distribution
5.2. Combined Damage Factor
5.3. The Deformation of Subgrade Top Surface
6. Discussion
6.1. The Deformation Mechanism
6.2. Limitations of This Study
7. Conclusions
- (1)
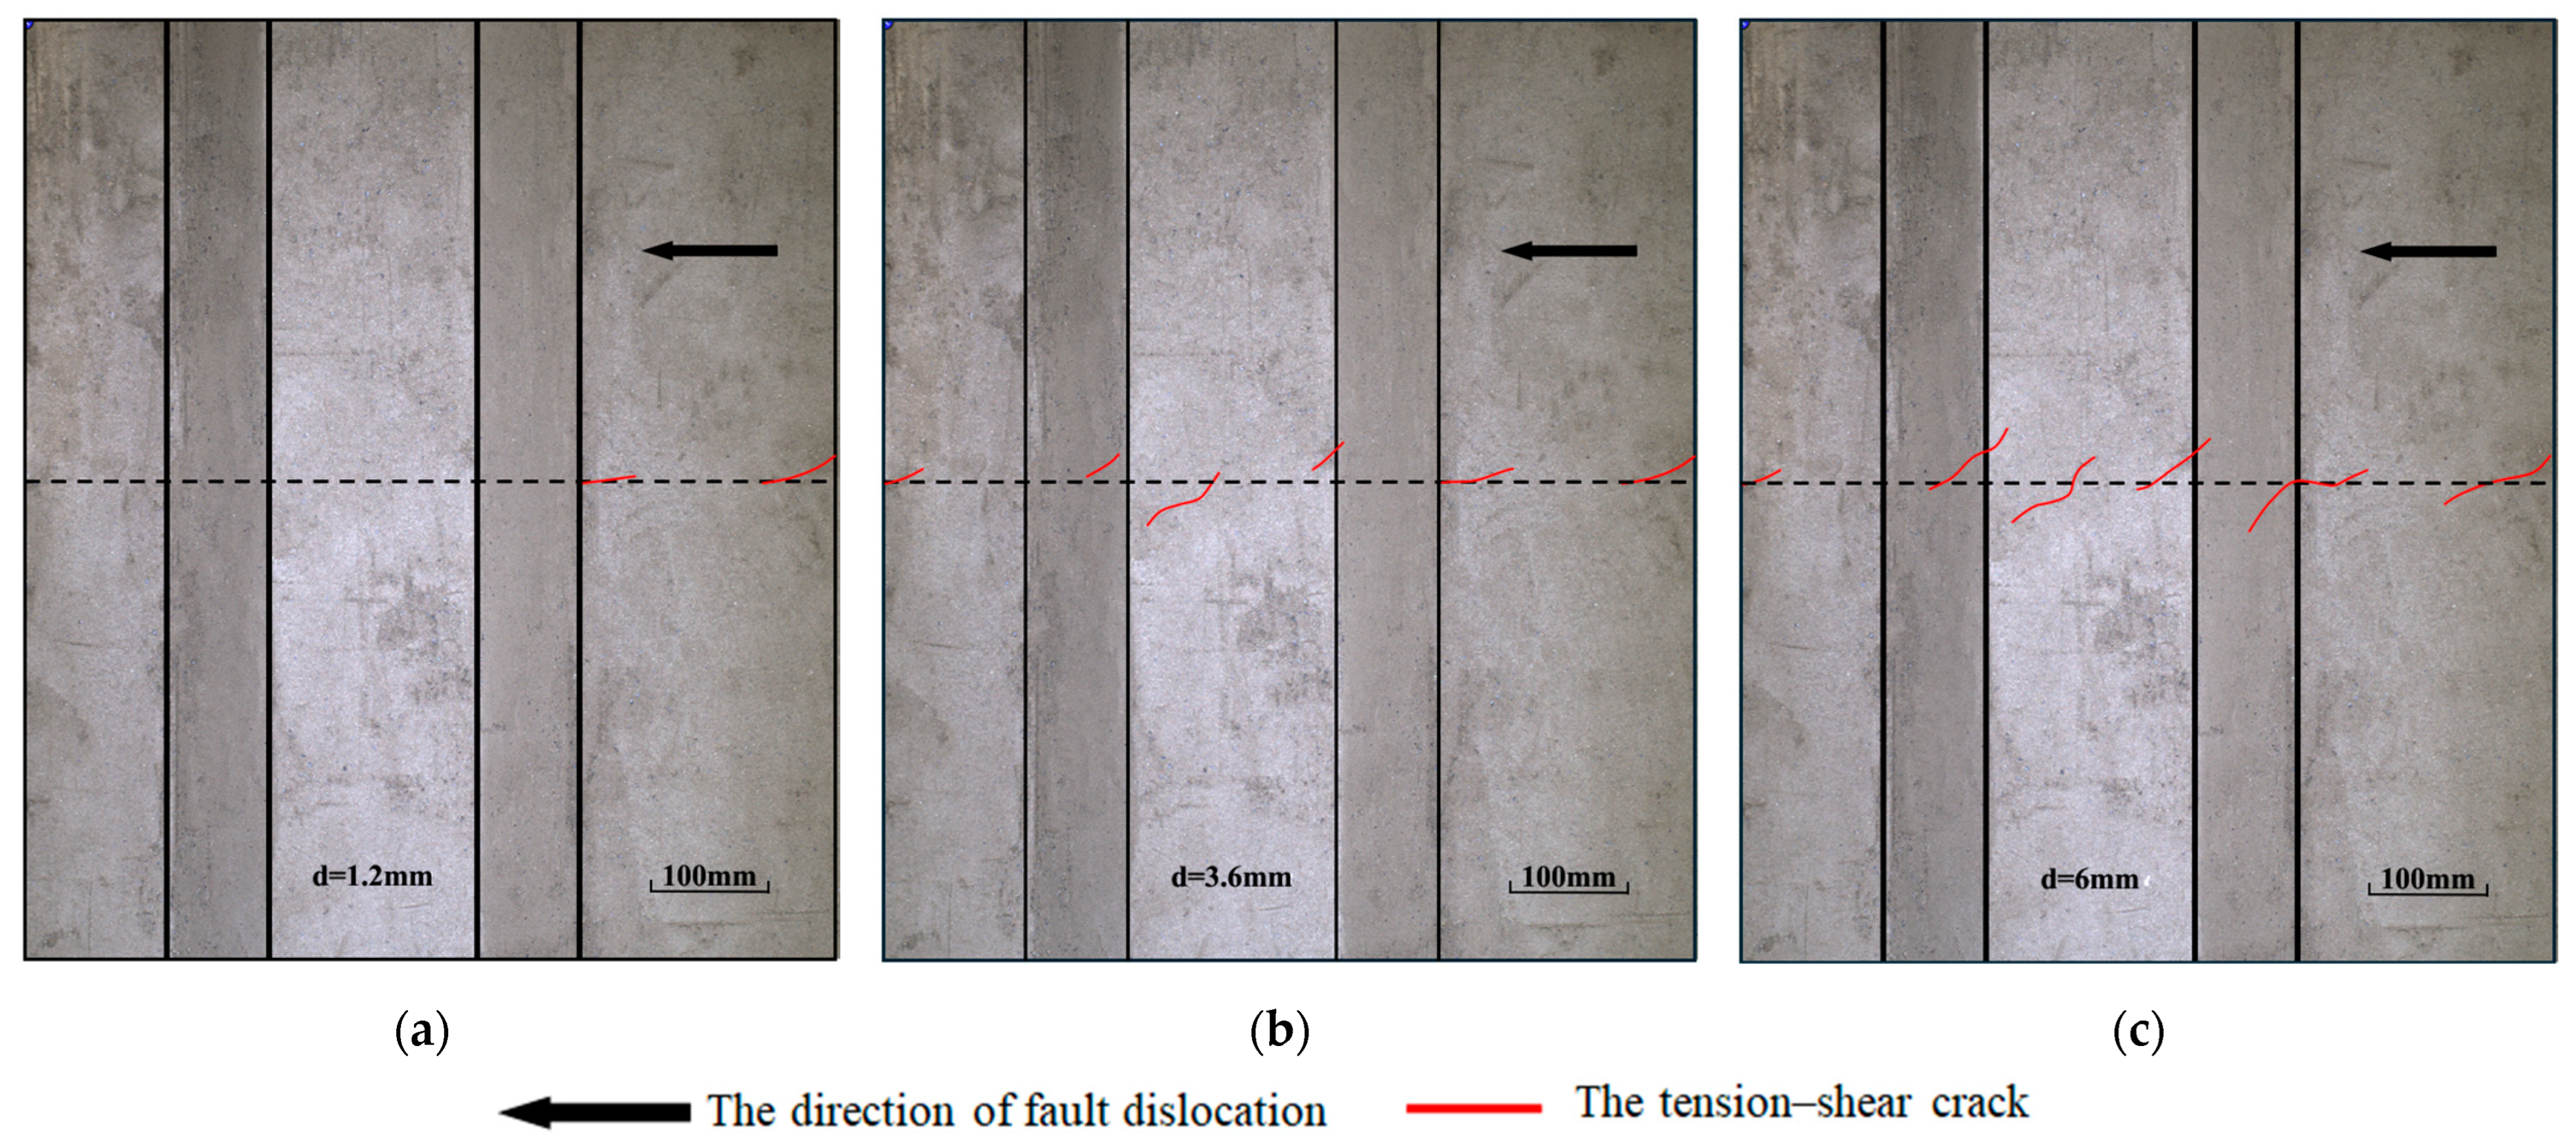
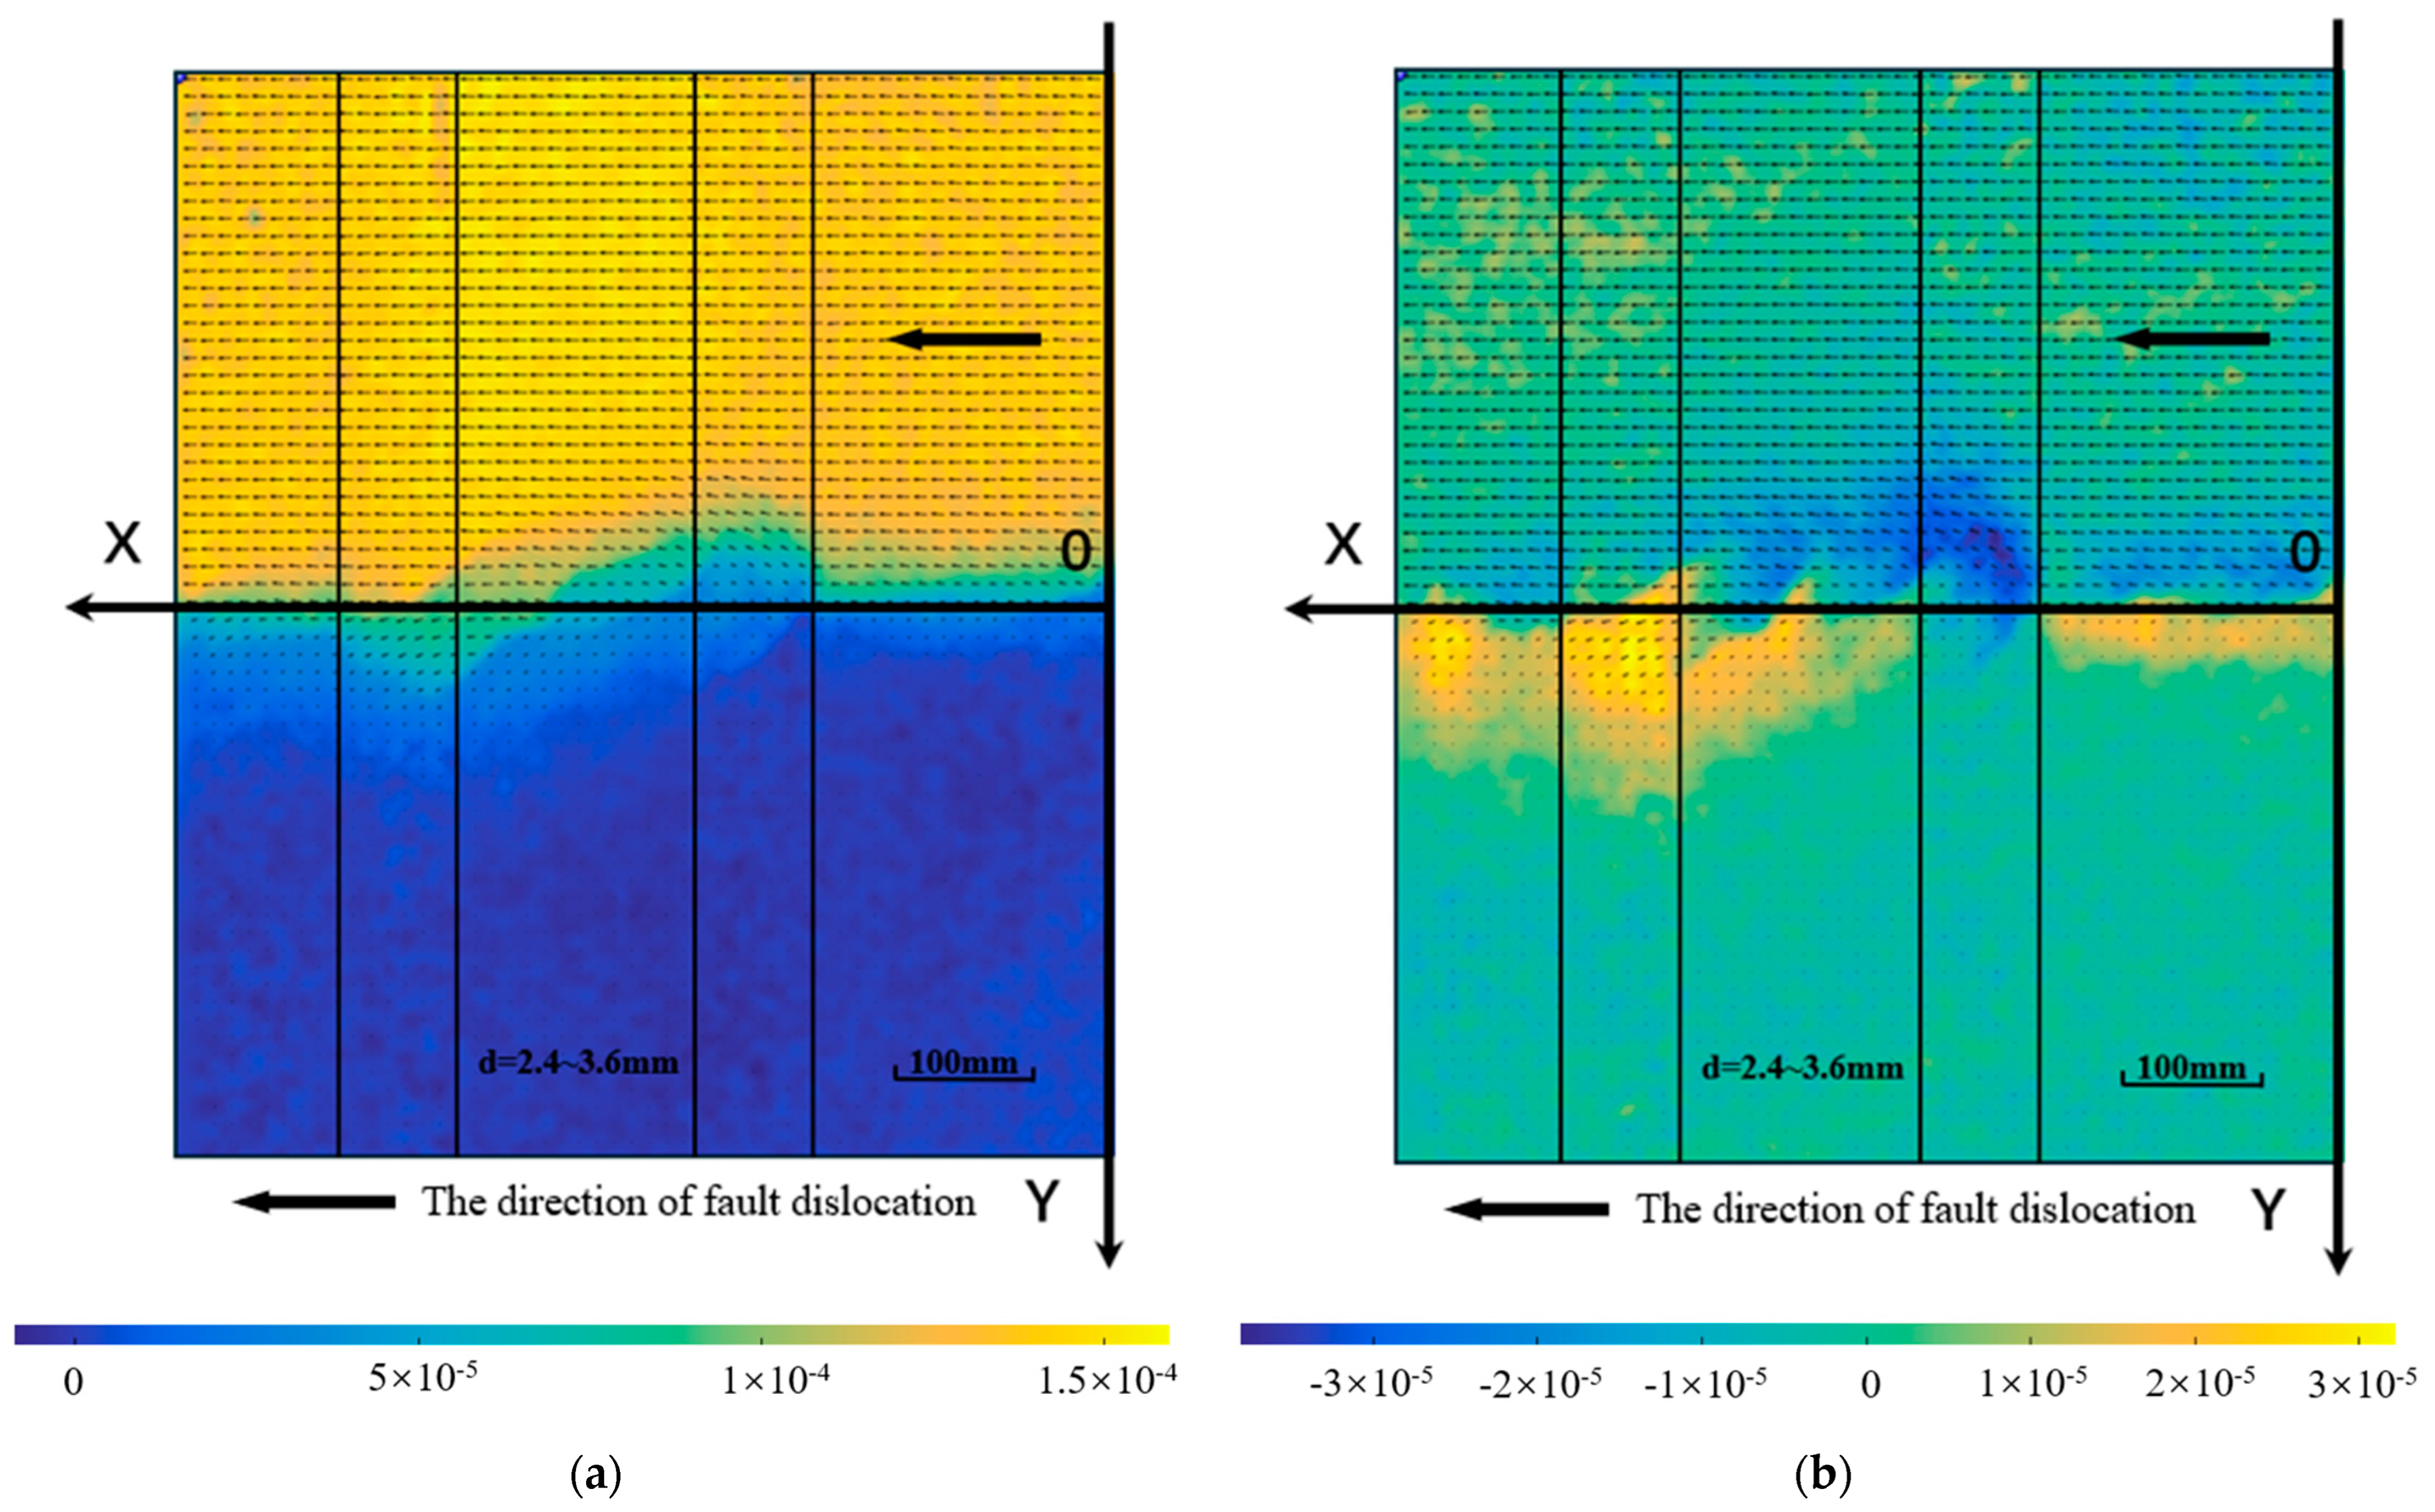
- When the fault dislocation was slight, the deformation of the subgrade surface was diffuse, with the subgrade showing an S–shaped dislocation along the fault strike. Simultaneously, the soil on the surface of the subgrade and the foundation was thrust to both sides of the fault. This phenomenon adversely affects the sustainability of the subgrade. During a severe fault dislocation, numerous en echelon tension–shear cracks appeared on the surface of the subgrade and foundation, and compression crush zones emerged on the surface of the subgrade slope. Taking the intersection of the centerline of the subgrade top surface and the fault strike as the center, the tension–shear cracks and compression crush zones were roughly distributed in a centrosymmetric manner. Due to the presence of tension–shear cracks and the thrusting effect, the density of the subgrade significantly decreased, leading to cavities and subsidence on the subgrade’s surface.
- (2)
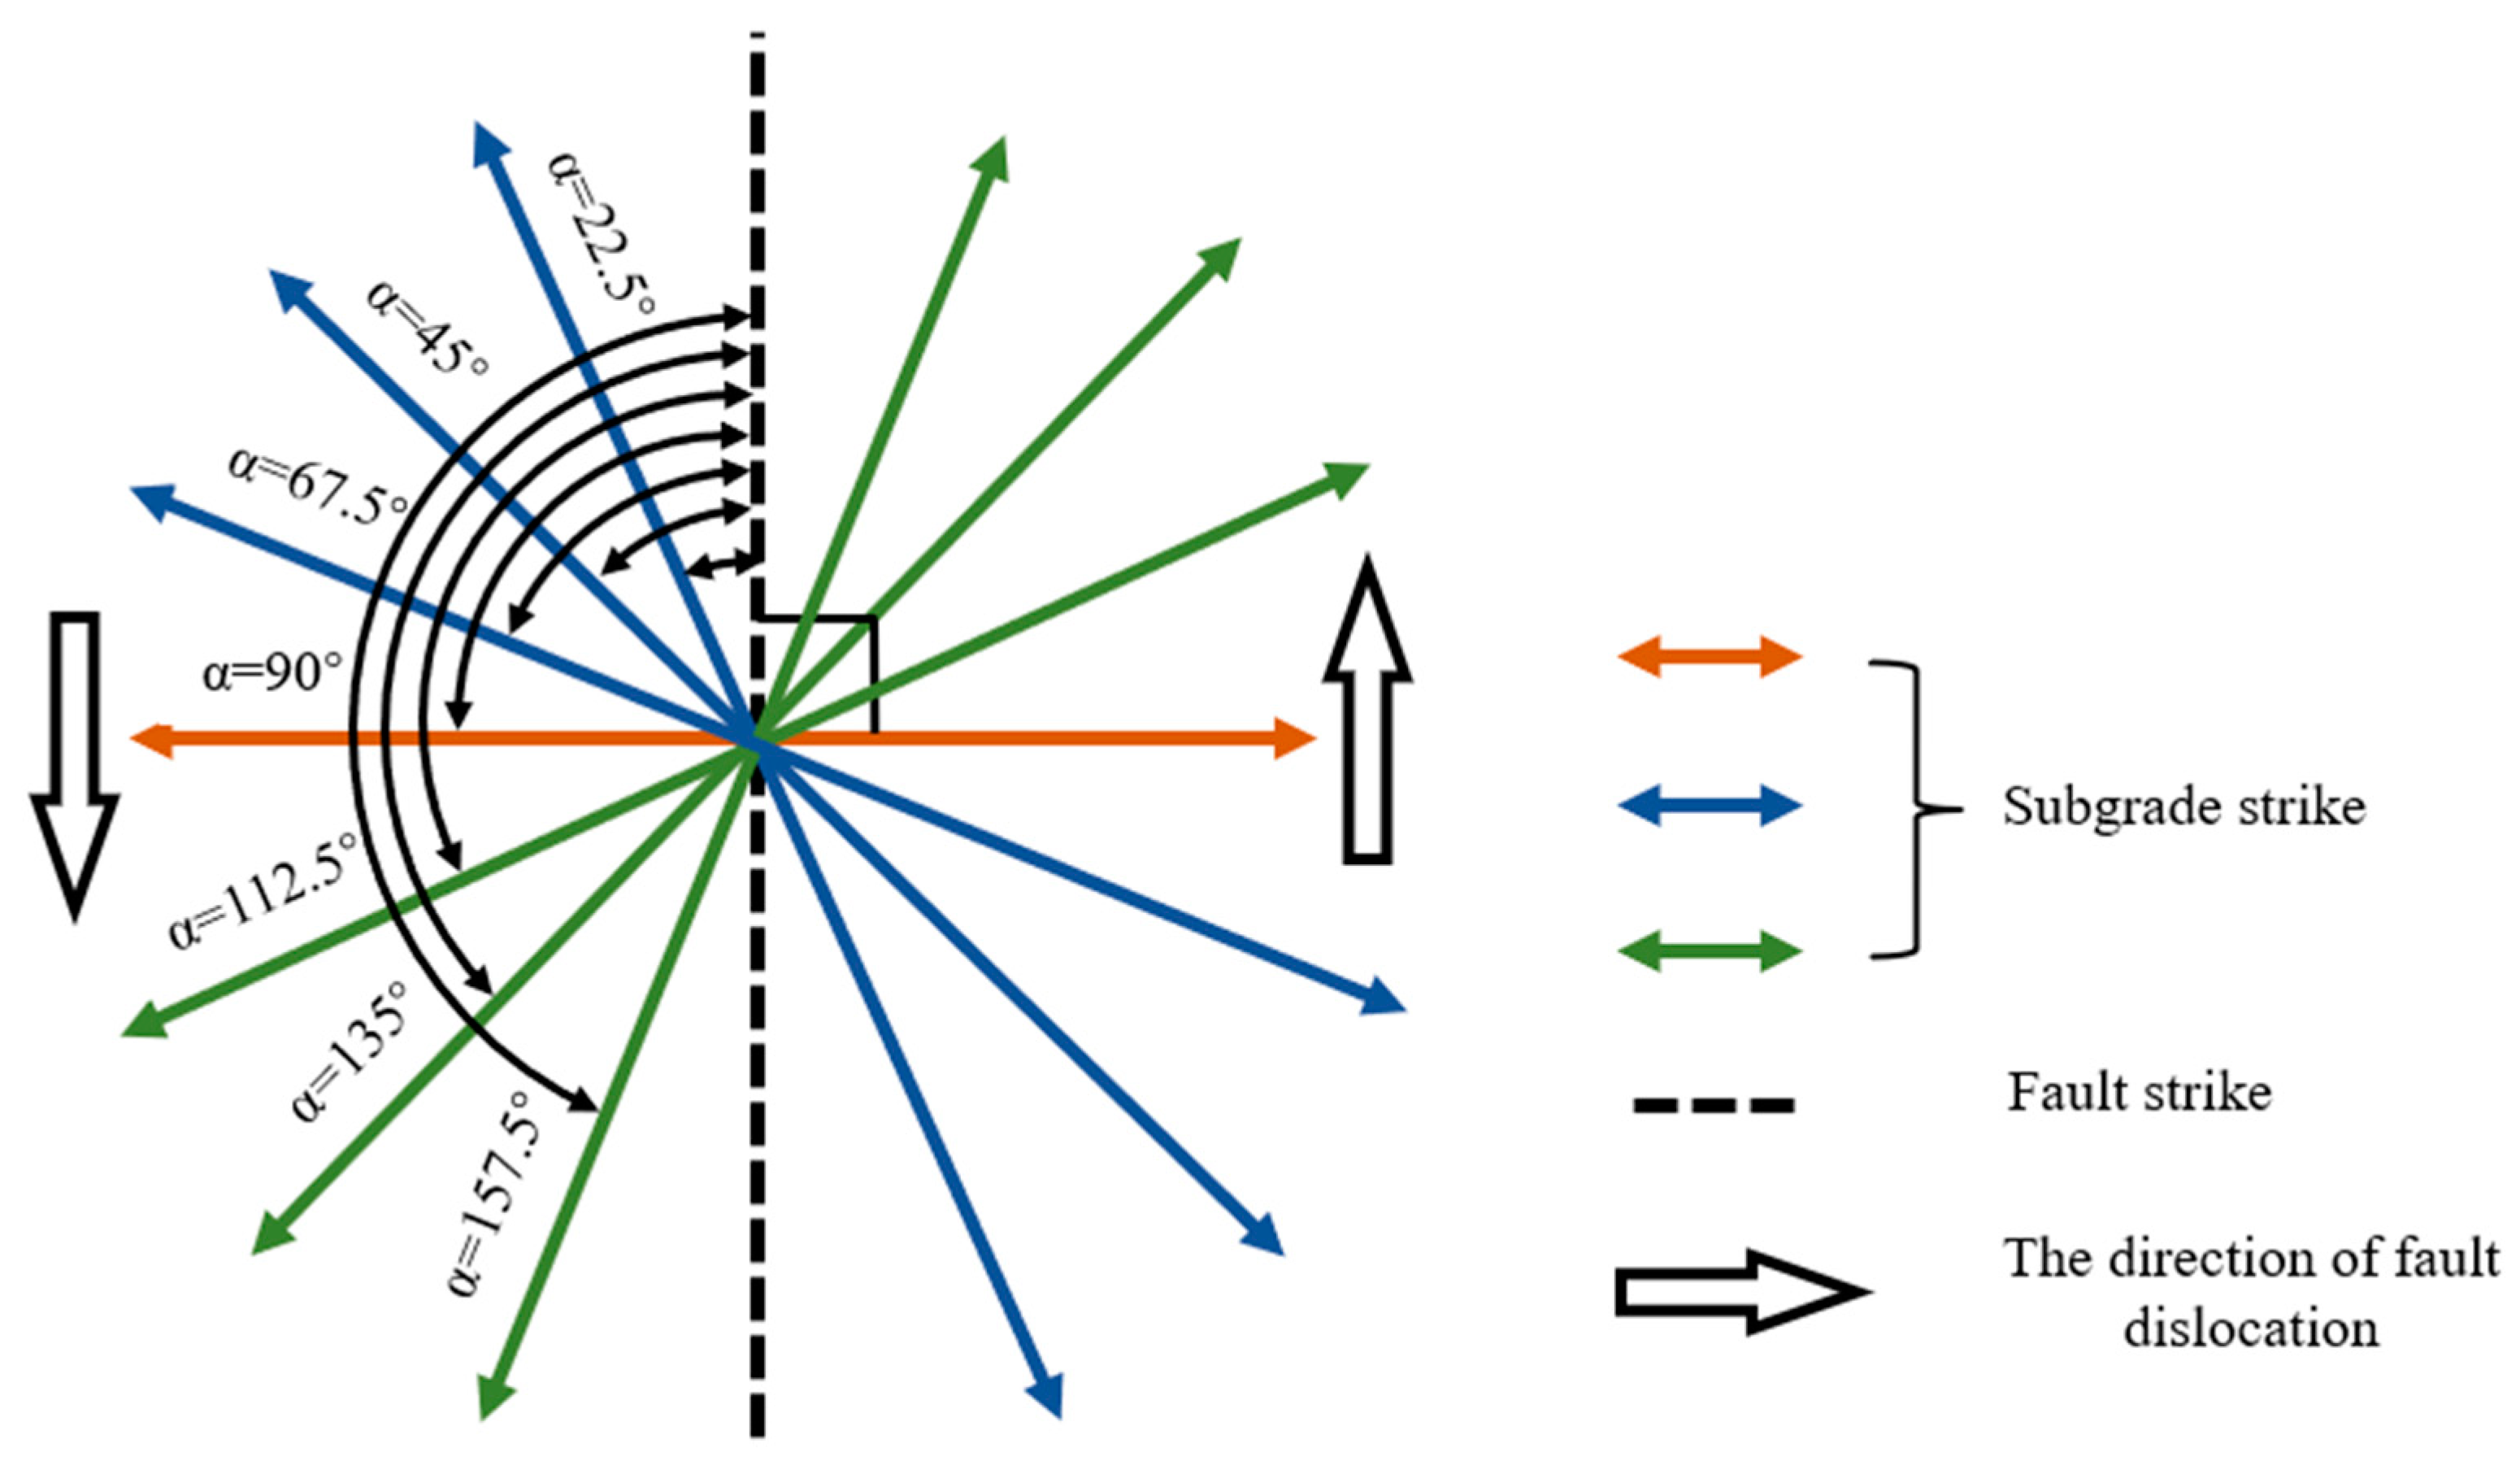
- When the angle between the fault strike and the subgrade strike increased from 22.5° to 157.5°, the range of uneven deformation of the subgrade induced by the fault dislocation decreased and then increased. When the angle was 90°, the range of uneven deformation was the smallest. To minimize the impact of the fault dislocation on the smoothness of railway lines, it is recommended that the angle between the fault strike and the subgrade strike should be 90° or close to 90°.
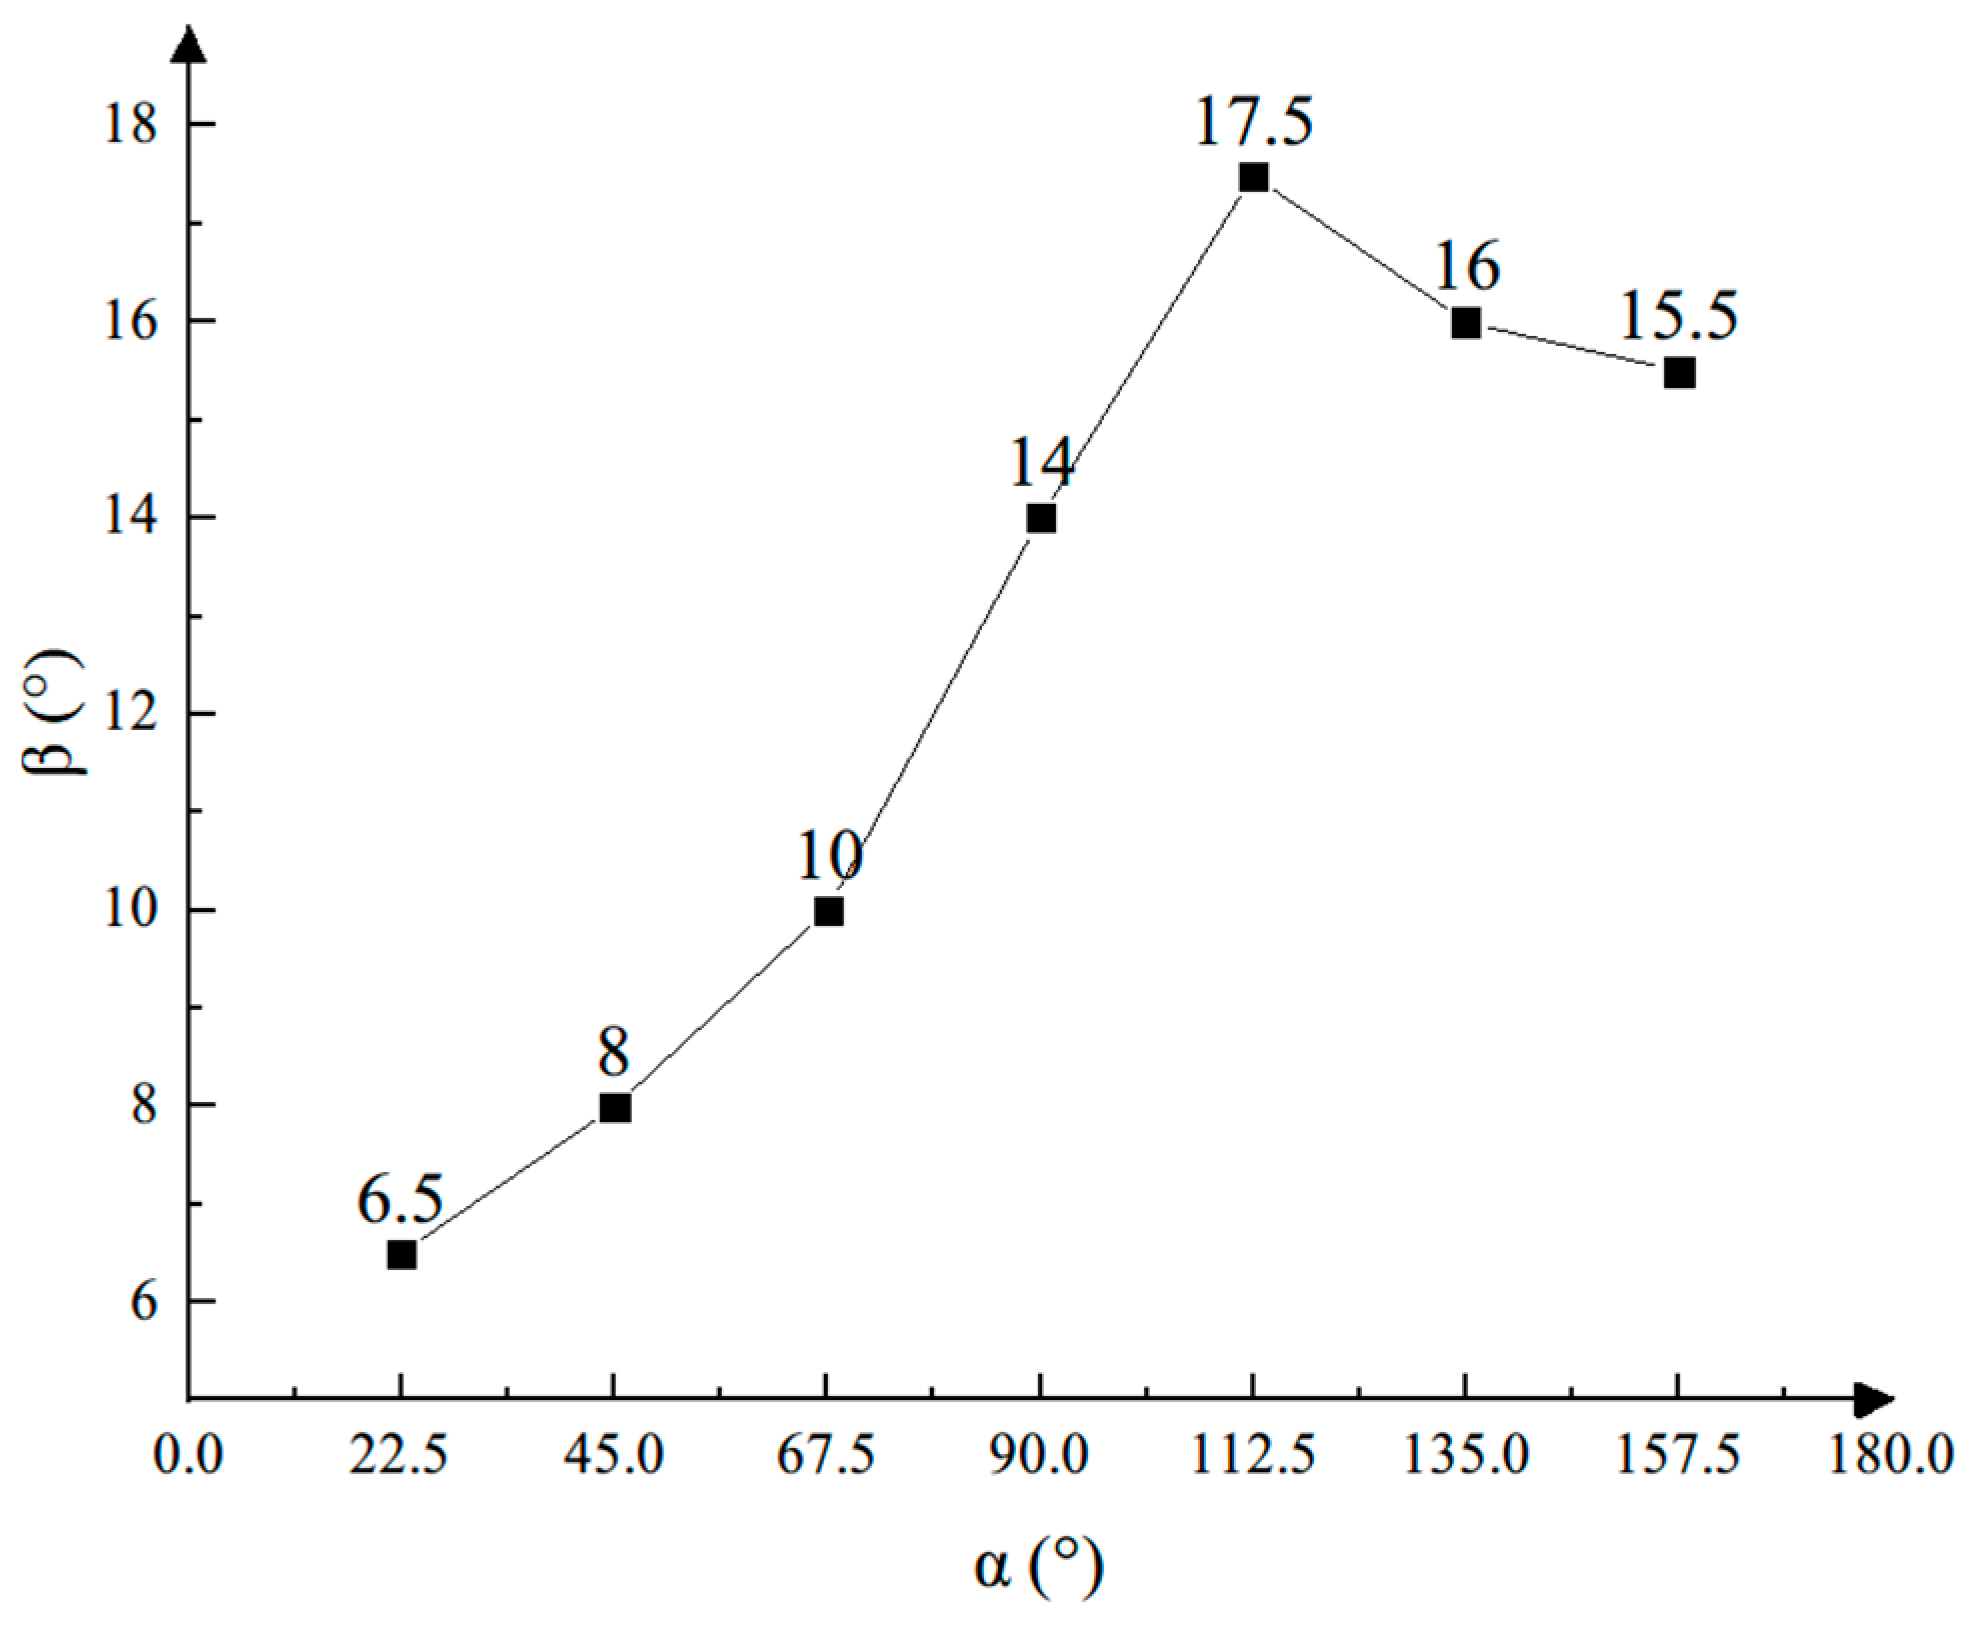
- (3)
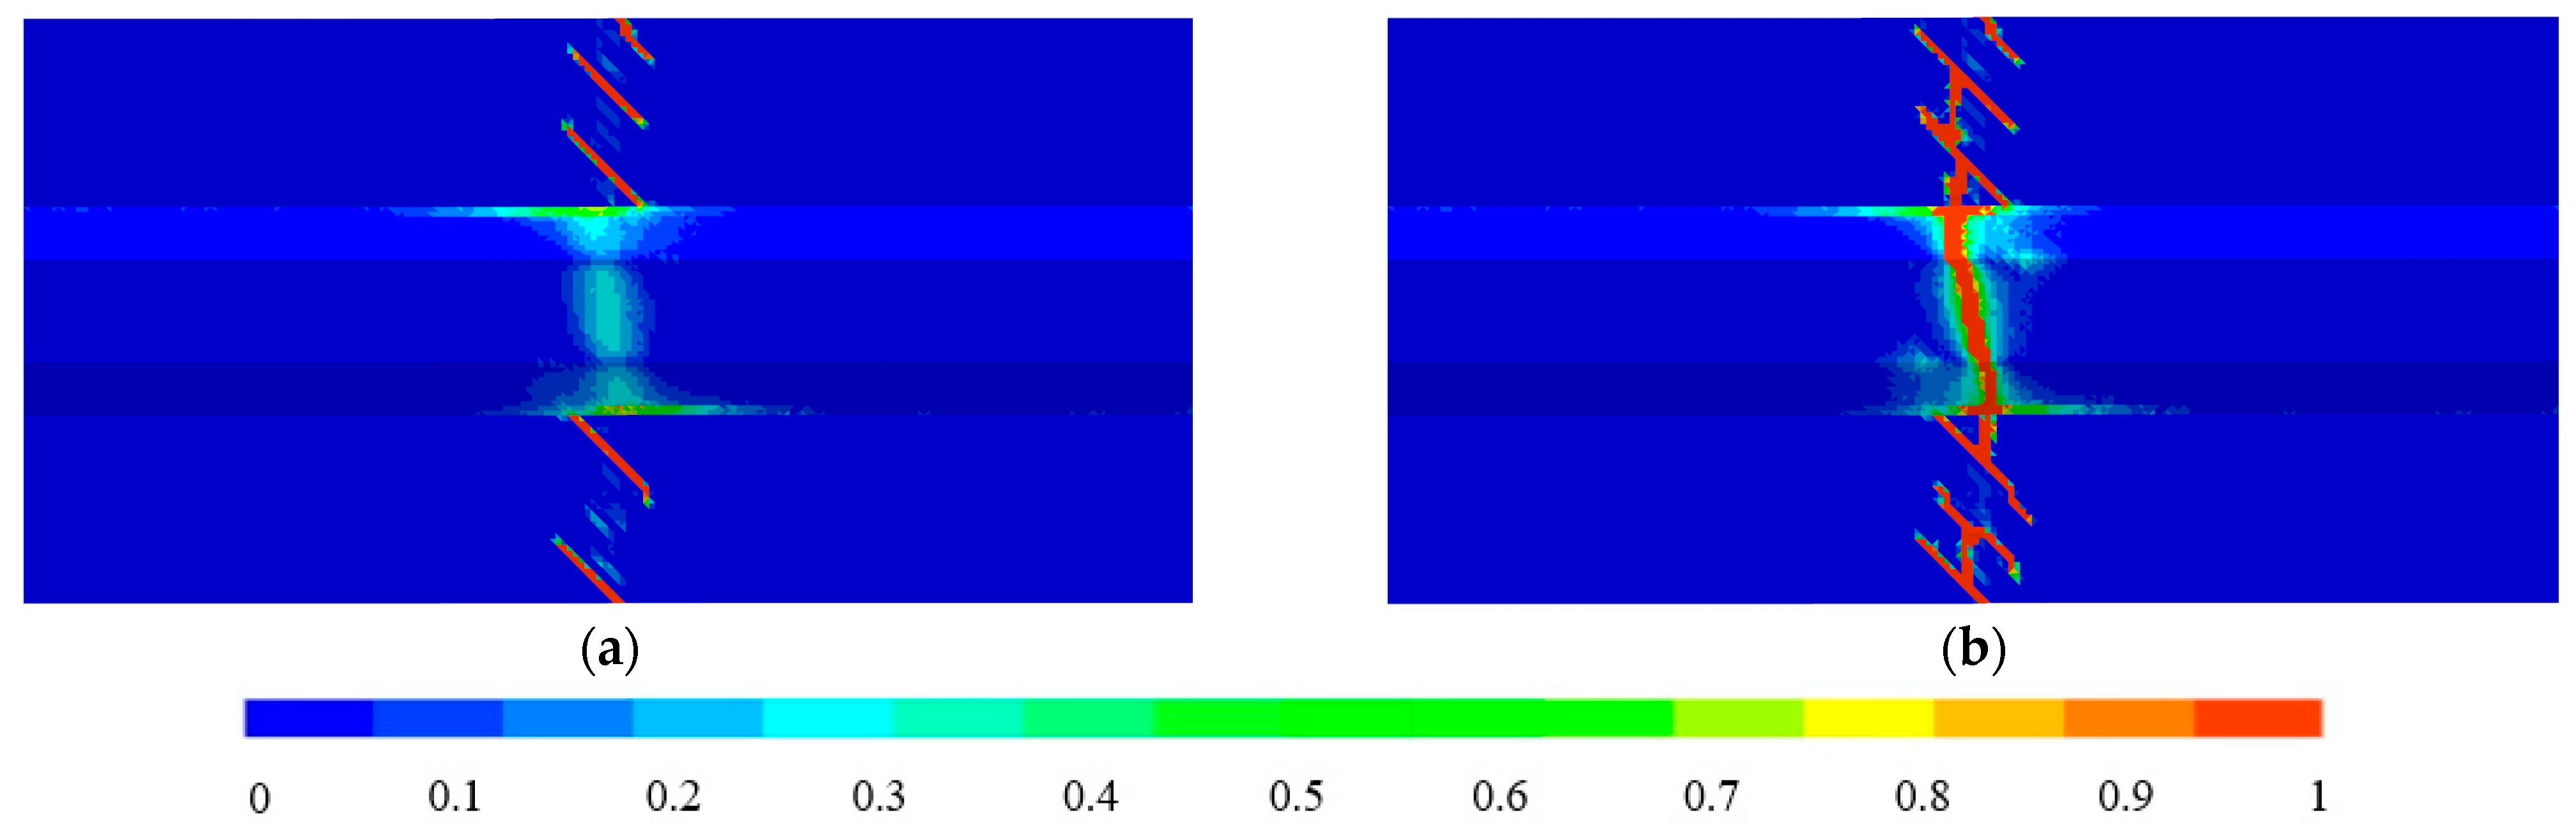
- When the angle between the fault strike and the subgrade strike increased from 22.5° to 157.5°, the angle between the main tension–shear crack on the top surface of the subgrade and the fault strike showed a trend of increasing and then decreasing. The maximum angle was 17.5° when the angle between the fault strike and the subgrade strike was 112.5°. The minimum angle was 6.5° when the angle between the fault strike and the subgrade strike was 22.5°. This conclusion can provide a reference for accurately determining the direction of the main tension–shear crack on the top surface of the subgrade.
- (4)
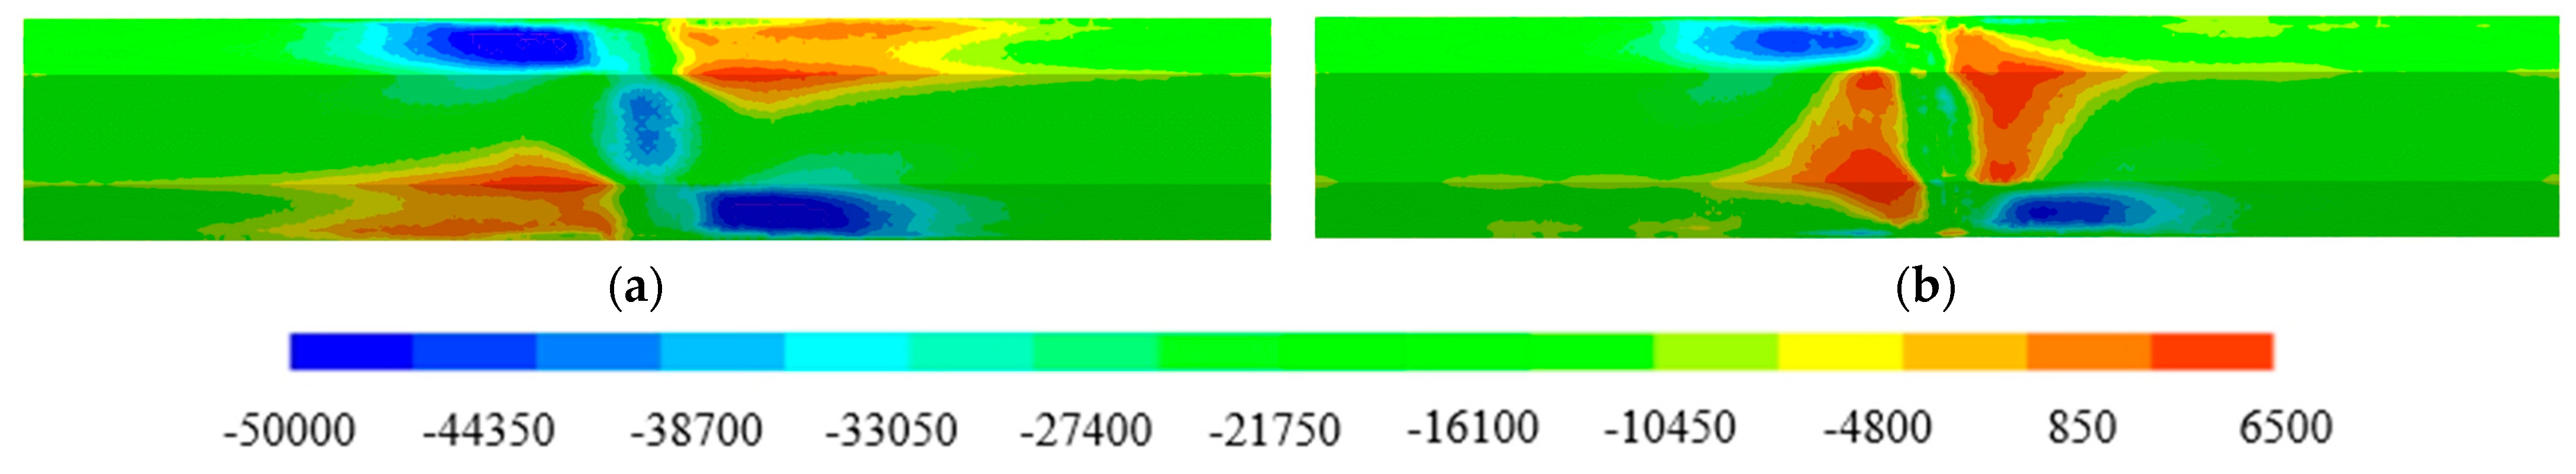
- When the angle between the fault strike and the subgrade strike increased from 22.5° to 157.5°, the compressive stress along the subgrade strike decreased, while the tensile stress along the subgrade strike gradually increased. Tensile stress was the main cause of tension–shear cracks on the subgrade surface, while compressive stress was the main cause of the compression crush zone on the subgrade slope.
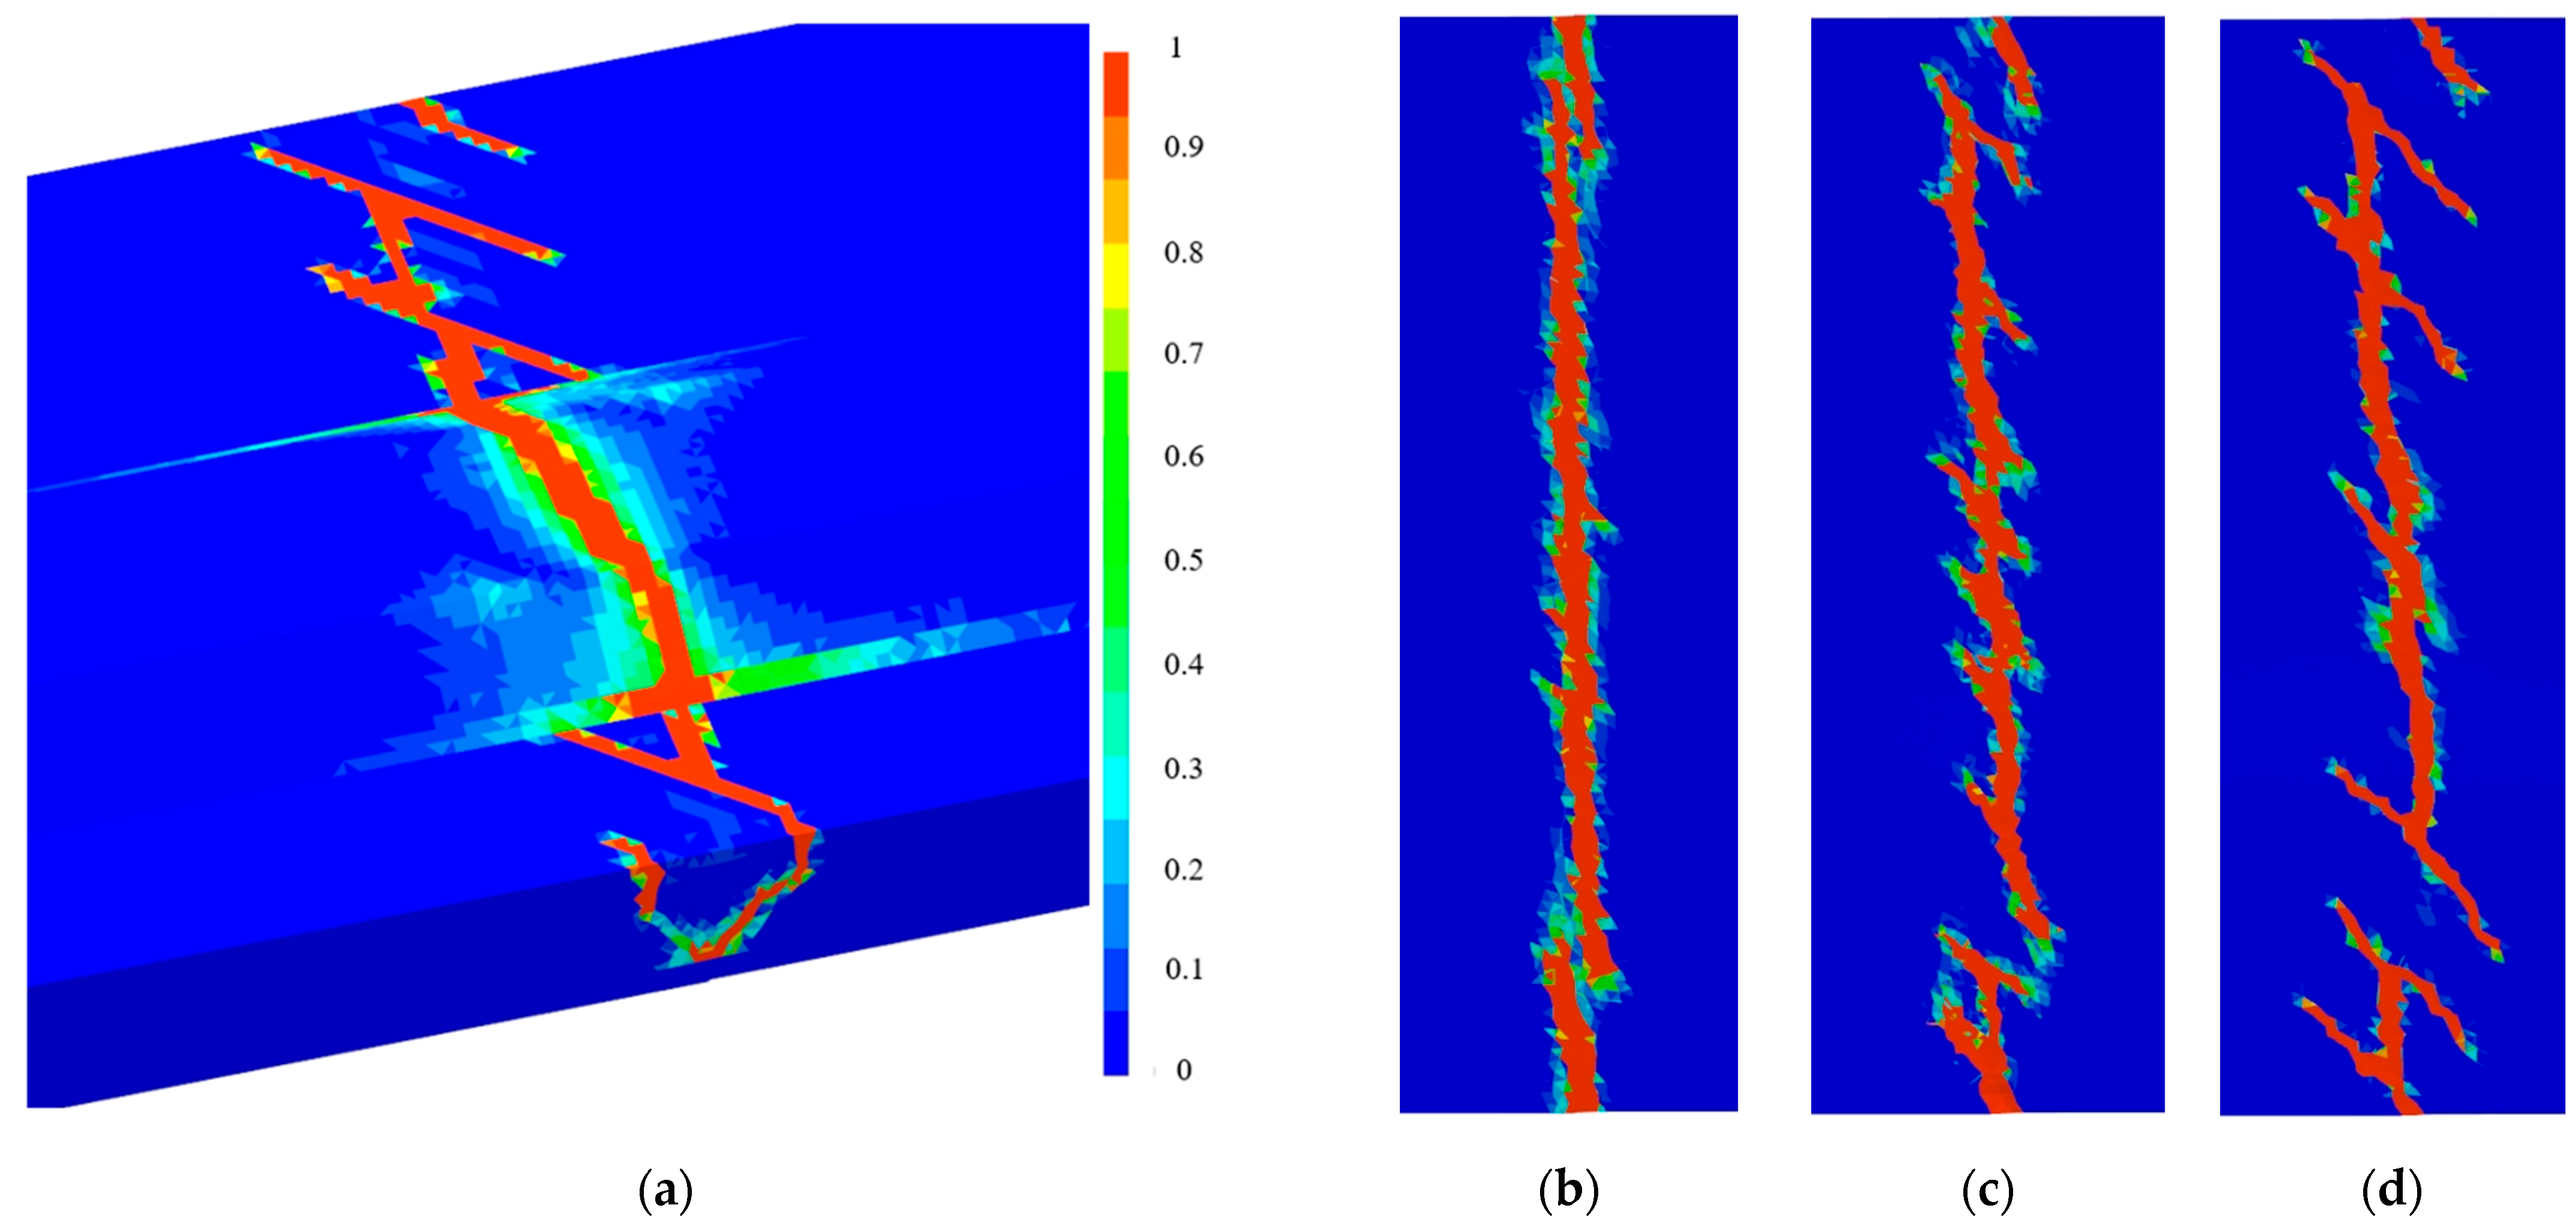
- (5)
- The tension–shear cracks formed in the subgrade and foundation were spiraled. With an increase in the depth of the subgrade and foundation, the angle between the cracks and the fault strike gradually decreased, converging on the strike–slip fault.
Author Contributions
Funding
Data Availability Statement
Conflicts of Interest
References
- Mao, J.; Jiang, D.W.; Yang, Q.H.; Zhang, Y.G. Discussion on typical disaster reduction route selection of Yunnan–Guangxi railway. High Speed Railw. Technol. 2018, S2, 62–67. [Google Scholar]
- Zhang, X.B.; Yu, H.; Yu, X.; Guo, C.B.; Wu, R.A.; Wang, Y.; Zhong, N. Preliminary study on the Late Quaternary activity of important active fault zones along the Yunnan–Tibet railway. Prog. Earthq. Sci. 2024, 54, 94–109. [Google Scholar]
- Zhao, L.N. Route selection and engineering measures for high speed railway crossing active fault zone. China Railw. 2023, 7, 7–13. [Google Scholar]
- Liu, Y.; Ren, Y.F.; Wang, D.R.; Wen, R.; Huang, Y.; Wang, H. Research on co–seismic displacement of ground surface at Liuhuanggou bridge of Lanzhou–Xinjiang high–speed railway caused by the 2022 Menyuan earthquake in Qinghai province. China Railw. Sci. 2022, 43, 42–50. [Google Scholar]
- Zhang, Y.F.; Yuan, K.; Zhou, W.J.; Fan, J.W. Study on structural deformation characteristics and surface crack distribution of girder tunnel across Lenglongling fault caused by Menyuan earthquake. Chin. J. Rock Mech. Eng. 2023, 42, 1055–1069. [Google Scholar]
- Wang, J.J. Coseismic, Postseismic and Interseismic Stress Triggerings. Ph.D. Thesis, Wuhan University, Wuhan, China, 2010. [Google Scholar]
- Riedel, W. Zur mechanik geologischer brucherscheinungen. Geol. Und Paleontol. B 1929, 8, 345–368. [Google Scholar]
- Naylor, M.A.; Mandl, G.; Supesteijn, C.H.K. Fault geometries in basement–induced wrench faulting under different initial stress states. J. Struct. Geol. 1986, 8, 737–752. [Google Scholar] [CrossRef]
- Savage, J.C.; Burford, R.O. Geodetic determination of relative plate motion in central California. J. Geophys. Res. 1973, 78, 832–845. [Google Scholar] [CrossRef]
- Cai, Q.P.; Wu, H.W.; Hu, P.; Chen, X.X.; Li, S.C. Centrifuge experimental study of dynamic responses of clay stratum overlying a strike–slip fault. Rock Soil Mech. 2018, 39, 2424–2432. [Google Scholar]
- Hardy, S.; Finch, E. Discrete element modelling of the influence of cover strength on basement–involved fault–propagation folding. Tectonophysics 2006, 415, 225–238. [Google Scholar] [CrossRef]
- Zhang, J.J.; Si, C.L.; Zhao, Y.J.; Liu, H.; Hou, J.Q. Reinforcement measures and deformation failure modes of subgrade on embedded reverse fault. Rock Soil Mech. 2013, 34, 2460–2467. [Google Scholar]
- Ai, S.J. Study on the Influence of Dip–Slip Faulting on Subgrade Stability and Engineering Failure Resistance Technology. Master’s Thesis, Lanzhou Jiaotong University, Lanzhou, China, 2021. [Google Scholar]
- Ji, Y. Strike–Slip Fault Zone Activities’ Influence to the Stability of Roadbed and Research on Engineering Anti Breaking Technology. Master’s Thesis, Lanzhou Jiaotong University, Lanzhou, China, 2021. [Google Scholar]
- Ma, S.J. Study on Tunnel Disaster Response Mechanism and Disaster Range Prediction under Active Fault Dislocation. Master’s Thesis, Southwest Jiaotong University, Chengdu, China, 2022. [Google Scholar]
- Li, L. Study on the Influence Mechanism of Active Fault Zone on Metro Viaduct. Master’s Thesis, Chang’an University, Xi’an, China, 2022. [Google Scholar]
- Li, H. Numerical Simulation of Coseismic Surface Deformation and Stick–Slip Dislocation Process of Strike–Slip Fault. Ph.D. Thesis, Institute of Geology, China Earthquake Administration, Beijing, China, 2018. [Google Scholar]
- TB 10001–2016; Code for Design on Subgrade of Railway. China Railway Publishing House Co., Ltd.: Beijing, China, 2017.
- Li, Y.H.; Zhu, H.H.; Katsutoshi, U.; Akitoshi, M. Deformation field measurement for granular soil model using image analysis. Chin. J. Geotech. Eng. 2004, 26, 36–41. [Google Scholar]
- Zhang, G.; Mu, T.P.; Zhang, J.M. Displacement measurement using image analysis in centrifuge modeling of slopes. Chin. J. Geotech. Eng. 2007, 29, 94–97. [Google Scholar]
- Thielicke, W.; Sonntag, R. Particle Image Velocimetry for MATLAB: Accuracy and enhanced algorithms in PIVlab. J. Open Res. Softw. 2021, 9, 12. [Google Scholar] [CrossRef]
- Feng, J. Physical Analog Modeling of Main Controlling Factors of Strike–Slip Fault Formation and Evolution and Its Application. Ph.D. Thesis, Northeast Petroleum University, Daqing, China, 2022. [Google Scholar]


| Parameter | Resemblance Constant |
|---|---|
| Length | 50 |
| Density | 1 |
| Cohesive force | 50 |
| Internal friction angle | 1 |
| Acceleration | 1 |
| Element | Volumetric Weight (kN·m−3) | Elastic Modulus (MPa) | Poisson’s Ratio | Internal Friction Angle (°) | Cohesive Force (kPa) | Tensile Strength (kPa) |
|---|---|---|---|---|---|---|
| Subgrade | 2000 | 120 | 0.25 | 30 | 15 | 3 |
| Foundation | 1900 | 10 | 0.275 | 28 | 20 | 10 |
| Bedrock | 2500 | 20,000 | 0.2 | 45 | 15,000 | 10,000 |
Disclaimer/Publisher’s Note: The statements, opinions and data contained in all publications are solely those of the individual author(s) and contributor(s) and not of MDPI and/or the editor(s). MDPI and/or the editor(s) disclaim responsibility for any injury to people or property resulting from any ideas, methods, instructions or products referred to in the content. |
© 2024 by the authors. Licensee MDPI, Basel, Switzerland. This article is an open access article distributed under the terms and conditions of the Creative Commons Attribution (CC BY) license (https://creativecommons.org/licenses/by/4.0/).
Share and Cite
Liang, J.; Ye, Y.; Cai, D.; Yan, H.; Yao, J. Research on the Deformation Mechanism of Railway Subgrade under Buried Strike–Slip Fault Dislocation. Appl. Sci. 2024, 14, 5102. https://doi.org/10.3390/app14125102
Liang J, Ye Y, Cai D, Yan H, Yao J. Research on the Deformation Mechanism of Railway Subgrade under Buried Strike–Slip Fault Dislocation. Applied Sciences. 2024; 14(12):5102. https://doi.org/10.3390/app14125102
Chicago/Turabian StyleLiang, Jingwei, Yangsheng Ye, Degou Cai, Hongye Yan, and Junkai Yao. 2024. "Research on the Deformation Mechanism of Railway Subgrade under Buried Strike–Slip Fault Dislocation" Applied Sciences 14, no. 12: 5102. https://doi.org/10.3390/app14125102