Article

Comparison of the Workday and Non-Workday Carbon Emission Reduction Benefits of Bikeshare as a Feeder Mode of Metro Stations

School of Civil Engineering, Xi’an University of Architecture and Technology, Xi’an 710055, China
*
Authors to whom correspondence should be addressed.
Appl. Sci. 2024, 14(12), 5107; https://doi.org/10.3390/app14125107
Submission received: 9 April 2024 / Revised: 2 June 2024 / Accepted: 7 June 2024 / Published: 12 June 2024

Abstract

:
Bikeshare, as a convenient transport mode, can address the first- and last-mile travel needs of metro trips while generating many environmental benefits, such as reducing the use of environmentally unfriendly transport modes and lowering the carbon emissions of the urban transportation system. This paper takes bikeshare as a feeder mode of metro stations (BS-FMMS) as the research object and compares the spatial and temporal differences in the carbon emission reduction benefits of BS-FMMS on workdays and non-workdays by using the framework of BS-FMMS carbon reduction benefit analysis and the methods of time-series analysis, spatial aggregation analysis, and box plot analysis. The results show that the carbon emission reduction benefit of bikeshare has obvious morning and evening peaks on workdays, while it tends to be stable without obvious peaks during the day on non-workdays. From the perspective of spatial distribution, the carbon emission reduction benefits of BS-FMMS are more significant in the metro station areas in the south of Baoan district, the west of Nanshan district, the central of Longhua district, and the south of Futian district in Shenzhen city, and the metro stations where the carbon emission reduction benefits of the non-workday are greater than those of the workday are mainly concentrated in Nanshan district, Futian district, and Luohu district. There is a significant positive correlation between BS-FMMS ridership and carbon emission reduction. These findings can provide clear policy implications for the decarbonization development of urban transportation systems.

1. Introduction

Global warming has attracted widespread attention around the world, and more and more countries are devoting their efforts to carbon emission reduction actions [1,2,3,4]. As a low-carbon and environmentally friendly green mode of transport, bikeshare is receiving increasing attention in the process of sustainable urbanization, with its features of reducing vehicle miles traveled (VMT), lowering vehicle emissions, easing traffic congestion, increasing commuting alternatives, facilitating public transit use, high travel convenience, and low use costs [5,6,7,8].
In many developing countries, over-reliance on car travel has become the main cause of urban environmental pollution, traffic congestion, and social equity [9], and prioritizing public transit (buses, metros, etc.) provides the answer to these problems [10,11]. Bikeshare as a feeder mode of metro stations (BS-FMMS) can effectively alleviate the first- and last-mile travel problems. The integration of bikeshare and metro facilitates multimodal travel in urban areas, making it a hot topic in urban transportation research. Relevant studies focus on transfer characteristics [12,13], use frequency [14,15], route analysis [16,17], accessibility [18,19], and the impact of the built environment [20,21].
Many existing studies have hypothesized that bikeshare travel may replace other modes of transport (i.e., those that have an adverse impact on the environment), leading to reduced environmental impacts [22,23,24]. Carbon emission reduction has been a popular research topic for the environmental benefits of bikeshare [25,26]. The integration of bikeshare and metro is a special type of bikeshare cycling behavior [20], which also has the potential to be a substitute for environmentally destructive modes of transport, resulting in the carbon emission reduction benefits of bikeshare. However, two research gaps remain in the existing studies: (1) How does one measure the carbon reduction benefits of BS-FMMS? (2) What are the spatiotemporal differences in the carbon reduction benefits of the BS-FMMS between workdays and non-workdays?
To fill the above research gaps, this paper uses bikeshare data and metro station data in Shenzhen, China, to study the carbon emission reduction benefits of BS-FMMS and its spatiotemporal differences between workdays and non-workdays. First, a framework for measuring the carbon emission reduction benefits of BS-FMMS is established for identifying the transfer behaviors of bikeshare and then measuring the carbon emission reduction benefits of bikeshare. Next, the carbon emission reduction of BS-FMMS is counted into the corresponding time pane and spatial unit, and the spatiotemporal differences between workday and non-workday are analyzed by using spatiotemporal visualization techniques. The study findings can serve as valuable references for the relevant departments involved in developing carbon reduction plans for urban transportation.
The rest of the paper is organized as follows: Section 2 reviews the related work; Section 3 introduces the study area and data; Section 4 presents the analysis framework and specific methods of carbon emission reduction benefits of BS-FMMS; Section 5 discusses the carbon reduction benefits of BS-FMMS by combining the results of spatiotemporal visualization; and Section 6 summarizes the results and provides a research outlook.

2. Literature Review

2.1. Environmental Benefits of Bikeshare

The environmental benefits of bikeshare refer to the fact that bikeshare replaces other transport modes during the travel stage, which reduces VMT and fuel consumption, as well as greenhouse gas (GHG) emissions (e.g., CO2 and NOx) [6,7,27]. In many studies, the environmental benefits of bikeshare are analyzed from the perspective of carbon emission reduction, with bikeshare regarded as a zero-carbon transport mode, the carbon dioxide emitted during travel by the transport modes that bikeshare replaces (walking, cars, and public transit) is quantified as the carbon emission reduction of bikeshare.
Early studies of bikeshare travel often only looked at a few alternative transport modes and did not consider the full range of possible replacement options. Tatsuya et al. [27] considered that the environmental benefits of bikeshare in both reducing VMT and lowering GHG emissions depend mainly on bikeshare substituting for car travel and with less relevance to transport modes such as public transit, private biking, and walking. Similarly, Ruxin Lai et al. [28] believed that the environmental benefits of bikeshare are mostly achieved by substituting other high-carbon emission transport modes during the travel stage. Zhang and Mi [6] set the travel distance threshold at 1 km and assumed that bikeshare travel shorter than 1 km could substitute for walking without environmental benefits and conversely substitute for car travel, resulting in environmental benefits. The results showed that bikeshare travel in Shanghai resulted in reduction of 8358 tons of gasoline, 25,240 tons of CO2 emissions and 64 tons of NOx emissions in 2016. However, the study only considered bikeshare as a substitute for walking and cars, ignoring the environmental benefits of bikeshare replacing other transport modes.
Subsequent studies have acknowledged that bikeshare can also replace public transit [29], and overlooking this fact may lead to an inaccurate assessment of the environmental benefits of bikeshare. To obtain more reliable results, related studies have started to incorporate public transit as an alternative mode when analyzing the environmental benefits of bikeshare. Kou et al. [30] considered that bikeshare could replace walking, cycling, cars, and public transit and proposed a bikeshare carbon emission reduction estimation model (BS-EREM) to quantify the environmental benefits of bikeshare. Kateryna et al. [7] studied the environmental benefits of bikeshare in two scenarios in Chengdu. In the first scenario, hypothetical bikeshare travel substituted walking and car travel. It is assumed that when the travel time is less than 3.87 min, bikeshare substitutes walking and vice versa substitutes car travel, which finds that the reduction in fuel consumption by bikeshare is 19,964.31 L, and the carbon emission reduction is 4125.13 kg. In the second scenario, it is hypothesized that bikeshare travel substitutes walking, car, bus, and metro travel, and the three relationships of substitution, integration, and complementation between bikeshare and public transit are identified based on the first scenario, which reveals that the reduction in fuel consumption by bikeshare is 13,198.68 L, and the carbon emission reduction is 2564.31 kg. Lv et al. [26] analyzed the spatiotemporal characteristics of the carbon emission reduction benefits of bikeshare in Shenzhen and found that the carbon emission reduction of bikeshare within 500 m of the metro station areas accounted for 57.23% of the total carbon emission reduction of the whole day.
It is worth noting that existing studies [6,7,22,25,26,30] have focused on the use phase of bikeshare, considering that the carbon emission reduction benefits of bikeshare are generated by substituting other transport modes in the travel.

2.2. Research Gap

The existing literature reveals that the methods of measuring the carbon emission reduction benefits of bikeshare have been gradually improved. However, most of these studies consider that travelers only use a single mode of transport during their trips, and there is a lack of in-depth discussion on the carbon emission reduction benefits of BS-FMMS. The combination of bikeshare and metro can effectively leverage the environmental advantages of both modes, replacing high-carbon emission transport modes in travel. Especially in the context of public transportation priority development and the decarbonization of the city, BS-FMMS has a broad development prospect and application market [12,31]. However, the existing studies are less related to the carbon emission reduction benefits of BS-FMMS, and the distribution characteristics of the carbon emission reduction benefits in different temporal and spatial areas are not clear. Therefore, this paper uses BS-FMMS as the study object to measure the carbon emission reduction benefits of bikeshare under the scenario of connecting to metro stations. By using spatiotemporal visualization, the spatial and temporal differences in carbon emission reduction benefits of bikeshares between workdays and non-workdays at different times of the day and in different metro station areas are revealed.

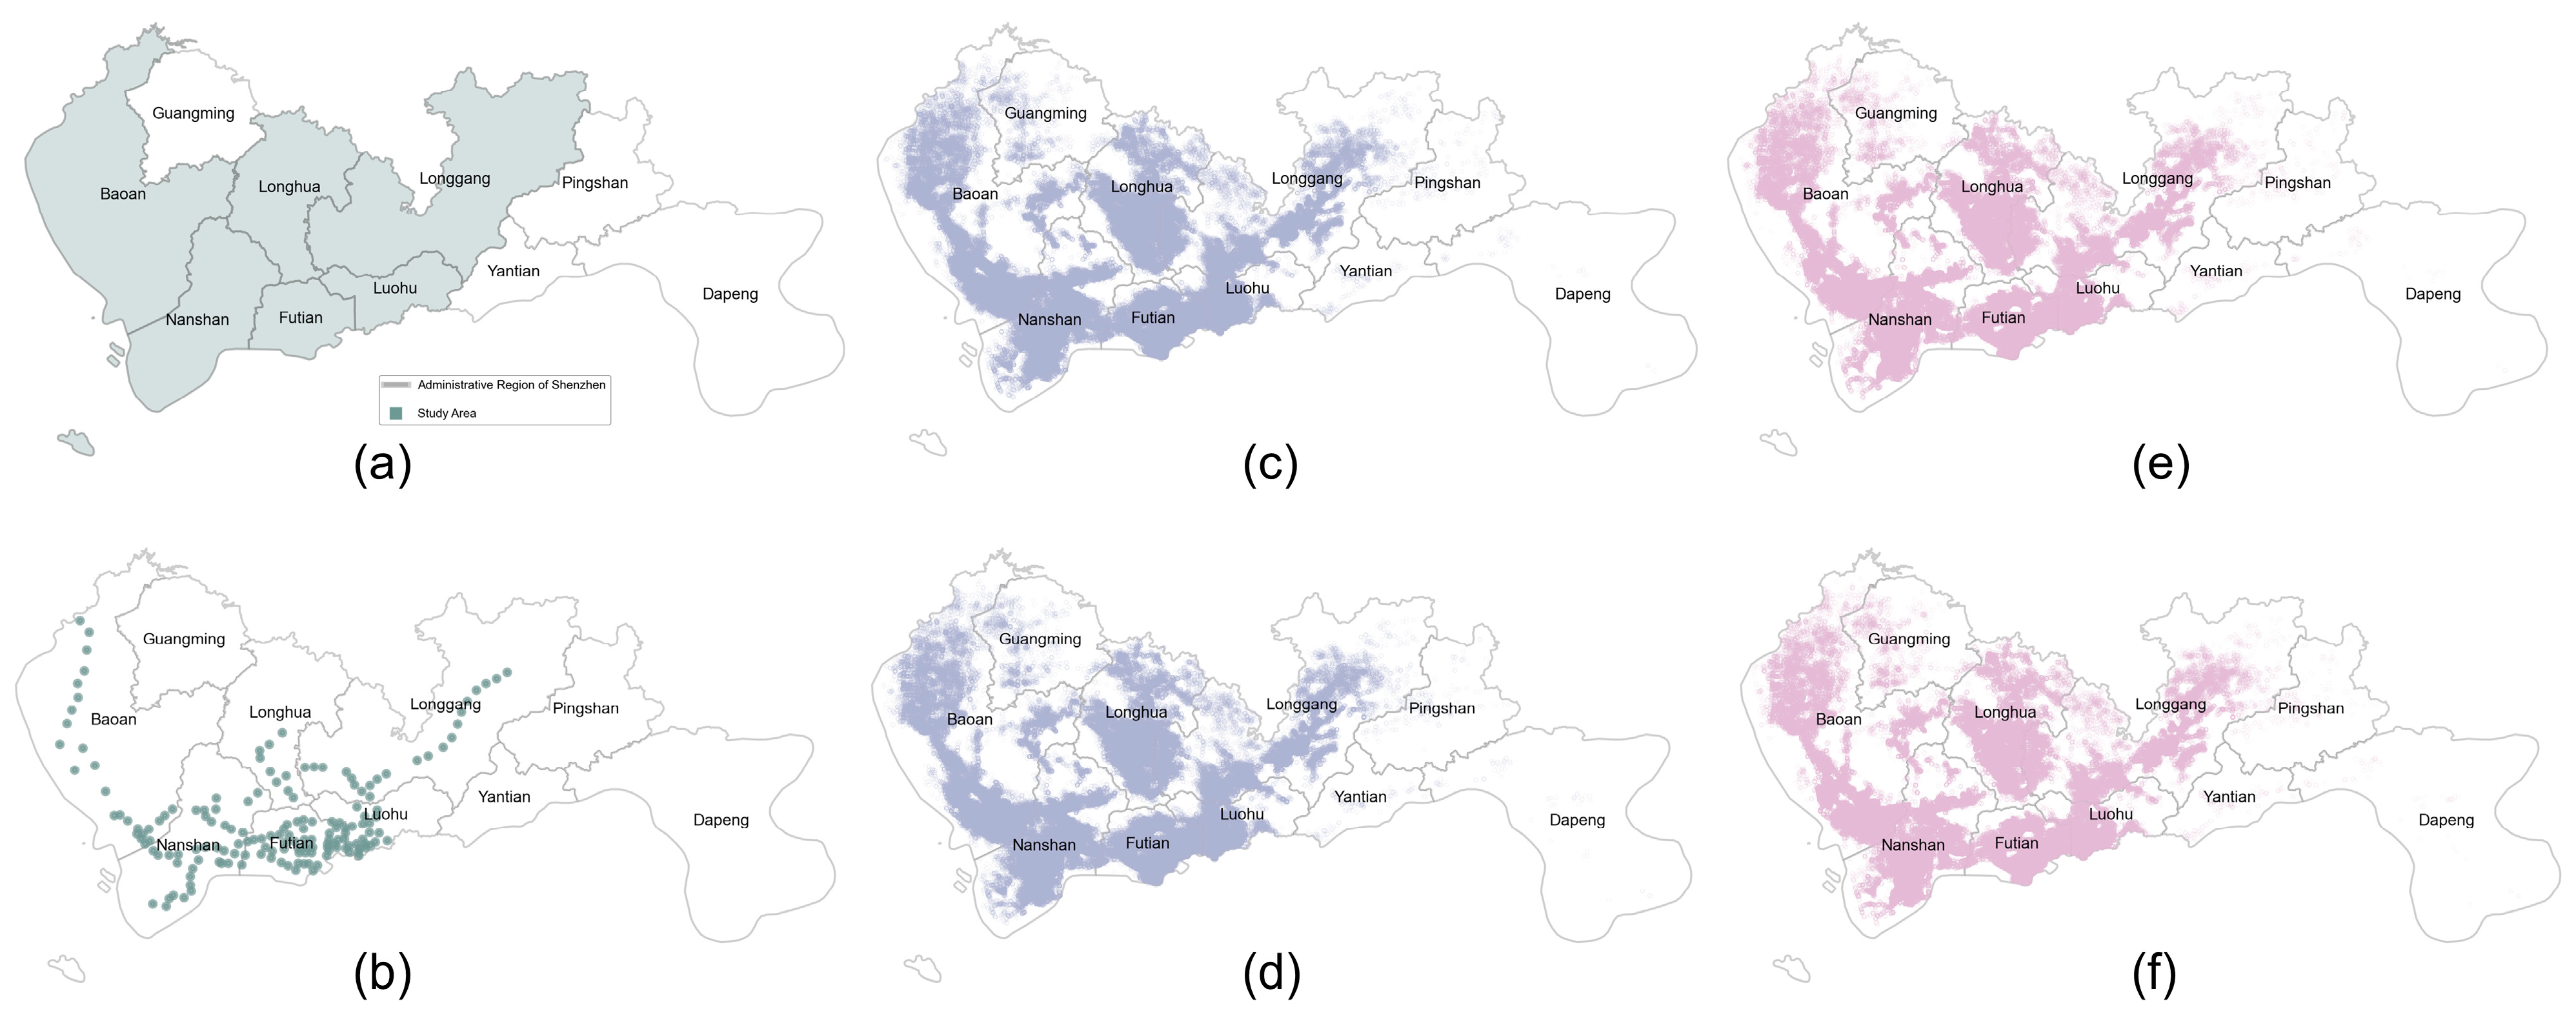
3. Study Area and Data

This section outlines the study area, the sources of the datasets, and their processing. The study uses multi-source datasets, including bikeshare data and metro station data in Shenzhen, which were all collected in 2018 to ensure that the multi-source data could be integrated.
Study area: Shenzhen is located on the southeast coast of China, with 10 administrative regions under its jurisdiction. It is a national economic center city and an international comprehensive transportation hub city, with strong transportation impact both domestically and internationally. This paper uses Shenzhen as the study city. To be consistent with the time of the study data, the study area of this paper is the six administrative districts (Futian District, Luohu District, Nanshan District, Baoan District, Longgang District, and Longhua District) that operated the metro in the same period in Shenzhen. The study area is shown in Figure 1a.
Metro station data: The metro stations opened for operation in Shenzhen in 2018 can be found at https://www.szmc.net (accessed on 10 November 2023). The metro station data are obtained through the API of AMAP (a map application, https://www.amap.com/, (accessed on 10 November 2023)), and the spatial distribution of metro stations is shown in Figure 1b.
Bikeshare data: This paper uses bikeshare order data from October 24 (workday) and 28 (non-workday) in 2018, including OFO, MOBIKE, One Step, U-bicycle, and 99 bicycle. The raw data contain the sequence number, bike ID, date, timestamp, longitude, latitude, and status. Historical weather information from http://lishi.tianqi.com (accessed on 8 November 2023) shows that the weather during this period was sunny or cloudy, with suitable temperatures and low wind levels having less impact on the demand for bikeshare trips. Using the Transbigdata package [32] in Python, the travel chains containing the latitude, longitude, and timestamps of the origin and destination of bikeshare trips were extracted, and those with a travel time of less than 1 min or more than 30 min and a travel distance of less than 100 m or more than 5000 m were eliminated [18,33]. The spatial distribution of the origin of bikeshare on the workday and non-workday is shown in Figure 1c,d, while the spatial distribution of the destination is shown in Figure 1e,f.
In addition, to ensure the accuracy of the results, the multi-source data were converted to the same coordinate system, and the WGS84 coordinate system was used in this study.

4. Methods

This section first proposes a framework for analyzing the carbon emission reduction benefits of BS-FMMS and then proposes a spatiotemporal visualization method for the carbon emission reduction benefits of BS-FMMS. The framework of the methods is shown in Figure 2.

4.1. BS-FMMS Carbon Emission Reduction Benefit Analysis Framework

The framework includes two parts, which are the identification of bikeshare transfer behavior and the measurement of bikeshare carbon emission reduction.

4.1.1. Identification of Bikeshare Transfer Behavior

Temporal constraint: The operating hours of each metro line should be considered when developing the temporal constraints. Among the metro lines in operation, some of them have extended operating hours to meet the travel demand in different regions. To reduce the analysis error caused by the inconsistency of the line operation time, the common operation time of each line is selected as the temporal constraint for extracting the behavior of the feeder, i.e., the temporal constraint is satisfied when the start timestamp and the end timestamp of a bikeshare trip are both considered or one of them is within the period of metro operation.
Spatial constraint: There is no standardization in the size of the metro station transfer range between different cities in the existing studies [18,30,33,34]. Differences exist in the frequency of bikeshare transfer use in different cities, and the spatial characteristics of the city also affect the traveler’s choice of transport mode. Based on the existing research [34], the actual travel data of bikeshare in Shenzhen were used to establish the radius of the metro station transfer range, ranging from 50 m to 300 m. Within this range, the amount of bikeshare ridership was counted every 10 m, and the growth rate of the ridership between neighboring transfer ranges was calculated. A line graph was then plotted, and the value corresponding to the turning point, where the growth rate changes from a steep increase to a flat increase, was taken as the radius of the metro station transfer range. The growth rate of gi of the bikeshare ridership in the i-th catchment area is calculated as follows:
g i = V i V i 1 V i 1
where Vi−1 and Vi are the total bikeshare ridership in the (i − 1)-th and i-th catchment area, respectively. In particular, when i is equal to 1, g1 is equal to 1.
When one of the origins and destinations of a bikeshare trip is located within the metro station connection, a connection is considered to exist between the bikeshare and the metro. When the destination of a bikeshare trip is located within the metro station catchment area, it is termed as access-integrated; when the origin of a bikeshare trip is located within the metro station catchment area, it is referred to as egress-integrated [35]. Moreover, when the origin and destination of the bikeshare trip are both located within the metro station catchment area, it is recognized that bikeshare serves as an alternative transport mode to metro travel, which should be removed.

4.1.2. Calculation of Carbon Emission Reductions from Bikeshares

Under the bottom-up carbon emission calculation idea of the Intergovernmental Panel on Climate Change (IPCC), this study adopts the calculation method based on the distance traveled to calculate the carbon emissions of each transport mode [6,7,26]. The carbon emission reduction of bikeshare can be quantified by comparing the carbon emissions generated by bikeshare with the carbon emissions generated by other transport modes for the same distance traveled.
The travel chain of a bikeshare only contains the origin and destination locations, without specific paths or driving trajectories. The Manhattan distance, which is the sum of the distances moved along the horizontal and vertical directions between two points, is commonly used to estimate the distance between two locations in the urban road network [36] and is more applicable to the estimation of bikeshare cycling distance. Therefore, the Manhattan distance is used to approximate the estimation of the bikeshare transfer distance.
Based on the literature [6], the following hypotheses are proposed by considering the potential transport modes that can be connected with bikeshare in daily travel in Shenzhen:
(1) When the riding distance of bikeshare is less than 1 km, it is considered that bikeshare would substitute walking and other non-motorized transport modes (bikeshare, private bicycle, electric bicycle, etc.) during the feeder process and that this portion of the ride would not result in carbon reduction benefits.
(2) When the riding distance of a bikeshare is more than 1 km, it is considered that bikeshare would substitute three transport modes (car, taxi, and bus) in the feeder process, and this portion of the ride would generate carbon emission reduction benefits.
According to the Shenzhen 2020 travel survey report (see Table 1) [26], the ratio of mode share between the metro and other transport modes is evenly distributed among the three transport modes, cars, taxis, and buses, and it can be obtained that the ratio of mode share of these three transport modes is 61%, 13%, and 26%, respectively. To ensure randomness in the traveler’s choice of travel mode, Python was used to simulate the travel chains with a connection distance greater than 1 km, and 61% of the bikeshare travel chains were randomly selected as alternatives to car trips, 13% as alternatives to taxi trips, and the rest as alternatives to bus trips.
Fuel vehicles contribute directly to carbon emissions during the use phase. Electric vehicles do not cause carbon emissions during use, but the energy consumed in the operation of electric vehicles also causes emissions during production, so the use phase of electric vehicles also indirectly causes carbon emissions. Shenzhen has completed the electrification of all buses in 2017 and taxis in 2018. Among cars, electric vehicles occupy a certain share, and all of them should be taken into consideration when measuring the carbon emission reductions of bikeshare. Referring to existing studies [26], the carbon emission factors of cars, taxis, and buses in Shenzhen are 139.48 g/pkm, 155.00 g/pkm, and 79.62 g/pkm, respectively (see Table 2). Bikeshares often serve a single traveler, while cars, taxis, and buses can usually accommodate multiple travelers at the same time. Therefore, bikeshare has a passenger loading of 1, cars and taxis have an average passenger loading of 1.5, and buses have an average passenger loading of 17 [7].
In this study, it is considered that bikeshare does not consume energy (fuel, electricity, etc.) or cause carbon emissions in the use stage, so the carbon emissions caused by the transport modes replaced by bikeshare are taken as the carbon emission reduction of bikeshare. The equation for calculating the carbon emission reduction of bikeshare is as follows:
E i = 0   if         d i < 1 km d i α j / L j   if         d i 1 km
where Ei is the carbon emission reduction of the i-th bikeshare, di is the feeder distance of the i-th bikeshare, αj is the carbon emission factor of the j-th transport mode, and Lj is the average passenger loading of the j-th transport mode.

4.2. Spatiotemporal Visualization Analysis

4.2.1. Time-Series Analysis

The carbon emission reduction of bikeshare is counted in hourly time panes and visualized in the form of a heat map to characterize the temporal distribution of carbon emission reduction of bikeshare.

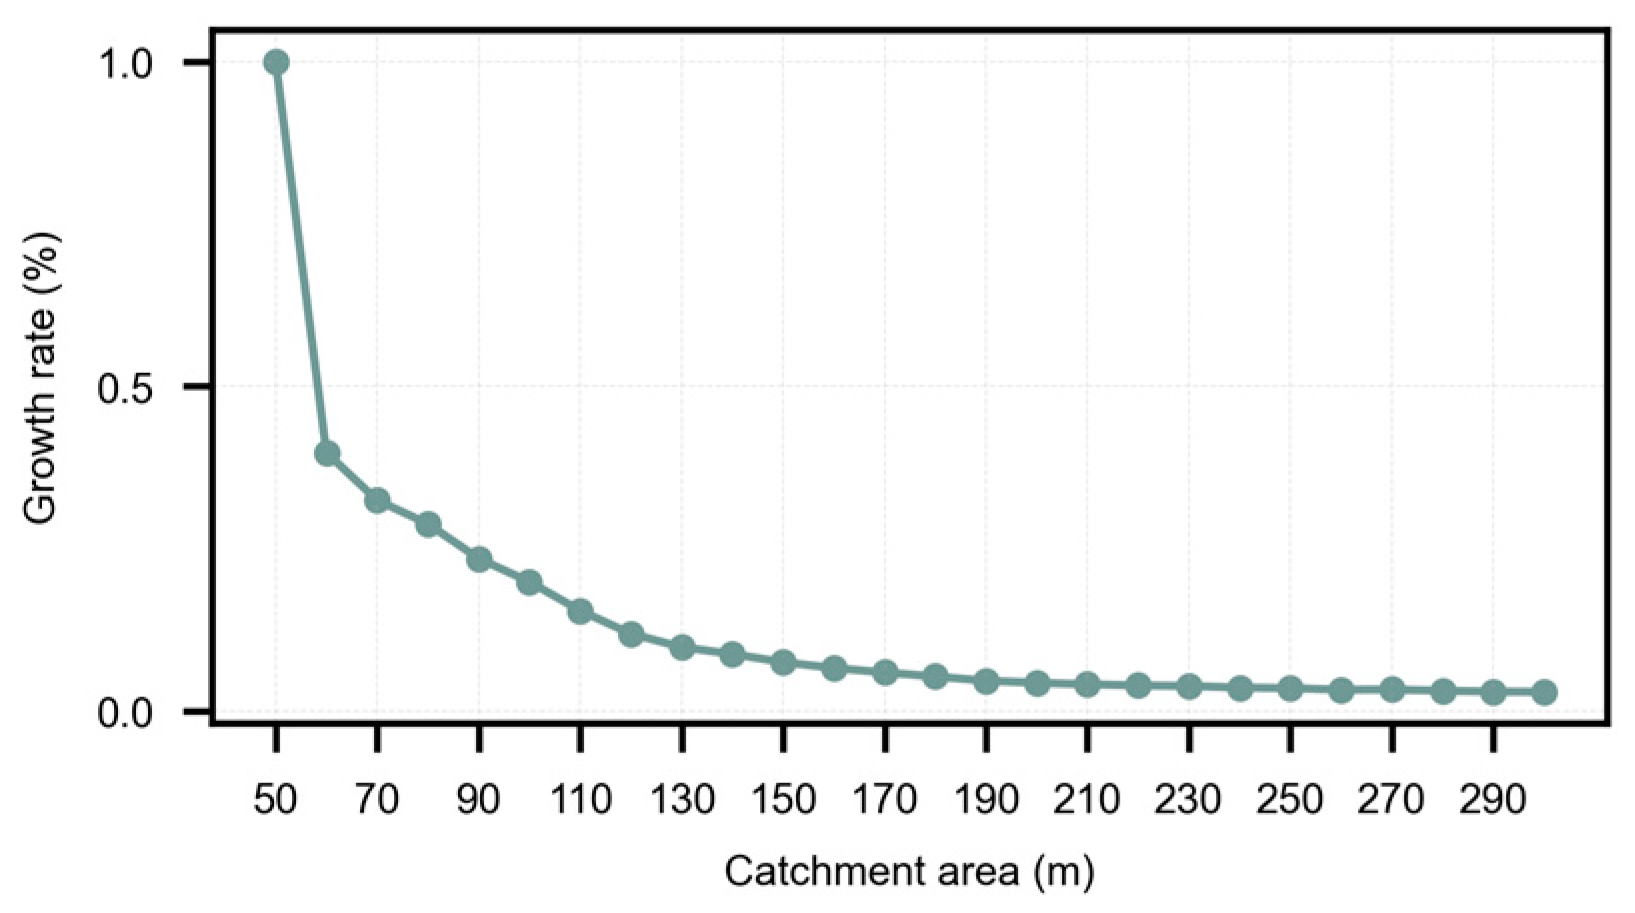
4.2.2. Spatial Aggregation Analysis

The K-Dimensional tree (K-D tree) algorithm is used to match the origin or destination of the bikeshare with the nearest metro station and calculate the Euclidean distance between them. As a data structure for storing and retrieving k-dimensional data, the K-D tree can construct a k-dimensional tree spatial index based on the latitude and longitude information of the metro station, efficiently search for the nearest-neighbor stations of origin and destination of the bikeshare in the tree, and further compute the nearest-neighbor distance between them. This algorithm can be implemented with the TransBigData [32] package in Python 3.9.13 software.
Specifically, carbon reductions from bikeshare access to the feeder are matched to the nearest metro station at the destination of the trip, and carbon reductions from bikeshare egress to the feeder are matched to the nearest metro station at the origin of the trip.

4.2.3. Box Plot Analysis

Box plot analysis is a statistical and data visualization method used to understand and describe the distribution and statistical characteristics of data. Box plots typically include the maximum, minimum, median, upper quartile, and lower quartile of the data. The representation of carbon emission reductions aggregated at the temporal and spatial levels in the form of box plots allows for a visualization of the distributional characteristics of the data.

5. Results

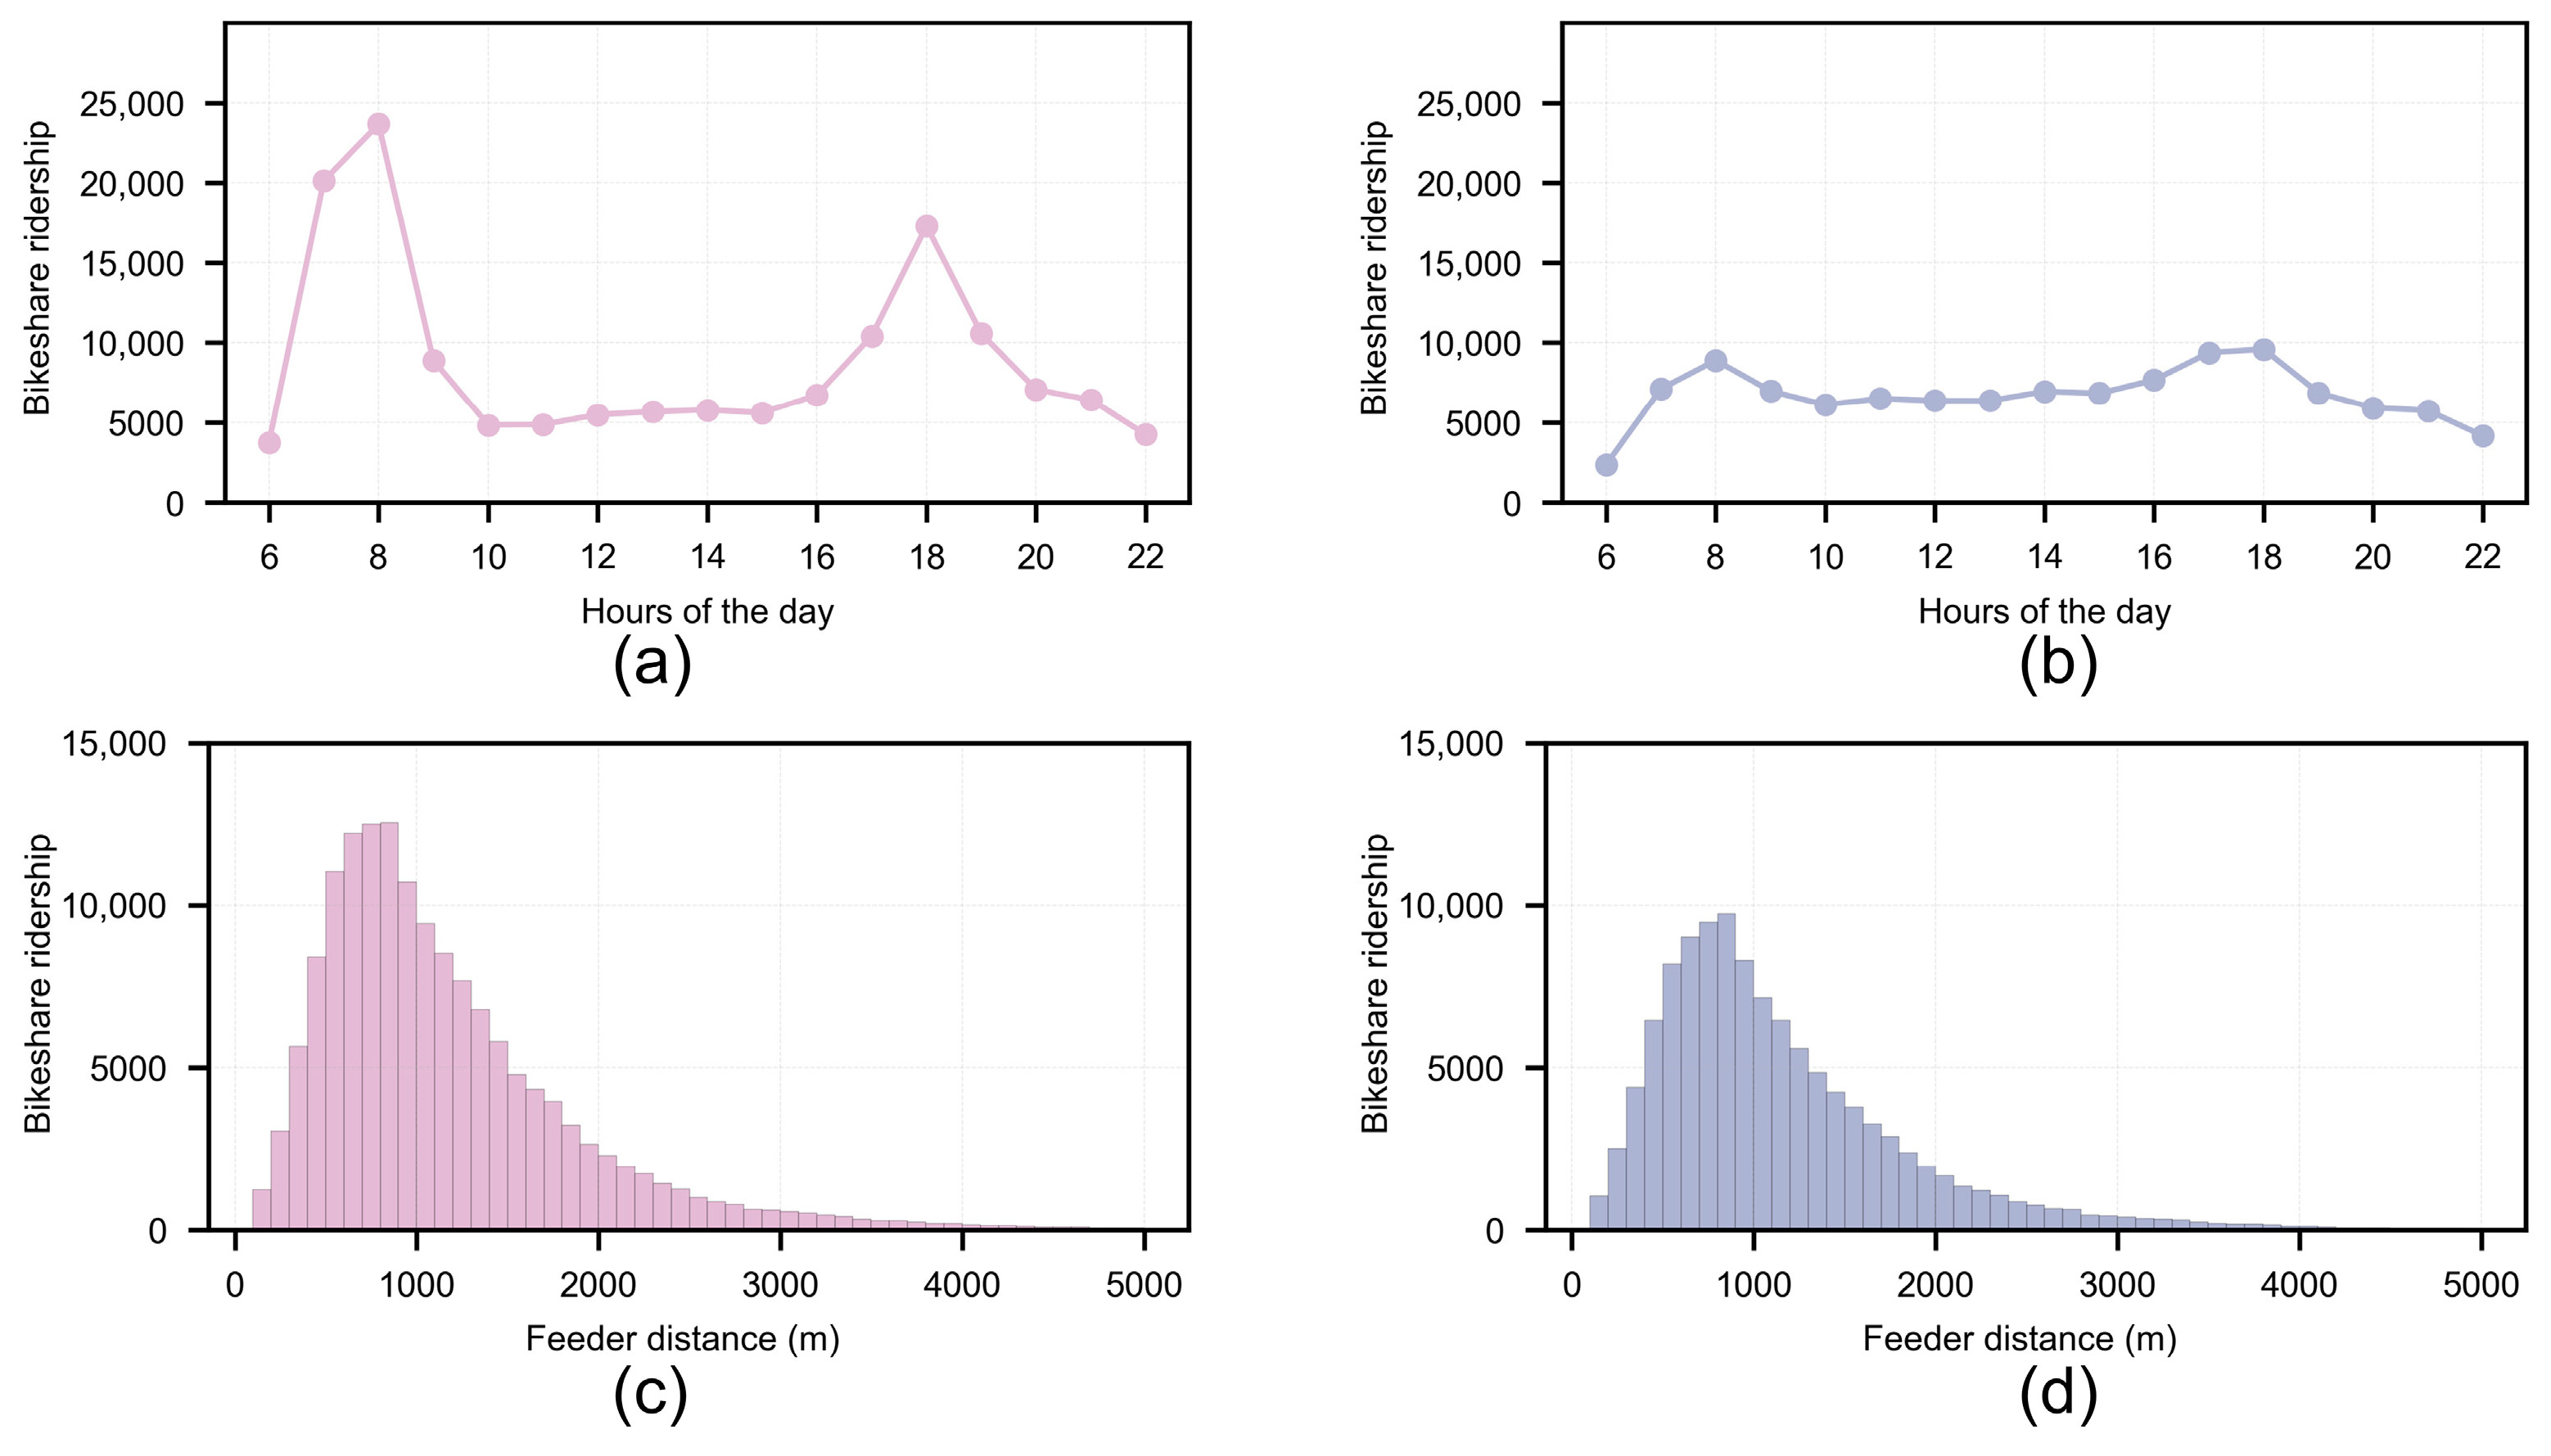
5.1. Bikeshare Transfer Characteristics

Considering that the inconsistency of the operating time of different metro lines may lead to bias in the analysis, 6:30 to 23:00 was chosen as the temporal constraint for the extraction of bikeshare transfer behavior. As shown in Figure 3, the growth of bikeshare ridership shows a decreasing trend with the increase in the catchment area range of the metro station and stabilizes after 150 m. Therefore, 150 m is selected as the radius of the catchment area of the metro station, and the Geopandas package in Python is used to establish a buffer zone for the metro station, which is used as the catchment area of the metro station. The catchment area of the metro station is used as the spatial constraint for the extraction of bikeshare transfer behavior.
After the selection of spatiotemporal constraints, the bikeshare feeder volume on workdays and non-workdays is obtained, as shown in Figure 4a,b. The bikeshare feeder volume on the workday has obvious morning and evening peaks from 7:00 to 9:00 and 17:00 to 19:00, while the bikeshare feeder volume on the non-workday reaches the morning and evening peaks at the same time, but the peaks are not obvious.
Feeder distance is an important consideration for travelers to choose metro feeder transport mode. As shown in Figure 4c,d, there are 88.81% and 89.38% of bikeshare feeder distances within 2 km on workday and non-workday, respectively, indicating that bikeshare mainly serves the short-distance feeder.

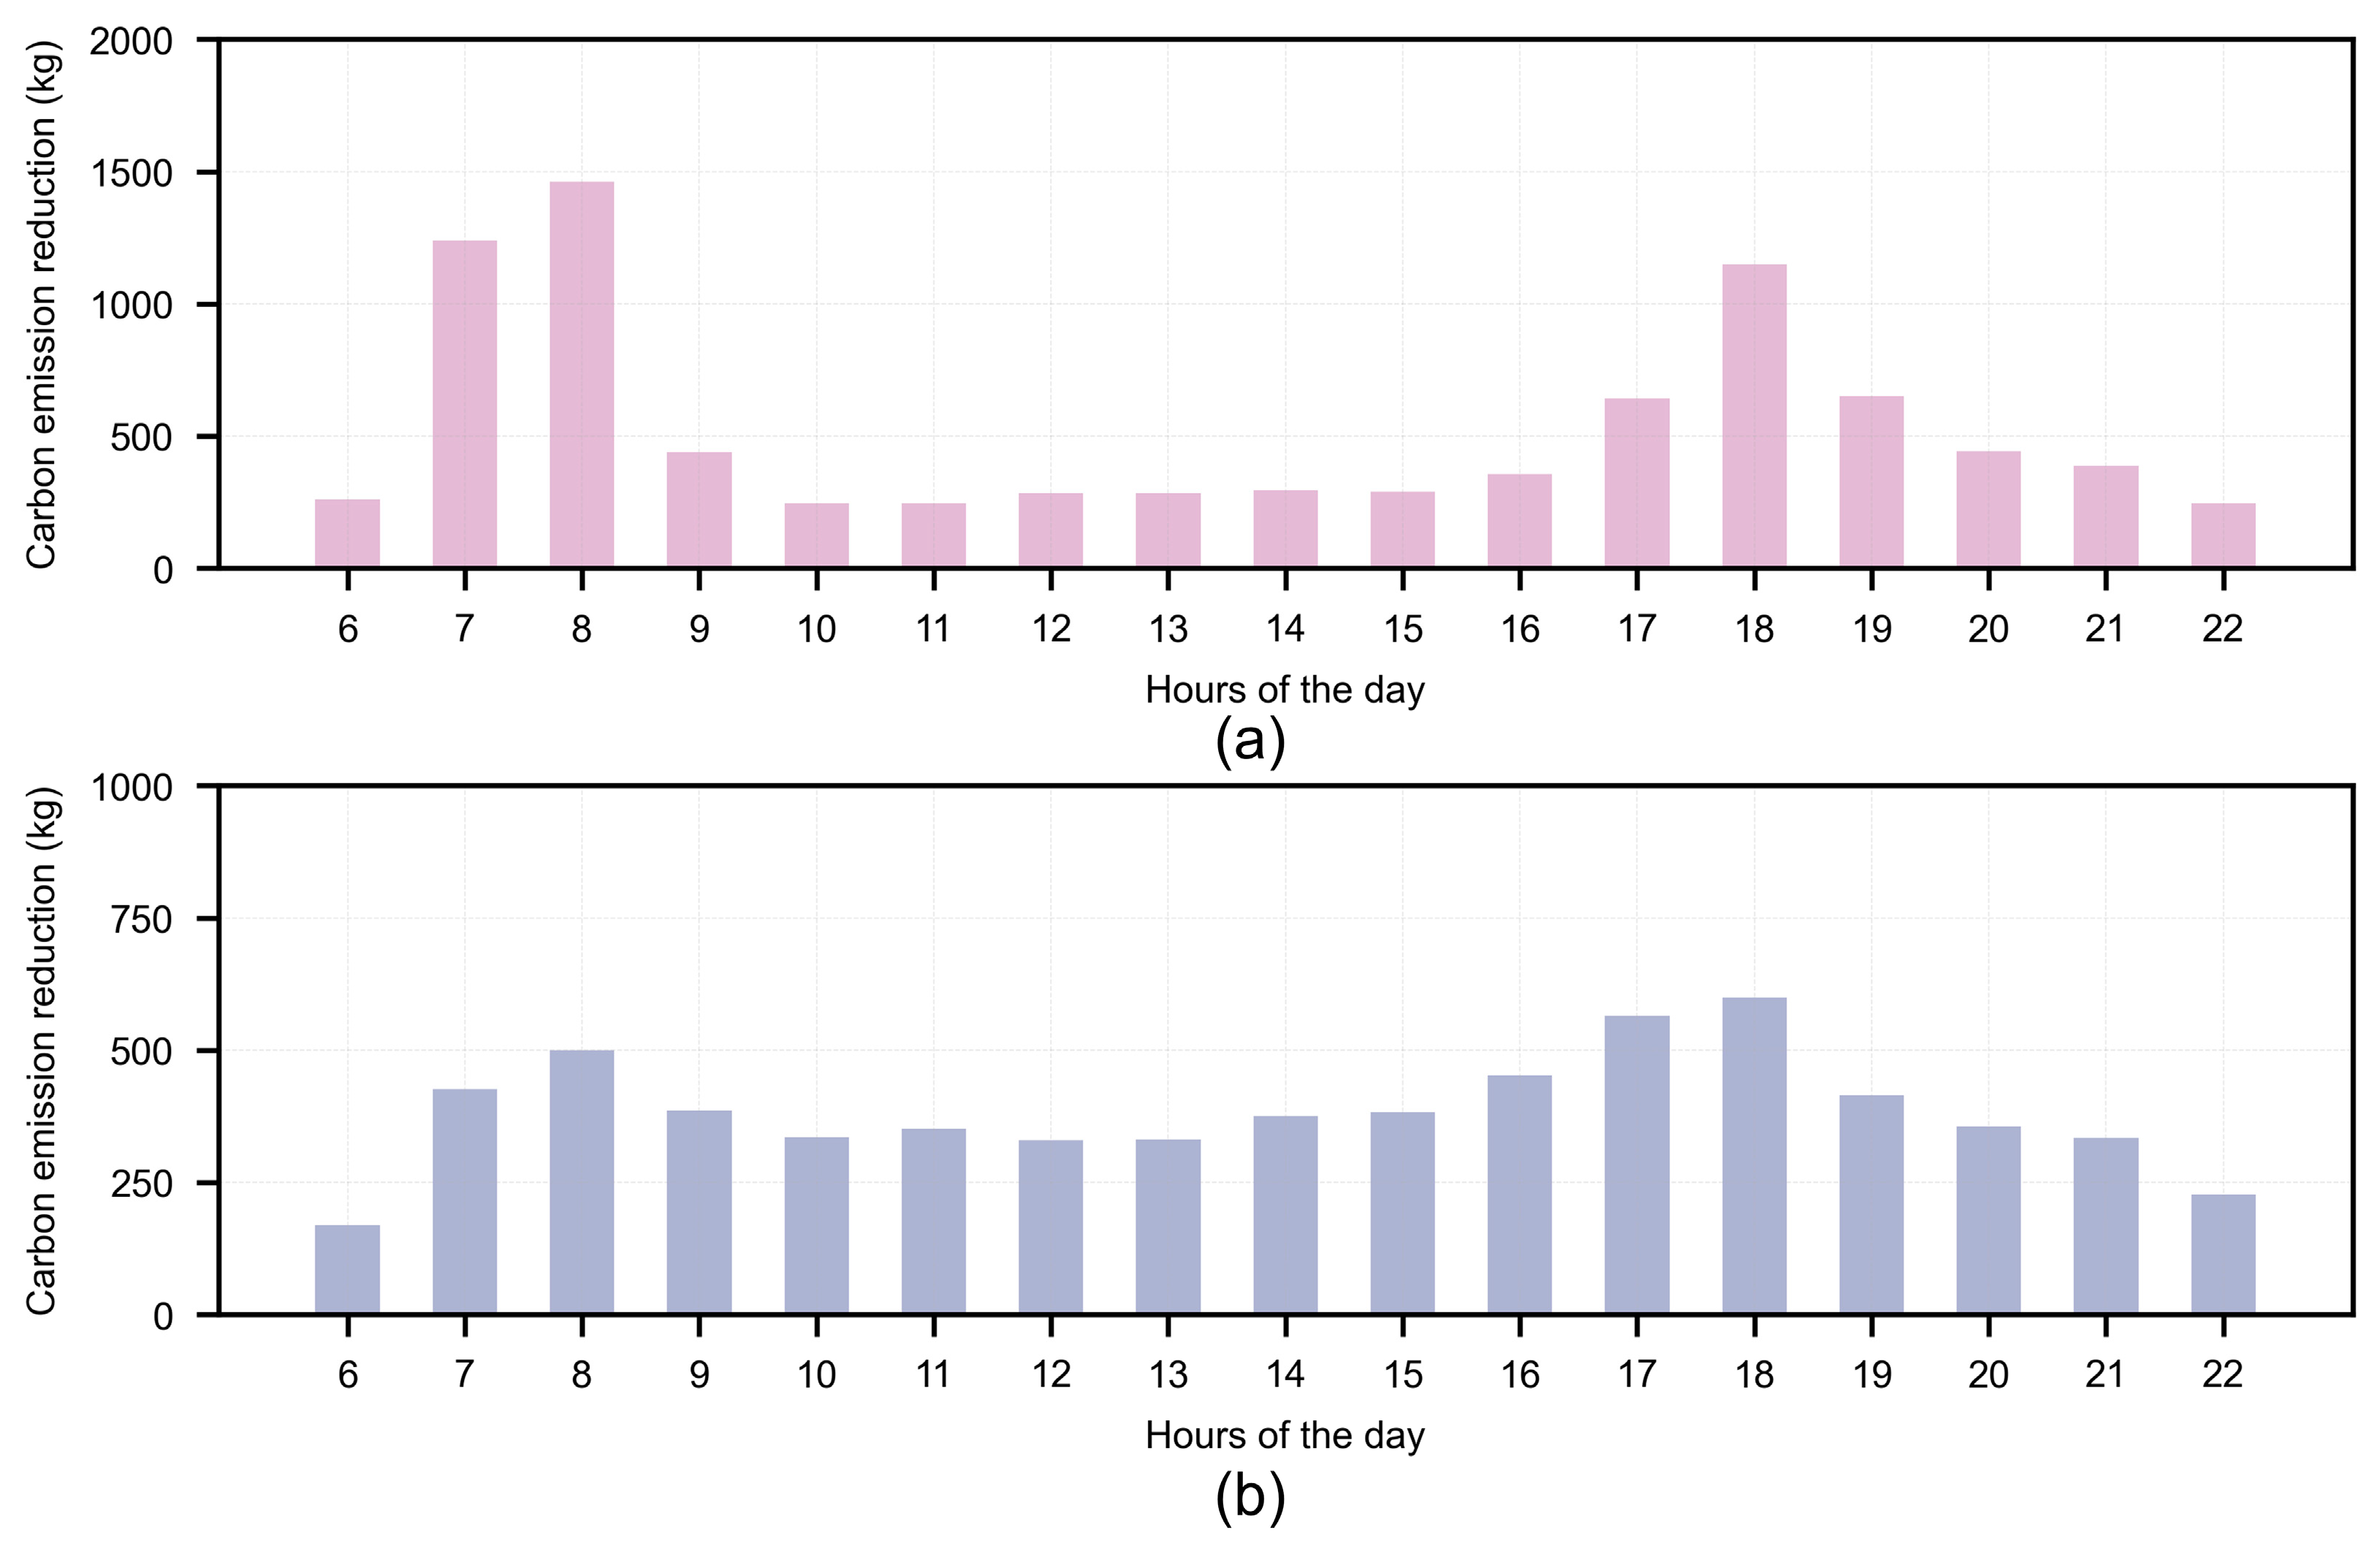
5.2. Temporal Distribution of Carbon Reduction Benefits of BS-FMMS

Based on the measurement method mentioned above, the carbon emission reduction of BS-FMMS was measured, and it was counted in an hourly time frame. As shown in Figure 5, the carbon emission reduction benefits of BS-FMMS on workdays have obvious morning and evening peaks, which are consistent with the morning and evening peak periods where the bikeshare transfer behavior occurs (7:00 to 9:00 and 17:00 to 19:00). The carbon reduction benefits of BS-FMMS on non-workdays are evenly distributed throughout the day, with no obvious peak hours.
On the workday, the distribution of BS-FMMS carbon emission reductions spanned a wide range (see Figure 5a), reaching the highest value (1460.37 kg) during the 8:00 to 9:00 period and the lowest value (244.84 kg) during the 10:00 to 11:00 period, with an average carbon emission reduction of 540.37 kg per hour.
On the non-workday, the distribution of carbon emission reduction of BS-FMMS is more concentrated (see Figure 5b), reaching the highest value (599.33 kg) during the 18:00 to 19:00 period and the lowest value (168.59 kg) during the 6:30 to 7:00 period, with an average carbon emission reduction of 396.05 kg per hour.

5.3. Spatial Distribution of Carbon Reduction Benefits of BS-FMMS

The carbon emission reductions of bikeshare are aggregated to the metro station level to facilitate the observation of the spatial distribution characteristics of the carbon emission reduction benefits of BS-FMMS. In this part, comparative analyses are conducted in the all-day period (6:30 to 23:00), morning peak period (7:00 to 9:00), and evening peak period (17:00 to 19:00) when the bikeshare transfer behavior occurs, respectively.

5.3.1. All-Day Period

Comparing workdays and non-workdays, it is found that the carbon emission reduction benefits of BS-FMMS show similar spatial characteristics. The carbon emission reduction of BS-FMMS in the metro station areas in the south of Baoan district, the west of Nanshan district, the central part of Longhua district and the south of Futian district is relatively high, while the carbon emission reductions of BS-FMMS in the metro station areas in the north of Baoan district (see Figure 6a,b), the northeastern part of Longgang district and the western part of Luohu district is relatively low. There are 31 metro station areas with higher carbon emission reductions on non-workdays than on workdays, mostly in Nanshan district, Futian district and Luohu district (see Figure 6c).
In comparison, the carbon reduction benefit of BS-FMMS on the workday is more obvious and the distribution of carbon emission reduction is wide (see Figure 6d), and the top three metro station areas with the largest carbon emission reduction are Bihaiwan station (316.82 kg), Nanshan station (302.74 kg), and Gushu station (249.11 kg), with an average carbon emission reduction of 53.71 kg per metro station area.
However, the carbon emission reduction benefit of BS-FMMS on non-workdays is relatively limited and spans a small range (see Figure 6d), and the top three metro station areas with the largest carbon emission reductions are Pengzhou station (186.03 kg), Nanshan station (185.29 kg), and Longhua station (184.58 kg), with an average carbon emission reduction of 39.37 kg per metro station area.

5.3.2. Morning Peak Period

During the morning peak period, the spatial distribution characteristics of the carbon emission reduction benefits of bikeshares on workdays are similar to those of the all-day period, and the metro station areas with larger carbon emission reductions are mainly concentrated in the southern part of Baoan district, the western part of Nanshan district, the central part of Longhua district, and the southern part of Futian district (see Figure 6e). In comparison, the carbon emission reduction benefits of bikeshare on non-workdays show different spatial distribution characteristics, and the carbon emission reduction of BS-FMMS in different regions is smaller (see Figure 6f). There are three, two, and two metro station areas in Baoan district, Nanshan district, and Futian district, respectively, where the carbon emission reductions on non-workdays are higher than those on workdays (see Figure 6g).
The carbon emission reduction of BS-FMMS on the workday spans a wide range (see Figure 6h), and the top three metro station areas with the largest carbon emission reductions are Bihaiwan station (129.11 kg), Xixiang station (83.83 kg), and Pengzhou station (83.82 kg), with an average carbon emission reduction of 16.26 kg per metro station area.
The carbon emission reduction of BS-FMMS on non-workdays is relatively limited, and the difference in carbon emission reduction between different metro station areas is relatively small (see Figure 6h). The top three metro station areas with the largest carbon emission reduction are Pengzhou station (29.53 kg), Nanshan station (28.94 kg), and Longhua station (28.52 kg), with an average carbon emission reduction of 5.58 kg per metro station area.

5.3.3. Evening Peak Period

For the workday, the carbon reduction benefits of BS-FMMS are more pronounced in the southern part of Baoan district, the western part of Nanshan district, the central part of Longhua district, and the southern part of Futian district (see Figure 6i). For non-workdays, the overall distribution of carbon emission reduction benefits of BS-FMMS is more similar, but the carbon emission reduction benefits are relatively obvious in the south of Baoan district, the west of Nanshan district, and the central part of Longhua district (see Figure 6j). There are 39 metro station areas with higher carbon emission reductions on non-workdays than on workdays, with more distribution in Nanshan district and Luohu district, relatively less distribution in Baoan district, Futian district and Longgang district, and no distribution in Longhua district (see Figure 6k).
From Figure 6l, it can be seen that the carbon emission reduction of BS-FMMS on workdays is widely distributed, and the top three metro station areas with the largest carbon emission reductions on weekdays are Nanshan station (77.20 kg), Yitian station (69.25 kg), and Bihaiwan station (54.97 kg), with an average carbon emission reduction of 10.79 kg per metro station area.
The carbon emission reduction benefit of bikeshare on non-workdays is relatively limited (see Figure 6l), and the top three metro station areas with the largest carbon emission reduction are Bihaiwan station (37.53 kg), Nanshan station (34.85 kg), and Longhua station (33.20 kg), with an average carbon emission reduction of 7.02 kg per metro station area.

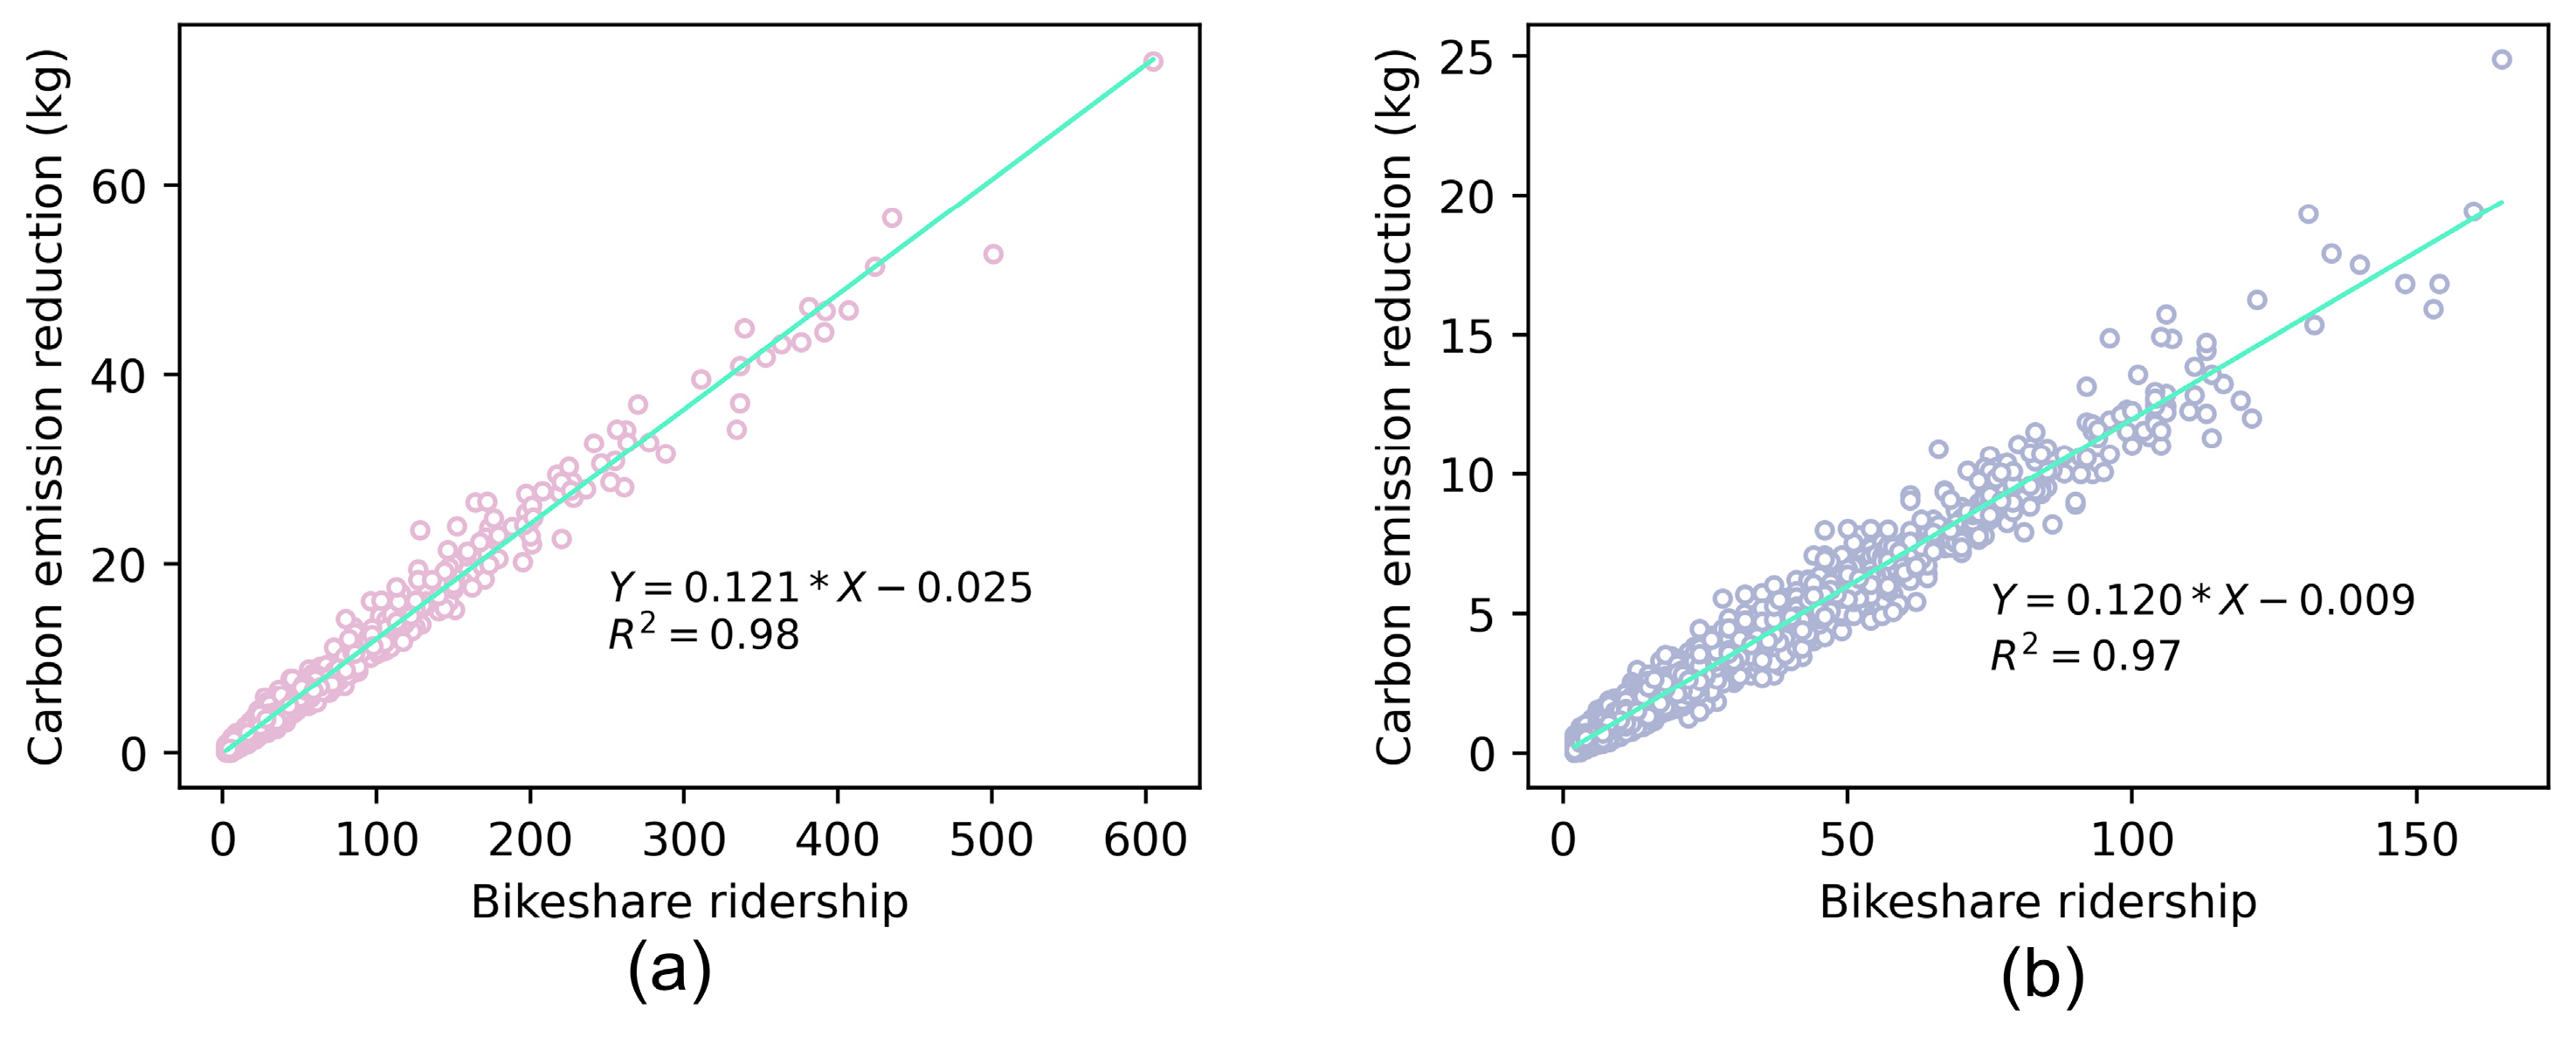
5.4. Relationship between Ridership and Carbon Emission Reduction in BS-FMMS

The ridership and carbon emission reductions from BS-FMMS were aggregated in hourly time panes and spatially scaled in the metro station area, respectively. The scatter plot of ridership and carbon emission reduction is plotted and fitted, as shown in Figure 7. It is seen that the R2 values for the workday and non-workday fits are 0.98 (see Figure 7a) and 0.97 (see Figure 7b), respectively.
While the carbon emission reduction of a single bikeshare feeder trip is affected by the riding distance and the carbon emission factor of alternative transport modes, considering the metro station area, the carbon emission reduction benefit of bikeshare shows a significant positive correlation with ridership. In addition, the slopes of 0.121 (see Figure 7a) and 0.120 (see Figure 7b) for workdays and non-workdays, respectively, showed that bikeshare ridership on workdays had a slightly greater impact on carbon emission reduction than that on non-workdays.

6. Conclusions

In summary, this paper compares the differences in carbon emission reduction benefits of BS-FMMS in the spatial and temporal dimensions between workdays and non-workdays.
It was found that the carbon emission reduction benefit of BS-FMMS on a workday has obvious morning and evening peaks, reaching up to 1460.37 kg in the highest hour (8:00 to 9:00), with an average carbon emission reduction of 540.37 kg per hour, while the carbon emission reduction benefit of BS-FMMS on a non-workday tends to be stable throughout the day and only reaches 599.33 kg in the highest hour (18:00 to 19:00), with an average carbon emission reduction of 396.05 kg per hour. The metro station areas with significant BS-FMMS carbon emission reduction benefits on workdays and non-workdays are mostly concentrated in the south of Baoan district, the west of Nanshan district, the central part of Longhua district, and the south of Futian district in Shenzhen. From an overall perspective, the carbon emission reduction benefits on a workday are better than those on a non-workday. However, there are some metro station areas with greater carbon emission reduction on the non-workday than on the workday, and these areas are mainly concentrated in Nanshan district, Futian district, and Luohu district. Also, the study found a significant correlation between bikeshare ridership and carbon emission reduction in metro station areas.
From the perspective of real application, this paper proposes a BS-FMMS carbon emission reduction benefit analysis framework that can quantify the carbon emission reduction benefit of bikeshare through the refined BS-FMMS carbon emission reduction measurement method. Combined with the spatiotemporal visualization method, the temporal and spatial distribution of the carbon emission reduction benefits of bikeshares can be intuitively understood so as to provide empirical evidence for the formulation of urban low-carbon transportation policies. In addition, this paper analyzes in depth from the metro station level and finds that there is a strong correlation between the ridership and carbon emission reduction of bikeshare in metro stations, and the relevant departments can roughly estimate the carbon emission reduction of bikeshare according to the ridership of bikeshare in metro stations. Also, strengthening the supply of bikeshare in the metro station area can effectively promote the enhancement of carbon reduction benefits.
There are existing studies showing that the built environment is an important factor affecting carbon emissions [37,38], and in future studies, the reasons for the difference in carbon reduction benefits of bikeshare between workdays and non-workdays can be analyzed in the context of the built environment elements of the metro station area.

Author Contributions

H.L.: conceptualization, methodology, visualization, software, writing—original draft; Z.W.: conceptualization, methodology, writing—review and editing; Q.W.: supervision, writing—review and editing. All authors have read and agreed to the published version of the manuscript.

Funding

This research received no external funding.

Institutional Review Board Statement

Not applicable.

Informed Consent Statement

Not applicable.

Data Availability Statement

Data available on request due to privacy restrictions.

Conflicts of Interest

The authors declare no conflicts of interest.

References

  1. Walmsley, M.R.W.; Walmsley, T.G.; Atkins, M.J.; Kamp, P.J.J.; Neale, J.R.; Chand, A. Carbon Emissions Pinch Analysis for Emissions Reductions in the New Zealand Transport Sector through to 2050. Energy 2015, 92, 569–576. [Google Scholar] [CrossRef]
  2. Dong, J.; Li, Y.; Li, W.; Liu, S. CO2 Emission Reduction Potential of Road Transport to Achieve Carbon Neutrality in China. Sustainability 2022, 14, 5454. [Google Scholar] [CrossRef]
  3. Bao, S.; Nishiura, O.; Fujimori, S.; Oshiro, K.; Zhang, R. Identification of Key Factors to Reduce Transport-Related Air Pollutants and CO2 Emissions in Asia. Sustainability 2020, 12, 7621. [Google Scholar] [CrossRef]
  4. Montoya-Torres, J.; Akizu-Gardoki, O.; Alejandre, C.; Iturrondobeitia, M. Towards Sustainable Passenger Transport: Carbon Emission Reduction Scenarios for a Medium-Sized City. J. Clean. Prod. 2023, 418, 138149. [Google Scholar] [CrossRef]
  5. Song, Y.; Luo, K.; Shi, Z.; Zhang, L.; Shen, Y. Nonlinear Influence and Interaction Effect on the Imbalance of Metro-Oriented Dockless Bike-Sharing System. Sustainability 2023, 16, 349. [Google Scholar] [CrossRef]
  6. Zhang, Y.; Mi, Z. Environmental Benefits of Bike Sharing: A Big Data-Based Analysis. Appl. Energy 2018, 220, 296–301. [Google Scholar] [CrossRef]
  7. Saltykova, K.; Ma, X.; Yao, L.; Kong, H. Environmental Impact Assessment of Bike-Sharing Considering the Modal Shift from Public Transit. Transp. Res. Part D Transp. Environ. 2022, 105, 103238. [Google Scholar] [CrossRef]
  8. Li, X.; Liu, Z.; Ma, X. Measuring Access and Egress Distance and Catchment Area of Multiple Feeding Modes for Metro Transferring Using Survey Data. Sustainability 2022, 14, 2841. [Google Scholar] [CrossRef]
  9. Jarah, S.; Zhou, B.; Abdullah, R.; Lu, Y.; Yu, W. Urbanization and Urban Sprawl Issues in City Structure: A Case of the Sulaymaniah Iraqi Kurdistan Region. Sustainability 2019, 11, 485. [Google Scholar] [CrossRef]
  10. Canitez, F. Pathways to Sustainable Urban Mobility in Developing Megacities: A Socio-Technical Transition Perspective. Technol. Forecast. Soc. Change 2019, 141, 319–329. [Google Scholar] [CrossRef]
  11. Shekhovtsov, A.; Kozlov, V.; Nosov, V.; Sałabun, W. Efficiency of Methods for Determining the Relevance of Criteria in Sustainable Transport Problems: A Comparative Case Study. Sustainability 2020, 12, 7915. [Google Scholar] [CrossRef]
  12. Cheng, L.; Huang, J.; Jin, T.; Chen, W.; Li, A.; Witlox, F. Comparison of Station-Based and Free-Floating Bikeshare Systems as Feeder Modes to the Metro. J. Transp. Geogr. 2023, 107, 103545. [Google Scholar] [CrossRef]
  13. Ma, X.; Ji, Y.; Yang, M.; Jin, Y.; Tan, X. Understanding Bikeshare Mode as a Feeder to Metro by Isolating Metro-Bikeshare Transfers from Smart Card Data. Transp. Policy 2018, 71, 57–69. [Google Scholar] [CrossRef]
  14. Liu, Y.; Ji, Y.; Feng, T.; Shi, Z. Use Frequency of Metro–Bikeshare Integration: Evidence from Nanjing, China. Sustainability 2020, 12, 1426. [Google Scholar] [CrossRef]
  15. Liu, Y.; Ji, Y.; Feng, T.; Timmermans, H. Understanding the Determinants of Young Commuters’ Metro-Bikeshare Usage Frequency Using Big Data. Travel Behav. Soc. 2020, 21, 121–130. [Google Scholar] [CrossRef]
  16. Liu, Y.; Feng, T.; Shi, Z.; He, M. Understanding the Route Choice Behaviour of Metro-Bikeshare Users. Transp. Res. Part A Policy Pract. 2022, 166, 460–475. [Google Scholar] [CrossRef]
  17. Liu, Y.; Ji, Y.; Feng, T.; Shi, Z. A Route Analysis of Metro-Bikeshare Users Using Smart Card Data. Travel Behav. Soc. 2022, 26, 108–120. [Google Scholar] [CrossRef]
  18. Wu, X.; Lu, Y.; Lin, Y.; Yang, Y. Measuring the Destination Accessibility of Cycling Transfer Trips in Metro Station Areas: A Big Data Approach. Int. J. Environ. Res. Public Health 2019, 16, 2641. [Google Scholar] [CrossRef] [PubMed]
  19. Li, W.; Chen, S.; Dong, J.; Wu, J. Exploring the Spatial Variations of Transfer Distances between Dockless Bike-Sharing Systems and Metros. J. Transp. Geogr. 2021, 92, 103032. [Google Scholar] [CrossRef]
  20. Wu, X.; Lu, Y.; Gong, Y.; Kang, Y.; Yang, L.; Gou, Z. The Impacts of the Built Environment on Bicycle-Metro Transfer Trips: A New Method to Delineate Metro Catchment Area Based on People’s Actual Cycling Space. J. Transp. Geogr. 2021, 97, 103215. [Google Scholar] [CrossRef]
  21. Hu, S.; Chen, M.; Jiang, Y.; Sun, W.; Xiong, C. Examining Factors Associated with Bike-and-Ride (BnR) Activities around Metro Stations in Large-Scale Dockless Bikesharing Systems. J. Transp. Geogr. 2022, 98, 103271. [Google Scholar] [CrossRef]
  22. Chen, Y.; Zhang, Y.; Coffman, D.; Mi, Z. An Environmental Benefit Analysis of Bike Sharing in New York City. Cities 2022, 121, 103475. [Google Scholar] [CrossRef]
  23. Fishman, E.; Washington, S.; Haworth, N. Bike Share’s Impact on Car Use: Evidence from the United States, Great Britain, and Australia. Transp. Res. Part D Transp. Environ. 2014, 31, 13–20. [Google Scholar] [CrossRef]
  24. Li, X.; Cottam, A.; Wu, Y.-J.; Khani, A. Can a Bikesharing System Reduce Fuel Consumption? Case Study in Tucson, Arizona. Transp. Res. Part D Transp. Environ. 2020, 89, 102604. [Google Scholar] [CrossRef]
  25. Cao, Y.; Shen, D. Contribution of Shared Bikes to Carbon Dioxide Emission Reduction and the Economy in Beijing. Sustain. Cities Soc. 2019, 51, 101749. [Google Scholar] [CrossRef]
  26. Lv, G.; Zheng, S.; Chen, H. Spatiotemporal Assessment of Carbon Emission Reduction by Shared Bikes in Shenzhen, China. Sustain. Cities Soc. 2024, 100, 105011. [Google Scholar] [CrossRef]
  27. Fukushige, T.; Fitch, D.T.; Handy, S. Estimating Vehicle-Miles Traveled Reduced from Dock-Less E-Bike-Share: Evidence from Sacramento, California. Transp. Res. Part D Transp. Environ. 2023, 117, 103671. [Google Scholar] [CrossRef]
  28. Ruxin, L.; Xinwei, M.; Fan, Z.; Yanjie, J. Life Cycle Assessment of Free-Floating Bike Sharing on Greenhouse Gas Emissions: A Case Study in Nanjing, China. Appl. Sci. 2021, 11, 11307. [Google Scholar] [CrossRef]
  29. Jin, H.; Jin, F.; Wang, J.; Sun, W.; Dong, L. Competition and Cooperation between Shared Bicycles and Public Transit: A Case Study of Beijing. Sustainability 2019, 11, 1323. [Google Scholar] [CrossRef]
  30. Kou, Z.; Wang, X.; Chiu, S.F.; Cai, H. Quantifying Greenhouse Gas Emissions Reduction from Bike Share Systems: A Model Considering Real-World Trips and Transportation Mode Choice Patterns. Resour. Conserv. Recycl. 2020, 153, 104534. [Google Scholar] [CrossRef]
  31. Cheng, L.; Jin, T.; Wang, K.; Lee, Y.; Witlox, F. Promoting the Integrated Use of Bikeshare and Metro: A Focus on the Nonlinearity of Built Environment Effects. Multimodal Transp. 2022, 1, 100004. [Google Scholar] [CrossRef]
  32. Yu, Q.; Yuan, J. TransBigData: A Python Package for Transportationspatio-Temporal Big Data Processing, Analysis and Visualization. J. Open Source Softw. 2022, 7, 4021. [Google Scholar] [CrossRef]
  33. Guo, Y.; Yang, L.; Lu, Y.; Zhao, R. Dockless Bike-Sharing as a Feeder Mode of Metro Commute? The Role of the Feeder-Related Built Environment: Analytical Framework and Empirical Evidence. Sustain. Cities Soc. 2021, 65, 102594. [Google Scholar] [CrossRef]
  34. Dong, J.; Chen, S.; Li, W.; Zhou, Y.; Si, H. Evaluation of Dockless Bike-Sharing Transfer Services around Metro Stations Considering Spatial Heterogeneity. J. Adv. Transp. 2022, 2022, 7732485. [Google Scholar] [CrossRef]
  35. Guo, Y.; He, S.Y. Built Environment Effects on the Integration of Dockless Bike-Sharing and the Metro. Transp. Res. Part D Transp. Environ. 2020, 83, 102335. [Google Scholar] [CrossRef]
  36. Cai, H.; Wang, X.; Adriaens, P.; Xu, M. Environmental Benefits of Taxi Ride Sharing in Beijing. Energy 2019, 174, 503–508. [Google Scholar] [CrossRef]
  37. Shao, Q.; Zhang, W.; Cao, X.; Yang, J. Built Environment Interventions for Emission Mitigation: A Machine Learning Analysis of Travel-Related CO2 in a Developing City. J. Transp. Geogr. 2023, 110, 103632. [Google Scholar] [CrossRef]
  38. Wu, J.; Jia, P.; Feng, T.; Li, H.; Kuang, H. Spatiotemporal Analysis of Built Environment Restrained Traffic Carbon Emissions and Policy Implications. Transp. Res. Part D Transp. Environ. 2023, 121, 103839. [Google Scholar] [CrossRef]
Figure 1. Spatial distribution of study area and study data. (af) are the spatial distributions of the study area, metro stations, workday bikeshare origins, non-workday bikeshare origins, workday bikeshare destinations, and non-workday bikeshare destinations, respectively.
Applsci 14 05107 g001
Figure 2. The framework of methods.
Applsci 14 05107 g002
Figure 3. Growth rate of bikeshare ridership within the catchment area.
Applsci 14 05107 g003
Figure 4. Distribution of transfer characteristics of bikeshares. (a,b) show the temporal distribution of bikeshare feeder volumes on workdays and non-workdays, respectively. (c,d) are the feeder distance distributions of bikeshare on workdays and non-workdays, respectively.
Applsci 14 05107 g004
Figure 5. Temporal distribution of carbon reduction benefits of BS-FMMS on workdays and non-workdays. (a) represents the workday and (b) represents the non-workday.
Applsci 14 05107 g005
Figure 6. Spatial distribution of carbon reduction benefits of BS-FMMS on workdays and non-workdays. From top to bottom, it shows the spatial distribution of workday, the spatial distribution of non-workday, the spatial distribution of the difference between workday and non-workday (type 1 is that the carbon emission reduction on workday is larger than that on non-workday, and type 2 is that the carbon emission reduction on workday is smaller than that on non-workday), and the distribution of the box plots within the same period. From left to right, these are the all-day period (6:30 to 23:00), the morning peak period (7:00 to 9:00), and the evening peak period (17:00 to 19:00). (a,e,i) show the spatial distribution of carbon emission reductions during the all-day period, the morning peak period, and the evening peak period on workdays, respectively. (b,f,j) represent the spatial distribution of carbon emission reductions during the all-day period, the morning peak period, and the evening peak period on non-workdays, respectively. (c,g,k) show the spatial distribution of the difference in carbon emission reductions between workdays and non-workdays in the all-day period, the morning peak period, and the evening peak period, respectively. (d,h,l) represent the box plots distribution of carbon emission reductions between workdays and non-workdays in the all-day period, the morning peak period, and the evening peak period, respectively.
Applsci 14 05107 g006
Figure 7. Relationship between ridership and carbon emission reduction. (a,b) are plots of workday and non-workday, respectively. X is the ridership of bikeshare in a specific metro station area during a specific time period, and Y is the carbon emission reduction of bikeshare in the corresponding metro station area during the corresponding time period.
Applsci 14 05107 g007
Table 1. Share of different transport modes.
Transport ModeBusSubwayTaxiCarOther
Mode share18%20%5%53%4%
Source: Shenzhen Planning and Natural Resources Bureau.
Table 2. Carbon emission factor and passenger loading.
Transport ModeCarbon Emission Factor (gCO2/km)Passenger Loading
Bikeshare01
Car139.481.5
Taxi155.001.5
Bus79.6217
Source: Carbon Emission Factor [26]; Passenger Loading [7].
Disclaimer/Publisher’s Note: The statements, opinions and data contained in all publications are solely those of the individual author(s) and contributor(s) and not of MDPI and/or the editor(s). MDPI and/or the editor(s) disclaim responsibility for any injury to people or property resulting from any ideas, methods, instructions or products referred to in the content.

