
Modeling the Dynamics of Water and Mud Inrush in Fault Fracture Zones: The Role of Seepage–Erosion Interactions

Abstract
1. Introduction
2. Theoretical Modeling of Water and Mud Inrush for Completely Weathered Rock in a Fault Fracture Zone
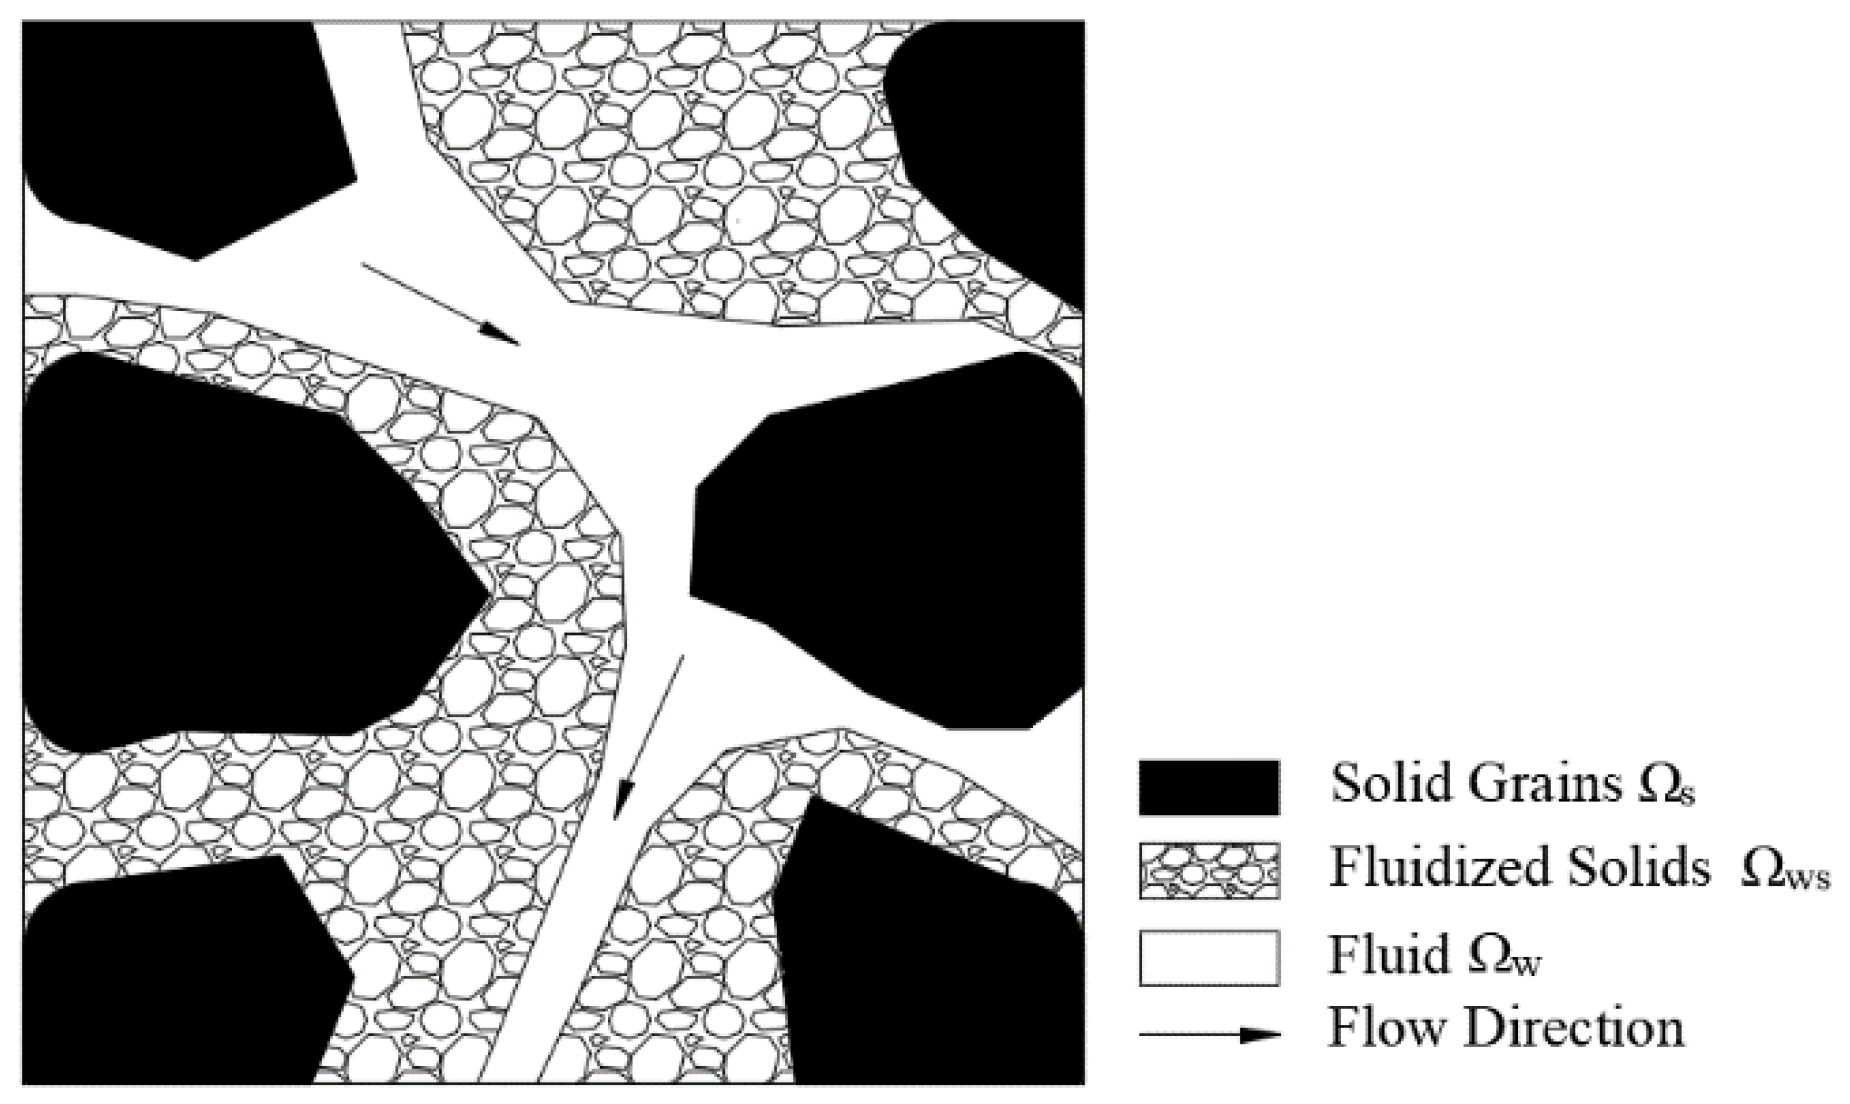
2.1. Mass Balance Equation
2.2. Flow Pattern Evolution Equation
2.3. Porosity Evolution Law
2.4. Permeability Evolution Law
3. Validation of the Model
3.1. Description of the Experimental Tests
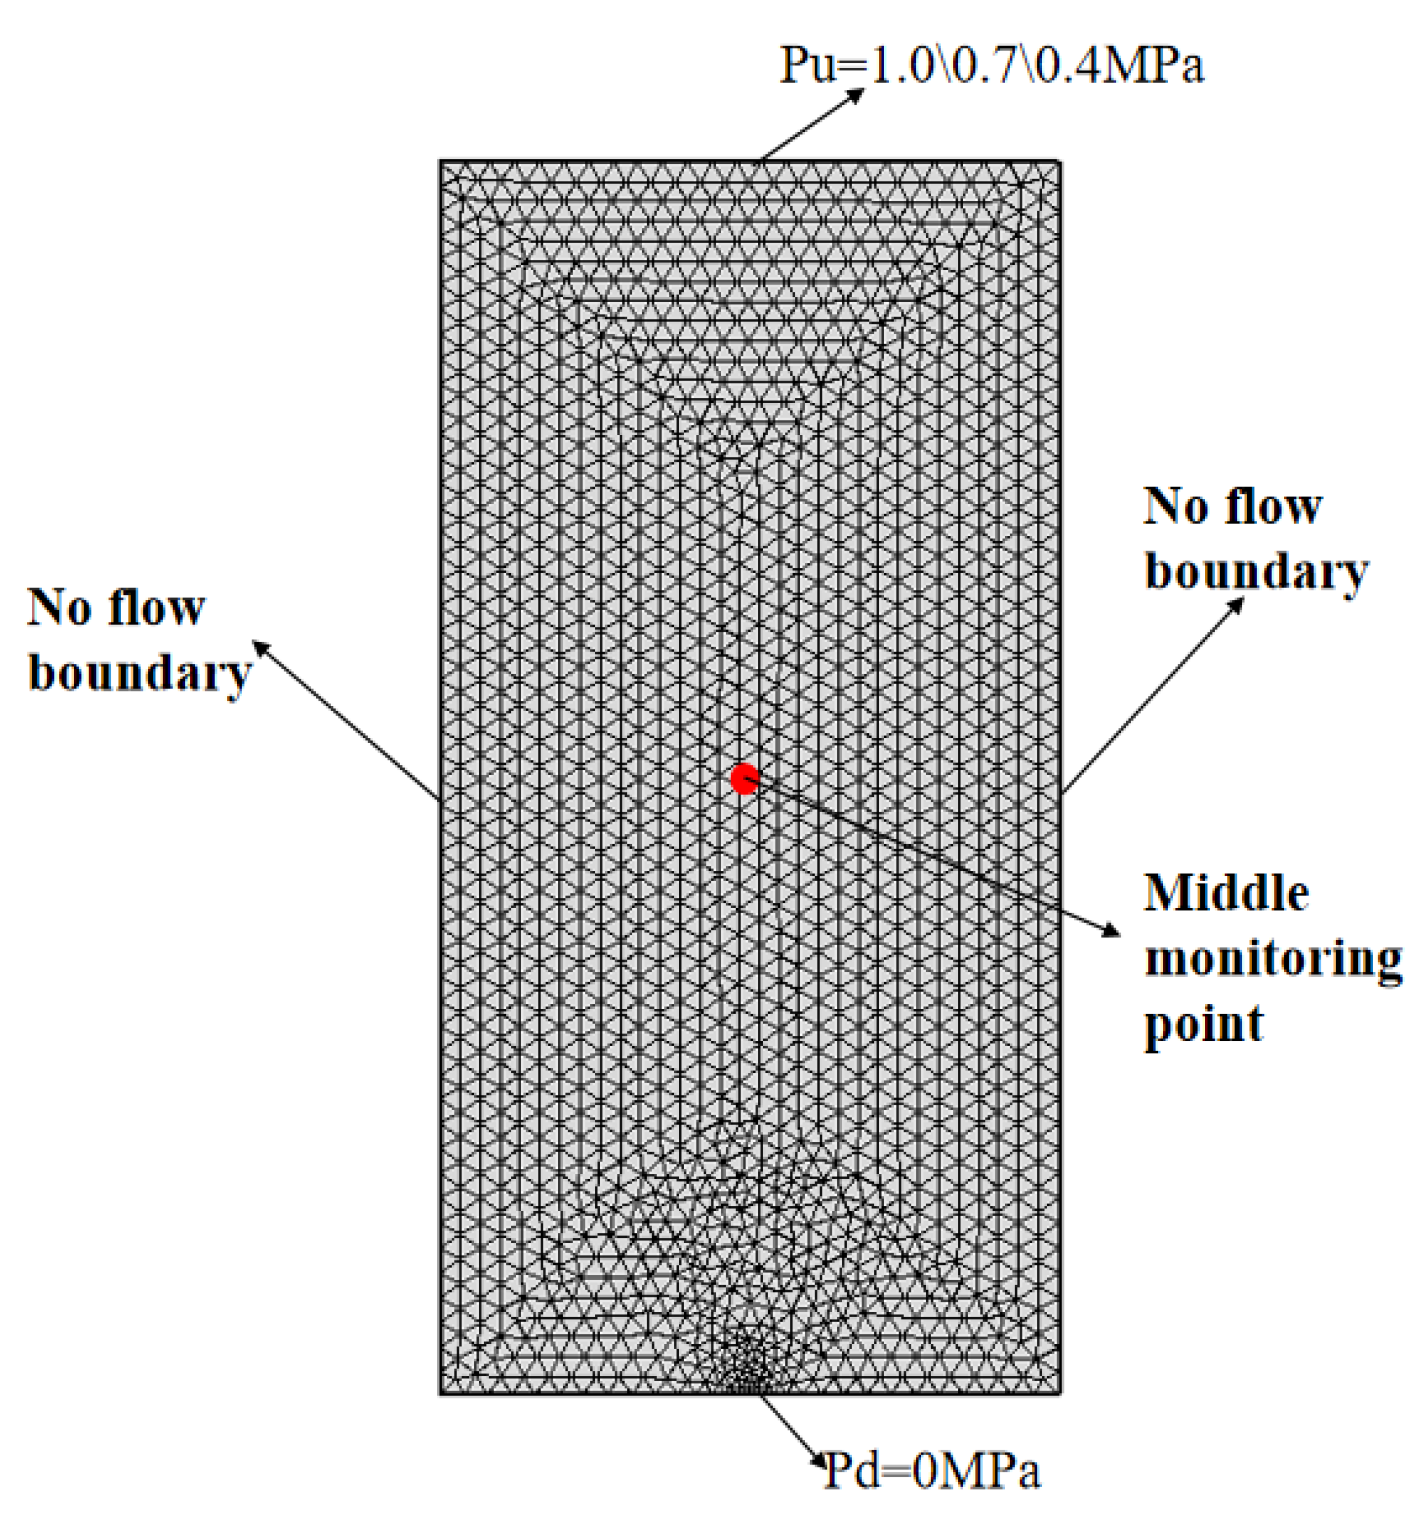
3.2. Numerical Simulations
3.3. Calibration of Parameters
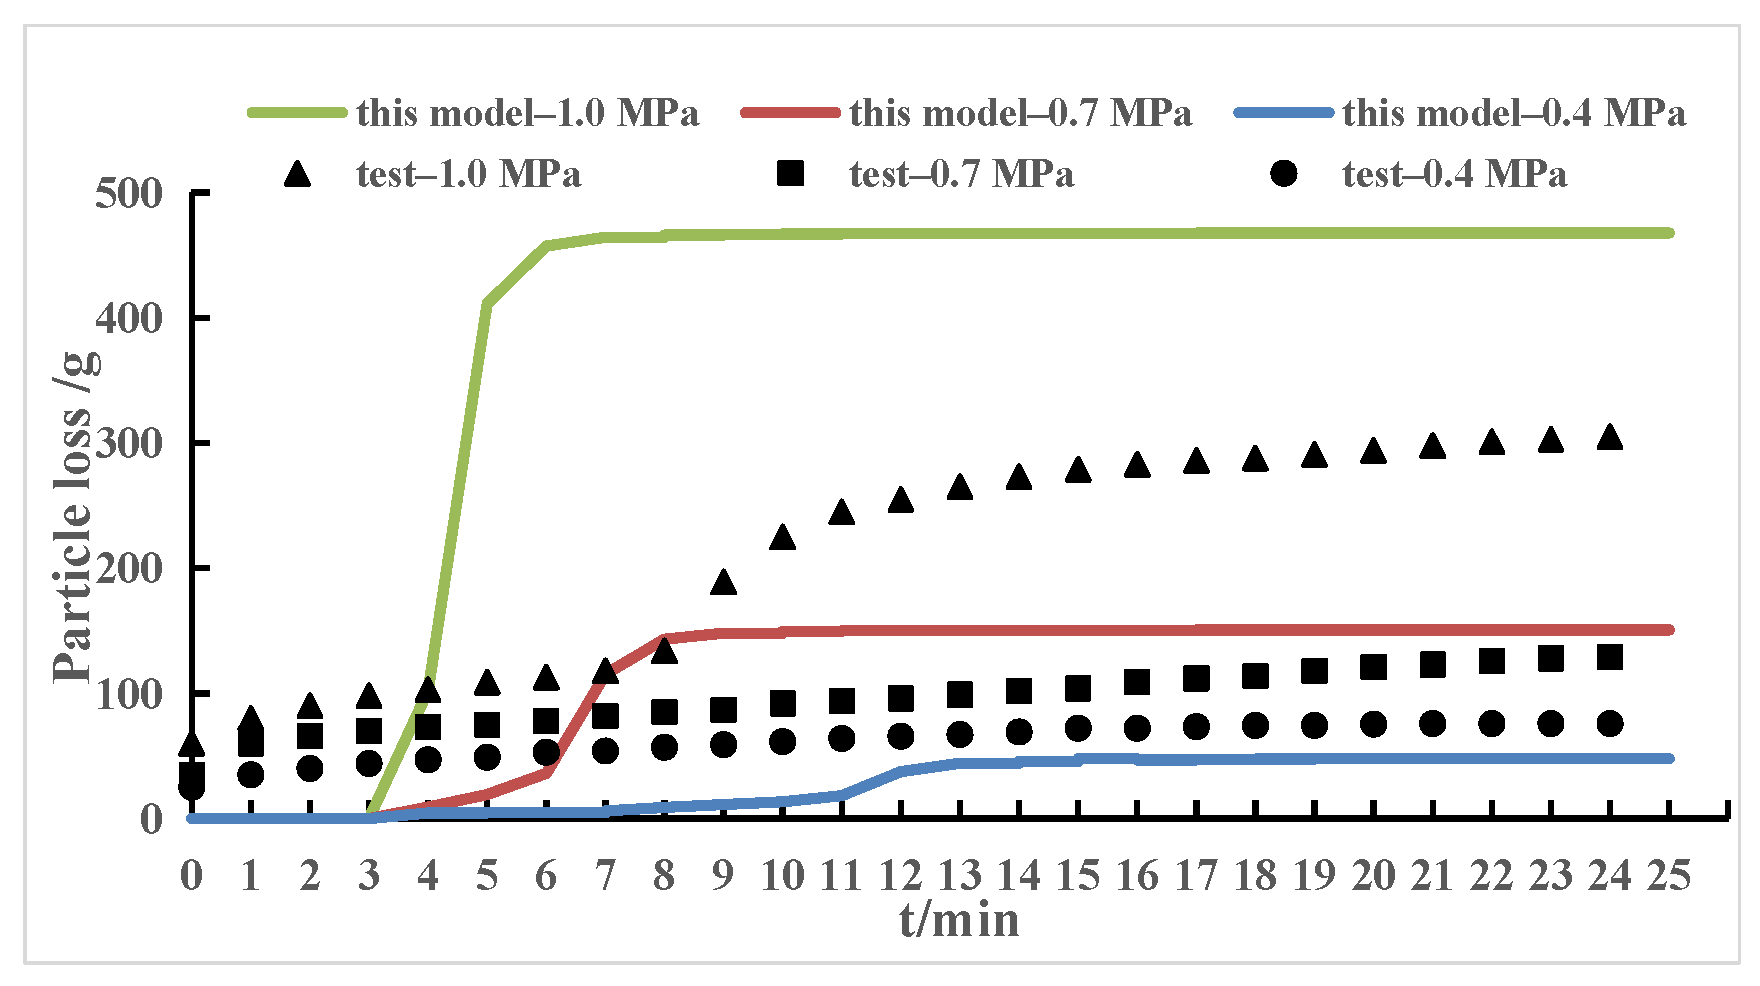
3.4. Comparisons between Model Prediction and Laboratory Experiments
4. Engineering Application
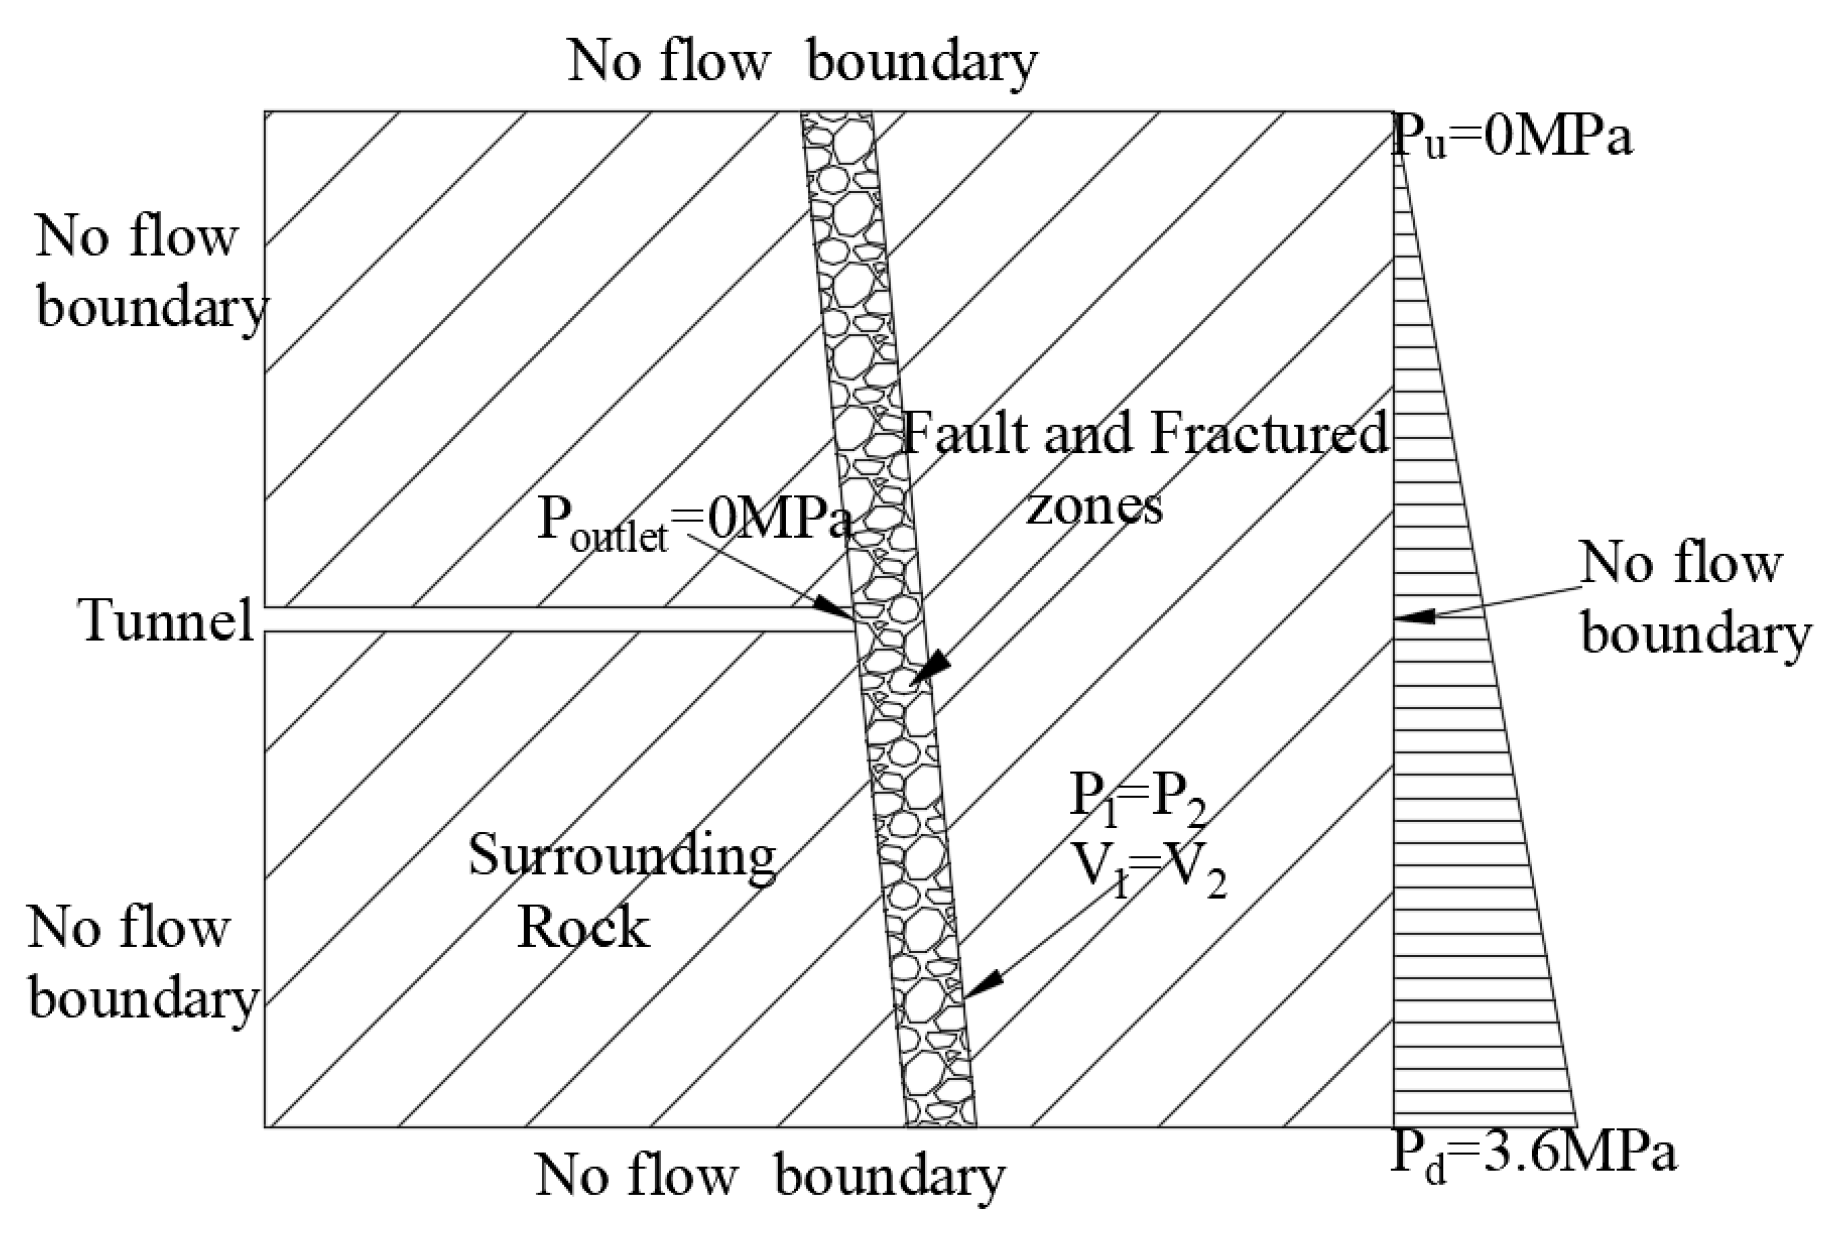
4.1. Geometry and Finite Element Model
4.2. Model Calculation Results and Analysis
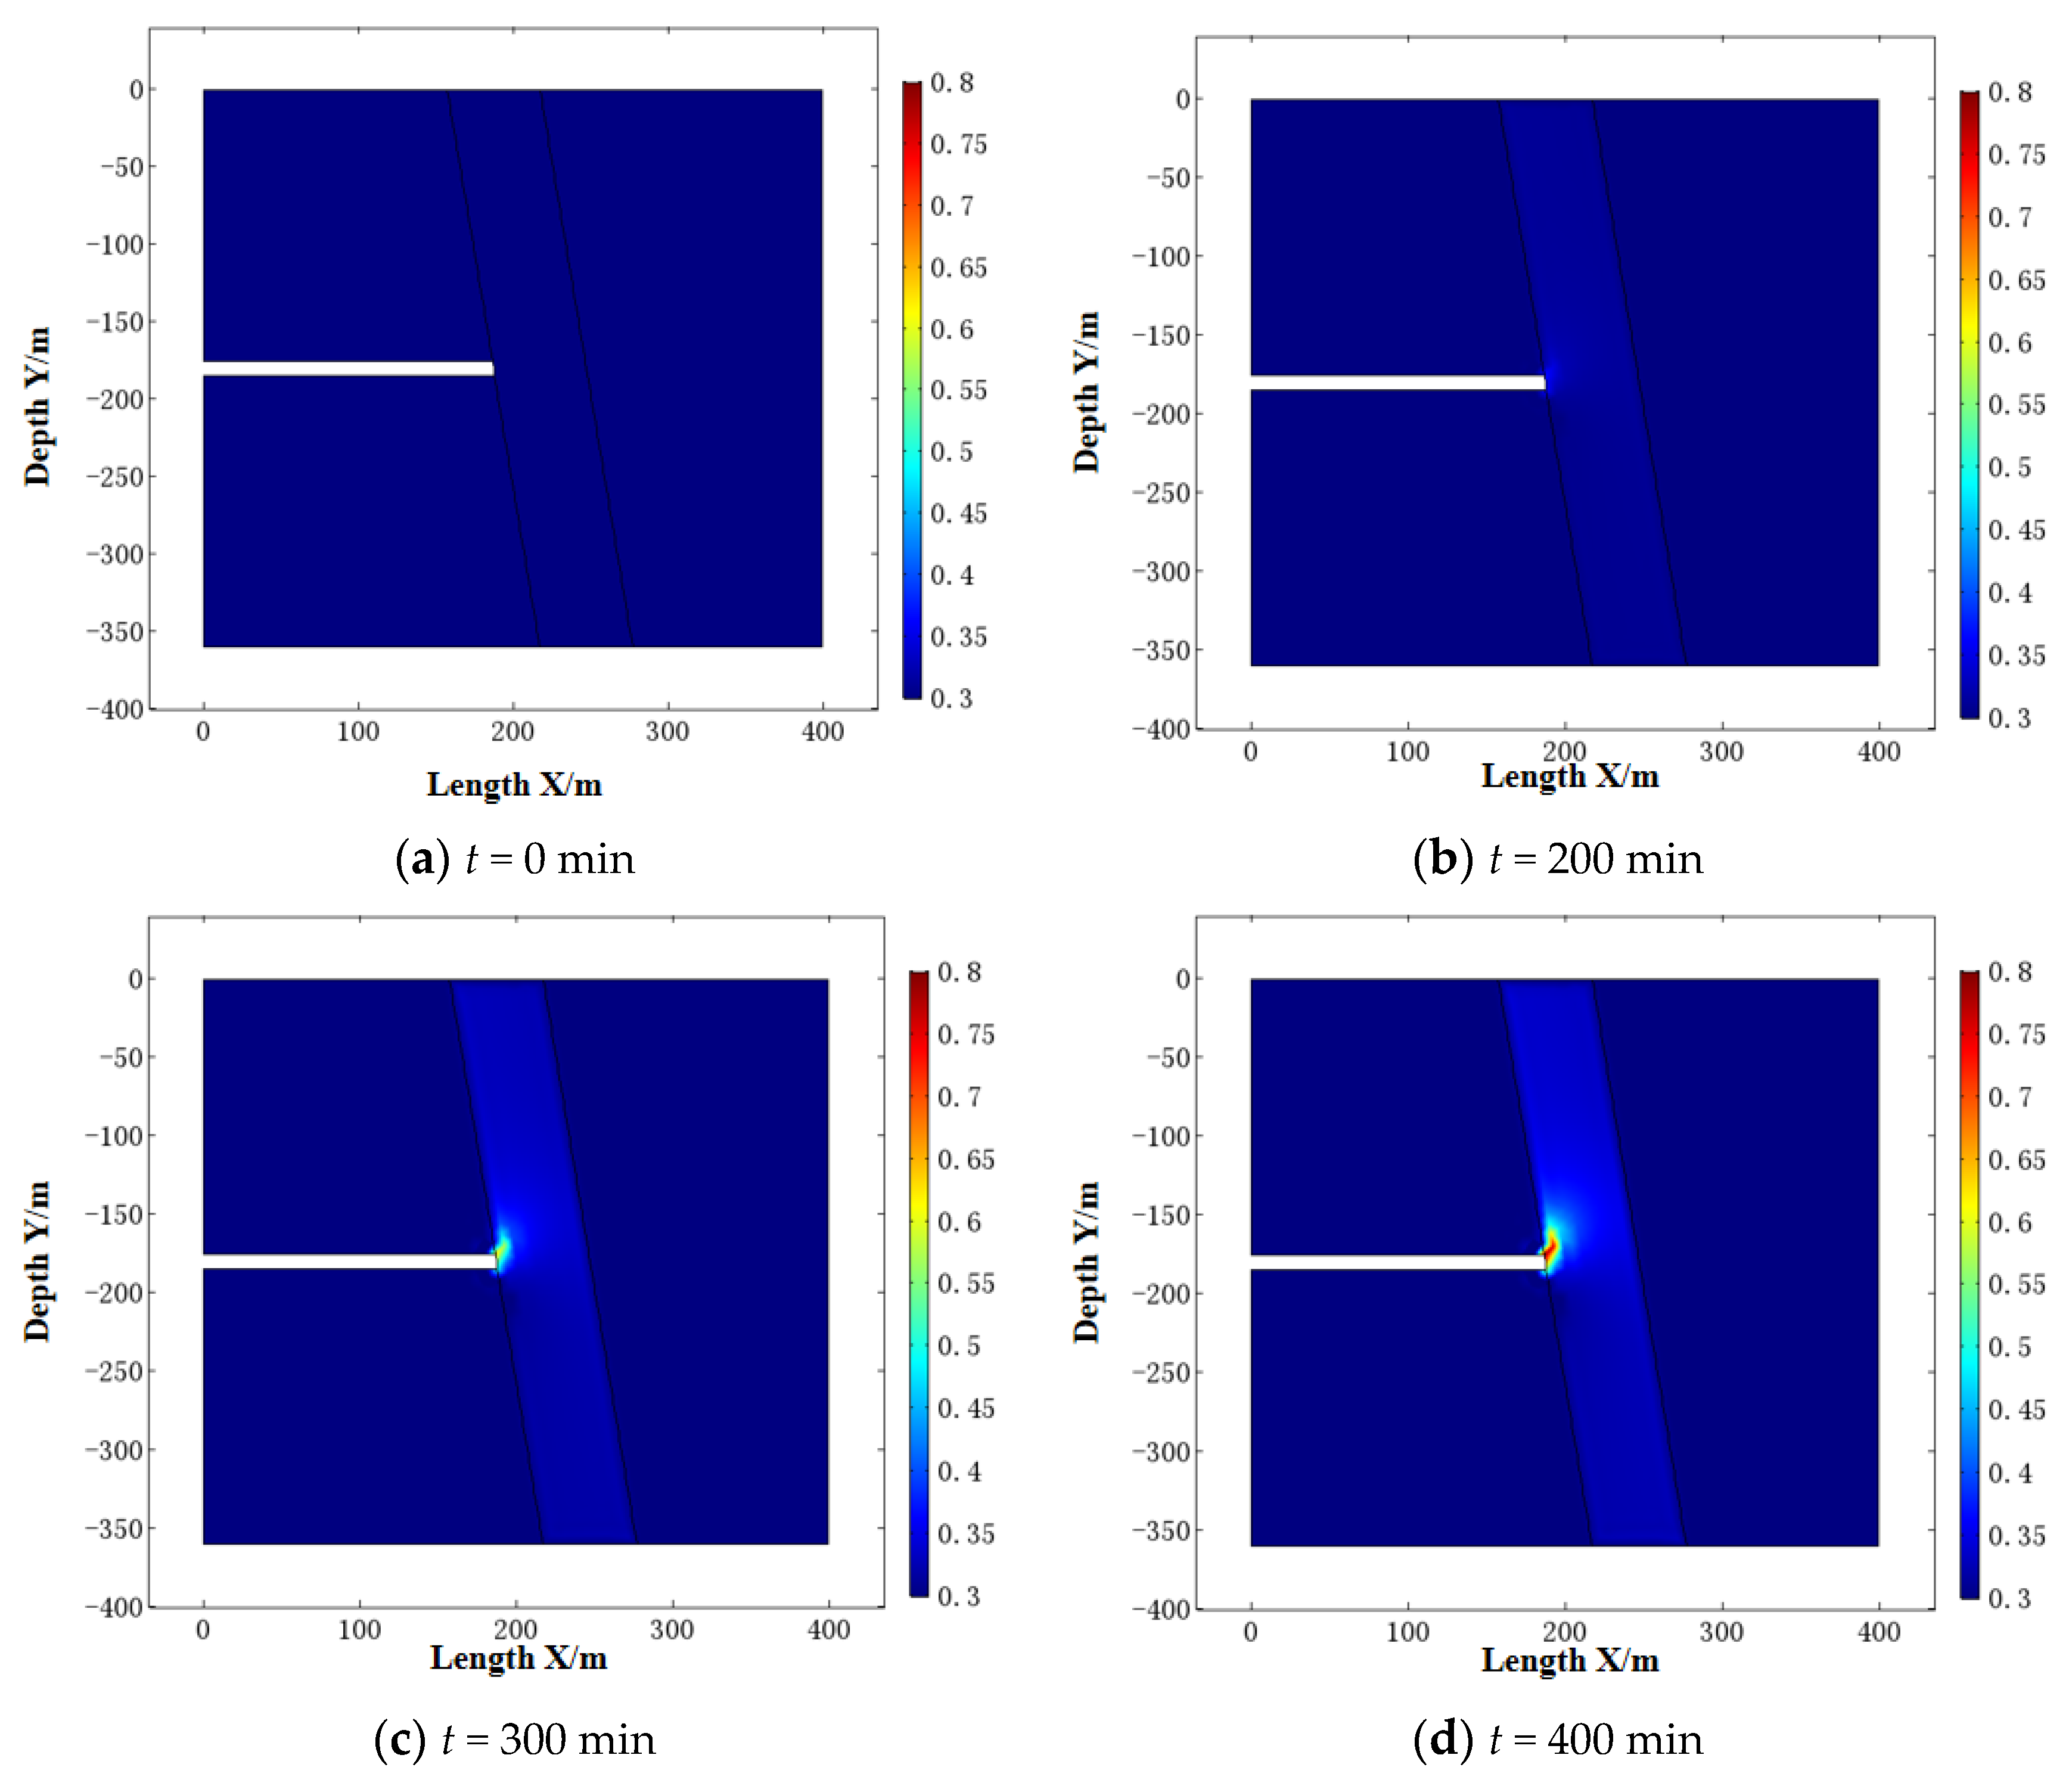
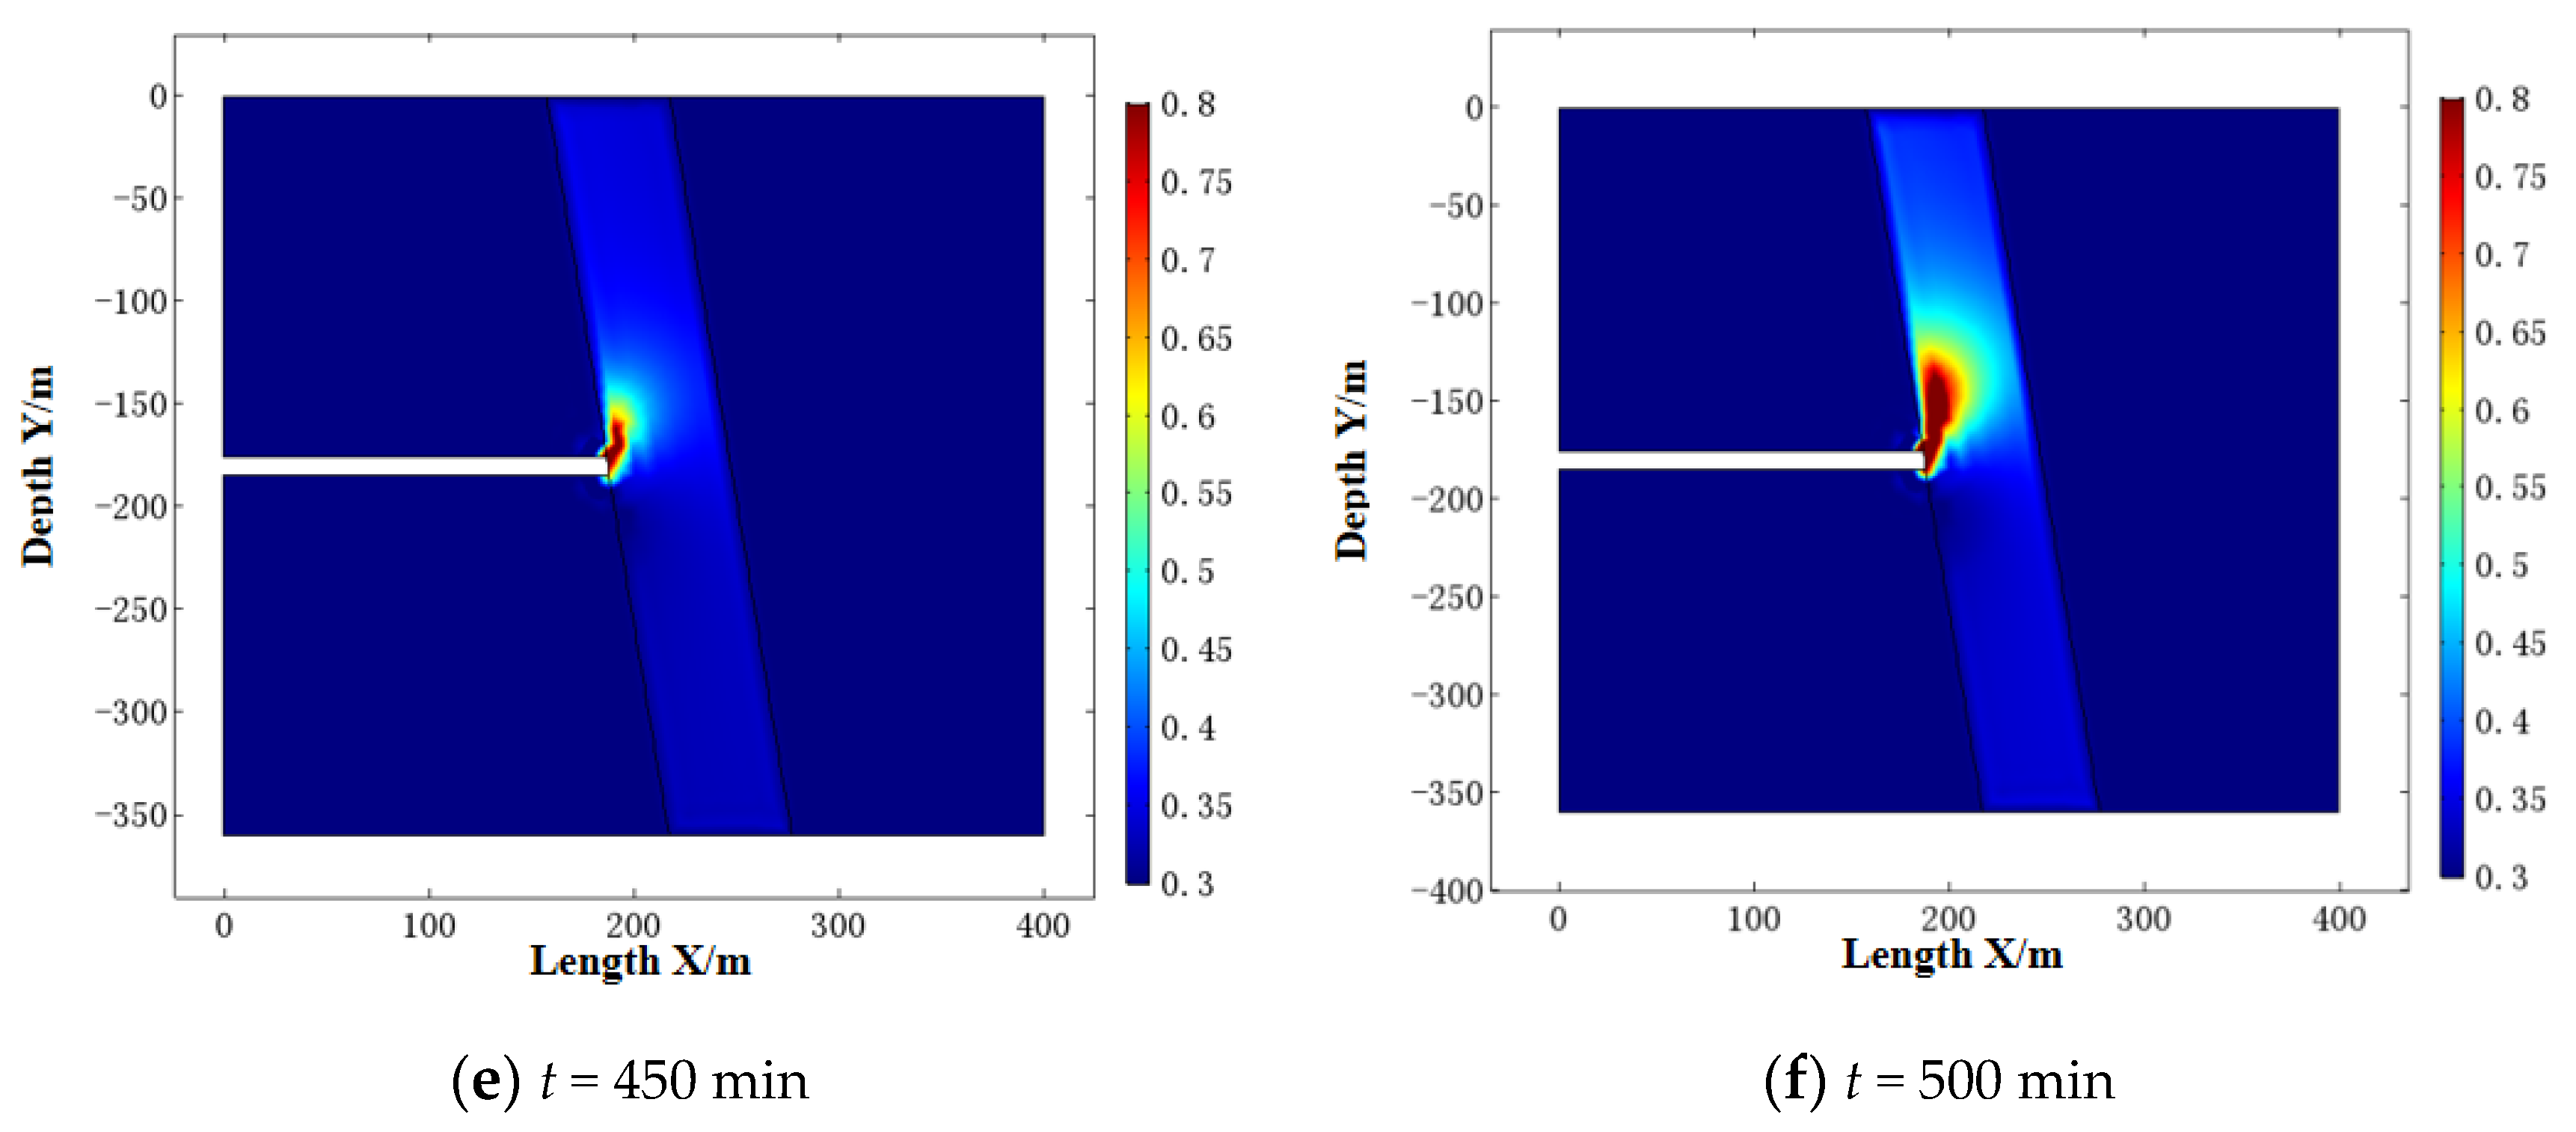
- (1)
- Porosity evolution.
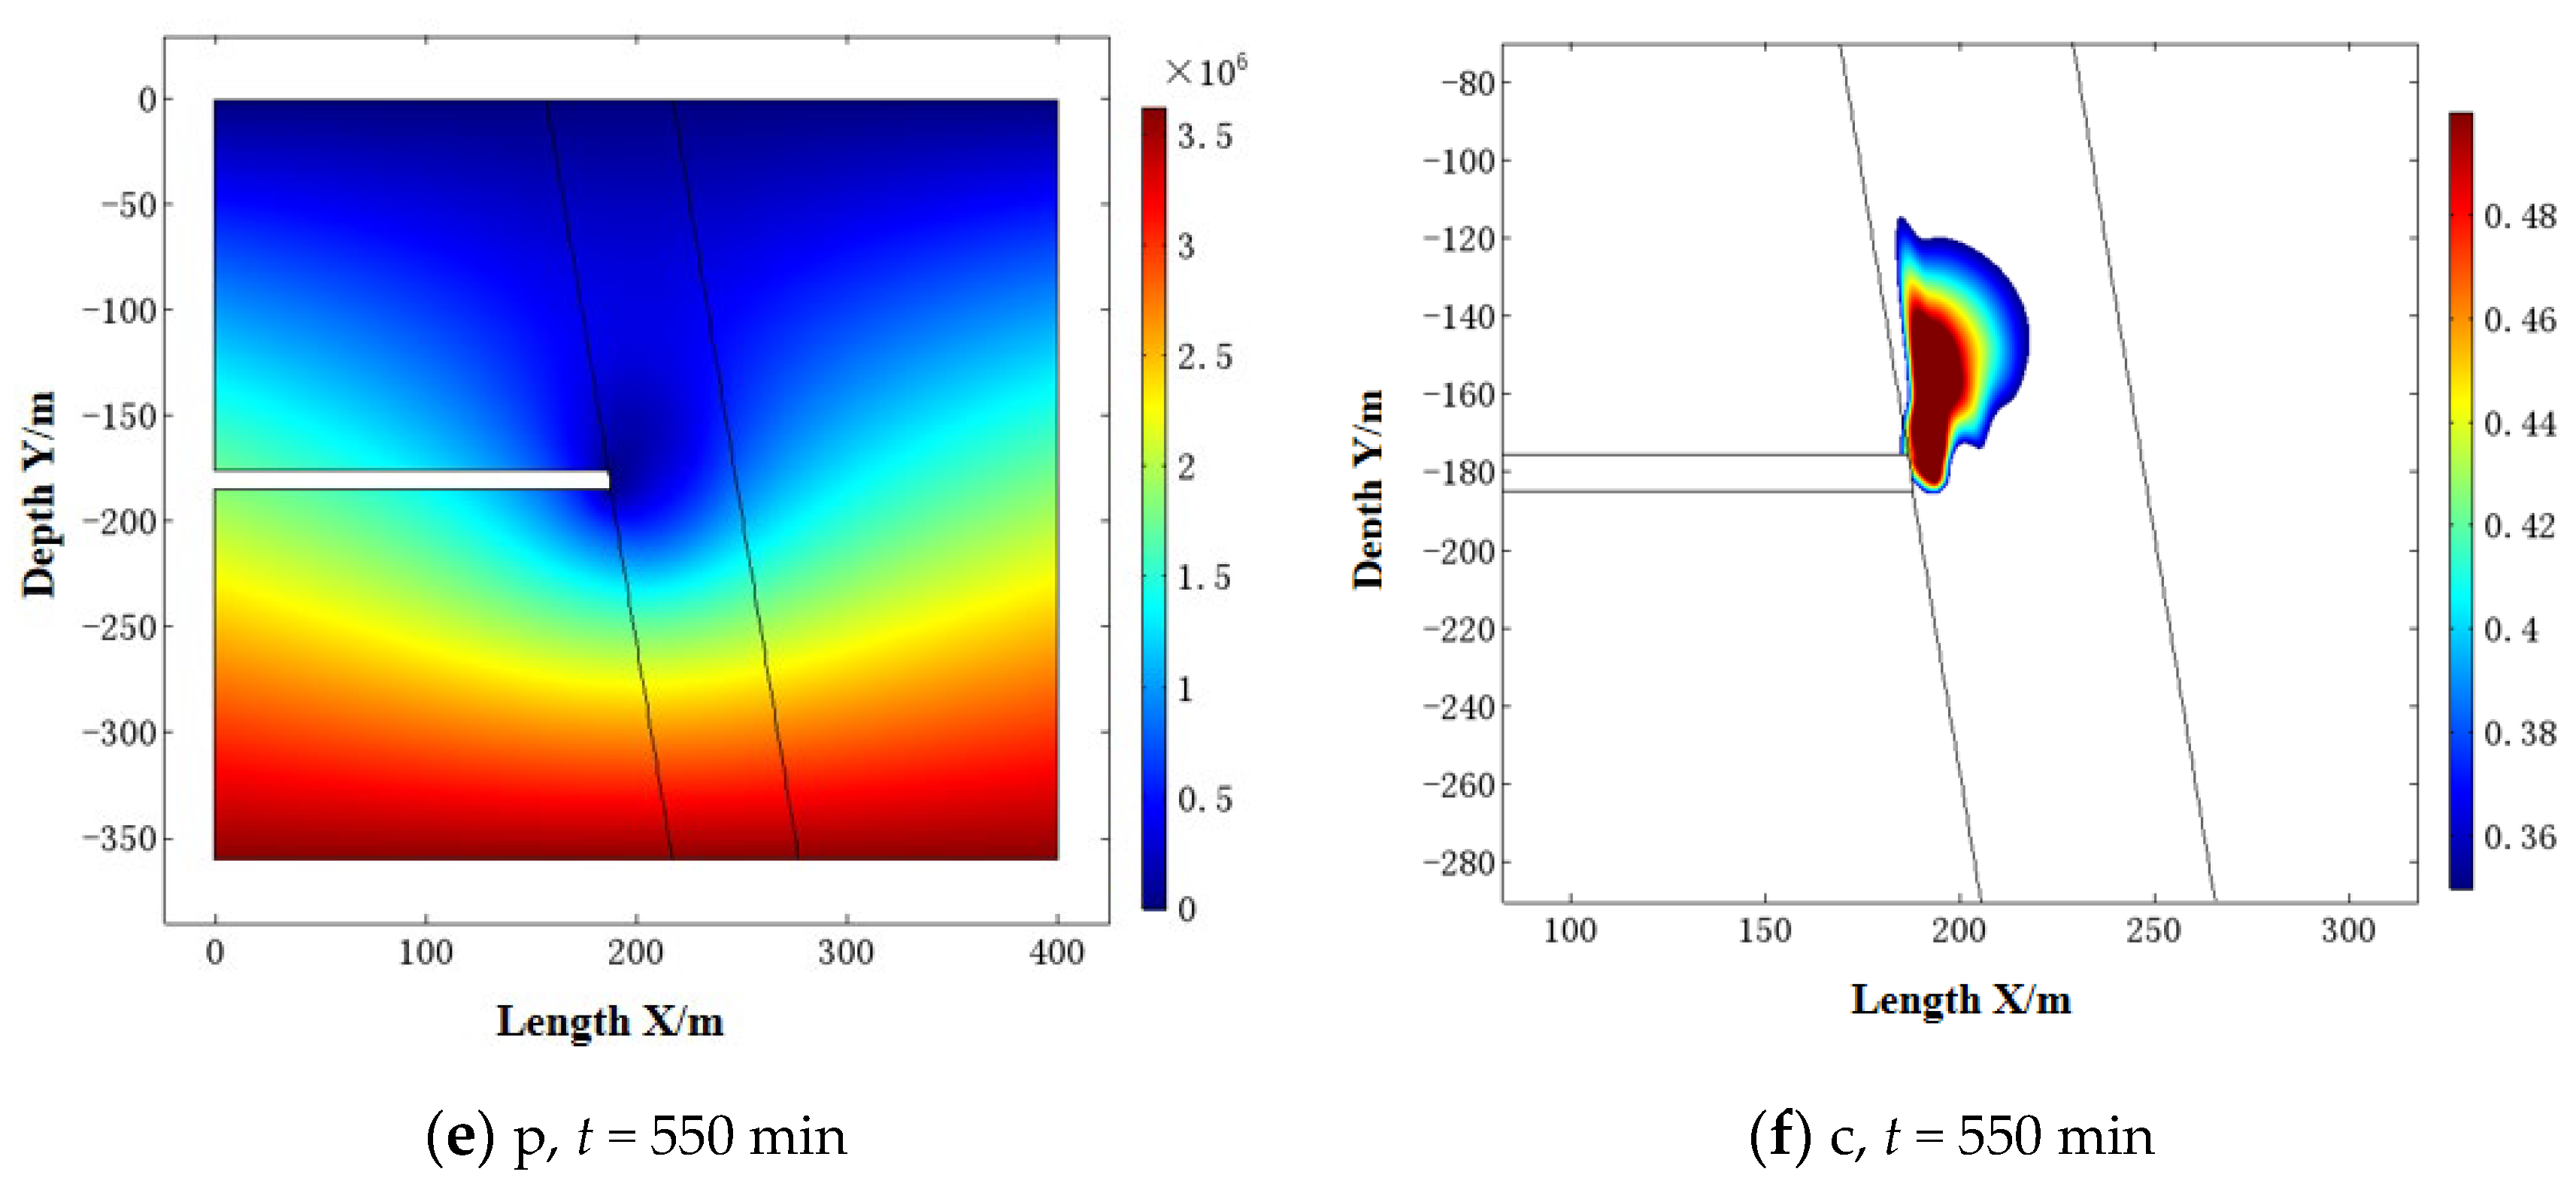
- (2)
- Pore water pressure and fluidized grain concentration evolution.
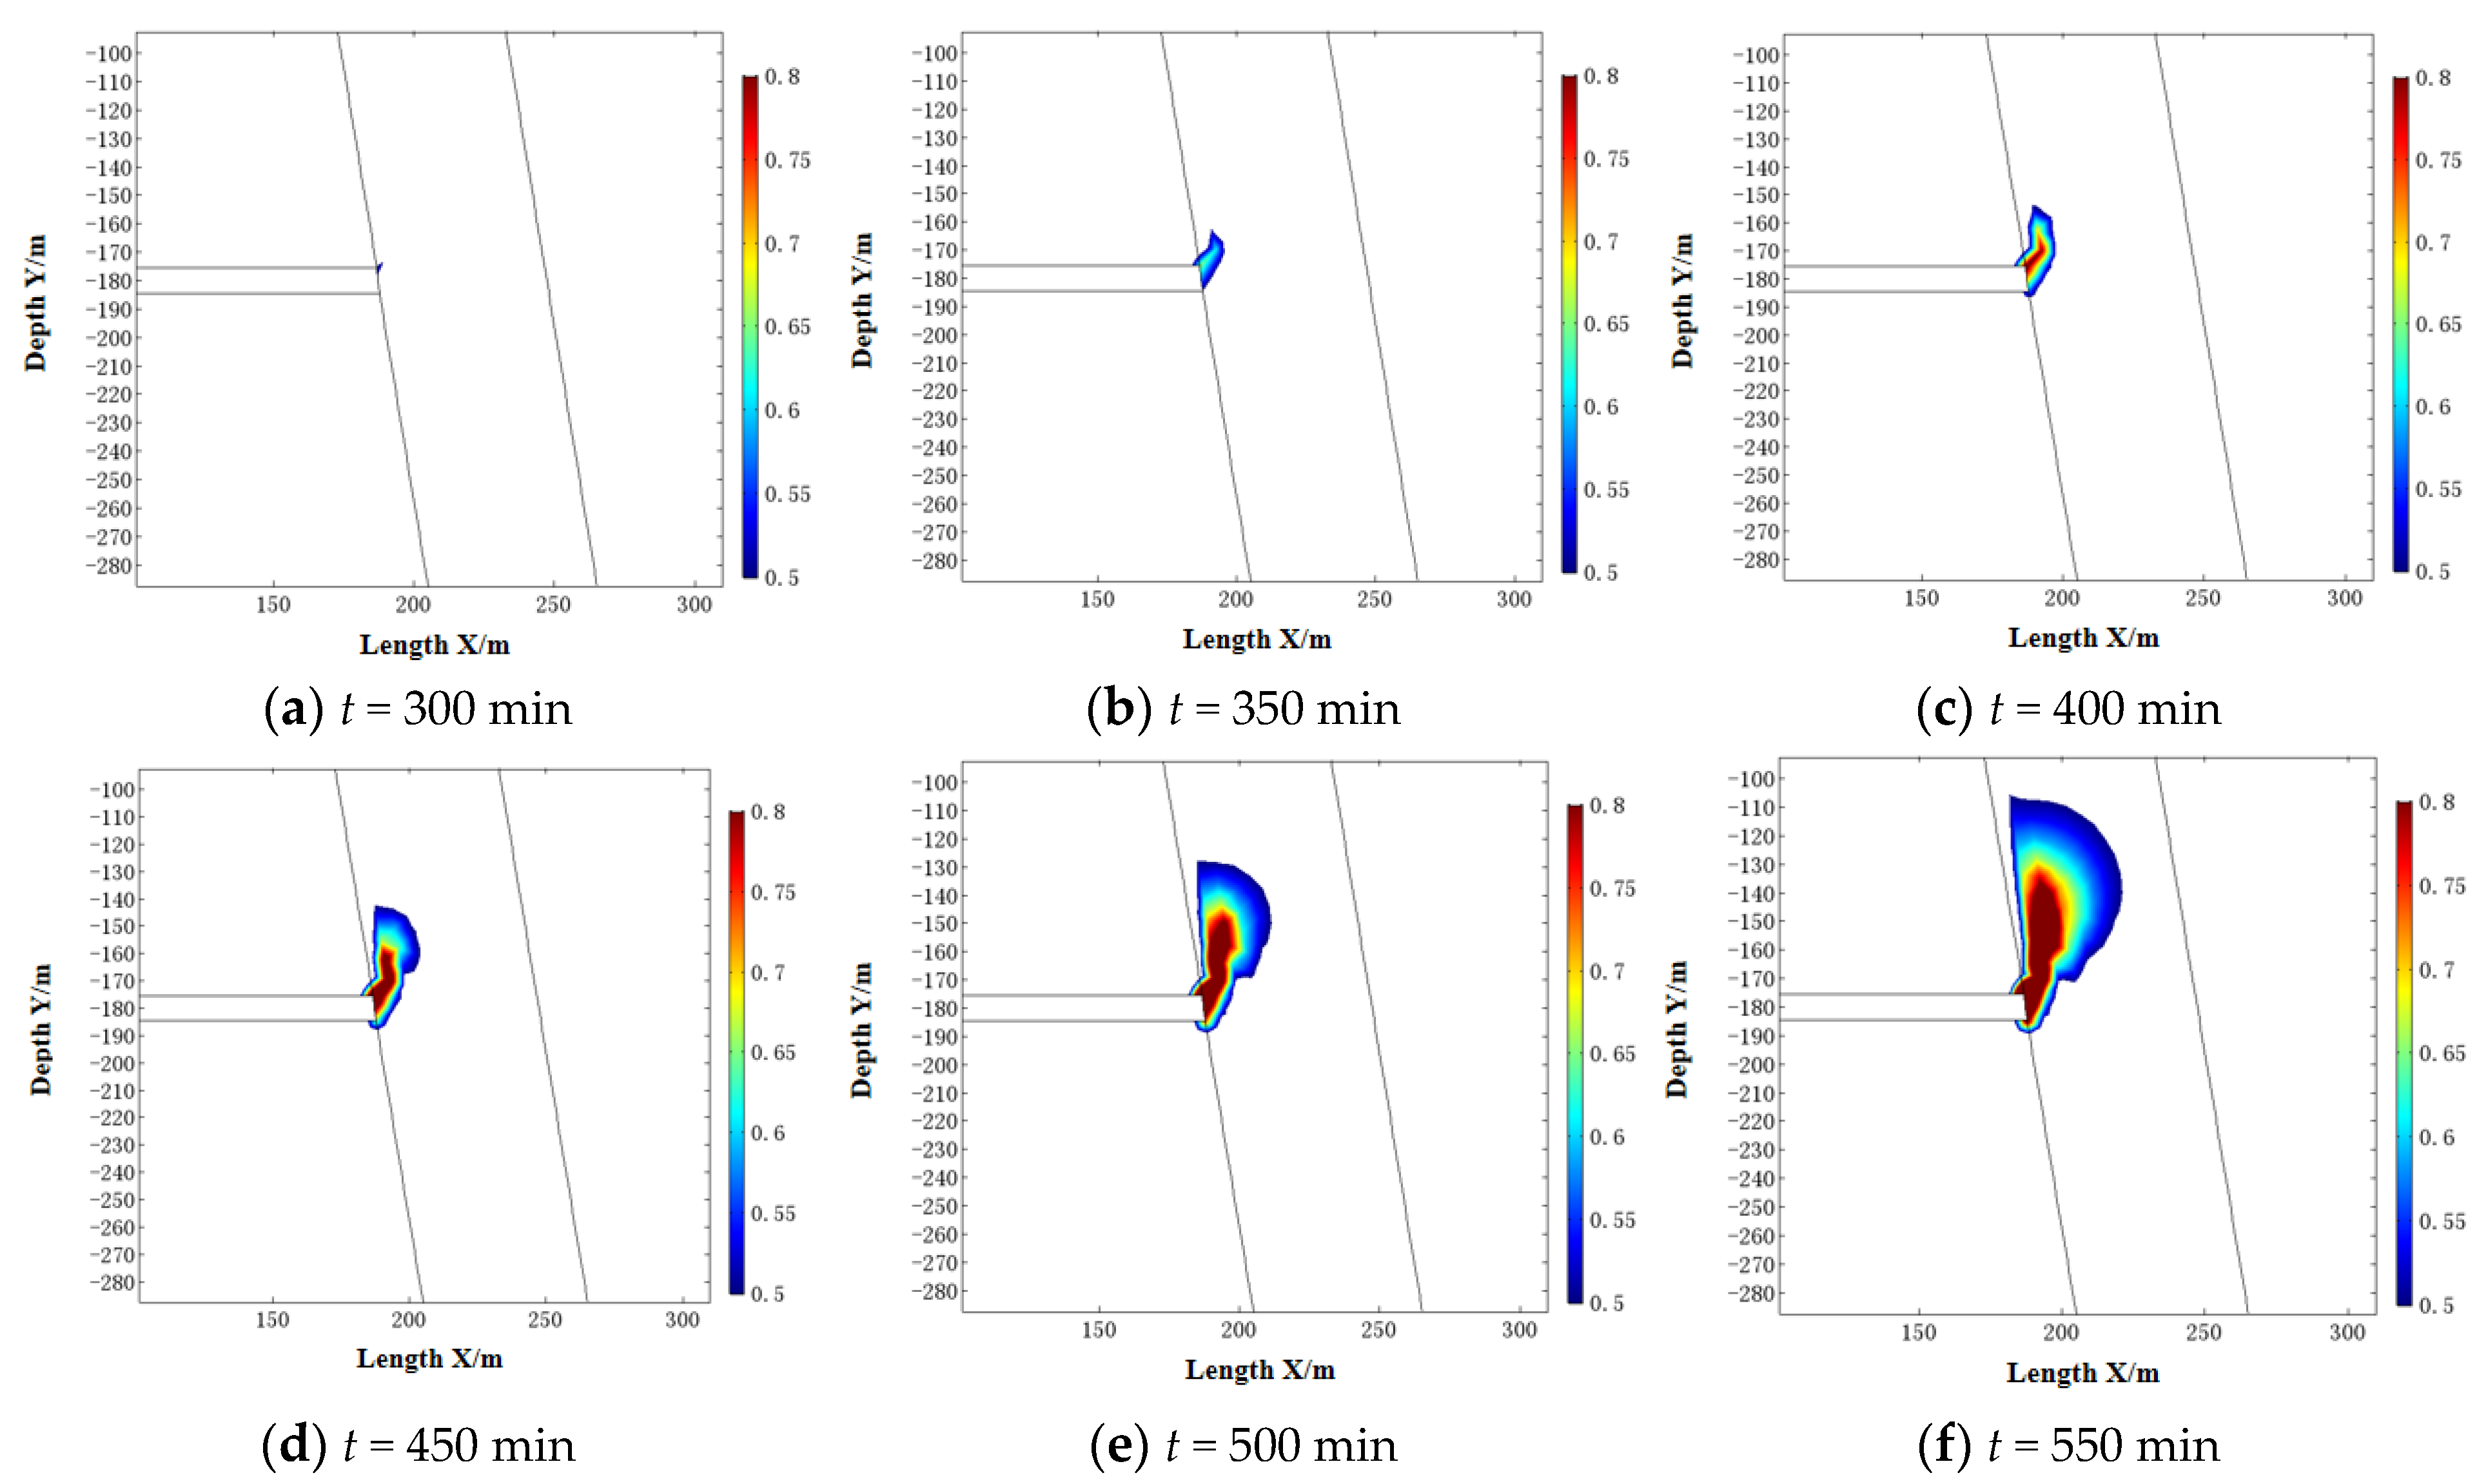
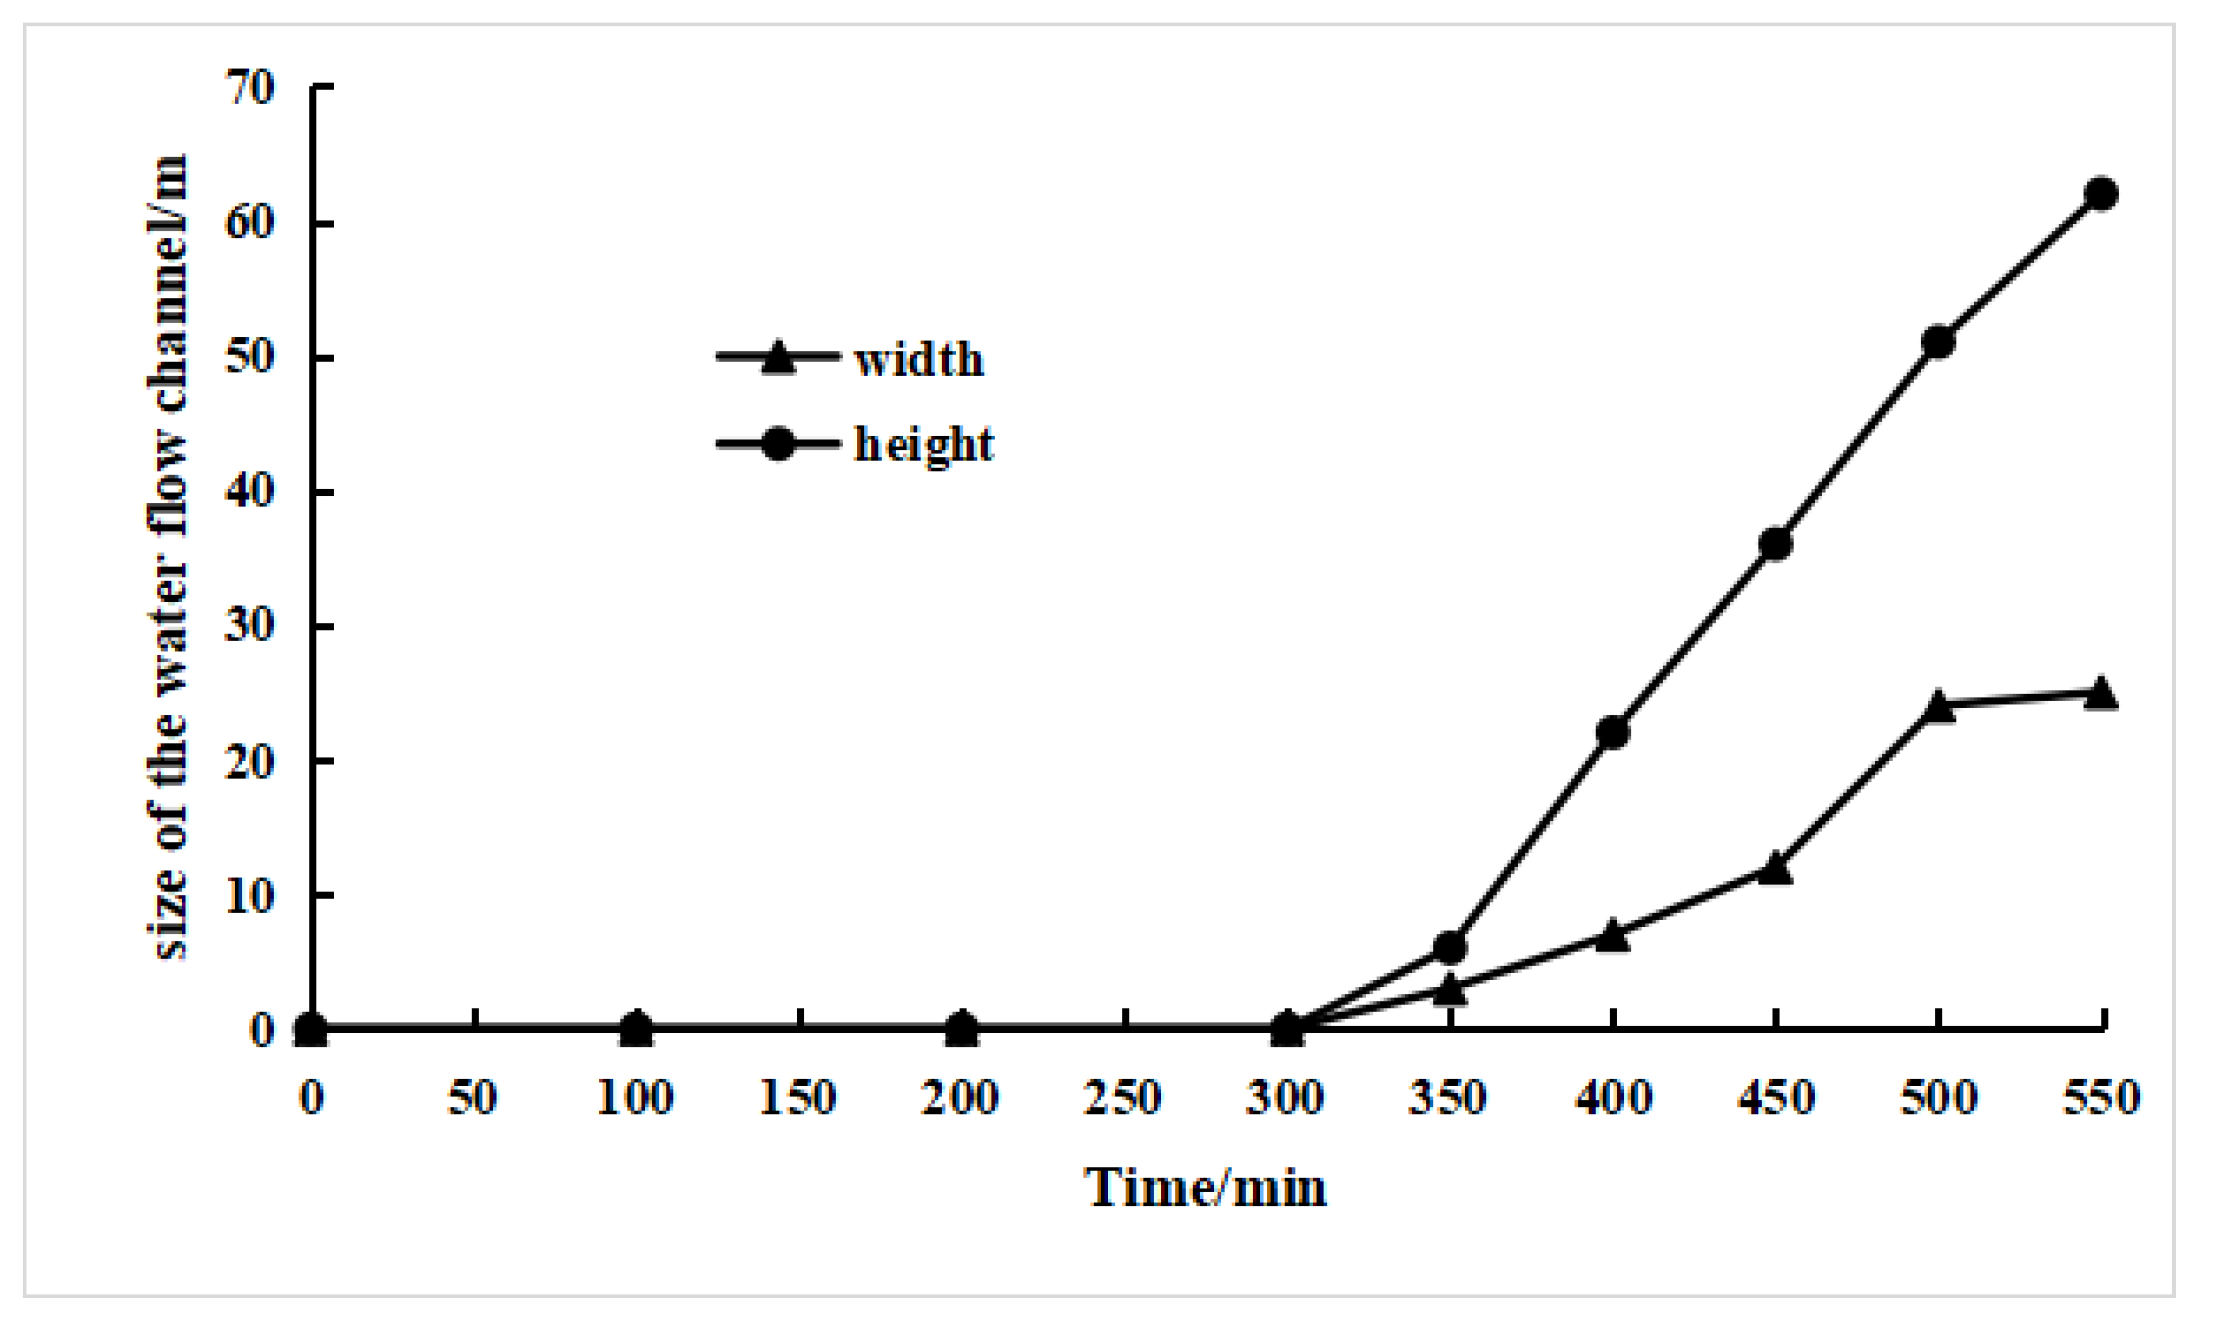
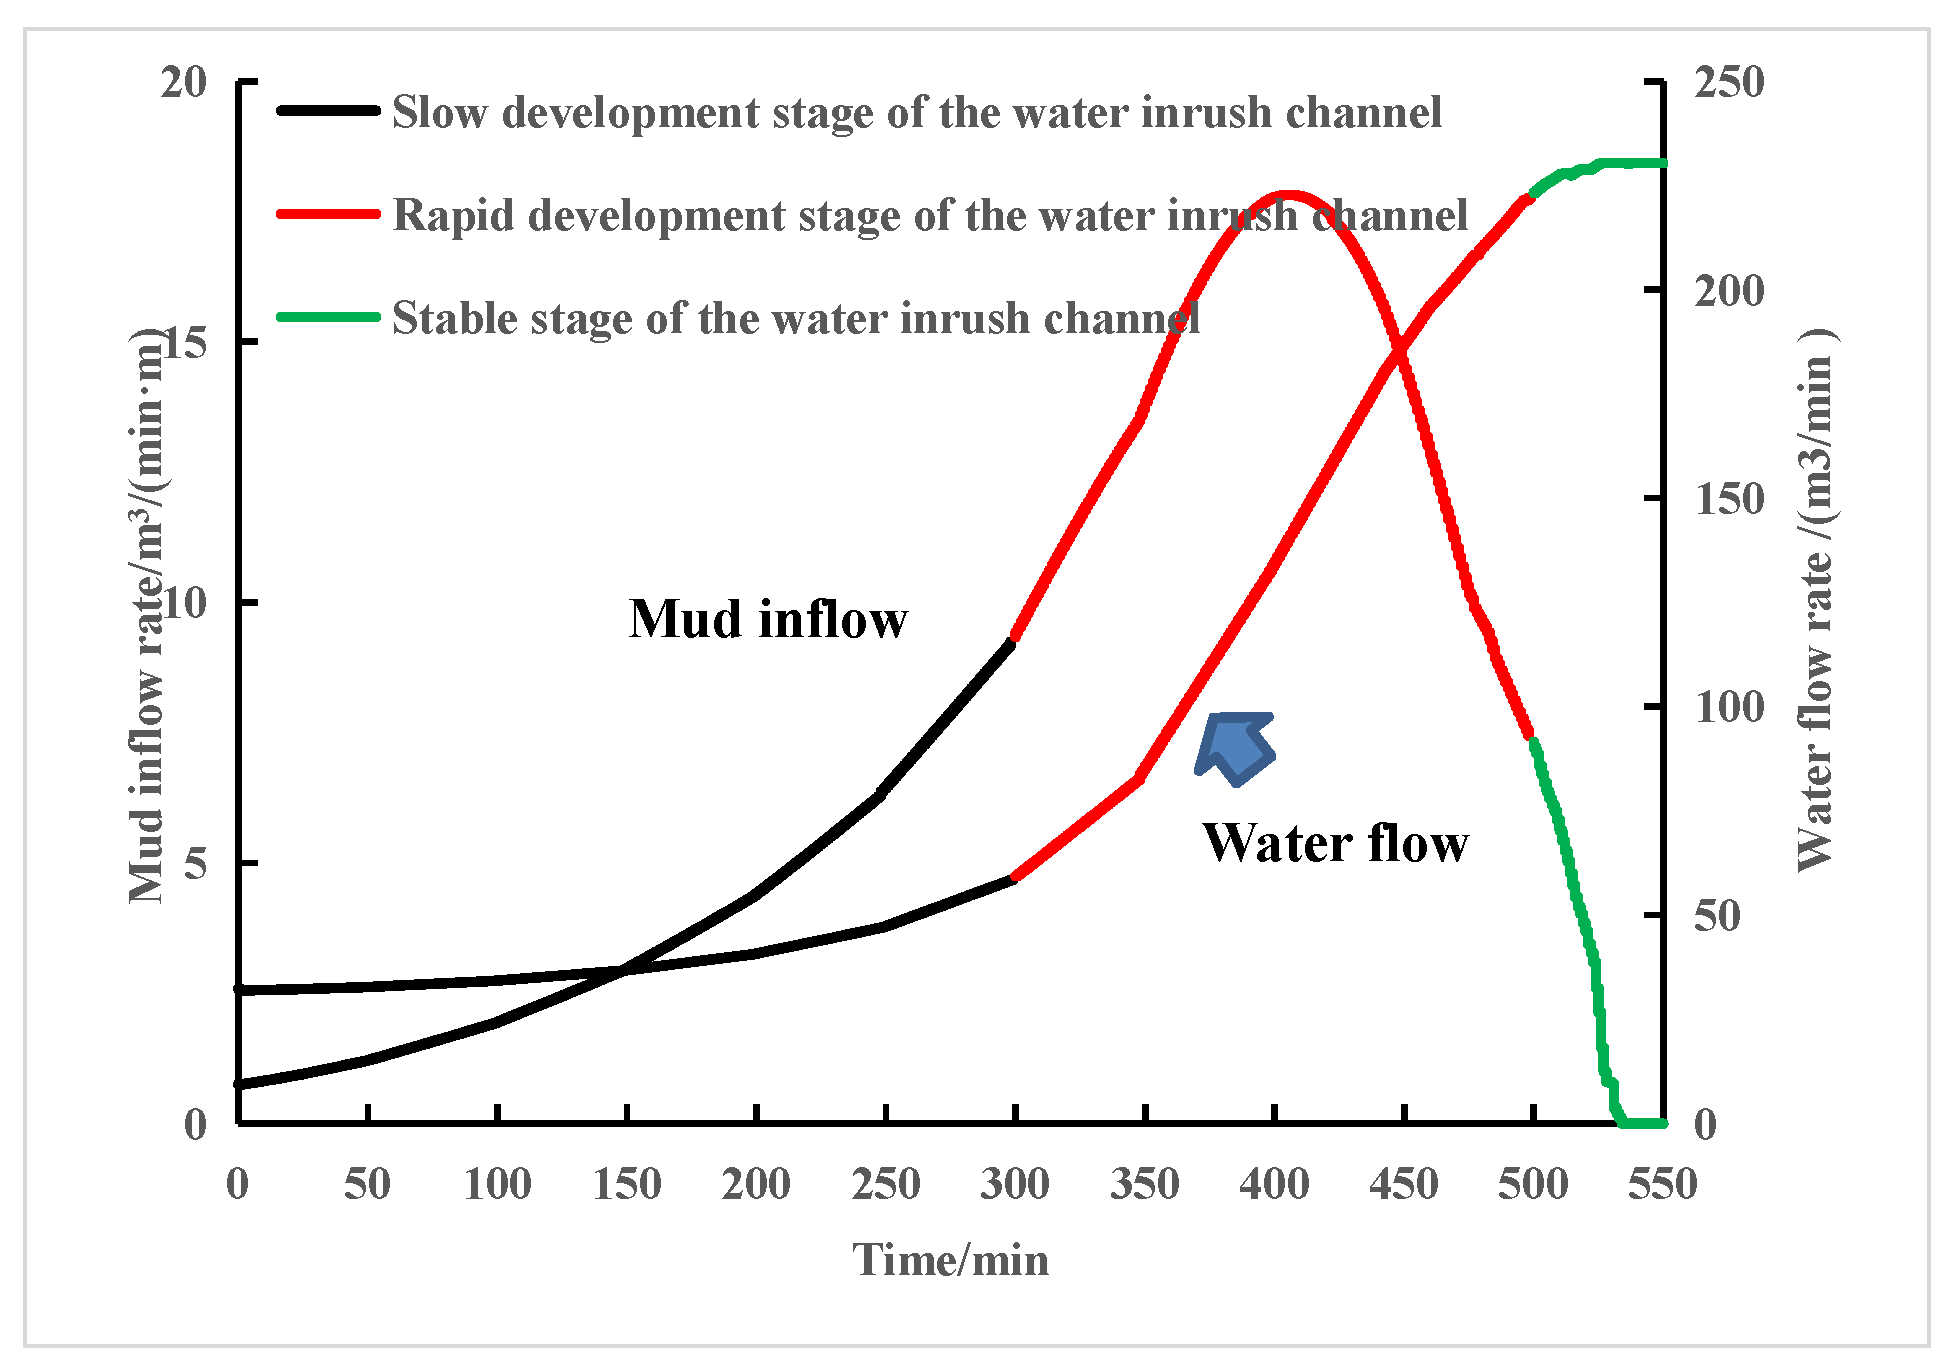
- (3)
- Analysis of the development of the water inrush channel and the water and mud inrush disaster.
5. Conclusions
Author Contributions
Funding
Institutional Review Board Statement
Informed Consent Statement
Data Availability Statement
Conflicts of Interest
References
- Meng, Y.X. Research on the forms ofadvancedsupport reinforcement for tunnels in weak surrounding rocks. J. Munic. Technol. 2023, 41, 111–116. [Google Scholar]
- Liu, R. Prediction of surace deformation during construction of railway tunnels crossing karst areas. J. Munic. Technol. 2023, 41, 129–136. [Google Scholar]
- Liu, J. Study on safety of suport stmuc.ture in karst section of tunnel considering fluid-solid coupling. J. Munic. Technol. 2023, 41, 84–90. [Google Scholar]
- Li, S.C.; Xu, Z.H.; Huang, X.; Lin, P.; Zhao, X.C.; Zhang, Q.S.; Yang, L.; Zhang, X.; Sun, H.F.; Pan, D.D. Classification, geological identification, hazard mode and typical case studies of hazard-causing structures for water and mud inrush in tunnels. Chin. J. Rock Mech. Eng. 2018, 37, 1043–1069. [Google Scholar]
- Golian, M.; Teshnizi, E.S.; Nakhaei, M. Prediction of water inflow to mechanized tunnels during tunnel-boring-machine advance using numerical simulation. Hydrogeol. J. 2018, 26, 2827–2851. [Google Scholar] [CrossRef]
- Liu, J.; Chen, W.; Yuan, J.; Li, C.; Zhang, Q.; Li, X. Groundwater control and curtain grouting for tunnel construction in completely weathered granite. Bull. Eng. Geol. Environ. 2018, 77, 515–531. [Google Scholar] [CrossRef]
- Liu, J.-Q.; Yuen, K.-V.; Chen, W.-Z.; Zhou, X.-S.; Wang, W. Grouting for water and mud inrush control in weathered granite tunnel: A case study. Eng. Geol. 2020, 279, 105896. [Google Scholar] [CrossRef]
- Li, S.C.; Wang, K.; Li, L.P.; Zhang, Q.S.; Hu, C.; Zhou, Y.; Liu, H.L.; Lin, P. Development and application of an extendable model test system for water inrush simulation in subsea tunnel. Chin. J. Rock Mech. Eng. 2014, 33, 2409–2418. [Google Scholar]
- Li, W.P.; Liu, Q.M.; Sun, R.H. Theoretical and experiment study on vadose conversion of water inrush later occurred from structure broken zone. Coal Sci. Technol. 2011, 39, 10–13. [Google Scholar]
- Zhang, Q.S.; Wang, D.M.; Li, S.C.; Zhang, X.; Tan, Y.H.; Wang, K. Development and application of model test system for inrush of water and mud of tunnel in fault rupture zone. Chin. J. Geotech. Eng. 2017, 39, 417–426. [Google Scholar]
- Xiexing, M.; Zhanqing, C.; Xianbiao, M.; Ronghua, C. The bifurcationof non-Darcy flow in post-failure rock. Acta Mech. Sin. 2003, 35, 660–667. [Google Scholar]
- Li, S.C.; Miao, X.X.; Chen, Z.Q. Non-linear dynamic analysis on non-Darcy seepage in over-broken rock mass. J. China Coal Soc. 2005, 30, 557–561. [Google Scholar]
- Chen, Z.Q.; Wang, L.Z.; Kong, H.L.; Yao, B.H. Study on non-linear seepage test of variable mass of broken rock. Saf. Coal Mines 2014, 45, 15–21. [Google Scholar]
- Wang, J.A.; Park, H.D. Coal mining above a confined aquifer. Int. J. Rock Mech. Min. 2003, 40, 537–551. [Google Scholar] [CrossRef]
- Font-Capó, J.; Vázquez-Suñé, E.; Carrera, J.; Martí, D.; Carbonell, R.; Pérez-Estaun, A. Groundwater inflow prediction in urban tunneling with a tunnel boring machine (TBM). Eng. Geol. 2011, 121, 46–54. [Google Scholar] [CrossRef]
- Zhang, X.S.; Wong, H.; Leo, C.J.; Bui, T.A.; Wang, J.X.; Sun, W.H.; Huang, Z.Q. A Thermodynamics-Based Model on the Internal Erosion of Earth Structures. Geotech. Geol. Eng. 2013, 31, 479–492. [Google Scholar] [CrossRef]
- Bonelli, S.; Marot, D. Micromechanical modeling of internal erosion. J. Environ. Civ. Eng. 2011, 15, 1207–1224. [Google Scholar] [CrossRef]
- Fell, R.; Wan, C.F.; Cyganiewicz, J.; Foster, M. Time for Development of Internal Erosion and Piping in Embankment Dams. J. Geotech. Geoenviron. Eng. 2003, 129, 307–314. [Google Scholar] [CrossRef]
- Yerro, A.; Rohe, A.; Soga, K. Modelling Internal Erosion with the Material Point Method. Procedia Eng. 2017, 175, 365–372. [Google Scholar] [CrossRef]
- Rönnqvist, H.; Fannin, J.; Viklander, P. On the use of empirical methods for assessment of filters in embankment dams. Geotech. Lett. 2014, 4, 272–282. [Google Scholar] [CrossRef]
- Liu, J.; Chen, W.; Nie, W.; Yuan, J.; Dong, J. Experimental research on the mass transfer and flow properties of water inrush in completely weathered granite under different particle size distributions. Rock Mech. Rock Eng. 2019, 52, 2141–2153. [Google Scholar] [CrossRef]
- Liu, J.; Zhou, C. Permeability-porosity relation during erosion-induced water inrush: Experimental and theoretical investigations. Transp. Geotech. 2023, 38, 100893. [Google Scholar] [CrossRef]
- Kong, F.; Xue, Y.; Gong, H.; Jiang, X.; Song, Q.; Fu, Y.; Fu, K. The formation mechanism of dynamic water and mud inrush geohazard triggered by deep-buried tunnel crossing active fault: Insights from the geomechanical model test. Tunn. Undergr. Space Technol. 2023, 142, 105437. [Google Scholar] [CrossRef]
- Li, S.C.; Wu, J.; Xu, Z.H.; Li, L.P. Unascertained measure model of water and mud inrush risk evaluation in karst tunnels and its engineering application. KSCE J. Civ. Eng. 2016, 21, 1170–1182. [Google Scholar] [CrossRef]
- Sterpi, D. Effects of the Erosion and Transport of Fine Particles due to Seepage Flow. Int. J. Géoméch. 2003, 3, 111–122. [Google Scholar] [CrossRef]
- Cividini, A.; Gioda, G. Finite-Element Approach to the Erosion and Transport of Fine Particles in Granular Soils. Int. J. Géoméch. 2004, 4, 191–198. [Google Scholar] [CrossRef]
- Papamichos, E.; Vardoulakis, I. Sand erosion with a porosity diffusion law. Comput. Geotech. 2005, 32, 47–58. [Google Scholar] [CrossRef]
- Bear, J. Dynamics of Fluids in Porous Media; American Elsevier: New York, NY, USA, 1972. [Google Scholar]
- Li, T.; Mei, T.; Sun, X.; Lv, Y.; Sheng, J.; Cai, M. A study on a water-inrush incident at Laohutai coalmine. Int. J. Rock Mech. Min. Sci. 2013, 59, 151–159. [Google Scholar] [CrossRef]
- Yang, T.; Chen, S.; Zhu, W.; Meng, Z.; Gao, Y. Water inrush mechanism in mines and monlinear flow model for fractured rocks. Chin. J. Rock Mech. Eng. 2008, 27, 1411–1416. [Google Scholar]
- Xue, Y.-Q. Principle of Groundwater Dynamics; Geological Publishing House: Beijing, China, 1986. [Google Scholar]
- Brinkman, H.C. A calculation of the viscous force exerted by a flowing fluid on a dense swarm of particles. Appl. Sci. Res. 1949, 1, 27–34. [Google Scholar] [CrossRef]
- Hill, A.A.; Carr, M. Nonlinear stability of the one-domain approach to modelling convection in superposed fluid and porous layers. Proc. R. Soc. A. Math. Phys. Eng. Sci. 2010, 466, 2695–2705. [Google Scholar] [CrossRef]
- Rahmati, H.; Jafarpour, M.; Azadbakht, S.; Nouri, A.; Vaziri, H.; Chan, D.; Xiao, Y. Review of sand production prediction models. J. Pet. Eng. 2013, 2013, 864981. [Google Scholar] [CrossRef]
- Vardoulakis, I.; Stavropoulou, M.; Papanastasiou, P. Hydromechanical aspects of the sand production problem. Transp. Porous Med. 1996, 22, 225–244. [Google Scholar] [CrossRef]
- Zhang, Q.Y.; Chen, W.Z.; Yuan, J.Q.; Liu, L.Q.; Rong, C. Experimental study on evolution characteristics of water and mud inrush in fault fractured zone. Rock Soil Mech. 2020, 41, 1911–1922. [Google Scholar]
- Wang, D.-M.; Zhang, Q.-S.; Zhang, X.; Wang, K.; Tan, Y.-H. Model experiment on inrush of water and mud and catastrophic evolution in a fault fracture zone tunnel. Rock Soil Mech. 2016, 37, 2851–2860. [Google Scholar]
- Tan, Y. Evolutionary Mechanism of Mud Bursting through Water-Inrich Fault in Tunnels and Engineering Applications. Master’s Thesis, Shandong University, Jinan, China, 2017. [Google Scholar]


| Initial porosity φ0 | 0.35 |
| Initial fluidized grain concentration c0 | 0.01 |
| Pore pressure on the outer boundary pd/MPa | 0 |
| Upper-pressure boundary pu/MPa | 1.0/0.7/0.4 |
| Coefficient λ/m−1 | 4 |
| Real density of fluid qρw/kgm−3 | 1000 |
| Real density of grains ρs/kgm−3 | 2650 |
| Kinematic viscosity of fluid ηk/m2s−1 | 1 × 10⁻⁶ |
| Initial permeability k0/m2 | 5 × 10⁻¹² |
| Initial porosity φ0 | 0.35 |
| Initial porosity φ0 | 0.3 |
| Initial fluidized grain concentration c0 | 0.05 |
| Pore water pressure on the upper boundary pd/MPa | 0 |
| Pore water pressure on the bottom boundary pd/MPa | 3.6 |
| Coefficient λ of fault/m−1 | 4 |
| Coefficient λ of surrounding rock/m−1 | 0.01 |
| Real density of grains ρs/kgm−3 | 2650 |
| Fluid viscosity ηk/m2s−1 | 1 × 10⁻⁶ |
| Initial permeability k0 of fault/m2 | 5 × 10⁻¹² |
| Initial permeability k0 of surrounding rock/m2 | 1 × 10⁻¹³ |
Disclaimer/Publisher’s Note: The statements, opinions and data contained in all publications are solely those of the individual author(s) and contributor(s) and not of MDPI and/or the editor(s). MDPI and/or the editor(s) disclaim responsibility for any injury to people or property resulting from any ideas, methods, instructions or products referred to in the content. |
© 2024 by the authors. Licensee MDPI, Basel, Switzerland. This article is an open access article distributed under the terms and conditions of the Creative Commons Attribution (CC BY) license (https://creativecommons.org/licenses/by/4.0/).
Share and Cite
Zhang, Q.; Zhou, X. Modeling the Dynamics of Water and Mud Inrush in Fault Fracture Zones: The Role of Seepage–Erosion Interactions. Appl. Sci. 2024, 14, 5115. https://doi.org/10.3390/app14125115
Zhang Q, Zhou X. Modeling the Dynamics of Water and Mud Inrush in Fault Fracture Zones: The Role of Seepage–Erosion Interactions. Applied Sciences. 2024; 14(12):5115. https://doi.org/10.3390/app14125115
Chicago/Turabian StyleZhang, Qingyan, and Xiaowen Zhou. 2024. "Modeling the Dynamics of Water and Mud Inrush in Fault Fracture Zones: The Role of Seepage–Erosion Interactions" Applied Sciences 14, no. 12: 5115. https://doi.org/10.3390/app14125115
APA StyleZhang, Q., & Zhou, X. (2024). Modeling the Dynamics of Water and Mud Inrush in Fault Fracture Zones: The Role of Seepage–Erosion Interactions. Applied Sciences, 14(12), 5115. https://doi.org/10.3390/app14125115