
Risk Assessment of Landfalling Tropical Cyclones in China Based on Hazard Risk Theory
Abstract
:1. Introduction
2. Materials and Methods
2.1. Data
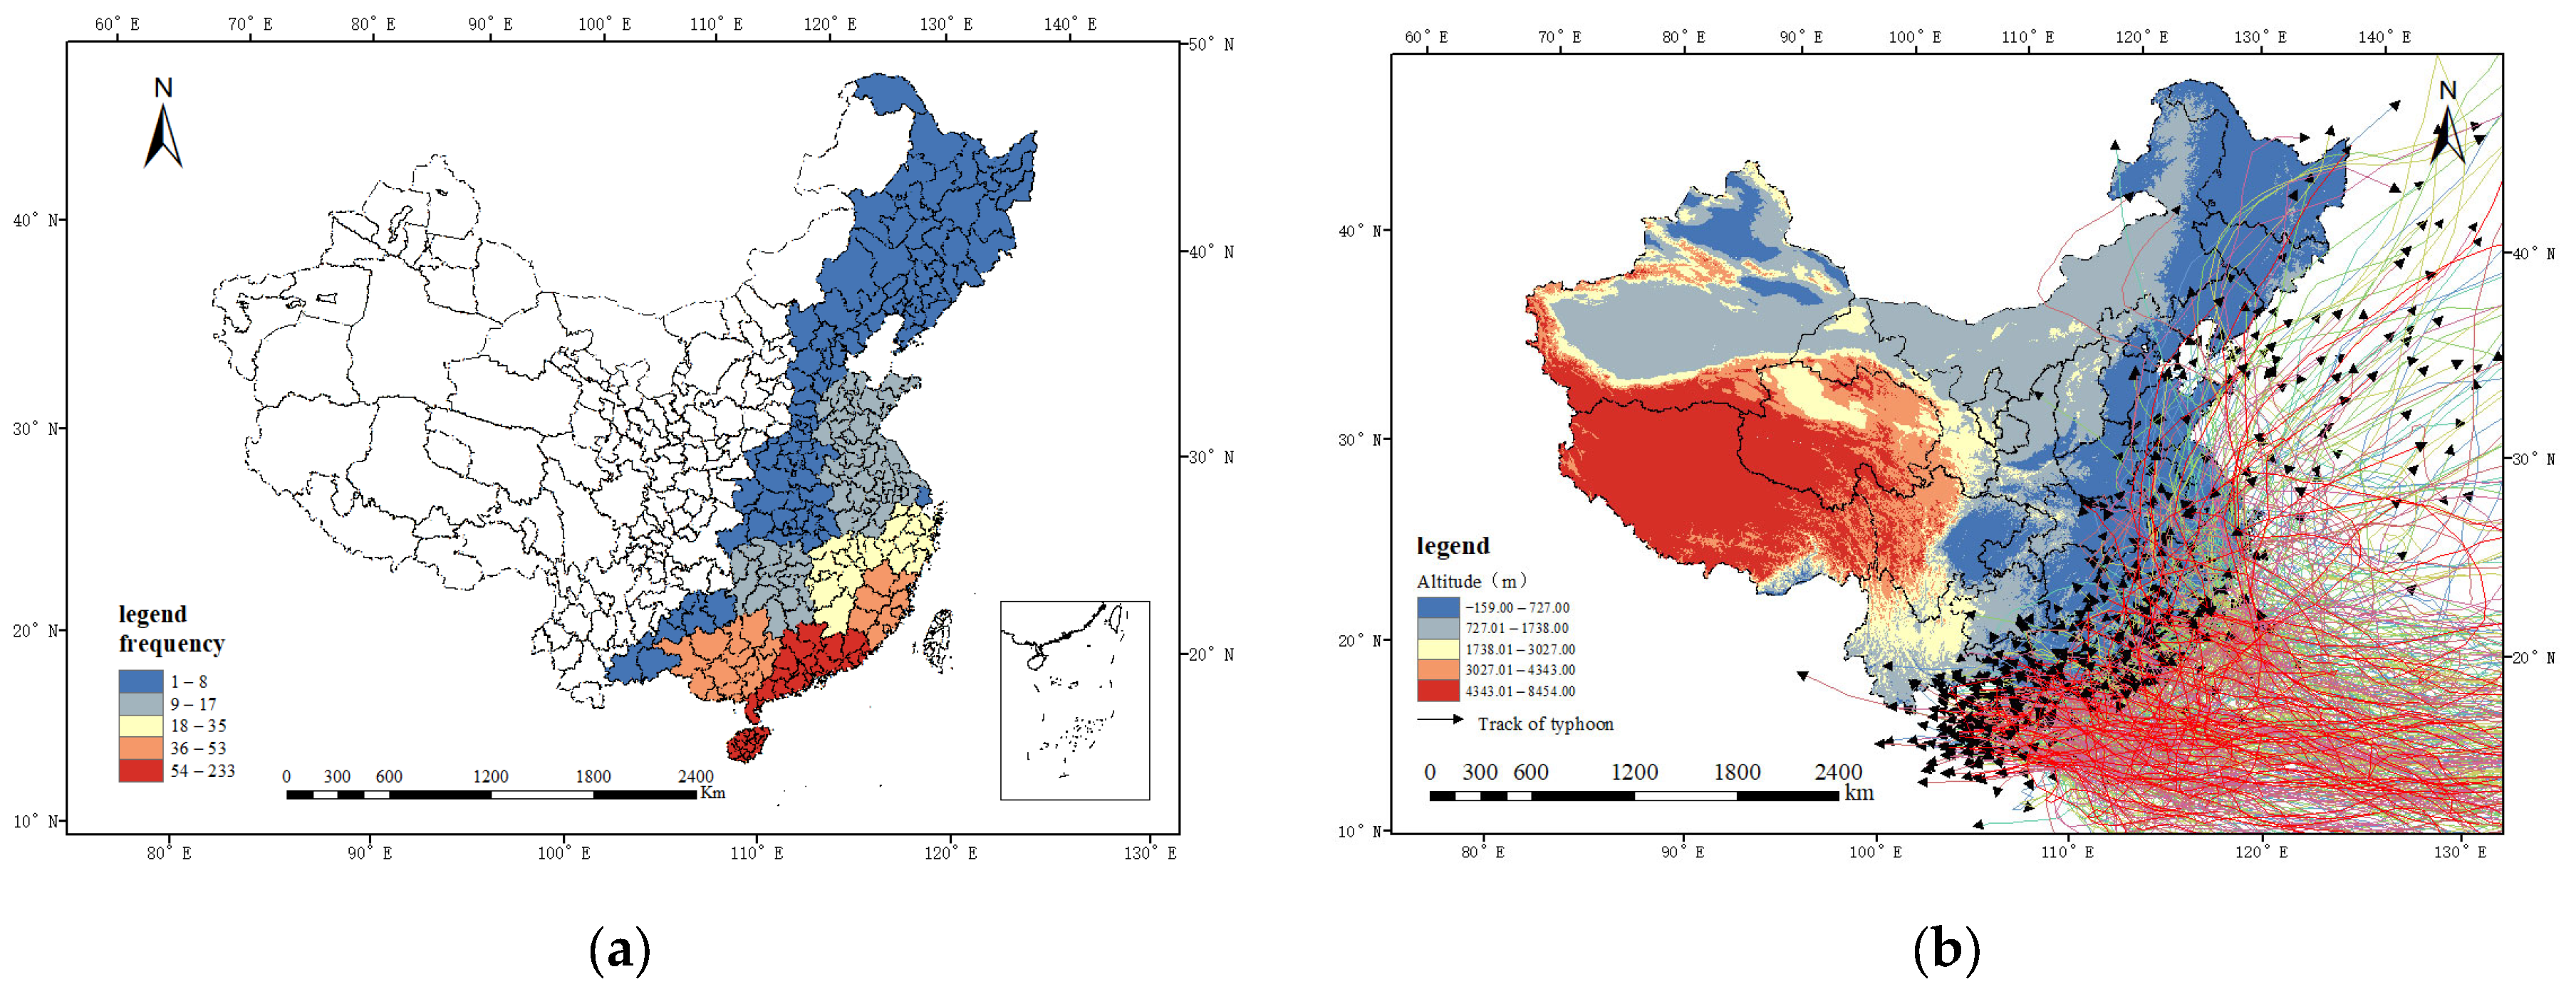
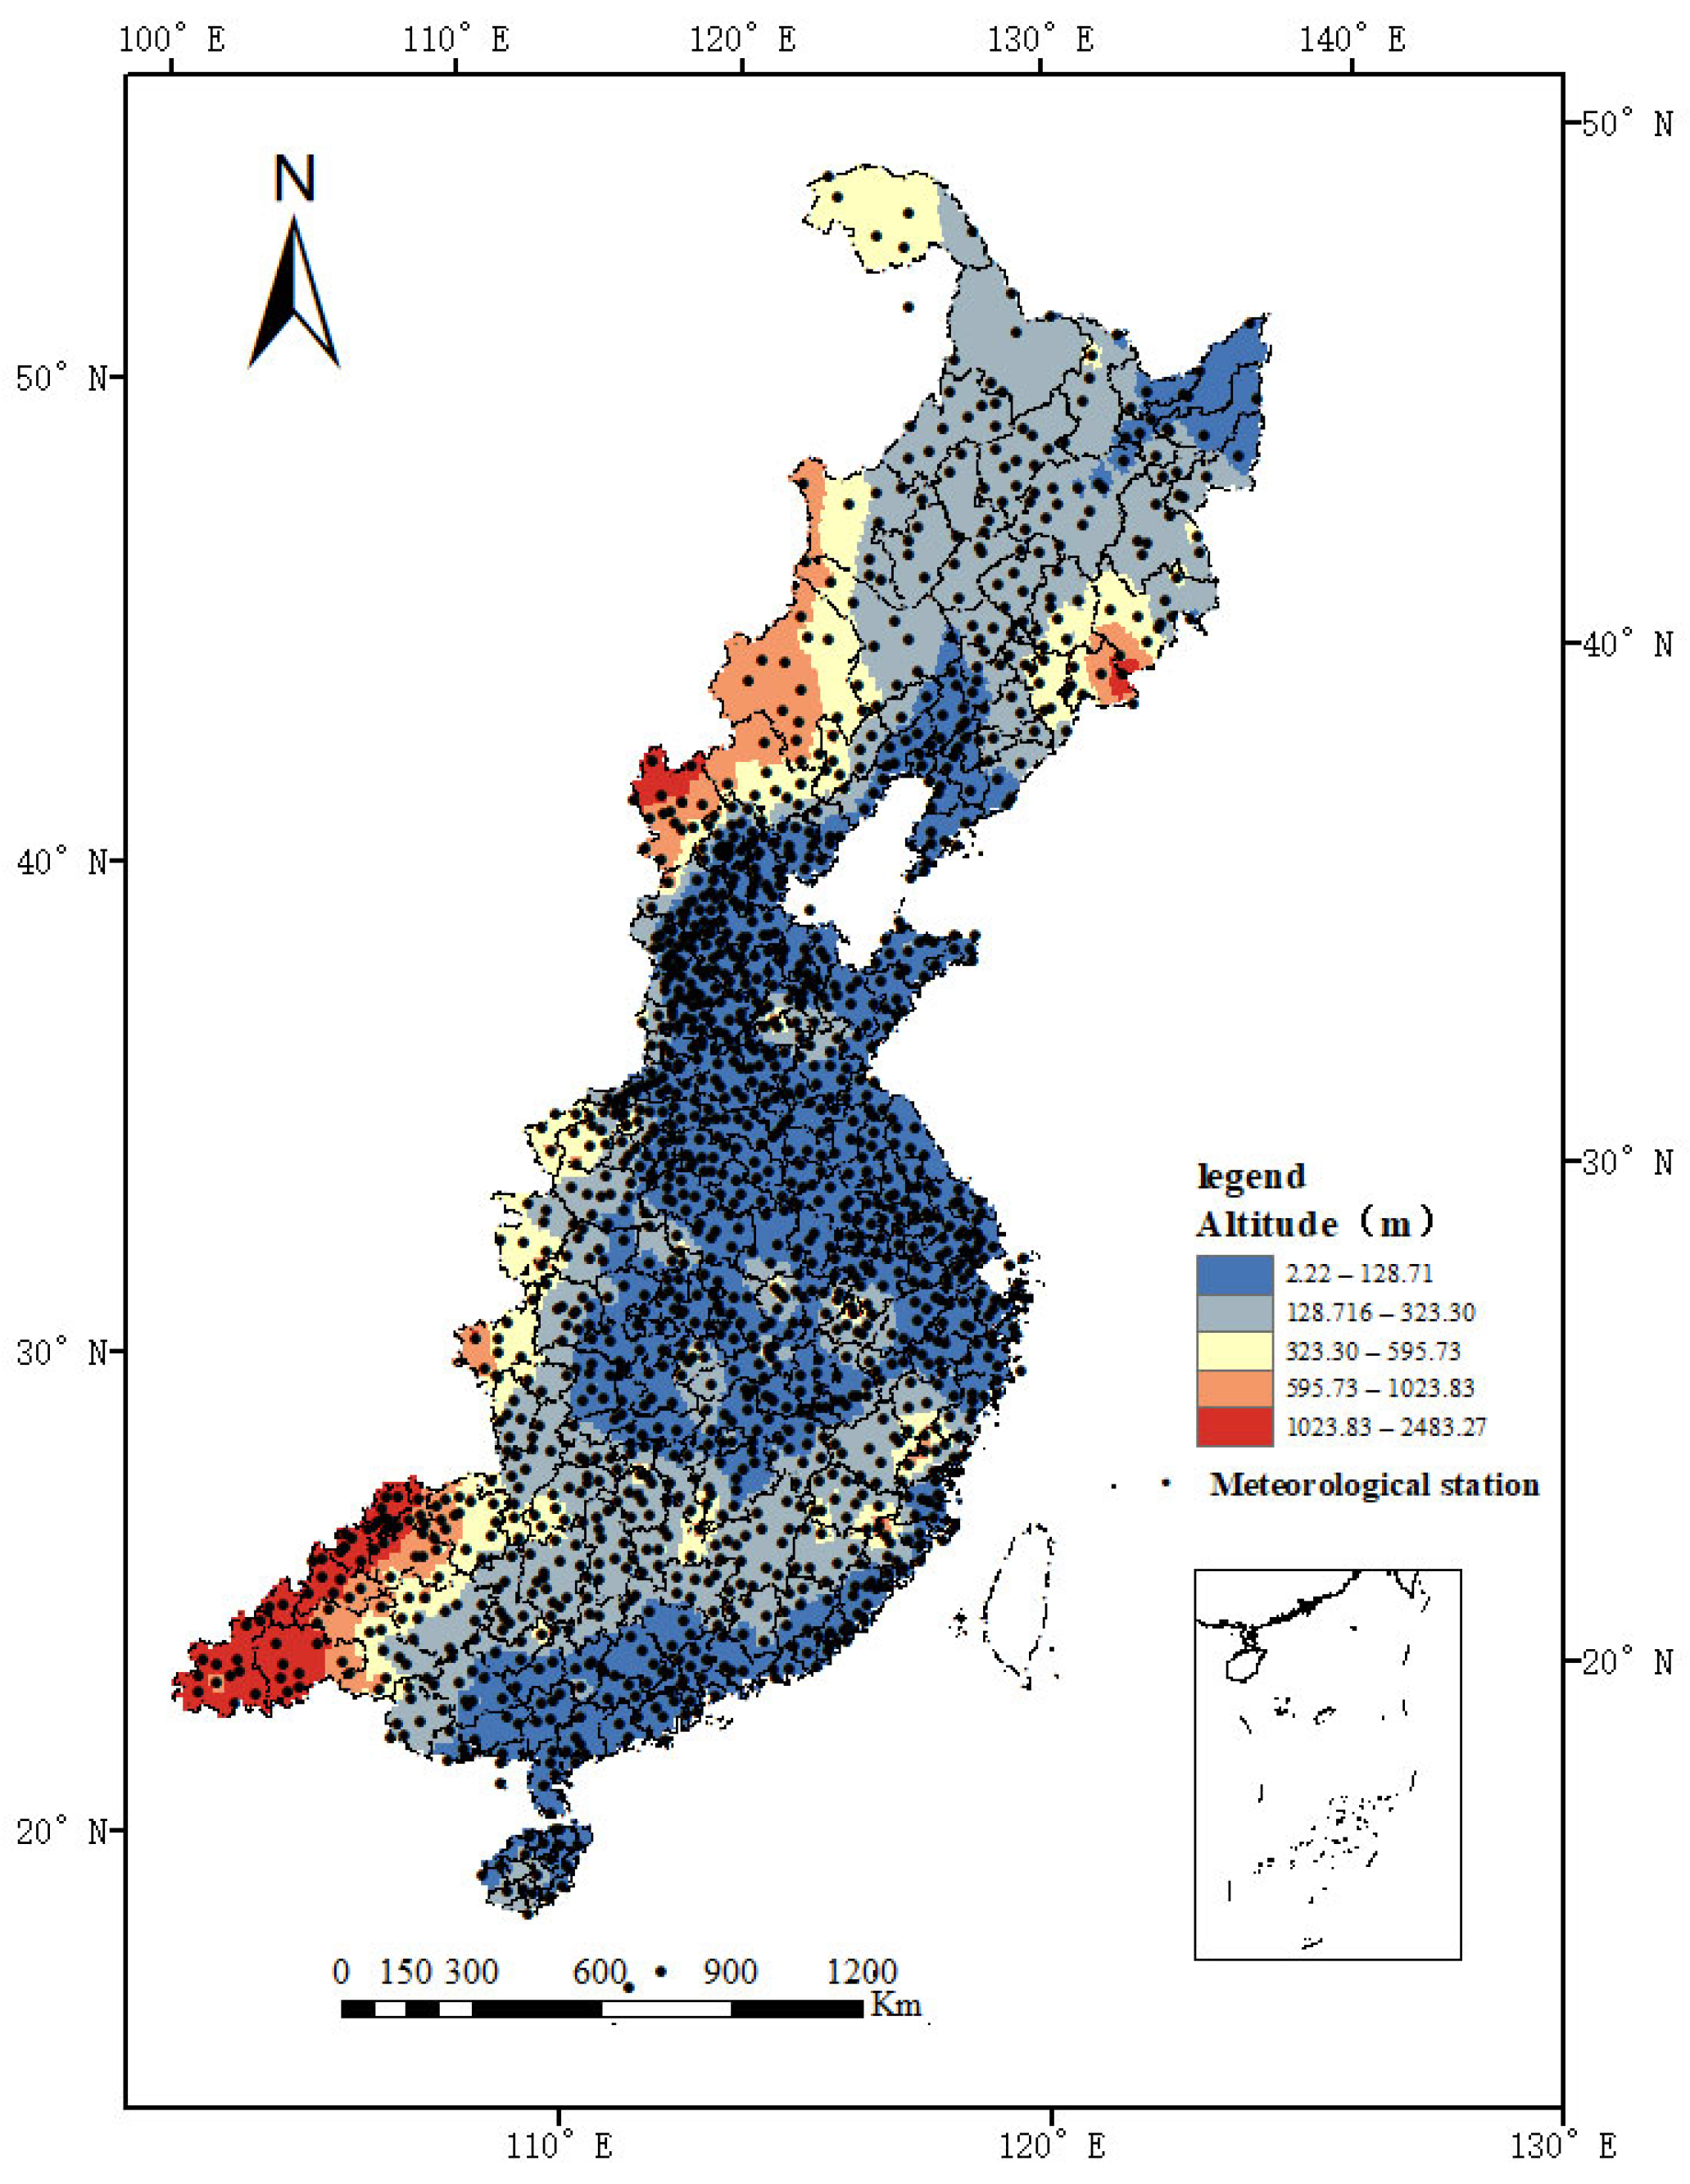
2.2. Study Area
2.3. Methodology
2.3.1. Integrated Risk Assessment Theory for Tropical Cyclone Hazards
2.3.2. Analytic Hierarchy Process
2.3.3. ArcGIS Spatial Analysis
- Inverse Distance Weighting
- 2.
- ANUSPLIN Spatial Interpolation
2.3.4. Data Standardization
2.3.5. Processing of Evaluation Indicators and Calculation of Weights
- The Hazard of Hazard-Causing Factors
- 2.
- Sensitivity of Natural Carriers
- 3.
- Integrated Risk of Tropical Cyclone Hazards
3. Results and Discussion
3.1. Analysis of the Characteristics of Tropical Cyclone Hazards in China
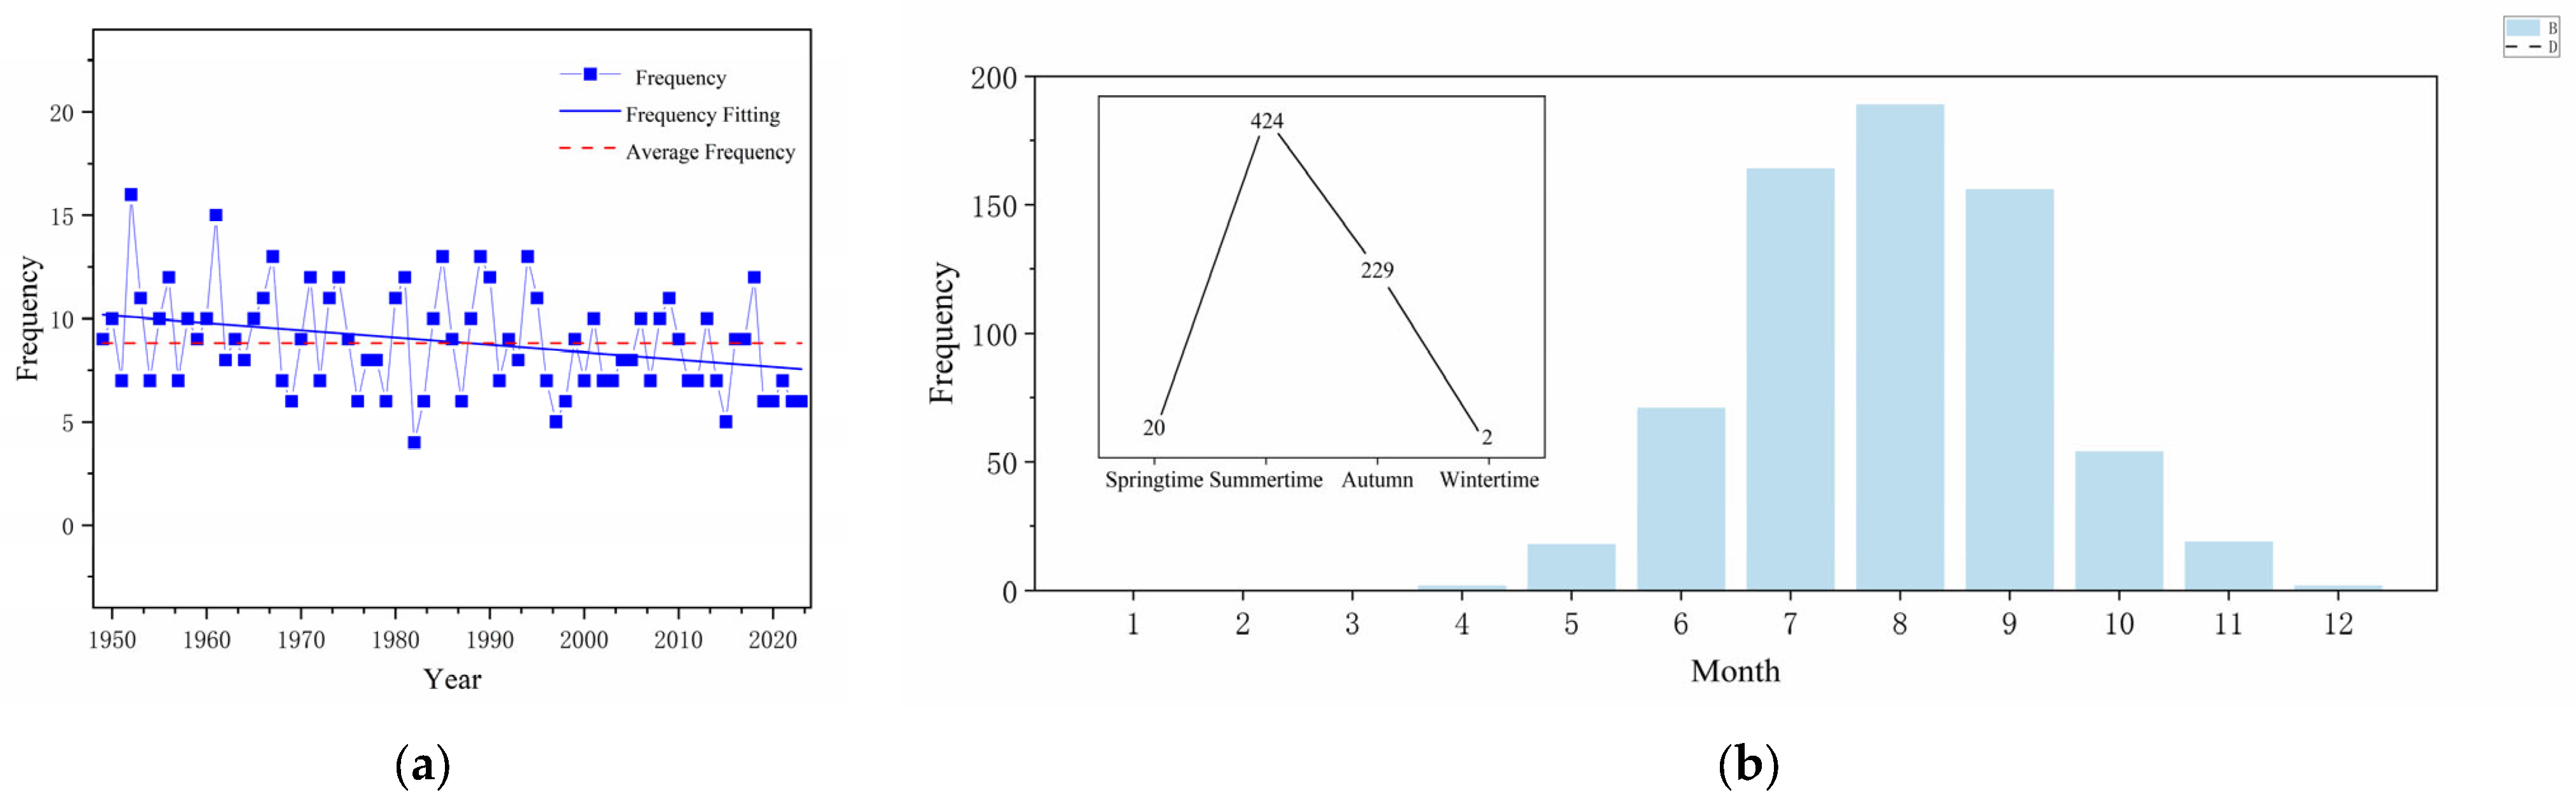
3.1.1. Temporal Distribution Characteristics of Landfalling Tropical Cyclones
3.1.2. Distribution Characteristics of the Impact Intensity of Landfalling Tropical Cyclones
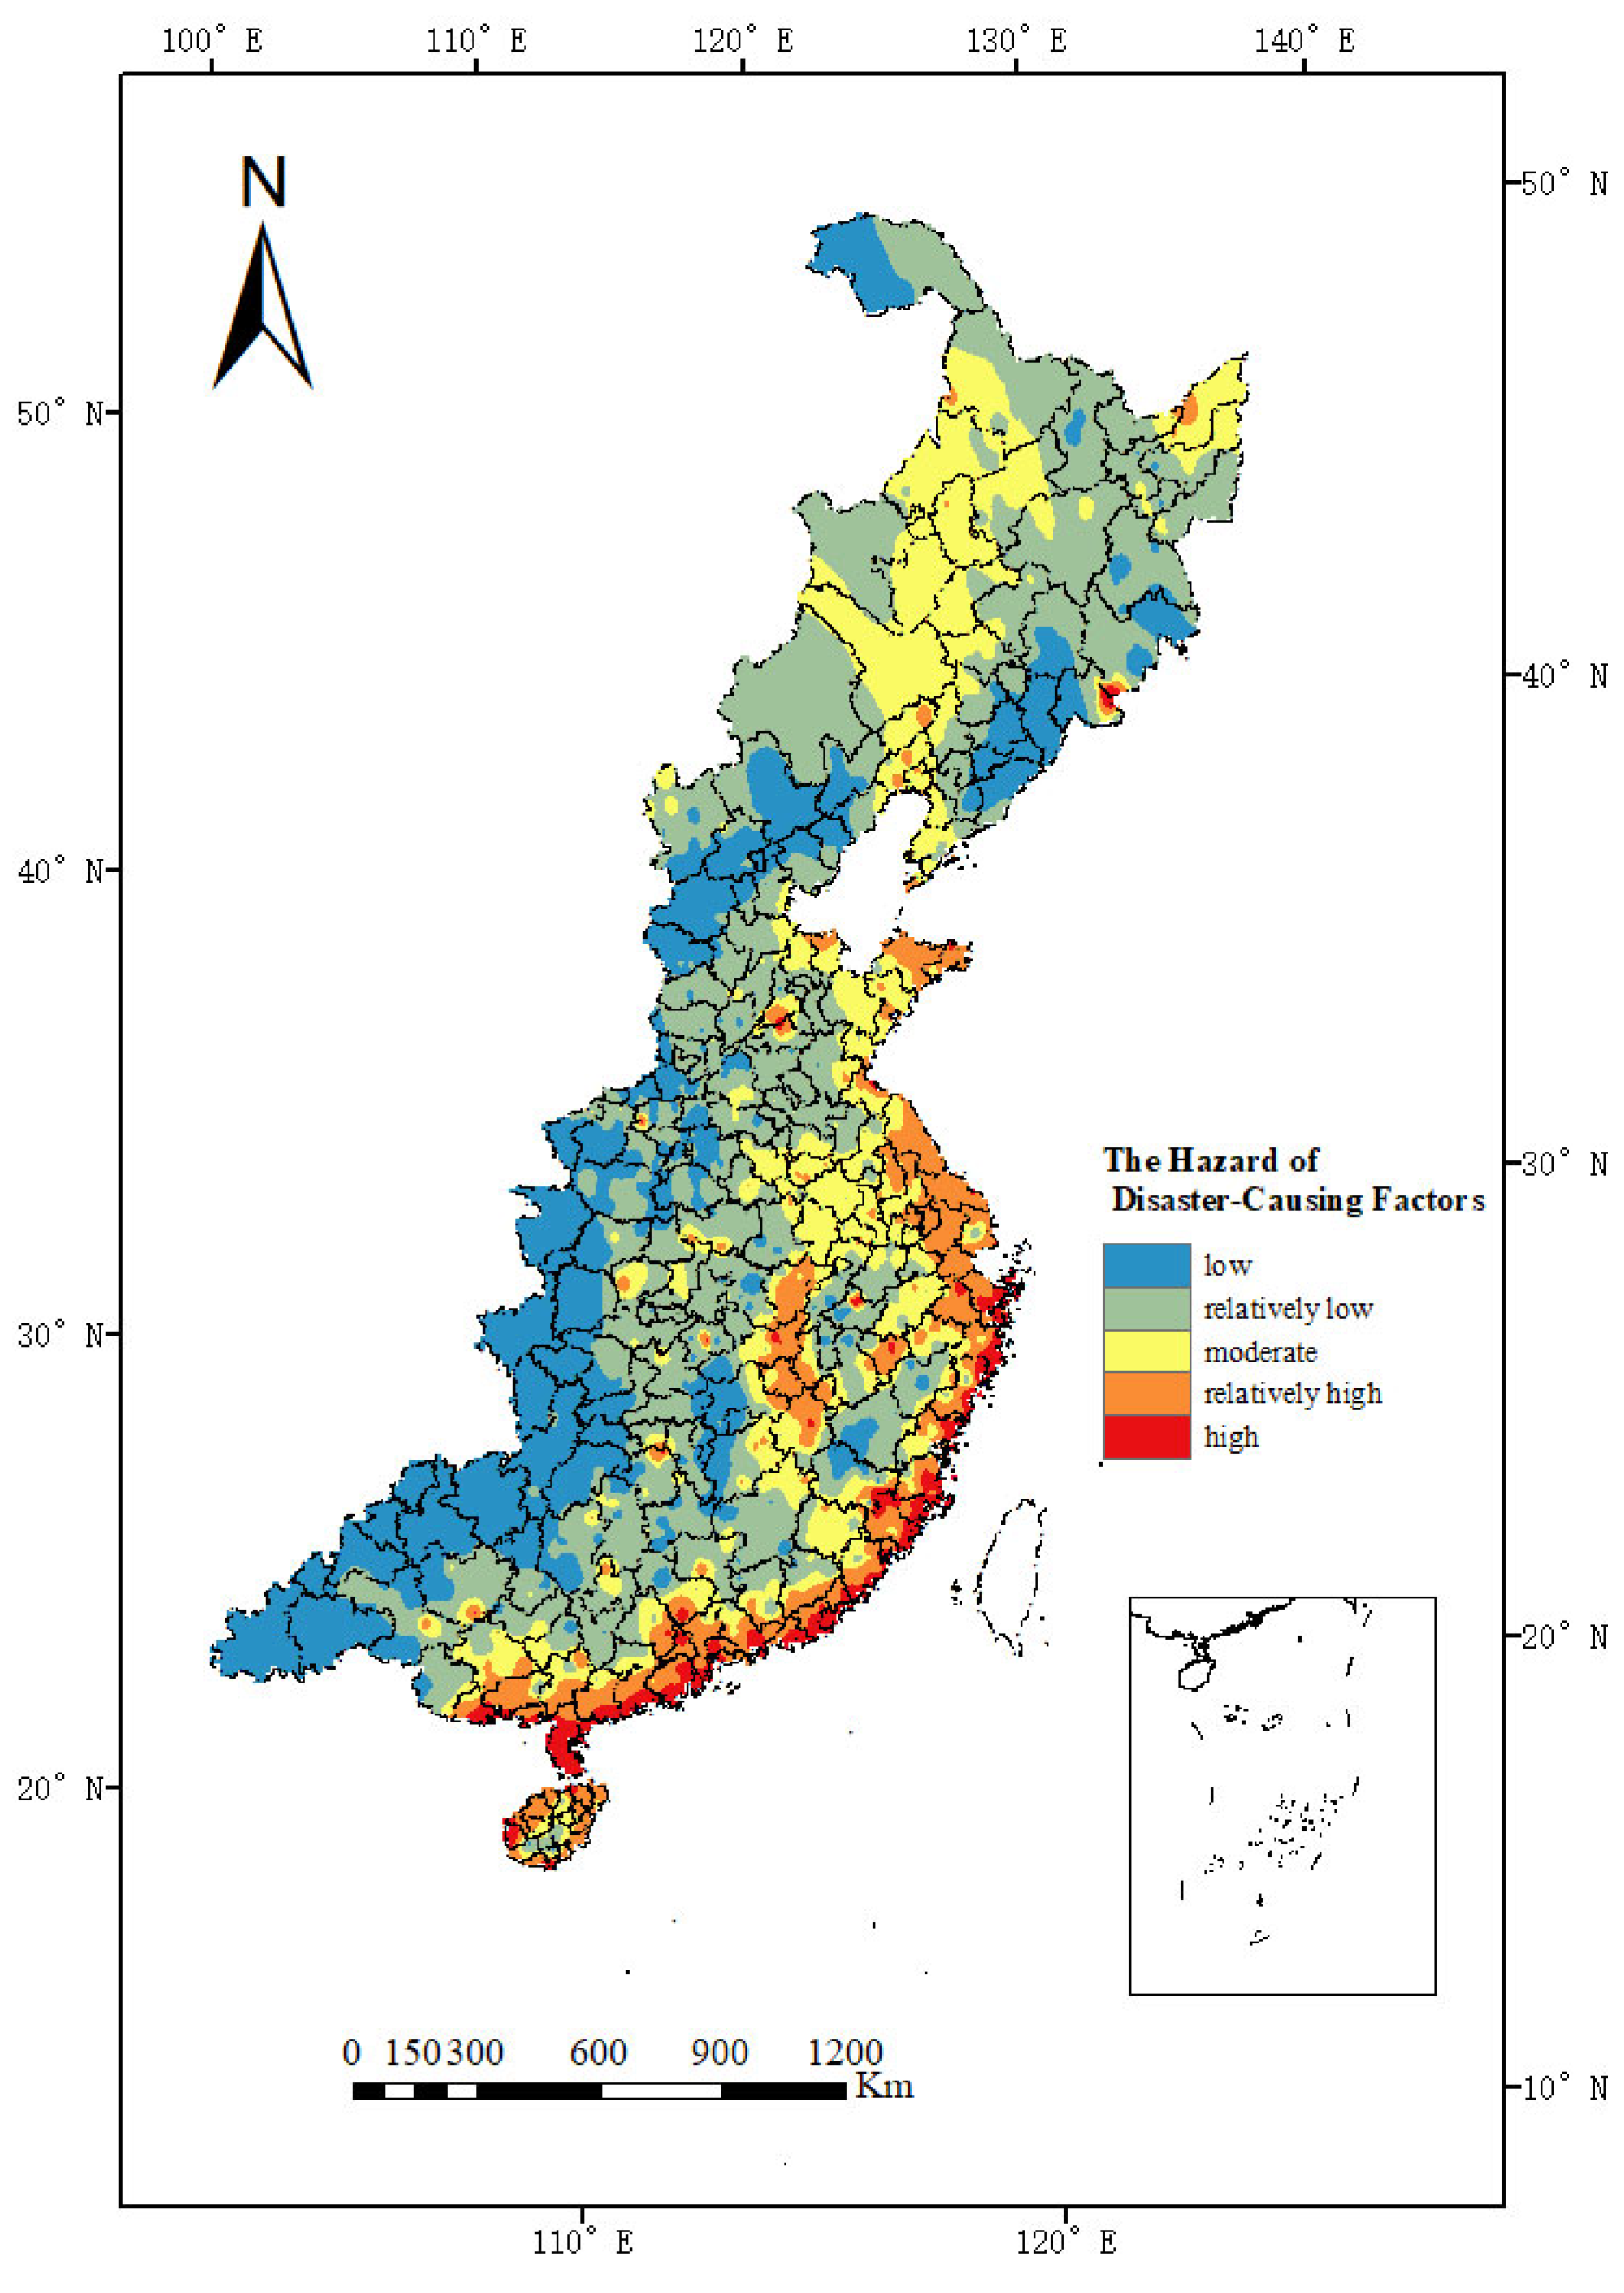
3.2. Hazard Analysis and Assessment of Causative Factors
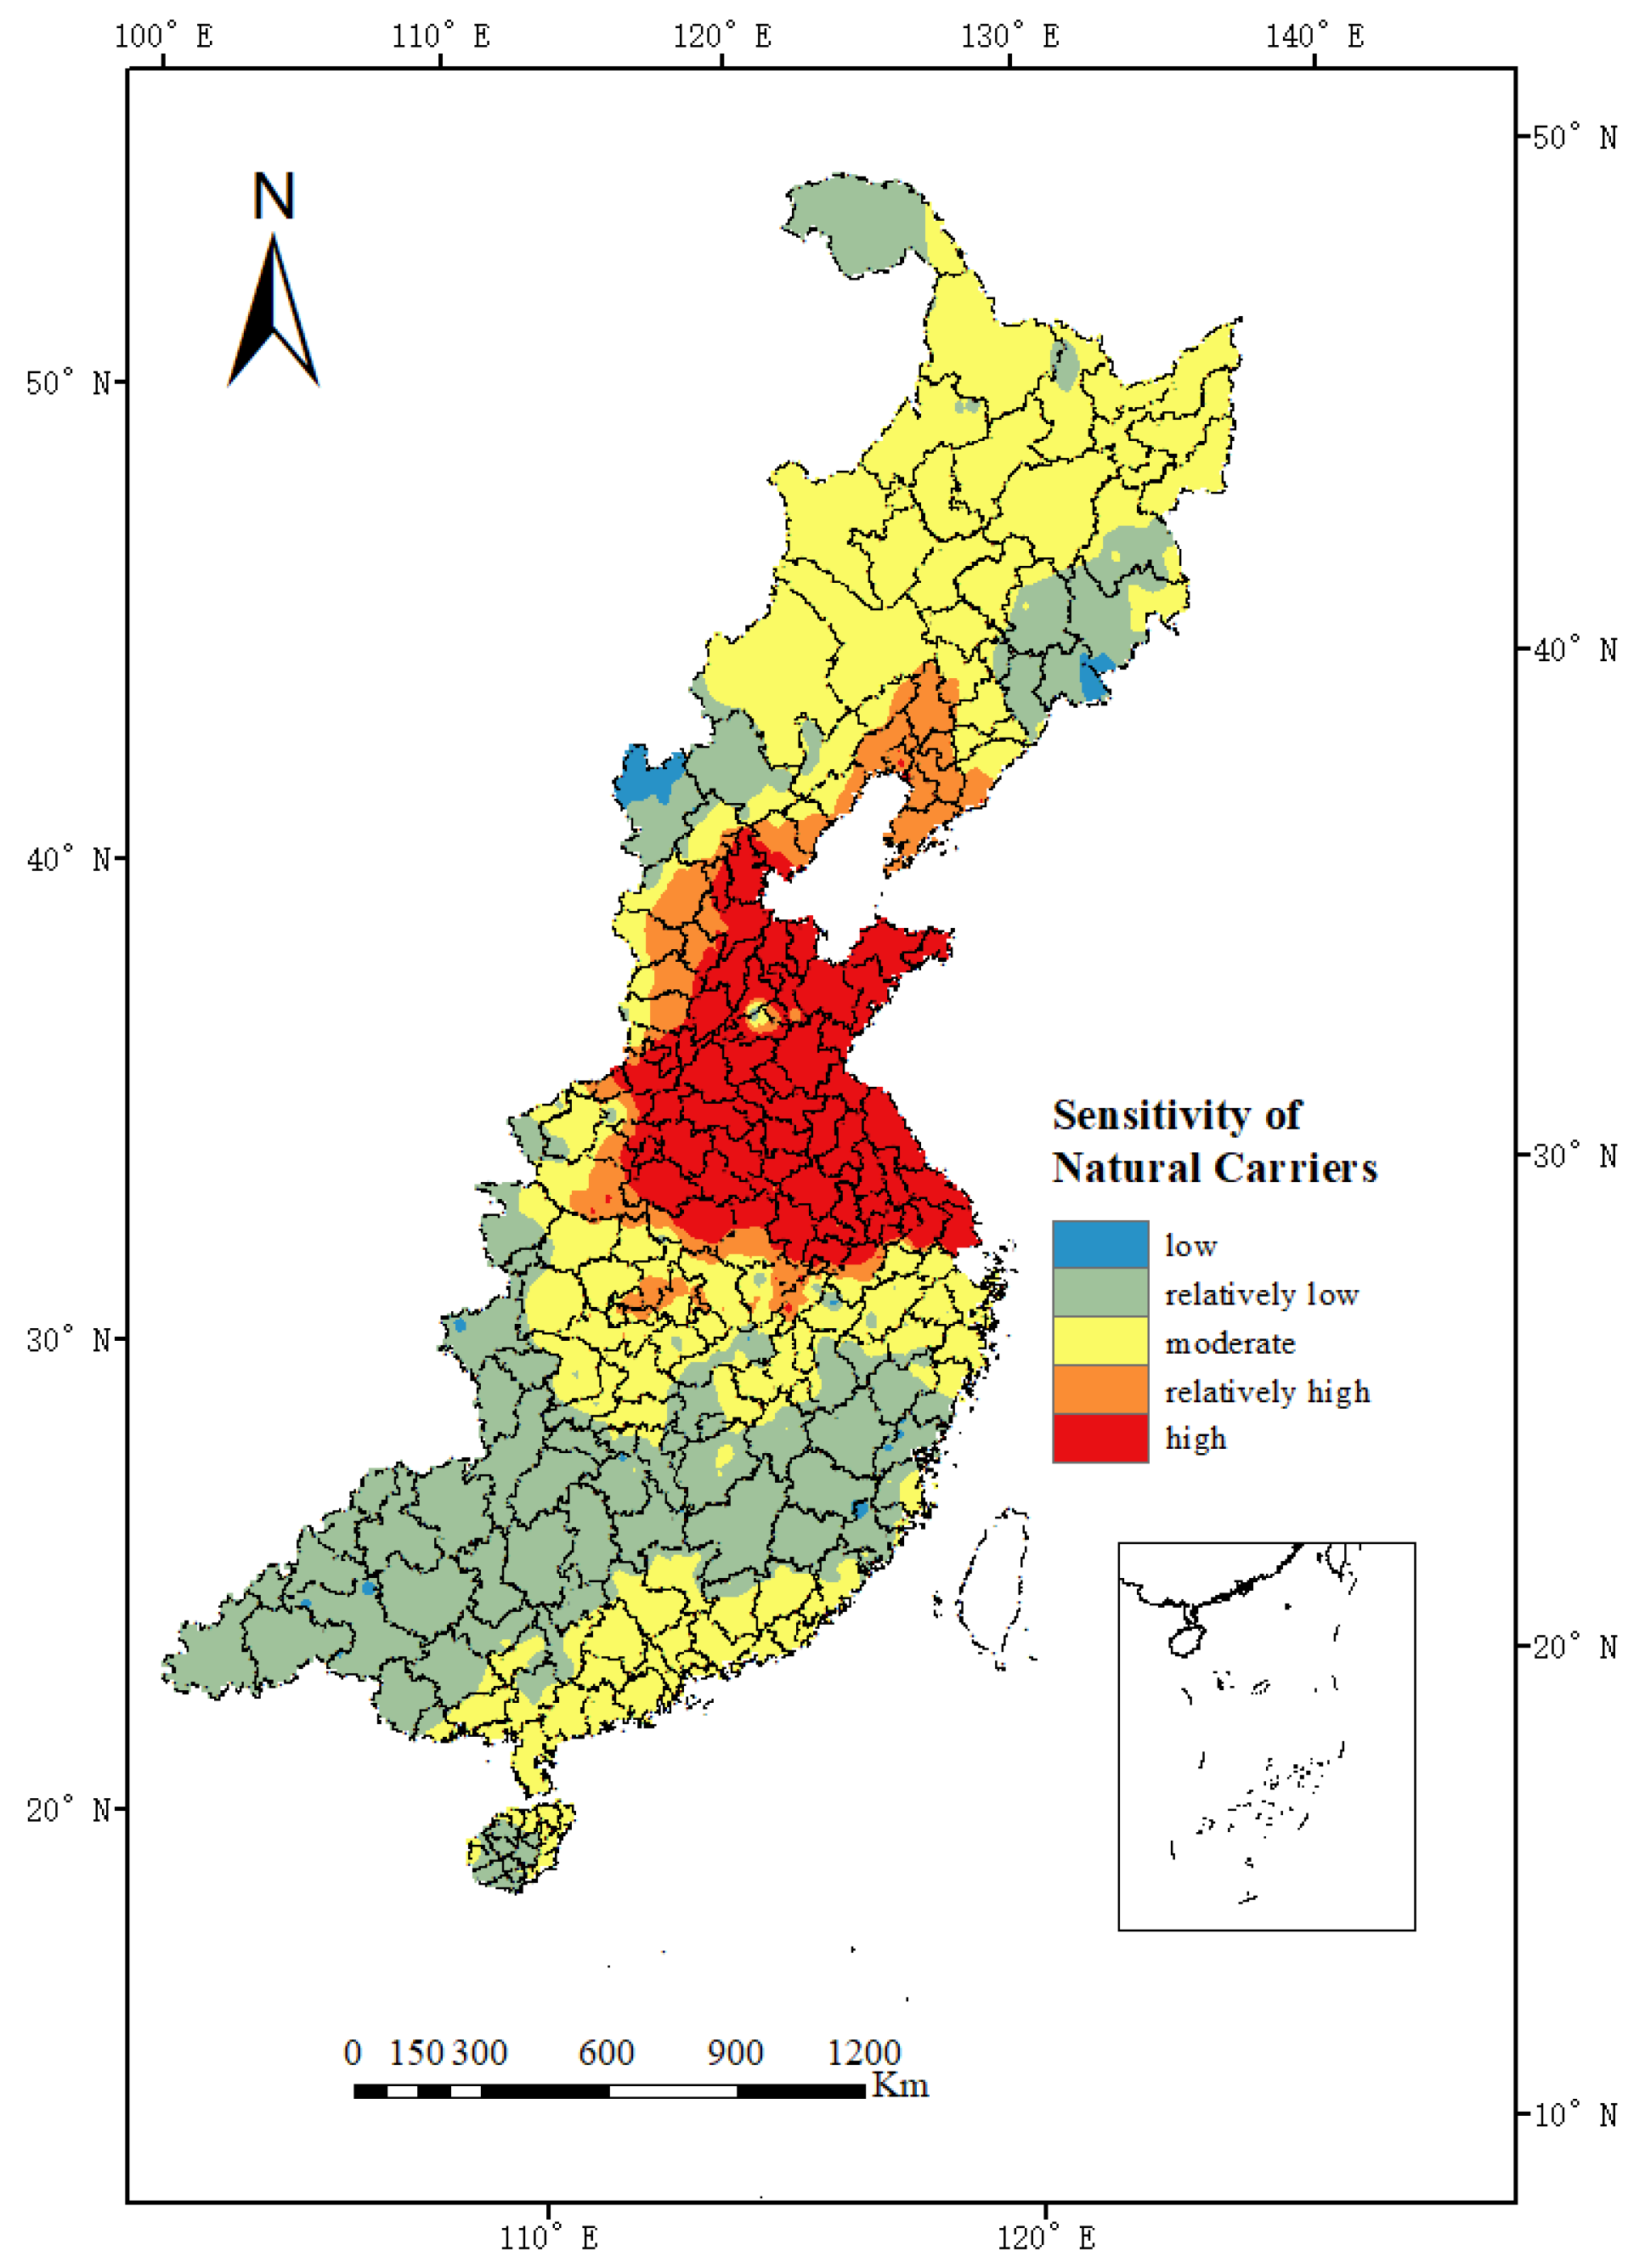
3.3. Sensitivity Analysis and Assessment of Natural Carriers
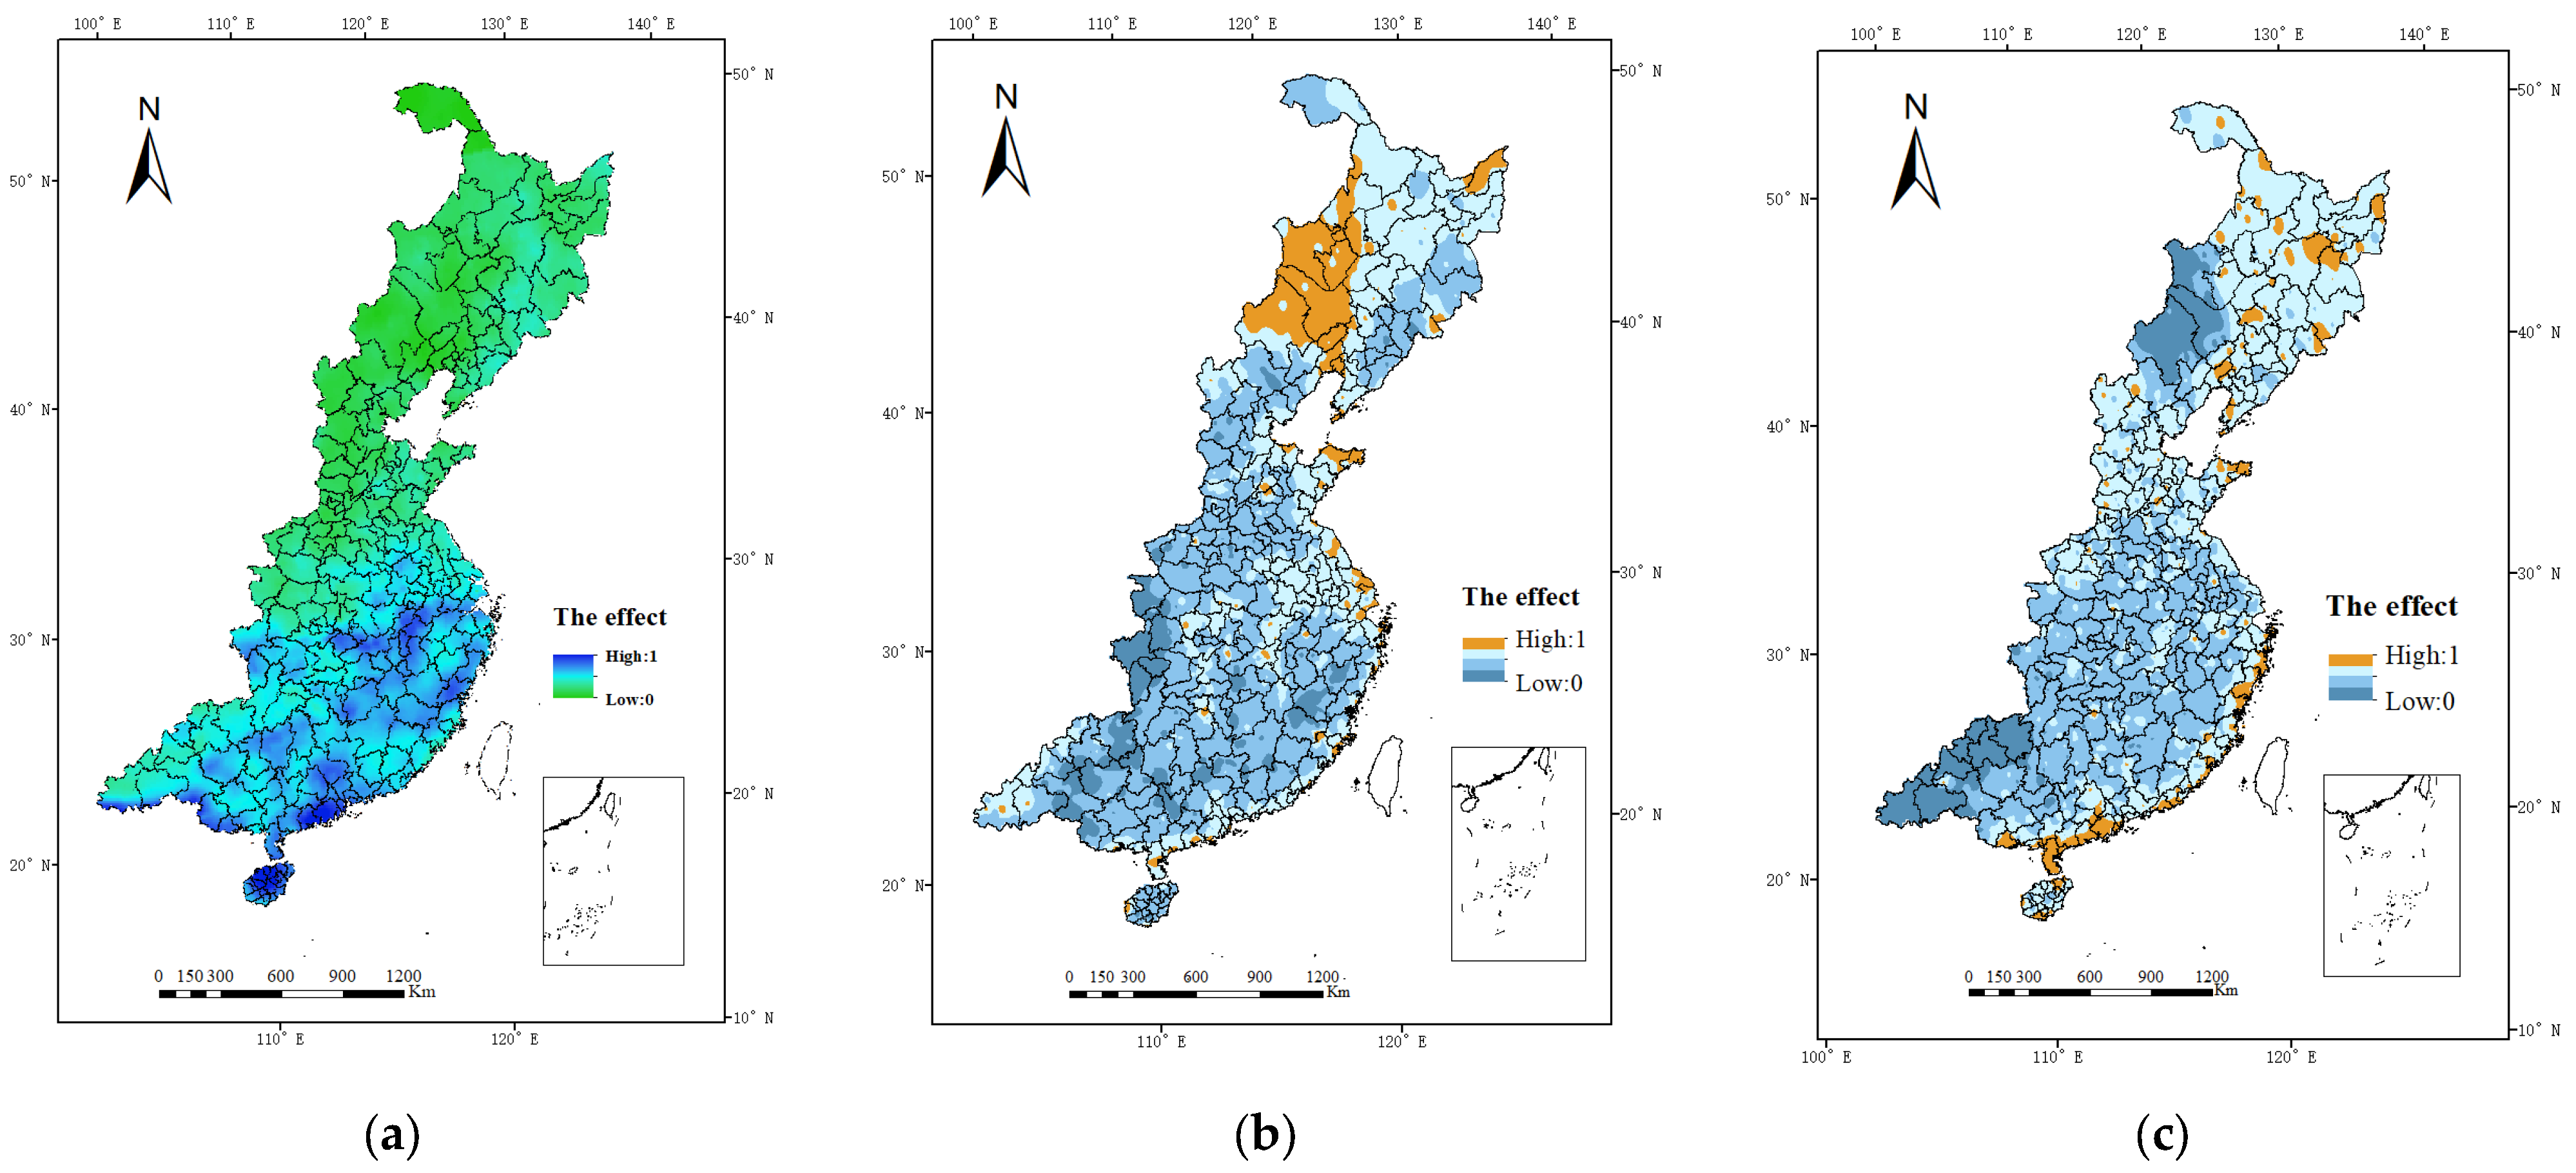
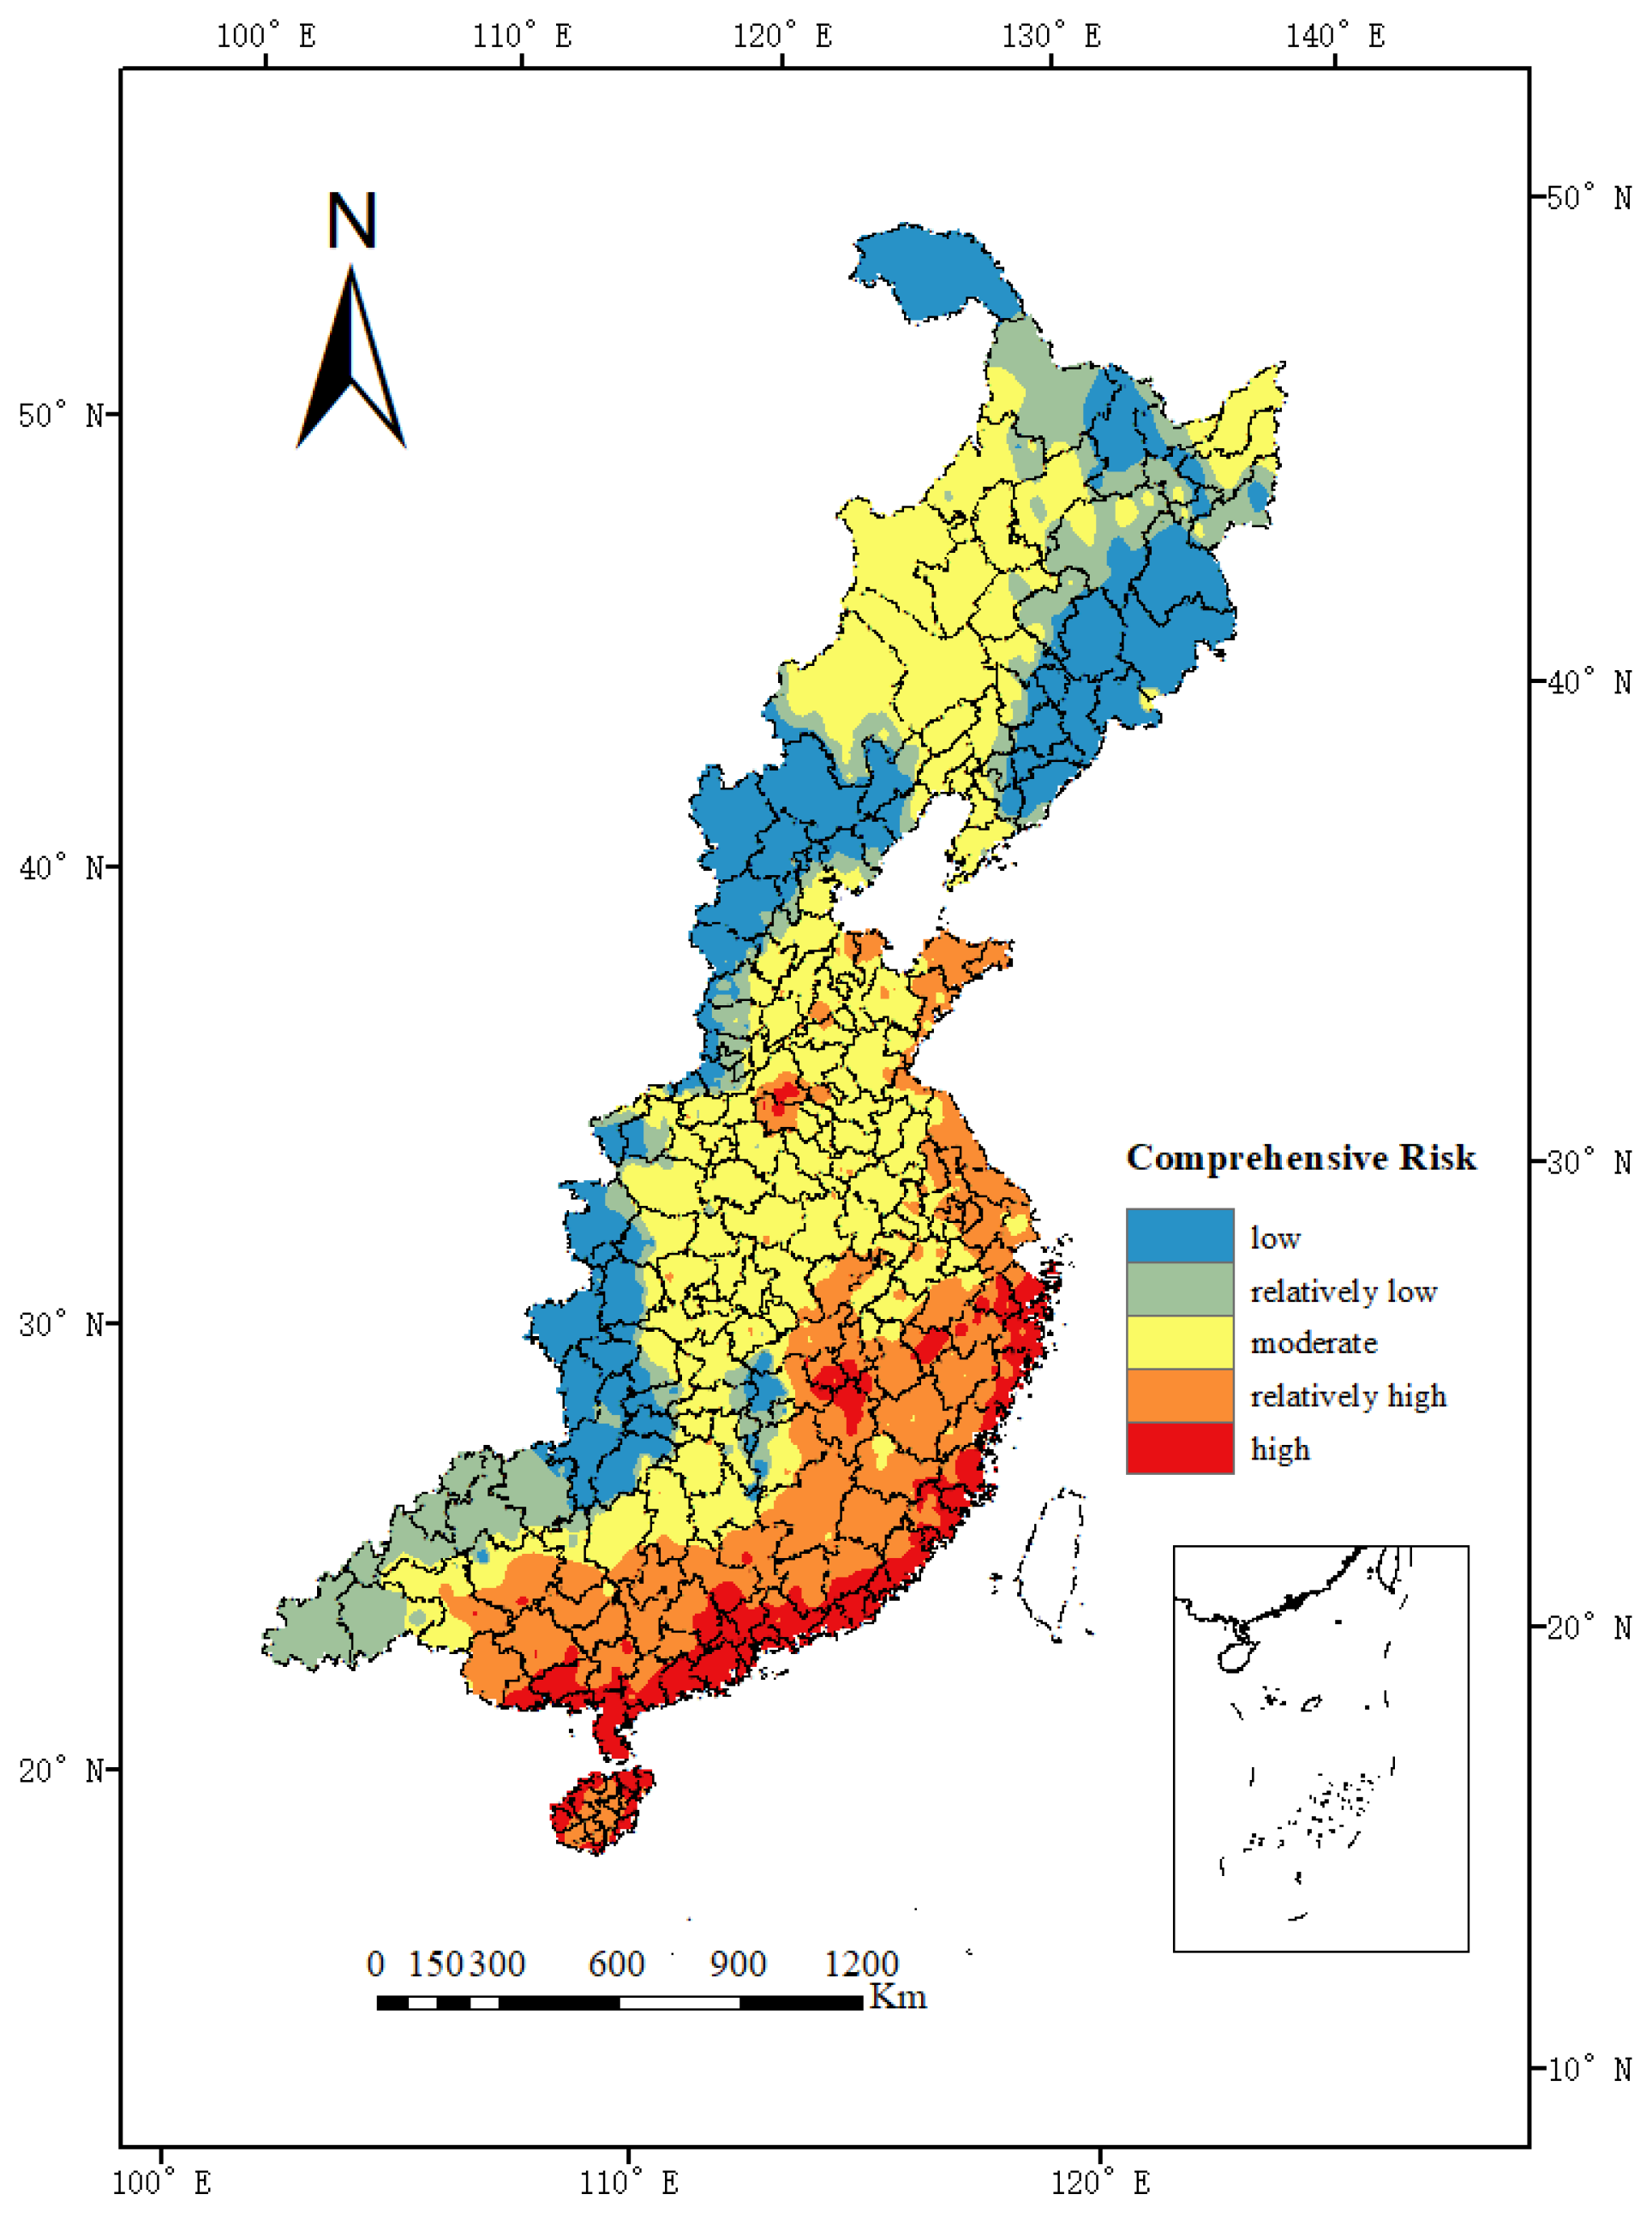
3.4. Comprehensive Risk Analysis and Assessment of Tropical Cyclone Hazards
4. Conclusions
- Between 1949 and 2023, the overall number of tropical cyclone landfalls showed a fluctuating downward trend, with landfall frequency staying below the mean after 1986. In terms of intensity, strong tropical storms and typhoons accounted for the highest proportion, at 50.6% of the total, over the past 75 years. After 1980, the intensity of tropical cyclones making landfall in China increased by 12.4% to 14.7%. Landfalls primarily occurred from June to October each year, with August being the peak month. The occurrence of strong typhoons has gradually shifted from autumn to late summer, leading to more frequent typhoon events in the summer. Therefore, prevention efforts against tropical cyclone hazards should be intensified, particularly in summer and autumn.
- Along the eastern coastal areas of China, the hazard susceptibility due to the direct impacts of typhoons is highest, then gradually decreases inland. Some areas in Jiangxi Province experience abundant precipitation, while central Liaoning, Jilin, and western Heilongjiang are influenced by Mongolian cyclones, resulting in persistently high average daily wind speeds and significantly higher hazard levels, when compared to surrounding areas.
- The sensitivity of the natural environment is concentrated mainly in central Liaoning, Tianjin, eastern Hebei, Shandong, eastern Henan, central-northern Anhui, Jiangsu, and Shanghai, where flat terrain and low vegetation coverage are predominant.
- The risk distribution characteristics present a decreasing trend from south to north and from east to west. On a larger scale, the southeastern regions of China remain high-risk areas for tropical cyclones, necessitating continued emphasis on hazard prevention efforts in key provinces and cities. However, while enhancing prevention measures in high-risk areas, corresponding measures should also be tailored based on the specific hazard situation in inland cities.
Author Contributions
Funding
Institutional Review Board Statement
Informed Consent Statement
Data Availability Statement
Conflicts of Interest
References
- Zhang, J.Y.; Wu, L.G.; Zhang, Q. Tropical cyclone damages in China under the background of global warming. J. Trop. Meteor. 2011, 27, 442–454. [Google Scholar]
- Krapivin, V.F.; Soldatov, V.Y.; Varotsos, C.A. An adaptive information technology for the operative diagnostics of the tropical cyclones; solar-terrestrial coupling mechanisms. J. Atmos. Sol. Terr. Phys. 2012, 89, 83–89. [Google Scholar] [CrossRef]
- Wei, Z.J.; Ma, H.L.; Tang, D.L. Trend assessment of typhoon hazards based on the improved entropy method. J. Catastrophol. 2017, 32, 7–11. [Google Scholar]
- Chou, J.M.; Dong, W.J.; Xu, H.; Ban, J.H. Assessment on economic losses of tropical cyclone hazards affecting China’s coastal areas. Meteor. Environ. Sci. 2022, 45, 1–10. [Google Scholar]
- Duan, Y.H. Monitoring and forecasting of finescale structure and impact assessment of landfalling typhoons. Adv. Earth Sci. 2015, 30, 847–854. [Google Scholar]
- Gu, X.J.; Wang, Y.H.; Wu, W.B. Statistical Analysis of Rainstorm in Henan Caused by Typhoon Landing in East China. Meteor. Environ. Sci. 2023, 46, 10–16. [Google Scholar]
- Liu, H.X.; Lu, Y.J.; Wang, M.; Li, G.T. Risk assessment of extreme typhoon hazards based on information diffusion technology. J. Trop. Oceanogr. 2020, 39, 31–41. [Google Scholar]
- Rostami, M.; Zeitlin, V. Evolution, propagation, and interactions with topography of hurricane-like vortices in moist-convective rotating shallow-water model. J. Fluid Mech. 2020, 902, A24. [Google Scholar] [CrossRef]
- Liu, D.; Xiang, C.Y.; Zhang, L.; Xu, Y.L.; Luo, Q. Analysis on main characteristics of Typhoon Doksuri (2305) and difficulties in its track and intensity forecast. J. Mar. Meteor. 2023, 43, 1–10. [Google Scholar]
- Yin, J.; Dai, E.F.; Wu, S.H. Integrated Risk Assessment and Zoning of Typhoon Hazards in China. Sci. Geogr. Sin. 2013, 33, 1370–1376. [Google Scholar]
- Shi, P.J. Theory on hazard science and hazard dynamics. J. Nat. Disast. 2002, 3, 1–9. [Google Scholar]
- Ding, Y.; Shi, P.J. Fuzzy risk assessment model of typhoon hazard. J. Nat. Disast. 2002, 11, 34–43. [Google Scholar]
- Shi, J.; Xiao, F.J.; Mu, H.Z.; Xu, J.L. Loss assessment of typhoon hazard in Shanghai during 1949–2009. Resour. Environ. Yangtze Basin. 2013, 22, 952–957. [Google Scholar]
- Wang, Y.M.; Ren, F.M.; Li, J.J. Climatic characteristics of typhoon precipitation in China. J. Trop. Meteor. 2008, 03, 233–238. [Google Scholar]
- Ding, D.P.; Li, Y. Study on the characteristics of typhoon precipitation in Beijing. Acta Meteorol. Sin. 2009, 67, 864–874. [Google Scholar]
- Ye, X.F.; Ma, Z.Y.; Ma, X.L. Analysis of environmental background and cloud pattern characteristics of typhoon rainstorm in Lushan. J. Nat. Disast. 2012, 21, 159–166. [Google Scholar]
- Zhao, S.J.; Huang, C.F.; Guo, S.J. Scenario-driven regional natural hazard risk analysis. J. Nat. Disast. 2012, 21, 9–17. [Google Scholar]
- Zhang, X.Y.; Wei, B.; Yang, H.Z. Typhoon hazard risk assessment in Guangdong Province based on GIS. J. Trop. Meteor. 2018, 34, 783865. [Google Scholar]
- Lee, Y.H. Spatial risk assessment of typhoon cumulated rainfall: A case study in Taipei area. Stoch. Env. Res. Risk A. 2012, 7, 97–104. [Google Scholar] [CrossRef]
- Ying, M.W.; Zhang, H.Y.; Lu, X.; Feng, J.; Fan, Y.; Zhu, Y. An overview of the China Meteorological Administration tropical cyclone database. J. Atmos. Oceanic Technol. 2014, 31, 287–301. [Google Scholar] [CrossRef]
- Lu, X.Q.; Yu, H.; Ying, M.; Zhao, B.K.; Zhang, S. Western North Pacific tropical cyclone database created by the China Meteorological Administration. Adv. Atmos. Sci. 2021, 38, 690–699. [Google Scholar] [CrossRef]
- Ren, F.M.; Wang, X.L.; Chen, L.S. Tropical cyclones landfalling in the mainland Hainan and Taiwan of China and their interrelations. Acta Meteorol. Sin. 2008, 66, 224–235. [Google Scholar]
- Yang, Y.J.; Wang, J. Typhoon hazard risk assessment of coastal cities in China based on historical data in recent 20 years. J. Mar. Forecast 2021, 38, 24–30. [Google Scholar]
- Shi, X.L.; Zhang, Y.; Ding, H. Research progress of natural hazard risk assessment. J. Xi’an Univ. Technol. 2024, 6, 1–11. [Google Scholar]
- Wu, L.Y.; He, D.J.; Hong, W. Research progress of natural hazard risk assessment and hazard vulnerability. J. Catastrophol. 2014, 29, 129–135. [Google Scholar]
- Gu, X.L.; Chen, Y.L.; Qian, Y.Z. Typhoon hazard assessment and risk assessment based on Analytic Hierarchy Process (AHP) in Ningbo. J. Trop. Meteor. 2018, 34, 489. [Google Scholar]
- Han, L.; Mei, Q.; Lu, Y.M.; Ji, M. Analysis and Study on AHP-Fuzzy Comprehensive Evaluation. China Saf. Sci. J. 2004, 7, 86–89. [Google Scholar] [CrossRef]
- Yan, J.B.; Wu, B.; He, Q.H. An anisotropic lDW interpolation method with multiple parameters cooperative optimization. J. Geod. Geoinf, Sin. 2021, 50, 675–684. [Google Scholar]
- Xiao, X.; Zheng, C.; Ding, C.Q. Comparative analysis of the temperatures and rainfall in loess hilly regions using the ANUSPLIN model. Arid. Zone. Res. 2023, 40, 1575–1582. [Google Scholar]
- Yu, X.D.; Wu, Y.; He, L.M. Improvement and comparison of inverse range-weighted grid-based interpolation algorithms. Chin. J. Eng. Geophys. 2013, 10, 900–904. [Google Scholar]
- Yue, X.Y.; Shi, X.X.; Geng, S.S. The risk assessment of hazards induced bytyphoons in Shandong province based on historica data during 1985–2010. Mar. Sci. Bull. 2022, 24, 34–46. [Google Scholar]
- Cheng, H.F.; Zhang, W.B.; Chen, F. Advances in researches on application of remote sensing method to estimating vegetation coverage. Rem. Sens. Nat. Resour. 2008, 1, 13–18. [Google Scholar]
- Fan, J.; Wang, L.; Qin, J. Evaluating cultivated land stability during the growing season based on precipitation in the Horqin Sandy Land, China. J. Environ. Manag. 2020, 276, 111269. [Google Scholar] [CrossRef] [PubMed]
- Xiao, C.Y.; Zhao, H.K.; Liu, Q.Y.; Dong, L. The distribution of torrential rain after landfalling of Typhoon “Lekima” (1909). J. Meteor. Sci. 2020, 40, 294–302. [Google Scholar]
- Cui, Z.P.; Liu, X.M.; Liu, B. Statistical evaluation of wind energy resources in Changling wind field, Jilin Province. Renew. Energ. 2023, 41, 1100–1112. [Google Scholar]
- Li, R.C.; Zhou, W.; Shun, C.M. Change in destructiveness of landfalling tropical cyclones over China in recent decades. J. Climate 2017, 30, 3367–3379. [Google Scholar] [CrossRef]
- Wang, J.; Chen, Y.; Nie, J. On the role of anthropogenic warming and wetting in the July 2021 Henan record-shattering rainfall. Sci. Bull. 2022, 67, 2055–2059. [Google Scholar] [CrossRef]


| Data | Source | Content | Purpose |
|---|---|---|---|
| The CMA-STI Tropical Cyclone Best Track Data [20,21] | Cma Tropical Cyclone Data Center “http://tcdata.typhoon.org.cn/ (accessed on 12 July 2023)” | Best track and intensity of landfalling tropical cyclones from 1949 to 2023 | Analysis of regions affected by historical tropical cyclone paths |
| Meteorological Station Observation Records | China Meteorological Data Service Centre “http://data.cma.cn/ (accessed on 19 January 2023)” | The accumulated precipitation of each station at 20–20 h every day and the average wind speed of 10 min at an hourly height of 10 m from 1997 to 2021 | Risk data of hazard factors |
| Topographic Elevation Data | Resource and Environmental Science Data Platform “https://www.resdc.cn/ (accessed on 19 January 2023)” | Longitude, latitude, and terrain with 90 m spatial resolution | Natural carrier sensitivity data |
| MOD13A1 Product Data | EarthData “https://search.earthdata.nasa.gov/ (accessed on 20 May 2023)” | The year 2019 has 16-day intervals and 500 m NDVI spatial distribution data | Natural carrier sensitivity data |
| Primary Index | Single Sort Weight | Positive/Negative Indicators | Secondary Index | Single Sort Weight | Positive/Negative Indicators | Total Sort Weight |
|---|---|---|---|---|---|---|
| The Hazard of Hazard-Causing Factors | 0.67 | Positive | Average Daily Rainfall | 0.68 | Positive | 0.45 |
| Average Daily Wind Speed | 0.19 | Positive | 0.13 | |||
| Average Daily Maximum Wind Speed | 0.13 | Positive | 0.09 | |||
| Sensitivity of Natural Carriers | 0.33 | Positive | Terrain Elevation | 0.83 | Negative | 0.28 |
| Vegetation Coverage | 0.17 | Negative | 0.05 |
| Strength Level | Tropical Depression | Tropical Storm | Severe Tropical Storm | Typhoon | Severe Typhoon | Super Typhoon |
|---|---|---|---|---|---|---|
| Quantity | 116 | 128 | 158 | 166 | 54 | 18 |
| Proportion/% | 18.1 | 20.0 | 24.7 | 25.9 | 8.4 | 2.8 |
| Level | Low | Relatively Low | Moderate | Relatively High | High |
|---|---|---|---|---|---|
| Scoring range (×100) | H ≤ 16.44 | 16.44 < H ≤ 23.95 | 23.95 < H ≤ 36.98 | 36.98 < H ≤ 53.9 | 53.9 < H |
| Level | Low | Relatively Low | Moderate | Relatively High | High |
|---|---|---|---|---|---|
| Scoring range (×100) | N ≤ 17.54 | 17.54 < N ≤ 34.25 | 34.25 < N ≤ 51.36 | 51.36 < N ≤ 68.79 | 68.79 < N |
| Level | Low | Relatively Low | Moderate | Relatively High | High |
|---|---|---|---|---|---|
| Scoring range (×100) | CRTY ≤ 17.24 | 17.24 < CRTY ≤ 34.65 | 34.65 < CRTY ≤ 51.28 | 51.28 < CRTY ≤ 68.17 | 68.17 < CRTY |
Disclaimer/Publisher’s Note: The statements, opinions and data contained in all publications are solely those of the individual author(s) and contributor(s) and not of MDPI and/or the editor(s). MDPI and/or the editor(s) disclaim responsibility for any injury to people or property resulting from any ideas, methods, instructions or products referred to in the content. |
© 2024 by the authors. Licensee MDPI, Basel, Switzerland. This article is an open access article distributed under the terms and conditions of the Creative Commons Attribution (CC BY) license (https://creativecommons.org/licenses/by/4.0/).
Share and Cite
Xu, J.; Xue, X.; Yang, B.; Wang, W.; Wu, W.; Ji, X. Risk Assessment of Landfalling Tropical Cyclones in China Based on Hazard Risk Theory. Appl. Sci. 2024, 14, 5126. https://doi.org/10.3390/app14125126
Xu J, Xue X, Yang B, Wang W, Wu W, Ji X. Risk Assessment of Landfalling Tropical Cyclones in China Based on Hazard Risk Theory. Applied Sciences. 2024; 14(12):5126. https://doi.org/10.3390/app14125126
Chicago/Turabian StyleXu, Jin, Xinyue Xue, Bo Yang, Wen Wang, Wenxiang Wu, and Xiaodong Ji. 2024. "Risk Assessment of Landfalling Tropical Cyclones in China Based on Hazard Risk Theory" Applied Sciences 14, no. 12: 5126. https://doi.org/10.3390/app14125126