
Reliability, Validity, and Sensitivity of Spatiotemporal Parameters in Bandy Sprint Skating Using Skate-Mounted Inertial Measurement Units


Abstract
:1. Introduction
2. Materials and Methods
2.1. Participants
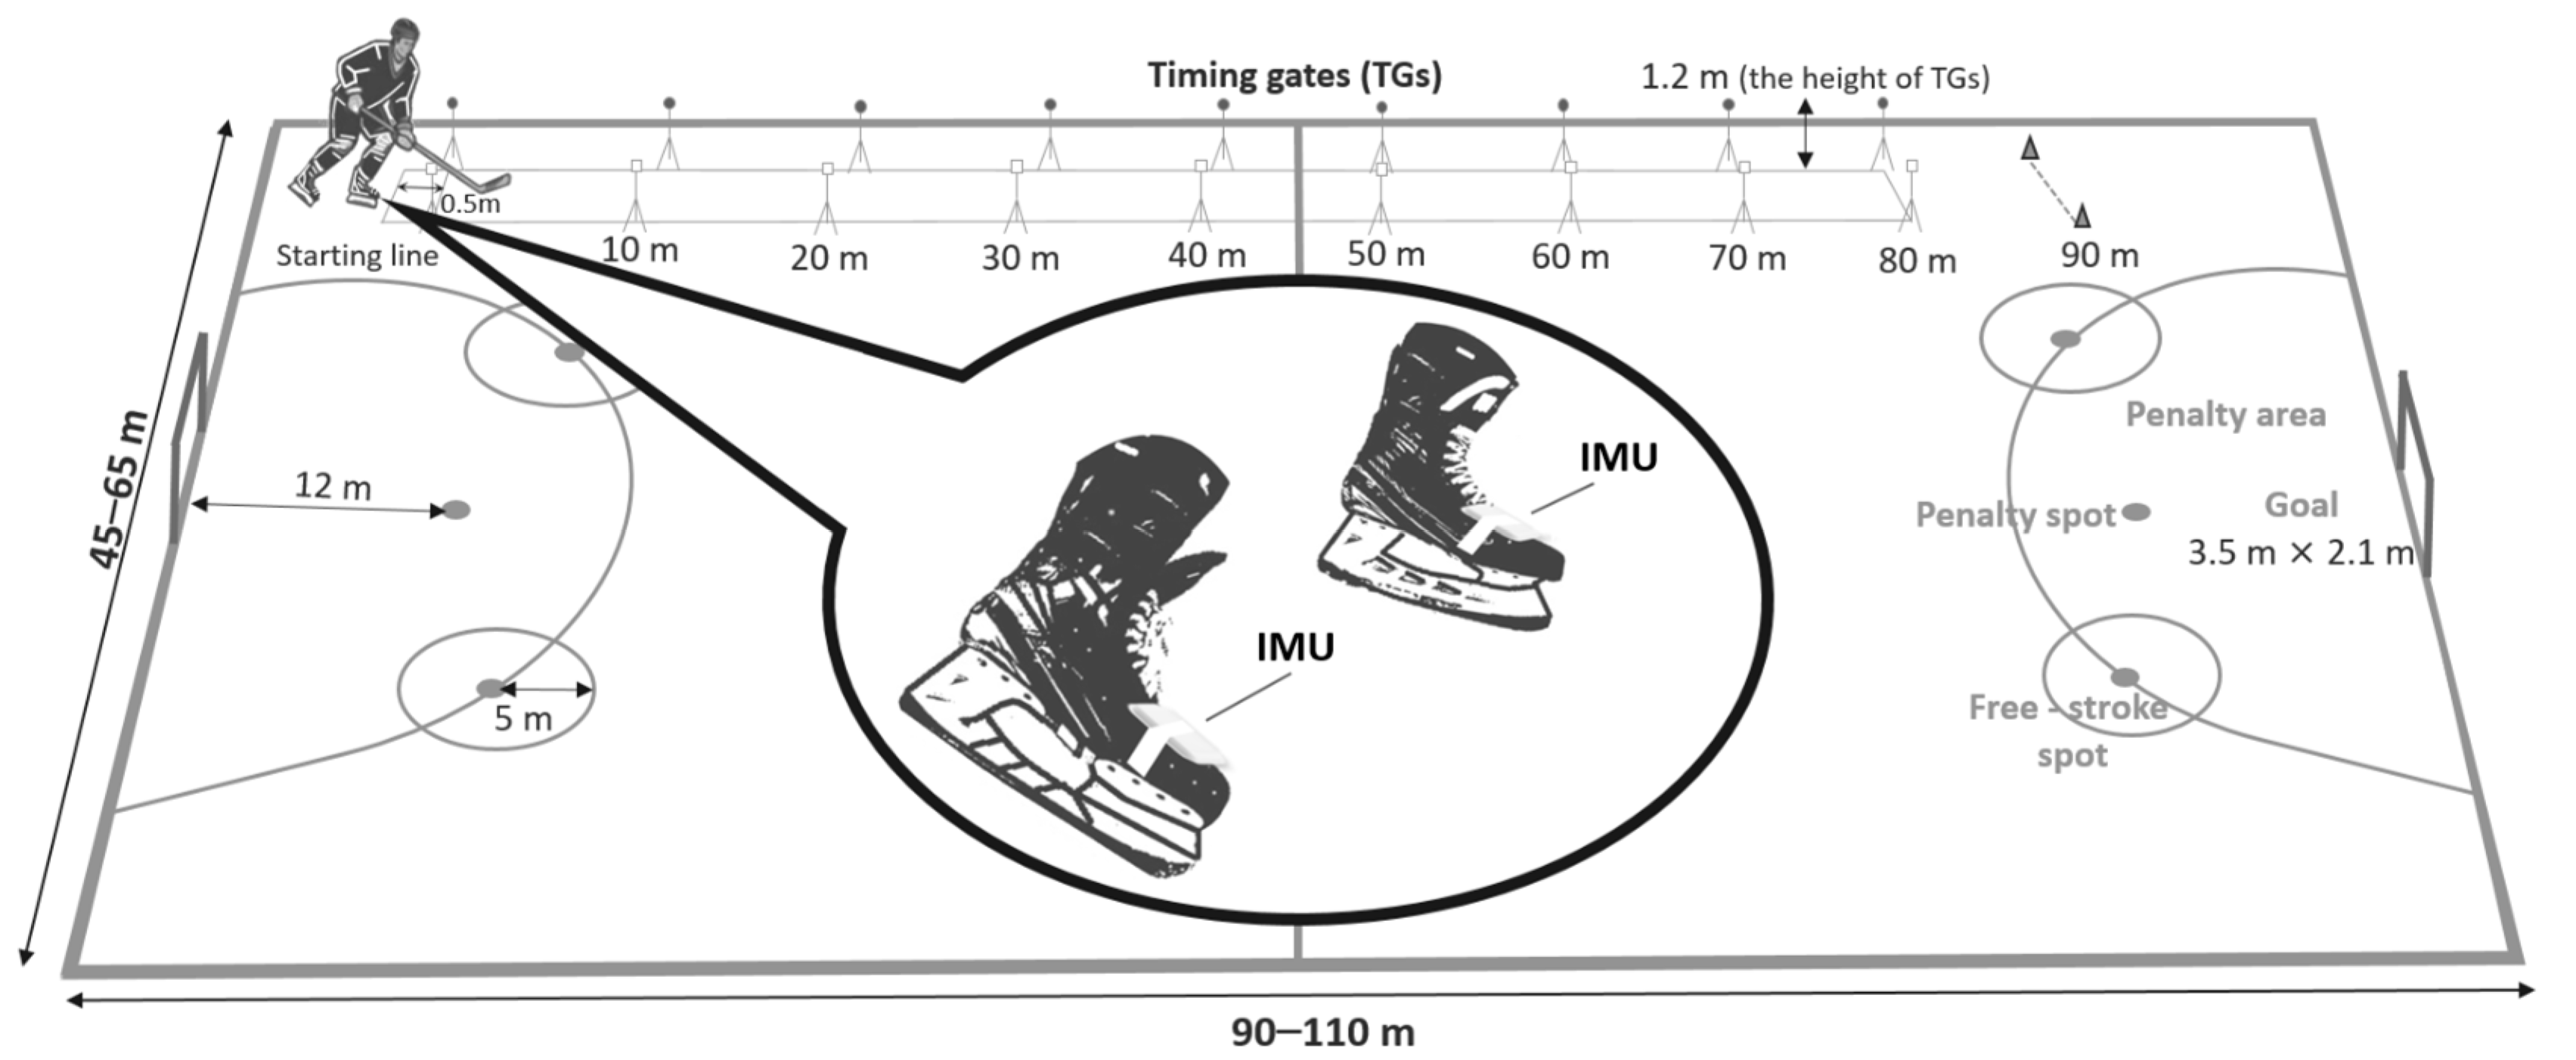
2.2. Procedure
2.3. Statistical Analyses
3. Results
3.1. Reliability and Sensitivity

| Kinematic Variables | Mean ± SD | Min–Max | CV%(BS) | CV%(WS) | SWC(0.2) | SWC(0.5) | TE | Sensitivity | ICC (CI95%) | |
|---|---|---|---|---|---|---|---|---|---|---|
| Velocity [m/s] | 8.51 ± 0.33 | 7.53 | 9.21 | 3.86 | 0.73 | 0.06 | 0.16 | 0.05 | GOOD | 0.97 (0.94–0.99) |
| Trial 1 | 8.50 ± 0.33 | 7.42 | 8.99 | |||||||
| Trial 2 | 8.52 ± 0.33 | 7.53 | 9.21 | |||||||
| Glide time [ms] | 402 ± 22 | 345 | 469 | 5.63 | 2.76 | 4 | 11 | 8 | GOOD | 0.82 (0.64–0.91) |
| Trial 1 | 404 ± 21 | 364 | 456 | |||||||
| Trial 2 | 400 ± 27 | 344 | 469 | |||||||
| Double support time [ms] | 72 ± 9 | 49 | 98 | 12.90 | 7.10 | 2 | 5 | 5 | SATISFACTORY | 0.73 (0.45–0.87) |
| Trial 1 | 73 ± 10 | 54 | 106 | |||||||
| Trial 2 | 71 ± 11 | 49 | 98 | |||||||
| Glide length [m] | 3.47 ± 0.21 | 2.96 | 3.87 | 6.04 | 2.85 | 0.04 | 0.10 | 0.07 | GOOD | 0.83 (0.66–0.92) |
| Trial 1 | 3.48 ± 0.21 | 2.94 | 3.88 | |||||||
| Trial 2 | 3.46 ± 0.24 | 2.96 | 3.87 | |||||||
| Double support length [m] | 0.63 ± 0.09 | 0.43 | 0.81 | 13.74 | 7.64 | 0.02 | 0.04 | 0.04 | SATISFACTORY | 0.74 (0.47–0.88) |
| Trial 1 | 0.64 ± 0.09 | 0.46 | 0.90 | |||||||
| Trial 2 | 0.62 ± 0.11 | 0.43 | 0.81 | |||||||
| Step length [m] | 2.83 ± 0.16 | 2.46 | 3.17 | 5.69 | 2.01 | 0.03 | 0.08 | 0.04 | GOOD | 0.90 (0.78–0.95) |
| Trial 1 | 2.84 ± 0.16 | 2.46 | 3.12 | |||||||
| Trial 2 | 2.83 ± 0.18 | 2.46 | 3.174 | |||||||
| Step frequency [step/s] | 3.07 ± 0.17 | 2.71 | 3.51 | 5.50 | 2.32 | 0.03 | 0.08 | 0.06 | GOOD | 0.85 (0.69–0.93) |
| Trial 1 | 3.05 ± 0.16 | 2.69 | 3.34 | |||||||
| Trial 2 | 3.09 ± 0.20 | 2.71 | 3.51 | |||||||
| Kinematic Variables | Mean ± SD | Min–Max | CV%(BS) | CV%(WS) | SWC(0.2) | SWC(0.5) | TE | Sensitivity | ICC (CI95%) | |
|---|---|---|---|---|---|---|---|---|---|---|
| Velocity [m/s] | 6.18 ± 0.29 | 5.53 | 6.86 | 4.71 | 1.89 | 0.06 | 0.15 | 0.10 | GOOD | 0.87 (0.66–0.94) |
| Trial 1 | 6.13 ± 0.31 * | 5.05 | 6.85 | |||||||
| Trial 2 | 6.23 ± 0.31 | 5.53 | 6.86 | |||||||
| Glide time [ms] | 367 ± 27 | 302 | 418 | 7.36 | 3.24 | 5 | 14 | 11 | GOOD | 0.82 (0.63–0.91) |
| Trial 1 | 371 ± 28 | 315 | 451 | |||||||
| Trial 2 | 363 ± 30 | 302 | 418 | |||||||
| Double support time [ms] | 63 ± 12 | 37 | 90 | 19.15 | 9.73 | 2 | 6 | 6 | SATISFACTORY | 0.77 (0.51–0.89) |
| Trial 1 | 65 ± 13 * | 38 | 112 | |||||||
| Trial 2 | 61 ± 13 | 37 | 90 | |||||||
| Glide length [m] | 2.31 ± 0.20 | 1.89 | 2.70 | 8.61 | 3.33 | 0.04 | 0.10 | 0.06 | GOOD | 0.88 (0.76–0.94) |
| Trial 1 | 2.31 ± 0.19 | 1.89 | 2.72 | |||||||
| Trial 2 | 2.30 ± 0.22 | 1.88 | 2.69 | |||||||
| Double support length [m] | 0.41 ± 0.08 | 0.23 | 0.57 | 18.48 | 9.78 | 0.02 | 0.04 | 0.04 | SATISFACTORY | 0.76 (0.50–0.88) |
| Trial 1 | 0.42 ± 0.08 * | 0.24 | 0.68 | |||||||
| Trial 2 | 0.40 ± 0.08 | 0.23 | 0.57 | |||||||
| Step length [m] | 1.89 ± 0.15 | 1.60 | 2.26 | 8.05 | 2.81 | 0.03 | 0.08 | 0.04 | GOOD | 0.90 (0.80–0.95) |
| Trial 1 | 1.88 ± 0.15 | 1.63 | 2.23 | |||||||
| Trial 2 | 1.90 ± 0.17 | 1.60 | 2.26 | |||||||
| Step frequency [step/s] | 3.32 ± 0.21 | 1.60 | 2.26 | 6.44 | 2.51 | 0.04 | 0.11 | 0.08 | GOOD | 0.86 (0.72–0.93) |
| Trial 1 | 3.30 ± 0.21 | 2.95 | 3.72 | |||||||
| Trial 2 | 3.34 ± 0.24 | 2.87 | 3.80 | |||||||
| Kinematic Variables | Mean ± SD | Min–Max | CV%(BS) | CV%(WS) | SWC(0.2) | SWC(0.5) | TE | Sensitivity | ICC (CI95%) | |
|---|---|---|---|---|---|---|---|---|---|---|
| Velocity [m/s] | 10.03 ± 0.45 ¥ | 8.57 | 10.87 | 4.47 | 0.78 | 0.09 | 0.22 | 0.06 | GOOD | 0.98 (0.95–0.99) |
| Trial 1 | 10.05 ± 0.45 | 8.56 | 10.76 | |||||||
| Trial 2 | 10.00 ± 0.45 | 8.57 | 10.87 | |||||||
| Glide time [ms] | 433 ± 27 ¥ | 377 | 503 | 6.15 | 3.72 | 5 | 13 | 14 | MARGINAL | 0.69 (0.37–0.85) |
| Trial 1 | 437 ± 28 | 385 | 500 | |||||||
| Trial 2 | 437 ± 28 | 377 | 503 | |||||||
| Double support time [ms] | 82 ± 12 ¥ | 55 | 115 | 15.06 | 9.79 | 2 | 6 | 8 | MARGINAL | 0.57 (0.14–0.79) |
| Trial 1 | 84 ± 13 | 58 | 115 | |||||||
| Trial 2 | 80 ± 16 | 55 | 114 | |||||||
| Glide length [m] | 4.35 ± 0.32 ¥ | 3.56 | 4.98 | 7.24 | 3.79 | 0.06 | 0.15 | 0.14 | GOOD | 0.78 (0.53–0.89) |
| Trial 1 | 4.39 ± 0.34 | 3.52 | 4.92 | |||||||
| Trial 2 | 4.31 ± 0.35 | 3.55 | 4.98 | |||||||
| Double support length [m] | 0.84 ± 0.15 ¥ | 0.54 | 1.55 | 18.05 | 9.92 | 0.03 | 0.08 | 0.09 | MARGINAL | 0.64 (0.26–0.83) |
| Trial 1 | 0.85 ± 0.14 | 0.57 | 1.17 | |||||||
| Trial 2 | 0.83 ± 0.21 | 0.54 | 1.55 | |||||||
| Step length [m] | 3.51 ± 0.25 ¥ | 2.90 | 4.00 | 7.06 | 3.28 | 0.05 | 0.12 | 0.11 | GOOD | 0.79 (0.57–0.90) |
| Trial 1 | 3.52 ± 0.28 | 2.81 | 4.11 | |||||||
| Trial 2 | 3.50 ± 0.26 | 2.89 | 4.00 | |||||||
| Step frequency [step/s] | 2.89 ± 0.21 ¥ | 2.51 | 4.23 | 7.41 | 4.52 | 0.04 | 0.11 | 0.23 | MARGINAL | 0.26 (−0.48–0.62) |
| Trial 1 | 2.85 ± 0.18 | 2.38 | 3.16 | |||||||
| Trial 2 | 2.94 ± 0.36 | 2.51 | 4.23 | |||||||
3.2. Content and Predictive Validity
4. Discussion
4.1. Reliability and Sensitivity
4.2. Content Validity
4.3. Predictive Validity
4.4. Limitations
5. Conclusions and Practical Application
Author Contributions
Funding
Institutional Review Board Statement
Informed Consent Statement
Data Availability Statement
Acknowledgments
Conflicts of Interest
References
- van den Tillaar, R.; Pojskic, H.; Andersson, H. Sprint skating profile of competitive male bandy players: Determination of positional differences and playing level. Front. Physiol. 2023, 14, 1055863. [Google Scholar] [CrossRef] [PubMed]
- Blomqvist, S.; Ervasti, P.-E.; Elcadi, G.H. Evaluating physical workload by position during match in elite bandy. J. Strength Cond. Res. 2018, 32, 2616–2622. [Google Scholar] [CrossRef] [PubMed]
- Johansson, M.; Ervasti, P.-E.; Blomqvist, S. An analysis of acceleration, deceleration and high-intensity skating during elite bandy match-play: A case study. Sports 2021, 9, 152. [Google Scholar] [CrossRef] [PubMed]
- Persson, E.; Andersson, M.; Blomqvist, S. Differences in physical demands among offensive and defensive players in elite men bandy. Res. Q. Exerc. Sport 2021, 92, 805–812. [Google Scholar] [CrossRef] [PubMed]
- Renaud, P.J.; Robbins, S.M.; Dixon, P.C.; Shell, J.R.; Turcotte, R.A.; Pearsall, D.J. Ice hockey skate starts: A comparison of high and low calibre skaters. Sports Eng. 2017, 20, 255–266. [Google Scholar] [CrossRef]
- Douglas, A.; Johnston, K.; Baker, J.; Rotondi, M.A.; Jamnik, V.K.; Macpherson, A.K. On-ice measures of external load in relation to match outcome in elite female ice hockey. Sports 2019, 7, 173. [Google Scholar] [CrossRef] [PubMed]
- Khandan, A.; Fathian, R.; Carey, J.P.; Rouhani, H. Measurement of temporal and spatial parameters of ice hockey skating using a wearable system. Sci. Rep. 2022, 12, 22280. [Google Scholar] [CrossRef] [PubMed]
- Shell, J.R.; Robbins, S.M.; Dixon, P.C.; Renaud, P.J.; Turcotte, R.A.; Wu, T.; Pearsall, D.J. Skating start propulsion: Three-dimensional kinematic analysis of elite male and female ice hockey players. Sports Biomech. 2017, 16, 313–324. [Google Scholar] [CrossRef] [PubMed]
- Budarick, A.R.; Shell, J.R.; Robbins, S.M.; Wu, T.; Renaud, P.J.; Pearsall, D.J. Ice hockey skating sprints: Run to glide mechanics of high calibre male and female athletes. Sports Biomech. 2018, 19, 601–617. [Google Scholar] [CrossRef] [PubMed]
- Khandan, A.; Fathian, R.; Carey, J.P.; Rouhani, H. Assessment of Three-Dimensional Kinematics of High-and Low-Calibre Hockey Skaters on Synthetic ice Using Wearable Sensors. Sensors 2022, 23, 334. [Google Scholar] [CrossRef] [PubMed]
- van den Tillaar, R.; Nagahara, R.; Gleadhill, S.; Jiménez-Reyes, P. Step-to-step kinematic validation between an Inertial Measurement Unit (IMU) 3D system, a combined Laser+ IMU system and force plates during a 50 M sprint in a cohort of sprinters. Sensors 2021, 21, 6560. [Google Scholar] [CrossRef] [PubMed]
- van den Tillaar, R.; Pojskic, H.; Andersson, H. Sprint skating profile of competitive female bandy players: An analysis of positional and playing-level differences. Front. Physiol. 2023, 14, 1094170. [Google Scholar] [CrossRef] [PubMed]
- Stetter, B.J.; Buckeridge, E.; von Tscharner, V.; Nigg, S.R.; Nigg, B.M. A novel approach to determine strides, ice contact, and swing phases during ice hockey skating using a single accelerometer. J. Appl. Biomech. 2016, 32, 101–106. [Google Scholar] [CrossRef] [PubMed]
- Stetter, B.J.; Buckeridge, E.; Nigg, S.R.; Sell, S.; Stein, T. Towards a wearable monitoring tool for in-field ice hockey skating performance analysis. Eur. J. Sport Sci. 2019, 19, 893–901. [Google Scholar] [CrossRef] [PubMed]
- Buckeridge, E.; LeVangie, M.C.; Stetter, B.; Nigg, S.R.; Nigg, B.M. An on-ice measurement approach to analyse the biomechanics of ice hockey skating. PLoS ONE 2015, 10, e0127324. [Google Scholar] [CrossRef] [PubMed]
- Gratton, C.; Jones, I. Research Methods for Sports Studies; Routledge: London, UK, 2010. [Google Scholar]
- Hopkins, W.G. Measures of reliability in sports medicine and science. Sports Med. 2000, 30, 1–15. [Google Scholar] [CrossRef] [PubMed]
- Weir, J.P. Quantifying test-retest reliability using the intraclass correlation coefficient and the SEM. J. Strength Cond. Res. 2005, 19, 231–240. [Google Scholar] [PubMed]
- Hopkins, W.G. How to interpret changes in an athletic performance test. Sportscience 2004, 8, 1–7. [Google Scholar]
- Thomas, J.R.; Silverman, S.J.; Nelson, J.K. Research Methods in Physical Activity, 7th ed.; Human Kinetics: Champaign, IL, USA, 2015. [Google Scholar]
- Chaabene, H.; Negra, Y.; Bouguezzi, R.; Capranica, L.; Franchini, E.; Prieske, O.; Granacher, U. Tests for the assessment of sport-specific performance in Olympic combat sports: A systematic review with practical recommendations. Front. Physiol. 2018, 9, 349041. [Google Scholar] [CrossRef] [PubMed]
- Gindre, C.; Lussiana, T.; Hebert-Losier, K.; Morin, J.-B. Reliability and validity of the Myotest® for measuring running stride kinematics. J. Sports Sci. 2016, 34, 664–670. [Google Scholar] [CrossRef] [PubMed]
- Kozinc, Ž.; Smajla, D.; Šarabon, N. The reliability of wearable commercial sensors for outdoor assessment of running biomechanics: The effect of surface and running speed. Sports Biomech. 2022, 1–14. [Google Scholar] [CrossRef] [PubMed]
- Setuain, I.; Lecumberri, P.; Ahtiainen, J.; Mero, A.; Häkkinen, K.; Izquierdo, M. Sprint mechanics evaluation using inertial sensor-based technology: A laboratory validation study. Scand. J. Med. Sci. Sports 2018, 28, 463–472. [Google Scholar] [CrossRef] [PubMed]
- Ammann, R.; Taube, W.; Wyss, T. Accuracy of PARTwear inertial sensor and Optojump optical measurement system for measuring ground contact time during running. J. Strength Cond. Res. 2016, 30, 2057–2063. [Google Scholar] [CrossRef] [PubMed]
- Blauberger, P.; Horsch, A.; Lames, M. Detection of ground contact times with inertial sensors in elite 100-m sprints under competitive field conditions. Sensors 2021, 21, 7331. [Google Scholar] [CrossRef]
- de Ruiter, C.J.; van Dieën, J.H. Stride and step length obtained with inertial measurement units during maximal sprint acceleration. Sports 2019, 7, 202. [Google Scholar] [CrossRef]
- de Ruiter, C.J.; Wilmes, E.; van Ardenne, P.S.; Houtkamp, N.; Prince, R.A.; Wooldrik, M.; van Dieën, J.H. Stride lengths during maximal linear sprint acceleration obtained with foot-mounted Inertial Measurement Units. Sensors 2022, 22, 376. [Google Scholar] [CrossRef] [PubMed]
- Miranda-Oliveira, P.; Branco, M.; Fernandes, O. Accuracy and interpretation of the acceleration from an inertial measurement unit when applied to the sprint performance of track and field athletes. Sensors 2023, 23, 1761. [Google Scholar] [CrossRef] [PubMed]
- Tomita, Y.; Iizuka, T.; Irisawa, K.; Imura, S. Detection of movement events of long-track speed skating using wearable inertial sensors. Sensors 2021, 21, 3649. [Google Scholar] [CrossRef]
- Marino, G.W. Selected mechanical factors associated with acceleration in ice skating. Res. Q. Exerc. Sport 1983, 54, 234–238. [Google Scholar] [CrossRef]
- Pearsall, D.; Turcotte, R.; Murphy, S. Biomechanics of ice hockey. Exerc. Sport Sci. 2000, 43, 675–692. [Google Scholar]
- Atkinson, G.; Nevill, A.; Edwards, B. What is an acceptable amount of measurement error? The application of meaningful ‘analytical goals’ to the reliability of sports science measurements made on a ratio scale. J. Sports Sci. 1999, 17, 18. [Google Scholar]
- Bruton, A.; Conway, J.H.; Holgate, S.T. Reliability: What is it, and how is it measured? Physiotherapy 2000, 86, 94–99. [Google Scholar] [CrossRef]
- Hopkins, W.; Marshall, S.; Batterham, A.; Hanin, J. Progressive statistics for studies in sports medicine and exercise science. Med. Sci. Sports Exerc. 2009, 41, 3. [Google Scholar] [CrossRef] [PubMed]
- Pyne, D.B.; Hopkins, W.; Batterham, A.; Gleeson, M.; Fricker, P. Characterising the individual performance responses to mild illness in international swimmers. Br. J. Sports Med. 2005, 39, 752–756. [Google Scholar] [CrossRef] [PubMed]
- Cohen, J. Statistical Power Analysis for the Behavioral Sciences; Routledge: London, UK, 2013. [Google Scholar]
- Hopkins, W.G.; Batterham, A.M.; Marshall, S.W.; Hanin, J. Progressive statistics. Sportscience 2009, 13, 1. [Google Scholar]
- Salkind, N.J. Encyclopedia of Measurement and Statistics; SAGE Publications: Washington, DC, USA, 2006. [Google Scholar]
- Kim, J.H. Multicollinearity and misleading statistical results. Korean J. Anesthesiol. 2019, 72, 558. [Google Scholar] [CrossRef] [PubMed]
- Pojskic, H.; McGawley, K.; Gustafsson, A.; Behm, D.G. The reliability and validity of a novel sport-specific balance test to differentiate performance levels in elite curling players. J. Sports Sci. Med. 2020, 19, 337. [Google Scholar] [PubMed]
- Perez, J.; Guilhem, G.; Brocherie, F. Reliability of the force-velocity-power variables during ice hockey sprint acceleration. Sports Biomech. 2022, 21, 56–70. [Google Scholar] [CrossRef] [PubMed]
- Lockie, R.G.; Schultz, A.B.; Callaghan, S.J.; Jeffriess, M.D.; Berry, S.P. Reliability and validity of a new test of change-of-direction speed for field-based sports: The change-of-direction and acceleration test (CODAT). J. Sports Sci. Med. 2013, 12, 88. [Google Scholar]
- Stidwill, T.; Pearsall, D.; Turcotte, R. Comparison of skating kinetics and kinematics on ice and on a synthetic surface. Sports Biomech. 2010, 9, 57–64. [Google Scholar] [CrossRef] [PubMed]
- De Koning, J.; Thomas, R.; Berger, M.; de Groot, G.; van Ingen Schenau, G. The start in speed skating: From running to gliding. Med. Sci. Sports Exerc. 1995, 27, 1703–1708. [Google Scholar] [CrossRef] [PubMed]
- van Schenau, G.J.I.; de Koning, J.J.; de Groot, G. Optimisation of sprinting performance in running, cycling and speed skating. Sports Med. 1994, 17, 259–275. [Google Scholar] [CrossRef] [PubMed]
- Bracko, M.R. Biomechanics powers ice hockey performance. Biomechanics 2004, 9, 47–53. [Google Scholar]
- Robbins, S.M.; Renaud, P.J.; Pearsall, D.J. Principal component analysis identifies differences in ice hockey skating stride between high-and low-calibre players. Sports Biomech. 2021, 20, 131–149. [Google Scholar] [CrossRef] [PubMed]
- Upjohn, T.; Turcotte, R.; Pearsall, D.J.; Loh, J. Three-dimensional kinematics of the lower limbs during forward ice hockey skating. Sports Biomech. 2008, 7, 206–221. [Google Scholar] [CrossRef] [PubMed]
- Kaartinen, S.; Venojärvi, M.; Lesch, K.J.; Tikkanen, H.; Vartiainen, P.; Stenroth, L. Lower limb muscle activation patterns in ice-hockey skating and associations with skating speed. Sports Biomech. 2021, 1–16. [Google Scholar] [CrossRef] [PubMed]
- Lafontaine, D. Three-dimensional kinematics of the knee and ankle joints for three consecutive push-offs during ice hockey skating starts. Sports Biomech. 2007, 6, 391–406. [Google Scholar] [CrossRef] [PubMed]
- Laakso, L.A.; Secomb, J.L. Skating sprint performance and the influence of lower-body strength and power in professional and junior elite ice hockey athletes. Sports Biomech. 2023, 1–12. [Google Scholar] [CrossRef] [PubMed]
| Kinematic Variables | r (CI95%) | % of Common Variance |
|---|---|---|
| Velocity (m/s) | 0.62 * (0.34–0.79) | 37.8 |
| Glide time (ms) | 0.46 * (0.14–0.70) | 21.4 |
| Double support time (ms) | 0.42 * (0.09–0.67) | 17.9 |
| Glide length (m) | 0.52 * (0.21–0.74) | 27.4 |
| Double support length (m) | 0.44 * (0.11–0.69) | 19.5 |
| Step length (m) | 0.46 * (0.13–0.70) | 21.2 |
| Step frequency (steps/s) | 0.59 * (0.30–0.78) | 34.3 |
| The Acceleration Phase | The Steady-State Phase | |||||||||
|---|---|---|---|---|---|---|---|---|---|---|
| Max Velocity (m/s) | B | SE B | β | R2 | ΔR2 | B | SE B | β | R2 | ΔR2 |
| Model | 0.62 | 0.54 | 0.72 | 0.67 | ||||||
| Constant | −10.97 | 6.29 | −2.19 | 2.25 | ||||||
| Double support time (s) | 0.02 | 0.04 | 0.65 | −0.01 | 0.01 | −0.14 | ||||
| Glide length (m) | −13.06 | 10.55 | −5.79 | 2.19 | 0.58 | 1.55 * | ||||
| Double support length (m) | 11.67 | 11.07 | 1.98 | −1.45 | 1.06 | −0.49 | ||||
| Step length (m) | 17.45 | 11.18 | 5.94 | −0.32 | 0.54 | −0.17 | ||||
| Step frequency (steps/s) | 3.55 | 1.03 | 1.70 * | 1.86 | 0.41 | 0.89 * | ||||
Disclaimer/Publisher’s Note: The statements, opinions and data contained in all publications are solely those of the individual author(s) and contributor(s) and not of MDPI and/or the editor(s). MDPI and/or the editor(s) disclaim responsibility for any injury to people or property resulting from any ideas, methods, instructions or products referred to in the content. |
© 2024 by the authors. Licensee MDPI, Basel, Switzerland. This article is an open access article distributed under the terms and conditions of the Creative Commons Attribution (CC BY) license (https://creativecommons.org/licenses/by/4.0/).
Share and Cite
Pojskic, H.; Tillaar, R.v.d.; Andersson, H. Reliability, Validity, and Sensitivity of Spatiotemporal Parameters in Bandy Sprint Skating Using Skate-Mounted Inertial Measurement Units. Appl. Sci. 2024, 14, 5168. https://doi.org/10.3390/app14125168
Pojskic H, Tillaar Rvd, Andersson H. Reliability, Validity, and Sensitivity of Spatiotemporal Parameters in Bandy Sprint Skating Using Skate-Mounted Inertial Measurement Units. Applied Sciences. 2024; 14(12):5168. https://doi.org/10.3390/app14125168
Chicago/Turabian StylePojskic, Haris, Roland van den Tillaar, and Håkan Andersson. 2024. "Reliability, Validity, and Sensitivity of Spatiotemporal Parameters in Bandy Sprint Skating Using Skate-Mounted Inertial Measurement Units" Applied Sciences 14, no. 12: 5168. https://doi.org/10.3390/app14125168
APA StylePojskic, H., Tillaar, R. v. d., & Andersson, H. (2024). Reliability, Validity, and Sensitivity of Spatiotemporal Parameters in Bandy Sprint Skating Using Skate-Mounted Inertial Measurement Units. Applied Sciences, 14(12), 5168. https://doi.org/10.3390/app14125168