Featured Application
Additive manufacturing is frequently used in industries that require the manufacturing of special parts, such as aerospace, automotive, medical, and situations where the produced parts need to be connected to each other. This study provides experimental data for integrating fasteners into additive manufactured parts, and the results will guide the design and optimization of the assembly of these parts.
Abstract
This study aims to investigate common fastener implementation methods for parts manufactured with Fused Deposition Modeling (FDM). Although fastener applications for FDM manufactured parts are already in use, the effects of these methods on tensile and bending forces have not been examined. Test samples with different design techniques and infill ratios were produced using Polylactic Acid (PLA), and tensile strength and flexural and tightening torque tests were performed. Four of the of the most preferred fastener applications were studied. Two of the applications use a heat-set insert, and the other two applications use square nuts. Test samples were designed for the applications and printed with three different infill ratios. The production times and material consumption for these different applications were explained and evaluated. Different drawbacks and advantages were investigated for different applications. It has been observed that the strength of the basic heat-set inserts depends on the surface adhesion and is less affected by the filling rate. Advanced heat-set inserts adhere better to the surface, so the infill ratio is the determining factor in strength. The embedded nut methods depend on the infill ratio up to a certain load. As the load increases, the influence of wall thickness becomes increasingly evident. These findings not only contribute to enhancing structural integrity but also offer invaluable insights into optimizing connection methods for diverse applications.
1. Introduction
Additive manufacturing (AM), usually referred to as 3D printing, is an innovative manufacturing technique that has gained significant acclaim in several industries. Its application spans across various disciplines, such as engineering, materials science, and medicine, demonstrating its adaptability and extensive influence [1,2,3]. This technology has profound consequences for design and manufacturing, impacting the qualities of parts, design possibilities, supply chains, manufacturing methods, and business models [4].
AM is a manufacturing technique that utilizes 3D CAD model data to directly produce a physical solid model by adding material layer by layer [5,6]. This contrasts with conventional techniques of material processing. AM procedures allow for the production of intricate geometric structures, providing a notable benefit compared to traditional machining methods [7,8]. In addition, AM is utilized for the production of prototypes, tooling, and functioning goods. It also holds significant promise in the optics industry for creating mechanical components [9]. Additionally, technology is causing a shift in manufacturing business models towards the practice of mass customization, responsible production, and sustainable consumption [10,11]. AM systems can be coupled with other technologies, becoming a hybrid machine. The most common example of hybrid machines is combining AM systems with subtractive systems, such as milling machines. Parts can be manufactured as AM with milled surfaces; also, in some cases, these systems can also be used to repair parts [12].
Fused Deposition Modeling (FDM), alternatively referred to as Fused Filament Fabrication (FFF), is a prevalent AM technique [13,14,15]. One of its main advantages is its cost-effectiveness, making it accessible for personal use, education, and small businesses. FDM is compatible with a variety of materials, including ABS, PLA, and nylon, which allows for flexibility in application and functionality [16]. The biggest differences that distinguish FDM are that it can use two or more different materials in one print and that it can form cavities inside the part that are not connected to the outside. Thanks to these properties, we can use flexible and rigid materials in a single piece, 4D composite structures can be obtained with materials that react differently when exposed to temperature, or a functional gap can be created by removing one of the materials with a chemical solvent [17].
In FDM printing, by leaving gaps in the interior of the parts, the part can be made lighter without affecting the external form of the part, and these gaps can also be used for different purposes as they can react differently to sound waves and RF signals [18,19]. These spaces also allow us to insert functional objects into the part during printing [20]. These functional objects may be a magnet, sensor, or strength-enhancing support structure, or it may be possible to place fasteners such as bolts and nuts. The cavity for the fastener can be designed in the CAD process, and according to some studies, the cavity can also be calculated by the software relevant to the fastener. Using hybrid systems, nuts or other fastener parts can be embedded automatically without human interaction [21].
In many manufactured designs, it is necessary to assemble the parts together. While the bonding method can be used to connect parts produced by AM to each other or to other parts, fasteners are often preferred. In current studies, studies on fasteners produced by AM are included in the literature [22,23]. Screws and nuts produced with FDM have the ability to be designed according to need, but they also have some limitations brought about by the production method. One of these limitations is the low strength of the plastics used in FDM compared to the materials used in fasteners. Another limitation is the surface roughness caused by the layer thickness of the FDM [24,25,26]. This feature leads to both reduced strength and tolerance problems as screw diameters are reduced.
Although being able to design and produce threaded holes on the part for screw connections is one of the useful features of AM methods, it may not be applicable in cases where thread sizes are small in the FDM technique [23,27]. In applications with a thread diameter below M6, the thread tolerances increase, and the strength of the threads decreases significantly. In cases where it is not possible to use large mounting elements or where frequent assembly and disassembly are required, the use of metal fasteners is inevitable. The methods that can be used for FDM technology are generally mechanical or heat inserting of the metal nut. In the literature, there are special designs for the assembly of parts produced by AM as well as studies on the insertion of standard fasteners [28,29,30,31].
When AM is used in situations that require the manufacturing of special parts, such as unmanned aerial vehicles, electric vehicles, and prosthetic designs, situations frequently arise where the manufactured parts need to be connected to each other. In these cases, whether the manufactured part should be resistant to tensile-compressive force or bending changes the type and design of the connection. In this study, three different connection techniques were produced by additive manufacturing, and the response of these methods to bending and tensile forces was examined.
In this study, the four most commonly used fastener implementation methods in FDM were manufactured in three different infill ratios, and experiments were performed. For the first two methods, brass inserts used in injection molding are heated and mounted in parts after the printing process is completed. In these methods, the cavity for the insert is designed to be adequately wide. The installation is carried out by melting the surfaces of the cavity where the heated insert is placed. In the third method, a cavity is designed for both fastener and installation. After the printing is completed, the material is installed into the cavity of the part. In the fourth method, a cavity is designed only for the fastener. When the printing process reached the layer lined with the upper surface of the fastener, the fastener was placed manually or automatically, and the printing process was completed with the remaining layers. In the last approach, there is no need to perform postprocessing after printing. In the last two methods, square nuts were used instead of a hexagonal nut to reduce damage to the cavity surface during the tightening of a shell. Square nuts can hold more torque compared to hexagonal nuts [32,33]. The CAD designs of these four methods were manufactured with a 3D printer and compared experimentally.
Firstly, test samples were designed for tensile strength and three-point flexural and torque testing. The experimental setup was designed to assess four different sample designs across varying infill ratios. According to the experimental setup, four designs for tensile strength tests, five designs for flexural tests with a blank one without a fastener, and four designs for tightening torque tests were performed. For each of these designs, samples were manufactured with 10%, 20%, and 40% infill ratios. For each test, 12 repetitions were run, and a total of 144 tensile, 180 flexural, and 144 torque tests were performed.
2. Design of Different Fastener Implementations
Considering the inherent properties of most plastics, difficulties are encountered when trying to cut threads into them. In particular, the material yield strength of plastics used in the FDM method is lower than metals. Due to the limitations of FDM technology, small diameter tapped holes cannot be accurately manufactured with a 3D printer. Even with the latest reinforced plastics, these threads will not withstand excessive forces or wear down quickly [34].
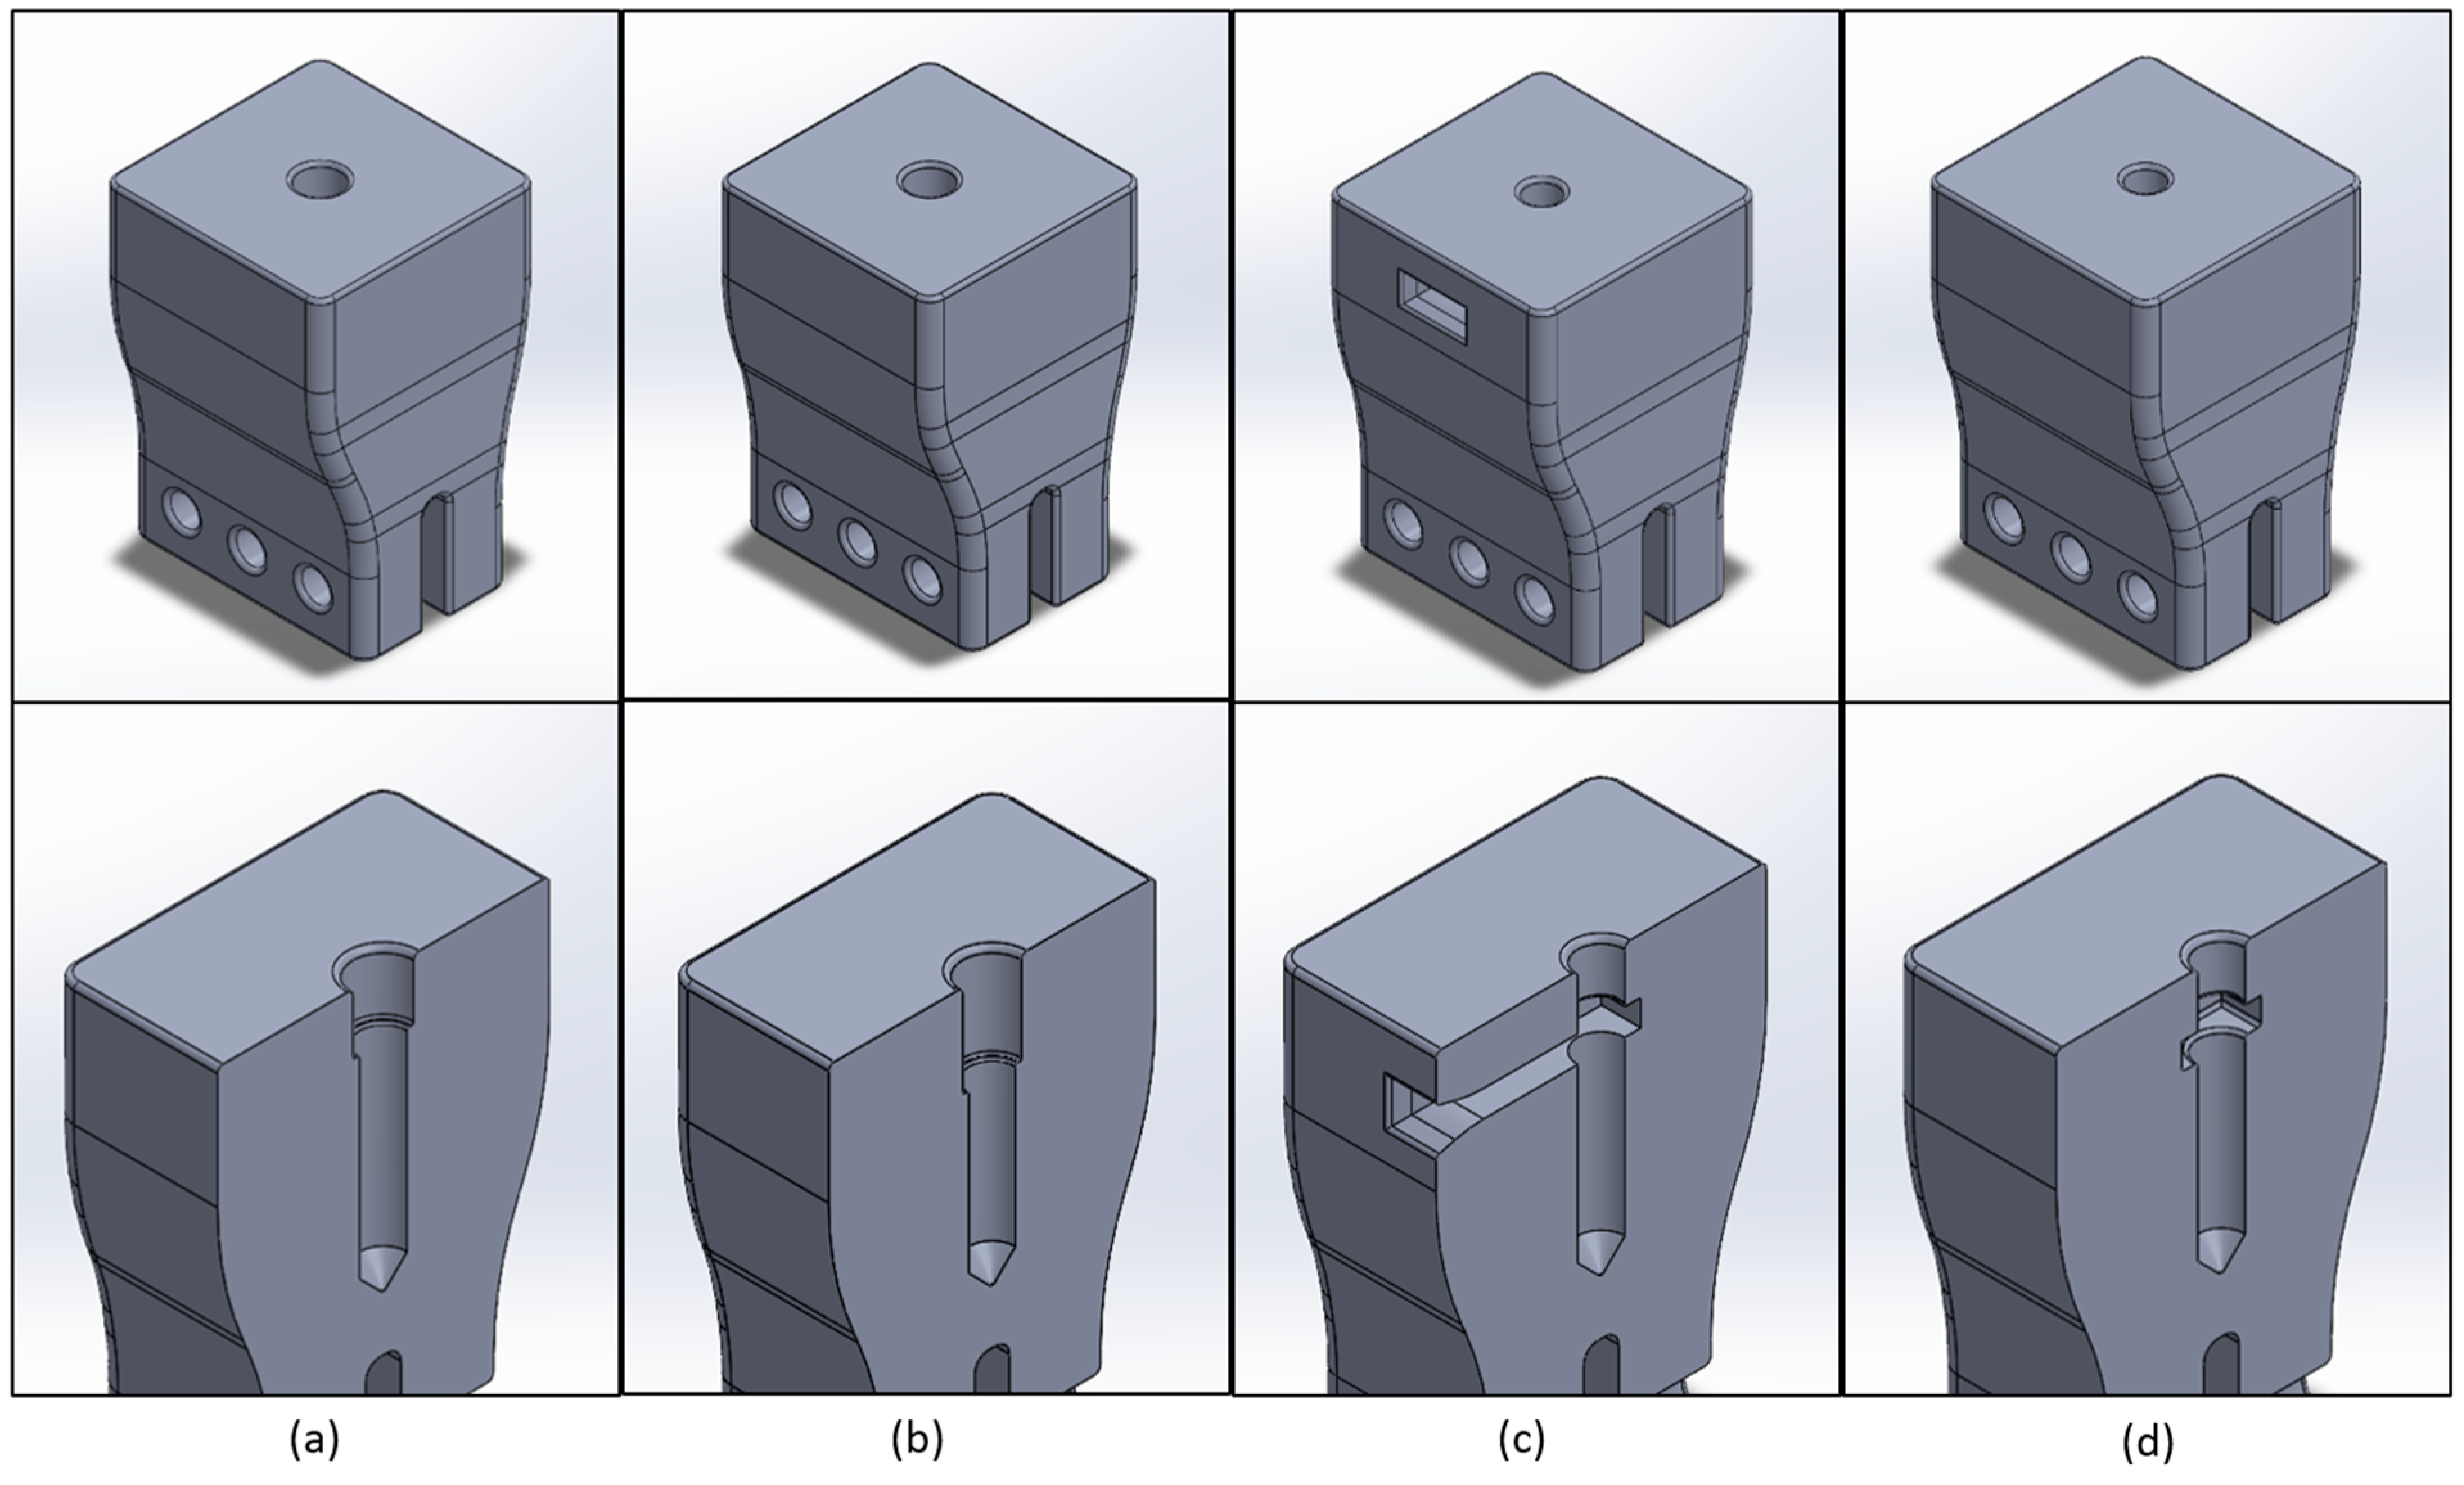
A more reliable solution for these situations is to add metal fasteners into the printed parts, such as nuts. Fasteners are implemented using various techniques, depending on the application and materials involved. Common techniques include heat-set insert and captive nut. In this study, four methods are examined, which are heat-set insert installation, side nut installation after printing, and nut installation into the part during printing. CAD designs of these inserts and square nut are presented in Figure 1. Each technique is chosen based on factors such as strength requirements, ease of assembly, permanence, and environmental conditions. In the first two methods discussed in this study, as it is presented in Figure 2a,b, the hole is designed to be adequately larger than the bolt size, and the heat-set insert presented in Figure 1a,b is heated and inserted into the hole after the manufacturing of the printed part. The heated metal insert melts a small layer of the hole surface and creates a bond. In the third method presented in Figure 2c, a suitable cavity is added to the design for the nut to be inserted in. After completing the printing process, a square nut presented in Figure 1c is inserted in its place through that added cavity. In the fourth method presented in Figure 2d, a nut is placed during the printing process. After printing the layer corresponding to the top surface of the nut, the printing process is paused. The nut is placed into the cavity designed just for the nut, either manually or automatically, and the printing process is continued with the remaining layers. In this approach, there is no need for a postprocess or extra cavity to place the nut.
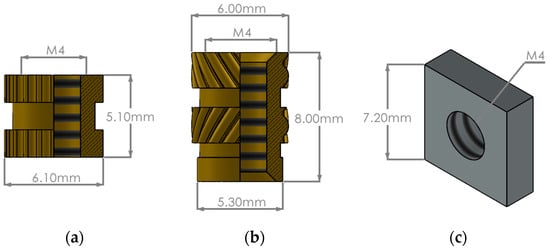
Figure 1.
Dimensions of (a,b) heat-set inserts and (c) square nut.
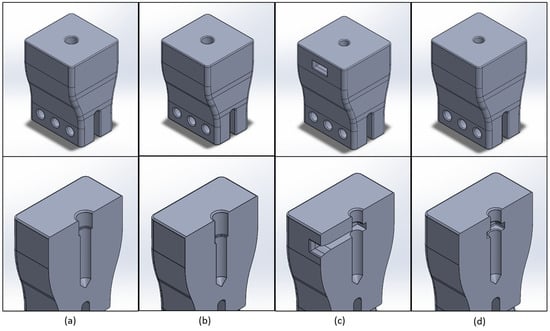
Figure 2.
Solid models with cross-section of test samples: (a) type I.a, (b) type I.b, (c) type II, (d) type III.
The cross-section of the samples was carried out in such a way that the impact of the walls was as small as possible, and the evaluation of the effect of the infill was easier. Samples were designed as 40 mm by 40 mm squares. For type II and type III samples, the distance between the top surface and the nuts is 8 mm.
The tensile strength test samples in this study were also designed keeping less manufacturing time and material consumption in mind. A sheet metal was installed with three bolts, and the metal part was held with the pneumatic jaws of the test bench. The metal part was easy to exchange between test samples, so that only one metal part was enough. The bolt screwed into the nut in the sample was held with the upper part designed especially for this study.
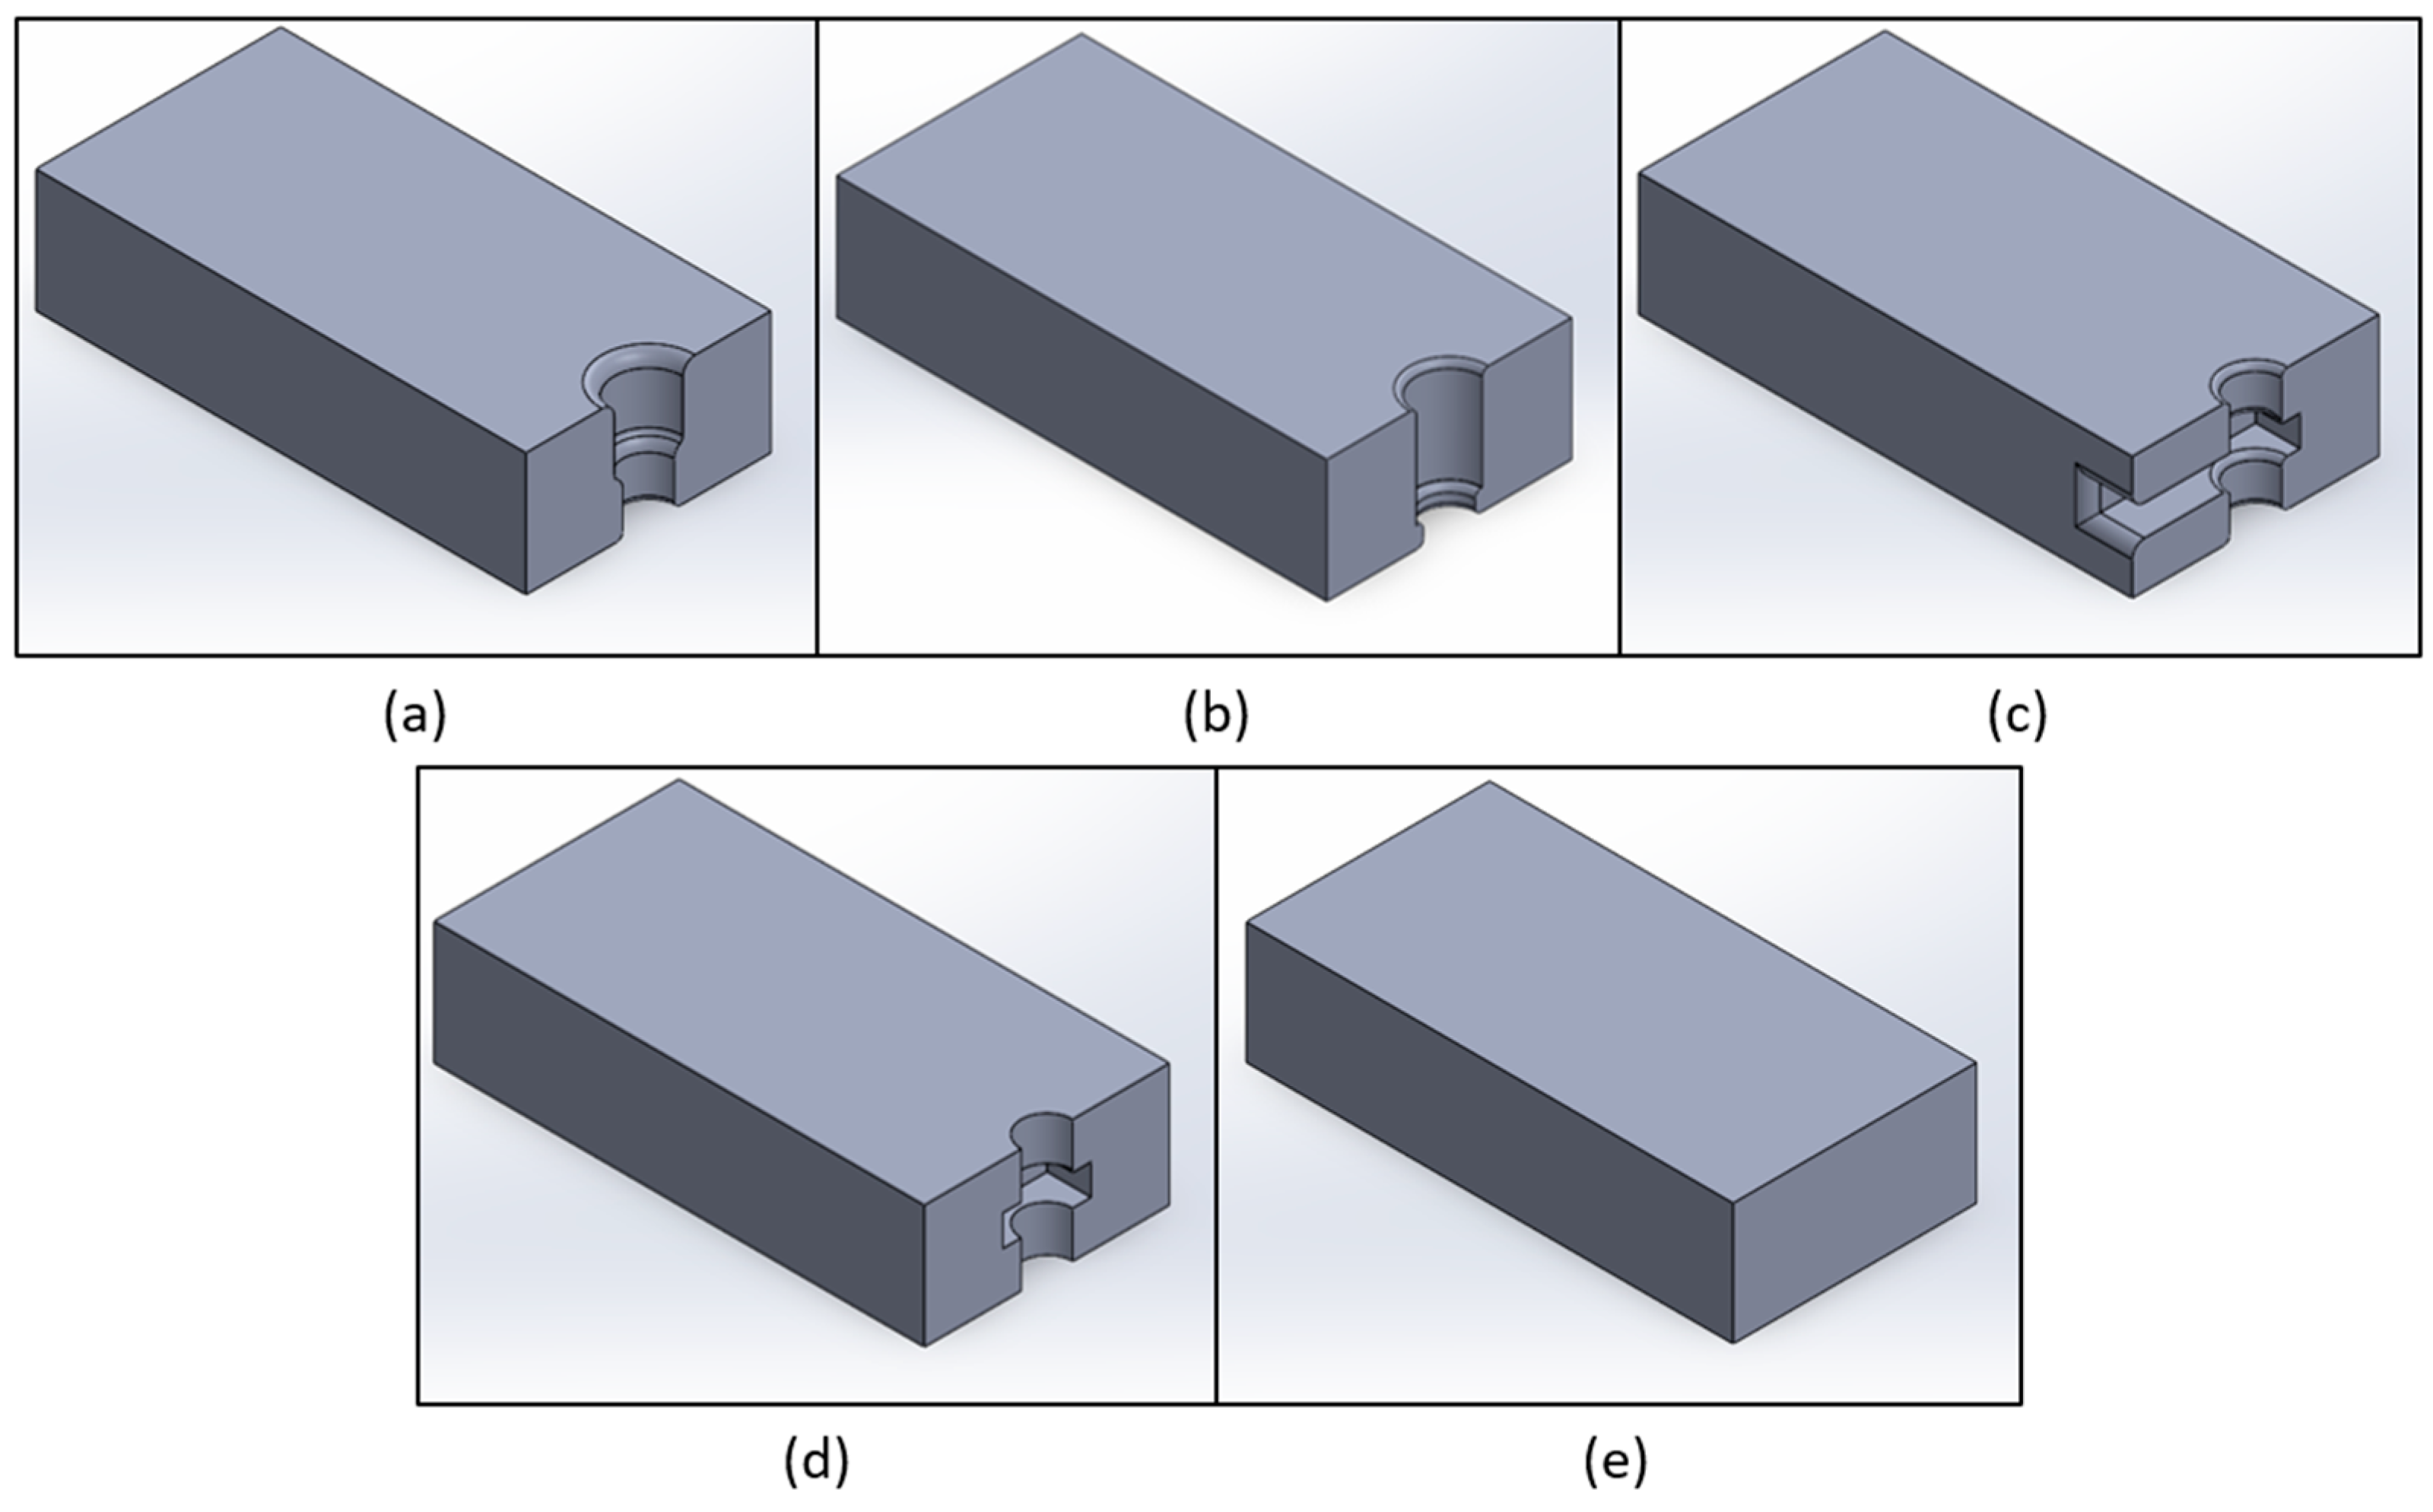
Samples are also designed for three-point flexural with each fastener implementation approach, and a blank design was added to the test for the reference. The test samples are designed according to ISO 178 standards. The width of the samples is 20 mm, and the thickness is 10 mm. The length of the samples is 80 mm, and the fasteners are placed in the middle of the part. Cross-sections of the flexural test samples are given in Figure 3.
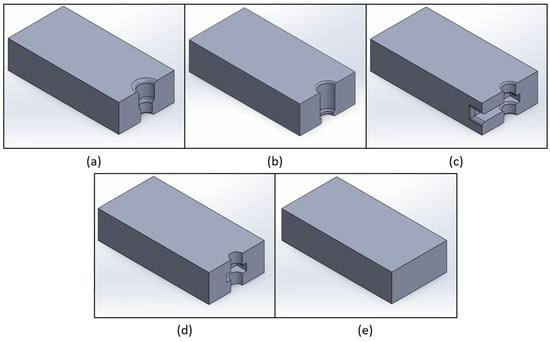
Figure 3.
Cross-sections of flexural and torque test samples: (a) type I.a, (b) type I.b, (c) type II, (d) type III, (e) blank.
Flexural test sample design is also used for torque tests. Torque tests were executed by tightening the screw until the nut slips inside and spins free. A large washer is placed under an 8.8 standard M4 machine screw.
Solid models were designed in SolidWorks, and CAM operations were executed on the AM software Prusa Slicer. Printing parameters were kept close to the most preferred values for parts, so a lighter design was appreciated.
2.1. Manufacturing Process
Printing parameters, especially layer height, nozzle temperature, and material flow, are the most important factors for ensuring the quality and strength of the part [35]. The printing speed and melted plastics flow rate was limited to 100 mm/s and 10 mm3/s to ensure that the results were affected as little as possible by other factors [36]. The negative impact of ambient temperature variation on the results when printing PLA is known [37]. To minimize this effect, the printer’s closure was closed, and the internal temperature was kept at around 40 °C.
Samples were manufactured with 2 wall perimeters, 3 bottom perimeters, and 4 top perimeters. For the material, the PLA+ filament produced by one of the most common brands, ESUN, was preferred [38]. Gyroid infill was preferred due to its advantages in terms of better three-dimensional properties. Gyroid infill gives good results for parts with lower infill ratios as being one of the strongest infill patterns [39,40,41].
Print temperature is also one of the most important parameters in FDM [42]. Based on the preliminary experiments conducted before this study and other studies in the literature, it was decided that the initial layer temperature would be 215 °C and the printing temperature would be 210 °C [43,44].
Samples are manufactured on a CoreXY FDM 3D printer. The device is operated with Linux based Klipper software and has a direct extruder with gear reduction for more reliable extrusion. The printer is capable of printing at 300 mm/s speed and 16 mm3/s melted plastic flow and has a 300 mm × 300 mm × 300 mm print volume.
Before manufacturing the samples for this study, a series of experiments were carried out to determine the consistency of the printing process. In the FDM process, layer printing time is an important factor for both the visual quality and strength of the printed part. Tensile strength test parts were printed in batches of 4, 9, 16, and 25 pieces at once. Batches printed as 4 or 9 pieces have almost the same tensile strength, but batches with 16 or 25 pieces have a lower strength. Pieces could be printed separately, but this scenario would not be realistic as real-life parts will most likely be larger than these test samples. Based on these results, the tensile strength test samples used in this study were printed as 9 pieces per batch, and the three-point flexural and torque test samples were printed as 8 pieces per batch.
For this study, 144 samples for the tensile strength tests, 180 samples for the three-point bending tests, and 144 samples for the torque tests were produced; for each test, 12 samples and three different infill ratios were used.
2.2. Experimental Setup
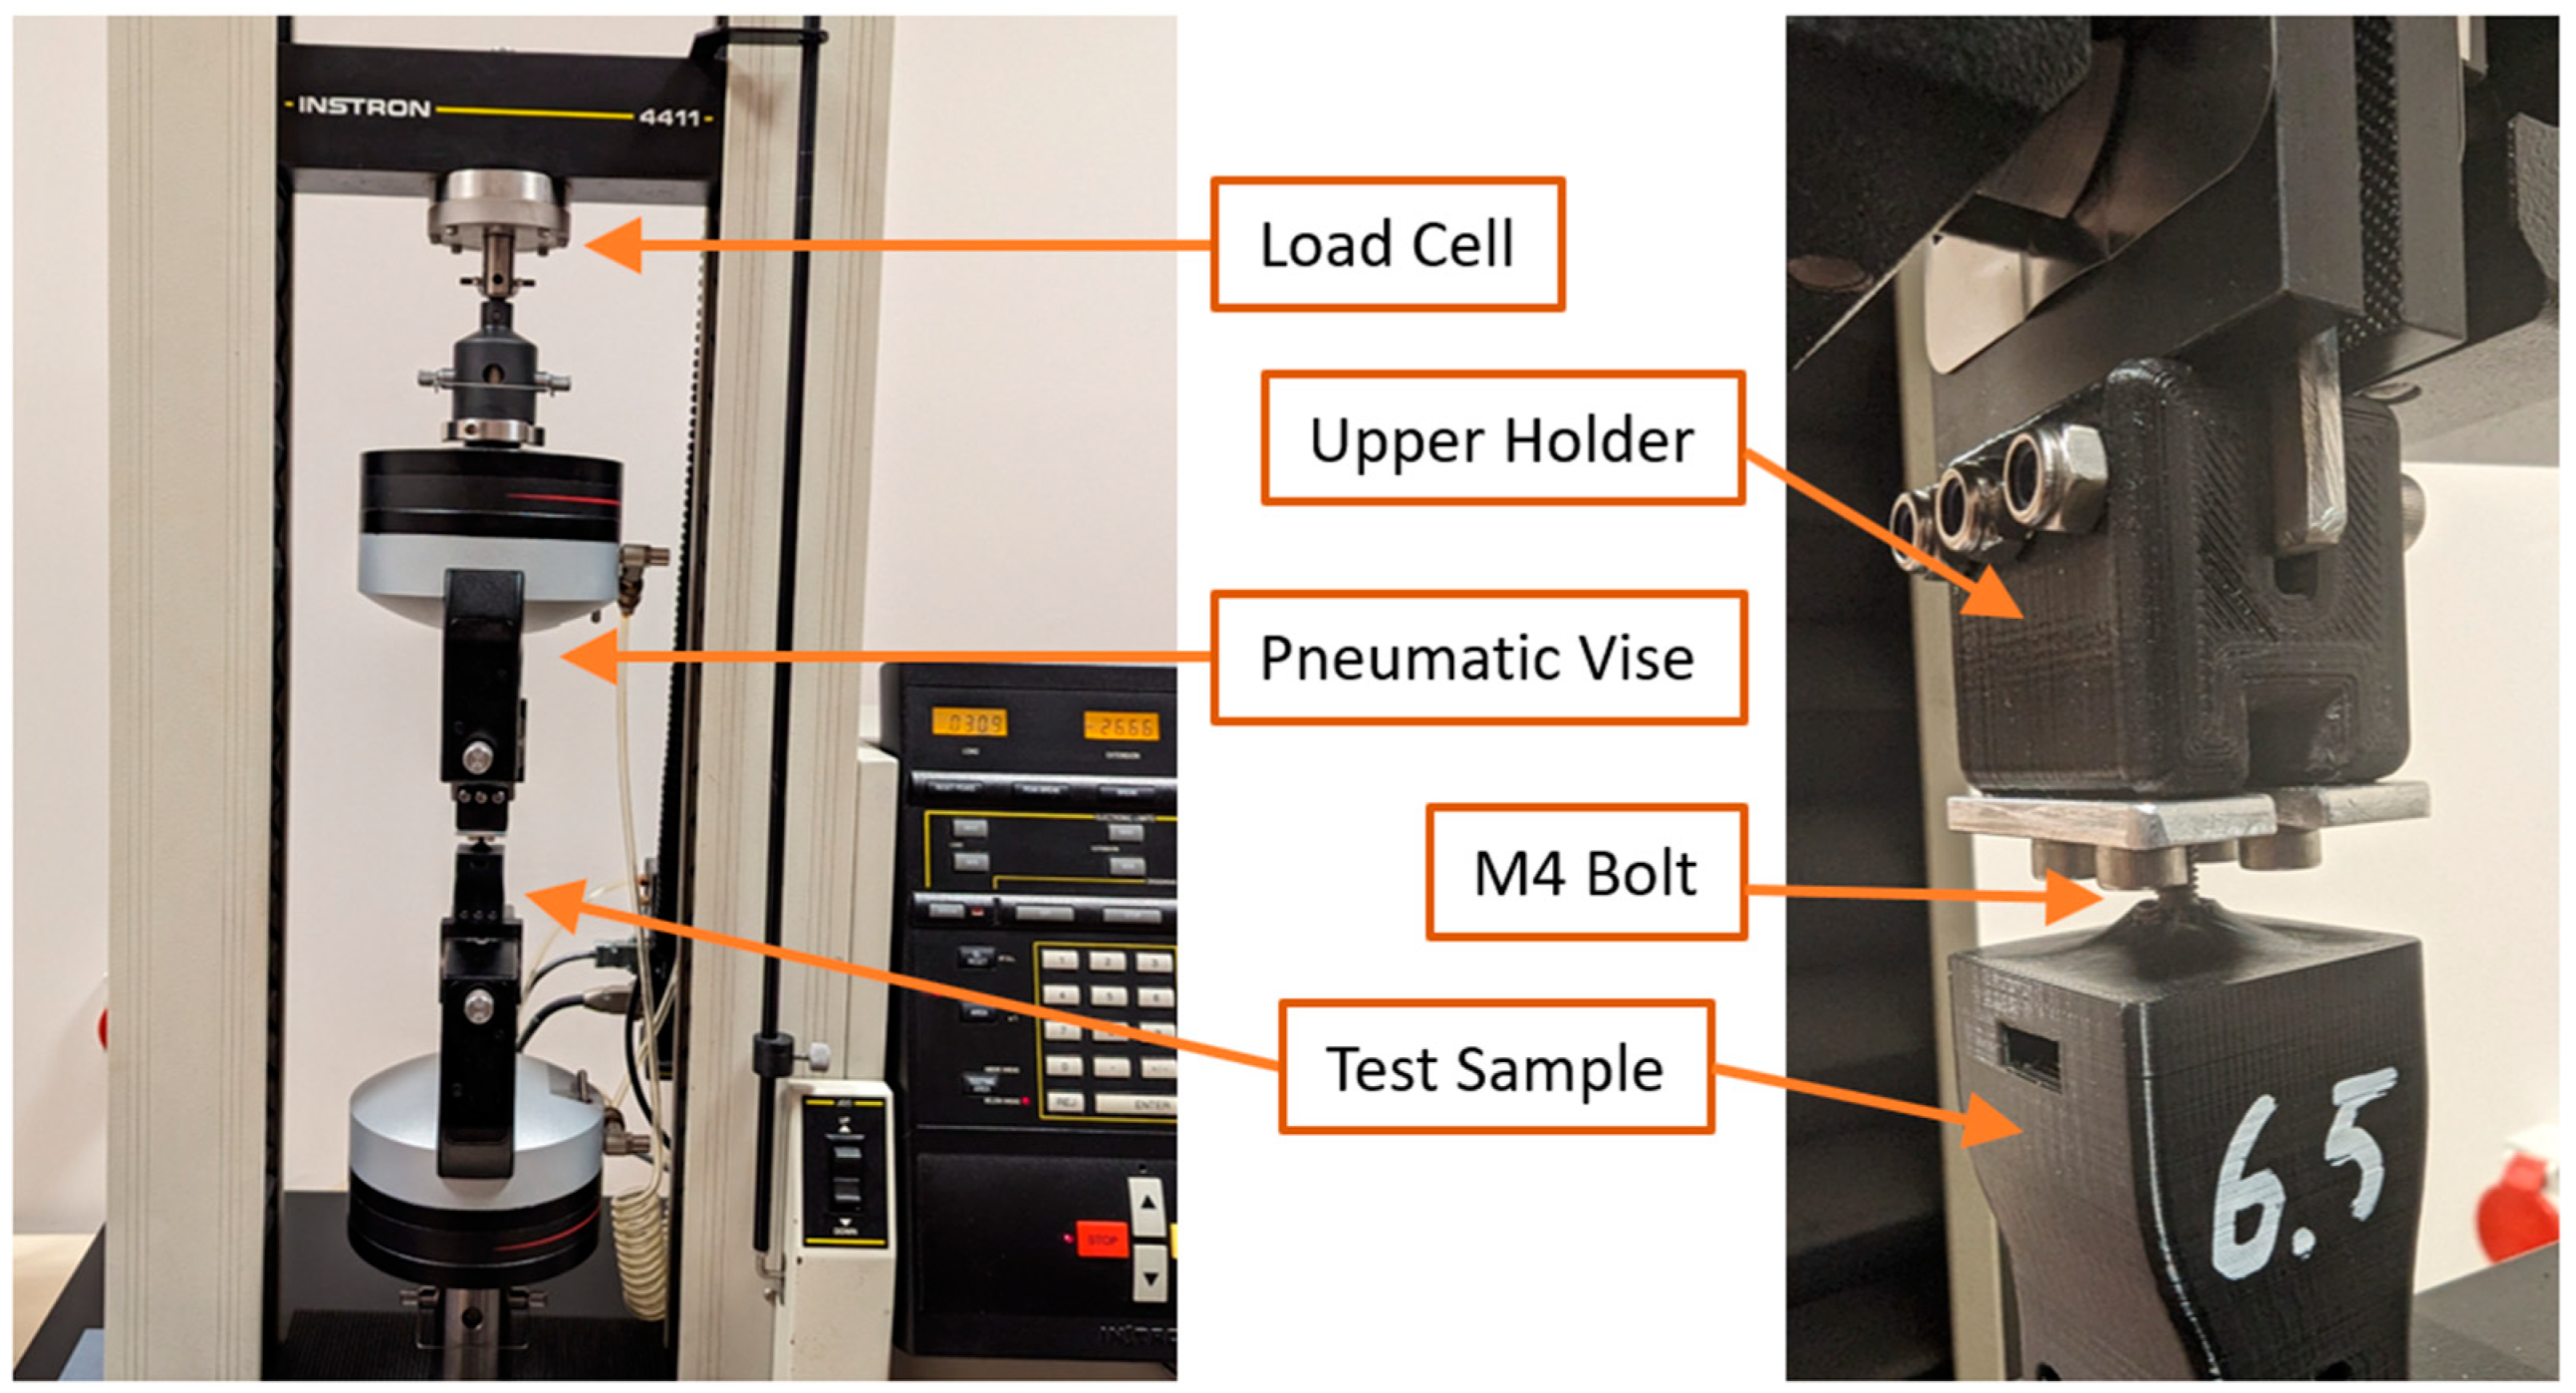
Samples were designed to fit the pneumatic mandrel on the tensile test machine. The upper part is designed for faster and easier sample changing and is supported with metal pieces to withstand more than a hundred tests. After more than 400 tests run with the same upper part, there was no wear or problem.
The test sample and the upper part are shown in Figure 4. A lower metal plate is attached to every test sample with three bolts. This design can be tested on any universal test bench using a vise, thanks to the metal tab on each end.
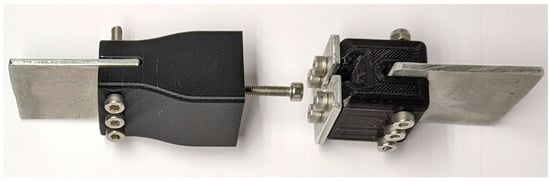
Figure 4.
Tensile test sample assembly.
The testing device used in this study is an Instron brand 4411 model universal test bench with a 5 kN load cell capacity. The device is equipped with a pneumatic vise system for easy and quick sample change. The test setup details are presented in Figure 5.
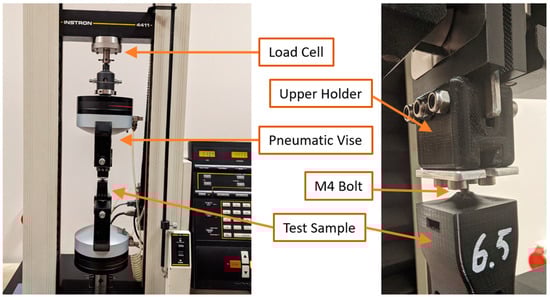
Figure 5.
Tensile test bench setup.
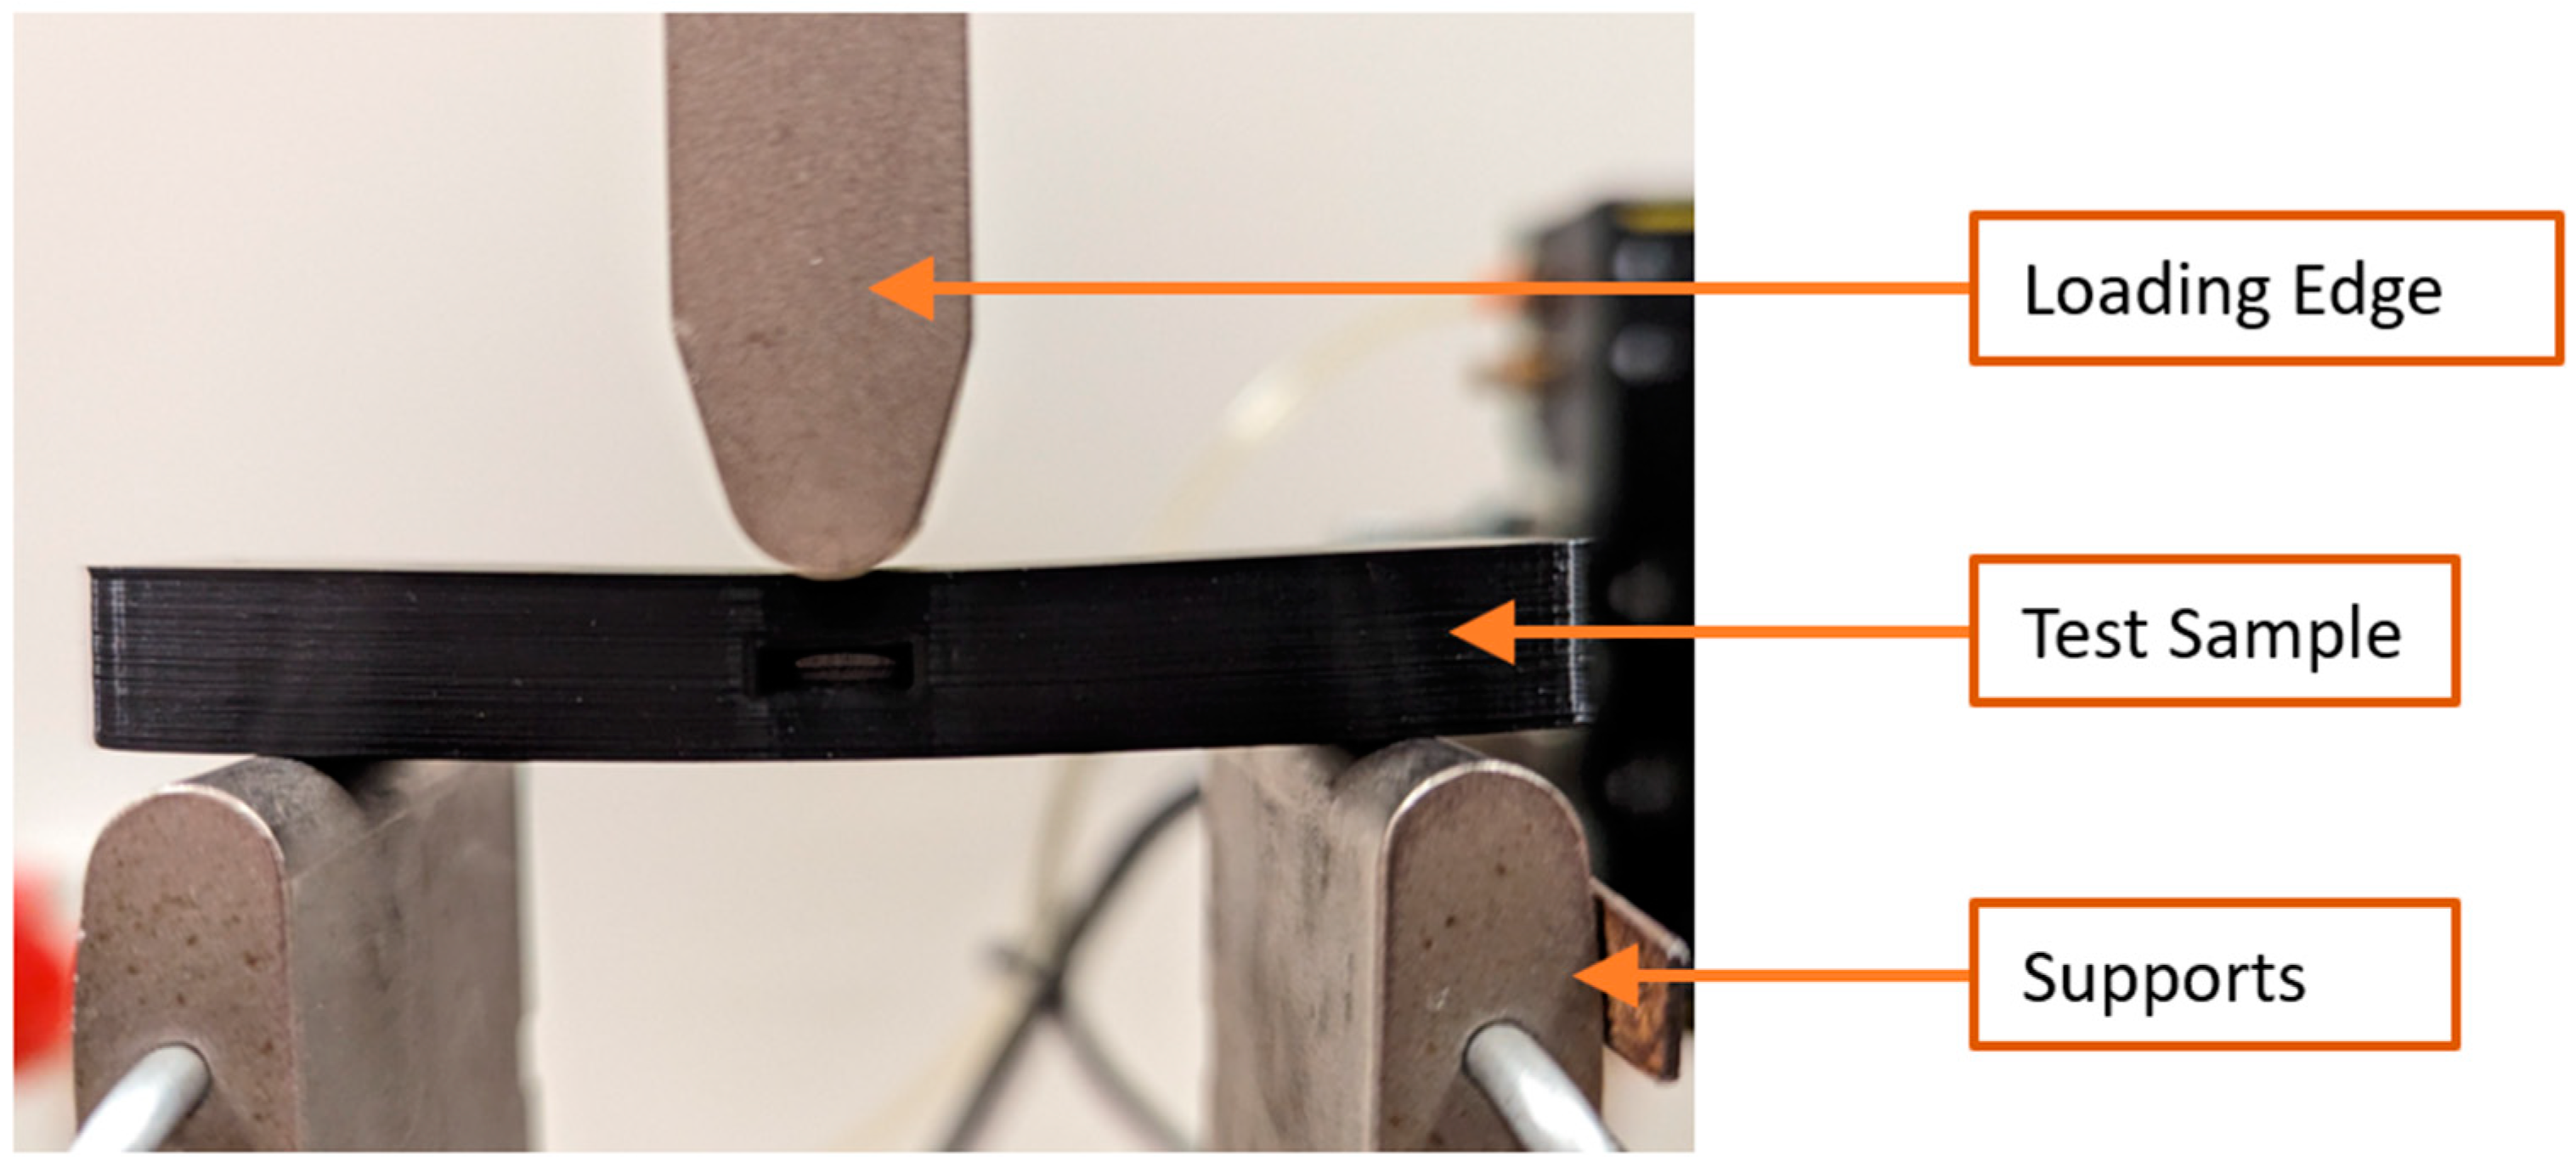
The three-point flexural test setup is presented in Figure 6. The samples of the three-point flexural test were designed according to ISO 178 standards, and the test setup was set up as recommended in the standard. The cross-section of the samples is 10 mm × 20 mm, the length is 80 mm, and the clearance between the two support points of the test bench is set to 66 mm.
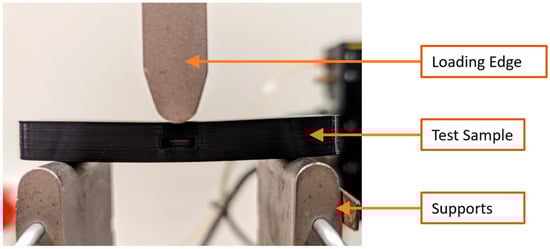
Figure 6.
Tensile test bench setup.
Every sample was marked right after the printing process and issued on a log file. Samples were placed on the bench, and tests were run at 5 mm/min speed at a steady 20 °C room temperature. Loadcell data were recorded to the computer at a rate of 1500 readings per minute by Bluehill software. The results were exported to the statistical analysis software given in the Results section.
A digital torque sensor was used to record torque data while tightening the screws. Instant torque data and maximum torque were recorded to a computer through serial data connection. Ultimate torque values were collected from the log file, and the average of the ultimate torque strength is concluded in the study.
3. Results and Discussion
In this study, three different sample designs for the tensile strength test and four different sample designs for the three-point flexural test were produced in three infill ratios. A total of 144 samples, 12 parts in each, were tested for tensile strength. A total of 180 samples, 12 parts in each, were tested for three-point flexural with an Instron test bench. A total of 144 samples, 12 parts in each, were tested for torque.
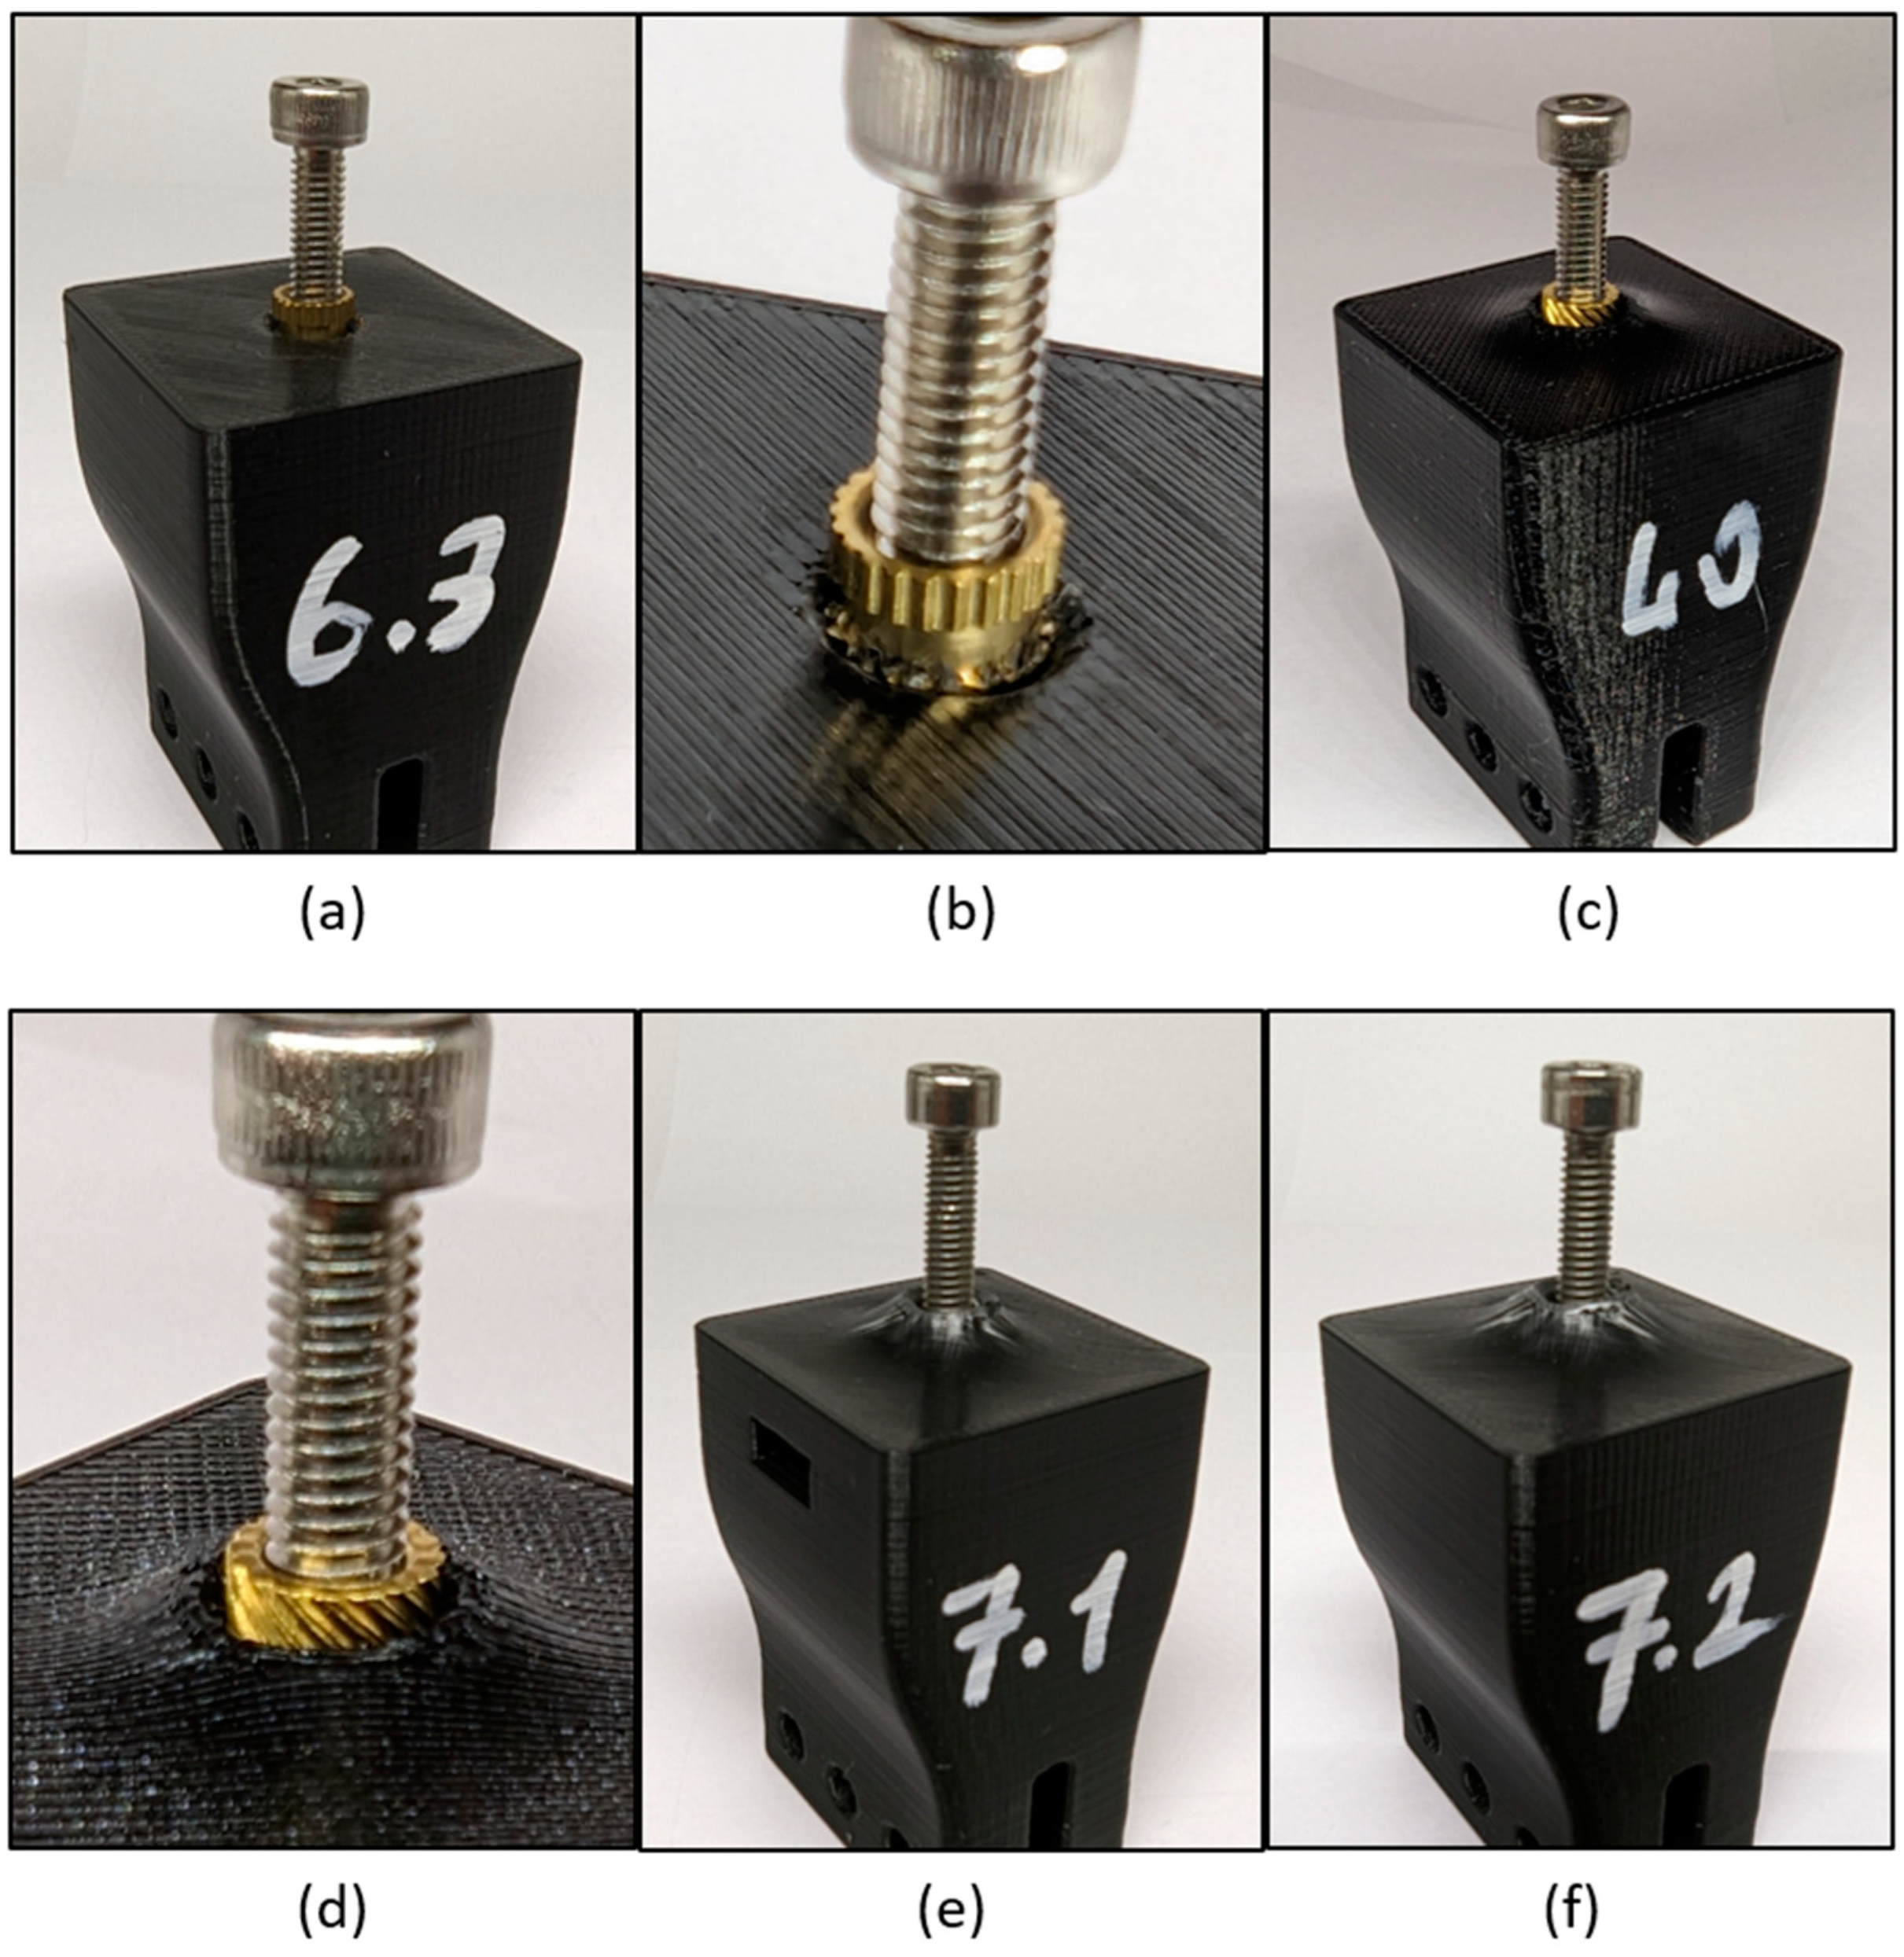
The deformed samples are shown in Figure 7. In Figure 7a,b, it is observed that the heat-set inserts came off when separating from its surface inside the type I.a samples. The insert used in type I.b does not easily separate from the surface under load and disintegrates the infill structure. During the tests of type I.b samples, minimal deformation was observed on the surface before reaching ultimate strength. The other two types of samples shown in Figure 7c,d were deformed by first disintegrating the infill structure and then tearing the upper surface of the part.
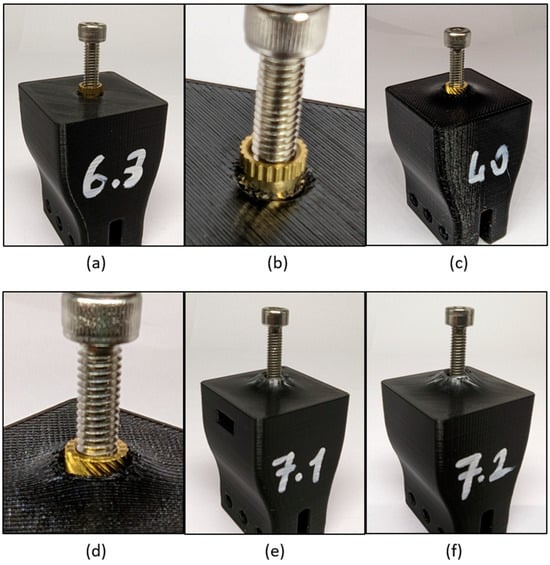
Figure 7.
Sample parts after tensile test: (a) type I.a, (b) type I.a detailed, (c) type I.b, (d) type I.b detailed, (e) type II, (f) type III.
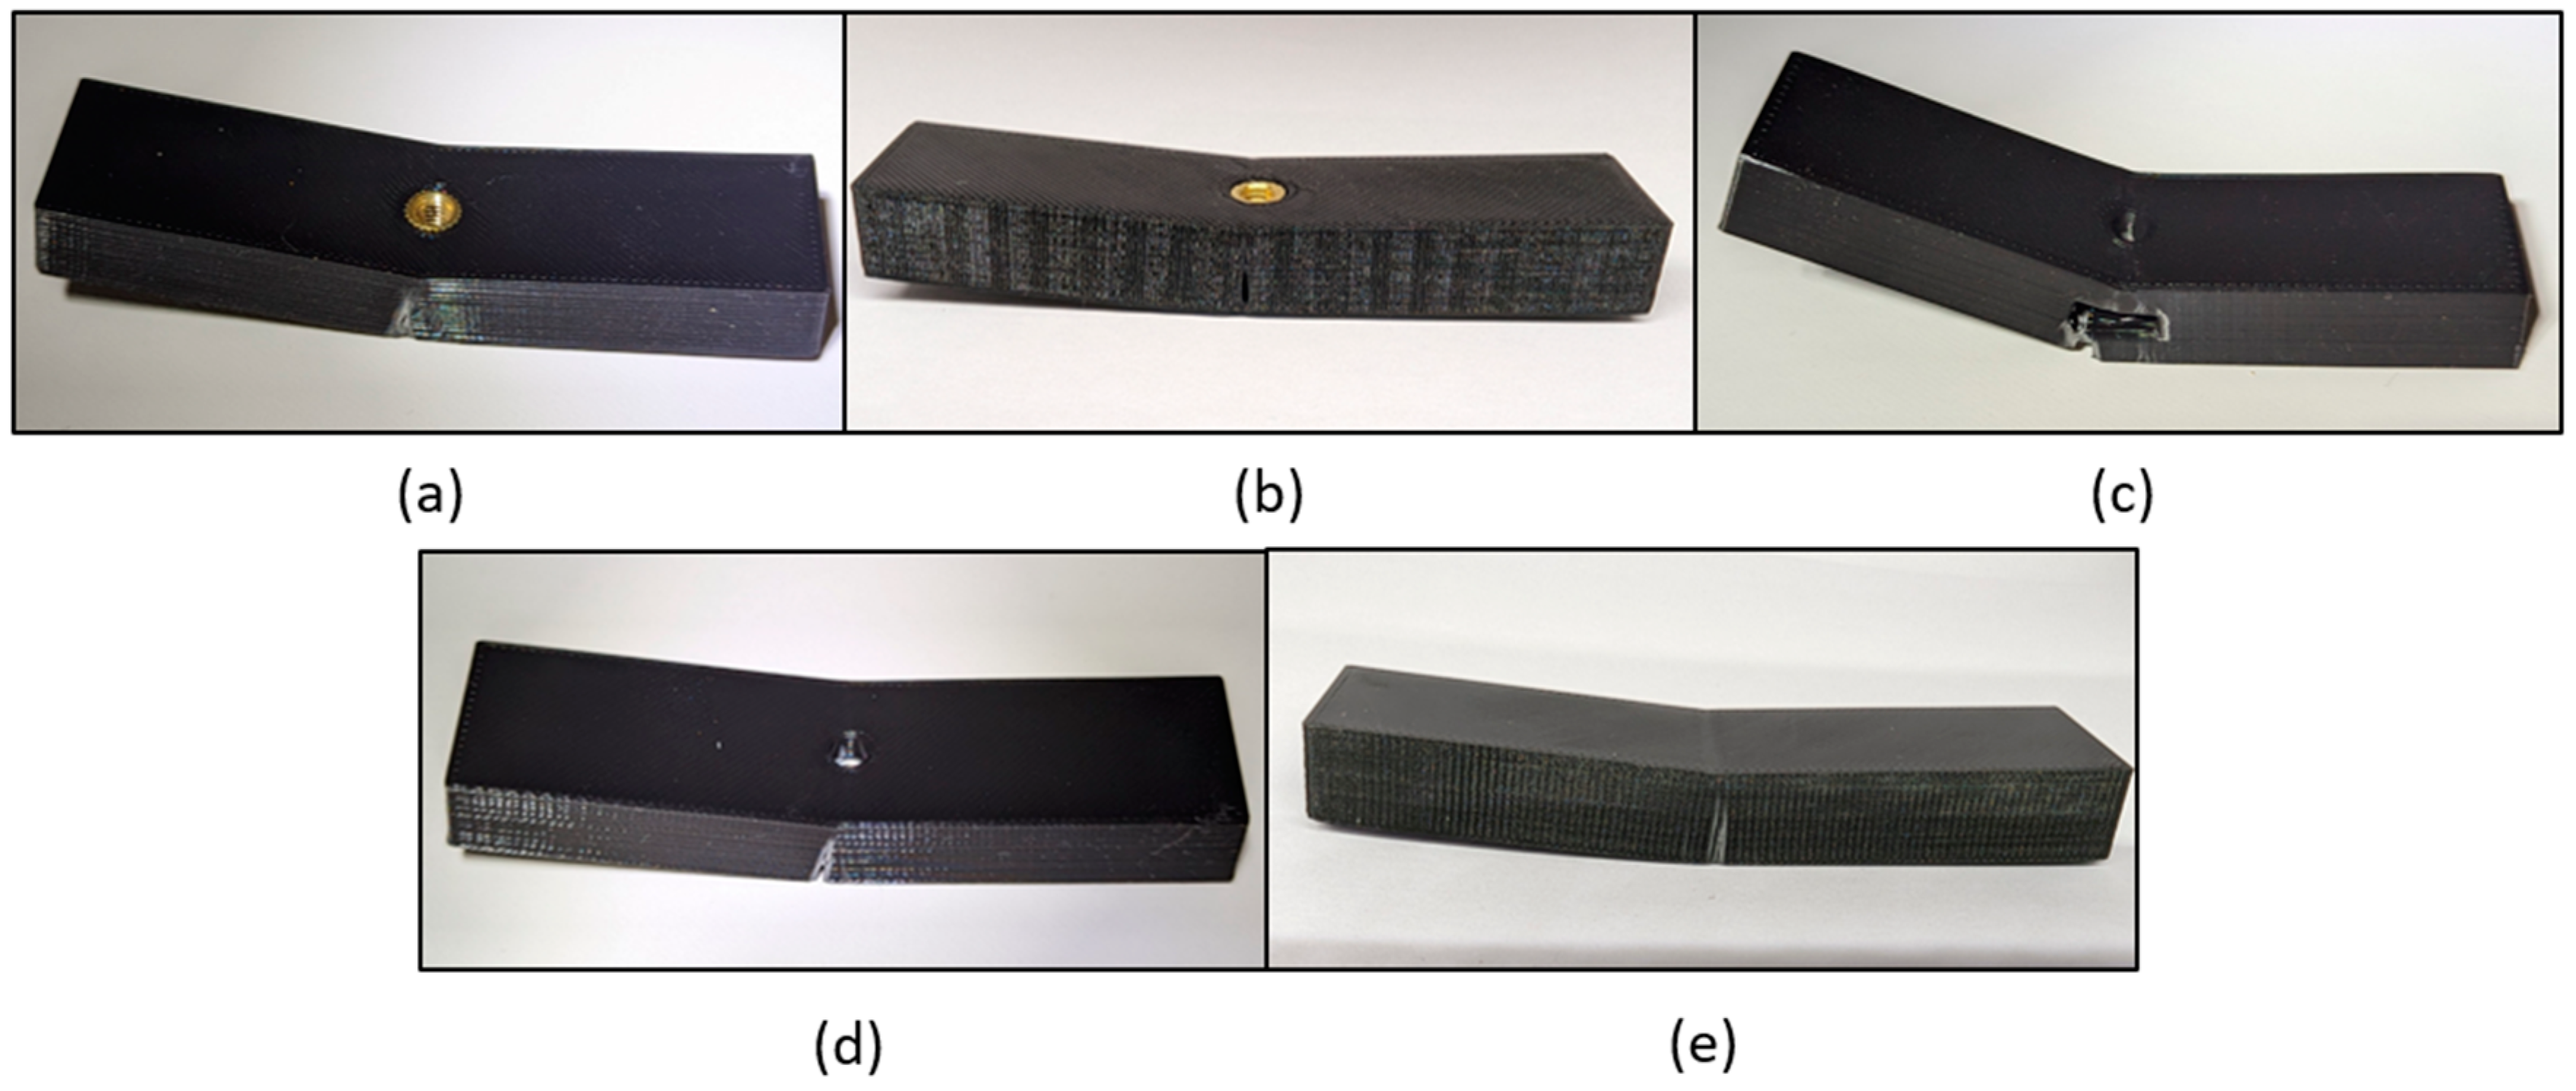
The three-point flexural test samples are shown in Figure 8. Type I samples show minimal cracks, as well as blank samples. Among all the samples, type II samples have the most damage, with more crack lines, and some of the type I.b samples were cracked into two pieces.
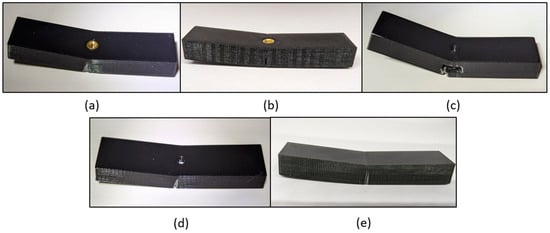
Figure 8.
Sample parts after flexural test: (a) type I.a, (b) type I.b, (c) type II, (d) type III, (e) blank.
After the torque tests, no visible change was observed on the outside of the samples. In the type II samples, it was observed that the square nut first rose by breaking the infill between the nut and the bolt, and then it started to spin freely. In type III samples, it was observed that the screws were stripped in some of the 40% filled samples.
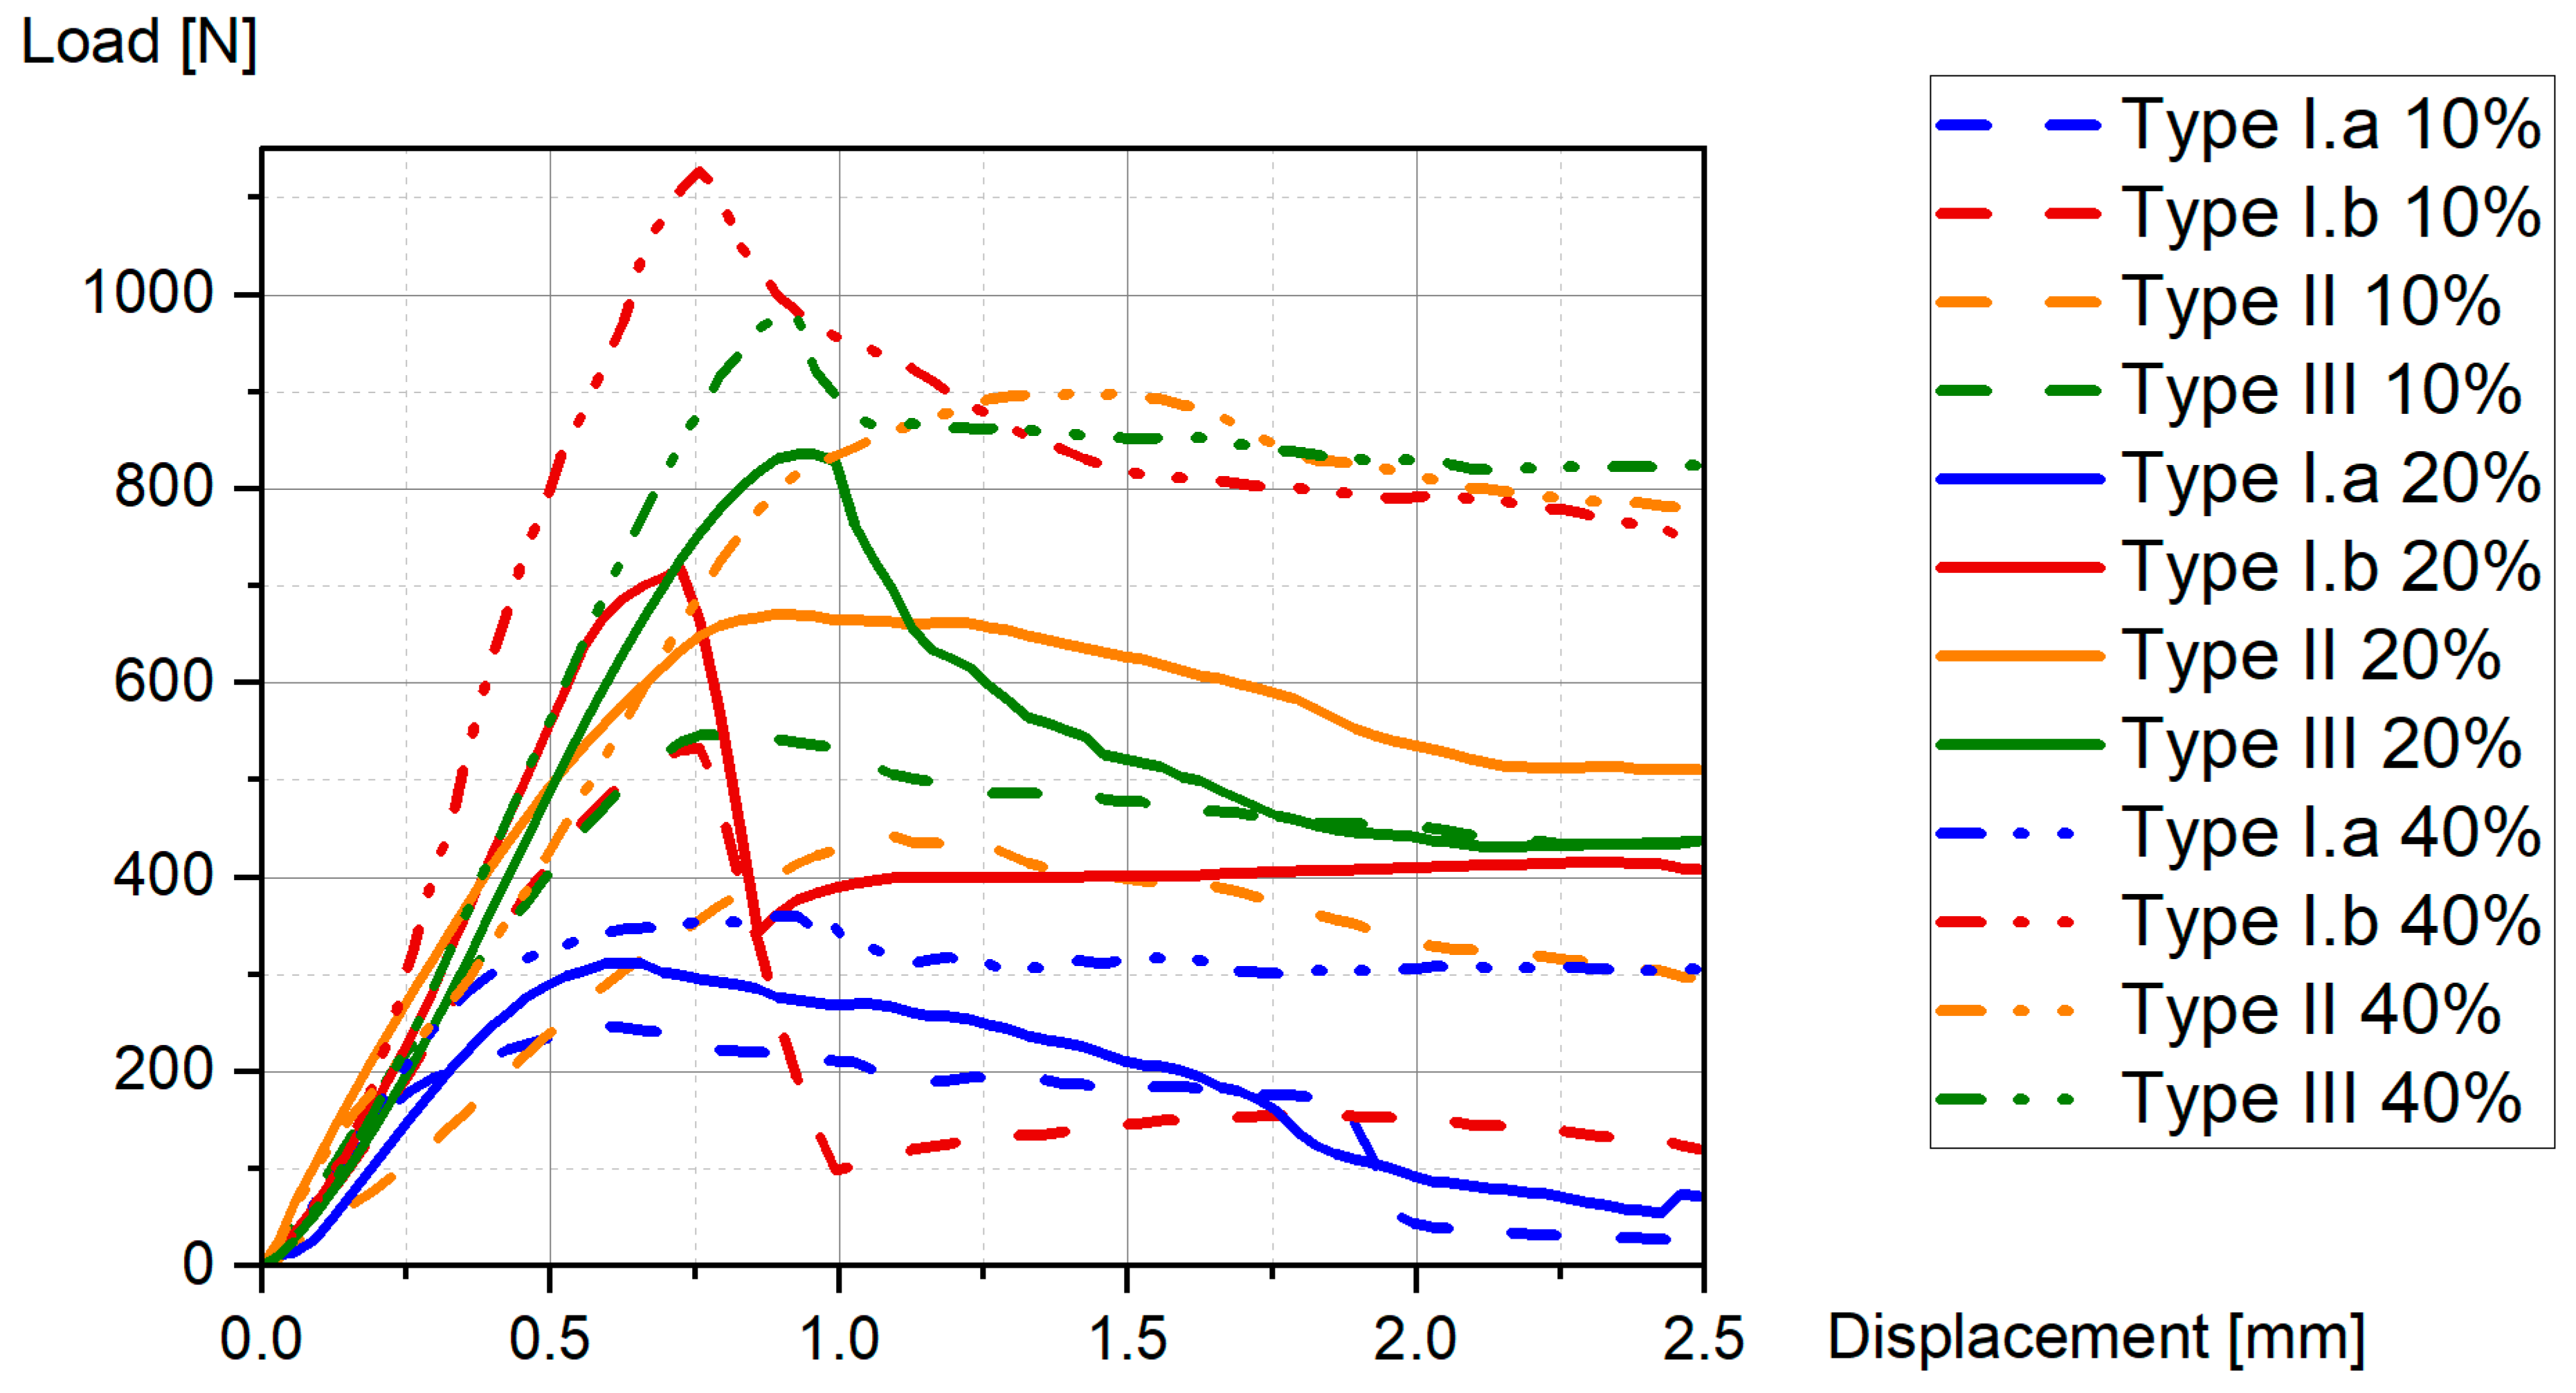
The tensile test results for one of each group are given in Figure 9. Each of them becomes more durable as the filling ratio increases, but this is not a linear relationship. Additionally, with increasing infill ratios, the type III design becomes more brittle.
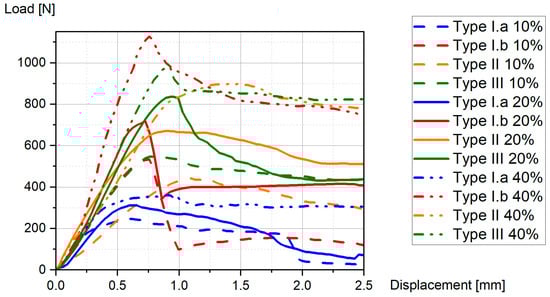
Figure 9.
Tensile test load/displacement results.
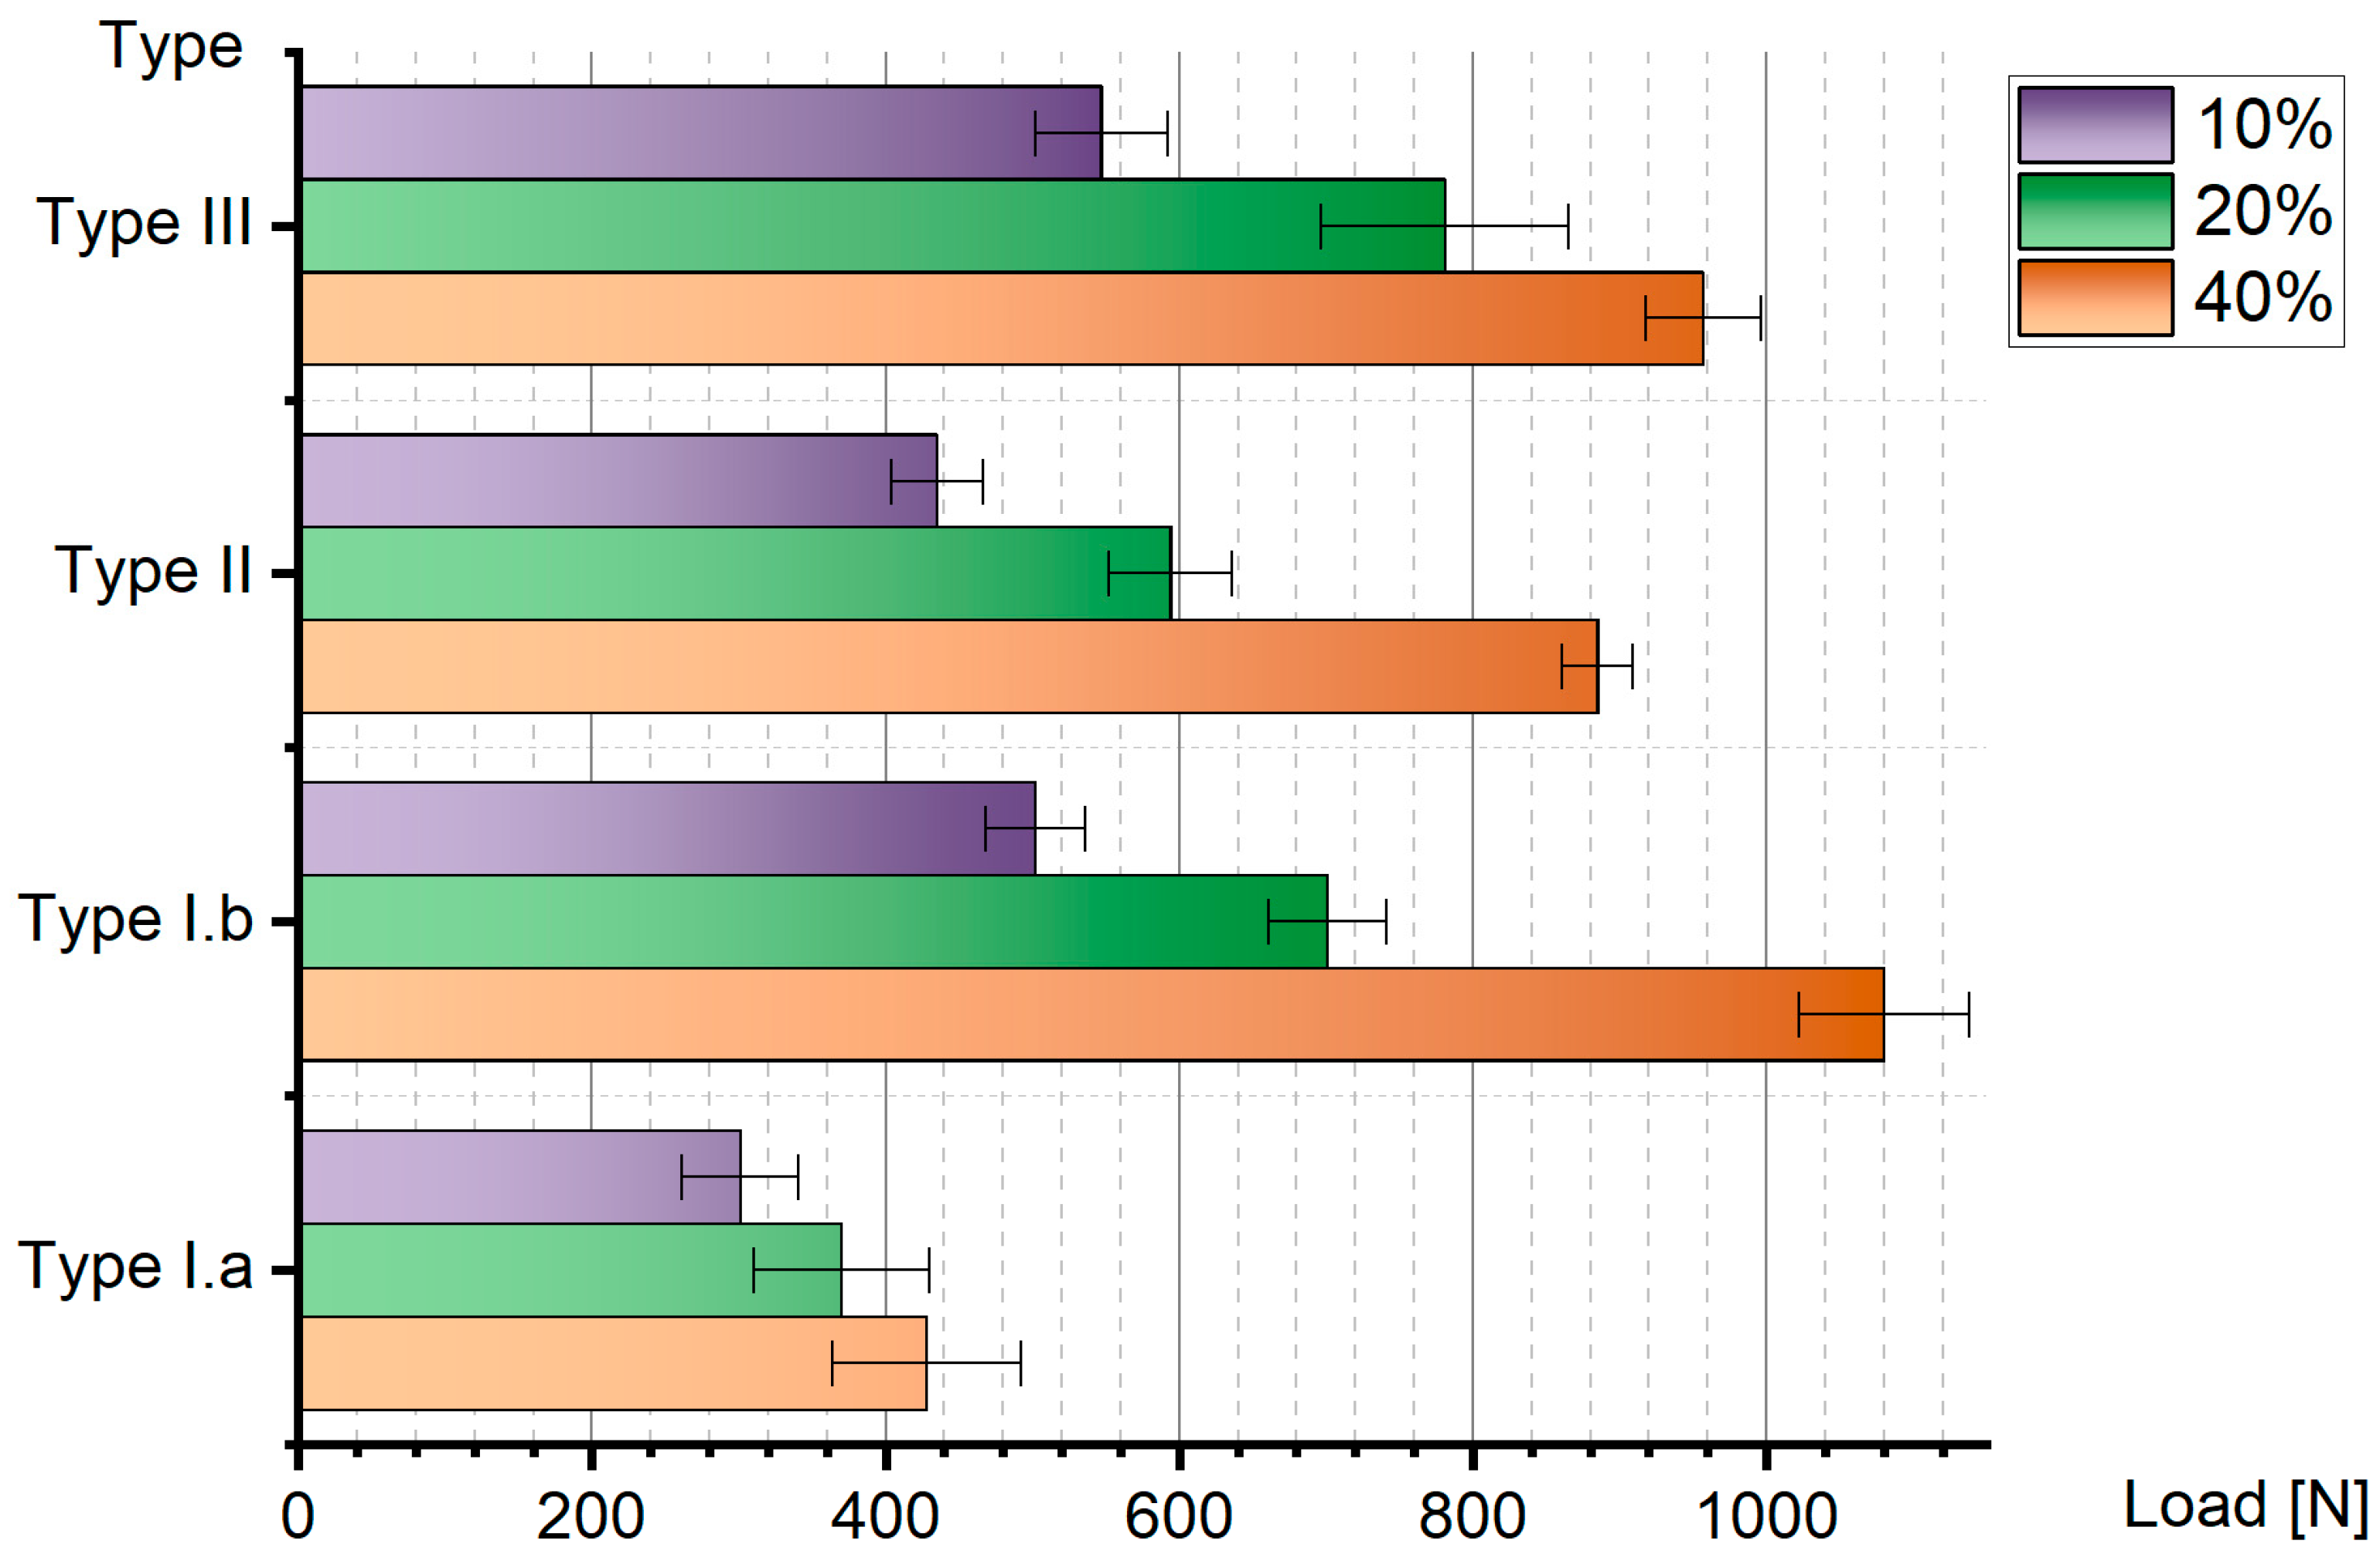
The average ultimate strength of all the tensile samples is shown in Figure 10. Type I.a samples with 10% infill have an average of 301 N tensile strength and 13% standard deviation. Samples with 20% infill have 370 N tensile strength and 16% standard deviation. Tested samples with 40% infill have 428 N tensile strength and 14% standard deviation. The strength of type I.a samples varies slightly depending on the infill ratio compared to the other designs. In type I.a, the force transfer between the fastener and the part body occurs through the cylindrical surface that melts during the assembly of the fastener. The surface area between the fastener and part body remains the same regardless of the infill ratio; because of this, strength is not directly related to the infill ratio.
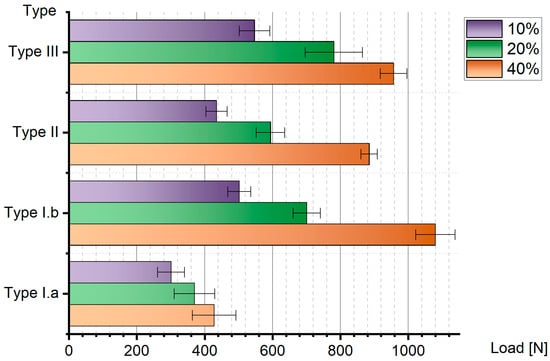
Figure 10.
Tensile test results of samples.
Type I.b showed the best result of the tensile test: for the samples with 40% infill, the average strength is 1080 N with a standard deviation of 6%. Samples with 10% infill have 502 N strength with 7% standard deviation, and 20% samples have 701 N strength with 6% standard deviation.
Type II samples show significant improvement in terms of increasing the infill ratio, and the results are almost linearly related to infill. For the 10% infill ratio, the average tensile strength is 435 N, and the standard deviation is 7%. Samples with 20% infill have a tensile strength of 594 N with a standard deviation of 7%. Type II samples printed with 40% infill have a tensile strength of 885 N with a standard deviation of 3%.
The results for type III samples show some improvement with increasing infill. The average tensile strength of the 10% infill samples is 547 N, and the standard deviation is 8%. A significant increase is observed between 10% and 20% infill samples, but the change is very small when the infill ratio is increased to 40%. The average tensile strength of 20% infill parts is 779 N with a standard deviation of 11%; for 40% infill parts, the strength is 957 N, and there is a standard deviation of 4%.
Comparing the three types of samples with 10% infill, we can see an obvious alignment as type III is, on average, 26% stronger than type II, which is 45% stronger than type I.a. As seen in Figure 10, the differences are approximately 125 N. While type I.b and type II samples are in the middle in terms of tensile strength, blank samples are at the weak end in terms of flexural strength. Type III samples are the strongest in both results for 10% infill.
Three-point flexural tests were carried out according to the ISO 178 standards. In order to compare and better evaluate the results, blank samples were also tested in the three-point flexural test.
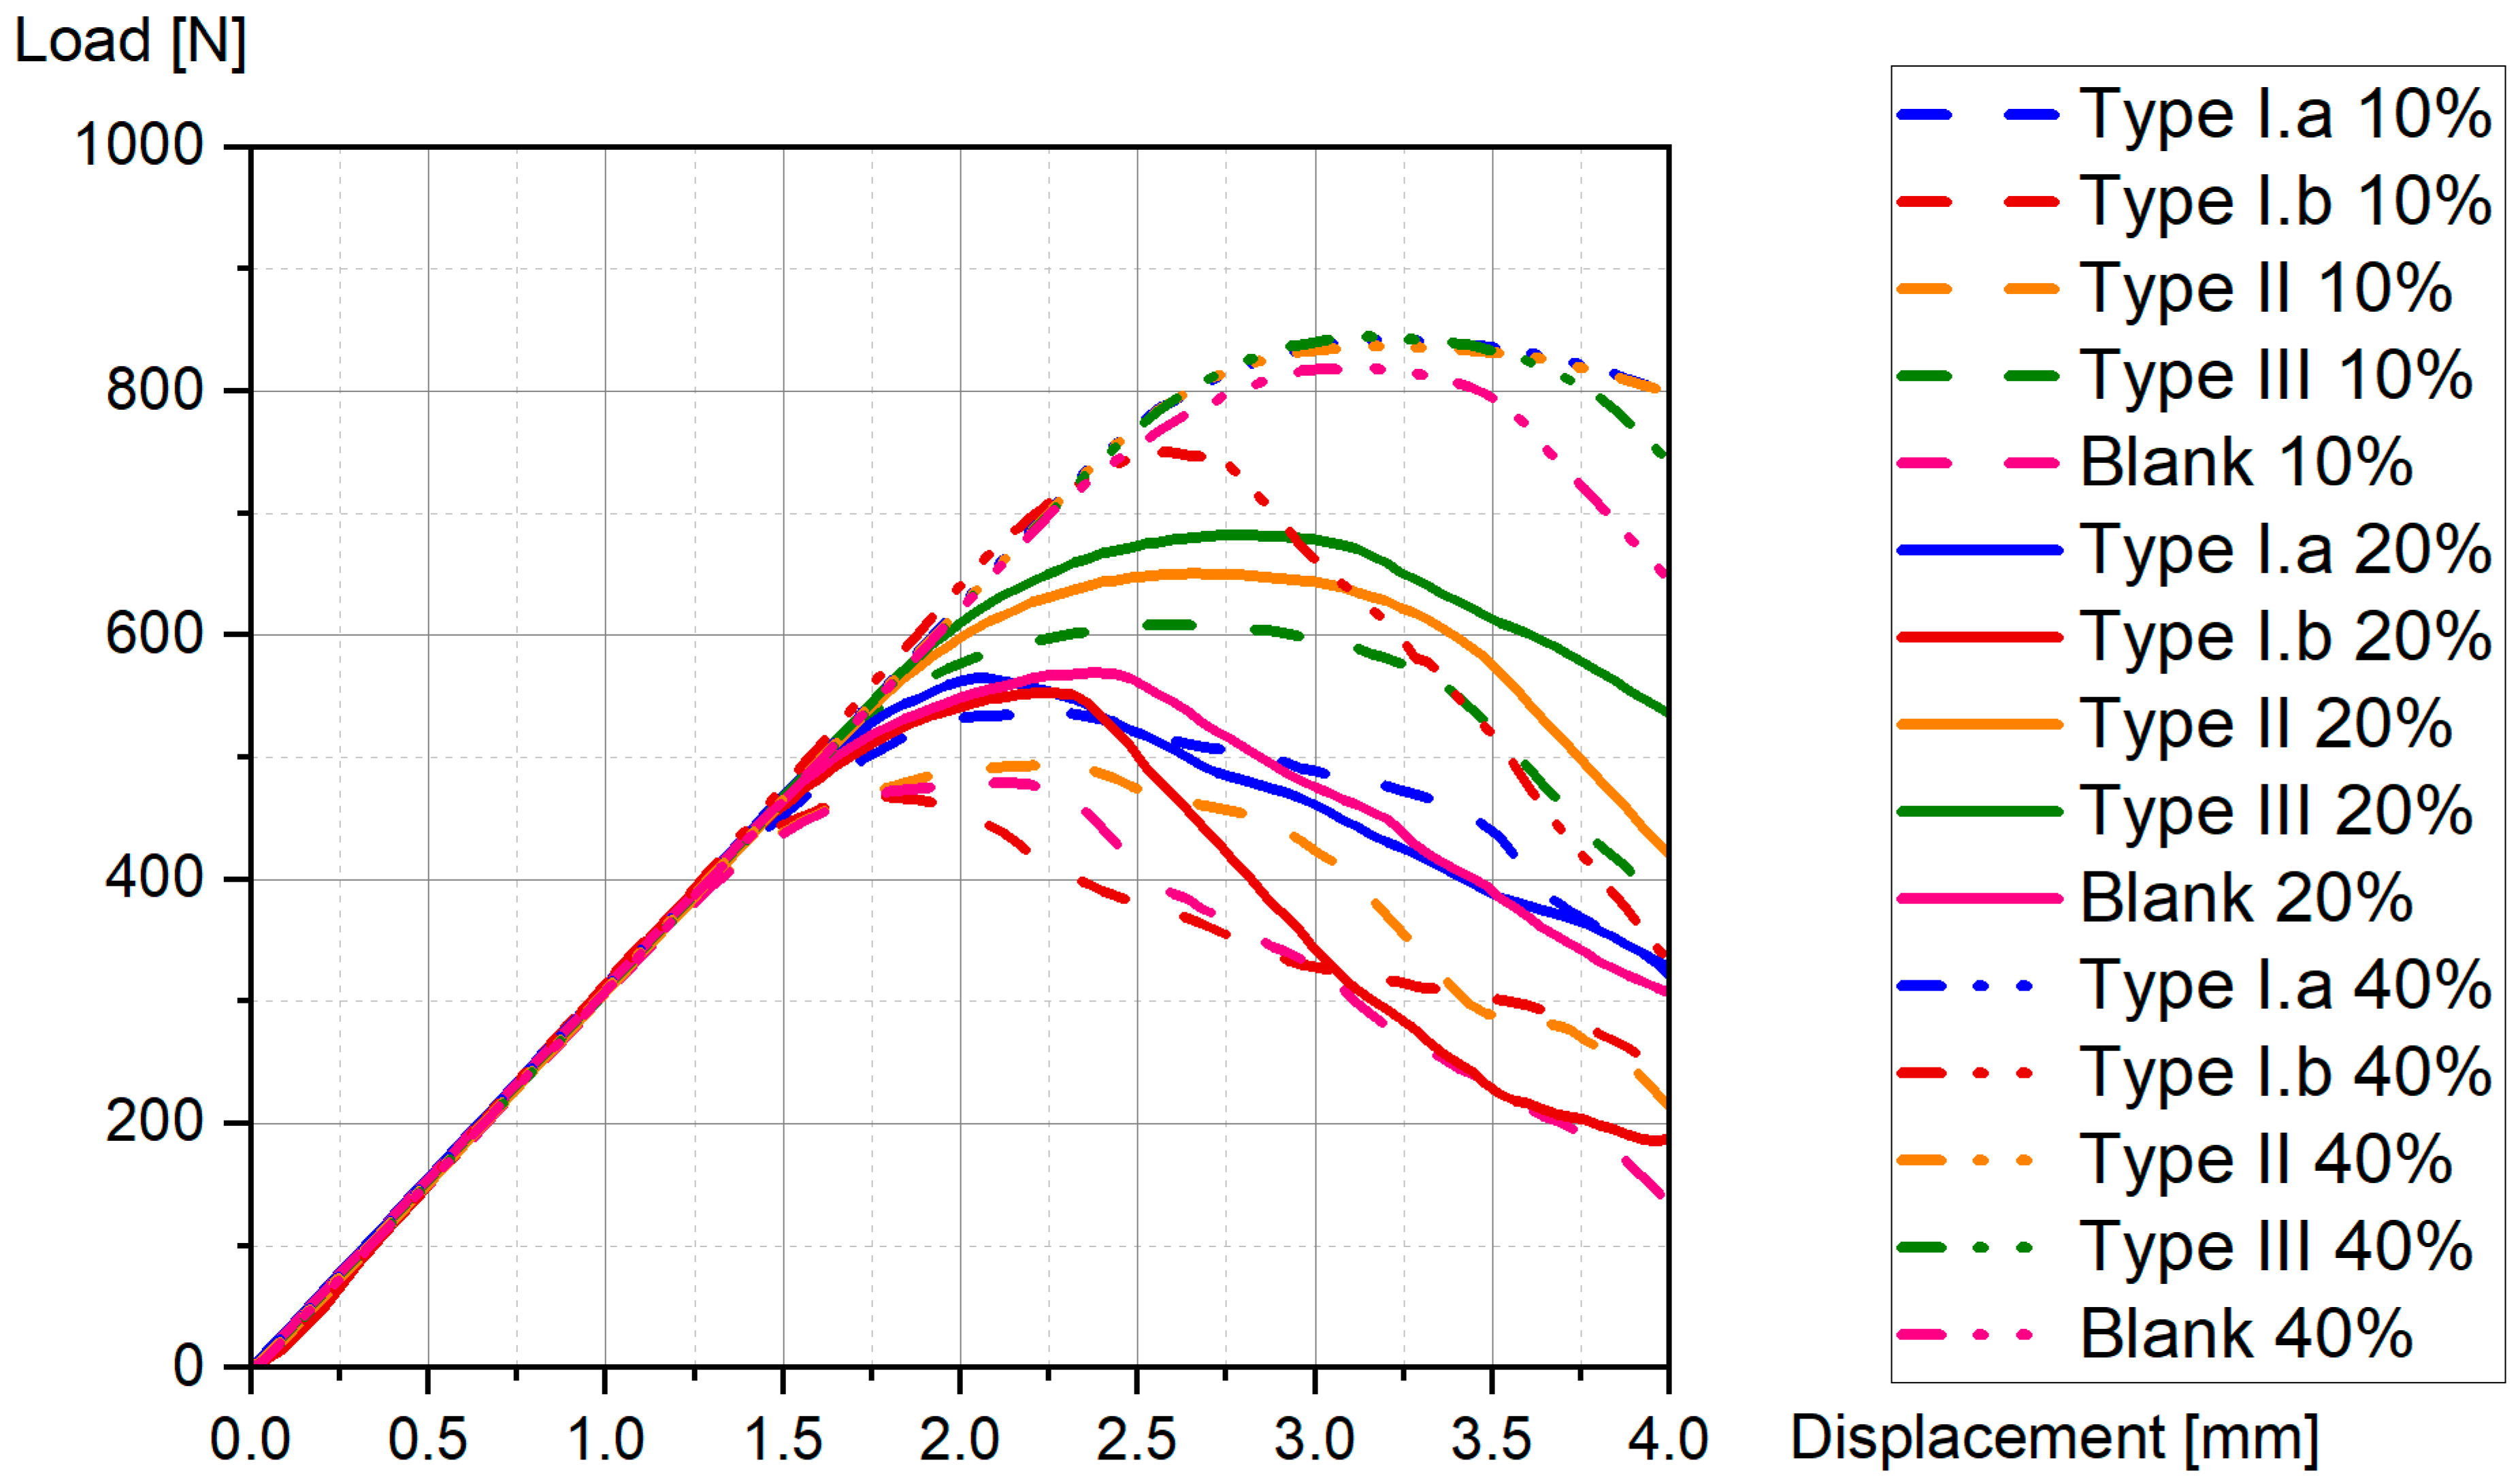
The three-point flexural test results of one of each design and infill are presented in Figure 11. The flexural modulus of the samples is almost the same up to 1.2 mm displacement. The reason for that is the samples have the same wall thickness and top and bottom thickness. After that point of flex, infill and other elements have effects on strength. Between samples with 40% infill, there is a small difference, but 10% and 20% infill parts show different plot and different values of maximum strength.
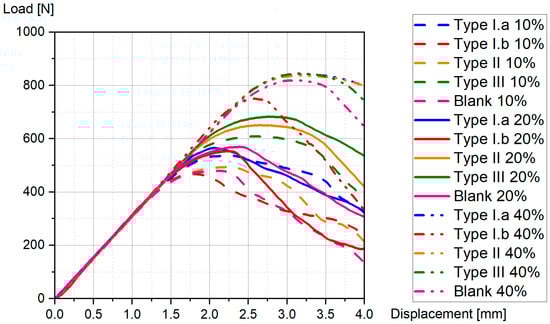
Figure 11.
The load/displacement results of flexural test samples.
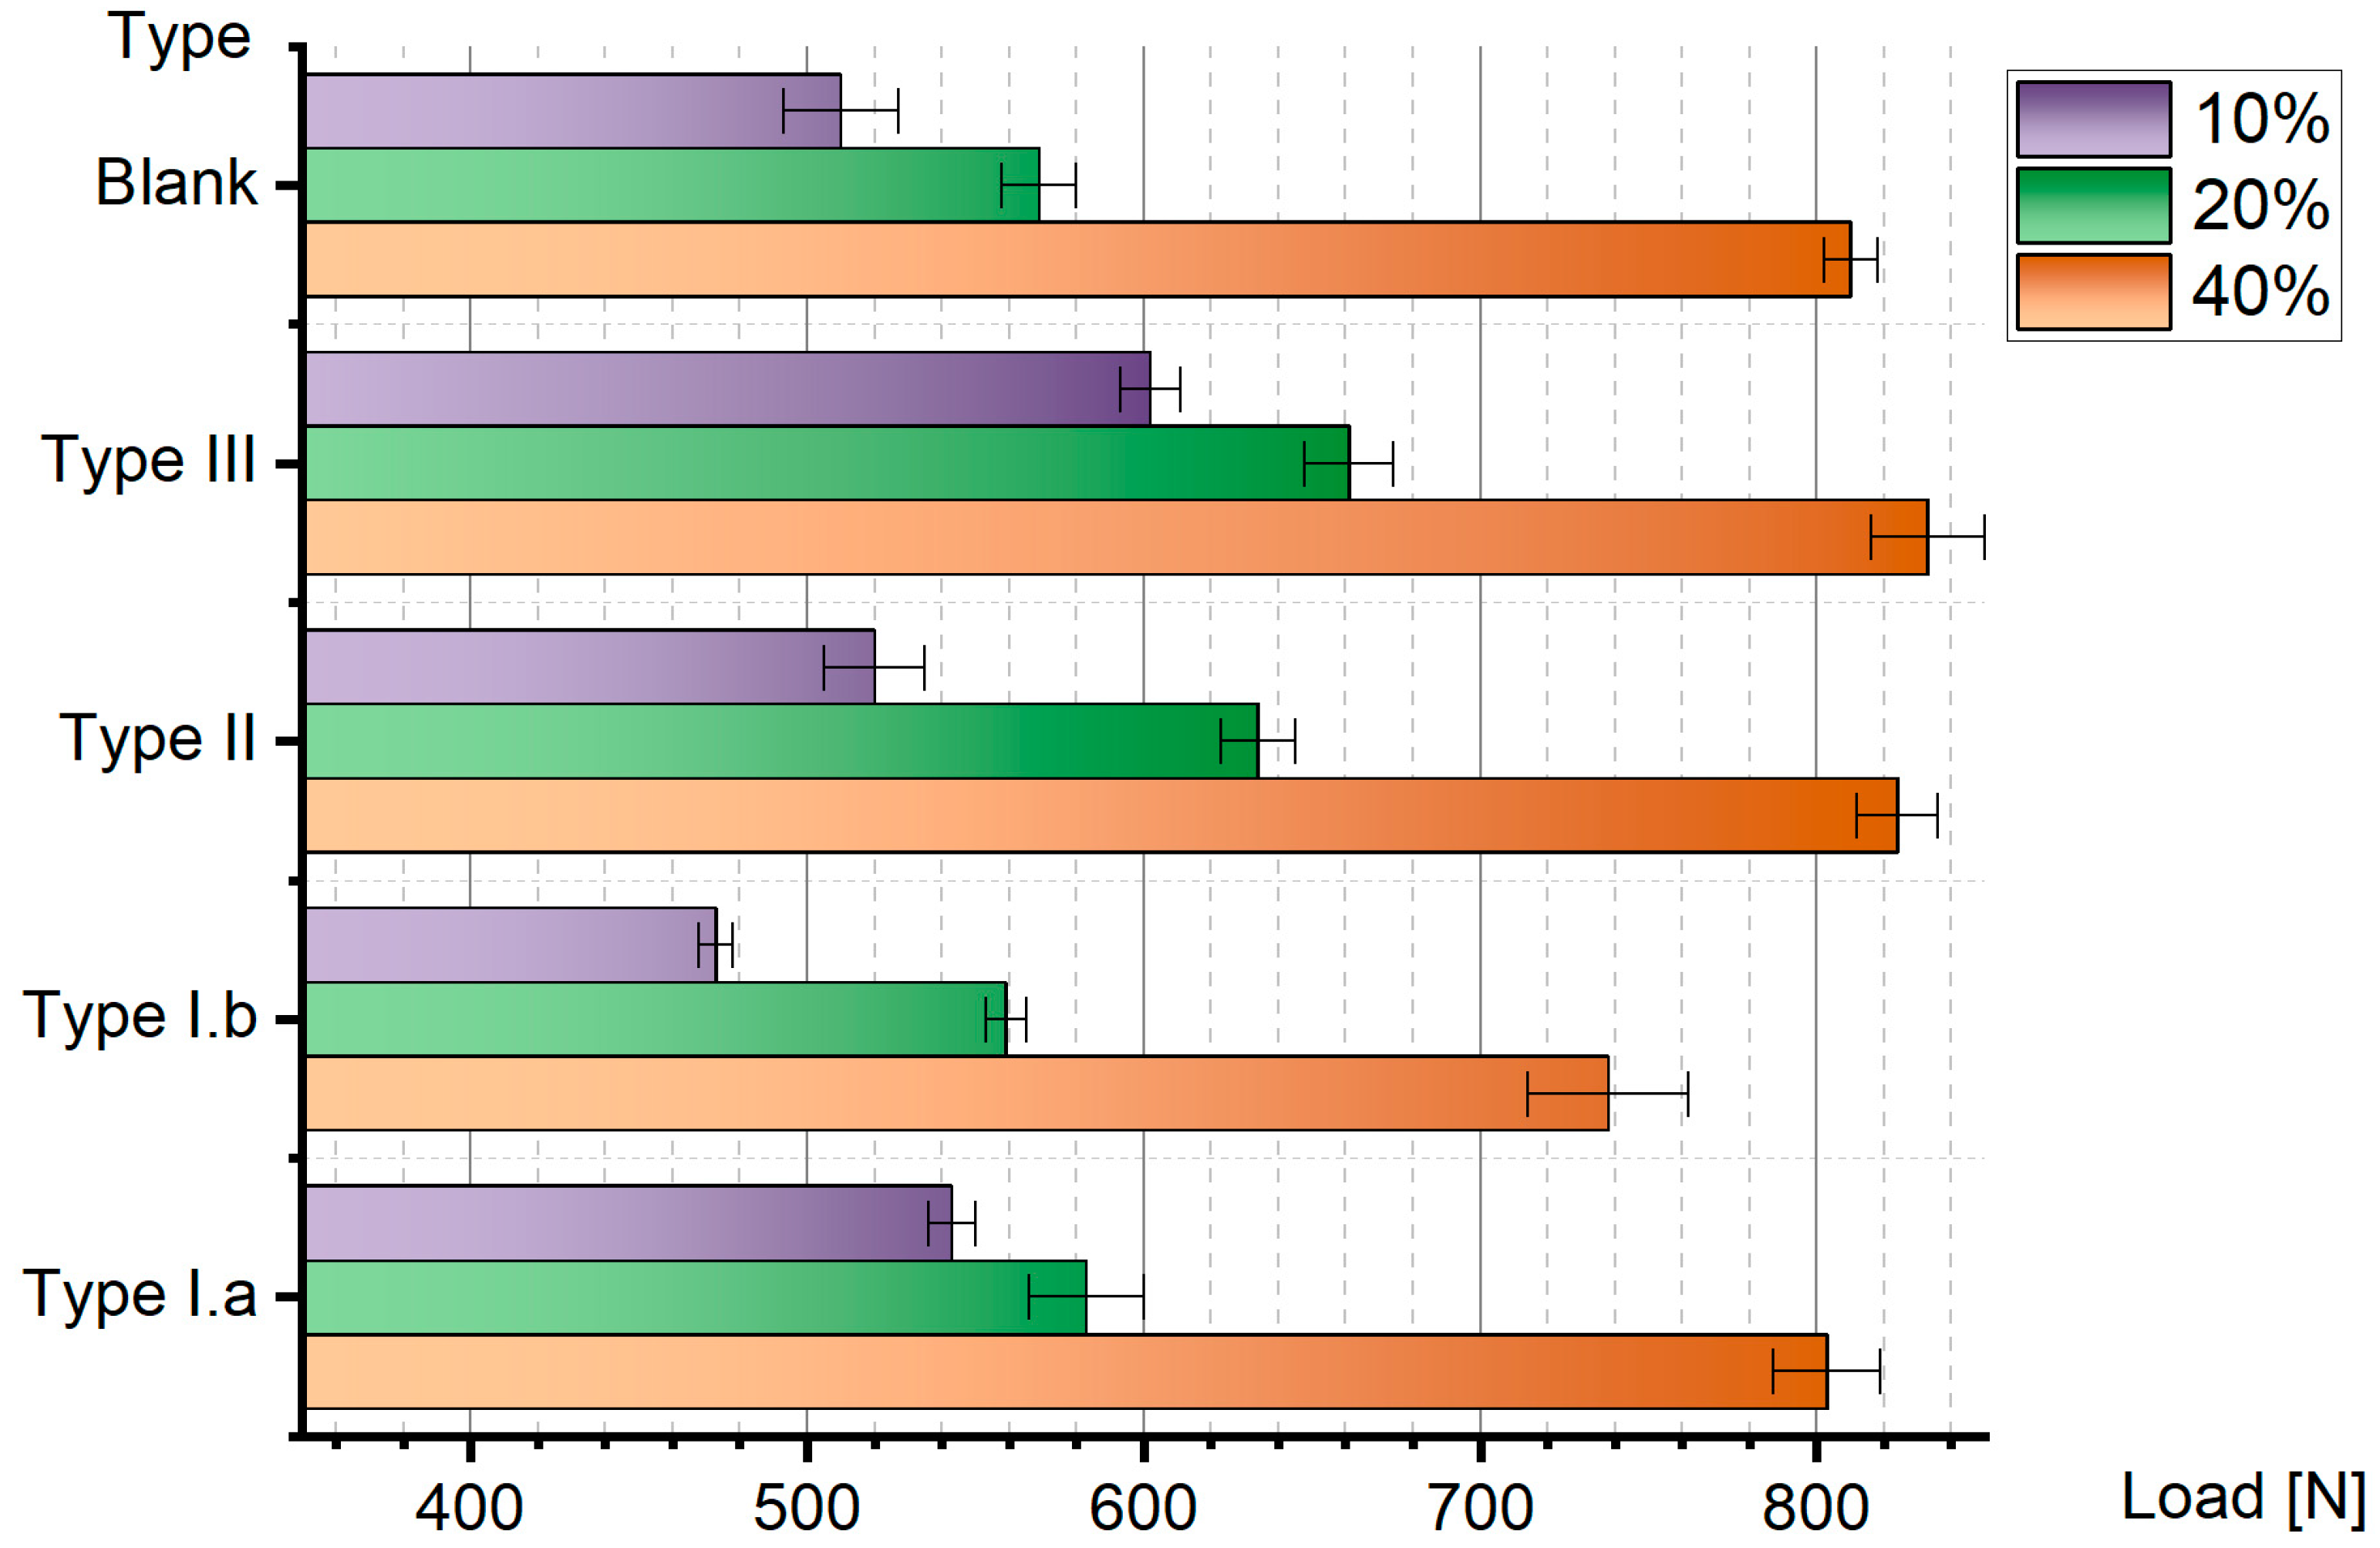
The ultimate strength results of all the samples are given in Figure 12. The average strength of the blank samples with 10% infill is 510 N, with 20% infill it is 569 N, and with 40% infill it is 810 N. For 10% infill samples, the standard deviation is 4%. The consistency in the results increases with the infill ratio. The standard deviation is 2% for 20% infill parts and 1% for 40% infill parts.

Figure 12.
Flexural test results of samples.
The flexural test results for type I.a samples present a significant difference between 40% and the others. The average strength is 543 N for 10% samples and 583 N for 20% samples. Parts with 40% infill have an average strength of 803 N, which is 35% more than the 20% infill parts.
Type I.b samples present the weakest samples for the flexural tests. Samples with 10% infill have 473 N strength, 20% samples have 559 N strength, and samples with 40% infill have 738 N strength. Type I.b is the only design in which five of the samples were broken into two pieces in the flexural tests.
Results of the three-point flexural test of the type II samples: the average strength of the 10% infill parts is 520 N, that of the 20% infill parts is 634 N, and that of the 40% infill parts is 824 N.
The type III flexural test results reveal that type III is the most durable design among the others. The three-point flexural strength of the 10% infill samples is 602 N, 661 N for 20% infill, and 833 N for 40% infill samples.
The results for the 40% infill are very close to each other. When designing any part with 40% infill, flexural strength is not an important factor if longer inserts are not used, such as in type I.b. The infill ratio might be lower when weight is a concern in design, like in an aerial vehicle; the 27% difference between the highest value and the lowest value is worth considering for the 10% infill. Even though type I.b has better values in other tests, other design variables should be taken into account because of the lower strength in flexural tests.
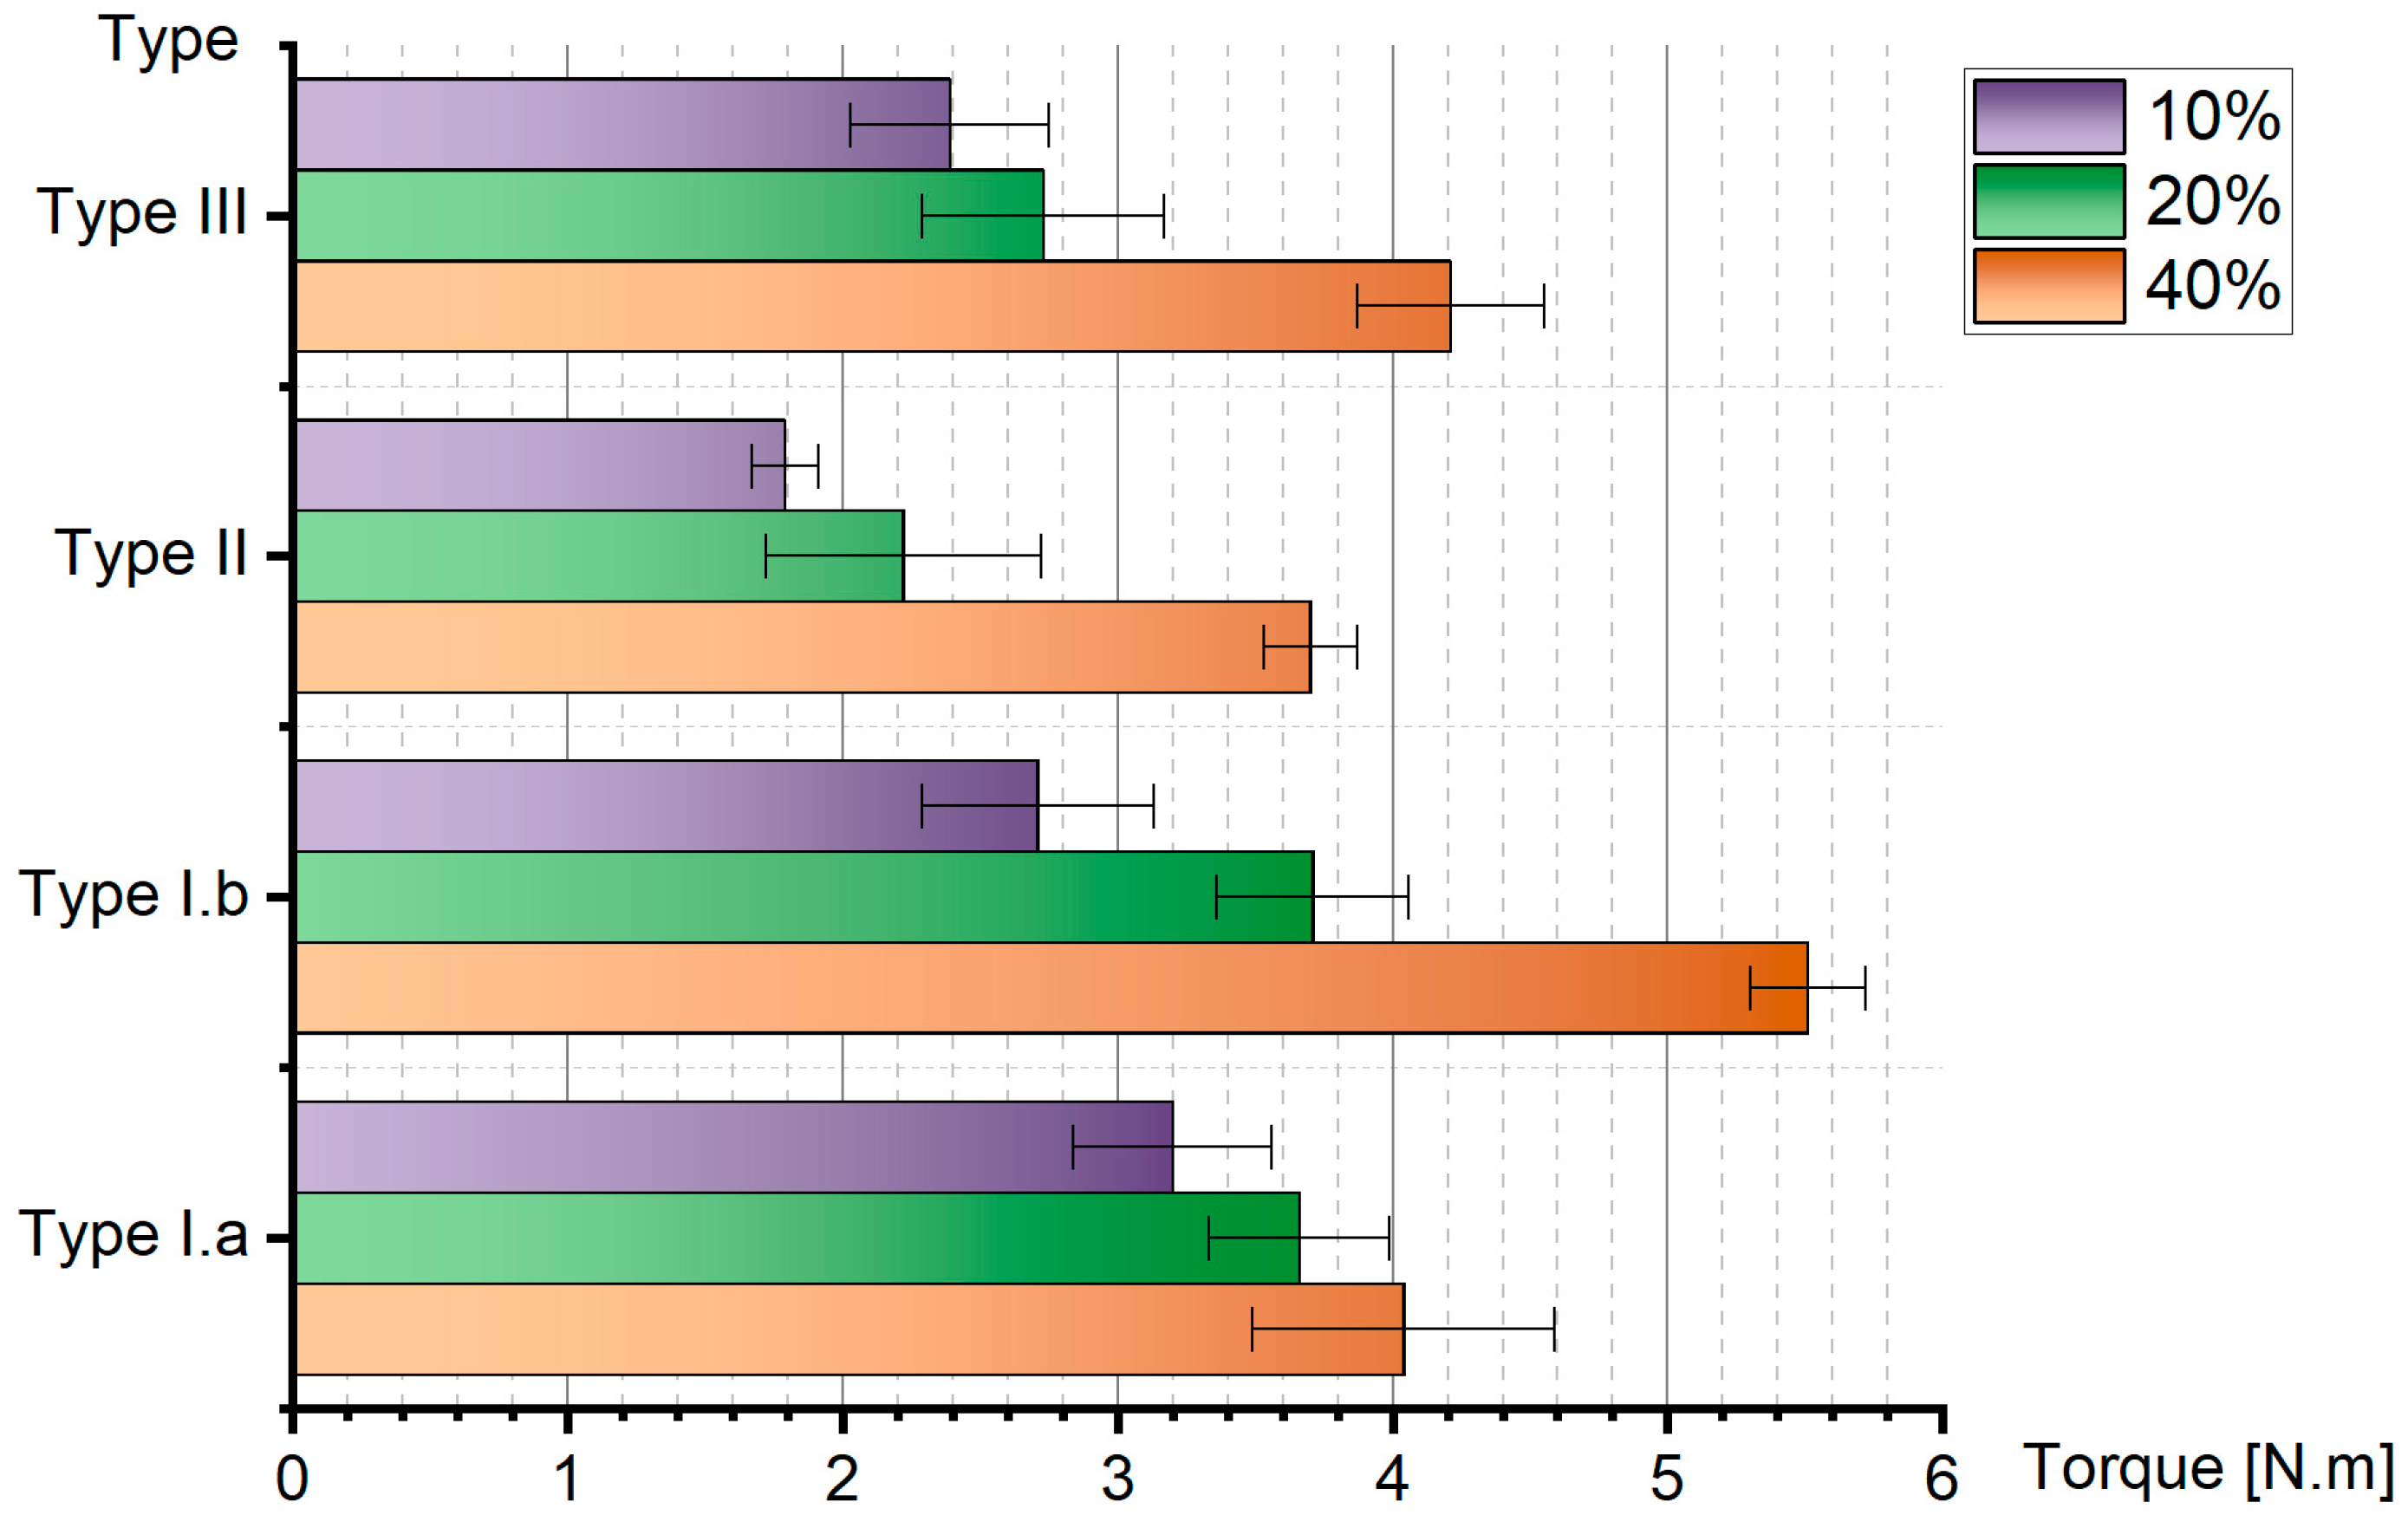
Torque tests were conducted to determine the maximum torque each design can handle in the case of tightening screws, and the results are presented in Figure 13. The ultimate torque strength of type I.a samples with 10% infill is 3.2 Nm, for samples with 20% infill it is 3.66 Nm, and for samples with 40% infill it is 4.04 Nm, with an average of 12 samples each. Type I.b samples with 40% infill show the best results in terms of the torque test, with an average strength of 5.05 Nm. Samples with 10% have 2.71 Nm torque strength, and samples with 40% infill have 3.71 Nm torque strength. Type II samples show the weakest design for the torque test, with 1.79 Nm for 10% infill samples, 2.21 Nm for 20% infill samples, and 3.7 Nm for 40% infill samples. The results of the torque test of the type III samples are 2.39 Nm for 10% infill samples, 2.73 Nm for 20% infill samples, and 4.21 Nm for 40% infill samples.
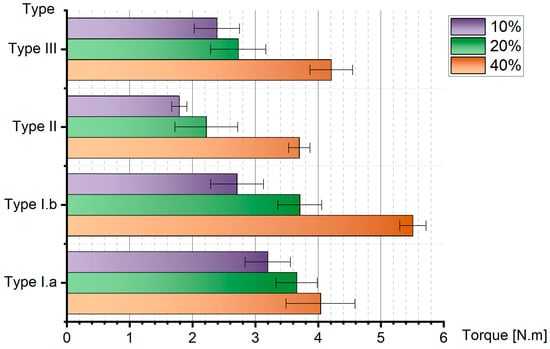
Figure 13.
Torque test results of samples.
The results reveal that type I.a has similar characteristics in terms of tensile and torque tests, showing a minor relation to the infill ratio. By analyzing all three test results, the strength of type I.b is directly related to the infill ratio.
In order to compare the costs of the samples produced in the study, printing times and amounts of raw materials used were compared. The used filament and approximate times for manufacturing were calculated by slicing software and are given in Table 1. Type I.a and type I.b samples consume the same amount of material, 110 g, 133 g, and 181 g with 10%, 20%, and 40% infill, respectively. The type II and type III samples use almost the same material, both more than type I, but with a difference of less than 2%. The type II samples use 111 g, 135 g, and 182 g of PLA+, and type III samples use 110 g, 135 g, and 182 g.

Table 1.
Production time and material consumptions per piece.
The manufacturing times for type I.a and type I.b samples are 48 min, 70 min, and 99 min, respectively, and for type II, they are 52 min, 72 min, and 102 min. To complete the production of type I.a and type I.b samples, inserts must be installed after the printing process. This process needs to be performed manually and takes about 4 min per sample. Type II samples also need some work after the printing process. The entrance of the nut cavity needs to be cleaned of supports or any debris, and a nut must be installed afterwards. The total of this process takes about 6 min per sample if there is no problem with the support structure. Cleaning the part could take time, or the part could even be scrapped if somehow the support structure is unsuccessful. Type III, on the other hand, does not need any processing after printing, meaning that the print time is also the total time. The total times for type III samples are 51 min, 72 min, and 98 min, respectively.
There was no significant difference between the active printing times of the printer and the raw materials used. However, when postprocess processes were included in the total production process of the part, it was determined that the design produced by placing nuts during printing was advantageous in terms of time and material consumption. Furthermore, type III can be manufactured semi-automatically or automatically. In semi-automatic mode, the printer pauses when the fastener needs to be installed, and after installation, the printing process continues. In automatic mode, a fastener is installed by a hybrid printer, and no human interaction is needed while printing. This method is less sensitive to the human error factor, even in semi-automatic mode.
Although type I application generally does not depend much on the infill ratio, it has also been observed that its durability is limited. While it is suitable for artistic or architectural designs to be produced for visual purposes, it can be used to carry elements such as sensor circuits that will not be subject to excessive load. Even though it is the method where human experience has the most impact on the results during application, it is preferred in applications such as prototypes because it is much more flexible during the design stage.
Type I.b application with 40% infill shows the best results in terms of both tensile and torque tests with a significant margin. On the other hand, this design shows minimum values in the flexural test results. While other samples were still intact after ultimate strength load was applied, some of the type I.b samples were broken into two pieces. Even though the installation process is still manual, type I.b inserts are easier to apply compared to type I.a inserts thanks to their flanged design.
Type II application shows high tensile strength, but as can be seen from the data obtained from the bending test, it can reduce the strength of the remaining structure in applications where the filling ratio is low. Although it is the most time-consuming postprocessing method, it can be preferred in some cases due to its ease of design.
Type III application provides the highest strength in 10–20% tensile and three of the flexural tests. The torque test results are not the best but more than enough for the M4 connection. Since the fastener is mounted during printing, it is advantageous that it does not require postprocessing. With developments in additive manufacturing technology, the ability to assemble such elements during printing in the future without human intervention makes this method much more advantageous in mass production. On the other hand, if an automatic machine is not used, an intervention must be made in the CAM software to pause the printing in order to place the fastener in this method.
4. Conclusions
This study revealed the design and experimental results of four of the most commonly used fastener addition methods in parts manufactured using FDM technology. Two of these designs are the heat mounting of the elements that are injected into plastic. After the printing process is completed, the insert is heated and placed in the designed cavity by melting the surfaces. In the third design, an opening for the assembly of the fastener is designed in addition to a cavity in which the substance will be placed. After the printing process is completed, the square nut is placed into the cavity through this opening. In the fourth design, there is no need for an opening other than the cavity in which the substance will be placed. During printing, the fastener is placed into the part at a suitable layer in the cavity inside the part, and the printing process is to be continued. After the printing is completed, no postprocessing is needed.
The printing process times are almost the same for each of the four designs. Although the postprocess times were added to print times, differences of up to 10% occur between some samples.
It can be concluded that the type I.a design is more dependent on the surface rather than the infill, while type I.b is directly related to the infill ratio. The failure characteristic of the basic inserts used in the type I.a samples is by the separation of the bond surface. Failure with more advanced inserts such as the ones used in type I.b is not separating from the surface but disintegrating the infill structure. On the other hand, the longer design of the insert used in type I.b results in lower strength in the flexural tests. This relates to affecting the durability of the overall structure.
Type II design is also much more dependent on the infill ratio, and the graph is almost linear. Type III design depends on both the infill ratio and the surface. Increasing the strength from 10% to 20% depends on increasing the filling. However, the increase in strength from 20% to 40% is much less due to wall thickness becoming important for loads at this level.
From the perspective of torque capability, most of the designs investigated in this study are capable enough for basic needs. In addition, the test results reveal that type I.b and type III designs can hold more than standard M4 screw, which is designed for when used with 40% or more infill.
When manufacturing components for unmanned aerial vehicles (UAVs), prioritizing lightweight construction is paramount, yet the challenge of ensuring robust connections, which endure diverse loads, necessitates the consideration of various assembly techniques. For the assembly of electronic components, hot insert can be preferred, which is the method that least affects the rest of the design, and the captive nut method can be preferred in wing-to-fuselage assemblies or motor mounts, which offer higher strength. In some applications such as prosthetics, expectations from fasteners may vary. In addition to providing high strength, it is also important to avoid situations such as dislocation of the fastener during assembly and disassembly. In addition, the type III application stands out as the method that least affects the visual of the piece.
Author Contributions
F.F.Ö.: investigation, methodology, formal analysis, validation, visualization, writing. İ.K.: writing—review and editing. E.P.Ö.: visualization, writing—review and editing. All authors have read and agreed to the published version of the manuscript.
Funding
This research received no external funding.
Institutional Review Board Statement
Not applicable.
Informed Consent Statement
Not applicable.
Data Availability Statement
Data are contained within the article.
Conflicts of Interest
The authors declare no conflict of interest.
References
- Sachs, E.; Cima, M.; Cornie, J. Three-Dimensional Printing: Rapid Tooling and Prototypes Directly from a CAD Model. CIRP Ann. 1990, 39, 201–204. [Google Scholar] [CrossRef]
- Kruth, J.-P.; Leu, M.C.; Nakagawa, T. Progress in Additive Manufacturing and Rapid Prototyping. CIRP Ann. 1998, 47, 525–540. [Google Scholar] [CrossRef]
- Kim, S.; Seong, H.; Her, Y.; Chun, J. A Study of the Development and Improvement of Fashion Products Using a FDM Type 3D Printer. Fash. Text. 2019, 6, 1–24. [Google Scholar] [CrossRef]
- Ishak, I.B.; Moffett, M.B.; Larochelle, P. An Algorithm for Generating 3D Lattice Structures for Printing on a Multi-Plane FDM Printing Platform. In Proceedings of the ASME 2018 International Design Engineering Technical Conferences and Computers and Information in Engineering Conference, Quebec City, QC, Canada, 26–29 August 2018. [Google Scholar]
- Fodran, E.; Koch, M.; Menon, U. Mechanical and Dimensional Characteristics of Fused Deposition Modeling Styles. In Proceedings of the Solid Freeform Fabrication Proceedings, September 1996, Austin, TX, USA, 12–14 August 1996; Bourell, D.L., Beaman, J.J., Marcus, H.L., Crawford, R.H., Barlow, J.W., Eds.; ScienceDirect: Amsterdam, The Netherlands, 1996; pp. 419–442. [Google Scholar]
- Rosen, D.; Kim, S. Design and Manufacturing Implications of Additive Manufacturing. In Additive Manufacturing Processes; ASM International: Detroit, MI, USA, 2020; pp. 19–29. [Google Scholar]
- Dickens, P.M. Research Developments in Rapid Prototyping. Proc. Inst. Mech. Eng. B J. Eng. Manuf. 1995, 209, 261–266. [Google Scholar] [CrossRef]
- Adekanye, S.A.; Mahamood, R.M.; Akinlabi, E.T.; Owolabi, M.G. Additive Manufacturing: The Future of Manufacturing: Dodajalna (3D) Tehnologija: Prihodnost Proizvajanja. Mater. Tehnol. 2017, 51, 709–715. [Google Scholar] [CrossRef]
- Heinrich, A.; Rank, M.; Maillard, P.; Suckow, A.; Bauckhage, Y.; Rößler, P.; Lang, J.; Shariff, F.; Pekrul, S. Additive Manufacturing of Optical Components. Adv. Opt. Technol. 2016, 5, 293–301. [Google Scholar] [CrossRef]
- Behrendt, U.; Shellabear, M. The EOS Rapid Prototyping Concept. Comput. Ind. 1995, 28, 57–61. [Google Scholar] [CrossRef]
- Serdar, T. Educational Challenges in Design for Additive Manufacturing. In Proceedings of the ASEE Annual Conference and Exposition, Conference Proceedings, New Orleans, LA, USA, 26–29 June 2016. [Google Scholar] [CrossRef]
- Li, J.; Wang, Y.; Xiang, G.; Liu, H.; He, J. Hybrid Additive Manufacturing Method for Selective Plating of Freeform Circuitry on 3D Printed Plastic Structure. Adv. Mater. Technol. 2019, 4, 1800529. [Google Scholar] [CrossRef]
- Wałpuski, B.; Słoma, M. Accelerated Testing and Reliability of FDM-Based Structural Electronics. Appl. Sci. 2022, 12, 1110. [Google Scholar] [CrossRef]
- Mendenhall, R.; Eslami, B. Experimental Investigation on Effect of Temperature on FDM 3D Printing Polymers: ABS, PETG, and PLA. Appl. Sci. 2023, 13, 11503. [Google Scholar] [CrossRef]
- Nadeem, H.; Ghazali, N.; Nabeel, M.; Ahsan, M.N.; Khurram, A.A. Experimental Assessment of Surface Roughness of Fused Deposition Modelling Parts and Method of Improvement. J. Thermoplast. Compos. Mater. 2024, 37, 1187–1201. [Google Scholar] [CrossRef]
- Ligon, S.C.; Liska, R.; Stampfl, J.; Gurr, M.; Mülhaupt, R. Polymers for 3D Printing and Customized Additive Manufacturing. Chem. Rev. 2017, 117, 10212–10290. [Google Scholar] [CrossRef] [PubMed]
- Rahmatabadi, D.; Soltanmohammadi, K.; Pahlavani, M.; Aberoumand, M.; Soleyman, E.; Ghasemi, I.; Baniassadi, M.; Abrinia, K.; Bodaghi, M.; Baghani, M. Shape Memory Performance Assessment of FDM 3D Printed PLA-TPU Composites by Box-Behnken Response Surface Methodology. Int. J. Adv. Manuf. Technol. 2023, 127, 935–950. [Google Scholar] [CrossRef]
- Yang, L.; Liu, X.; Xiao, Y.; Zhang, Y.; Zhang, G.; Wang, Y. 3D Printing of Carbon Nanotube (CNT)/Thermoplastic Polyurethane (TPU) Functional Composites and Preparation of Highly Sensitive, Wide-Range Detectable, and Flexible Capacitive Sensor Dielectric Layers via Fused Deposition Modeling (FDM). Adv. Mater. Technol. 2023, 8, 2201638. [Google Scholar] [CrossRef]
- Tkac, J.; Toth, T.; Mizera, O.; Molnar, V.; Fedorko, G.; Dovica, M. Comparison of Quality of Porous Structure Specimens Produced by Different Additive Technologies and from Different Materials. Appl. Sci. 2024, 14, 648. [Google Scholar] [CrossRef]
- Leoni, F.; Dal Fabbro, P.; Rosso, S.; Grigolato, L.; Meneghello, R.; Concheri, G.; Savio, G. Functionally Graded Additive Manufacturing: Bridging the Gap between Design and Material Extrusion. Appl. Sci. 2023, 13, 1467. [Google Scholar] [CrossRef]
- Malviya, M.; Sinha, S.; Berdanier, C.; Meisel, N.A. Digital Design Automation to Support in Situ Embedding of Functional Objects in Additive Manufacturing. J. Mech. Des. 2020, 142, 114501. [Google Scholar] [CrossRef]
- Harshitha, V.; Rao, S.S. Design and Analysis of ISO Standard Bolt and Nut in FDM 3D Printer Using PLA and ABS Materials. Mater. Today Proc. 2019, 19, 583–588. [Google Scholar] [CrossRef]
- Nefelov, I.S.; Baurova, N.I. Formation of Threaded Surfaces in the Components Produced by 3D Printing. Russ. Metall. (Metally) 2017, 2017, 1158–1160. [Google Scholar] [CrossRef]
- Budzik, G.; Dziubek, T.; Kawalec, A.; Turek, P.; Bazan, A.; Dębski, M.; Józwik, J.; Poliński, P.; Kiełbicki, M.; Kochmański, Ł.; et al. Geometrical Accuracy of Threaded Elements Manufacture by 3D Printing Process. Adv. Sci. Technol. Res. J. 2023, 17, 35–45. [Google Scholar] [CrossRef]
- Tronvoll, S.A.; Elverum, C.W.; Welo, T. Dimensional Accuracy of Threads Manufactured by Fused Deposition Modeling. Procedia Manuf. 2018, 26, 763–773. [Google Scholar] [CrossRef]
- Dorin Vasilescu, M.; Fleser, T. Influence of Technological Parametrs on the Dimension of Threaded Parts Generated with PLA Matherial by FDM 3D Printing. Mater. Plast 2018, 55, 718–722. [Google Scholar] [CrossRef]
- Diciuc, V. Fascicle: Mechanics, Tribology, Machine Manufacturing Technology; Baia Mare Universitatea din Baia Mare: Baia Mare, Romania, 2019. [Google Scholar]
- Kajzer, W.; Gieracka, K.; Pawlik, M.; Basiaga, M.; Kajzer, A.; Szewczenko, J. Tests of Threaded Connections Made by Additive Manufacturing Technologies. In Proceedings of the Innovations in Biomedical Engineering, Katowice, Poland, 18–20 October 2018; Tkacz, E., Gzik, M., Paszenda, Z., Piętka, E., Eds.; Springer International Publishing: Cham, Germany, 2019; pp. 329–337. [Google Scholar]
- Omidvarkarjan, D.; Balicki, P.; Baumgartner, H.; Rosenbauer, R.; Fontana, F.; Meboldt, M. The AM Dowel—A Novel Insert for the Integration of Threads into Additive Manufactured Polymer Components. In Industrializing Additive Manufacturing; Springer International Publishing: Berlin/Heidelberg, Germany, 2021; pp. 391–398. [Google Scholar]
- Kastner, T.; Troschitz, J.; Vogel, C.; Behnisch, T.; Gude, M.; Modler, N. Investigation of the Pull-Out Behaviour of Metal Threaded Inserts in Thermoplastic Fused-Layer Modelling (FLM) Components. J. Manuf. Mater. Process. 2023, 7, 42. [Google Scholar] [CrossRef]
- Stefan Hermann Helicoils, Threaded Insets and Embedded Nuts in 3d Prints—Strength & Strength Assessment. Available online: https://www.cnckitchen.com/blog/helicoils-threaded-insets-and-embedded-nuts-in-3d-prints-strength-amp-strength-assessment (accessed on 21 May 2024).
- Markforged Embedding Nuts in 3D Printed Parts for Hidden Fastener Strength. Available online: https://markforged.com/resources/blog/embedding-nuts-3d-printing (accessed on 21 May 2024).
- Bell, M.A.; Becker, K.P.; Wood, R.J. Injection Molding of Soft Robots. Adv. Mater. Technol. 2022, 7, 2100605. [Google Scholar] [CrossRef]
- Kukla, M.; Sieracki, I.; Maliga, W.; Górecki, J. Compression Strength of PLA Bolts Produced via FDM. Materials 2022, 15, 8740. [Google Scholar] [CrossRef]
- Rismalia, M.; Hidajat, S.C.; Permana, I.G.R.; Hadisujoto, B.; Muslimin, M.; Triawan, F. Infill Pattern and Density Effects on the Tensile Properties of 3D Printed PLA Material. J. Phys. Conf. Ser. 2019, 1402, 044041. [Google Scholar] [CrossRef]
- De Assis, C.L.F.; Rampazo, C.A. Assessment of the Mechanical Properties of PC/ABS Blends for Functional Prototyping by FFF 3D Printing. Rapid Prototyp. J. 2024, 30, 214–227. [Google Scholar] [CrossRef]
- Casavola, C.; Cazzato, A.; Karalekas, D.; Moramarco, V.; Pappalettera, G. The Effect of Chamber Temperature on Residual Stresses of FDM Parts. In Residual Stress, Thermomechanics & Infrared Imaging, Hybrid Techniques and Inverse Problems; Conference Proceedings of the Society for Experimental Mechanics Series; Springer: Cham, Switzerland, 2019; pp. 87–92. [Google Scholar]
- ESUN PLA+ Filament 3D Printer PLA Plus Filament PLA Pro. Available online: https://www.esun3d.com/pla-pro-product/ (accessed on 21 May 2024).
- Pandzic, A.; Hodzic, D.; Milovanovic, A. Effect of Infill Type and Density on Tensile Properties of Pla Material for Fdm Process. In Proceedings of the Annals of DAAAM and Proceedings of the International DAAAM Symposium, Zadar, Croatia, 23–26 October 2019; Danube Adria Association for Automation and Manufacturing, DAAAM: Vienna, Austria, 2019; Volume 30, pp. 545–554. [Google Scholar]
- Hozdić, E. Characterization and Comparative Analysis of Mechanical Parameters of FDM- and SLA-Printed ABS Materials. Appl. Sci. 2024, 14, 649. [Google Scholar] [CrossRef]
- Banić, D.; Itrić Ivanda, K.; Vukoje, M.; Cigula, T. Impact Fracture Resistance of Fused Deposition Models from Polylactic Acid with Respect to Infill Density and Sample Thickness. Appl. Sci. 2024, 14, 2035. [Google Scholar] [CrossRef]
- Abeykoon, C.; Sri-Amphorn, P.; Fernando, A. Optimization of Fused Deposition Modeling Parameters for Improved PLA and ABS 3D Printed Structures. Int. J. Lightweight Mater. Manuf. 2020, 3, 284–297. [Google Scholar] [CrossRef]
- de Freitas, F.; Pegado, H. Impact of Nozzle Temperature on Dimensional and Mechanical Characteristics of Low-Density PLA. Int. J. Adv. Manuf. Technol. 2023, 126, 1629–1638. [Google Scholar] [CrossRef]
- Frunzaverde, D.; Cojocaru, V.; Ciubotariu, C.R.; Miclosina, C.O.; Ardeljan, D.D.; Ignat, E.F.; Marginean, G. The Influence of the Printing Temperature and the Filament Color on the Dimensional Accuracy, Tensile Strength, and Friction Performance of FFF-Printed PLA Specimens. Polymers 2022, 14, 1978. [Google Scholar] [CrossRef] [PubMed]


Disclaimer/Publisher’s Note: The statements, opinions and data contained in all publications are solely those of the individual author(s) and contributor(s) and not of MDPI and/or the editor(s). MDPI and/or the editor(s) disclaim responsibility for any injury to people or property resulting from any ideas, methods, instructions or products referred to in the content. |
© 2024 by the authors. Licensee MDPI, Basel, Switzerland. This article is an open access article distributed under the terms and conditions of the Creative Commons Attribution (CC BY) license (https://creativecommons.org/licenses/by/4.0/).