
Identification and Discrimination of Petrol Sources by Nuclear Magnetic Resonance Spectroscopy and Machine Learning in Fire Debris Analysis
Abstract
:Featured Application
Abstract
1. Introduction
2. Materials and Methods
2.1. Materials
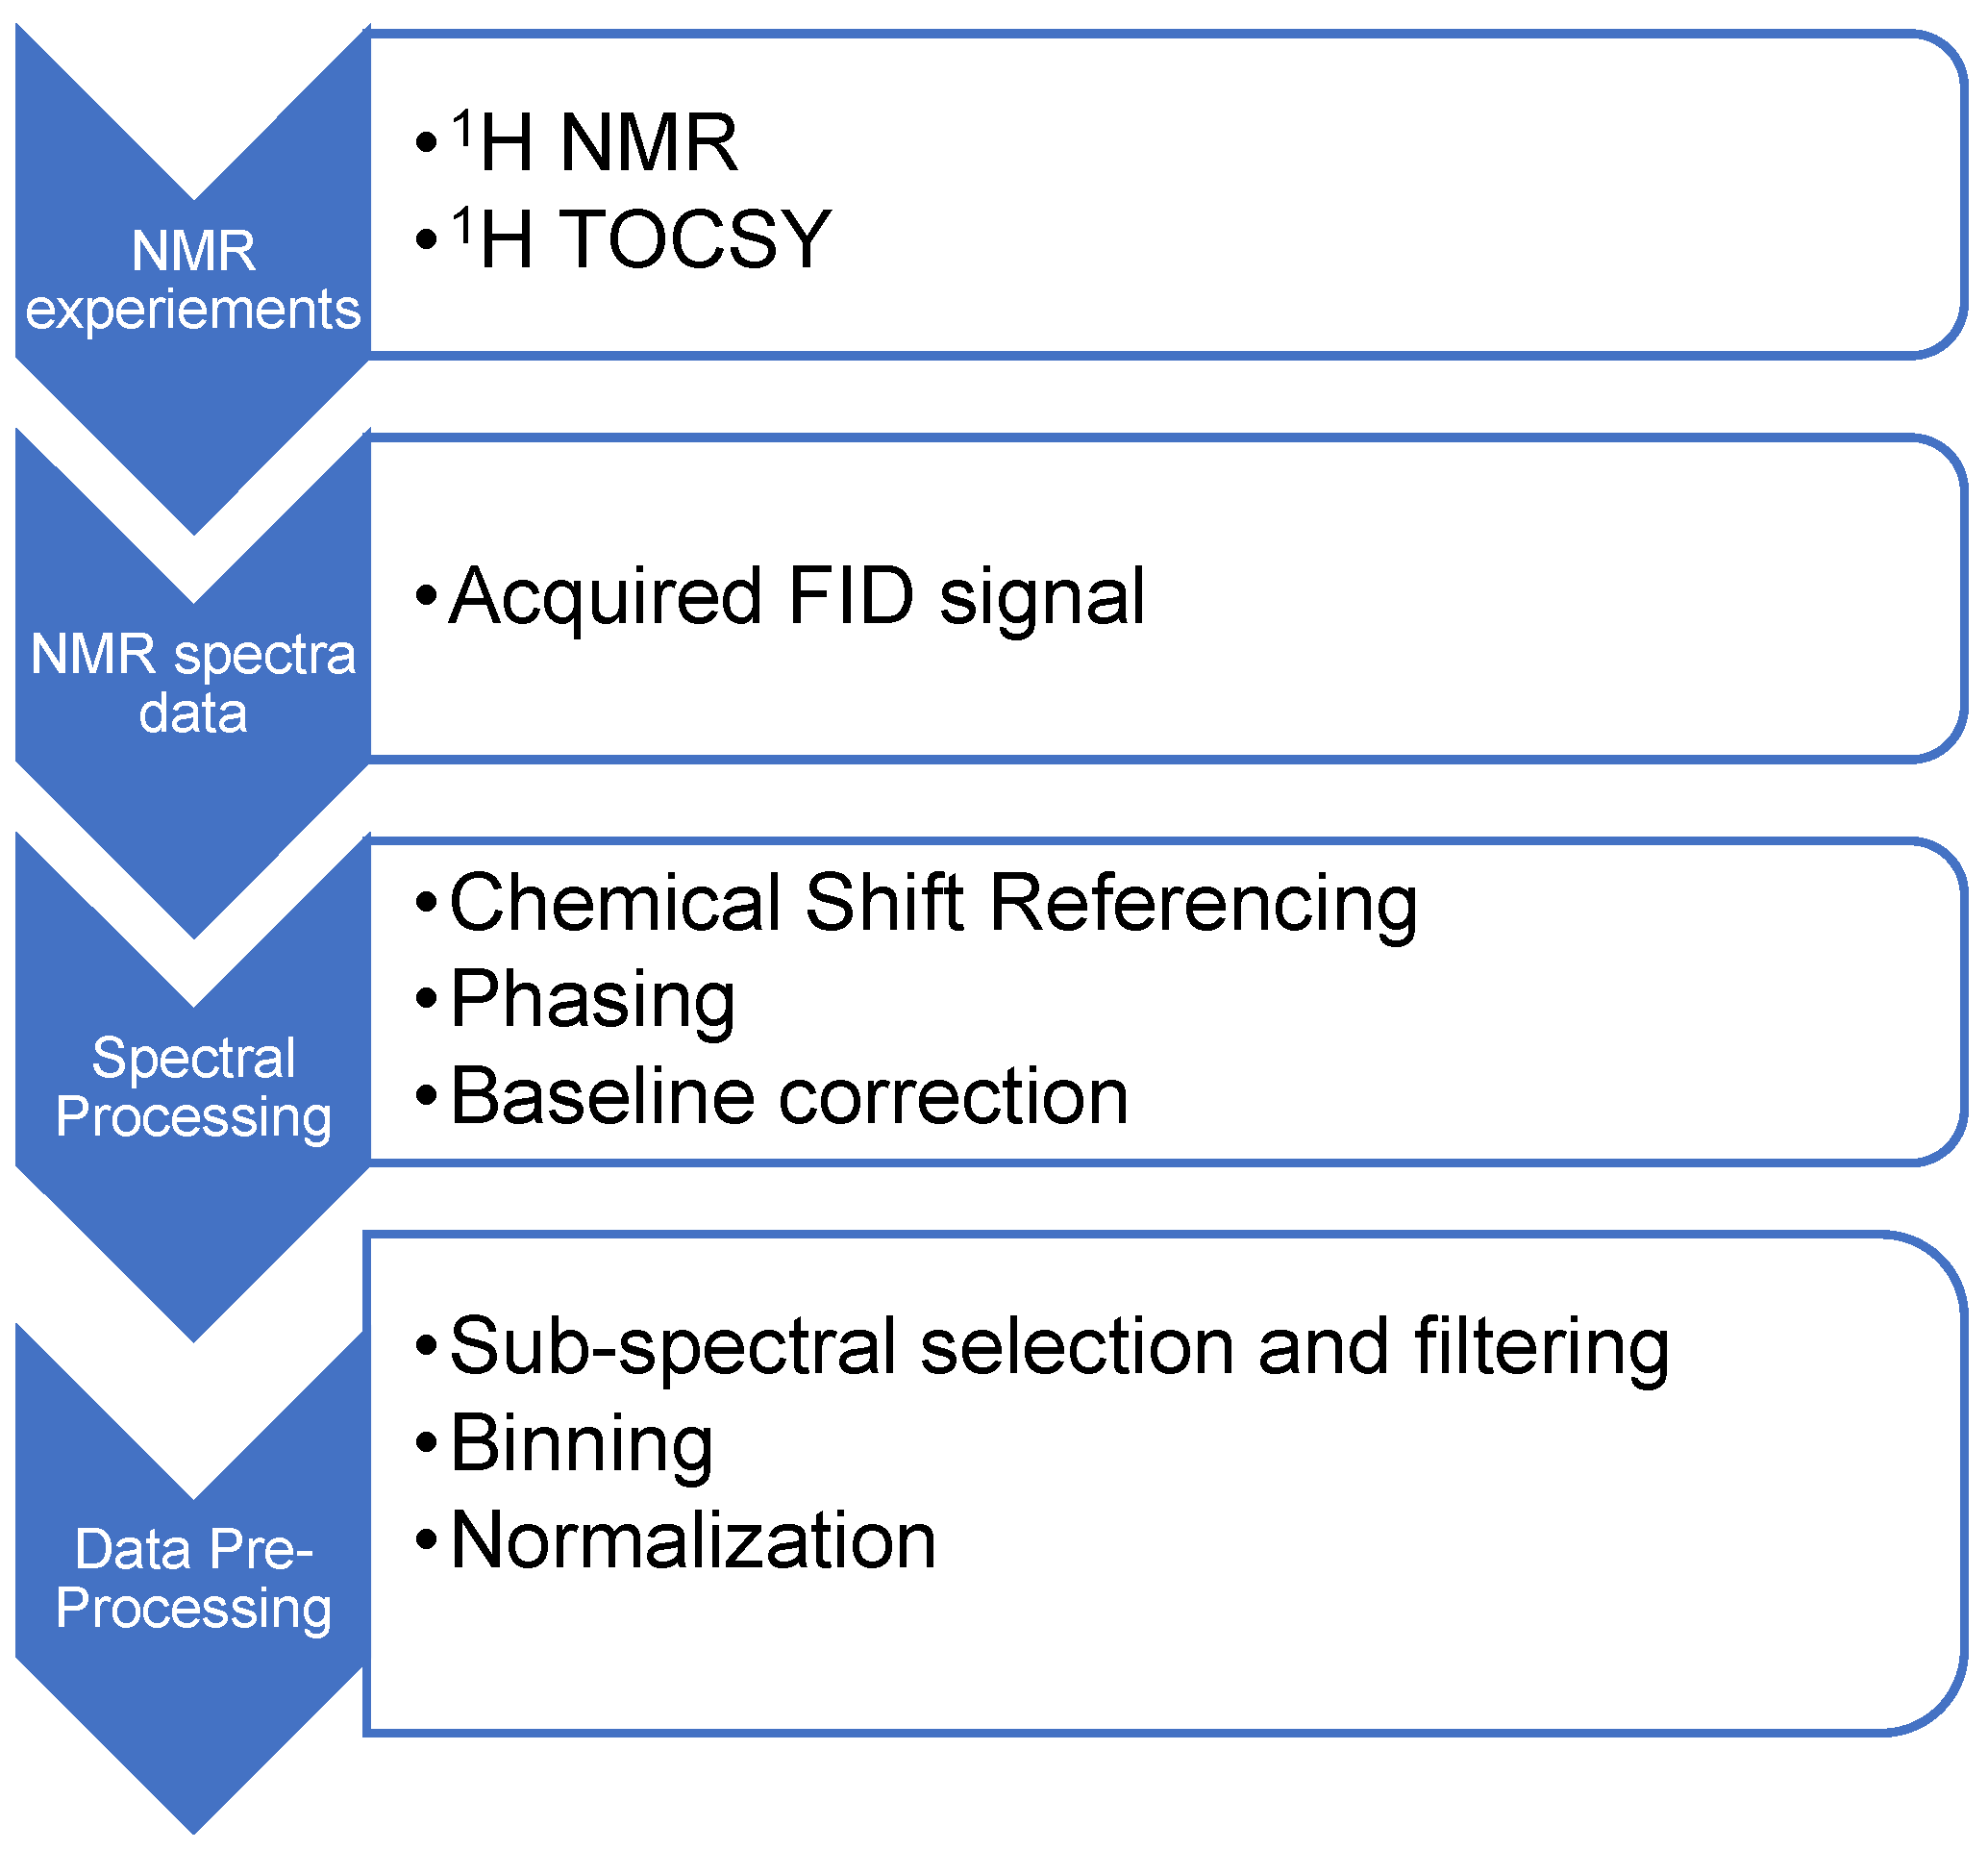
2.2. Data Acquisition
2.3. Data Pre-Treatment and Pre-Processing
2.4. Feature Selection
2.5. Classification Model
3. Results
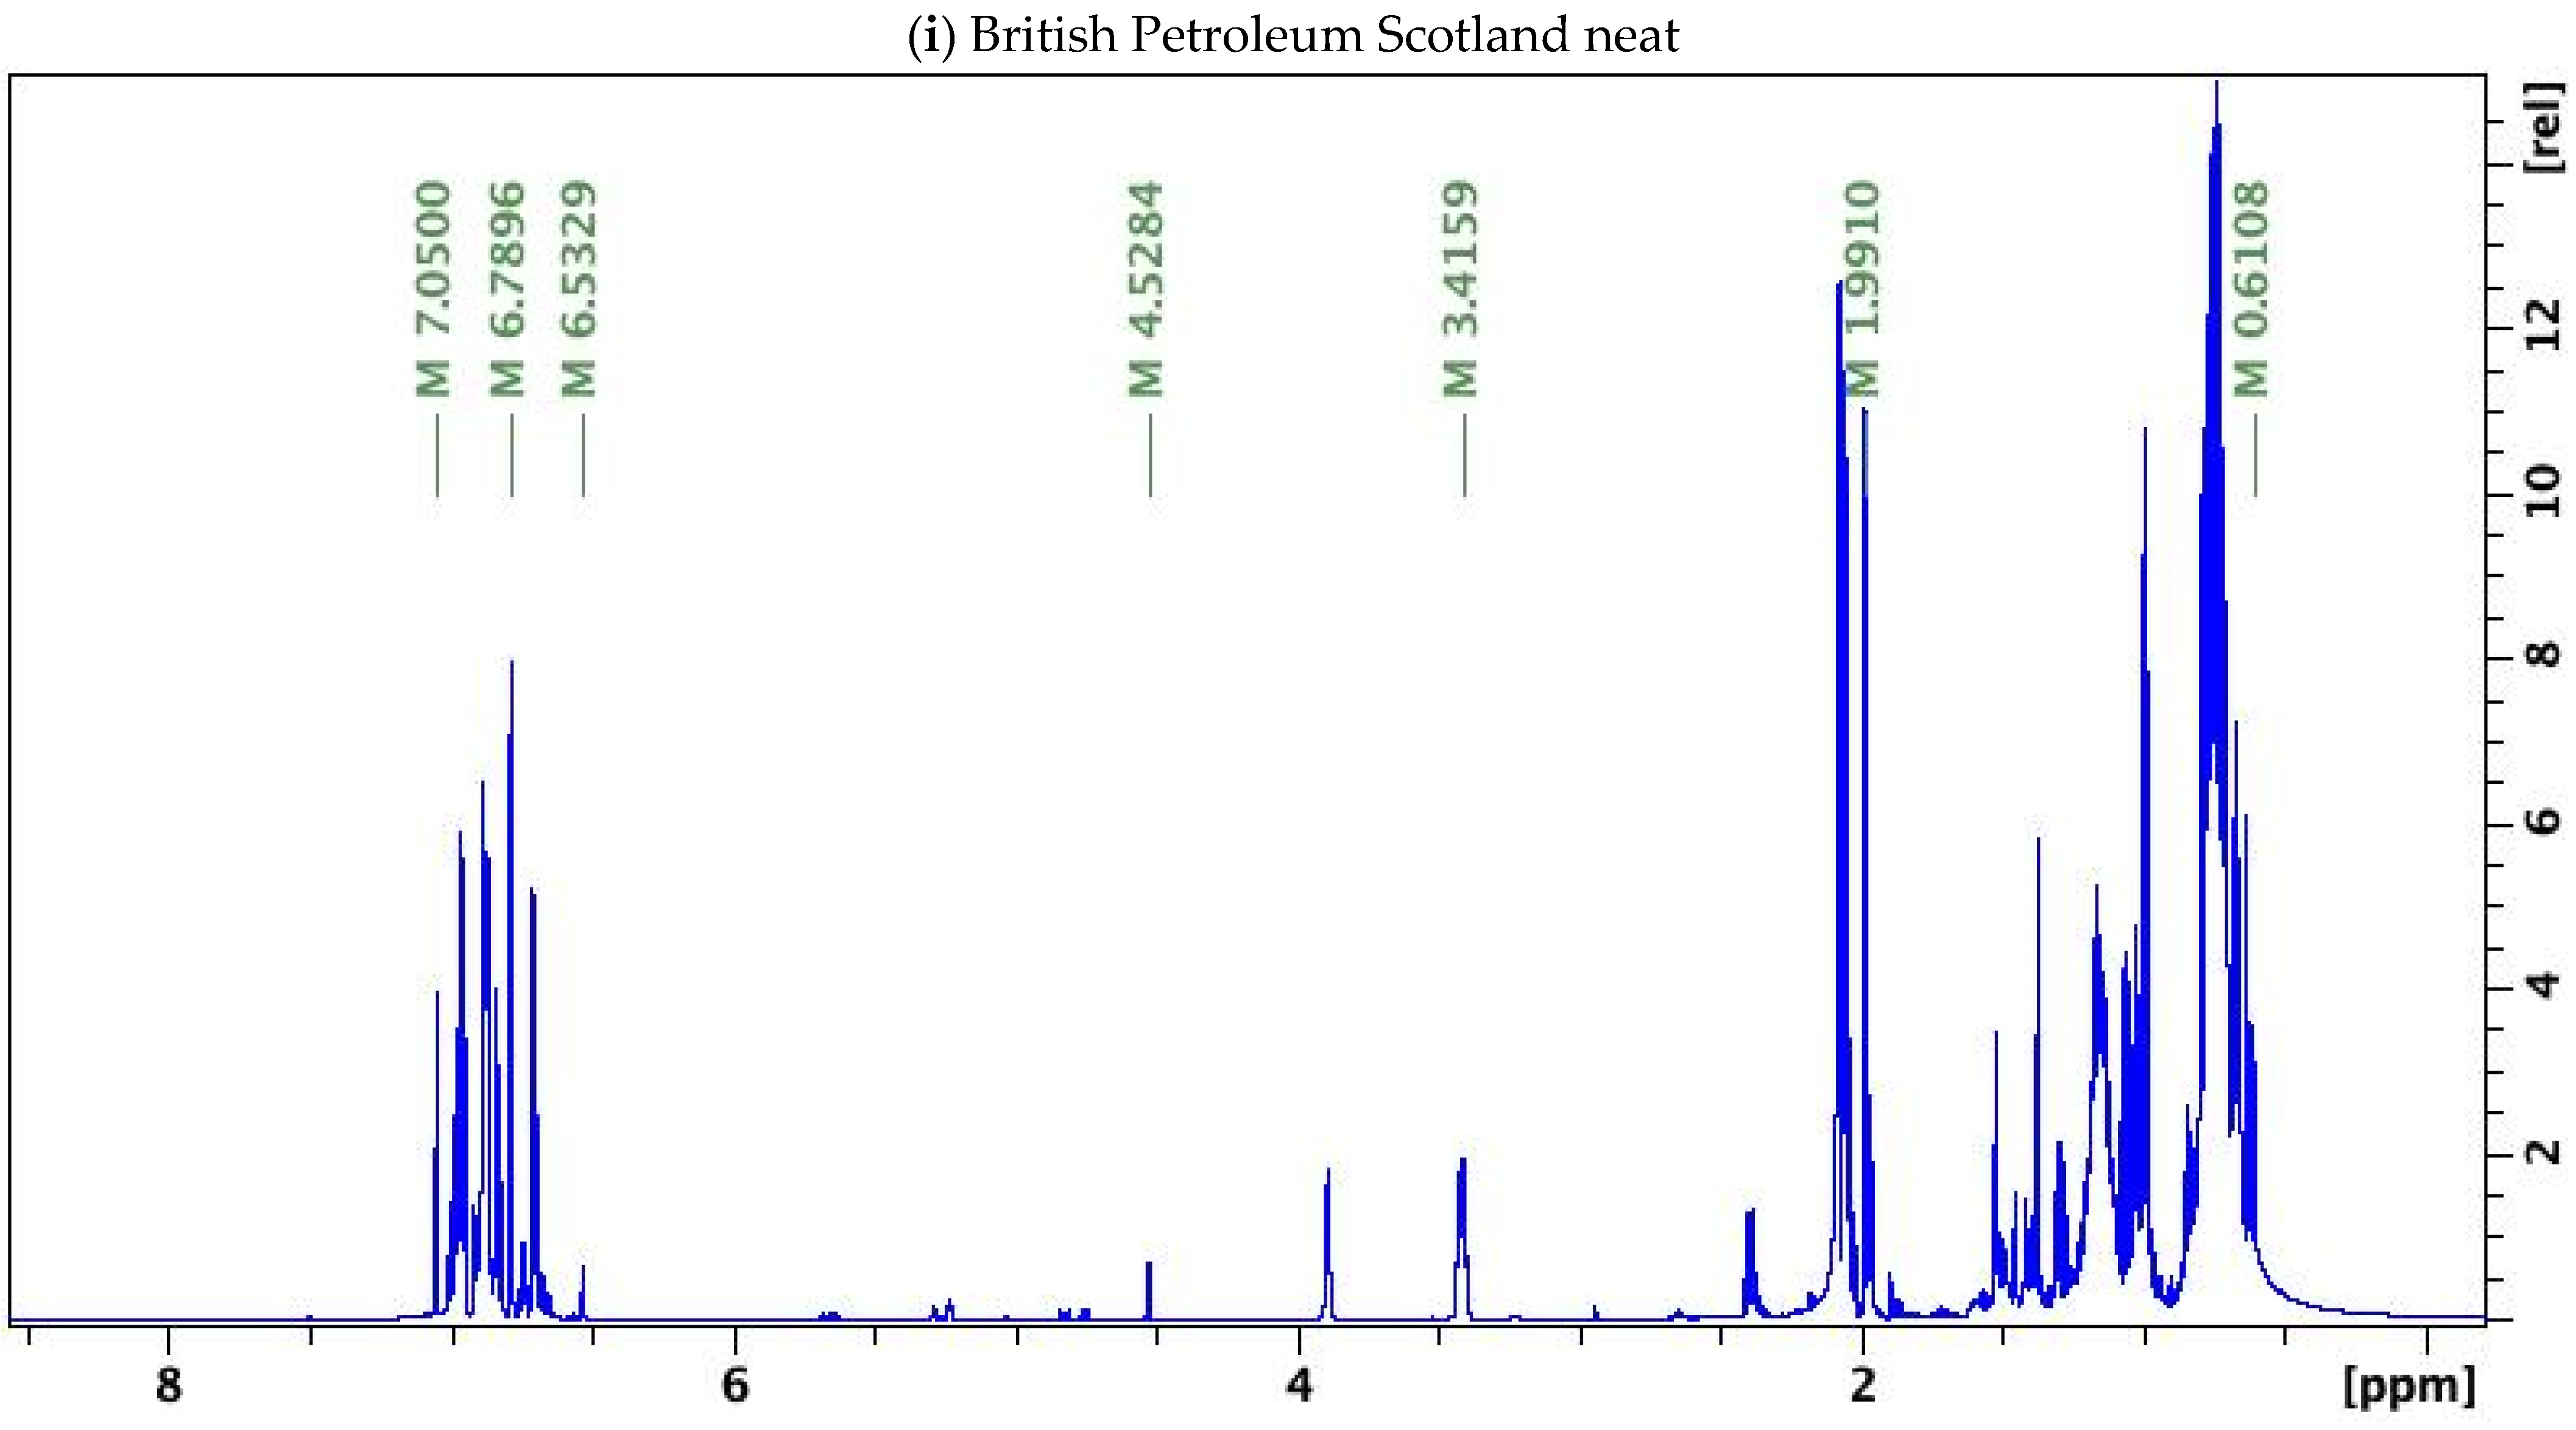
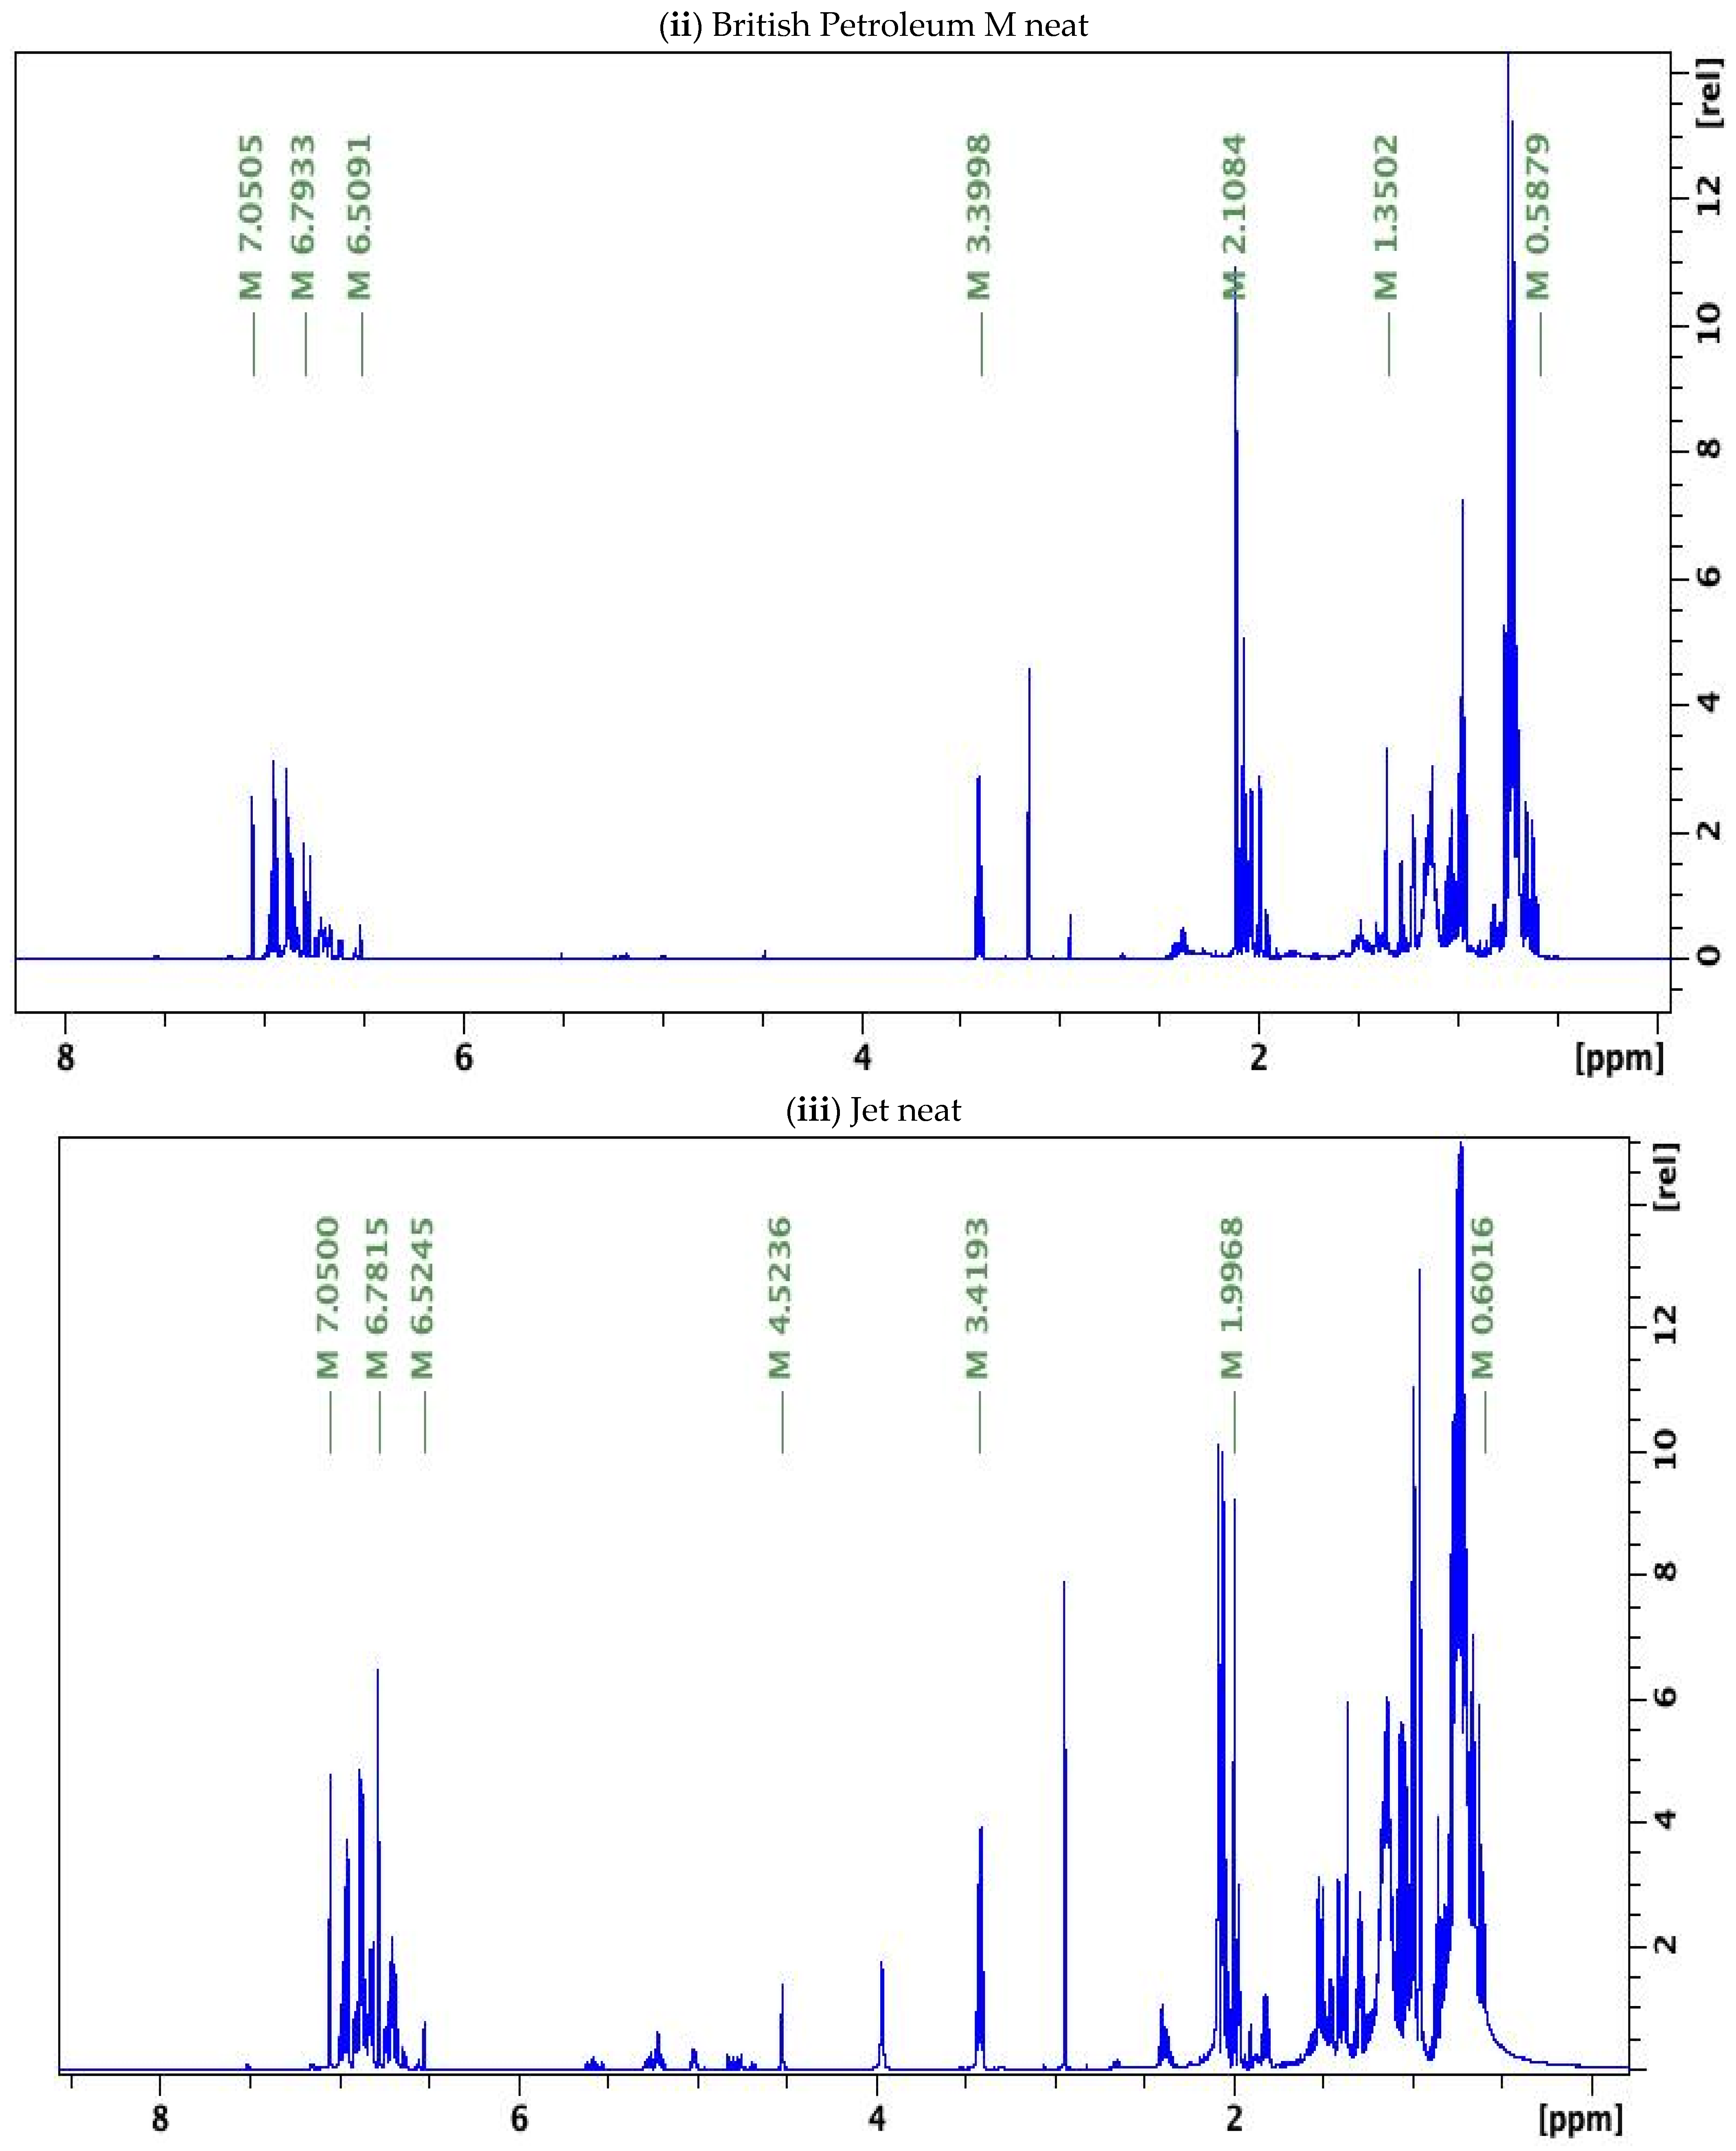
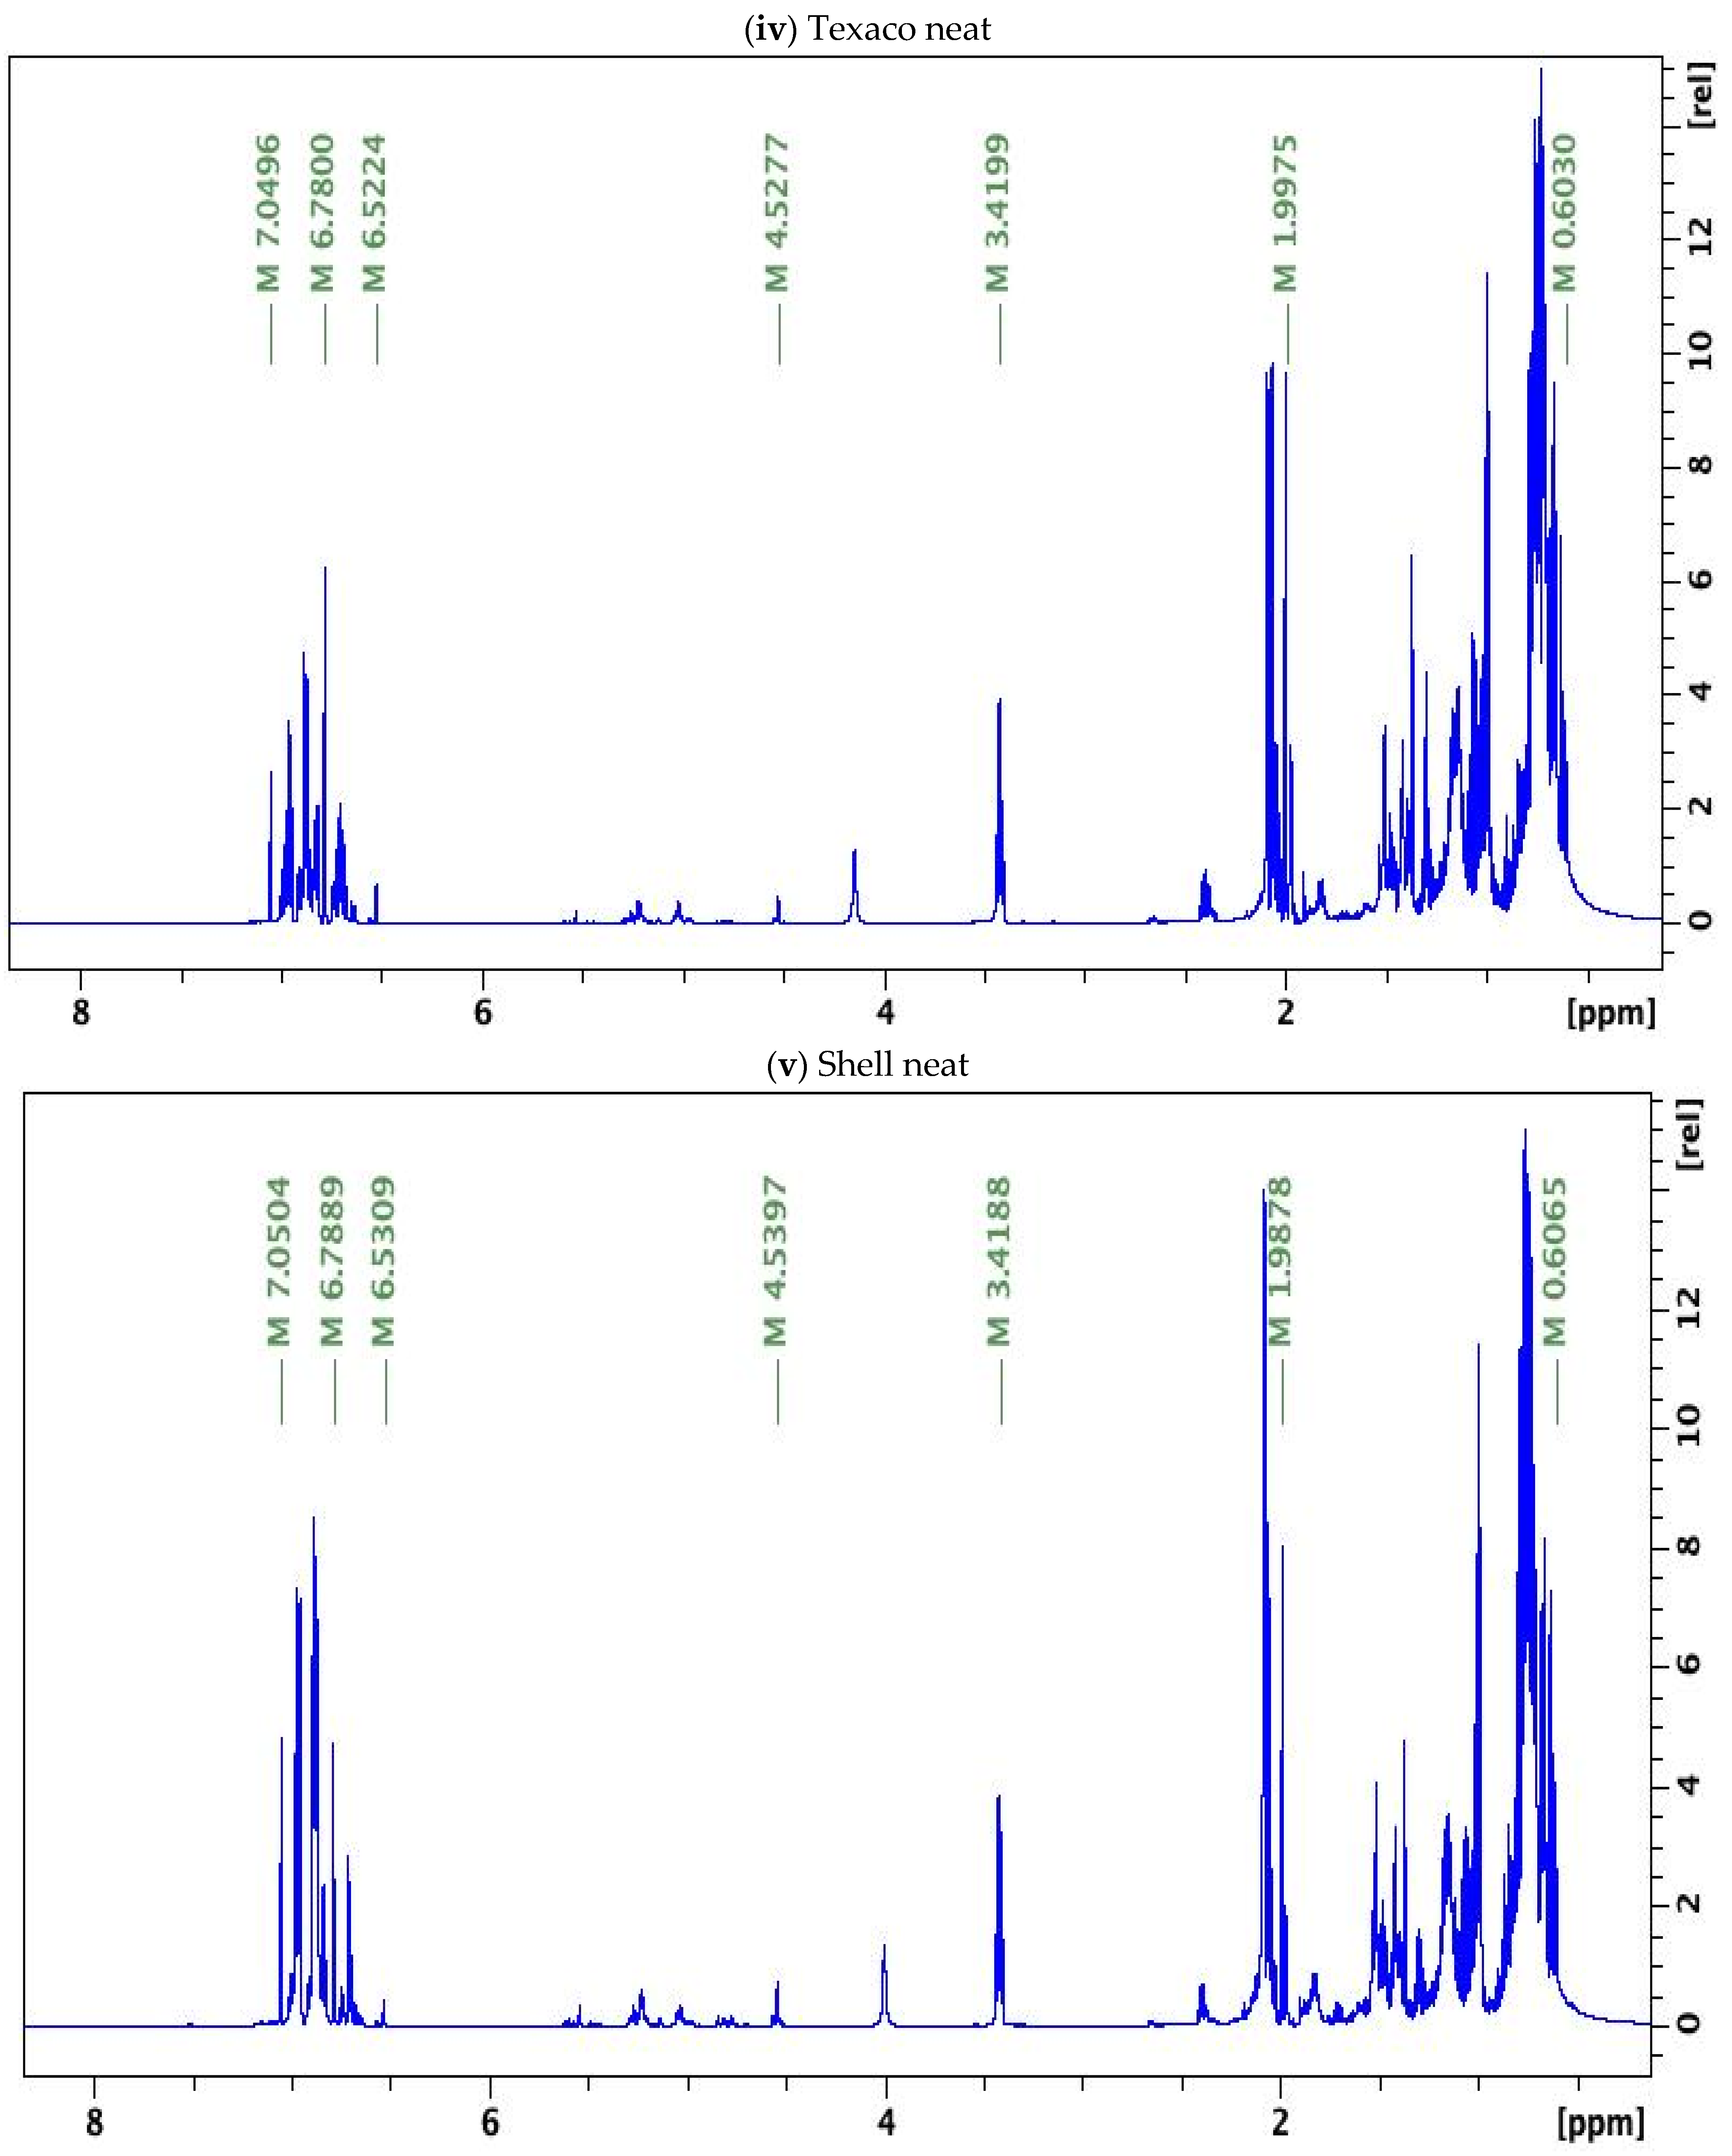
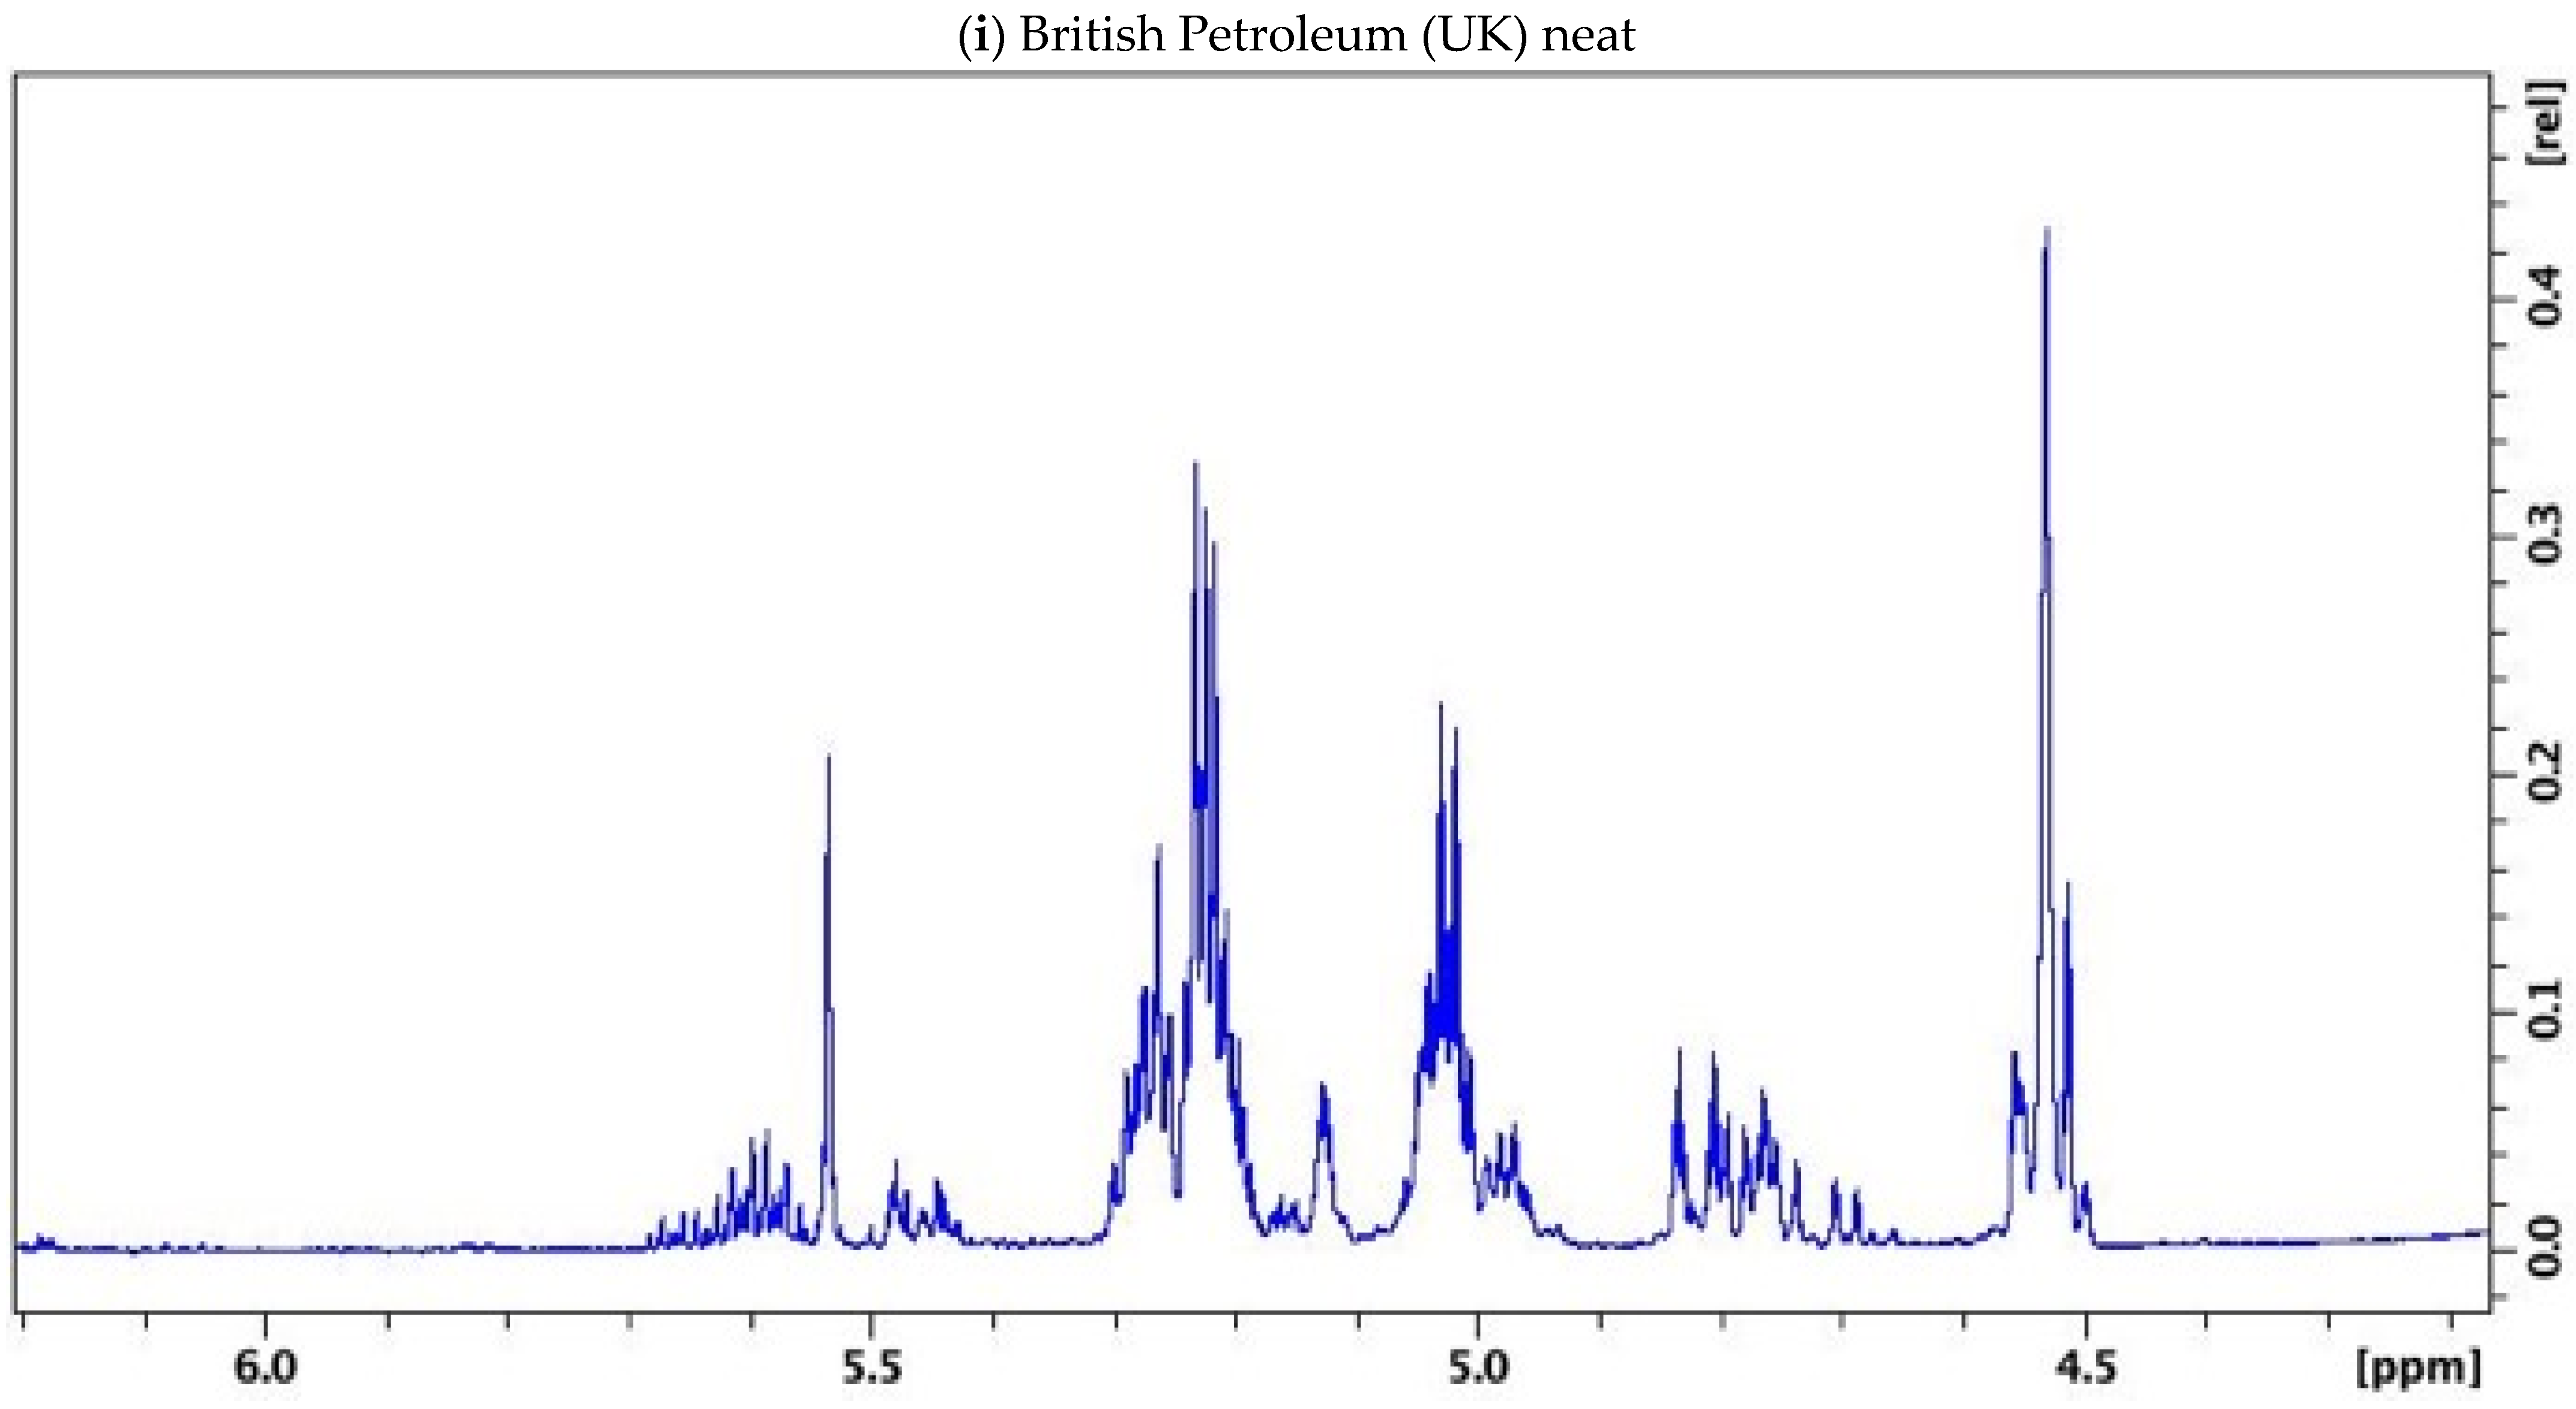
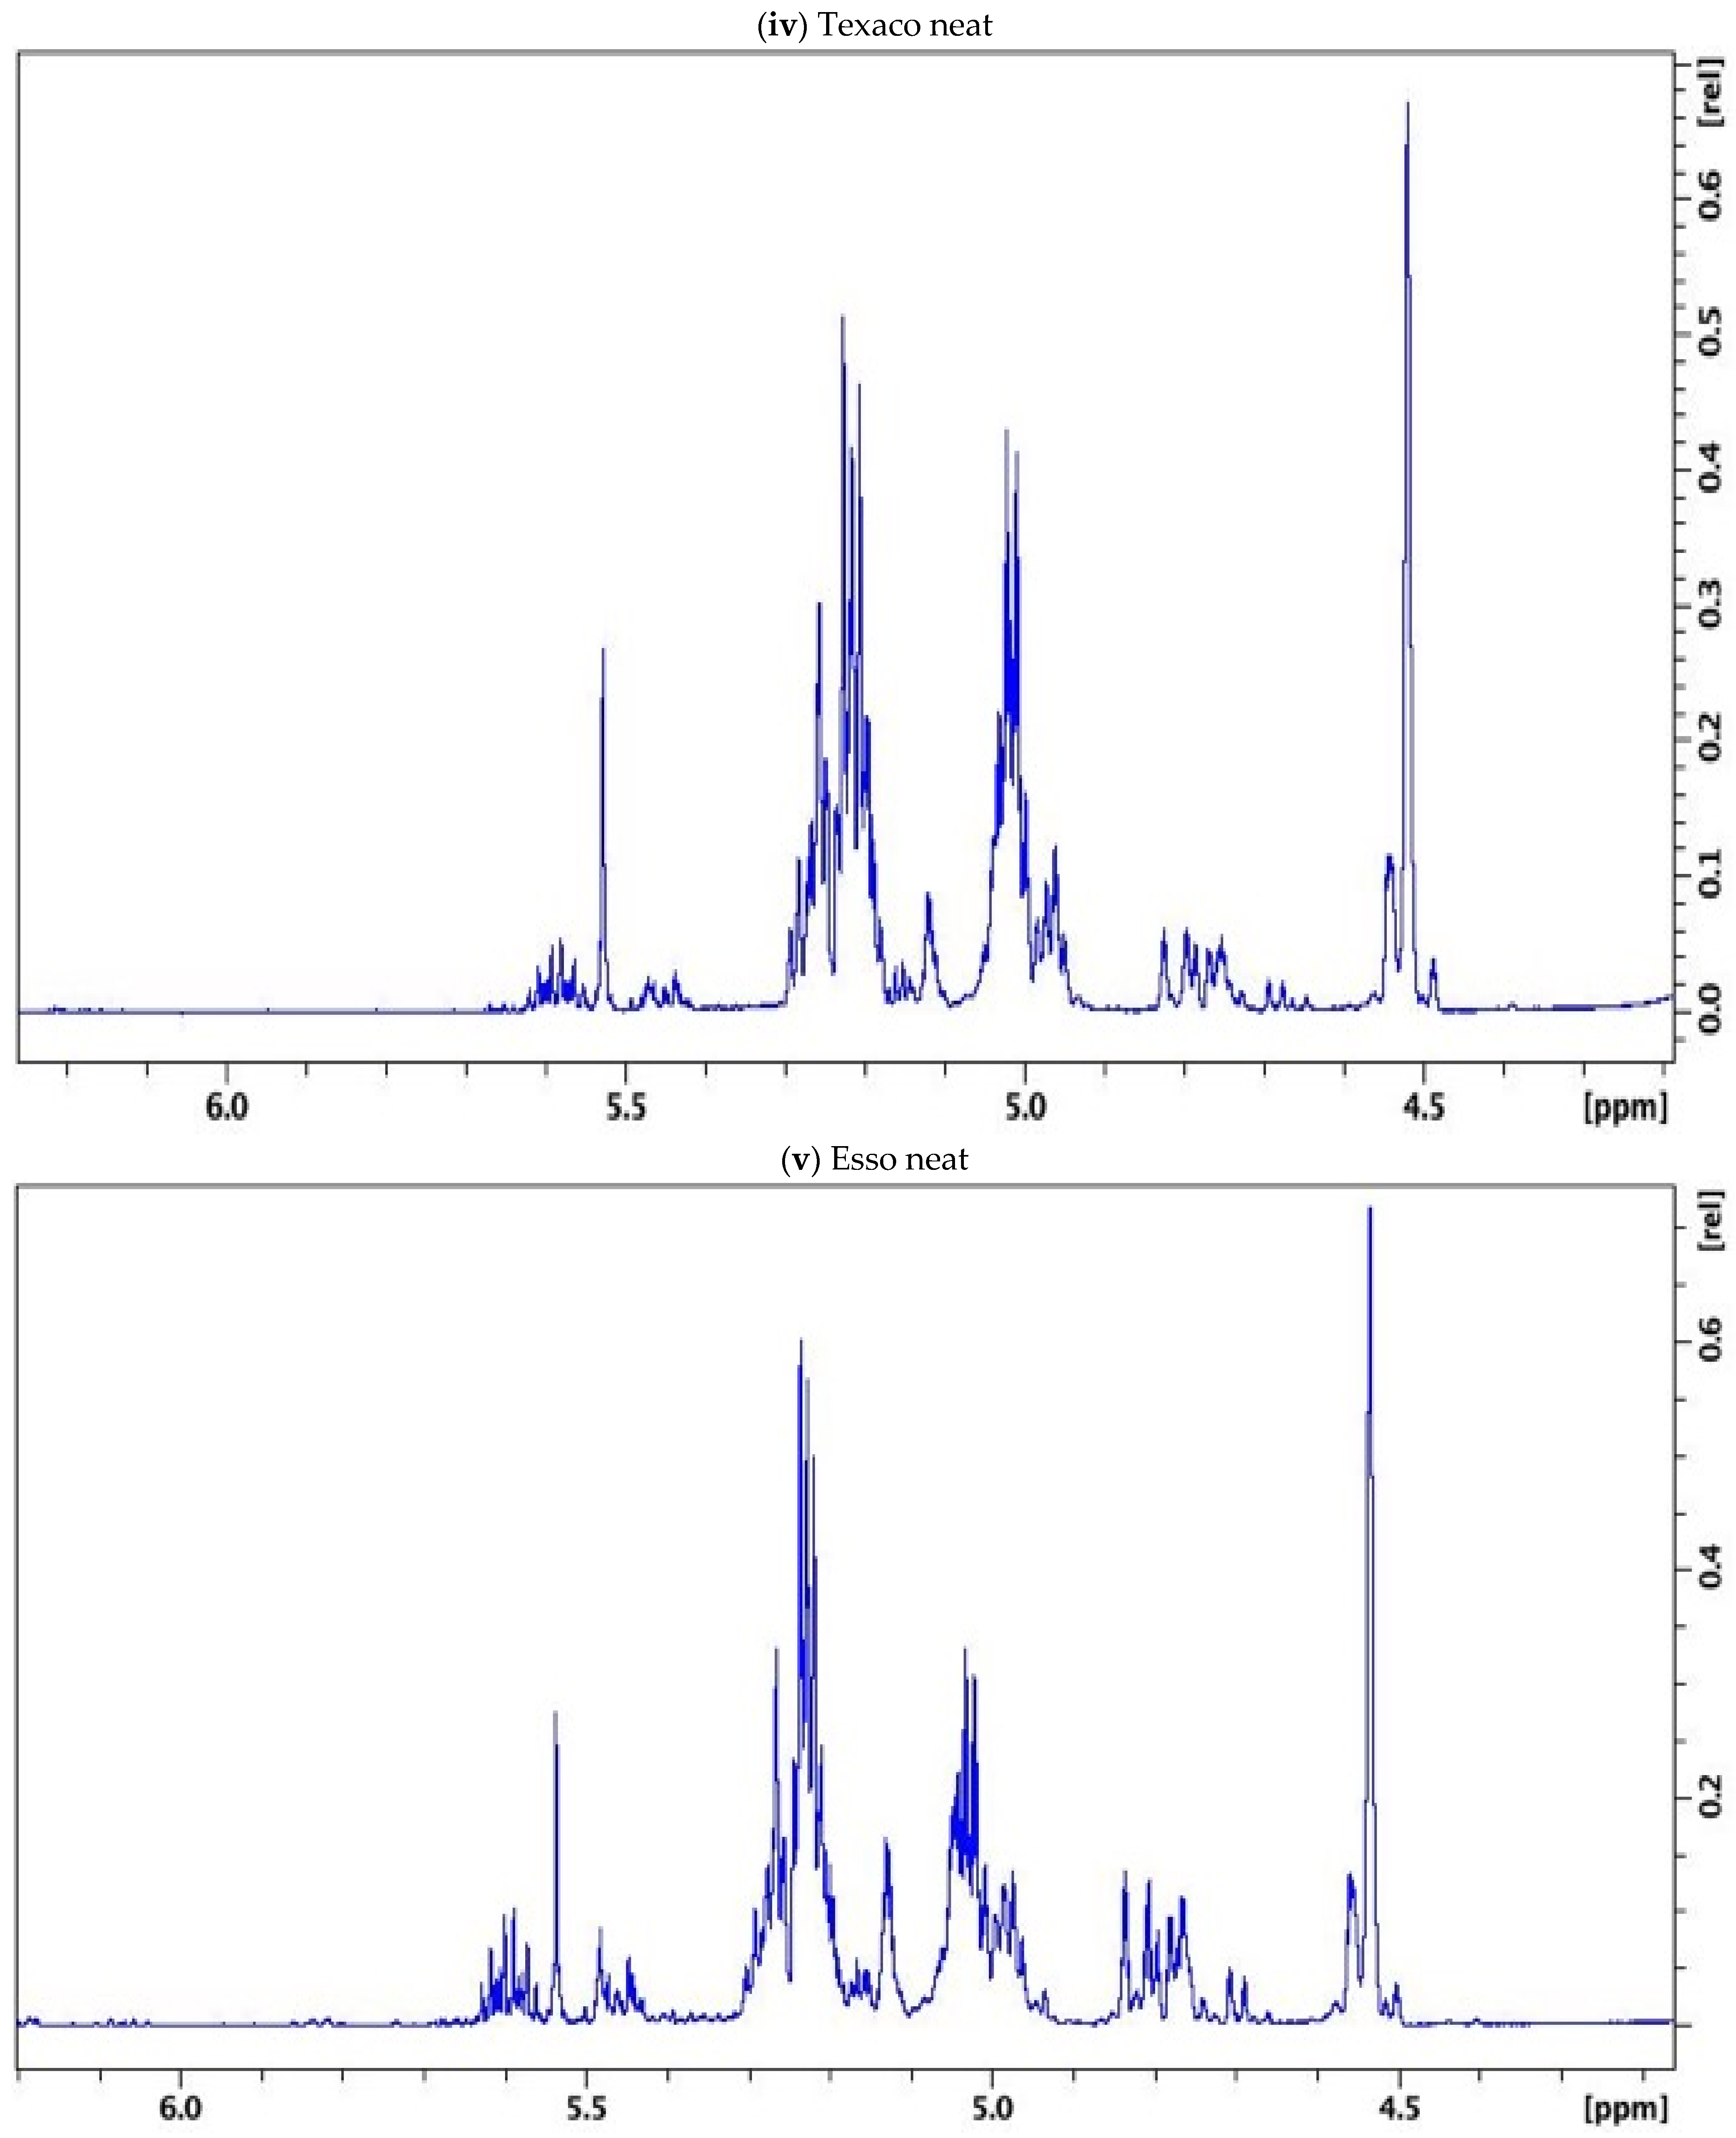
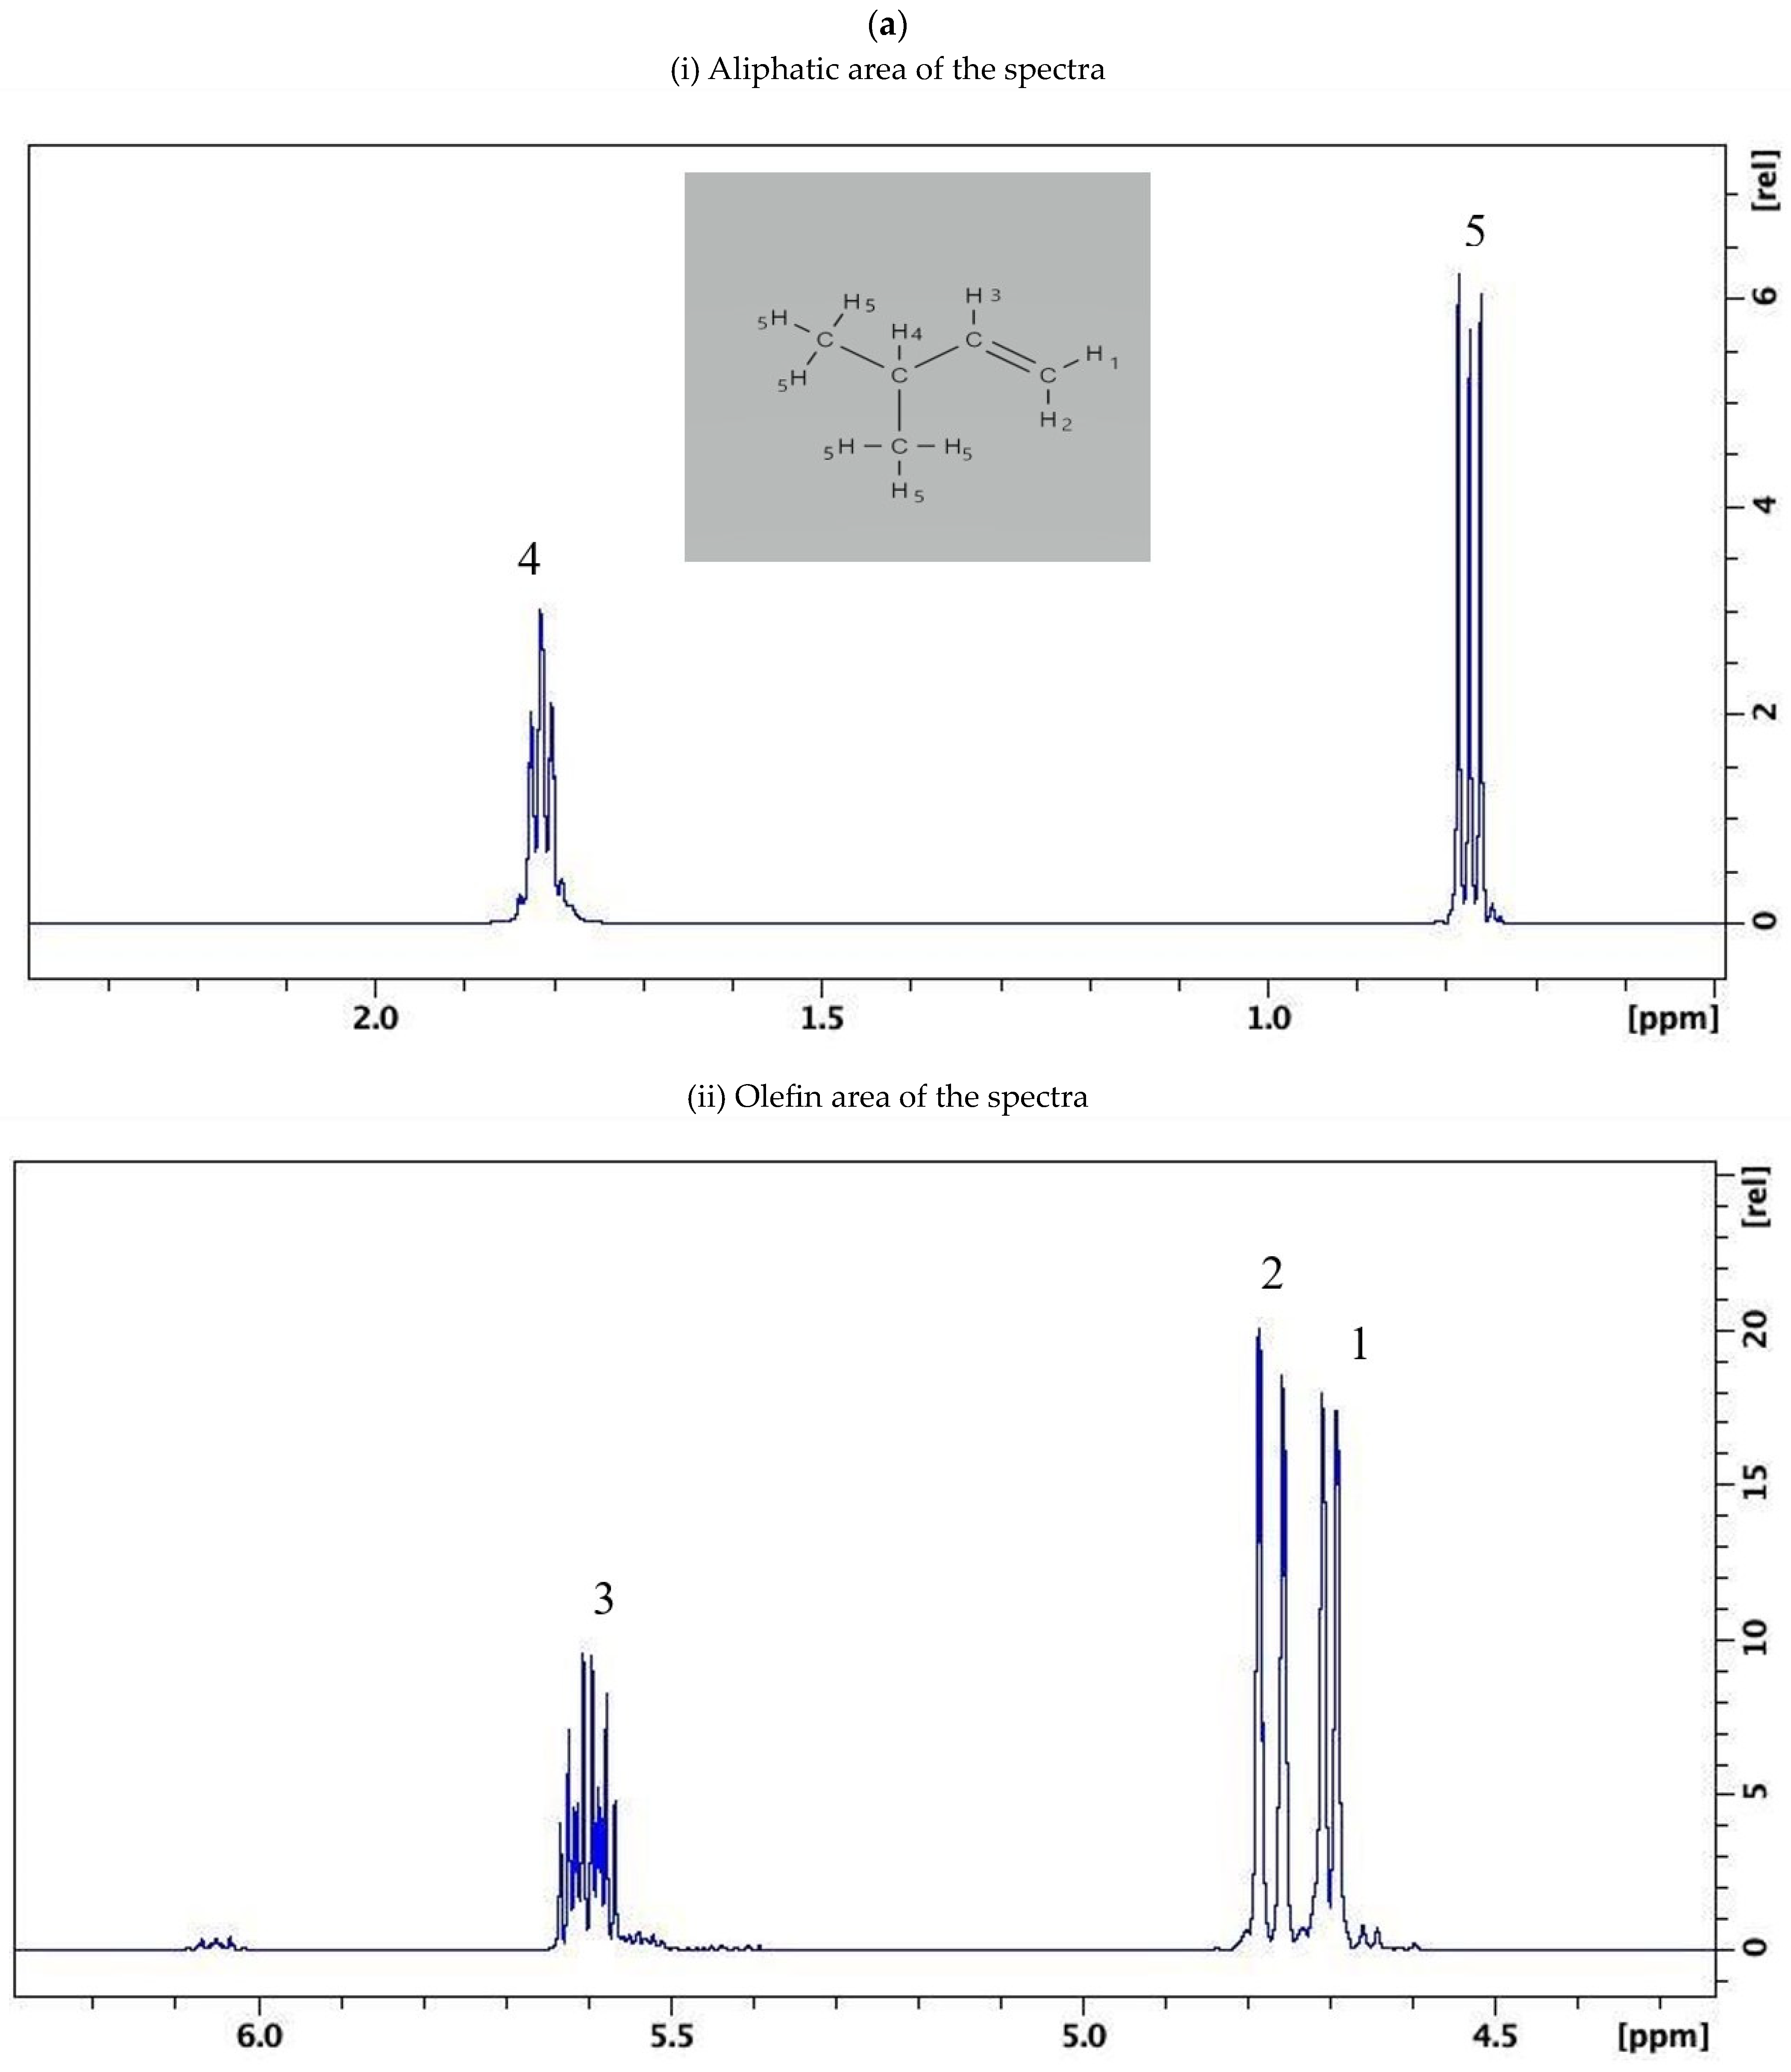
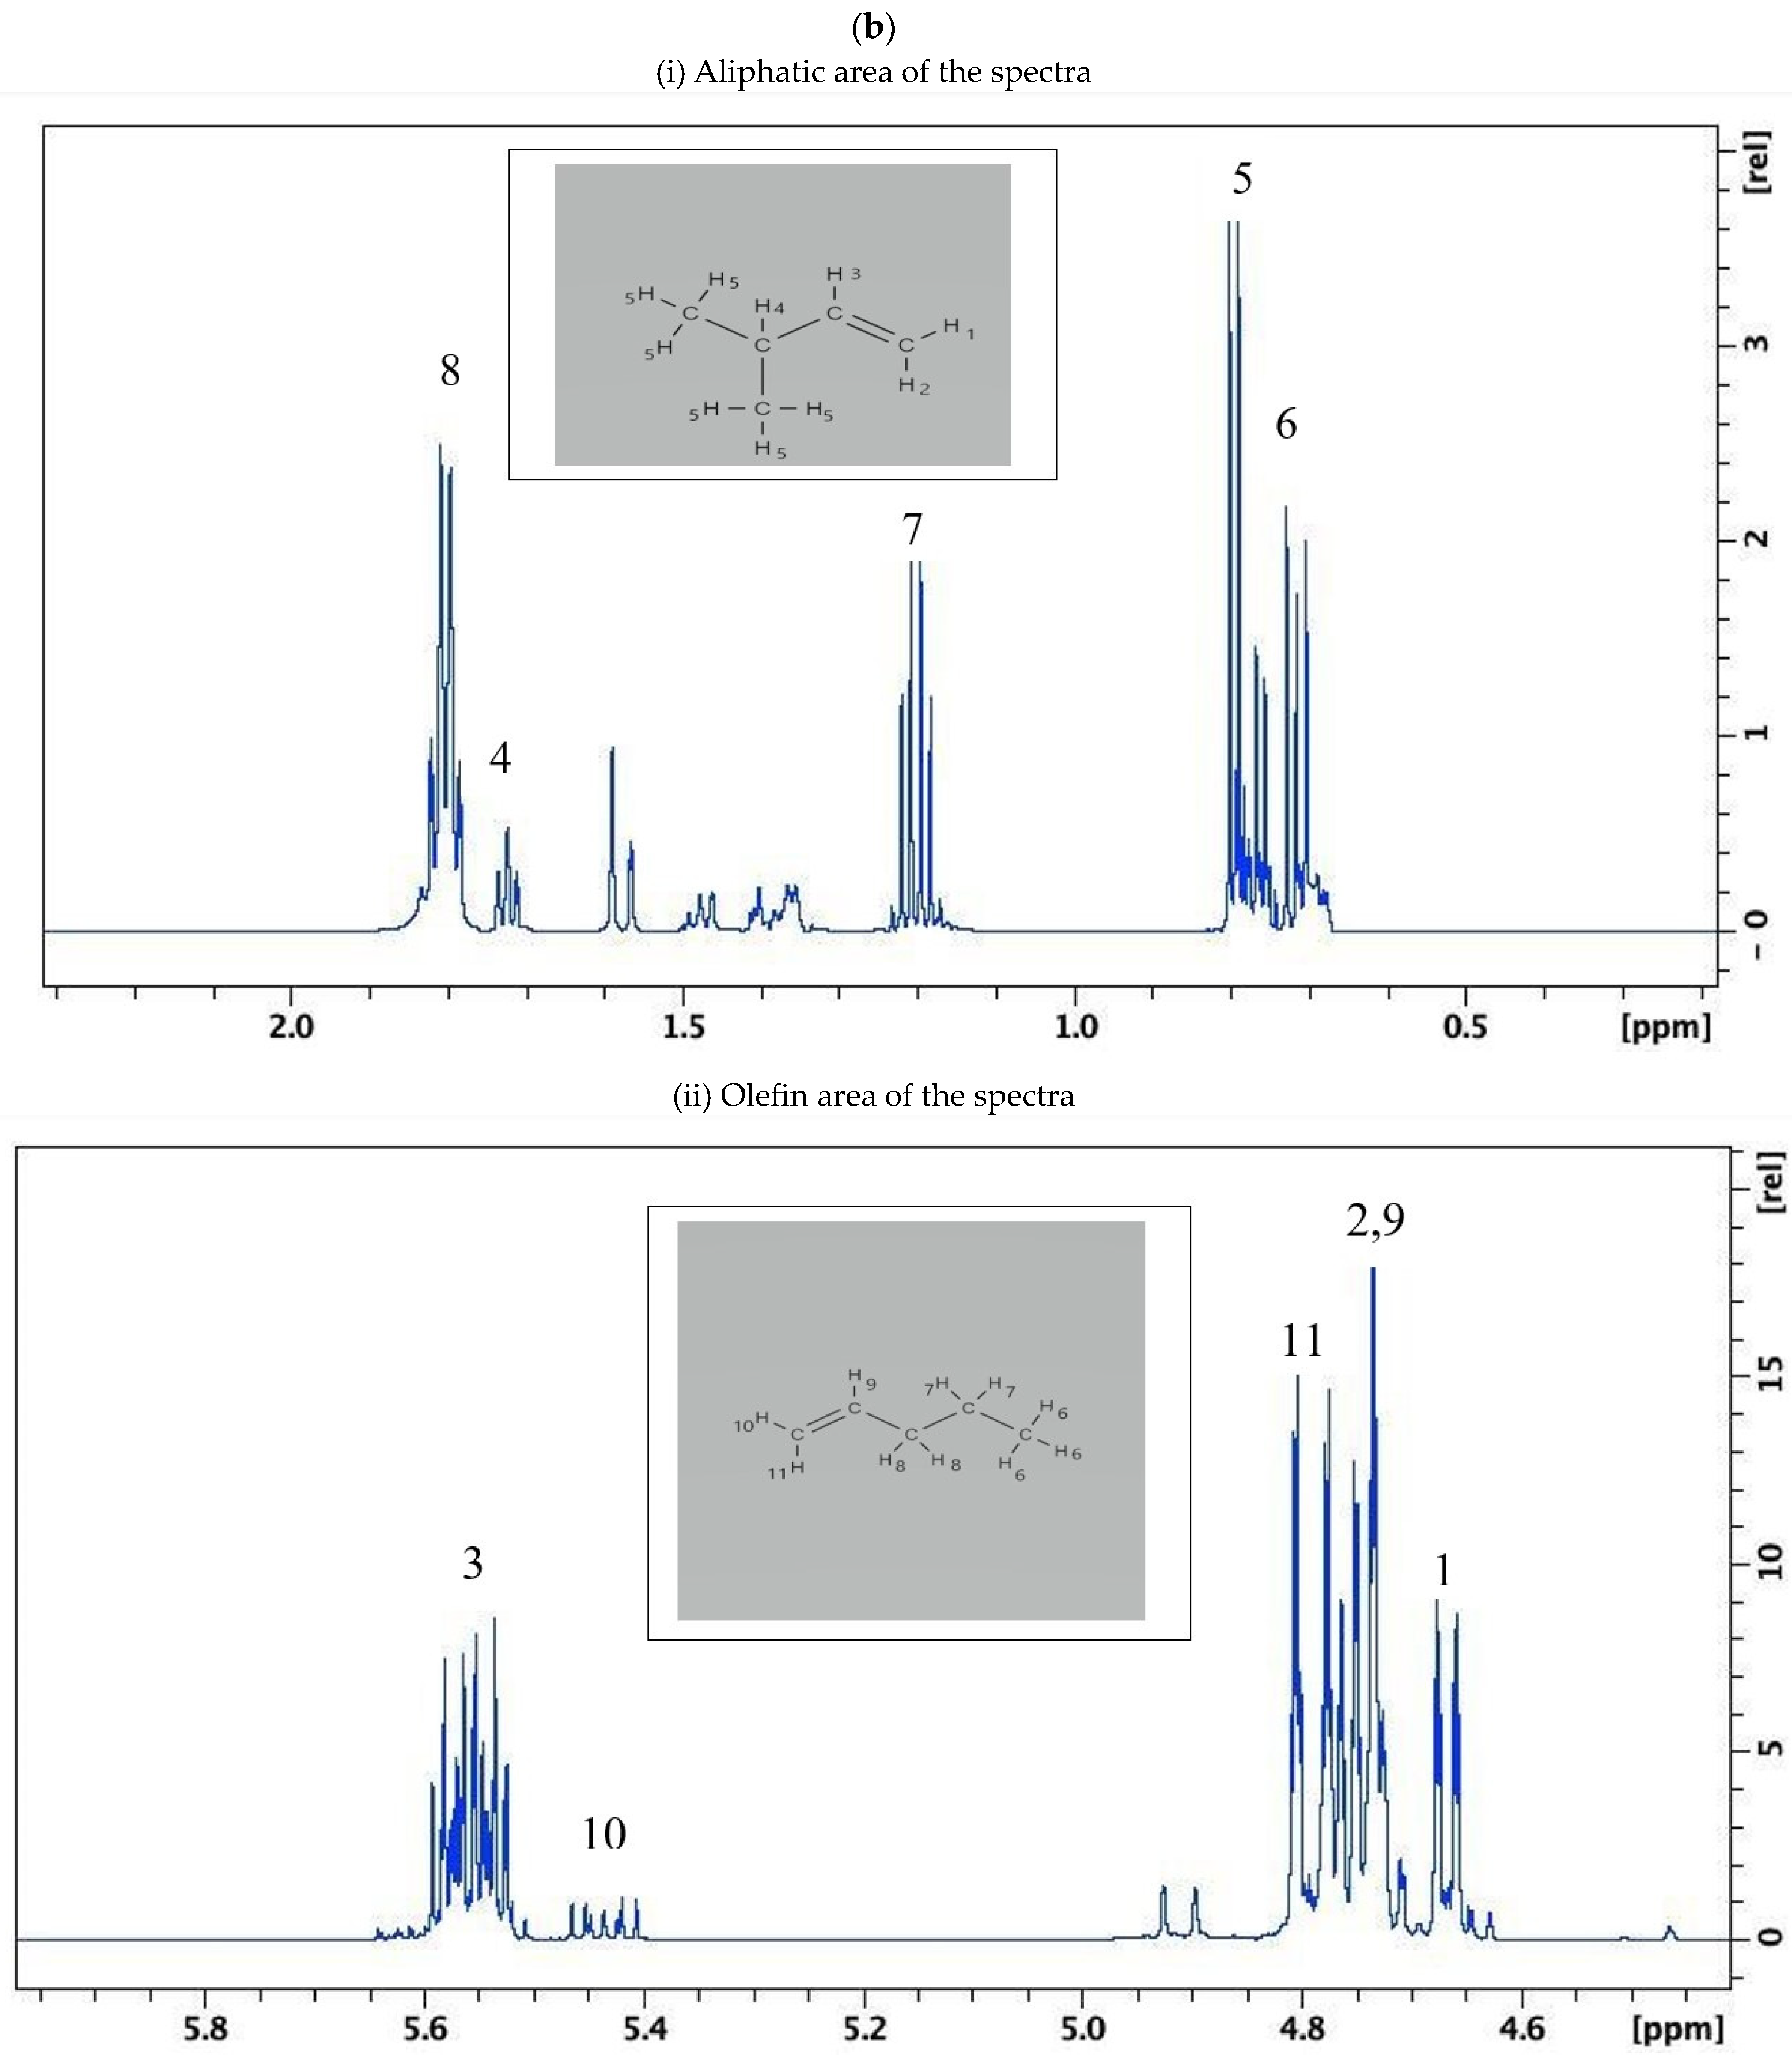
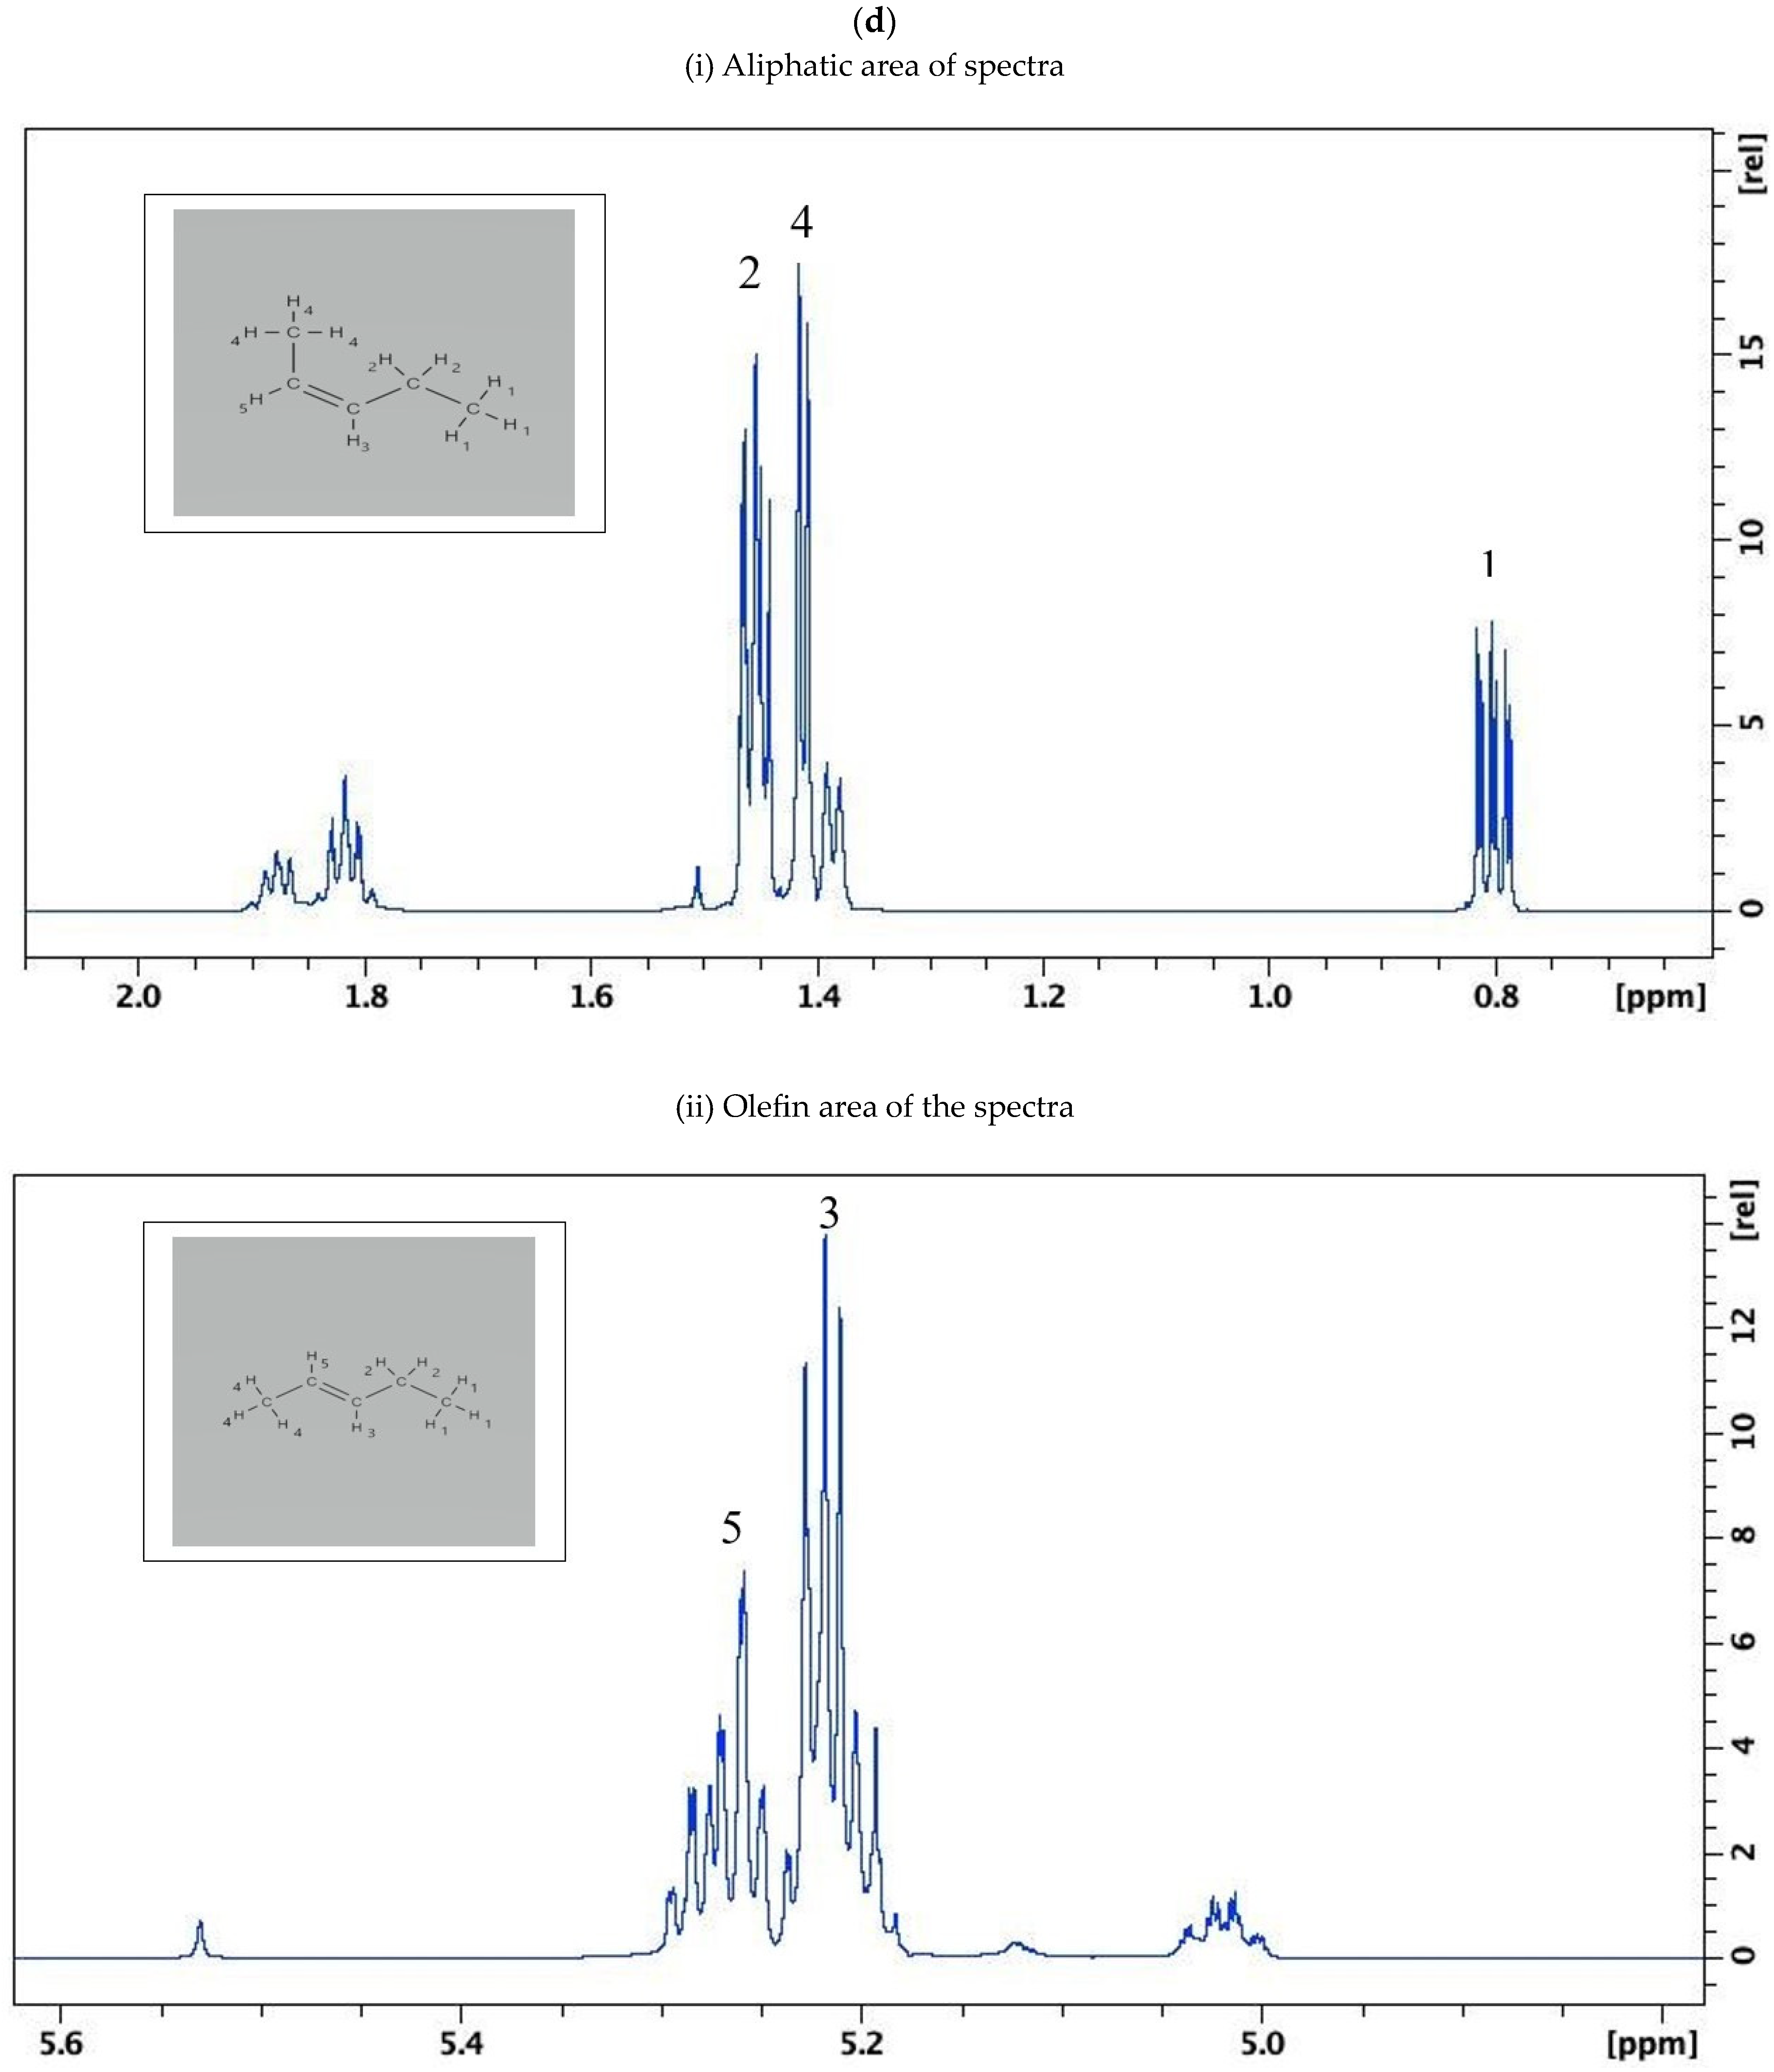
3.1. NMR Results
3.2. 1H selTOSCY Results for Native Petrol Samples
3.3. selTOCSY Results for Evaporated Petrol Samples
3.4. Identification of Target Olefin Sets in Petrol Samples Burned on Their Own and on Substrates
3.5. Classification of Neat Petrol Classes
3.6. Classification of Native, Evaporated, Burned on Its Own and Burned on Substrate Petrol Classes
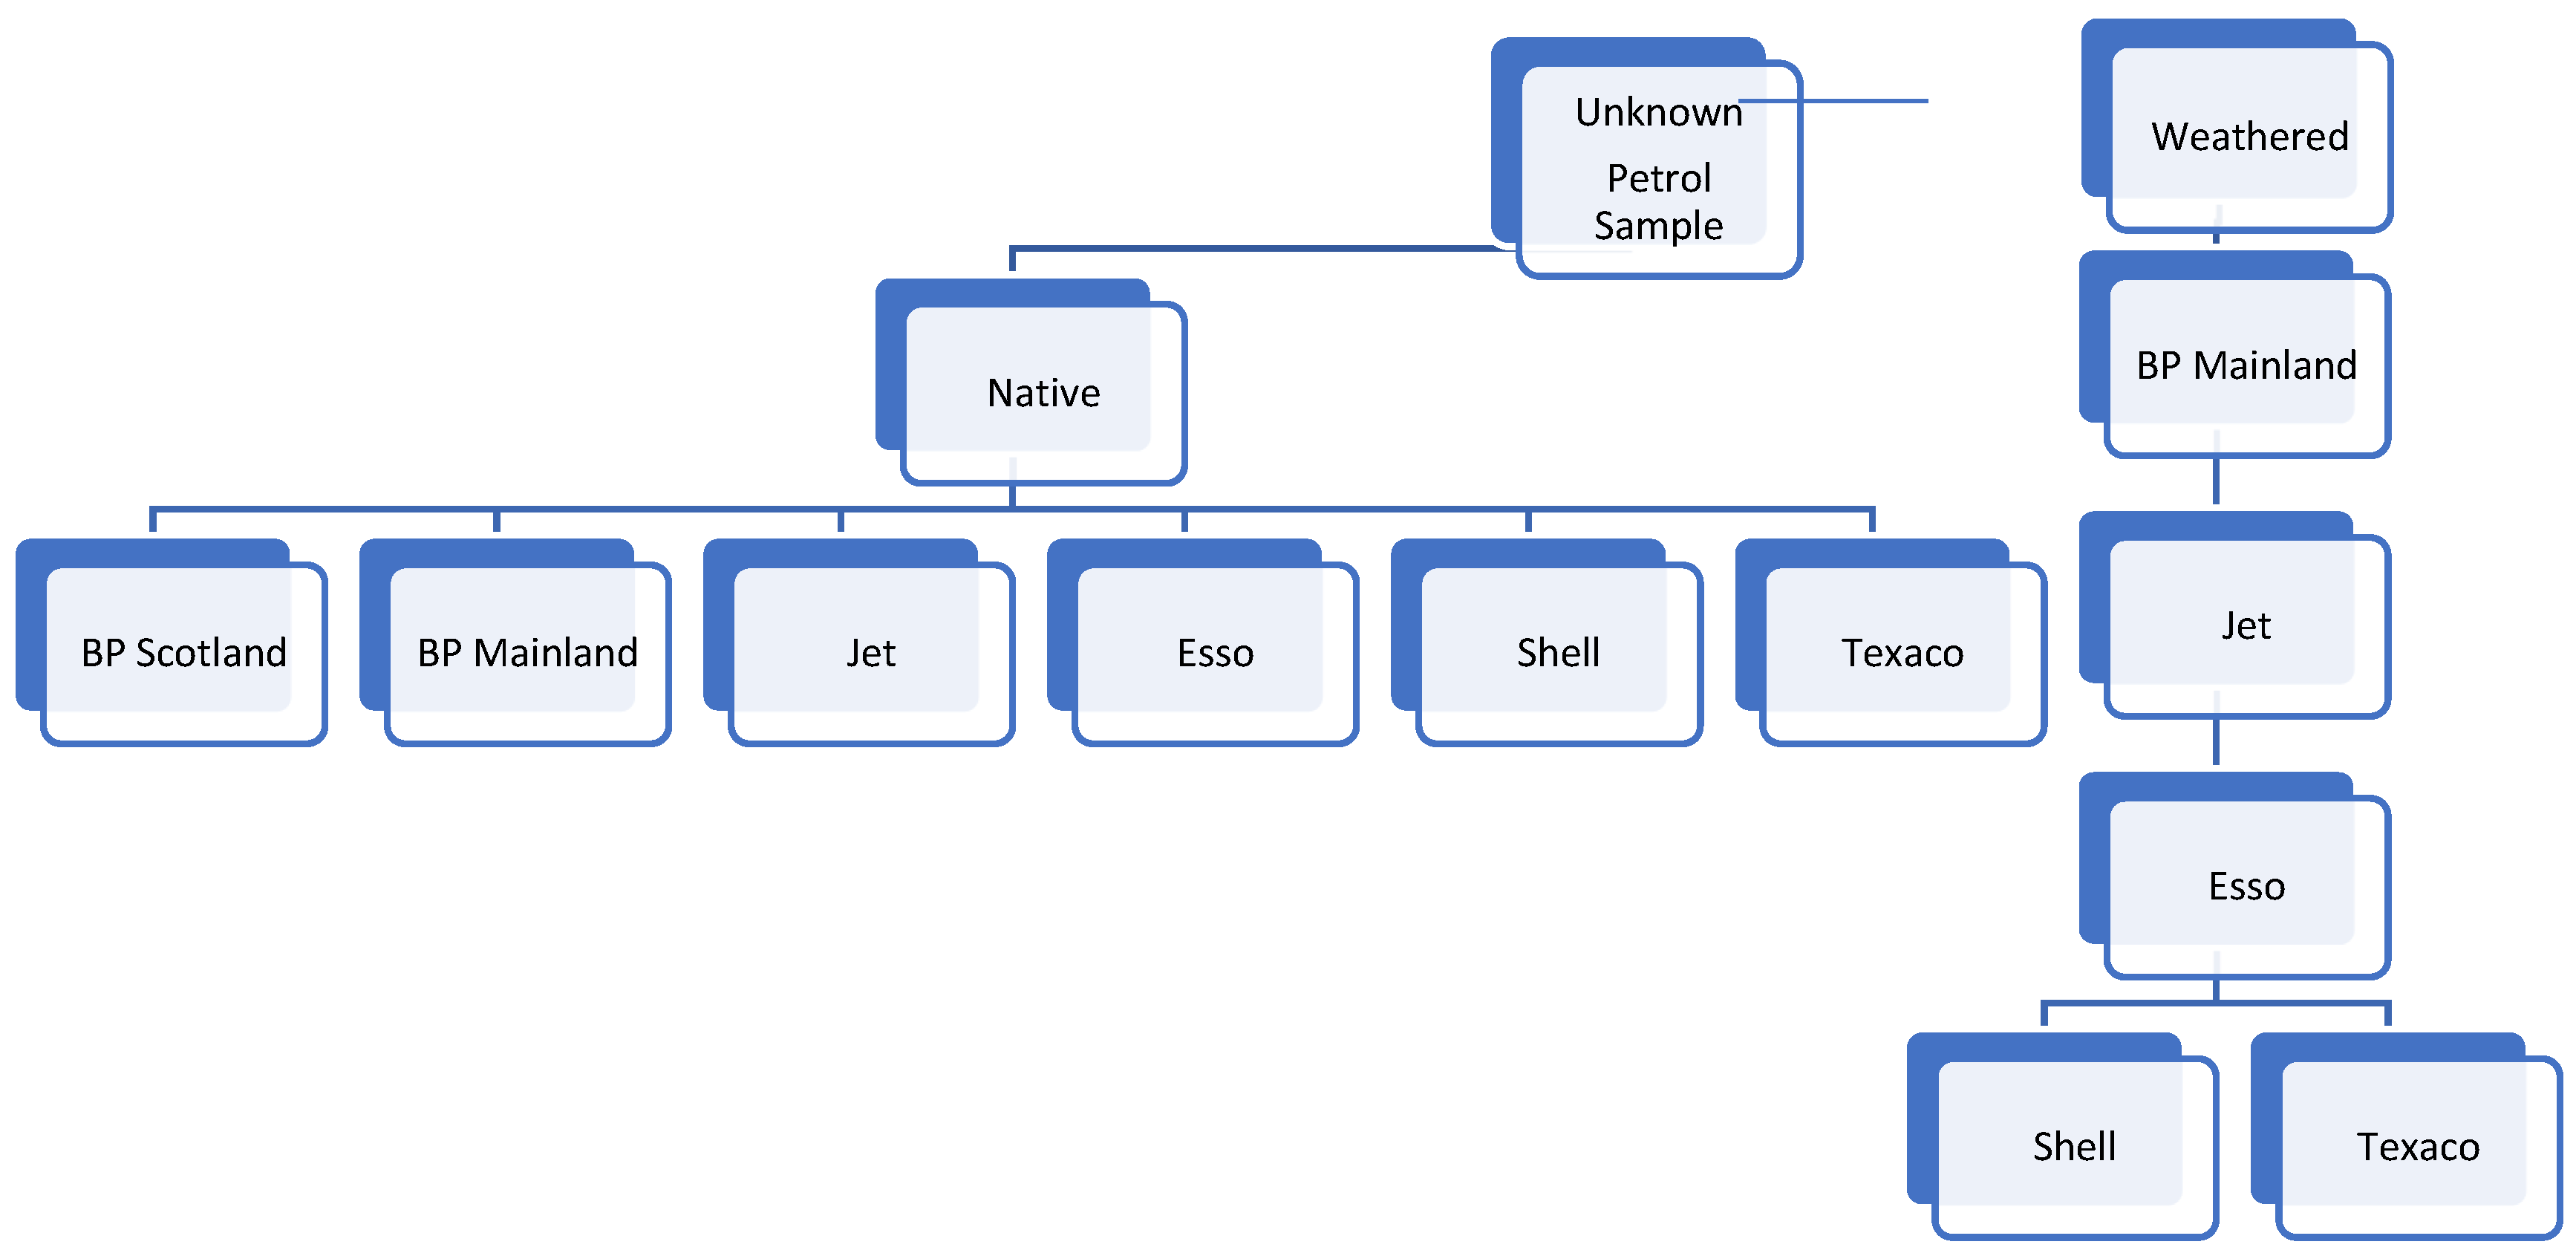
3.7. Hierarchical Classification Model for Individualization of Petrol Source
3.8. Blind Study
4. Discussion and Conclusions
Supplementary Materials
Author Contributions
Funding
Institutional Review Board Statement
Informed Consent Statement
Data Availability Statement
Acknowledgments
Conflicts of Interest
References
- Bumbrah, G.S.; Sarin, R.K.; Sharma, R.M. Analysis of Petroleum Products in Fire Debris Residues by Gas Chromatography: A Literature review. Arab. J. Forensic Sci. Forensic Med. 2017, 1, 512–534. [Google Scholar]
- Ugena, L.; Moncayo, S.; Manzoor, S.; Rosales, D.; Cáceres, J. Identification and Discrimination of Brands of Fuels by Gas Chromatography and Neural Networks Algorithm in Forensic Research. J. Anal. Methods Chem. 2016, 2016, 6758281. [Google Scholar] [CrossRef] [PubMed]
- Desa, W. The Discrimination of Ignitable Liquids and Ignitable Liquid Residues Using Chemometric Analysis. Ph.D. Thesis, University of Strathclyde, Glasgow, UK, 2012. [Google Scholar]
- Monfreda, M.; Gregori, A. Differentiation of unevaporated gasoline samples according to their brands, by SPME-GC-MS and multivariate statistical analysis. J. Forensic Sci. 2011, 56, 372–380. [Google Scholar] [CrossRef] [PubMed]
- Barnett, I.; Bailey, F.; Zhang, M. Detection and Classification of Ignitable Liquid Residues in the Presence of Matrix Interferences by Using Direct Analysis in Real Time Mass Spectrometry. J. Forensic Sci. 2019, 64, 1486–1494. [Google Scholar] [CrossRef] [PubMed]
- Novoa-Carballal, R.; Fernandez-Megia, E.; Jimenez, C.; Riguera, R. NMR methods for unravelling the spectra of complex mixtures. Nat. Prod. Rep. 2011, 28, 78–98. [Google Scholar] [CrossRef] [PubMed]
- Flumignan, D.L.; Boralle, N.; De Oliveira, J.E. Screening Brazilian commercial gasoline quality by hydrogen nuclear magnetic resonance spectroscopic fingerprinting and pattern-recognition multivariate chemometric analysis. Talanta 2010, 82, 99–105. [Google Scholar] [CrossRef] [PubMed]
- Monteiro, M.; Ambrozin, A.; Lião, L.; Boffo, E.; Tavares, L.; Ferreira, M.; Ferreira, A. Study of Brazilian Gasoline Quality Using Hydrogen Nuclear Magnetic Resonance (1H NMR) Spectroscopy and Chemometrics. Energy Fuels 2009, 23, 272–279. [Google Scholar] [CrossRef]
- Obeidat, S.M. The Use of 1H NMR and PCA for Quality Assessment of Gasoline of Different Octane Number. Appl. Magn. Reason. 2015, 46, 875–883. [Google Scholar] [CrossRef]
- Obeidat, S.; Alomary, A. Multivariate Calibration and 1H NMR Spectroscopy for Uncovering Fuel Adulteration. Appl. Magn. Reson. 2006, 47, 1273–1282. [Google Scholar] [CrossRef]
- Sun, C.; Wang, Z. 1H NMR application in characterizing the refinery products of gasoline. Concepts Magn. Reson. Part A 2016, 45A, e21393. [Google Scholar] [CrossRef]
- Pagano, B.; Lauri, I.; De Tito, S.; Persico, G.; Chini, M.G.; Malmendal, A.; Novellino, E.; Randazzo, A. Use of NMR in profiling of cocaine seizures. Forensic Sci. Int. 2013, 231, 120–124. [Google Scholar] [CrossRef] [PubMed]
- Takano, H.; Momota, Y.; Ozaki, T.; Terada, K. Personal Identification from Dental Findings Using AI and Image Analysis against Great Disaster in Japan. J. Forensic Leg. Investig. Sci. 2019, 5, 041. [Google Scholar] [CrossRef] [PubMed]
- Mitchell, F. The use of Artificial Intelligence in digital forensics: An introduction. Digit. Evid. Electron. Signat. Law Rev. 2010, 7, 35–41. [Google Scholar] [CrossRef]
- Vitiello, A.; Di Nunzio, C.; Garofano, L.; Saliva, M.; Ricci, P.; Acampora, G. Bloodstain pattern analysis as optimization problem. Forensic Sci. Int. 2016, 266, e79–e85. [Google Scholar] [CrossRef] [PubMed]
- Chinnikatti, S. Artificial Intelligence in Forensic Science. Forensic Sci. Addict. Res. 2018, 2. [Google Scholar] [CrossRef]
- Rigano, C. Using Artificial Intelligence to Address Criminal Justice Needs. Natl. Inst. Justice J. 2019, 17, 1–10. [Google Scholar]
- Braun, S.; Kalinowski, H.O.; Berger, S. 100 and More Basic NMR Experiments: A Practical Course; VCH: Weinheim, Germany, 1996. [Google Scholar]
- Pavia, D.; Lampman, G.; Kriz, G. Introduction to Spectroscopy, 3rd ed.; Thomson Learning: Washington, DC, USA, 2001. [Google Scholar]
- Beyer, T.; Schollmayer, C.; Holzgrabe, U. The role of solvents in the signal separation for quantitative 1H NMR spectroscopy. J. Pharm. Biomed. Anal. 2010, 52, 51–58. [Google Scholar] [CrossRef] [PubMed]
- Nawaiseh, A. Audit Opinion Decision Using Artificial Intelligence Techniques: Empirical Study of UK and Ireland. Ph.D. Thesis, Brunel University, London, UK, 2021. [Google Scholar]


| (1) Summary table of the neat petrol samples used for the double-blind study. | ||
| Blind Sample Name | Class | |
| BLIND A | Jet | |
| BLIND B | Esso I (from regions) | different |
| BLIND C | Esso II | |
| BLIND D | Esso III | |
| BLIND E | Texaco I | |
| BLIND F | Texaco II | |
| BLIND G | Shell I | |
| BLIND H | BP M | |
| BLIND I | Shell II | |
| BLIND J | BP S | |
| (2) Summary table of the evaporated, burnt, and burned on substrate petrol samples used for double-blind study. | ||
| Blind Exhibit Name | CLASS | Weathered Status |
| BLIND EXHIBIT A | BPM | Evaporated 50% |
| BLIND EXHIBIT B | BPM | Cardboard Substrate |
| BLIND EXHIBIT C | JET | Burnt |
| BLIND EXHIBIT D | JET | Evaporated 25% |
| BLIND EXHIBIT E | ESSO | Evaporated 25% |
| BLIND EXHIBIT F | SHELL | Cardboard Substrate |
| BLIND EXHIBIT G | SHELL | Burnt |
| BLIND EXHIBIT H | TEXACO | Burnt |
| BLIND EXHIBIT I | TEXACO | Evaporated 25% |
| Set 1 | Set 2 | Set 3 | Set 4 | |
|---|---|---|---|---|
| Petrol Brand | 3-methyl-1-butene | Mixture of 1-pentene and 3-methyl-1-butene | 2-methyl-2-butene | Mixture of cis- and trans-2-pentene |
| BP S | √ | X | X | √ |
| BP M | √ | √ | √ | √ |
| Jet | √ | √ | √ | √ |
| Texaco | √ | √ | X | X |
| Esso | √ | √ | X | X |
| Shell | √ | √ | X | X |
| Distinctive Set of Olefins | Aliphatic Couplings | Olefinic Couplings | Potential to Discriminate |
|---|---|---|---|
| 1. 3-methyl-1-butene | loss of -CH3 methyl groups and CH couplings at 25% evaporation rate | decrease in relative intensity of CH=CH2 couplings up to complete loss for 50% evaporation rate | X |
| 2. mixture of 1-pentene and 3-methyl-1-butene | loss of all aliphatic couplings at 50% evaporation rate | decrease in relative intensity for all couplings up to 50% evaporation rate, poor resolution was observed for 75% evaporation rate | X |
| 3. 2-methyl-2-butene | Preserved of all aliphatic couplings up to 75% evaporation with loss of resolution | decrease in relative intensity for all couplings up to 50% evaporation rate, poor resolution was observed for 75% evaporation rate | √ |
| 4. Mixture of cis- and trans- 2-pentene | Preserved of all aliphatic couplings up to 75% evaporation with loss of resolution | decrease in relative intensity for all couplings up to 50% evaporation rate, poor resolution was observed for 75% evaporation rate | √ |
| Type of Substrate | Background Interference | Application | Potential to Discriminate |
|---|---|---|---|
| Wood (flooring): Oak Ash White pine Yellow pine Hickory | Substrate background interference from the pyrolysis of the wood: cellulose and levoglucosan from oak; unidentified peaks in ash, hickory and yellow pine; 2-furalaldehyde and m-xylene from white pine | Household fires | X |
| Carpets 100% polyester with Acton/Hessian (14 mm thickness) 100% polypropylene with felt backing (12 mm thickness) 50% wool with Action/Hessain (5 mm thickness) | Substrate background interference from the backing of substrate itself due to the polymer styrene | Household/motor vehicle fires | X |
| Fabrics 100% cotton 100% linen 100% polyester fabric Cotton and linen Cotton and polyester Viscose and linen | Partially recovery of 2-methyl-2-butene and a mixture of cis- and trans-2-pentene identified by 1H selTOCSY method but inconsistent among petrol sources | Household fires, petrol bombs, fires set by humans | X |
| Paper materials | All sets of olefins were lost due to absorbance and retention capabilities of paper materials | Household and office fires, destruction of evidence | X |
| Cardboard | Fully recovered 2-methyl-2-butene and a mixture of cis- and trans-2-pentene, which were identified by 1H selTOCSY method | Household and office fires, destruction of evidence | √ |
| Dataset | Classifier | PCA | Feature Selection | k-Folds | BP S | BP M | Jet | Esso | Shell | Texaco |
|---|---|---|---|---|---|---|---|---|---|---|
| Entire 1H NMR spectra | Ensemble | √ | 5 | 92.3% | 91.7% | |||||
| Entire 1H NMR spectra | SVM | √ | 10 | 100% | 71.4% | 83.3% | ||||
| Olefin Region | NN | √ | 5 | 76.9% | 66.7% | |||||
| Olefin Region | NN | √ | 10 | 92.3% | 75% | |||||
| 3-methyl-2-butene | NN | √ | 10 | 100% | 83.3% | 88.9% | 100% | |||
| 3-methyl-2-butene | Ensemble | √ | 5 | 91.7% | 66.7% | 62.5% | 77.8% | 90% | ||
| Mixture of 3-methyl-2-butene and 1-pentene | Ensemble | √ | 5 | n/a | 100% | 100% | ||||
| Mixture of 3-methyl-2-butene and 1-pentene | kNN | √ | 10 | n/a | 66.7% | 76% | ||||
| 2-methyl-2-butene | SVM | √ | 10 | n/a | 66.7% | 85.7% | 76% | |||
| 2-methyl-2-butene | Ensemble | √ | 5 | n/a | 71.4% | 71.4% | 66.7% | 69.2% | ||
| Cis- and trans-2-pentene | Linear Discriminant | √ | 10 | 85.7% | 71.4% | 60% | 60% | 83.3% | ||
| Cis- and trans-2-pentene | Ensemble | √ | 10 | 100% | 71.4% | 60% | 60% | 83.3% | ||
| Combined Olefins | Ensemble | √ | 10 | 100% | 77.8% | 71.4% | 71.4% | 77.8% | 76.9% | |
| Combined Olefins | Ensemble | √ | 10 | 100% | 66.7% | 71.4% | 71.4% | 88.9% | 76.9% |
| Dataset | Classifier | k-Folds | BP S | BP M | Jet | Esso | Shell | Texaco |
|---|---|---|---|---|---|---|---|---|
| Neat Combined | Linear Discriminant | 5 | 85.7% | 88.9% | 76.9% | |||
| Evaporated petrol samples | NN | 10 | 75% | 60% | ||||
| Neat and evaporated petrol samples | NN | 10 | 60% | 69.2% | 70.6% | |||
| Neat, evaporated, burnt and burned on substrate petrol samples | NN | 5 | 100% | 62.5% |
| Sample N | Class | Native vs. Evaporated | Predicted Class by NMR Hierarchical Classifier | ATD-GC-MS |
|---|---|---|---|---|
| BLIND A | JET | native | ESSO | Identified as unique petrol source |
| BLIND B | ESSO | native | SHELL | Identified as unique petrol source or similar to J, E, F and H |
| BLIND C | ESSO | native | ESSO | Sample G identified as similar to Sample C |
| BLIND D | ESSO | native | ESSO | Sample D identified to be similar to Sample I |
| BLIND E | TEXACO | native | TEXACO | Sample E and F identified as same petrol source |
| BLIND F | TEXACO | native | TEXACO | Sample E and F identified as same petrol source |
| BLIND G | SHELL | native | SHELL | Sample G identified as similar to Sample C |
| BLIND H | BP M | native | BP M | Sample H and J were grouped with Texaco petrol source |
| BLIND I | SHELL | native | SHELL | Sample I identified as similar to Sample D |
| BLIND J | BP S | native | BP S | Sample H and J were grouped with Texaco petrol source |
| Sample N | Class | Native vs. Weathered | BP M Classifier | Jet Classifier | Esso Classifier | Shell/Texaco Classifier | Predicted Class by NMR Hierarchical Classifier | ATD-GC-MS |
|---|---|---|---|---|---|---|---|---|
| BLIND A | BP M 50% evaporated | Weathered | BP M | BP M | No differentiation achieved | |||
| BLIND B | BP M on cardboard | Weathered | BP M | BP M | Differentiated as different petrol source | |||
| BLIND C | JET burnt | Weathered | Other | JET | JET | No differentiation achieved | ||
| BLIND D | JET 25% evaporated | Weathered | Other | JET | JET | No differentiation achieved | ||
| BLIND E | ESSO 25% evaporated | Weathered | Other | Other | ESSO | ESSO | No differentiation achieved | |
| BLIND F | SHELL on cardboard | Weathered | Other | Other | Other | SHELL | SHELL | No differentiation achieved |
| BLIND G | SHELL burnt | Weathered | Other | Other | Other | TEXACO | TEXACO | No differentiation achieved |
| BLIND H | TEXACO burnt | Weathered | Other | Other | Other | TEXACO | TEXACO | No differentiation achieved |
| BLIND I | TEXACO 25% evaporated | Weathered | Other | Other | ESSO | ESSO | No differentiate achieved |
| Classifier | Overall Accuracy (%) | Classification |
|---|---|---|
| Linear Discriminant | 98.5 | Native vs. weathered |
| Ensemble | 80 | BP S vs. BP M vs. Jet vs. Texaco vs. Shell vs. Esso |
| k-NN | 84.4 | BP M vs. other petrol brands |
| Logistic Regression | 82.4 | Jet vs. other petrol brands |
| ANN | 82.1 | Esso vs. other petrol brands |
| ANN | 60 | Texaco vs. Shell |
Disclaimer/Publisher’s Note: The statements, opinions and data contained in all publications are solely those of the individual author(s) and contributor(s) and not of MDPI and/or the editor(s). MDPI and/or the editor(s) disclaim responsibility for any injury to people or property resulting from any ideas, methods, instructions or products referred to in the content. |
© 2024 by the authors. Licensee MDPI, Basel, Switzerland. This article is an open access article distributed under the terms and conditions of the Creative Commons Attribution (CC BY) license (https://creativecommons.org/licenses/by/4.0/).
Share and Cite
Yankova, Y.; Cirstea, S.; Cole, M.; Warren, J. Identification and Discrimination of Petrol Sources by Nuclear Magnetic Resonance Spectroscopy and Machine Learning in Fire Debris Analysis. Appl. Sci. 2024, 14, 5177. https://doi.org/10.3390/app14125177
Yankova Y, Cirstea S, Cole M, Warren J. Identification and Discrimination of Petrol Sources by Nuclear Magnetic Resonance Spectroscopy and Machine Learning in Fire Debris Analysis. Applied Sciences. 2024; 14(12):5177. https://doi.org/10.3390/app14125177
Chicago/Turabian StyleYankova, Yanita, Silvia Cirstea, Michael Cole, and John Warren. 2024. "Identification and Discrimination of Petrol Sources by Nuclear Magnetic Resonance Spectroscopy and Machine Learning in Fire Debris Analysis" Applied Sciences 14, no. 12: 5177. https://doi.org/10.3390/app14125177