Article

Mechanism of Unfrozen Water Content Evolution during Melting of Cryogenic Frozen Coal Body Based on 2D NMR

1
Jiangsu Key Laboratory of Coal-Based Greenhouse Gas Control and Utilization, China University of Mining and Technology, Xuzhou 221008, China
2
Low Carbon Energy Institute, China University of Mining and Technology, Xuzhou 221008, China
3
School of Safety Engineering, China University of Mining and Technology, Xuzhou 221116, China
4
Key Laboratory of Theory and Technology on Coal and Rock Dynamic Disaster Prevention and Control, National Mine Safety Administration, China University of Mining and Technology, Xuzhou 221116, China
5
College of Safety Science and Engineering, Xi’an University of Science and Technology, Xi’an 710054, China
*
Authors to whom correspondence should be addressed.
Appl. Sci. 2024, 14(12), 5182; https://doi.org/10.3390/app14125182
Submission received: 18 May 2024 / Revised: 10 June 2024 / Accepted: 12 June 2024 / Published: 14 June 2024

Abstract

:
The content of unfrozen water in the freezing process of coal body affects the microscopic pore structure and macroscopic mechanical properties of coal body and determines the permeability-enhancement effect of coal seam and the extraction efficiency of coal mine gas. To investigate the evolution mechanism of unfrozen water content in the melting process of lignite, this paper takes the melting process of lignite liquid nitrogen after freezing for 150 min as the research object and quantifies the spatial change process of unfrozen water distribution based on two-dimensional nuclear magnetic resonance technology. Through the accurate interpretation of the superimposed signals of different fluids, the 2D NMR technique can more easily obtain the spatial distribution of different fluids and even the specific content of fluids in different pores in coals. The results show that at −196 °C, the unfrozen water mainly existed in the small coal pore and the small ice pore in the large pore. As the temperature rose, the pores melted, and free water began to be produced. The mathematical model analysis shows that there was intermolecular potential energy between fluid molecules and the coal pore wall, and the pore wall exerted a part of pressure on its internal fluid, and the pressure affected the melting point of pore ice with pore diameter and melting temperature, resulting in the difference of unfrozen water content.

1. Introduction

Coal mine gas (coal bed methane), as a kind of power source with low pollution and a high utilization rate, has long been in high demand in our country [1,2,3,4,5]. The efficient extraction of coal mine gas has the triple benefits of coal mine disaster prevention and control, methane resource development and greenhouse gas emission reduction. Along with the continuous research on coal mine gas extraction and technology, anhydrous and permeability-enhancement technologies such as supercritical CO2, nitrogen and liquid nitrogen cracking have been gradually favored and utilized by scholars in related fields [6,7,8,9,10]. The intrinsic mechanism of the anhydrous fracturing method is to achieve the purpose of destroying the coal rock structure by cleverly applying the freezing and swelling force generated in the process of ice-water phase change, thus expanding the pore space of the coal body, increasing the permeability and better promoting the extraction rate of coal bed methane [11,12,13]. Low-temperature anhydrous permeability enhancement is of great significance for the safe, green and sustainable development of coal and gas resources.
Not all of the liquid water in coal is converted to solid ice when the coal is frozen by a low-temperature medium; due to surface adsorption and pore capillary action in the coal matrix, a certain amount of liquid water is always maintained, which is called unfrozen water [14,15]. The unfrozen water is deposited between the ice crystals and the coal matrix in the form of water film, which has a great influence on the macroscopic properties of the frozen coal [16,17]. As an important part of low-temperature fracturing, the melting process, compared with the freezing process, is characterized by a long time, complex pore evolution and significant changes in coal physical properties. Under low-temperature conditions, the solidification points of coals with different pore sizes are different due to the influence of surface particle energy and capillary suction. This leads to the transformation of ice within the pores of different pore sizes into water in a certain order [18,19]. Under the impact of low-temperature liquid nitrogen, different sizes of coal pores will undergo different degrees of expansion and contraction, which leads to differences in pore structure and affects the melting process of coal. The degree of coal melting directly determines the permeability of the pores and affects the efficiency of CBM extraction. Based on the above reasons, the study of the water content and ice-water conversion process of low-temperature frozen coal pores during the melting process of the coal body is crucial for the development and optimization of low-temperature anhydrous permeability enhancement technology for coal seams. This is of great significance for realizing efficient CBM extraction and safe coal mining [20,21].
The basis of unfrozen water research is how to accurately measure the content of unfrozen water [22,23]. At present, there are many methods to measure the content of unfrozen water, including calorimetry, pulsed nuclear magnetic resonance [24]; differential scanning calorimetry (DSC); the frequency domain reflection method (FDR) and the time domain propagation method (TDT). Magnetic resonance (NMR) can quantitatively analyze the porosity and pore size distribution of coal and has been widely used in the field of coal and rock [13,25]. By deriving the basic mathematical structure of the theoretical and parametric models, Jin et al. [26] demonstrated that the surface effect of clay is the main cause of unfrozen water in permafrost. Li et al. [27] established a mathematical physical model for the relationship between temperature and unfrozen water content during freeze-thaw based on similar theory and obtained that each curve during freeze-thaw showed hysteresis due to the different thermodynamic potential of pore water. Weng et al. [28] used NMR techniques to show that the pore size distribution determines the rate of water-ice phase transition and the total ice volume in sandstone samples. Based on NMR theory, Chen et al. [29] proposed to quantify the content of unfrozen water in the freezing process and divide the freezing characteristics in different stages. Su et al. [30] derived the unfrozen water calculation equation by analyzing the experimental data and proposed a model for calculating the unfrozen water content. Li et al. [31] also used the NMR technique and found that the content of unfrozen water in the pores of the freezing and melting processes differed at the same temperature, with the melting process having a lower content and a “hysteresis phenomenon”.
One-dimensional NMR tests were used for the above research results, which provided limited information [32,33]. It is true that the coal body contains many different organic substances containing hydrogen, such as water, oil and natural gas. If the hydrogen in these substances comes from the same pore, it will appear repeatedly in the region of the same peak in the T2 spectrum, causing errors in the analysis and judgment of the experimental results. The two-dimensional NMR technique can reflect the transverse relaxation and longitudinal relaxation of hydrogen protons at the same time, and the two can be coupled by special processing, so that the measured hydrogen protons can be distinguished from each other, which can effectively avoid experimental errors and misjudgment of results due to overlapping signals. The author adopted two-dimensional nuclear magnetic resonance technology to study the variation characteristics of unfrozen water content in the pores of coal at different melting temperatures and tested the lignite frozen in liquid nitrogen for 150 min using a Niumai MR-60 nuclear magnetic resonance core analyzer. By analyzing the changes of T2 distribution and T1-T2 spectra, the distribution pattern of unfrozen water in coal samples was obtained, and the Clausius–Clapeyron equation and 10-4-3 potential energy model was used to analyze the reasons affecting the change of unfrozen water content in pores. This study has certain guiding significance for the study of unfrozen water content in theory and method.

2. Coal Sample and Experiment

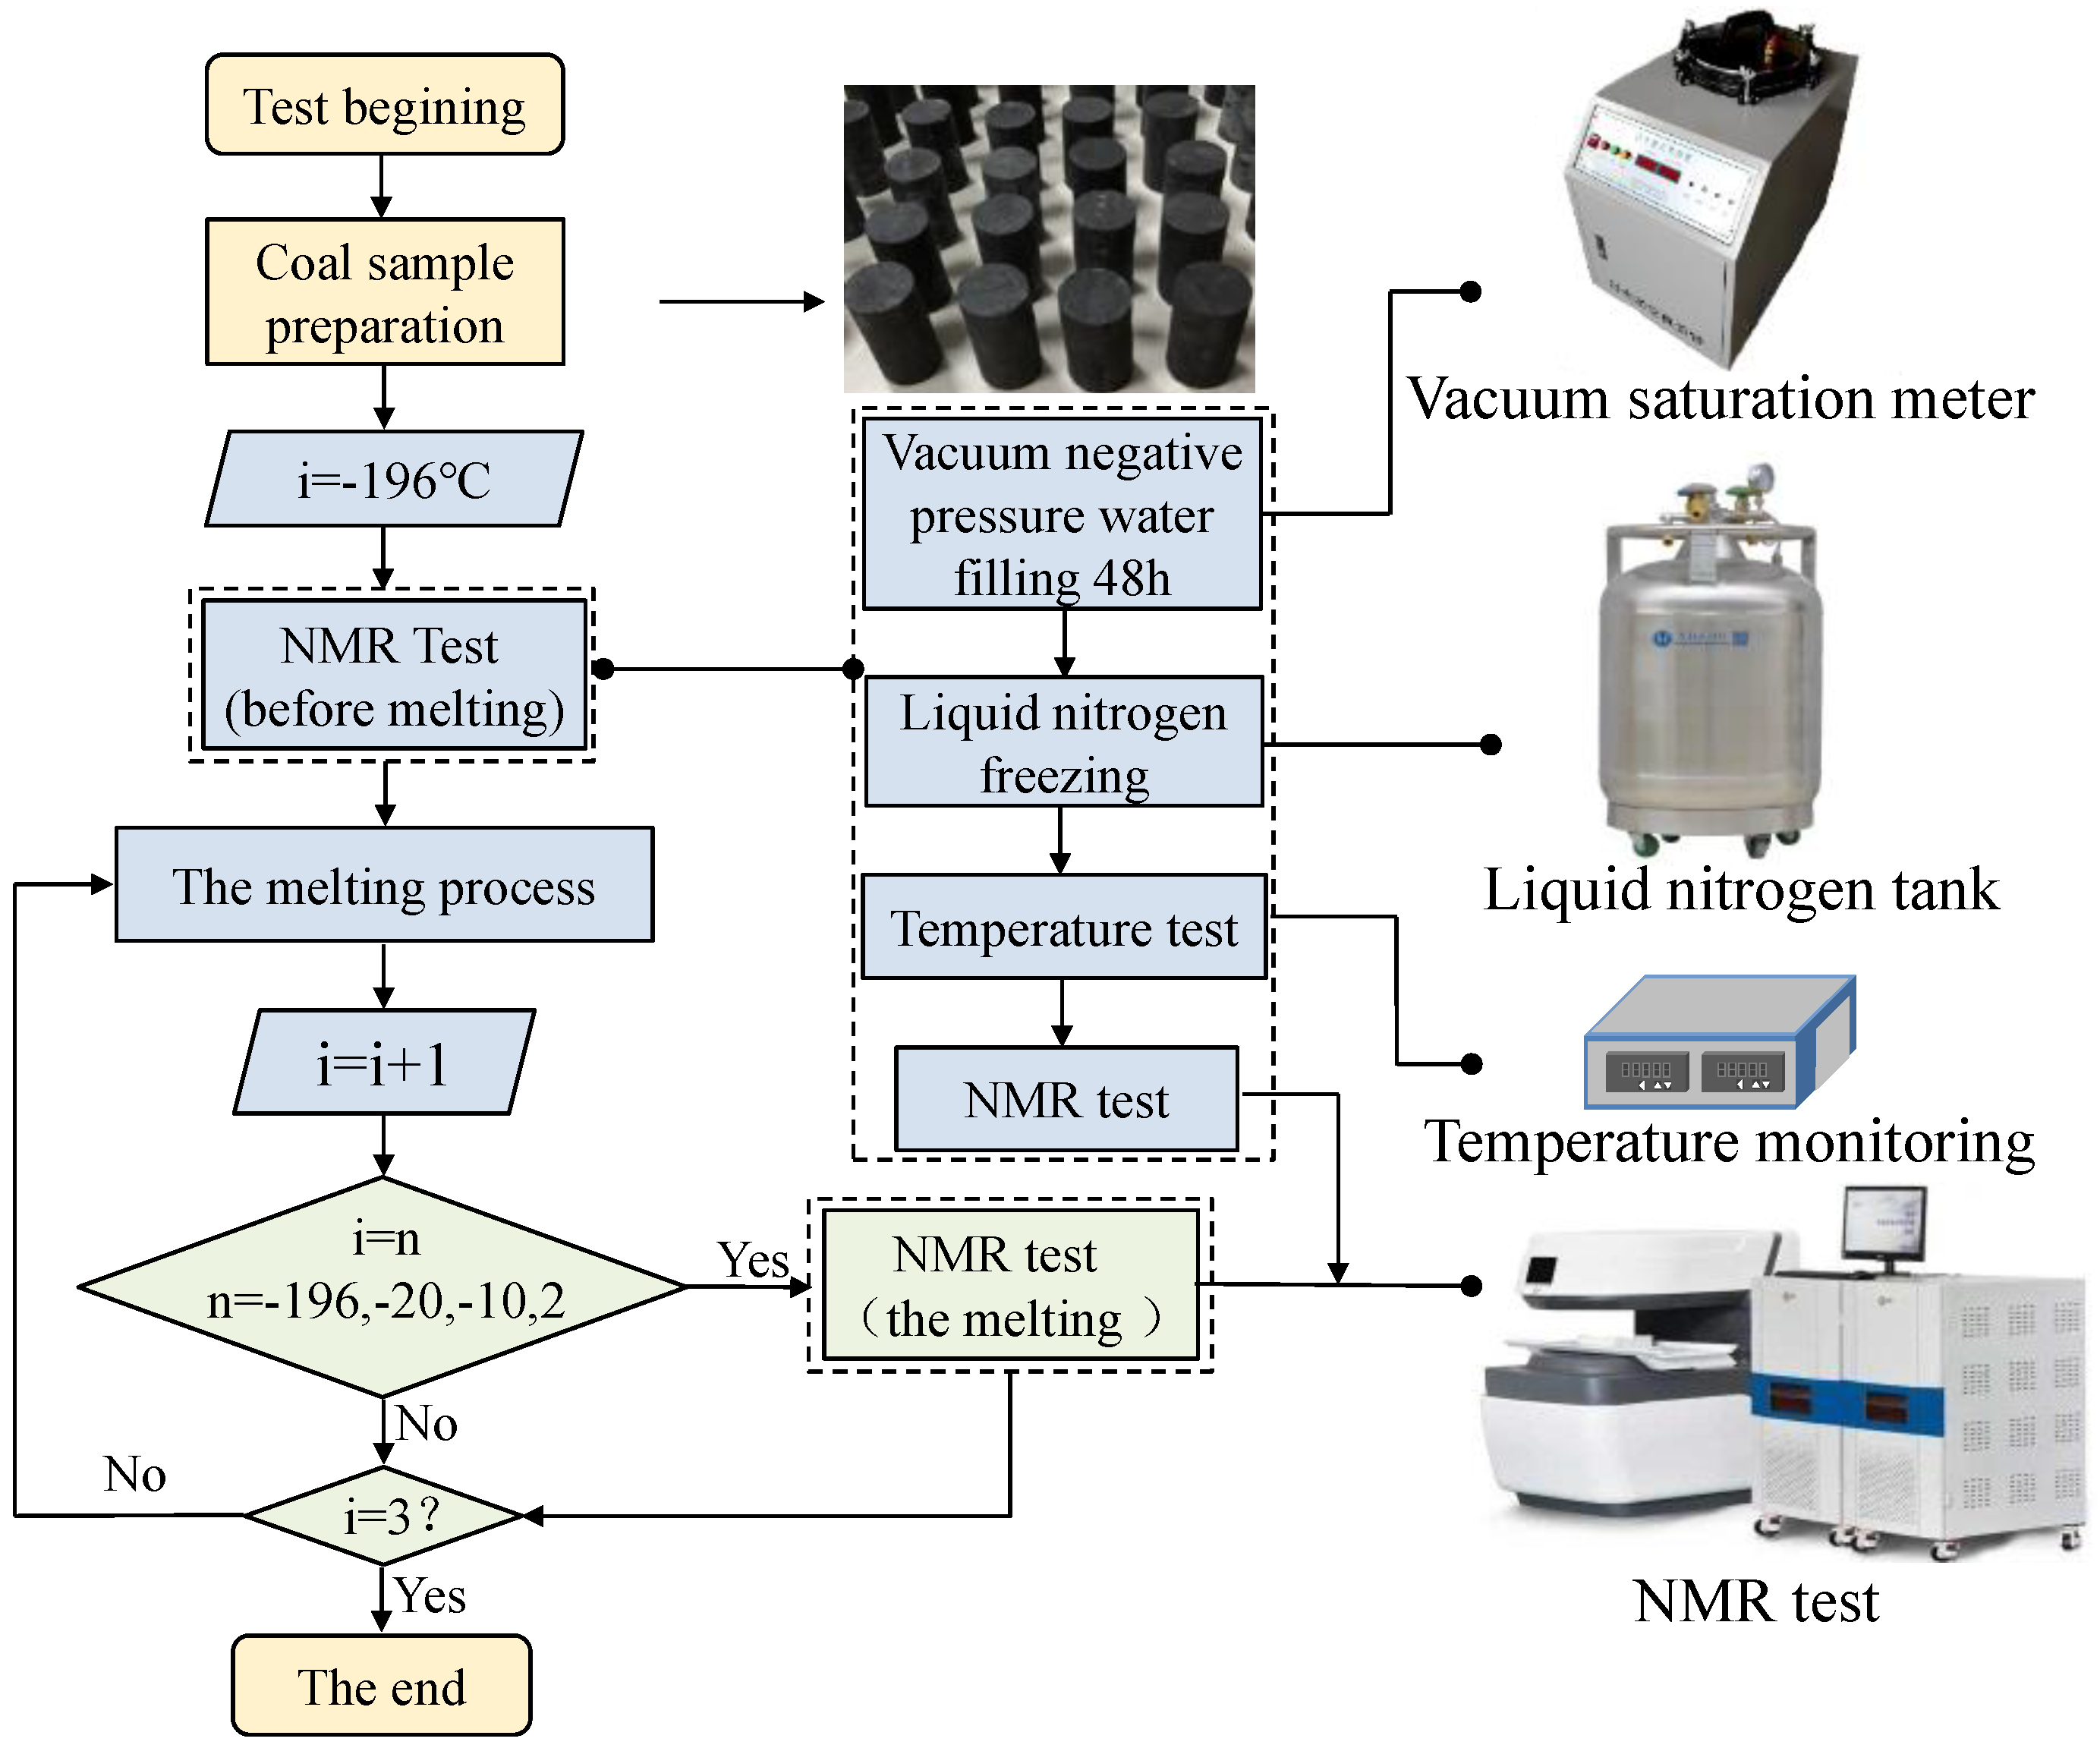
2.1. Coal Sample Preparation

The experimental coal samples were taken from lignite in Shengli Coalfield, Inner Mongolia, and all the coal samples were primary structural coal. In order to ensure the accuracy of the experiment, all the samples were taken from the same coal block, and the coal block was processed into standard cylindrical specimens φ50 mm × 100 mm. In order to avoid the large influence of the processing error of the specimen on the experimental results, the specimen without an obvious crack was selected, and the surface of the specimen was polished with fine sandpaper. During the sampling process, the drilling direction of the cores was kept consistent to ensure that the samples had similar structural characteristics. Before the experiment began, the basic parameters of coal samples were determined according to the Method of Coal Microclassification and Mineral Determination (GB/T 8899-2013) and the Method of Industrial Analysis—Instrument Method (GB/T 30732-2014), as shown in Table 1.

2.2. Experiment Method

The physical diagram of the specific equipment used in the experiment is shown in Figure 1, and the specific parameters of the instrument are as follows:
(1)
Vacuum full of water machine: BSJ intelligent vacuum full of water machine.
(2)
Nuclear magnetic resonance core analyzer: Niumag MR-60 nuclear magnetic resonance core analyzer, the number of single sampling points (TD) was 1024, the cumulative sampling times (NS) was 32 times, the echo time (TE) was 0.233 ms, and the number of echoes (NECH) was 6000, the hydrogen proton resonance frequency was 21.3 MHz and the diameter of the probe coil was 60 mm.
The experimental equipment and process are shown in Figure 1. The prepared coal sample was put into the vacuum pressurized water filling device, injected with distilled water and vacuum-pumped. The coal sample was taken out after 48 h of filling water under negative pressure so that the coal sample could reach full filling water. Then, it was placed in the liquid nitrogen tank and frozen for 150 min, and the temperature sensor was inserted immediately after the end to measure the surface temperature of the coal sample. Finally, nuclear magnetic resonance instrument was used to test the frozen coal sample and obtain the nuclear magnetic resonance data of the coal sample at −196 °C. The real-time melting temperature of the coal sample under natural ventilation was continually observed, and the nuclear magnetic resonance detection was carried out at −20 °C, −2 °C and 10 °C, respectively, to obtain the nuclear magnetic resonance data of the four temperature gradients of the liquid nitrogen freezing and melting process of the water-saturated coal sample. During the experiment, the thermal insulation material was used to wrap the nuclear magnetic measuring vehicle to control the single test time and reduce the heat exchange between the coal sample inside the vehicle and the external environment.

3. Experimental Results and Analysis

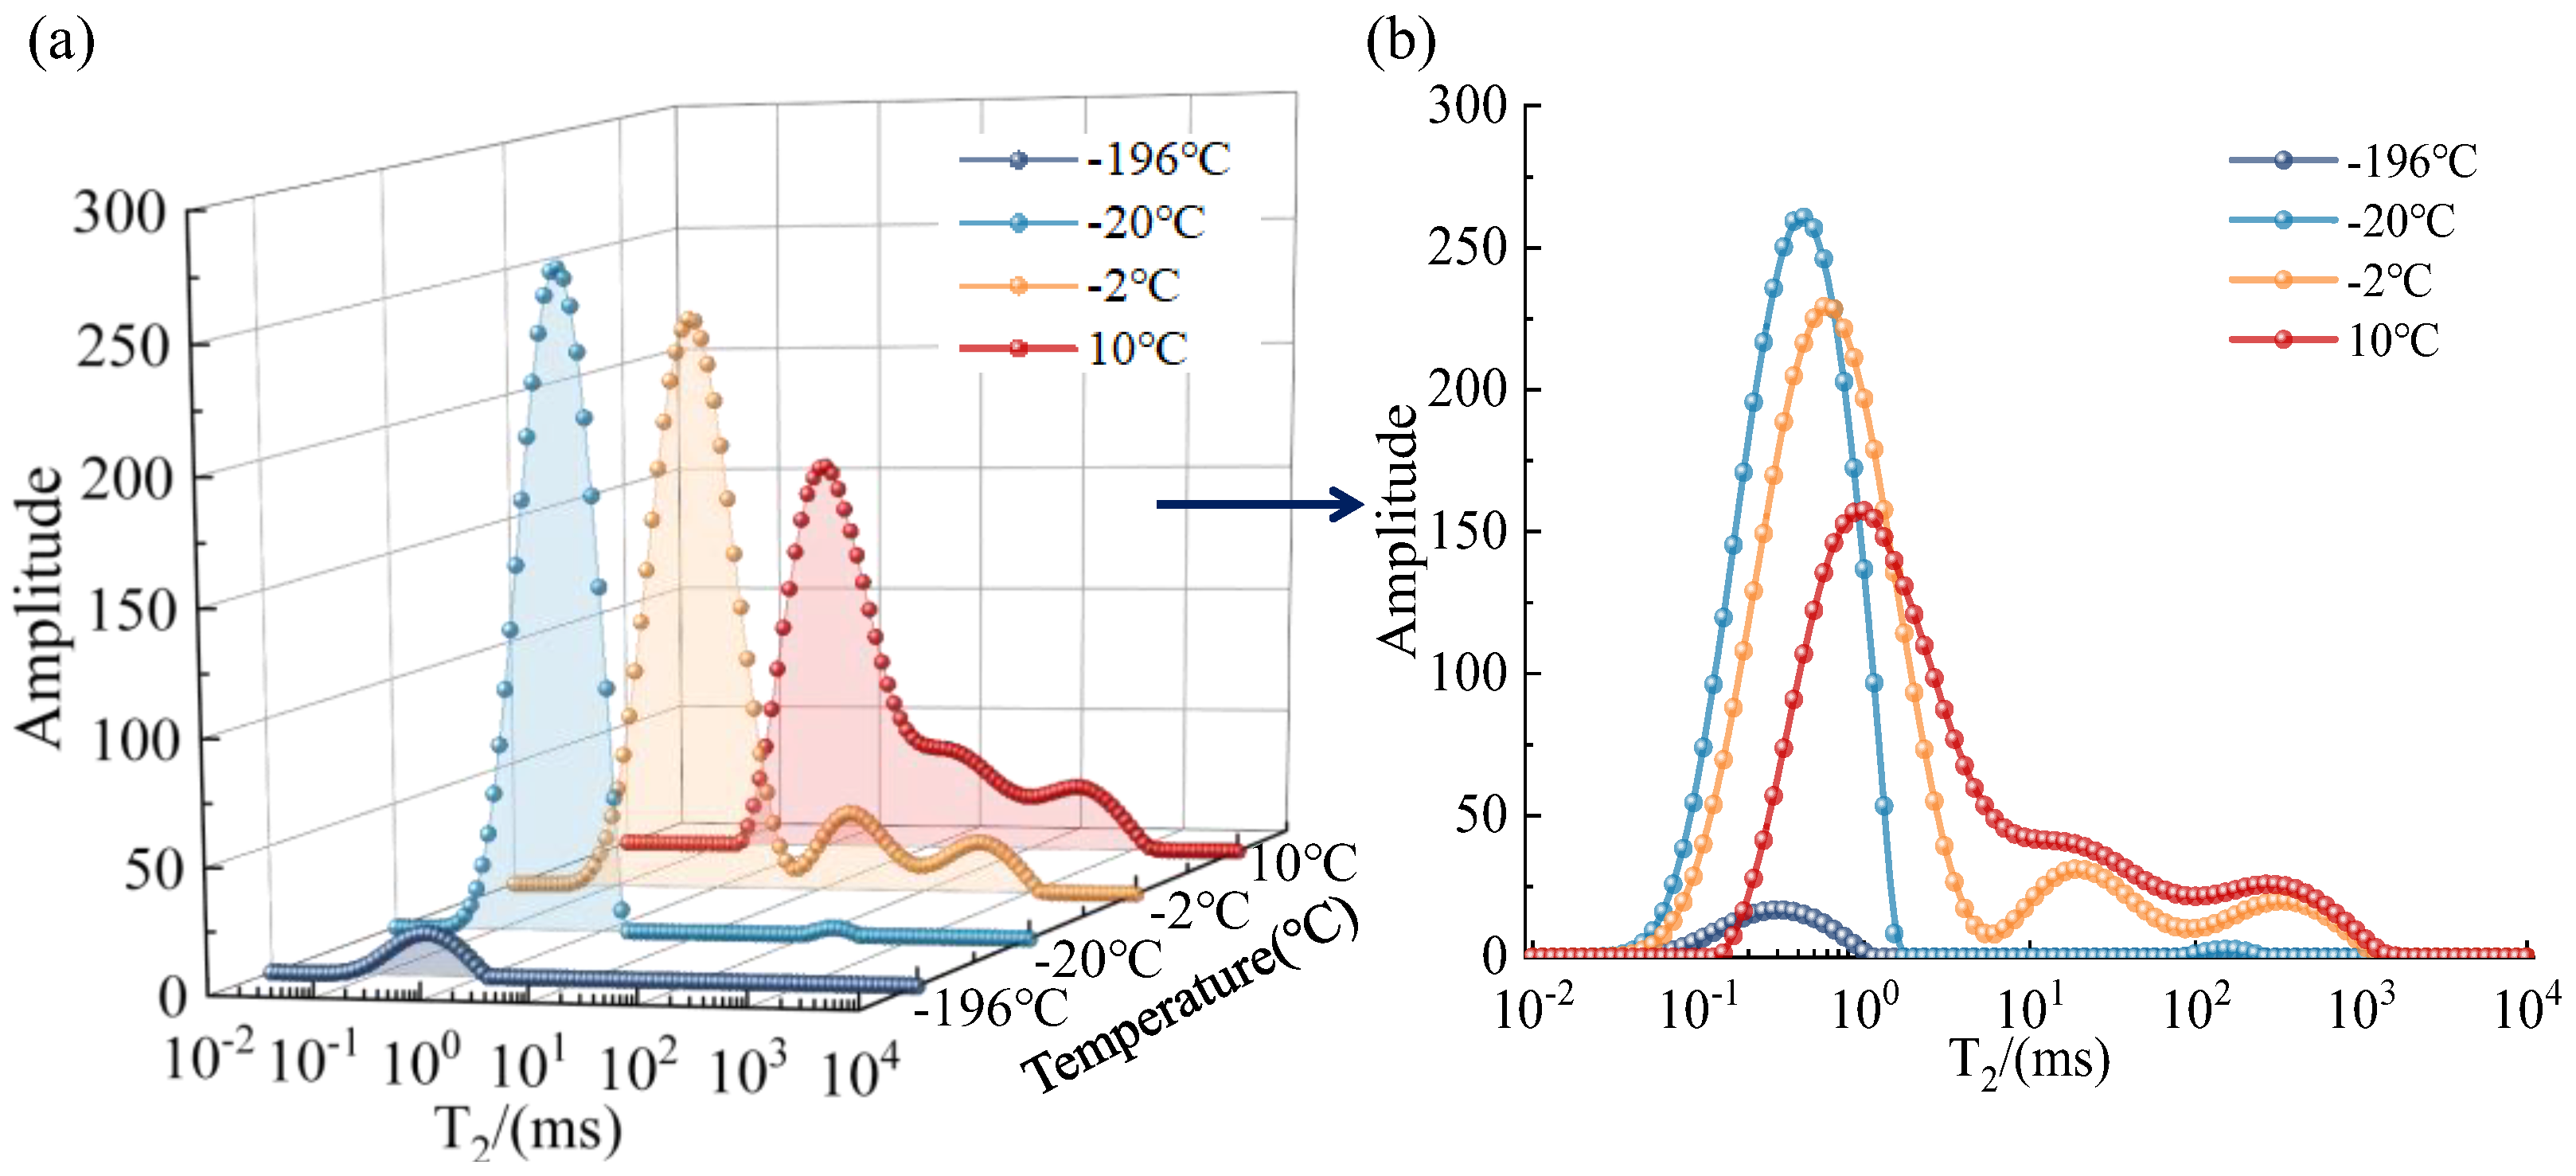
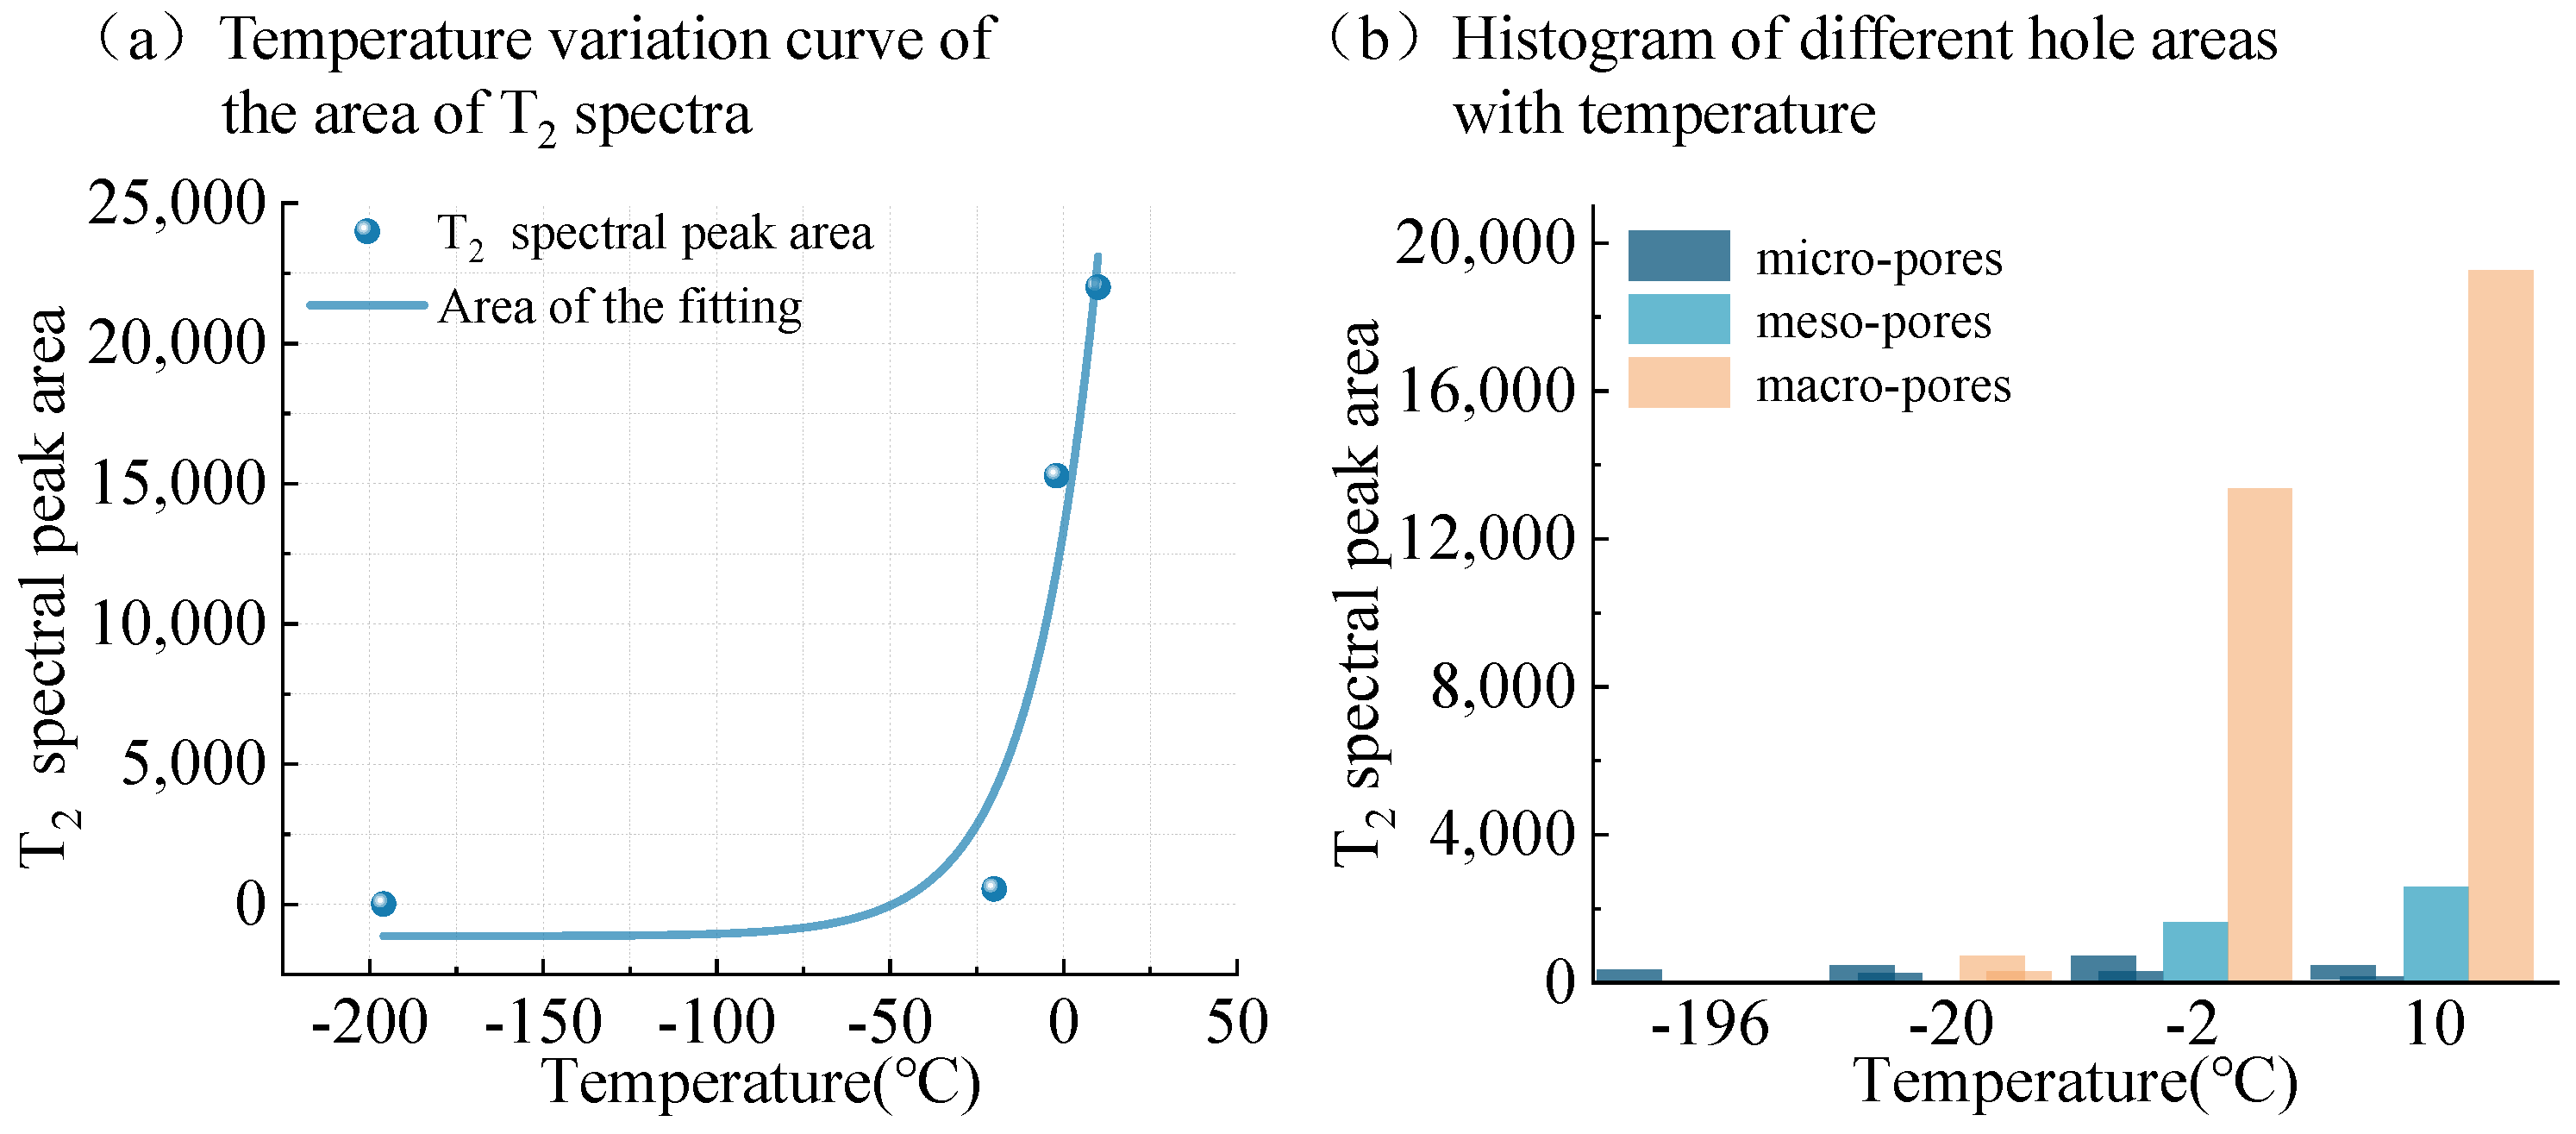
3.1. T2 Spectrum Test Results

The T2 spectrum is the time constant describing the recovery process of the transverse component of the nuclear magnetization intensity and is therefore called the transverse relaxation time. The transverse relaxation process is caused by the exchange of energy within the nuclear spin system, so it is also called the spin-spin relaxation time. The NMR T2 spectrum can approximate the content of hydrogen-containing material within the pores of the coal sample and its approximate distribution. Due to the complexity of the rock pore structure and the diversity of pore fluids and their fugitive states, the relaxation process is the result of multiple component contributions with different relaxation times. It can be expressed as a multi-exponential function: when the formation is saturated with water and the echo interval is relatively small, the T2 spectrum corresponds well to the distribution of the rock pore size. Figure 2 shows the T2 distribution curves of coal samples during melting at different temperatures. Usually, the T2 distribution curve will show from one to three different peaks, which represent the relaxation times of hydrogen-containing substances in coal samples in different states. According to the special equation between the NMR transverse relaxation time and the sample pore size, it is calculated that the first peak represents the content of hydrogen-containing substances in micro small pores, while the second and third peaks correspond to the content of hydrogen-containing substances in medium and large pores. According to the existing research, the three peaks are classified. The characteristic values of the types are 2.5 ms, 100 ms, 10,000 ms and also can be the cut-off values.
As shown in Figure 2a, when the temperature ranged from −196 °C to −20 °C, the area of the first peak increased, while the area of the second and third peaks did not change significantly. The main reason for this section was the continuous melting of ice in the tiny pores of coal samples. When the temperature ranged from −2 °C to 10 °C, the area of the second and third peaks increased significantly, and the ice in the large pores of this section began to melt continuously. In summary, during the melting process, the ice in the small pores melted first, and the temperature rose to a certain extent before the ice in the large pore melted. In addition, the unfrozen water in the pore space was mainly distributed in the pore space with a radius of 10 nm or smaller.
As shown in Figure 2b, the first peak “rightwing shift” occurred in the T2 spectrum of coal samples during the melting process. This is because during the freezing process, the water phase inside the mesopore and macropore becomes ice, and the ice compressions the remaining unfrozen water and fills the pores, which changes the size of the original pores and gradually forms ice pores. Therefore, in the negative temperature zone, the first peak not only represents the small pores in the coal sample but also includes the small ice pores in the large pores. With the increase of temperature, the ice in the large pore began to melt, the ice pore gradually disappeared and the area of the first peak gradually decreased and shifted to the right.
The T2 curve under four temperatures during the melting process of coal sample was integrated to obtain the curve of the change of peak area with temperature, based on which the change of unfrozen water content with temperature of coal sample was analyzed. As shown in Figure 3, the area enclosed by the T2 curve and the horizontal axis represents the amount of pore water (unfrozen water). When the temperature of the frozen coal sample was between −196 °C and −20 °C, there was little change in the amount of unfrozen water. Even if the temperature was below zero at this stage, there was still a small part of liquid water with low freezing point, and this part of the water maintained a dynamic balance with the ice, which is called film water. Due to the presence of thin film water, the unfrozen water content will not be reduced to zero during the test. From −2 °C to 10 °C, unfrozen water storage increased sharply, most of the ice melted and the content of unfrozen water increased substantially.

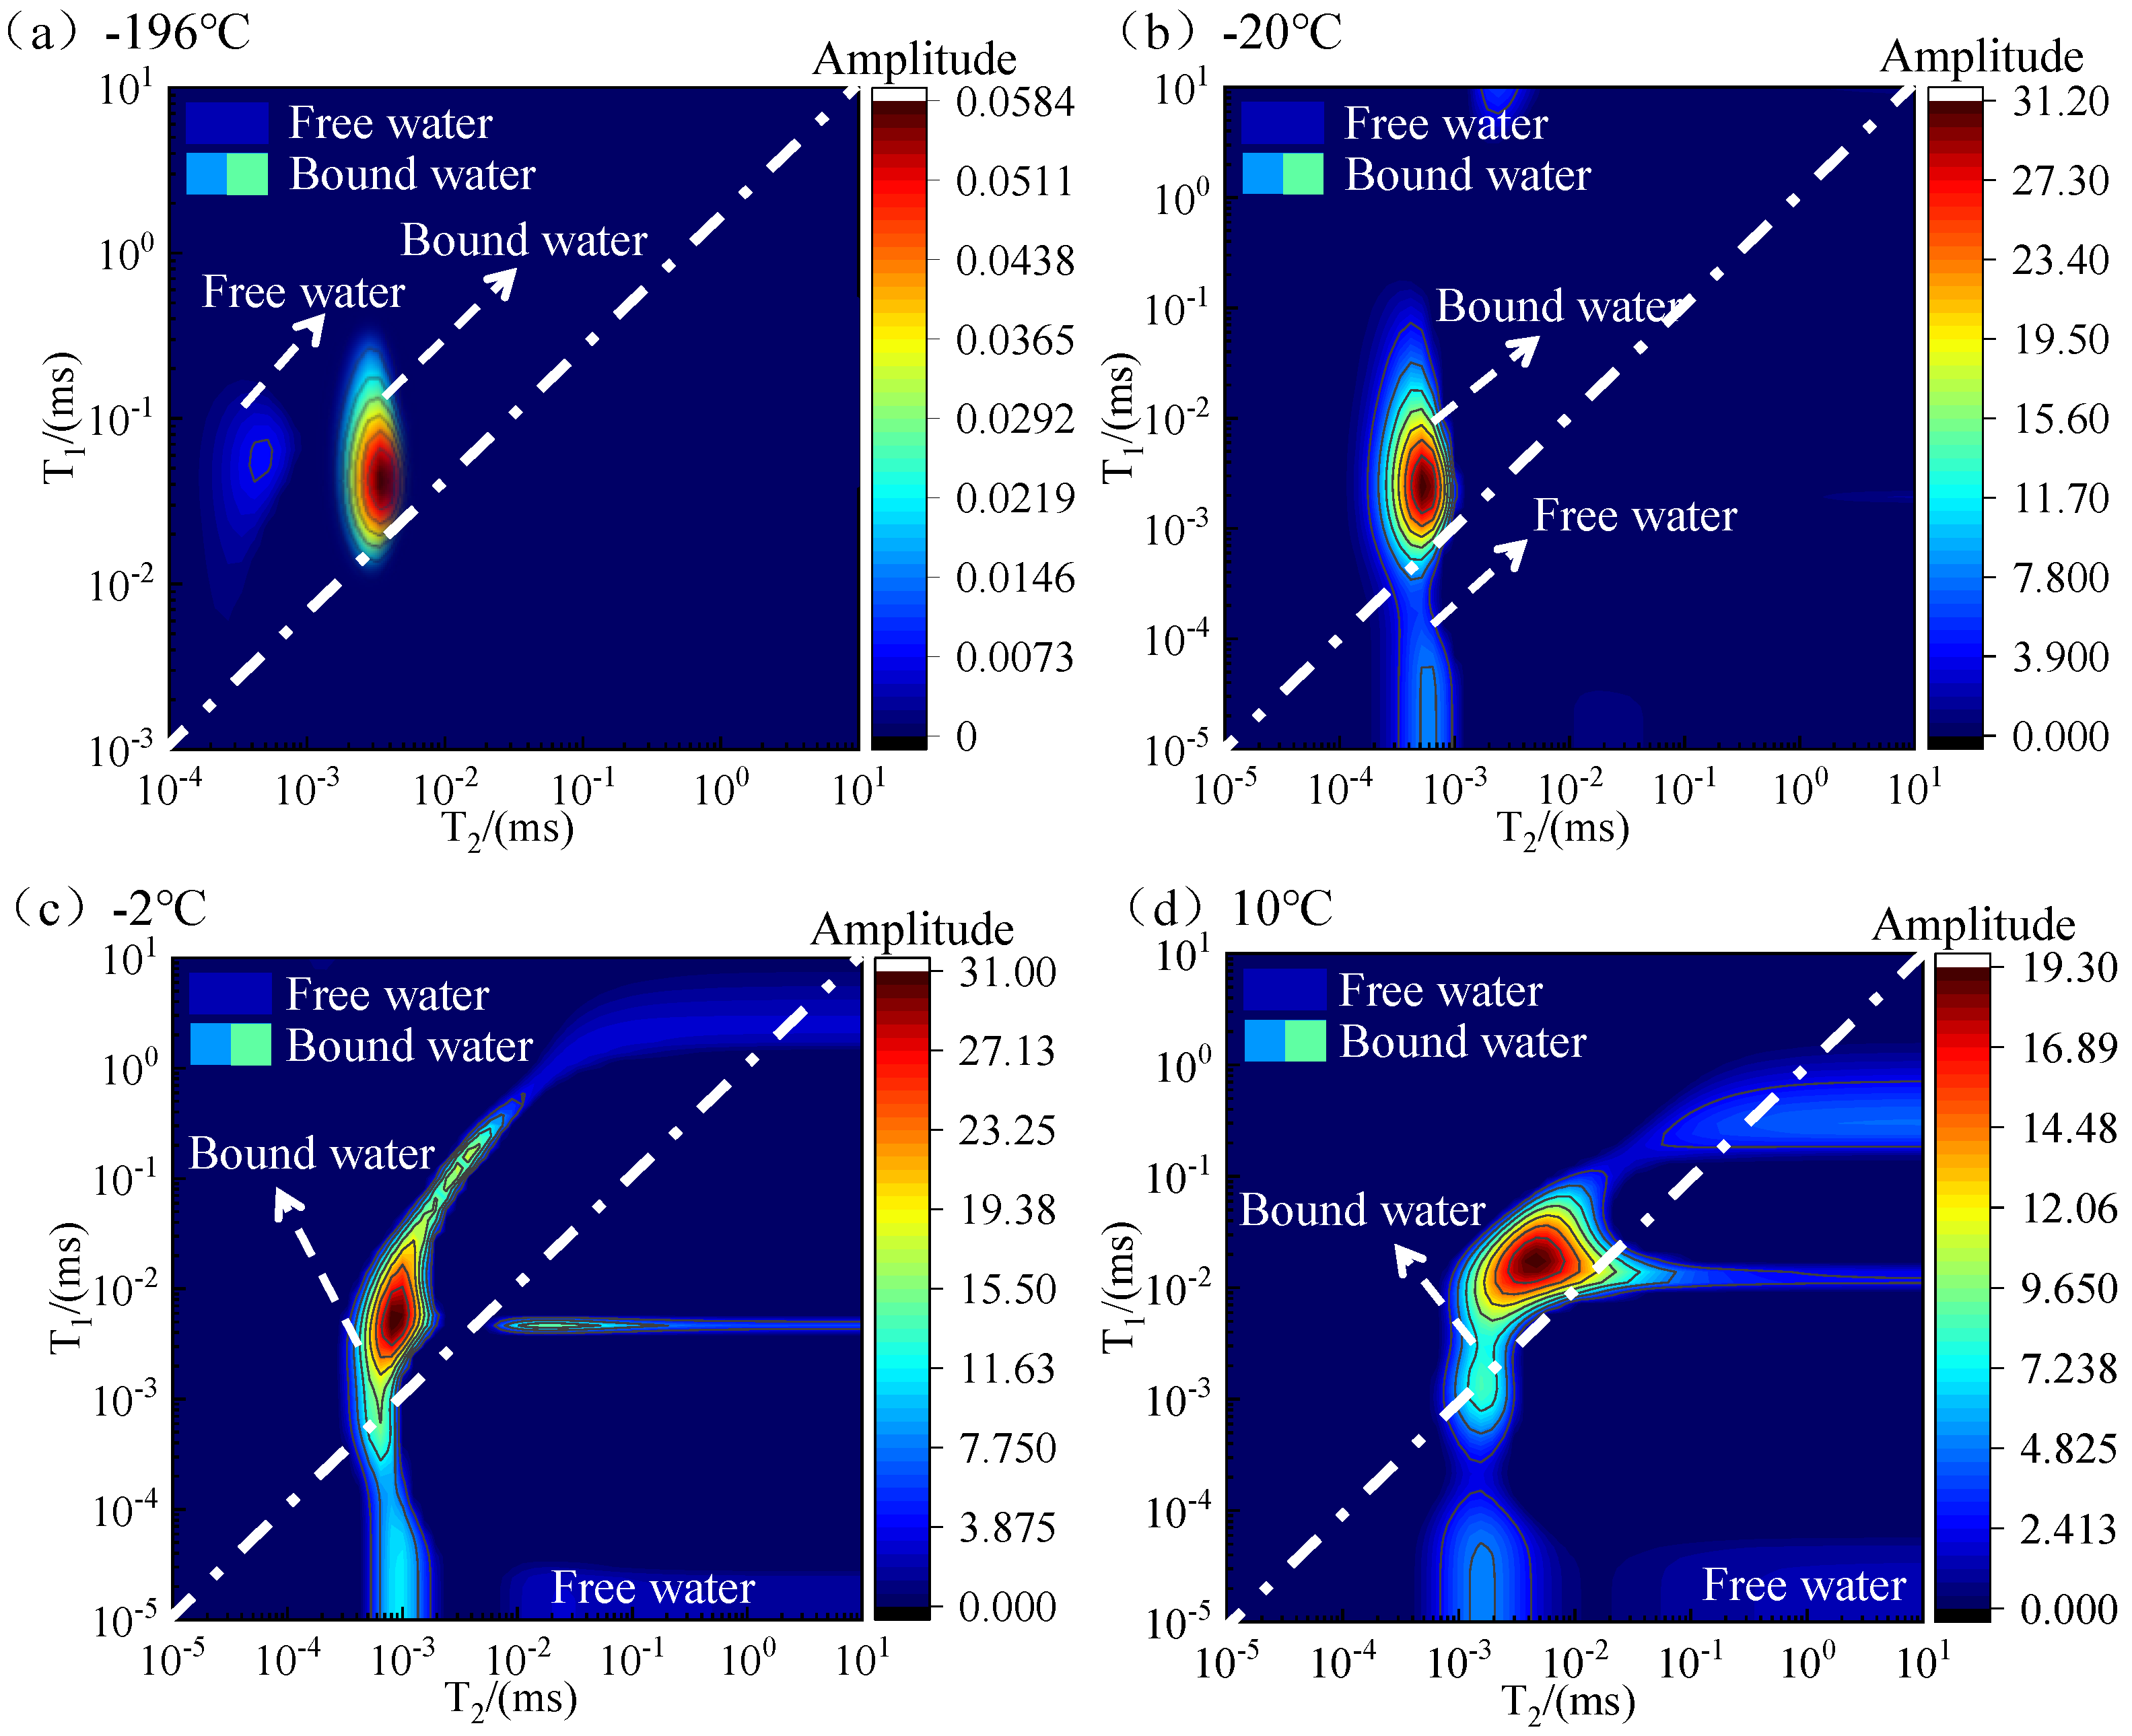
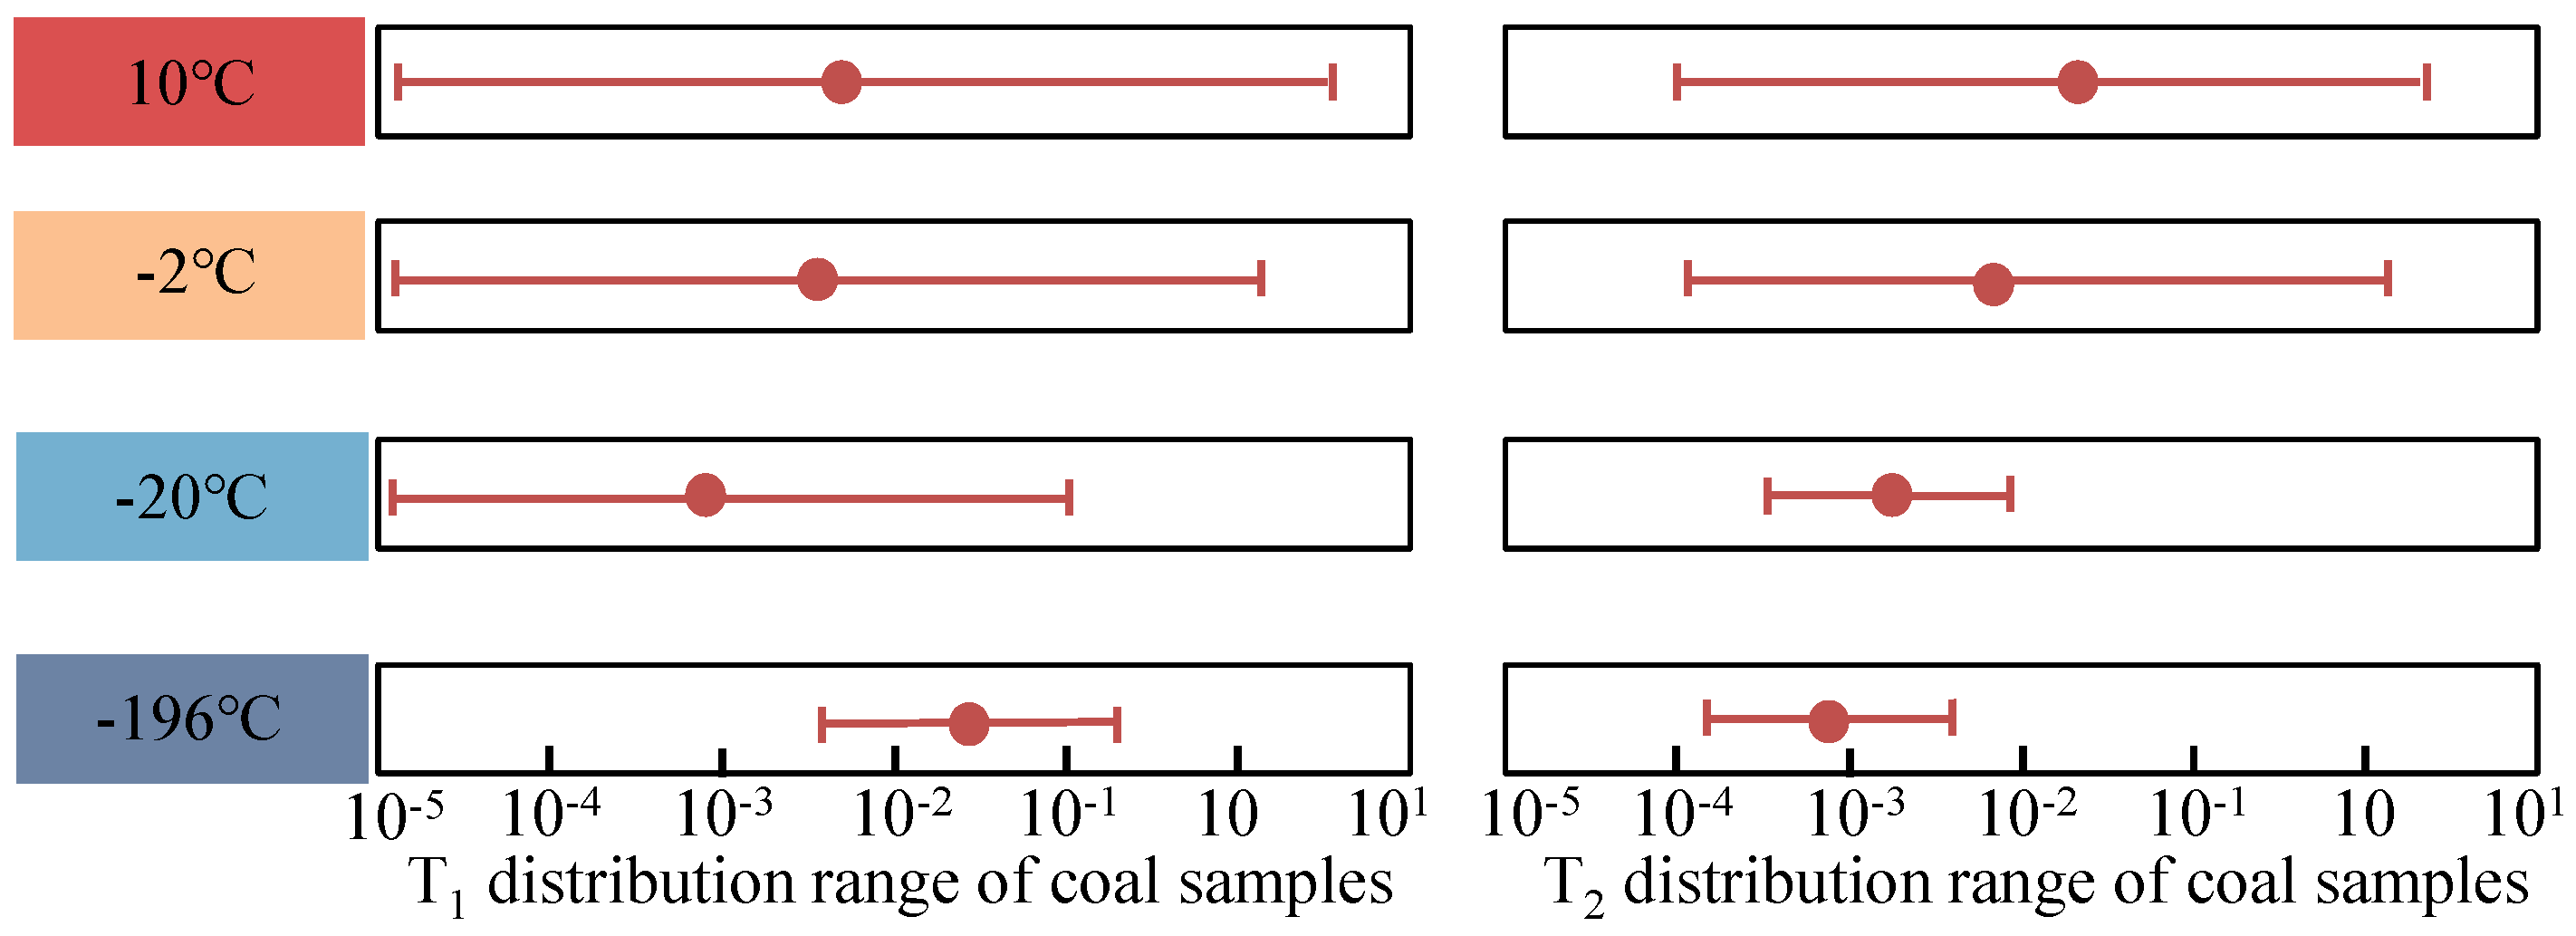
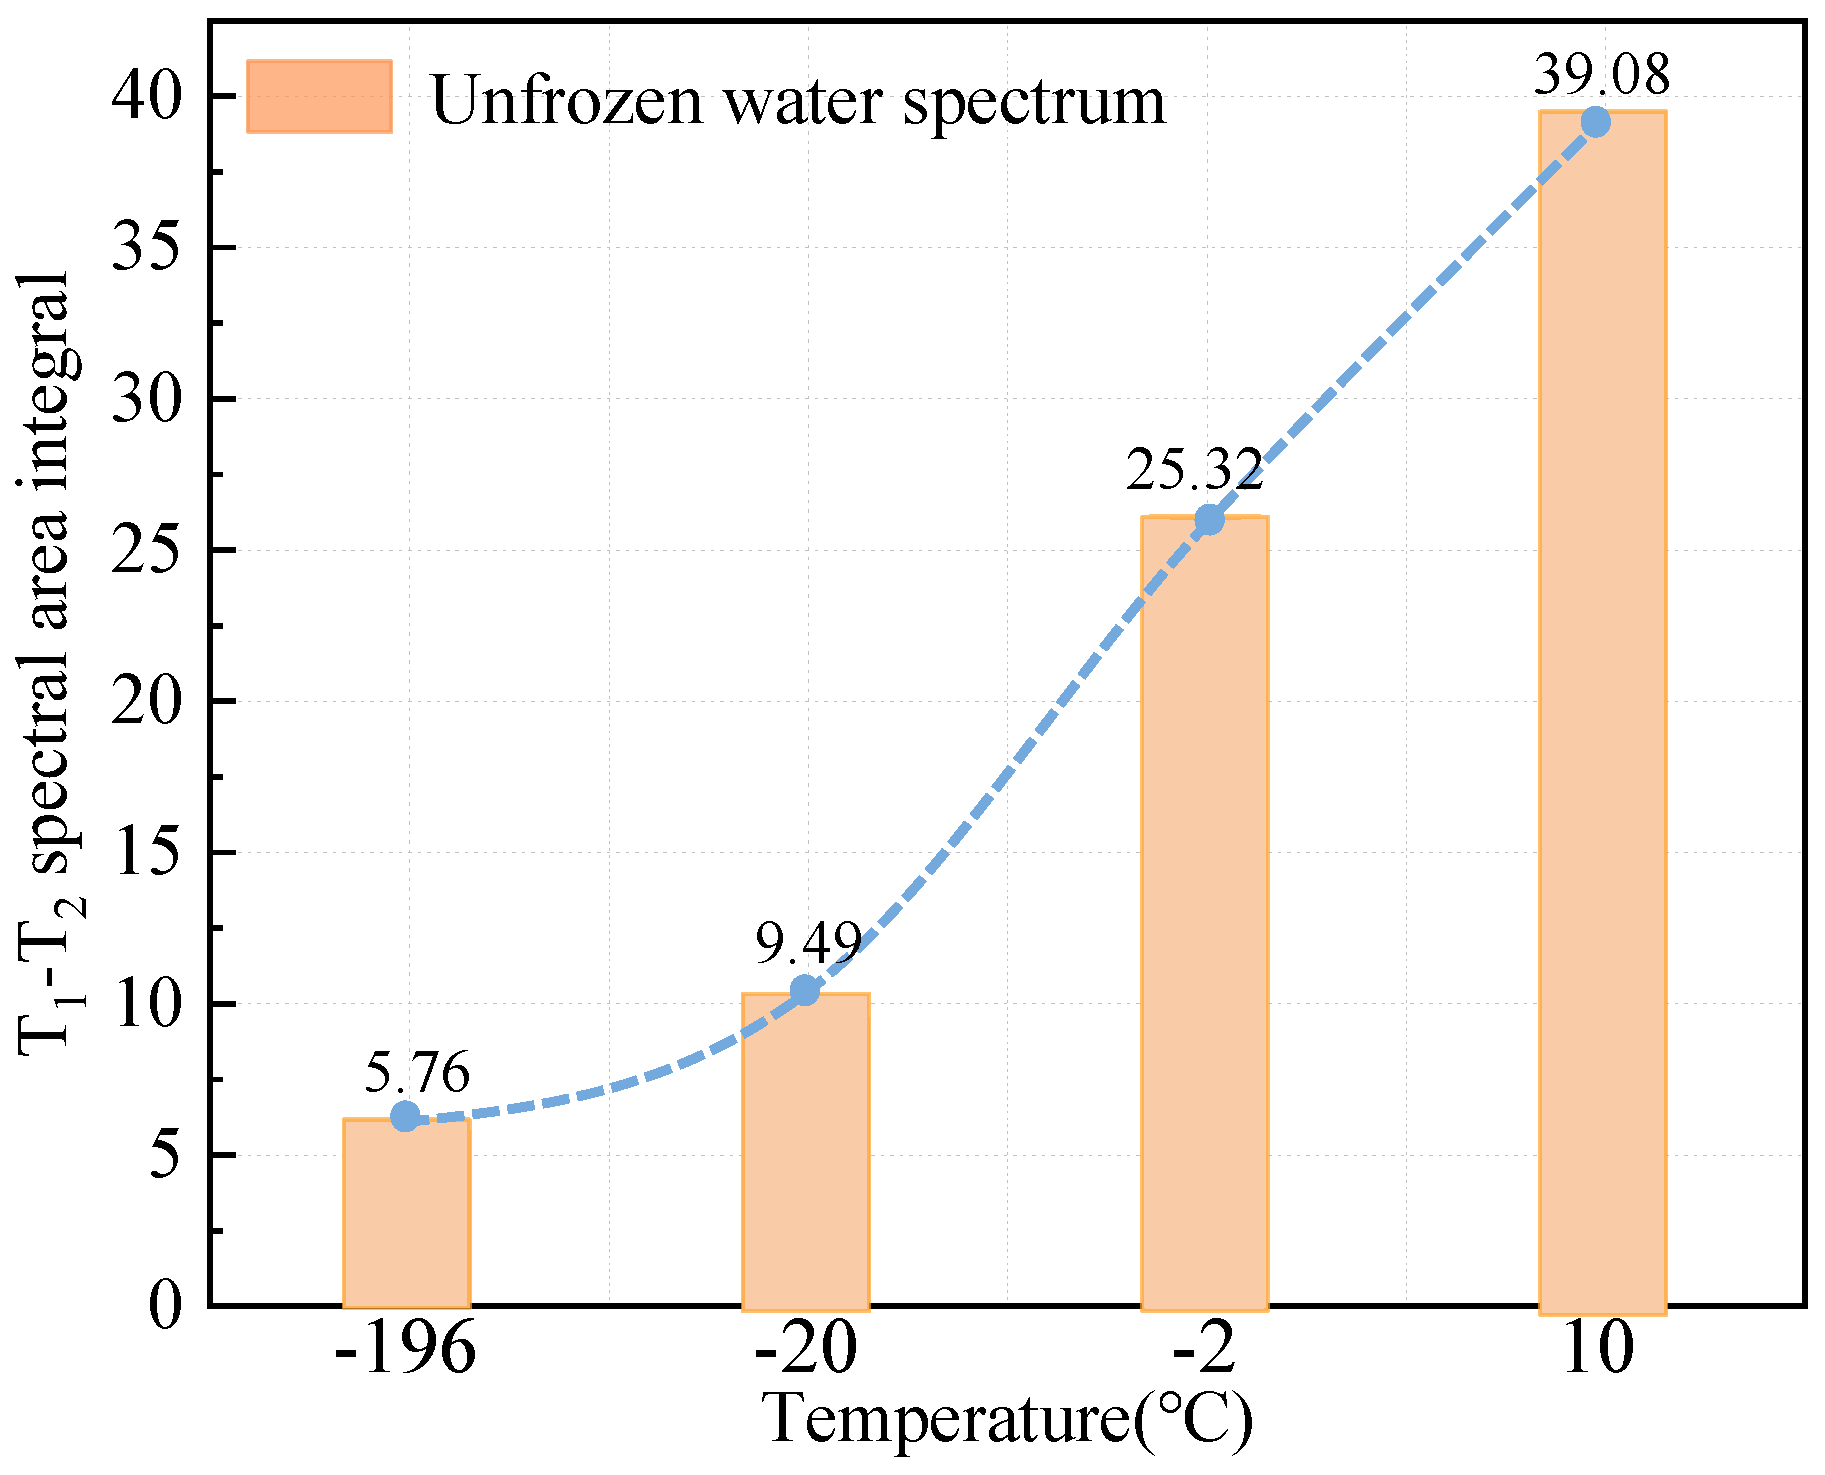
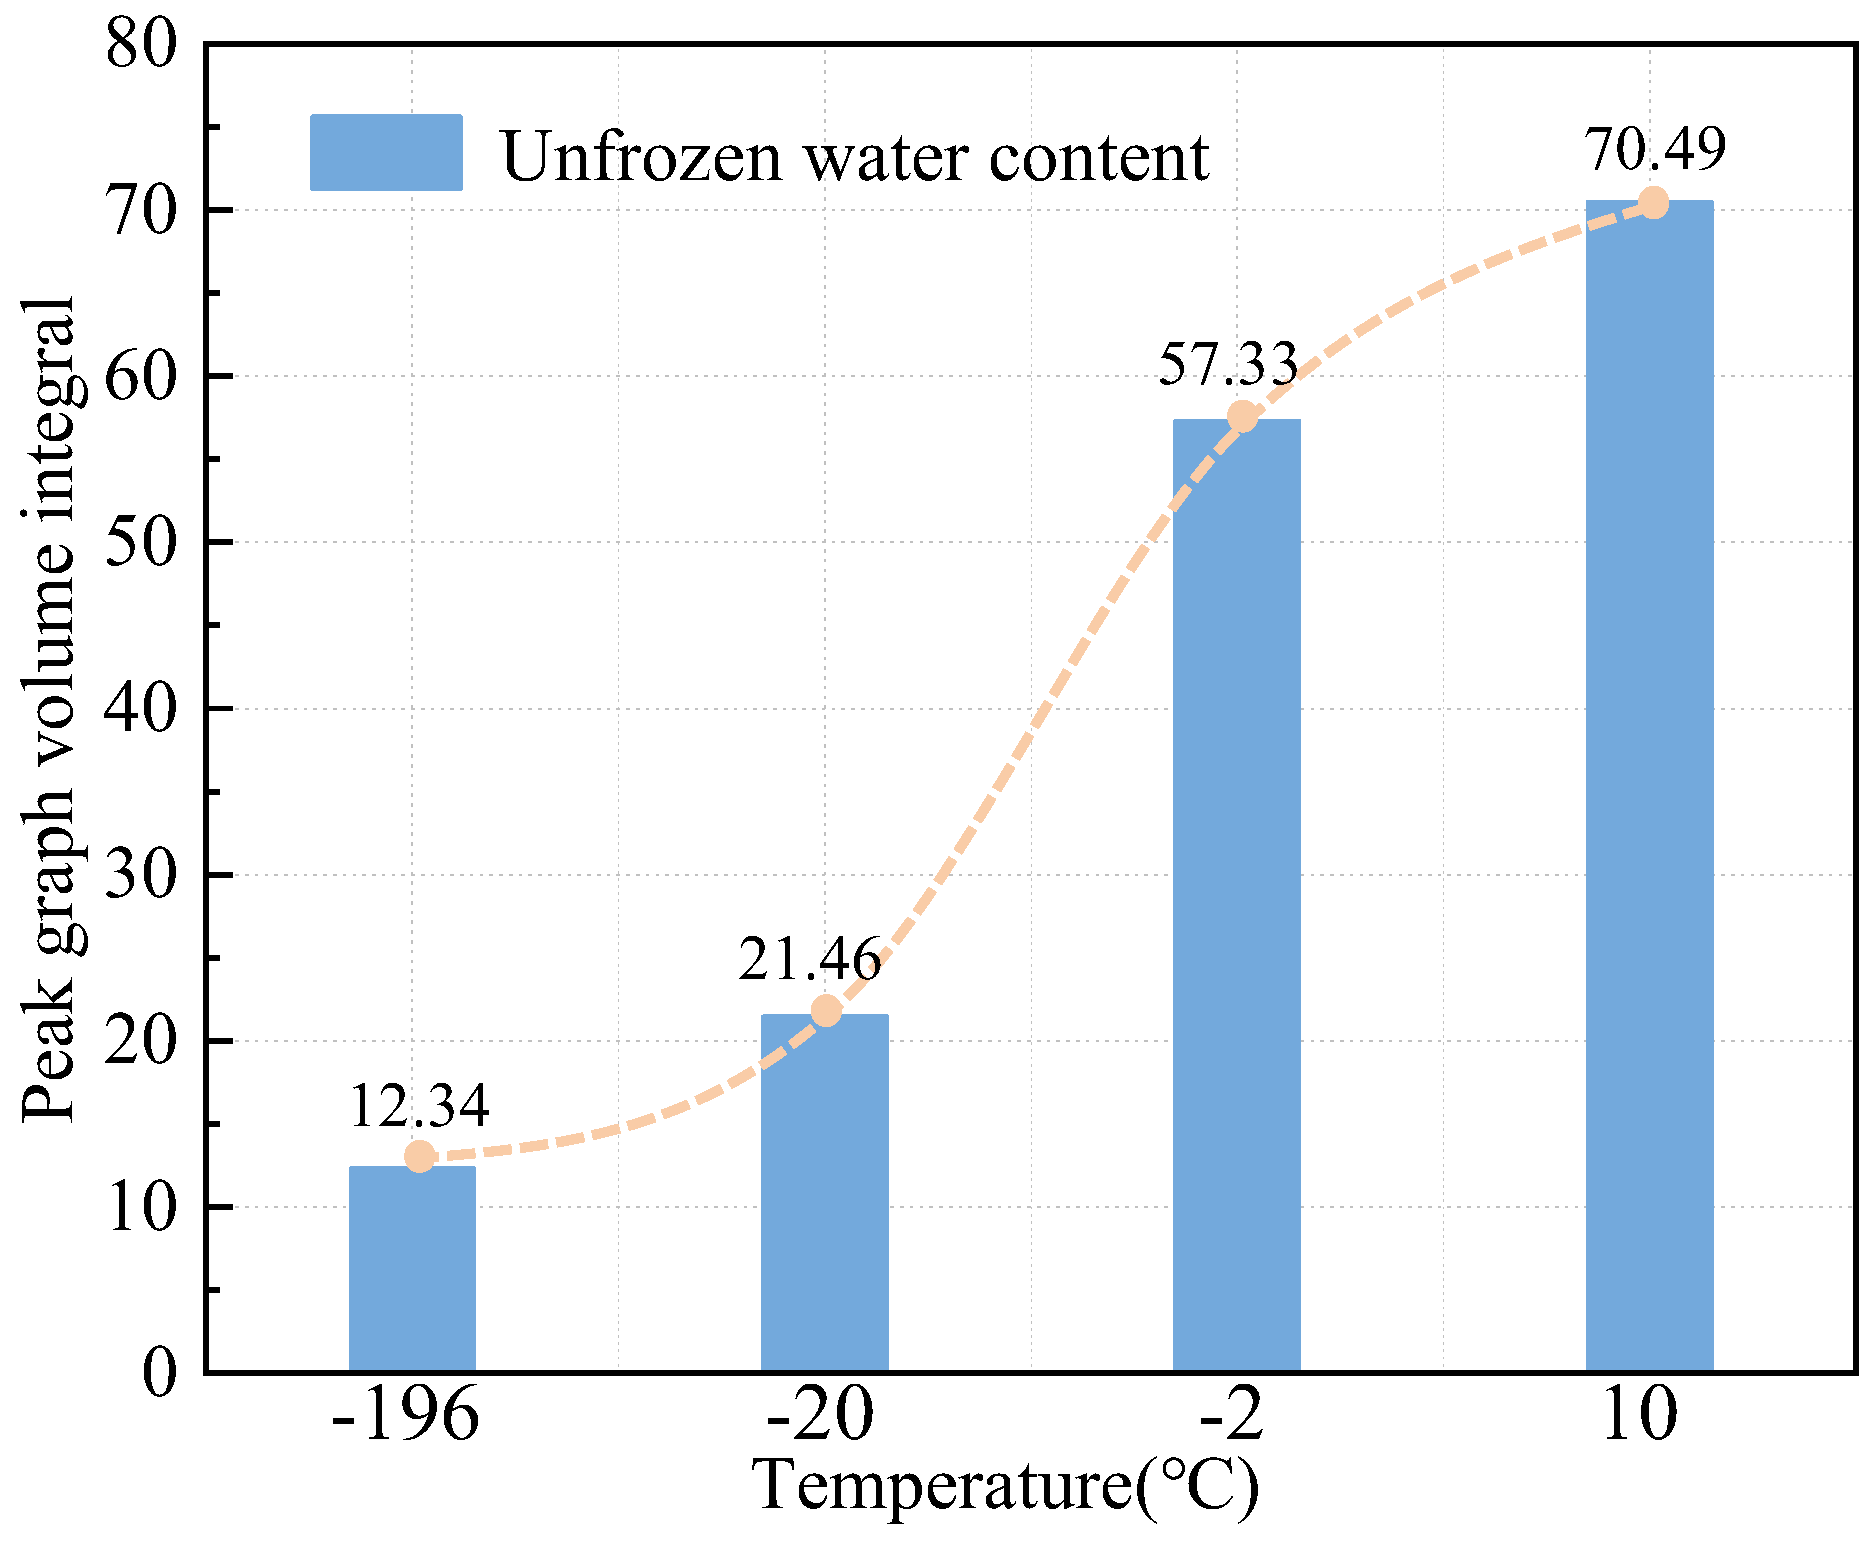
3.2. T1-T2 Spectrum Test Results

Longitudinal relaxation T1 can reduce the total energy of the magnetic nucleus, and transverse relaxation T2 does not decrease the total energy of magnetic nucleus. There was a linear relationship between the pore size characterization and the two relaxation times. The two relaxation times jointly represent the size of the internal pore diameter of the coal sample. The longer the two relaxation times are, the larger the pore diameter is, and the smaller the pore diameter is. Similarly, the distribution range of the two relaxation times represents the size of the aperture, and the larger the distribution range is, the larger the aperture is. The distribution region of pore size of coal sample can be obtained by combining the distribution of two kinds of relaxation time. When the two relaxation times are within the range of [0.01, 1] at the same time, it represents the distribution of small-size pores. When the two relaxation times are in the range of [1, 100] and [100, 10,000] at the same time, they represent the distribution of medium pores and large pores, respectively.
Figure 4 shows the T1–T2 spectra of coal samples at different melting temperatures. When the temperature was −196 °C, the longitudinal and transverse relaxation times of coal samples were within the range [0.001, 1], and the pores were mainly dominated by bound water. When the melting temperature reached −20 °C, part of the frozen water began to melt, starting from the small pore. When coal samples melted from −2 °C to 10 °C, both longitudinal and transverse relaxation time was in the [0.1, 100] range, large pores in the ice began to melt and not frozen water content increased gradually. However, the bound water distribution was significantly reduced; this is the reason why there ice pores at lower temperatures, not frozen in ice pore water, were detected as bound water. This is consistent with the phenomenon of the first peak “rightward shift” in the T2 spectrum above.
Figure 5 shows the distribution range of relaxation time of coal samples at non-melting temperature. At −196 °C and −20 °C, the transverse relaxation of coal samples had a similar interval width, but the transverse relaxation from −196 °C was mainly distributed in a short time, and the transverse relaxation from −20 °C was concentrated in a relatively long time interval. In addition, in the melting process from −2 °C to 10 °C, the two relaxation signals of coal samples were mainly concentrated in the medium and long time interval. For the longitudinal relaxation distribution of coal samples at non-melting temperature, at −196 °C, the longitudinal relaxation signal of coal samples was mainly distributed in a short interval, while the coal samples from −20 °C to 10 °C showed a similar interval distribution, mainly distributed in a short and medium interval. However, the distribution range of coal samples in the direction of longitudinal relaxation signal at the four temperatures was very different, and the coal samples from −20 °C to 10 °C always had the largest interval range.
In two-dimensional T1-T2 spectra, the integral areas of different regions represent the specific generational values of different fluid storage spaces. Figure 6 shows the distribution space of unfrozen water in coal samples at different melting temperatures. As can be seen from Figure 6, when the temperature ranged from −196 °C to −20 °C, the spatial growth slope of unfrozen water distribution was small, and unfrozen water concentrated in a small range. When the temperature ranged from −2 °C to 10 °C, the growth slope changed abruptly, the ice in different pores of the coal sample began to melt, the unfrozen water was distributed in different areas of the coal sample and the distribution range was wide.
Similar to the characteristic distribution pattern of the characteristic peaks presented by the 1D NMR T2 curve, as shown in Figure 7, each different peak in the 3D peak diagram represents hydrogen-containing substances with the same relaxation characteristics, and different colors are used to distinguish different hydrogen-containing substances due to different amplitudes. Since this paper mainly studies the content of unfrozen water in pores, bound water and free water are highlighted here. When the pores of the coal body were evenly distributed, the pore size or characteristics had large differences and the inter-pore connectivity was poor, the fluid relaxation signals in the pores showed large differences, which made the pores have strong sorting properties.
Even if the same coal sample is used in the test, coal at different melting temperatures will show different peak shapes. As shown in Figure 7, at −196 °C, the coal sample only had a single-peak state, and the peak value of the highest peak was very low and the pore structure was relatively simple, mainly consisting of coal and ice pores. At −20 °C, the coal sample presented a bimodal state, and the difference between the two peaks was larger, indicating that the pore results at this time were more complex than those at −196 °C. However, mainly small pores were observed, and only a small number of medium pores could be measured. When the coal sample ranged from −2 °C to 10 °C, the pore structure was more complex, and the peak value of the highest peak gradually decrease, while the peak value of other peaks gradually increased and the unfrozen water in the middle and large pores gradually melted; the pore types that could be detected gradually increased. At extremely low temperatures, free water was frozen, and the signal at this time represented the distribution state of unfrozen water in the pore.
Figure 8 shows the peak centroid positions of coal samples at different melting temperatures. When the coal samples gradually melted with room temperature, the peak centroid of coal samples at different melting temperatures changed: the centroid of coal samples at −196 °C and −20 °C moved in the direction of increasing T2. In addition, from −20 °C to 10 °C, the position of coal sample centroid moved along the increasing direction of T1-T2. The trend difference between coal samples at different temperatures is caused by the different development of unfrozen water content in the pores, which results in different lateral relaxation (spin-spin relaxation) and longitudinal relaxation (spin-lattice relaxation) of the fluid in different pores under the influence of magnetic field. By combining the two dimensions, T1-T2 methods can more accurately identify changes in fluid relaxation characteristics in pores than simple T1 or T2 methods.
The two-dimensional NMR method can identify the space of different fluid parts in different rock masses and reflect the specific fluid content in different pores. In the 3D peak diagram, the peak volume can directly represent the different fluid content in the coal. Figure 9 shows the unfrozen water content in coal samples at different melting temperatures. When the temperature ranged from −196 °C to −20 °C, the growth slope of unfrozen water content was small, and the content of unfrozen water in coal samples was small. When the temperature ranged from −2 °C to 10 °C, the slope increased obviously, but it was different from the rapid increase in Figure 6 because the distribution space of unfrozen water depends on the complexity of the pores in the coal. The unfrozen water content depends on the pore volume inside the coal, which is complex but small.
In the laboratory stage, after the coal sample, through dry processing, can evaporate the vast majority of free water, bound water in the small pores is still not completely evaporated. Water and gas in the coal reservoir compete in the same space. The relationship between the properties of the coal reservoir deeply affects the hydrocarbon content of the coal reservoir, determining the choice of coal reservoir reforming measures and the theory of the output of coalbed methane. Therefore, the water content of coal reservoirs and the factors affecting the water content in the pores of coal reservoirs have become the key issues in the current CBM exploration and development.

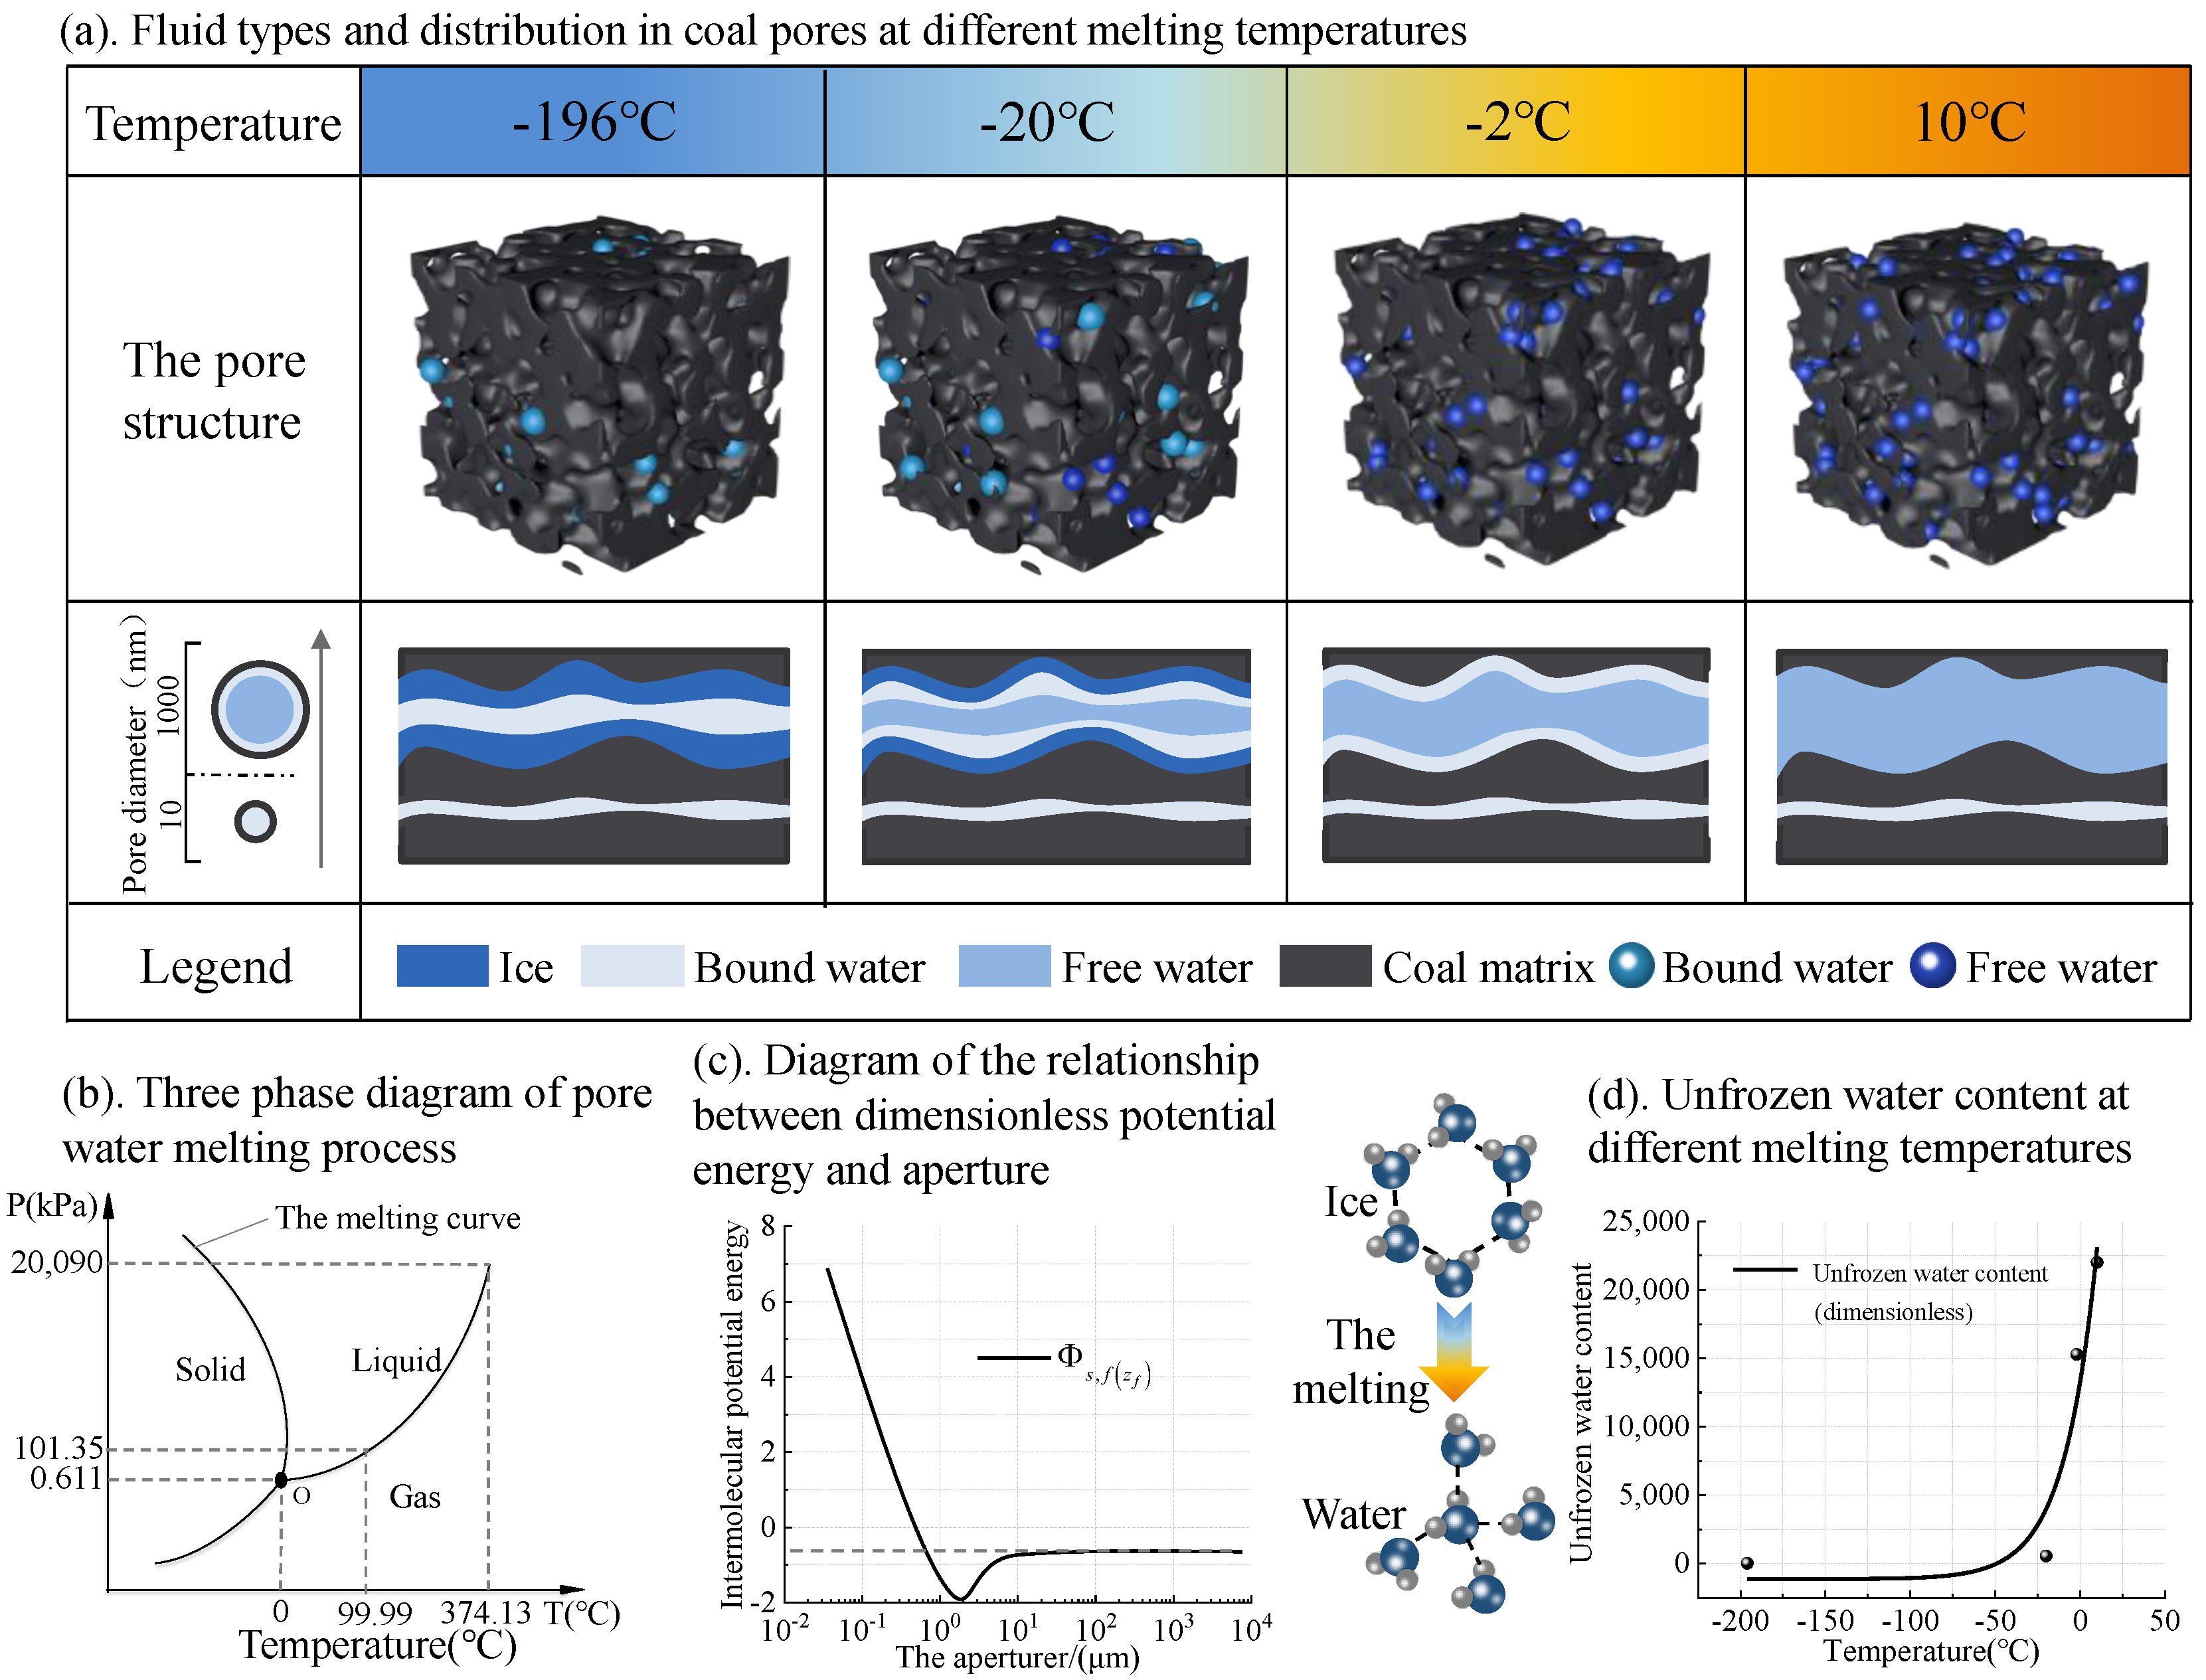
4. Evolution Mechanism of Unfrozen Water Content in Pore

Coal body is composed of multi-phase substances, usually including coal matrix, water and coalbed methane, covering three phases: solid, liquid and gas. Therefore, the properties of coal body are very complicated. As a kind of porous solid medium, coal is also a kind of discontinuous particle aggregate, and there are usually multiphase substances in the pores of coal.

4.1. Governing Equation of Water Ice Transition in Pore

When describing the fluid motion process within the pore space, Darcy’s law is usually used to characterize the state of energy conservation during fluid flow. Therefore, the governing equation of water-ice phase change flow in coal was derived based on the equation of continuous motion of water and Darcy’s law.
It is assumed that the side length of the micro-element body in any space in the pore is Δx, Δy and Δz, and the inflow mass and outflow mass of the water in the coal micro-element body moving along the X-axis are q u x 1 2 × x × δ q u x δ x and q u x + 1 2 × x × δ q u x δ x . Suppose that the unfrozen water fluxes at the center of the cell are q u x , q u y , q u z , Therefore, in the X-axis direction, unfrozen water flux per unit time (m/s) can be expressed as:
q ux + 1 2 Δ x q ux x ( q ux 1 2 Δ x q ux x ) = Δ x q ux x
Then, the volume change of unfrozen water in coal cell within unit time can be expressed as:
Δ x q ux x × Δ y Δ z = q ux x Δ x Δ y Δ z
Assume that the unit time is t and the density of unfrozen water is ρ u (kg·m−3). Therefore, the change value of unfrozen water mass along the X-axis is:
( ρ u q ux ) x Δ x Δ y Δ z Δ t
Then, the total change of unfrozen water mass in three directions xyz can be expressed as:
- ( ρ u q ux ) x + ( ρ u q uy ) y + ( ρ u q uz ) z Δ x Δ y Δ z Δ t
At the same time, the mass of unfrozen water in coal microelement is ρ u θ u x y z ; θ u is the volume content of unfrozen water (%). By the same token, the mass of ice in the cell is ρ i θ i x y z , where ρ i (kg·m−3) and θ i (%) are the density and volume content of ice, respectively. Therefore, the variation of total moisture content of the microelement per unit time is defined as:
( ρ u θ u + ρ i θ i ) t Δ x Δ y Δ z Δ t
According to the law of fluid mass conservation, the following can be obtained:
( ρ u θ u + ρ i θ i ) t Δ x Δ y Δ z Δ t = - ( ρ u q ux ) x + ( ρ u q uy ) y + ( ρ u q uz ) z Δ x Δ y Δ z Δ t
By eliminating homogeneity and simplifying, we can obtain:
( ρ u θ u + ρ i θ i ) t = - ( ρ u q )
Combined with fluid flux defined in Darcy’s law of fluid flow in unsaturated porous media:
q u = K ψ = K ( ψ m + ψ g )
where q u represents the flux of unfrozen water in coal, m/s; K represents the permeability coefficient of unfrozen water in coal. It can also be expressed as the influence coefficient of unfrozen water gravity, which is a function of θ u . ψ represents the potential energy involved in the unfrozen water flow process, including the matrix potential energy ψ m and gravitational potential energy ψ g . Therefore, Darcy’s law of unfrozen water flow in coal body is expressed as:
q u = K θ u ψ
By substituting Equation (9) into Equation (7), we can obtain:
θ u t + ρ i ρ u θ i t = x K θ u x ψ x + y K θ u y ψ y + z K θ u z ψ z
Two unknown variables θ u and ψ m exist in Equation (10). Therefore, the diffusion coefficient of unfrozen water D θ u is introduced:
D θ u = K θ u C θ u = K θ u d θ u / d ψ m = K θ u d ψ m d θ u
where C θ u is the specific heat capacity of unfrozen water, J·(kg·°C)−1.
To sum up, the governing equations of unfrozen water and ice in coal body in the two-dimensional rectangular coordinate system are, respectively, expressed as:
θ u t = D θ u 2 θ u x 2 + 2 θ u y 2 + K θ u y ρ i ρ u θ i t

4.2. Effect of Pore Temperature on Unfrozen Water Content

The process of freezing water will form hydrogen bonds between water molecules because of the irregular movement and synthesis, making the formation of hydrogen bonds in the direction of the existence of each anisotropy, which will lead to the freezing of water molecules in the process of aggregation. There are large gaps, and because of the existence of these gaps, the expansion of the volume of water after the freezing process occurs. The phase transition of ice and water reaches a two-phase equilibrium state according to the Clausius–Clapeyron equation [34]. As shown in Equation (13):
d P d T = L T Δ v
where dP/dT is the rate at which pressure changes with temperature; L is the enthalpy of the phase transition; T is the temperature; P is the pressure; Δ v is the specific volume change of latent heat of phase transition.
Equation (13) shows that until the new equilibrium is reached, the pressure always changes correspondingly with the temperature, so that the water and ice remain in a state of dynamic equilibrium during the phase transition. The solid-liquid phase change point of water under different pressures can be calculated by the conversion of Equation (13), as shown in Equation (14).
T 0 T H f u s T 2 d T = V i V w P P 0
where H f u s is the enthalpy change of melt at a certain temperature; V i V w is the change in molar volume during the freezing process; P 0 is the standard atmospheric pressure; T0 is the free freezing point of water (T0 = 273.15 K).
With the decrease of freezing temperature, the pore pressure increases gradually, and the freezing point of water decreases. When the freezing rate of water in the proposed system is the same as the melting rate of ice, the equilibrium of the two surfaces will be reached [35]. When the ice in the coal sample is melting, the hydrogen bond between the water molecules disappears as the temperature goes up, leading to a decrease in the pore filling volume, resulting in a decrease in the pore pressure and a rise in the ice melting rate, resulting in the gradual increase of unfrozen water content in the negative temperature area shown in Figure 6 and Figure 9 above.

4.3. Effect of Potential Energy between Pore Wall and Unfrozen Water on Unfrozen Water Content

In the slit pores, the intermolecular potential energy exists between the fluid molecules and the coal pore wall, which affects the pore pressure, thus weakening the interaction between water molecules and affecting the freezing process of pore water. The interaction between H2O molecule and coal pore wall adopts the two-body potential energy model. If the distance between f molecule and one side pore wall is z f , then
Φ s f ( z f ) = 5 3 Φ 0 2 5 σ s f z s f 10 σ s f z s f 4 σ s f 4 3 Δ 0.61 Δ + z s f 3
where Φ 0 represents the minimum interaction energy between molecules and carbon atoms, Φ 0 = 6 5 π ρ s ε s f σ s f 2 Δ ; ρ s is the number density of carbon atoms; Δ represents the layer distance of carbon atom crystal (0.335 nm); ε s f and σ s f are interaction parameters between fluid molecules and carbon pore walls and represent the depth and effective diameter of potential energy well between fluid molecules and carbon atoms, respectively.
The interaction parameters between solid (coal) and fluid (H2O molecules) were calculated using the Lorentz-Berthelot mixing rule, as follows:
σ s f = ε s s ε f f
σ s f = σ s s + σ f f 2
Equation (15) only describes the potential energy between fluid molecules and one side of the pore wall, but in fact, fluid molecules will interact with both sides of the pore wall. Assuming the pore width is w p , the total potential energy between a single fluid molecule f and the pore wall is:
Φ s , f z f = Φ s i z f + Φ s f w p z f
The effect of pore size on the potential energy between fluid molecules and coal pore wall molecules was further analyzed using the actual pore size combined with the 10-4-3 two-body potential energy model. Within slit-type pores with a pore diameter of less than 0.1 µm, there was a large intermolecular potential energy between water molecules and carbon atoms, which gradually decreases as the pore diameter table increases. Unfrozen water existed mainly in the form of thin film water in the slit-type pore; a very small gap existed between the H2O molecules and the coal pore wall, creating a large potential energy between two different molecules, so that the coal wall generated some pressure on the water molecules, affecting the freezing point of the pore water. In other words, the smaller the pore diameter was, the lower the ice melting point in the pore was, which is also consistent with the above results.
At extremely low temperatures, the free water in the pores of coal was completely frozen, and under the influence of pore pressure, there was still bound water that could not be completely frozen in some micropores, as shown in Figure 10. As the melting temperature increased, the ice in the pores began to melt gradually, and there were two kinds of fluids, bound water and free water, and a large amount of free water existed in the pores after the positive temperature. Figure 10b,c show the phase transition evolution process of ice water and the relationship between the intermolecular potential energy in the pore with the pore size. With the decrease of temperature, the pore pressure gradually increased, and there was a great intermolecular potential energy in the pores of small size, and both affected the melting point of the ice in the pores, resulting in the difference of unfrozen water content at different melting temperatures. In addition, the temperature at the site and the pore structure of different quality coals themselves can affect the unfrozen water content within the pores. In this paper, we only tested lignite alone and reasoned the effect of pore pressure on the pore ice melt point and unfrozen water content under a single pore width conditions according to the model equation; because of the non-homogeneity of the pore structure of coal, the next step is to consider the effect of pore size distribution on the unfrozen water content during experiments and molecular simulations to study the effect of the pore structure of real coal on the unfrozen water content during freezing.
In summary, the unfrozen water content and distribution characteristics can reflect the degree of coal body melting, and the degree of melting affects the size of ice pores, which directly determines the pore permeability and affects the efficiency of coalbed methane extraction. In this paper, it was found that temperature, pore size and distribution had a significant effect on unfrozen water content and distribution. Before the implementation of low-temperature fracturing technology, the unfrozen water evolution law should be investigated for the target reservoir during the melting process of frozen coal body. On the one hand, the effect of fracturing and permeability enhancement can be evaluated in advance. On the other hand, it can provide a reference for the selection of the optimal temperature interval for CBM extraction, which can further improve the gas production.

5. Conclusions

This paper focuses on the changes in unfrozen water content during the melting process of lignite coal after 150 min of liquid nitrogen freezing. The evolution of unfrozen water during the melting process is a key factor in controlling water migration and freezing. The difference in the distribution of unfrozen water directly affects the melting rate of coal seams. The study of the evolution law of unfrozen water during the melting process can further optimize the technical process of liquid nitrogen fracturing and determine the scientific and effective freezing time to achieve the best fracturing effect. The exploration of the intrinsic mechanism of the melting process in this paper will provide theoretical guidance for the engineering application of liquid nitrogen frozen permeability-enhancement technology. The main conclusions are as follows:
(1)
The two-dimensional NMR T1-T2 spectra reflected the unfrozen water space within the pore space. According to the T1-T2 spectra at different temperatures, the unfrozen water content could be obtained in ascending order with increasing temperature.
(2)
In the melting process of frozen coal sample, the pore structure was composed of coal pore and ice pore. As the melting progresses, the small pores formed by the ice gradually disappeared, the number of small pores decreased and the number of intermediate pores increased.
(3)
The unfrozen water content was affected by temperature and pore size. The change of pore pressure with temperature directly affected the melting point of ice. The melting of coal samples started from the small pores until the temperature rose to a certain degree and the large pores began to melt.
(4)
Under the influence of intermolecular potential energy between water molecules and coal wall in the pore, the ice melting point decreased in small pore. Since the smaller the pore is, the larger the intermolecular potential energy is, a more significant effect occurs on the ice melting point reduction. This is the key reason why the ice in the small pores melted first during the melting process of frozen coal. In this paper, we only theoretically analyzed the effect of pore pressure on pore ice melting point and unfrozen water content under a single pore size condition. Due to the uneven pore size distribution of real coals, the control mechanism of pore size and distribution on unfrozen water content in coals with different degrees of metamorphism will be discussed in our future studies.
(5)
In this paper, it was found that the order of pore ice melting was small pores first and then medium-large pores, and the slow ice melting in medium-large pores will undoubtedly increase fracturing time and reduce the permeability-enhancement effect in the coal seam. At the same time, previous tests found that the freezing sequence was medium-large pores first and then small pores. Therefore, we believe that when applying low-temperature freeze-thaw fracturing technology, rapid freeze-thawing should be adopted to improve the freeze-thawing efficiency of medium-large pores, avoiding the waste of energy and time by freezing and thawing of small pores, so as to achieve the purpose of high-efficiency permeability enhancement and coalbed methane production increase. For example, rapid cyclic freezing and thawing or rapid hot and cold alternation can be adopted to fully reduce the consumption of liquid nitrogen, energy and time, as well as to promote the low-cost and high-efficiency application of this technology.

Author Contributions

Conceptualization, L.Q.; methodology, T.L. and W.Y.; formal analysis, X.Z.; investigation, S.L.; data curation, M.M. and J.L.; writing—original draft preparation, T.L., X.Z. and L.Q.; writing—review and editing, T.L. and L.Q.; supervision, B.L.; funding acquisition, T.L. and L.Q. All authors have read and agreed to the published version of the manuscript.

Funding

This work was financially supported by the Young Elite Scientist Sponsorship Program by CAST (2022QNRC001), National Natural Science Foundation of China (51904237, 52204259), Innovation Capability Support Program of Shaanxi (2022KJXX-59), Young Talent Fund of Association for Science and Technology in Shaanxi, China (20220437), Natural Science Foundation of Jiangsu Province (BK20221142) and Open Fund of Jiangsu Key Laboratory of Coal-based Greenhouse Gas Control and Utilization (2022KF-ZD01).

Institutional Review Board Statement

Not applicable.

Informed Consent Statement

Not applicable.

Data Availability Statement

The data presented in this study are available on request from the corresponding authors.

Acknowledgments

The authors would like to thank the anonymous reviewers for their valuable comments that improved the quality of the manuscript.

Conflicts of Interest

The authors declare no conflicts of interest.

References

  1. Kleinhans, U.; Wieland, C.; Frandsen, F.J.; Spliethoff, H. Ash Formation and Deposition in Coal and Biomass Fired Combustion Systems: Progress and Challenges in the Field of Ash Particle Sticking and Rebound Behavior. Prog. Energy Combust. Sci. 2018, 68, 65–168. [Google Scholar] [CrossRef]
  2. Hasse, C.; Debiagi, P.; Wen, X.; Hildebrandt, K.; Vascellari, M.; Faravelli, T. Advanced Modeling Approaches for CFD Simulations of Coal Combustion and Gasification. Prog. Energy Combust. Sci. 2021, 86, 100938. [Google Scholar] [CrossRef]
  3. Ju, W.; Dong, J.; Chang, C. Evolution of Methane Permeability and Fracture Structure of Coal: Implications for Methane Extraction in Deep Coal Seams. RSC Adv. 2022, 12, 30227–30235. [Google Scholar] [CrossRef] [PubMed]
  4. Zou, Q.; Zhang, T.; Ma, T.; Tian, S.; Jia, X.; Jiang, Z. Effect of Water-Based SiO2 Nanofluid on Surface Wettability of Raw Coal. Energy 2022, 254, 124228. [Google Scholar] [CrossRef]
  5. Yan, F.; Lin, B.; Zhu, C.; Shen, C.; Zou, Q.; Guo, C.; Liu, T. A Novel ECBM Extraction Technology Based on the Integration of Hydraulic Slotting and Hydraulic Fracturing. J. Nat. Gas Sci. Eng. 2015, 22, 571–579. [Google Scholar] [CrossRef]
  6. Li, B.; Zhang, J.; Ding, Z.; Wang, B.; Li, P. A Dynamic Evolution Model of Coal Permeability during Enhanced Coalbed Methane Recovery by N 2 Injection: Experimental Observations and Numerical Simulation. RSC Adv. 2021, 11, 17249–17258. [Google Scholar] [CrossRef]
  7. Yan, H.; Wang, W.; Zhang, J.; Ma, D.; Zhou, N.; Wan, Z. Experimental Study on the Influence of Coal-Rock Interface Strength on Crack Propagation Law of Supercritical Carbon Dioxide Fracturing. Gas Sci. Eng. 2023, 112, 204943. [Google Scholar] [CrossRef]
  8. Sun, Y.; Zhai, C.; Qin, L.; Xu, J.; Yu, G. Coal Pore Characteristics at Different Freezing Temperatures under Conditions of Freezing–Thawing Cycles. Environ. Earth Sci 2018, 77, 525. [Google Scholar] [CrossRef]
  9. Akhondzadeh, H.; Keshavarz, A.; Al-Yaseri, A.Z.; Ali, M.; Awan, F.U.R.; Wang, X.; Yang, Y.; Iglauer, S.; Lebedev, M. Pore-Scale Analysis of Coal Cleat Network Evolution through Liquid Nitrogen Treatment: A Micro-Computed Tomography Investigation. Int. J. Coal Geol. 2020, 219, 103370. [Google Scholar] [CrossRef]
  10. Zou, Q.; Chen, Z.; Cheng, Z.; Liang, Y.; Xu, W.; Wen, P.; Zhang, B.; Liu, H.; Kong, F. Evaluation and Intelligent Deployment of Coal and Coalbed Methane Coupling Coordinated Exploitation Based on Bayesian Network and Cuckoo Search. Int. J. Min. Sci. Technol. 2022, 32, 1315–1328. [Google Scholar] [CrossRef]
  11. Sheta, S.; Afgan, M.S.; Hou, Z.; Yao, S.-C.; Zhang, L.; Li, Z.; Wang, Z. Coal Analysis by Laser-Induced Breakdown Spectroscopy: A Tutorial Review. J. Anal. At. Spectrom. 2019, 34, 1047–1082. [Google Scholar] [CrossRef]
  12. Zhao, Y.; Li, H.; Lei, J.; Xie, J.; Li, L.; Gan, Y.; Deng, J.; Qi, R.; Liu, Y. Study on the Surface Wetting Mechanism of Bituminous Coal Based on the Microscopic Molecular Structure. RSC Adv. 2023, 13, 5933–5945. [Google Scholar] [CrossRef] [PubMed]
  13. Liang, Y.; Tan, Y.; Wang, F.; Luo, Y.; Zhao, Z. Improving Permeability of Coal Seams by Freeze-Fracturing Method: The Characterization of Pore Structure Changes under Low-Field NMR. Energy Rep. 2020, 6, 550–561. [Google Scholar] [CrossRef]
  14. Wan, X.; Pei, W.; Lu, J.; Zhang, X.; Yan, Z.; Pirhadi, N. Prediction of the Unfrozen Water Content in Soils Based on Premelting Theory. J. Hydrol. 2022, 608, 127505. [Google Scholar] [CrossRef]
  15. Huang, S.; Liu, F.; Liu, G.; Yu, S. Estimation of the Unfrozen Water Content of Saturated Sandstones by Ultrasonic Velocity. Int. J. Min. Sci. Technol. 2023, 33, 733–746. [Google Scholar] [CrossRef]
  16. Bi, J.; Wang, G.; Wu, Z.; Wen, H.; Zhang, Y.; Lin, G.; Sun, T. Investigation on Unfrozen Water Content Models of Freezing Soils. Front. Earth Sci. 2023, 10, 1039330. [Google Scholar] [CrossRef]
  17. Kruse, A.M.; Darrow, M.M. Adsorbed Cation Effects on Unfrozen Water in Fine-Grained Frozen Soil Measured Using Pulsed Nuclear Magnetic Resonance. Cold Reg. Sci. Technol. 2017, 142, 42–54. [Google Scholar] [CrossRef]
  18. Lu, J.; Pei, W.; Zhang, X.; Bi, J.; Zhao, T. Evaluation of Calculation Models for the Unfrozen Water Content of Freezing Soils. J. Hydrol. 2019, 575, 976–985. [Google Scholar] [CrossRef]
  19. Feng, S.; Zhang, H.; Lv, J.; Dyck, M.; Wu, Q.; He, H. A Scientometric Review of Research Status on Unfrozen Soil Water. Water 2021, 13, 708. [Google Scholar] [CrossRef]
  20. Wan, X.; Pei, W.; Lu, J.; Qiu, E.; Yan, Z.; Pirhadi, N.; Zhu, J. Analytical Model to Predict Unfrozen Water Content Based on the Probability of Ice Formation in Soils. Permafr. Periglac. Process. 2022, 33, 436–451. [Google Scholar] [CrossRef]
  21. Zhang, M.; Zhang, X.; Lu, J.; Pei, W.; Wang, C. Analysis of Volumetric Unfrozen Water Contents in Freezing Soils. Exp. Heat Transf. 2019, 32, 426–438. [Google Scholar] [CrossRef]
  22. Wen, H.; Bi, J.; Guo, D. Evaluation of the Calculated Unfrozen Water Contents Determined by Different Measured Subzero Temperature Ranges. Cold Reg. Sci. Technol. 2020, 170, 102927. [Google Scholar] [CrossRef]
  23. Huang, S.; Liu, Q.; Liu, Y.; Ye, Z.; Cheng, A. Freezing Strain Model for Estimating the Unfrozen Water Content of Saturated Rock under Low Temperature. Int. J. Geomech. 2018, 18, 04017137. [Google Scholar] [CrossRef]
  24. An, R.; Kong, L.; Li, C. Pore Distribution Characteristics of Thawed Residual Soils in Artificial Frozen-Wall Using NMRI and MIP Measurements. Appl. Sci. 2020, 10, 544. [Google Scholar] [CrossRef]
  25. Ahamed, M.A.A.; Perera, M.S.A.; Matthai, S.K.; Ranjith, P.G.; Li, D. Coal Composition and Structural Variation with Rank and Its Influence on the Coal-Moisture Interactions under Coal Seam Temperature Conditions—A Review Article. J. Pet. Sci. Eng. 2019, 180, 901–917. [Google Scholar] [CrossRef]
  26. Jin, X.; Yang, W.; Gao, X.; Zhao, J.-Q.; Li, Z.; Jiang, J. Modeling the Unfrozen Water Content of Frozen Soil Based on the Absorption Effects of Clay Surfaces. Water Resour. Res. 2020, 56, e2020WR027482. [Google Scholar] [CrossRef]
  27. Li, Z.; Chen, J.; Sugimoto, M. Pulsed NMR Measurements of Unfrozen Water Content in Partially Frozen Soil. J. Cold Reg. Eng. 2020, 34, 04020013. [Google Scholar] [CrossRef]
  28. Weng, L.; Wu, Z.; Liu, Q.; Chu, Z.; Zhang, S. Evolutions of the Unfrozen Water Content of Saturated Sandstones during Freezing Process and the Freeze-Induced Damage Characteristics. Int. J. Rock Mech. Min. Sci. 2021, 142, 104757. [Google Scholar] [CrossRef]
  29. Chen, Y.; Zhou, Z.; Wang, J.; Zhao, Y.; Dou, Z. Quantification and Division of Unfrozen Water Content during the Freezing Process and the Influence of Soil Properties by Low-Field Nuclear Magnetic Resonance. J. Hydrol. 2021, 602, 126719. [Google Scholar] [CrossRef]
  30. Su, Z.; Tan, X.; Chen, W.; Jia, H.; Xu, F. A Model of Unfrozen Water Content in Rock during Freezing and Thawing with Experimental Validation by Nuclear Magnetic Resonance. J. Rock Mech. Geotech. Eng. 2022, 14, 1545–1555. [Google Scholar] [CrossRef]
  31. Li, H.; Yang, Z.; Wang, J. Unfrozen Water Content of Permafrost during Thawing by the Capacitance Technique. Cold Reg. Sci. Technol. 2018, 152, 15–22. [Google Scholar] [CrossRef]
  32. Song, Y.; Huang, F.; Li, X.; Han, D.; Zhao, L.; Liang, H.; Rui, M.; Wang, J.; Zhang, C. Water Status Evolution of Pork Blocks at Different Cooking Procedures: A Two-Dimensional LF-NMR T1-T2 Relaxation Study. Food Res. Int. 2021, 148, 110614. [Google Scholar] [CrossRef] [PubMed]
  33. Song, Y.-Q.; Venkataramanan, L.; Hürlimann, M.D.; Flaum, M.; Frulla, P.; Straley, C. T1–T2 Correlation Spectra Obtained Using a Fast Two-Dimensional Laplace Inversion. J. Magn. Reson. 2002, 154, 261–268. [Google Scholar] [CrossRef] [PubMed]
  34. Li, B.; Huang, L.; Lv, X.; Ren, Y. Variation Features of Unfrozen Water Content of Water-Saturated Coal under Low Freezing Temperature. Sci Rep 2021, 11, 15398. [Google Scholar] [CrossRef]
  35. Ma, W.; Zhang, L.; Yang, C. Discussion of the Applicability of the Generalized Clausius–Clapeyron Equation and the Frozen Fringe Process. Earth-Sci. Rev. 2015, 142, 47–59. [Google Scholar] [CrossRef]
Figure 1. Experimental equipment and process.
Applsci 14 05182 g001
Figure 2. T2 spectrum at each temperature point during the melting process. (a) Three-dimensional diagram; (b) Two-dimensional diagram.
Applsci 14 05182 g002
Figure 3. Spectral area versus temperature curve.
Applsci 14 05182 g003
Figure 4. T1-T2 spectra at various temperature points during the melting process. (a) −196 °C; (b) −20 °C; (c) −2 °C; (d) 10 °C.
Applsci 14 05182 g004
Figure 5. Distribution range of T1 and T2 of coal samples at different temperatures.
Applsci 14 05182 g005
Figure 6. Relative distribution space of unfrozen water in coal samples at different temperatures.
Applsci 14 05182 g006
Figure 7. Peak shape of coal samples at different melting temperatures. (a) −196 °C; (b) −20 °C; (c) −2 °C; (d) 10 °C.
Applsci 14 05182 g007
Figure 8. The position of the centroid of each peak of the coal sample at different temperatures.
Applsci 14 05182 g008
Figure 9. Unfrozen water content in coal samples at different temperatures.
Applsci 14 05182 g009
Figure 10. Change mechanism of unfrozen water content in the coal body during the thawing process.
Applsci 14 05182 g010
Table 1. Industrial analysis and maceral analysis.
Coal SpecimensProximate (wt %)Ro,max (%)Maceral Composition (vol %)
MadAadVadFCadVIEM
Lignite6.166.9428.9757.930.6245.7648.271.034.94
Notes: Mad, moisture, air-drying basis; Aad, ash yield, air-drying basis; Vad, volatile, air-drying basis; FCad, fixed carbon content, air-drying basis; V, vitrinite; I, inertinite; E, exinite; M, minerals. Romax, vitrinite reflectance.
Disclaimer/Publisher’s Note: The statements, opinions and data contained in all publications are solely those of the individual author(s) and contributor(s) and not of MDPI and/or the editor(s). MDPI and/or the editor(s) disclaim responsibility for any injury to people or property resulting from any ideas, methods, instructions or products referred to in the content.

