Article

Analysis and Characterization of Micro–Nano Pores in Coal Reservoirs of Different Coal Ranks

1
School of Energy Science and Engineering, Henan Polytechnic University, Jiaozuo 454000, China
2
Collaborative Innovation Center of Coalbed Methane and Shale Gas for Central Plains Economic Region, Jiaozuo 454000, China
3
School of Resources and Environment, Henan Polytechnic University, Jiaozuo 454000, China
*
Author to whom correspondence should be addressed.
Appl. Sci. 2024, 14(12), 5198; https://doi.org/10.3390/app14125198
Submission received: 18 May 2024 / Revised: 6 June 2024 / Accepted: 12 June 2024 / Published: 14 June 2024
(This article belongs to the Special Issue Advances in Unconventional Natural Gas: Exploration and Development)

Abstract

:
Coalbed methane represents a promising source of clean and efficient unconventional energy. The intricate network of micro–nano pores within coal serves as the primary adsorption space for gas, contributing to the complexity of gas migration channels. In this study, based on the box-counting method, three coal samples representing low, medium, and high ranks were subjected to high-precision micro-CT scanning and nano-CT scanning to generate three-dimensional (3D) pore network models using Avizo visualization software. This facilitated the accurate and quantitative characterization of the micro–nano pore structures within coal reservoirs. The results indicated that the face rate distribution range of each sample was large, indicating relatively strong heterogeneity in each sample. The volume fractal dimension of each sample, determined through micro–nano-CT scanning, was around 2.5, while the surface fractal dimension exhibited oscillatory characteristics with moderate uniformity. The pore equivalent radius and throat equivalent radius distributions were unimodal across all the samples, with the micro-CT scanning revealing a concentration primarily within the range of 100–400 μm for the pore equivalent radius and within 200 μm for the throat equivalent radius. Conversely, the nano-CT scanning exhibited concentrations primarily within the range of 500–2500 nm for the pore equivalent radius and within 2000 nm for the throat equivalent radius. The analysis of the 3D reconstruction structures indicated that the middle-rank coal exhibited more developed large–medium pores compared with the low-rank and high-rank coal, while the low-rank and high-rank coal exhibited relatively more micro–small pores. Furthermore, the low-rank coal exhibited the fewest number of pores but the largest average pore equivalent radius and throat radius. Additionally, the middle–high-rank coal exhibited a relatively larger number of pores. Despite the complex topological structures observed in each sample, a significant proportion indicated a coordination number of 0–20, indicating excellent connectivity within the coal samples. This study is conducive to the optimization of coalbed methane surface development blocks and the formulation of reasonable development plans.

1. Introduction

Coal, as a complex porous medium, exhibits a dual pore system consisting of both pores and fractures. The distribution of pore sizes ranges from millimeters to nanometers [1,2], spanning multiple scales, directly impacting the adsorption and fluidity of coalbed methane [3]. The complex pore networks within coal play a crucial role in controlling the occurrence and migration of coalbed methane, with factors such as development degree, porosity, pore number, distribution, and connectivity influencing both abnormal methane enrichment and mine safety [4,5]. Furthermore, studying the coal pore structure is of great significance for understanding the occurrence and migration of coalbed methane and optimizing its exploitation.
The genetic diversity and wide size distribution of coal pores contribute to its intricate pore network, which encompasses various types of pores interconnected through micro-scale cracks [6]. These characteristics serve as direct indicators of the gas generation, storage capacity, and permeability of coal reservoirs. Advanced technologies, such as mercury intrusion porosimetry (MIP), low-pressure gas adsorption, and various imaging techniques, including scanning electron microscopy (SEM), transmission electron microscopy (TEM), nuclear magnetic resonance (NMR), micro-CT, and small-angle X-ray scattering (SAXS), among others, have been increasingly employed for coal pore structure analysis [7,8]. While these methods offer insights into the complex pore structure, each excels within specific measurement ranges. For instance, Jia et al. [9] utilized MATLAB algorithms to analyze SEM images of coal samples, extracting parameters such as porosity, pore radius, pore throat radius, pore coordination number, pore throat ratio, and specific surface area. To determine the accuracy of the analysis results, constant-rate mercury injection and low-temperature N2 adsorption experiments were conducted. To study the pore structure characteristics of the medium- and high-rank coal in the Qinshui Basin, Li Xiaoyan et al. [10] measured the specific surface area and pore size distribution data of different coal samples using liquid nitrogen adsorption. Yang et al. [11] conducted a study on ten groups of coal samples sourced from different regions, focusing on saturated water, centrifugation, and a low-field NMR system. They conducted low-field NMR tests on coal in different states to investigate the pore structure characteristics across various coal ranks.
Furthermore, while NMR, gas adsorption, and mercury intrusion experiments offer wide measurement ranges and high precision, they are limited by the test principles, each targeting different pore size ranges. For instance, low-temperature N2 experiments are suitable for studying pore sizes ranging from 2 nm to 50 nm, whereas low-temperature CO2 experiments are more adept at analyzing pore sizes of <2 nm. Therefore, these methods may not fully reflect the three-dimensional (3D) pore structure characteristics of coal [12].
The nano-scale pores within coal serve as the primary adsorption space for gas, forming a complex pore network that complicates the gas migration channels [13,14]. Recently, computed tomography (CT) has emerged as a non-destructive technique capable of achieving micro- and nanometer resolutions, enabling the visualization of high-resolution 3D pore structures without sample damage. This technology enables the intuitive study of the pore throat morphology in unconventional reservoirs [15]. Digital core models and constructed CT scanning offer the direct and accurate quantitative characterization of microscopic pore structures and seepage simulations. These models can be tailored to different pore structures and types, facilitating detailed investigation into microscopic pore structures and seepage mechanisms [16,17]. Presently, CT scanning technology is predominantly employed in characterizing reservoirs’ pore structures, encompassing parameters such as pore throat size, spatial distribution, and connectivity [18].
Zhang Wenzheng et al. [19] utilized X-ray micro-CT 3D reconstruction technology and the Avizo visualization software 2020.1 to obtain a microscopic pore model of coal. The study establishes a 3D distribution model of coal pores and a pore ball rod model, analyzing statistical parameters such as the porosity, pore radius, throat radius, pore volume, and coordination number for long-flame coal. Wang Yong [20] employed Avizo 3D visualization reconstruction technology to identify the internal cracks within coal samples. Through the statistical analysis of the 3D geometric parameters of the cracks, the spatial distribution characteristics were accurately described. Wang et al. [21] investigated the development, distribution, morphology, and structural differences of fractures with openings exceeding 15 μm in two tectonic coal types through SEM combined with digital image processing technology. Furthermore, they established a permeability prediction model based on Poiseuille’s law, a triaxial permeability experiment, and CT scanning fracture structure parameters, discussing the impact of the control mechanism of the fracture structure on permeability. Hao et al. [22] utilized CT scanning technology to quantitatively characterize the pore-fracture structure of medium–high-rank coal. Through the statistical analysis of pore throat parameters such as pore volume, pore radius, throat radius, throat length, and coordination number, the pore structure differences in the pore structures between medium-rank coal and high-rank coal were identified.
Compared to studying only one or two coal ranks, in this study, the primary coal reservoir in a key area of coalbed methane exploration and development in China was the research focus, and the coal samples in the experiment covered three coal ranks. The same high-precision CT scanner was employed to scan the coal body by micro-CT scanning and nano-CT scanning, and then the representative elementary volume (REV) model of each coal sample was determined based on the box-counting method, filtering the interference noise in the original image using median filtering. The Avizo visualization software facilitated the reconstruction of a 3D pore network model of the coal body, enabling the accurate and quantitative characterization of different coal ranks’ micro–nano pore structures from different angles. This study is conducive to the optimization of coalbed methane surface development blocks and the formulation of reasonable development plans.

2. Coal Samples and Test

2.1. Coal Samples

In this study, three coal sample types from low-, medium-, and high-rank reservoir samples were obtained from the southern margin of the Junggar Basin, the eastern margin of the Ordos Basin, as well as the central and southern parts of the Qinshui Basin. Figure 1 is the distribution map of sampling sites. According to the GB 474-2008 [23] preparation method of coal samples, the samples were broken and sieved. Particle sizes of 120–180 μm were selected for analysis. According to the national standards (GB/T212-2008 [24], GB/T476-2008 [25], GB/T19227-2008 [26], and GB/T1574-2007 [27]), industrial and elemental analyses of the samples were conducted, respectively. The test result is presented in Table 1. The coal samples were processed into three cubes of 50 mm × 50 mm × 50 mm and three cubes of 1 mm × 1 mm × 1 mm using core drilling equipment, which were used for micro-CT and nano-CT scanning experiments, respectively.

2.2. Testing Device

The CT scanning experiment employed Phoenix V|tome|X S240 CT detection equipment. The maximum voltage of the device was 240 kV, and the maximum power was 320 W. It was equipped with transmission and direct X-ray tubes. The minimum identifiable voxel was 1 μm, the nano-focus tube was 0.2 μm, and the geometric magnification ranged between 1.46 X and 400 X. The detector was a DXR-250 digital flat panel detector (Drgem Corporation, Gwangmyeong, Republic of Korea), which consisted of 2036 pixels × 2036 pixels, with a pixel spacing of 200 μm. Phoenix Datos|x 3D computer (Waygate Technologies, Skaneateles, NY, USA) tomography acquisition and reconstruction software was employed to automate the analysis and operation of the entire CT process chain. It effectively reduced the operation time and human error. The sample was fixed on the sample table and scanned in its entirety. Among these, three samples for nano-experiments were scanned with a ray tube voltage of 80 kV, a power of 10 W, a single scan time of 2 s, an image magnification of 40 X, and a total of 2008 scanned images for each sample with a resolution of 200 nm. A total of 1000 images were scanned from the samples with a resolution of 41 μm.

2.3. Experimental Procedure

The experimental procedure was divided into four steps:
  • Six samples were subjected to micro–nano-CT scanning experiments to obtain continuous two-dimensional (2D) sections, necessitating the construction of 3D pore structures;
  • The 2D slices were imported into Avizo software 2020.1 for grayscale conversion, filtering, noise reduction, and stacking according to the position of the spatial coordinates to form a 3D data volume;
  • The threshold segmentation method was employed to differentiate between the pore part and matrix parts in the 2D slice, that is, the binarization processing of the image;
  • The pore network model (PNM) module was employed to extract pores in the coal reservoir, further analyzing the 3D spatial distribution characteristics and pore connectivity. Relevant parameters were extracted to quantitatively characterize the microscopic pore structure of the sample.

3. Results and Discussion

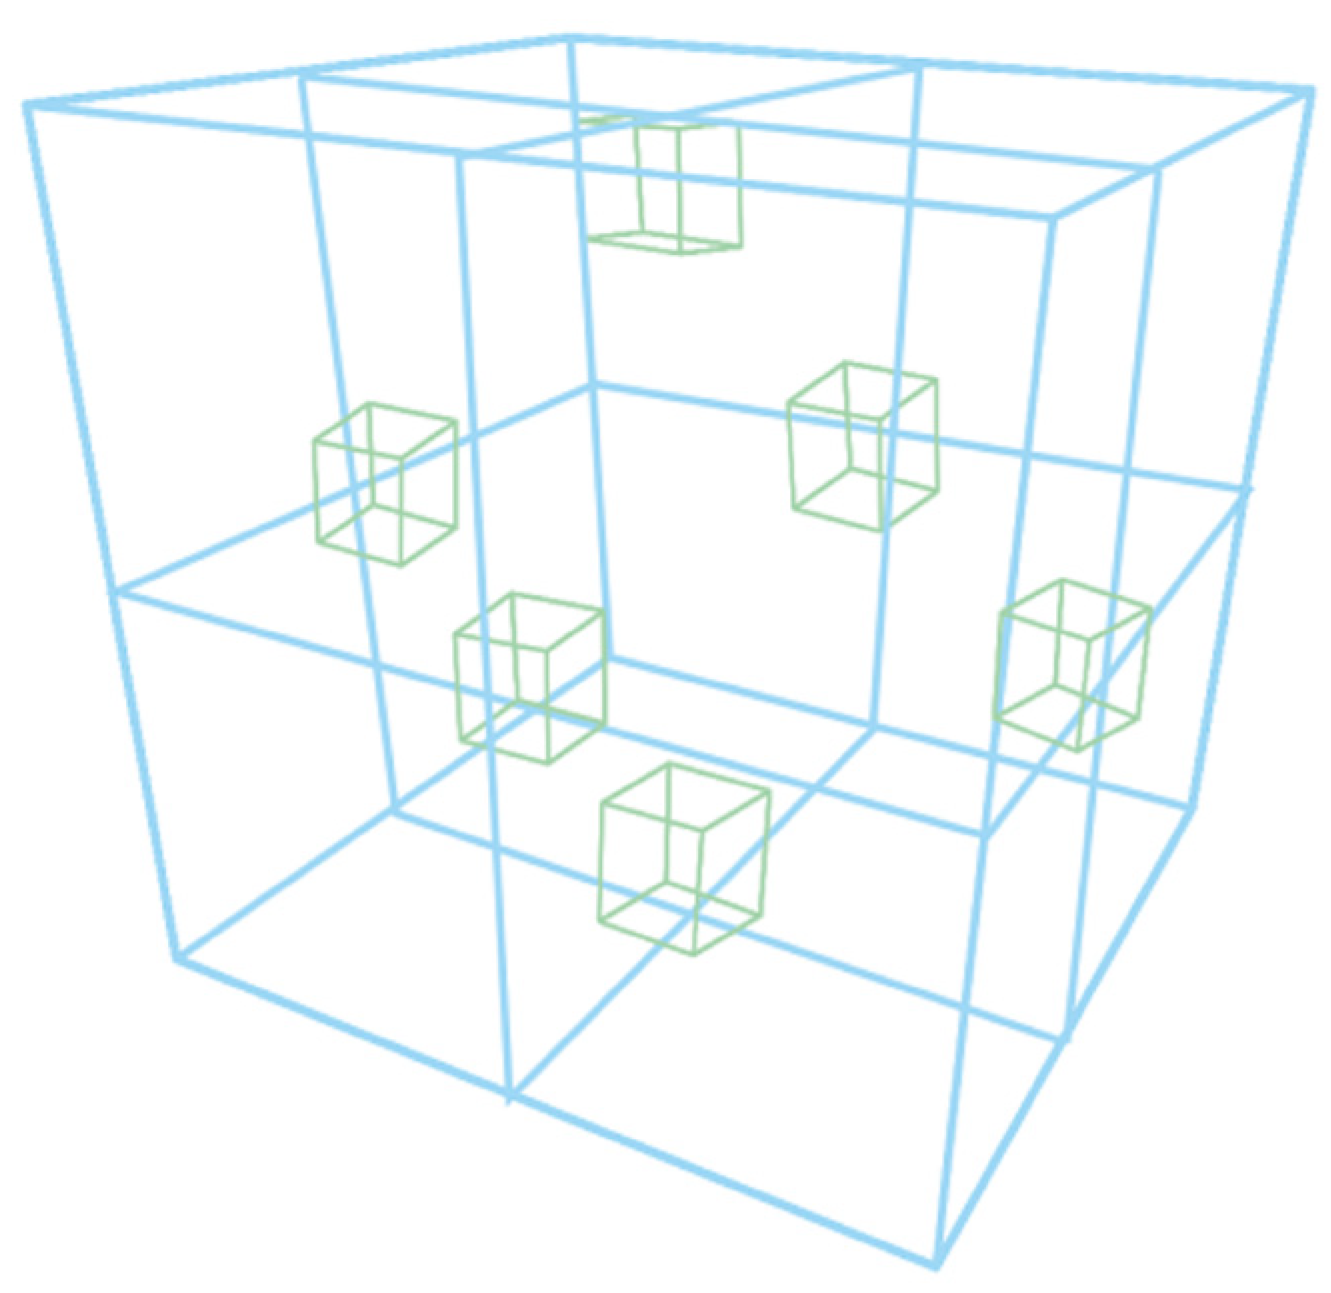
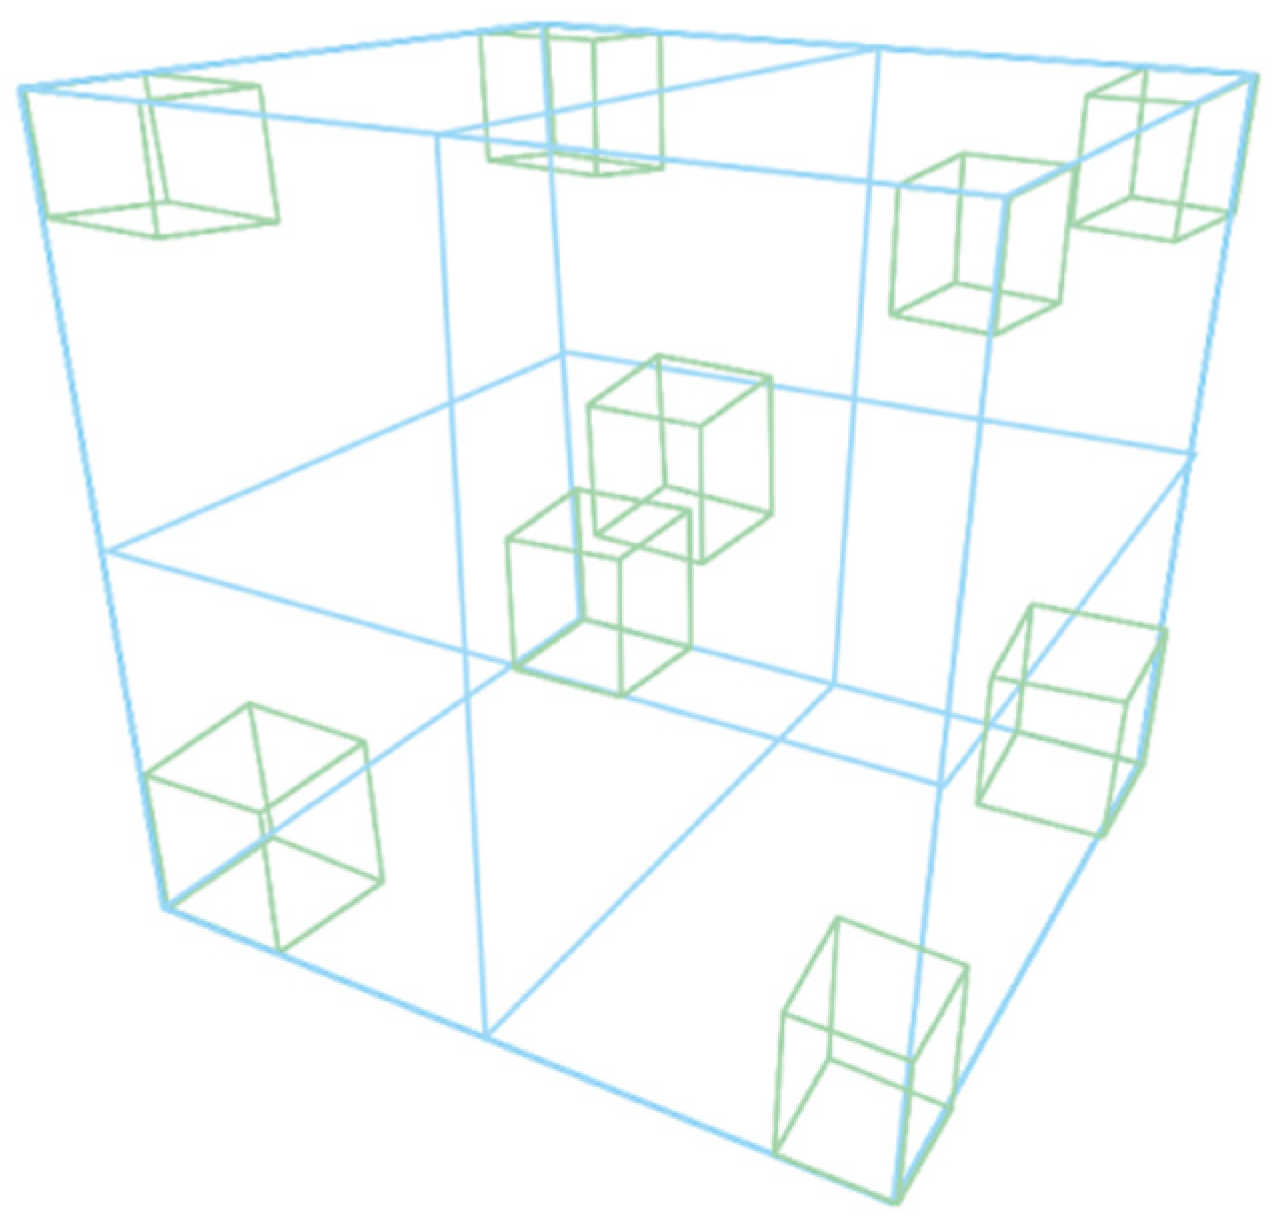
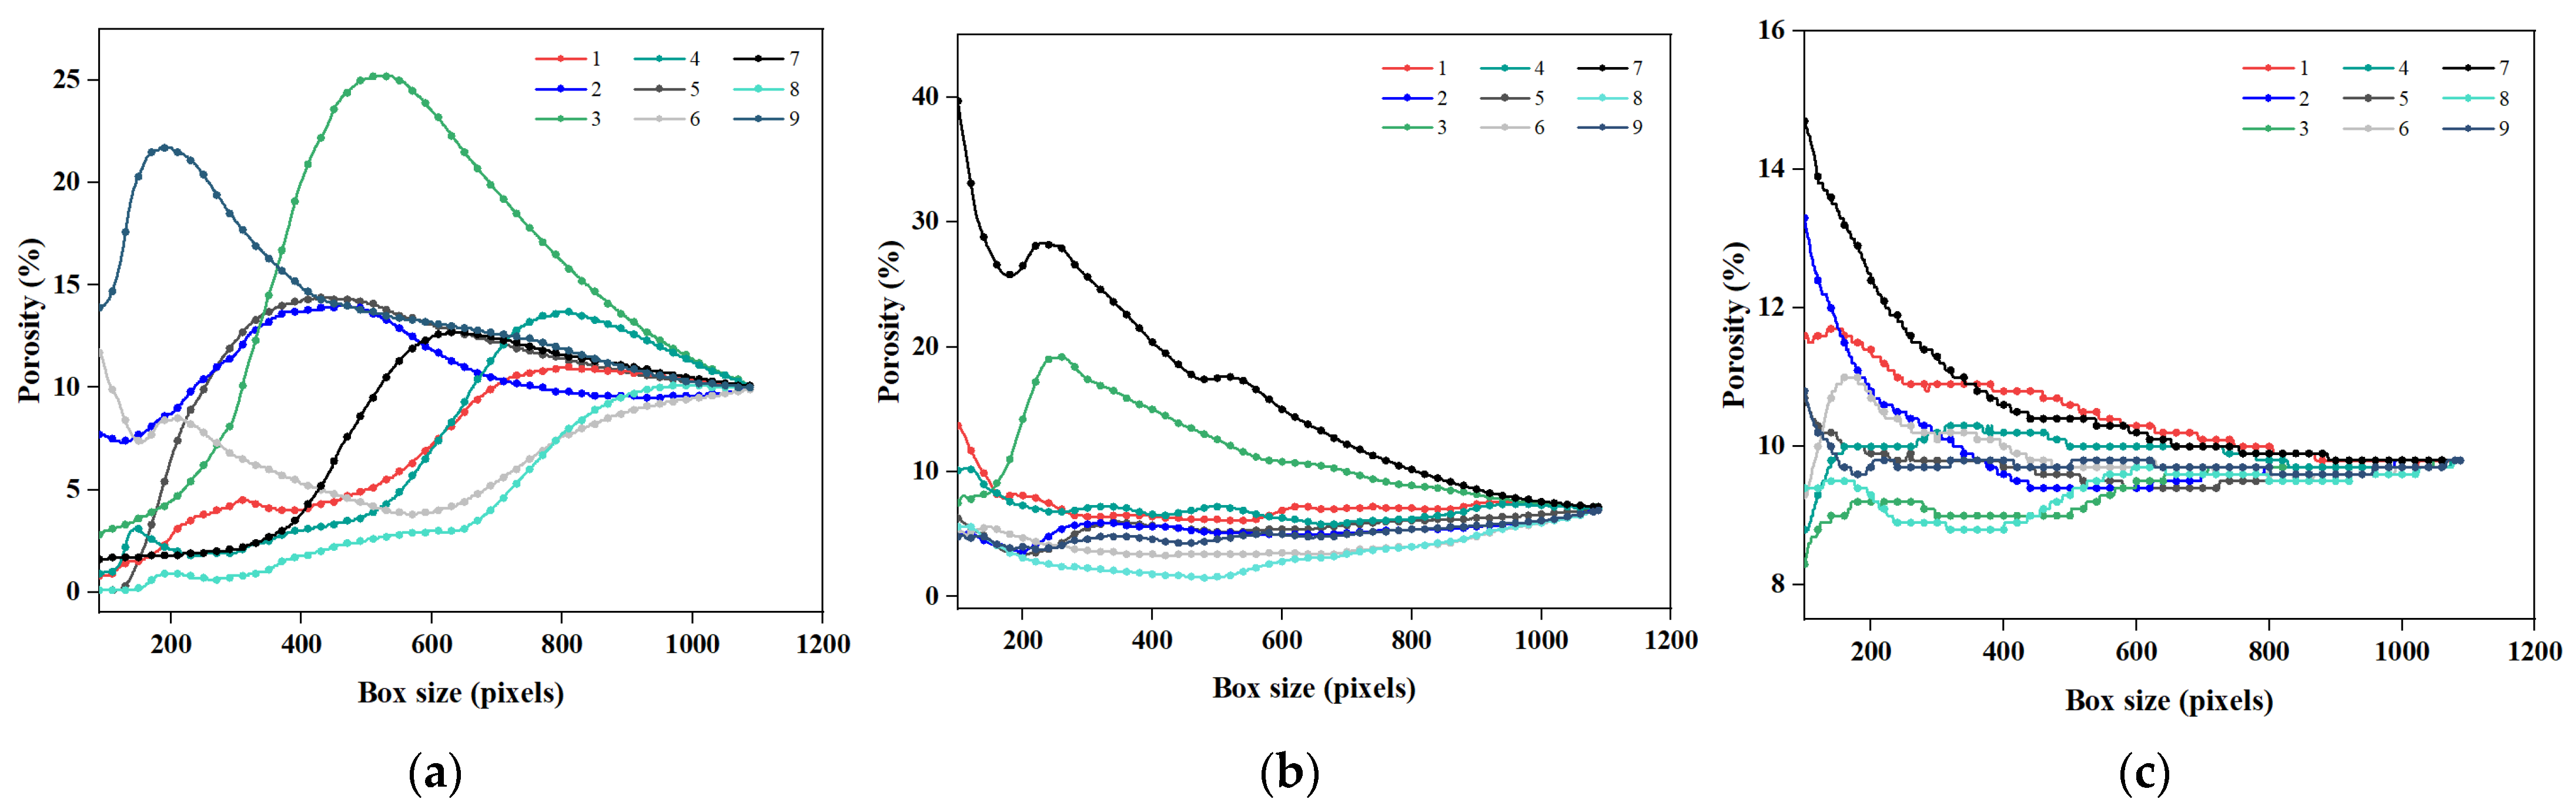
3.1. Research on Representative Elementary Volume

The 2D slices obtained using nano-CT scanning exhibited high-resolution and accurate data. Coal is an anisotropic material, and its pore structure exhibits an obvious size effect. However, due to the limitations imposed by the current computer hardware performance, it is difficult to fully characterize the pore structures of coal samples [28]. To realize the quantitative analysis of coal sample pores, it was necessary to introduce the concept of representative elementary volume (REV). The characterization unit is the smallest unit to describe the porosity and permeability of continuous porous media. Furthermore, when the volume of the coal is less than the REV, the coal porosity fluctuates significantly with volume changes. However, when the coal volume exceeds the REV, the porosity of coal tends to be stable with the volume change, making the REV model representative of coal [29]. Subsequently, the 3D pore modeling analysis was conducted using the determined REV model to study the overall characteristics of the coal sample pores, thereby saving computing resources.
The size of the REV model can be calculated by selecting the region of interest (ROI), but it is biased to analyze the coal body directly according to the ROI. In this study, the box-counting method was employed to determine the characterization unit (REV). According to the local porosity distribution theory, the representativeness of the determined REV model was evaluated, indicating that the local structure was similar to the whole, and there was self-similarity among local areas [30]. The center point of the binary image obtained through the threshold segmentation of different-scale images was employed as the starting point of the box-counting method. To eliminate the influence of different starting point positions on the REV model, several other different positions in the binary image were also selected as the starting points of the box-counting method, and the 3D image was the center position of the six faces of the box, as shown in Figure 2.
Subsequently, a cube box with an initial side length of 20 pixels was placed at nine different starting points (eight vertices and one center point) determined in the binary image (Figure 3). Upon calculating the ratio of the number of pore point pixels to the total number of pixels in the box at nine different positions, the local porosity values at different positions under the specific box size were obtained. Subsequently, the side length of the box gradually increased by 20 pixels.
Finally, the relationship between the porosity of binary images with different sizes and the size of the box was obtained, and the specific change trend is shown in Figure 4. Furthermore, when the box size was small, the porosity values at different positions fluctuated significantly, owing to the uneven distribution of the pores inside the smaller-sized boxes at different positions. Additionally, with the gradual increase in the size of the box, the porosity value fluctuated at different positions, gradually tending to a fixed value, indicating that the selected box size was the size of the characterization cell.
In Figure 4, it was observed that, when different representative units were intercepted, the porosity changes were different. When the LL of the coal sample was within the range of 50–1000 voxels, the porosity changed greatly, and, when the voxel exceeded 1000 voxels, the porosity tended to be stable. Similarly, when the XJ voxel of the coal sample exceeded 900 voxels, the porosity was relatively stable; when the ZZ voxel of the coal sample exceeded 800 voxels, the porosity was relatively stable. Given the variation in the porosity of each coal sample with the volume representative unit and the unity of the representative unit size, the REV was determined at 1000 voxels. The 2D slice of the micro-CT scan was not treated with the REV of 1000 voxels. Figure 5 shows the final REV model of each coal sample.

3.2. Porosity

In the coal pore space structure, there were connected and isolated pores [31]. To study the connectivity characteristics of the pore space structure of the coal samples in the Avizo software, the axis connectivity function was employed to extract the connected pores from the 2D slices scanned through micro-CT scanning, and the REV model was calculated through a nano-CT scan. The spatial structure is shown in Figure 6.
The matrix and pores were separated through threshold segmentation. The total porosity of the sample was the volume of the pores divided by the total volume. After Avizo calculation, under the micro-CT scan, the total porosity of LL was 9.94%, the total porosity of XJ was 5.01%, and the total porosity of ZZ was 7.93%. Under nano-CT scanning, the total porosity of LL was 8.87%, the total porosity of XJ was 6.13%, and the total porosity of ZZ was 7.89%. The total porosity, connected porosity, isolated porosity, and the error with the mercury intrusion data of each sample are presented in Table 2.
Table 2 indicates that, under micro-CT scanning, the total porosity of the medium-rank coal LL was the highest, and the total porosity of the low-rank coal XJ was the lowest. Under nano-CT scanning, the total porosity of LL was the highest, and the total porosity of XJ was the lowest. The 2D sections obtained through scanning the two CT types were calculated using the Avizo software, and the error was smaller compared with the total porosity of the mercury intrusion experimental data, indicating that the REV model obtained under nano-CT conditions was relatively accurate. Upon comparing the connected porosity with the total porosity, it was observed that the connected porosity was lower than the total porosity under the micro-CT scan. Under nano-CT scanning, the connected porosity was lower than the total porosity because the total porosity contained isolated pores, and the connected porosity under nano-CT scanning was relatively lower compared with micro-CT scanning.
The distribution of the surface porosity reflected the macro situation of the pores to a certain extent. Through the Avizo software, the 1000-layer 2D slice diagram of each micro–nano-CT was statistically analyzed by the porosity of each layer, and the surface porosity trend diagram of the xy direction slice of each sample was calculated. The results are shown in Figure 7.
In Figure 6, it was observed that, under the micro-CT scan, the layer-by-layer pore rate of each sample exhibited a ‘U’ trend, and the porosity before and after 1000 2D slices was quite different; under nano-CT scanning, the layer-by-layer face rate of each sample exhibited a downward trend, and the layer-by-layer face rate of the high-order coal ZZ was relatively stable. Furthermore, compared with the layer-by-layer porosity under micro-CT and the layer-by-layer porosity under nano-CT, the former fluctuated greatly, indicating that the micron-level pores of each sample were more uneven than the nano-level pores. The larger the interval of the surface porosity distribution, the worse the uniformity of the pore distribution and thus the stronger the heterogeneity of each sample [32,33].

3.3. Pore Size Distribution

In Avizo, the label analysis command was employed for the unit body after threshold segmentation, and then the data were counted, such as volume, area, equivalent diameter, etc., and checked in the command. The Avizo software had a built-in equivalent diameter formula, which directly calculated the required data, as shown in the micro–nano pore equivalent diameter parameter table of each sample in Table 3 and the pore equivalent diameter distribution histogram of each sample in Figure 8.
From the statistics of the pore equivalent diameter in Table 3, it was observed that the pore equivalent diameter of each sample under the micro-CT scan was larger than the pore equivalent diameter under the nano-CT scan, whether it was the average value or the maximum and minimum values. Under micro-CT scanning, the average equivalent diameter of LL in the medium-rank coal was 117 μm, which was the largest average equivalent diameter of the pores in the three samples. Under nano-CT scanning, the maximum equivalent diameter of the medium-rank coal LL was as high as 100,741 nm, which was larger than the maximum equivalent diameter of the low-rank coal XJ and high-rank coal ZZ. However, the average equivalent diameter was the largest for the low-rank coal XJ, 1656 nm. The minimum equivalent diameter of the micro–nano pores in each sample was the same, which was limited by the resolution of the CT scanning.
The pore equivalent pore size distribution in Table 3 and the equivalent pore distribution histogram of each sample in Figure 7 were analyzed. Thus, under the micro-CT scan, the pores with an equivalent diameter greater than 300 μm accounted for a small proportion in each coal sample, and the pores with an equivalent diameter of 50–200 μm accounted for a large proportion in each coal sample. However, the average equivalent diameter of each sample was around 110 μm, and the maximum and minimum equivalent diameters were quite different, indicating that the homogeneity of the pores was general. Under nano-CT scanning, each sample was distributed within 200–2000 nm, and the equivalent diameter of the low-rank coal XJ was evenly distributed in each size, attributable to the nano-equivalent diameter of the sample XJ, which was the largest among the three samples.

3.4. Fractal Dimension

Pore fractal dimension, a parameter used to measure the physical characteristics of pores, was employed to measure the spatial distribution of the pores, representing the pore system complexity. Generally, the greater the fractal dimension of the pore, the higher the complexity of the pore system, and, the more complex the spatial distribution of the pores, the higher the degree of fracture development. Thus, the rougher the pores, the greater the lack of uniformity [34].
Given the Avizo software, the fractal dimension command was based on the above formula for pores’ fractal dimension statistics. The command was employed after the 3D reconstruction and threshold segmentation of the imported 2D slices. In this study, the pore model of the characterization unit after the threshold segmentation of each sample was obtained in the above process. The fractal dimension command was employed to calculate the fractal dimension of the pore body and surface of each xy slice. The statistical results are presented in Table 4 and Figure 9.
In Table 4, it was observed that the volume fractal dimension of each sample under micro–nano-CT scanning was around 2.5, and the uniformity was poor. Among these, under the micro-CT scanning, the fractal dimension of XJ was the smallest, the fractal dimension of LL was the largest, and the volume fractal dimension of the sample scanned under nano-CT remained constant. However, the homogeneity of XJ and ZZ was relatively superior compared with LL.
Given Table 4 and Figure 8, the fractal dimension of each sample surface was analyzed. It was observed that the surface fractal dimension of each sample exhibited characteristics of oscillation and fluctuation. Among these, under micro-CT scanning, ZZ displayed the least fluctuation, ranging between 1.14 and 1.74, whereas XJ exhibited the largest fluctuation, ranging between 0.94 and 1.79. Conversely, under nano-CT scanning, LL exhibited the least fluctuation, ranging between 1.38 and 1.50, while XJ exhibited the largest, ranging between 0.87 and 1.41. Given the average surface fractal dimension under micro-CT scanning, LL exhibited the largest at 1.47, while XJ exhibited the smallest at 1.17. Similarly, under nano-CT scanning, LL again exhibited the largest surface average fractal dimension, reaching 1.43, with XJ recording the smallest at 1.08. This analysis indicated that XJ exhibited the smallest fractal dimension with the best uniformity, while LL exhibited the largest fractal dimension, indicating rougher pores and poorer uniformity.

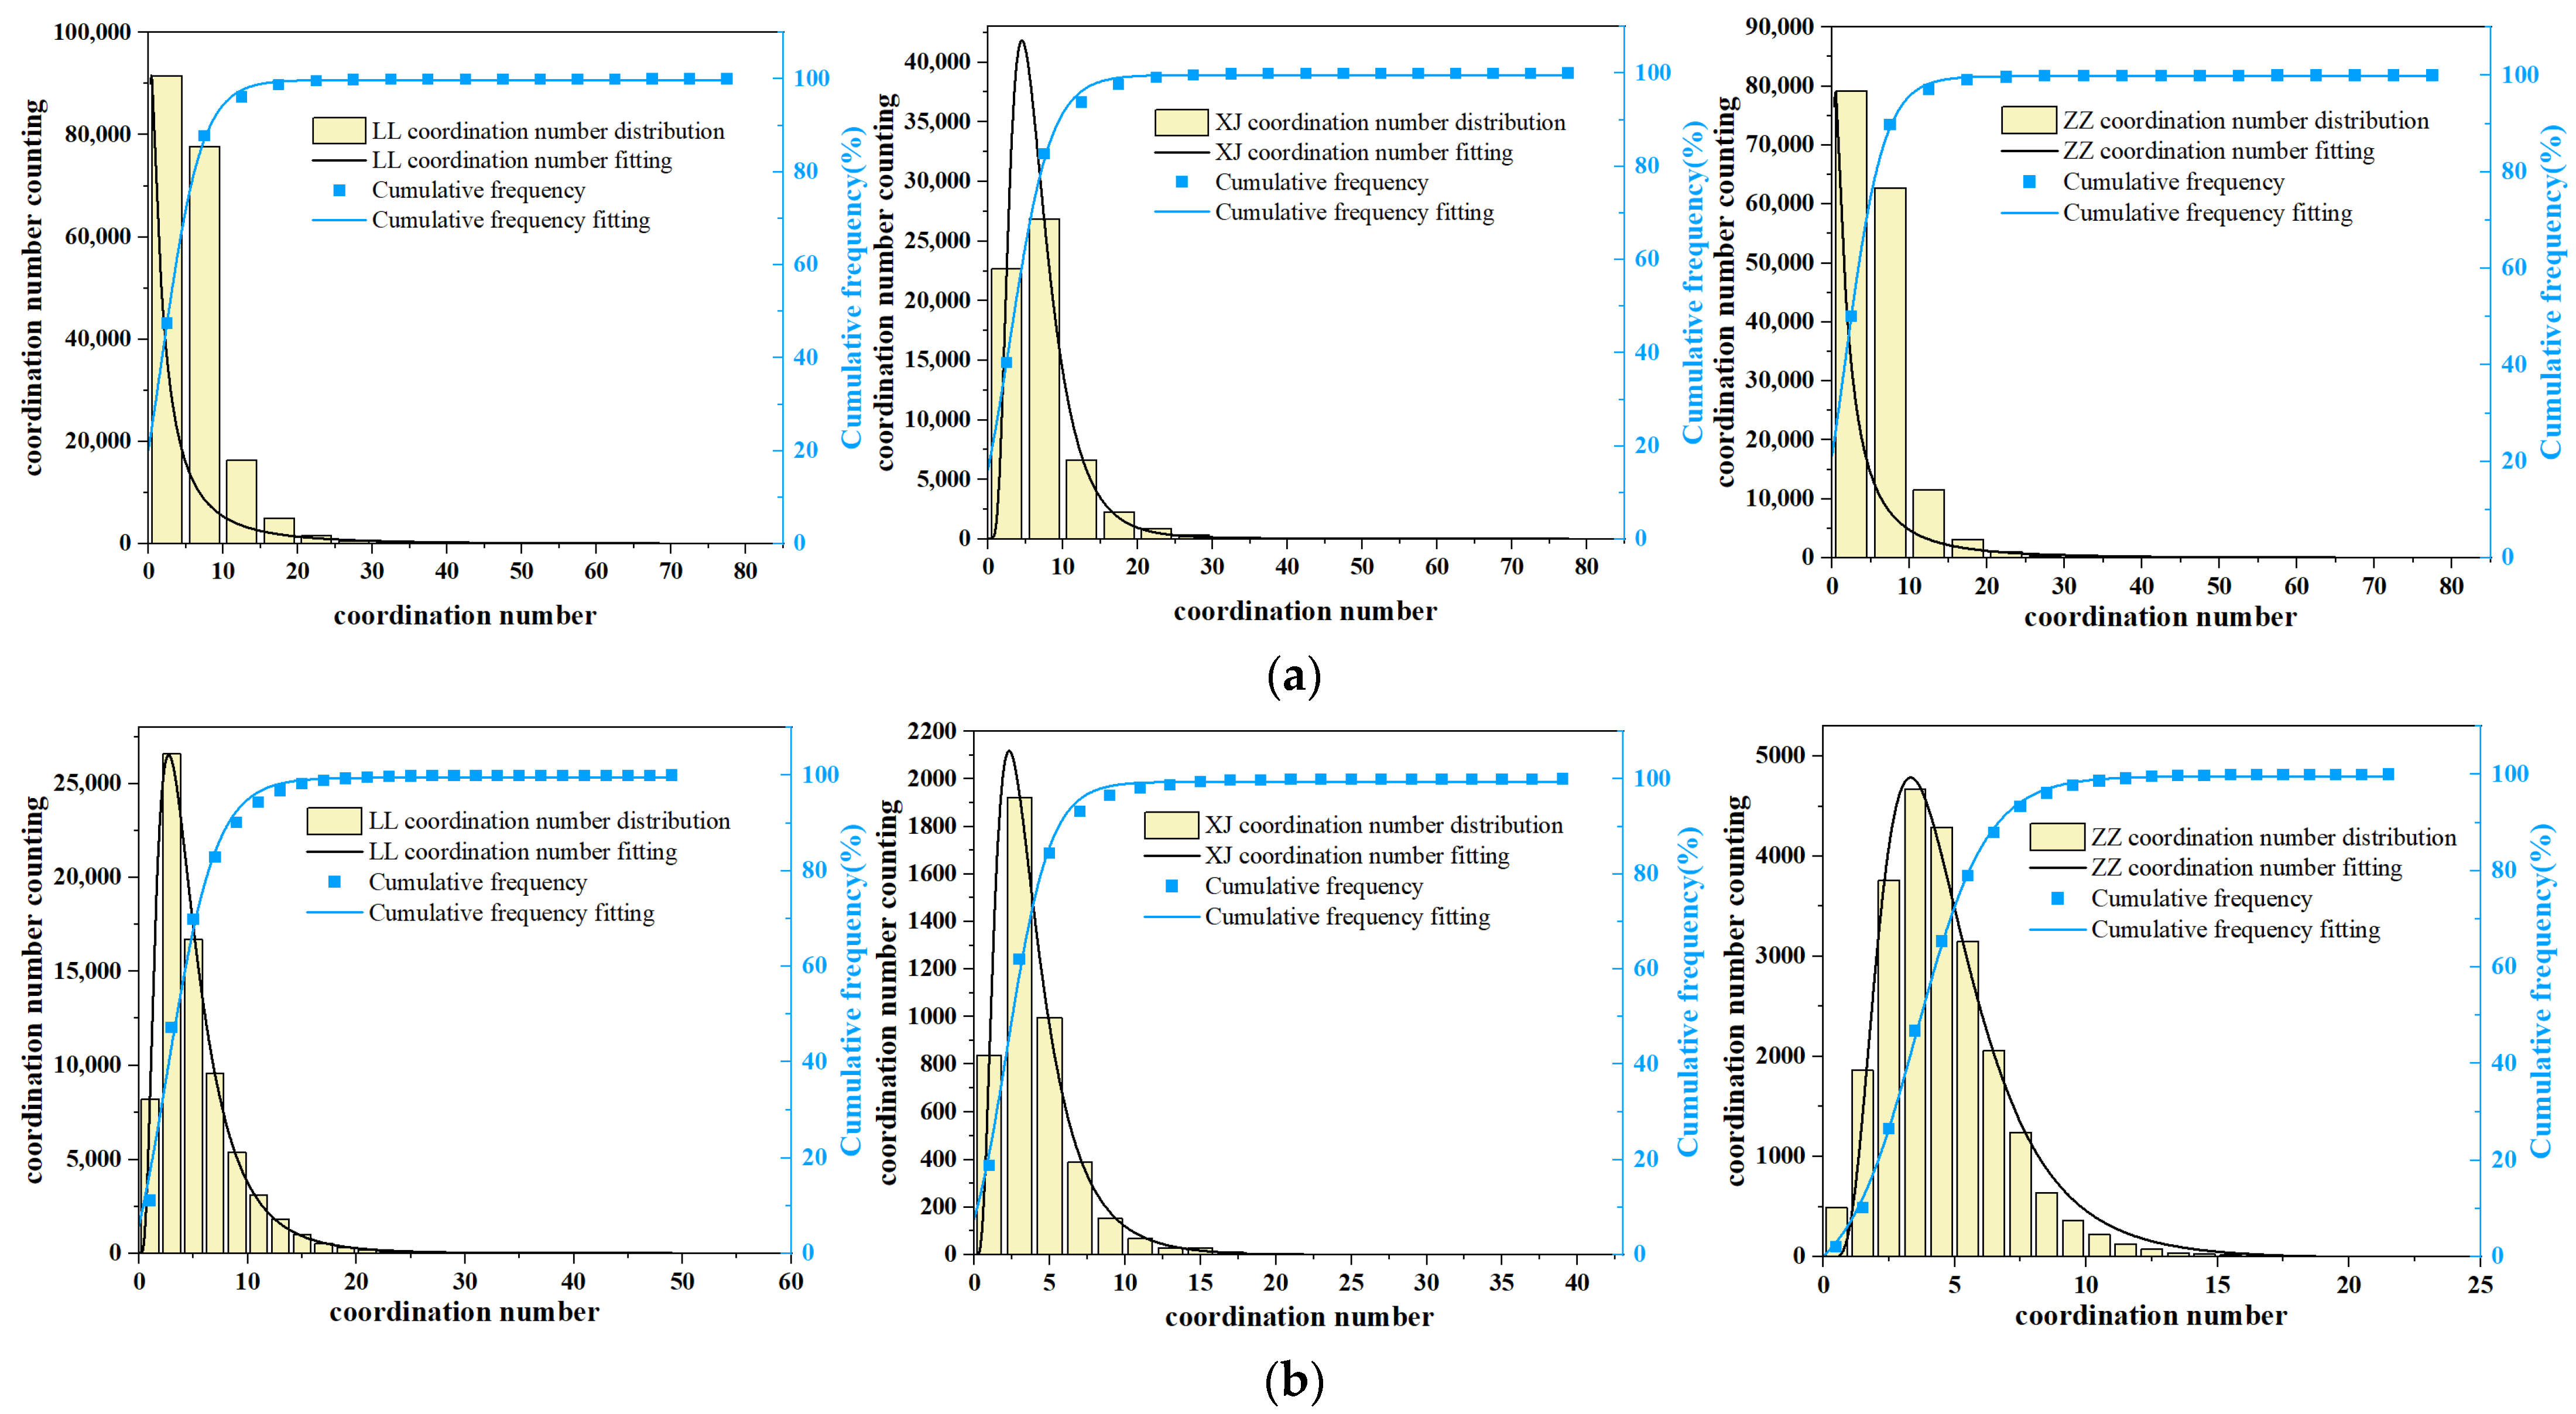
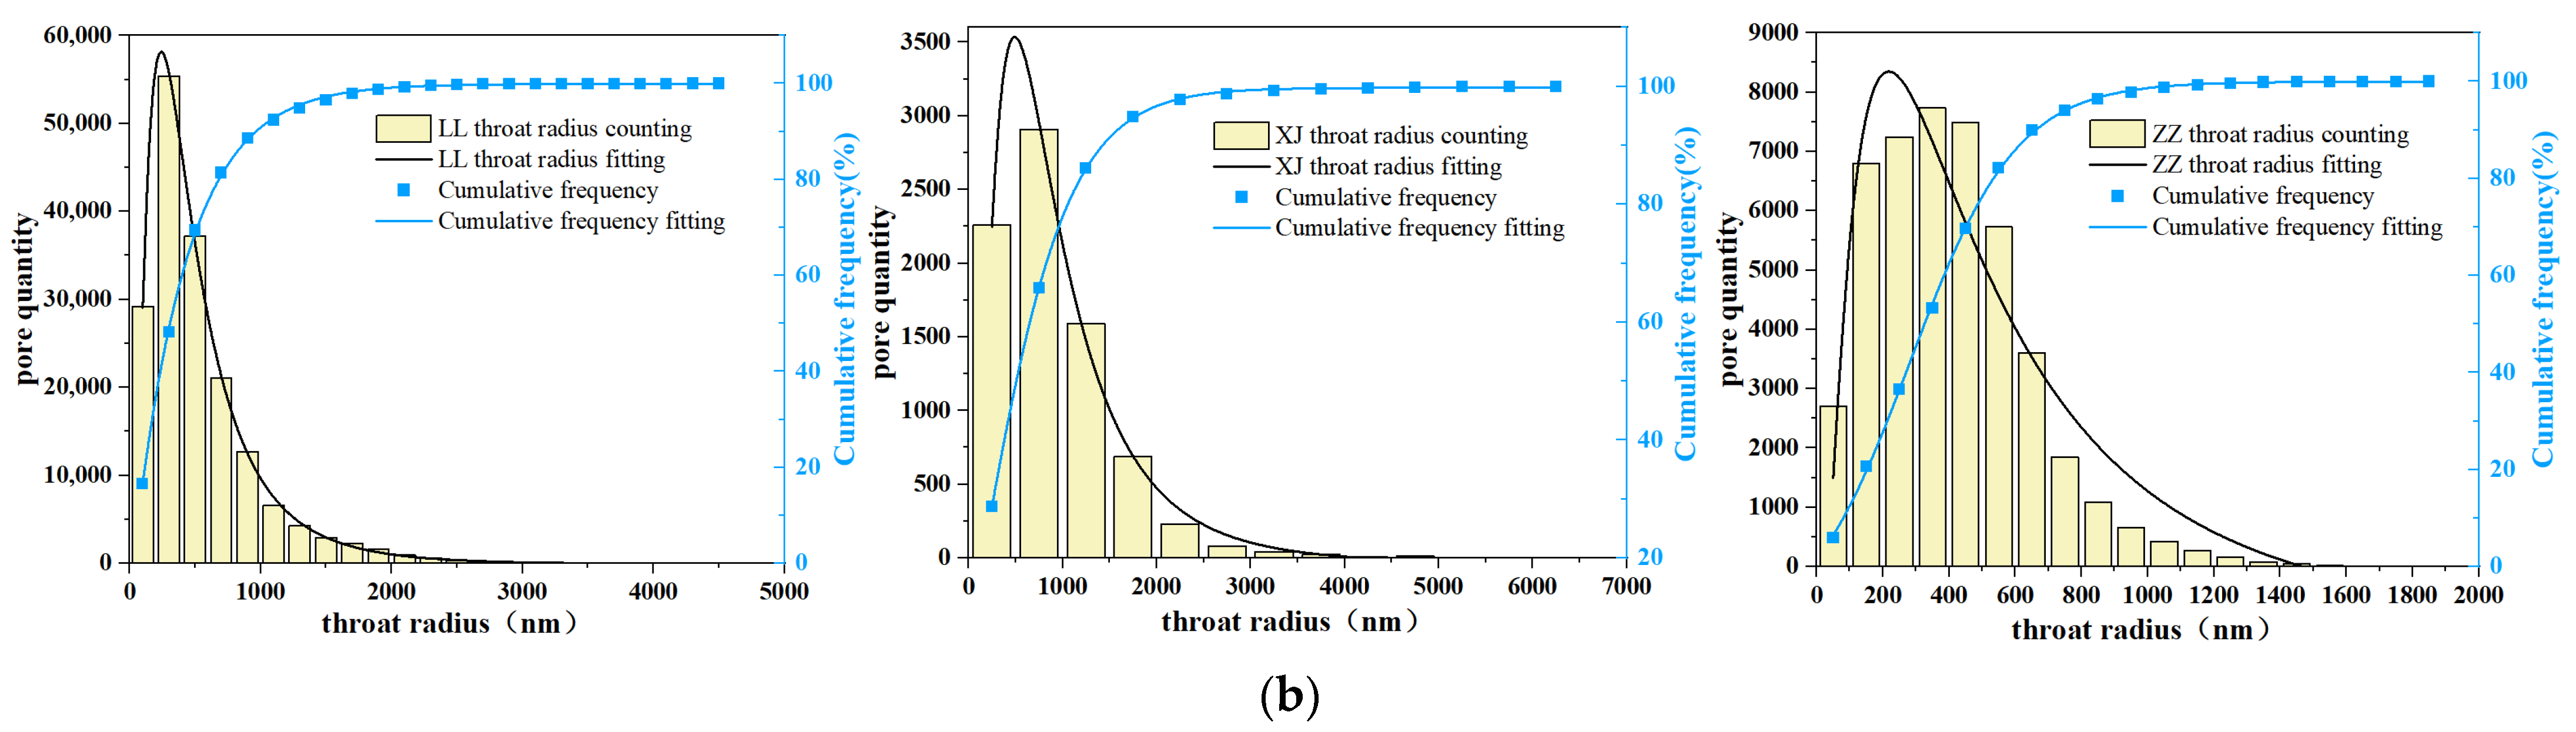
3.5. Pore Network Stick Model

The PNM stick model refers to simplified pore and throat structures with parameterized geometry and connectivity. It is extracted from a binarized 3D core pore model to accurately reflect the pore structure and its connectivity [35]. In this study, the maximum ball method was employed to extract the PNM from the 3D pore structure of the core sample. This method involves filling the pore space with spheres of different sizes. Upon identifying the local maximum ball within this spere set, the pore and throat structures within the pore network were established, with the smallest ball between the two largest balls forming the “pore-throat-pore” relationship [36,37,38,39]. The quantitative characterization of reservoir space was achieved through the extraction of pore throat parameters such as pore volume, pore area, pore equivalent radius, throat area, throat equivalent radius, and throat length [40]. The visualization results of the pore throat analysis of the coal samples using the Avizo software are shown in Figure 10.
The figure illustrates that the pores in the middle-rank coal LL were the most developed, followed by the high-rank coal ZZ, with the low-rank coal XJ exhibiting the least number of pores. This indicates that the micro–nano pores were more developed in the middle-rank and high-rank coals, while the micro-scale pores in the low-rank coal and nano-scale pores exceeding 200 nm were relatively weak. The ball–stick model diagram indicates relatively poor pore connectivity in coal samples XJ and ZZ, while the topological relationship of the pores in coal sample LL was complex, with more connected pores. Table 5 presents the pore characteristic parameters of the three coal samples. A notable difference in the number of connected pores between the different coal samples was observed.
In Table 5, under micro-CT scanning, LL exhibited the largest total number of pores (193,056), while XJ exhibited the least (59,998), which contributed to the higher porosity of LL compared with XJ. Similar trends were observed under nano-CT scanning. The coordination number reflected the connectivity of the pore network, with higher values indicating superior connectivity and permeability. Under micro-CT scanning, the overall connectivity was XJ > LL > ZZ, while, under nano-CT scanning, it was LL > ZZ > XJ, with LL exhibiting excellent overall connectivity. The average surface area of the micro–nano pores varied significantly among the three coal samples, contributing to differences in the pore structures. Among these, the average surface area of the micro–nano pores was large in the low-rank coal XJ, indicating larger pore sizes and exceptional connectivity compared with the high-rank coal ZZ. However, the high moisture content in the low-rank coal XJ hindered the coalbed methane adsorption channels, resulting in weaker adsorption capacity.
It was observed that the pore equivalent radius distribution of each sample was unimodal. Specifically, under micro-CT scanning, the pore equivalent radius was predominantly concentrated between 100 μm and 400 μm, while, under nano-CT scanning, it was primarily concentrated between 500 nm and 2500 nm, indicating excellent homogeneity within each sample. Notably, the micro-CT scan revealed a significantly higher number of medium-rank coal LL pore equivalents in the range of 100–200 μm compared with the low-rank coal XJ and high-rank coal ZZ. Thus, the nano-CT scans yielded consistent results across all the samples. A comparison between Table 5 and Figure 11 reveals that the medium-rank coal exhibited more developed large–medium pores compared with the low- and high-rank coal, while the low- and high-rank coal exhibited relatively more micro-pores. The variance between the average pore size and the maximum and minimum pore sizes, as well as the pore equivalent radius distribution histogram, indicated that the pore sizes span a wide range, resulting in an uneven distribution.
Figure 12 depicts the histogram of the coordination number distribution of each sample. The statistical analysis revealed that, under micro-CT scanning, the coordination number was concentrated between a 0 and 25 distribution, whereas, under nano-CT scanning, the coordination number was concentrated between 0 and 15. The maximum coordination number, a critical parameter describing the local pore connectivity, was 79, with an average coordination number of 5.67. Under nano-CT, the maximum value was 49, and the average coordination number was 4.76. The uneven distribution of the coordination numbers indicated that the pore throat distribution was more complex. Despite the complex distribution, particularly with coordination numbers ranging from 0 to 20, a significant portion of the samples exhibited excellent connectivity, making them suitable for seepage simulation.
Table 6 presents significant differences in the number of throats among the three coal samples. Particularly, the total number of LL throats of the medium-rank coal was notably higher under a micro-CT scan, which was 547,493. The total number of throats of the low-rank coal XJ was the least, which was 197,303. The total number of LL throats of the medium-rank coal under nano-CT scan was the largest, which was 175,483. The total number of throats of the low-rank coal XJ was the least, which was 7846. This indicated that the pore connectivity between the different samples varied significantly. In comparison with the throat equivalent radius and throat length data of the micro–nano-CT scans, the throat parameters under micro-CT exceeded those under nano-CT due to a higher total number of throat counts, resulting in a larger throat surface area.
Figure 13 depicts the throat equivalent radius distribution histogram of each sample. Notably, the throat equivalent radius distribution under a micro-CT scan exhibited a single peak, primarily concentrated within 200 μm, while, under a nano-CT scan, it was unimodal and concentrated within 2000 nm, indicating that the homogeneity of each sample was excellent. Upon comparing Table 6 and Figure 12, it was observed that the medium-rank coal LL exhibited the largest number of throats under micro–nano conditions, followed by the high-rank coal ZZ, with the low-rank coal XJ exhibiting the fewest throats. However, XJ exhibited a more compact distribution regarding the throat equivalent radius compared with ZZ, particularly with a significantly larger maximum throat equivalent radius under the nano-CT scan. This indicated that the connectivity of the low-rank coal exceeded that of the medium- and high-rank coal.

4. Discussion

The study employed micro–nano-CT scanning to analyze the pore space structures of low-, medium-, and high-rank coal samples. The scanning data volume was processed using Avizo 3D visualization software 2020.1, facilitating the establishment of the 3D reconstruction of the coal samples. Specifically, the micro-CT coal sample was determined at 1000 voxels, while the nano-CT coal sample was at 1000 voxels per volume unit (REV). The changes in porosity, fractal dimension, pore connectivity, and other parameters in the micro–nano scale of the coal samples were analyzed in detail. The specific conclusions are as follows:
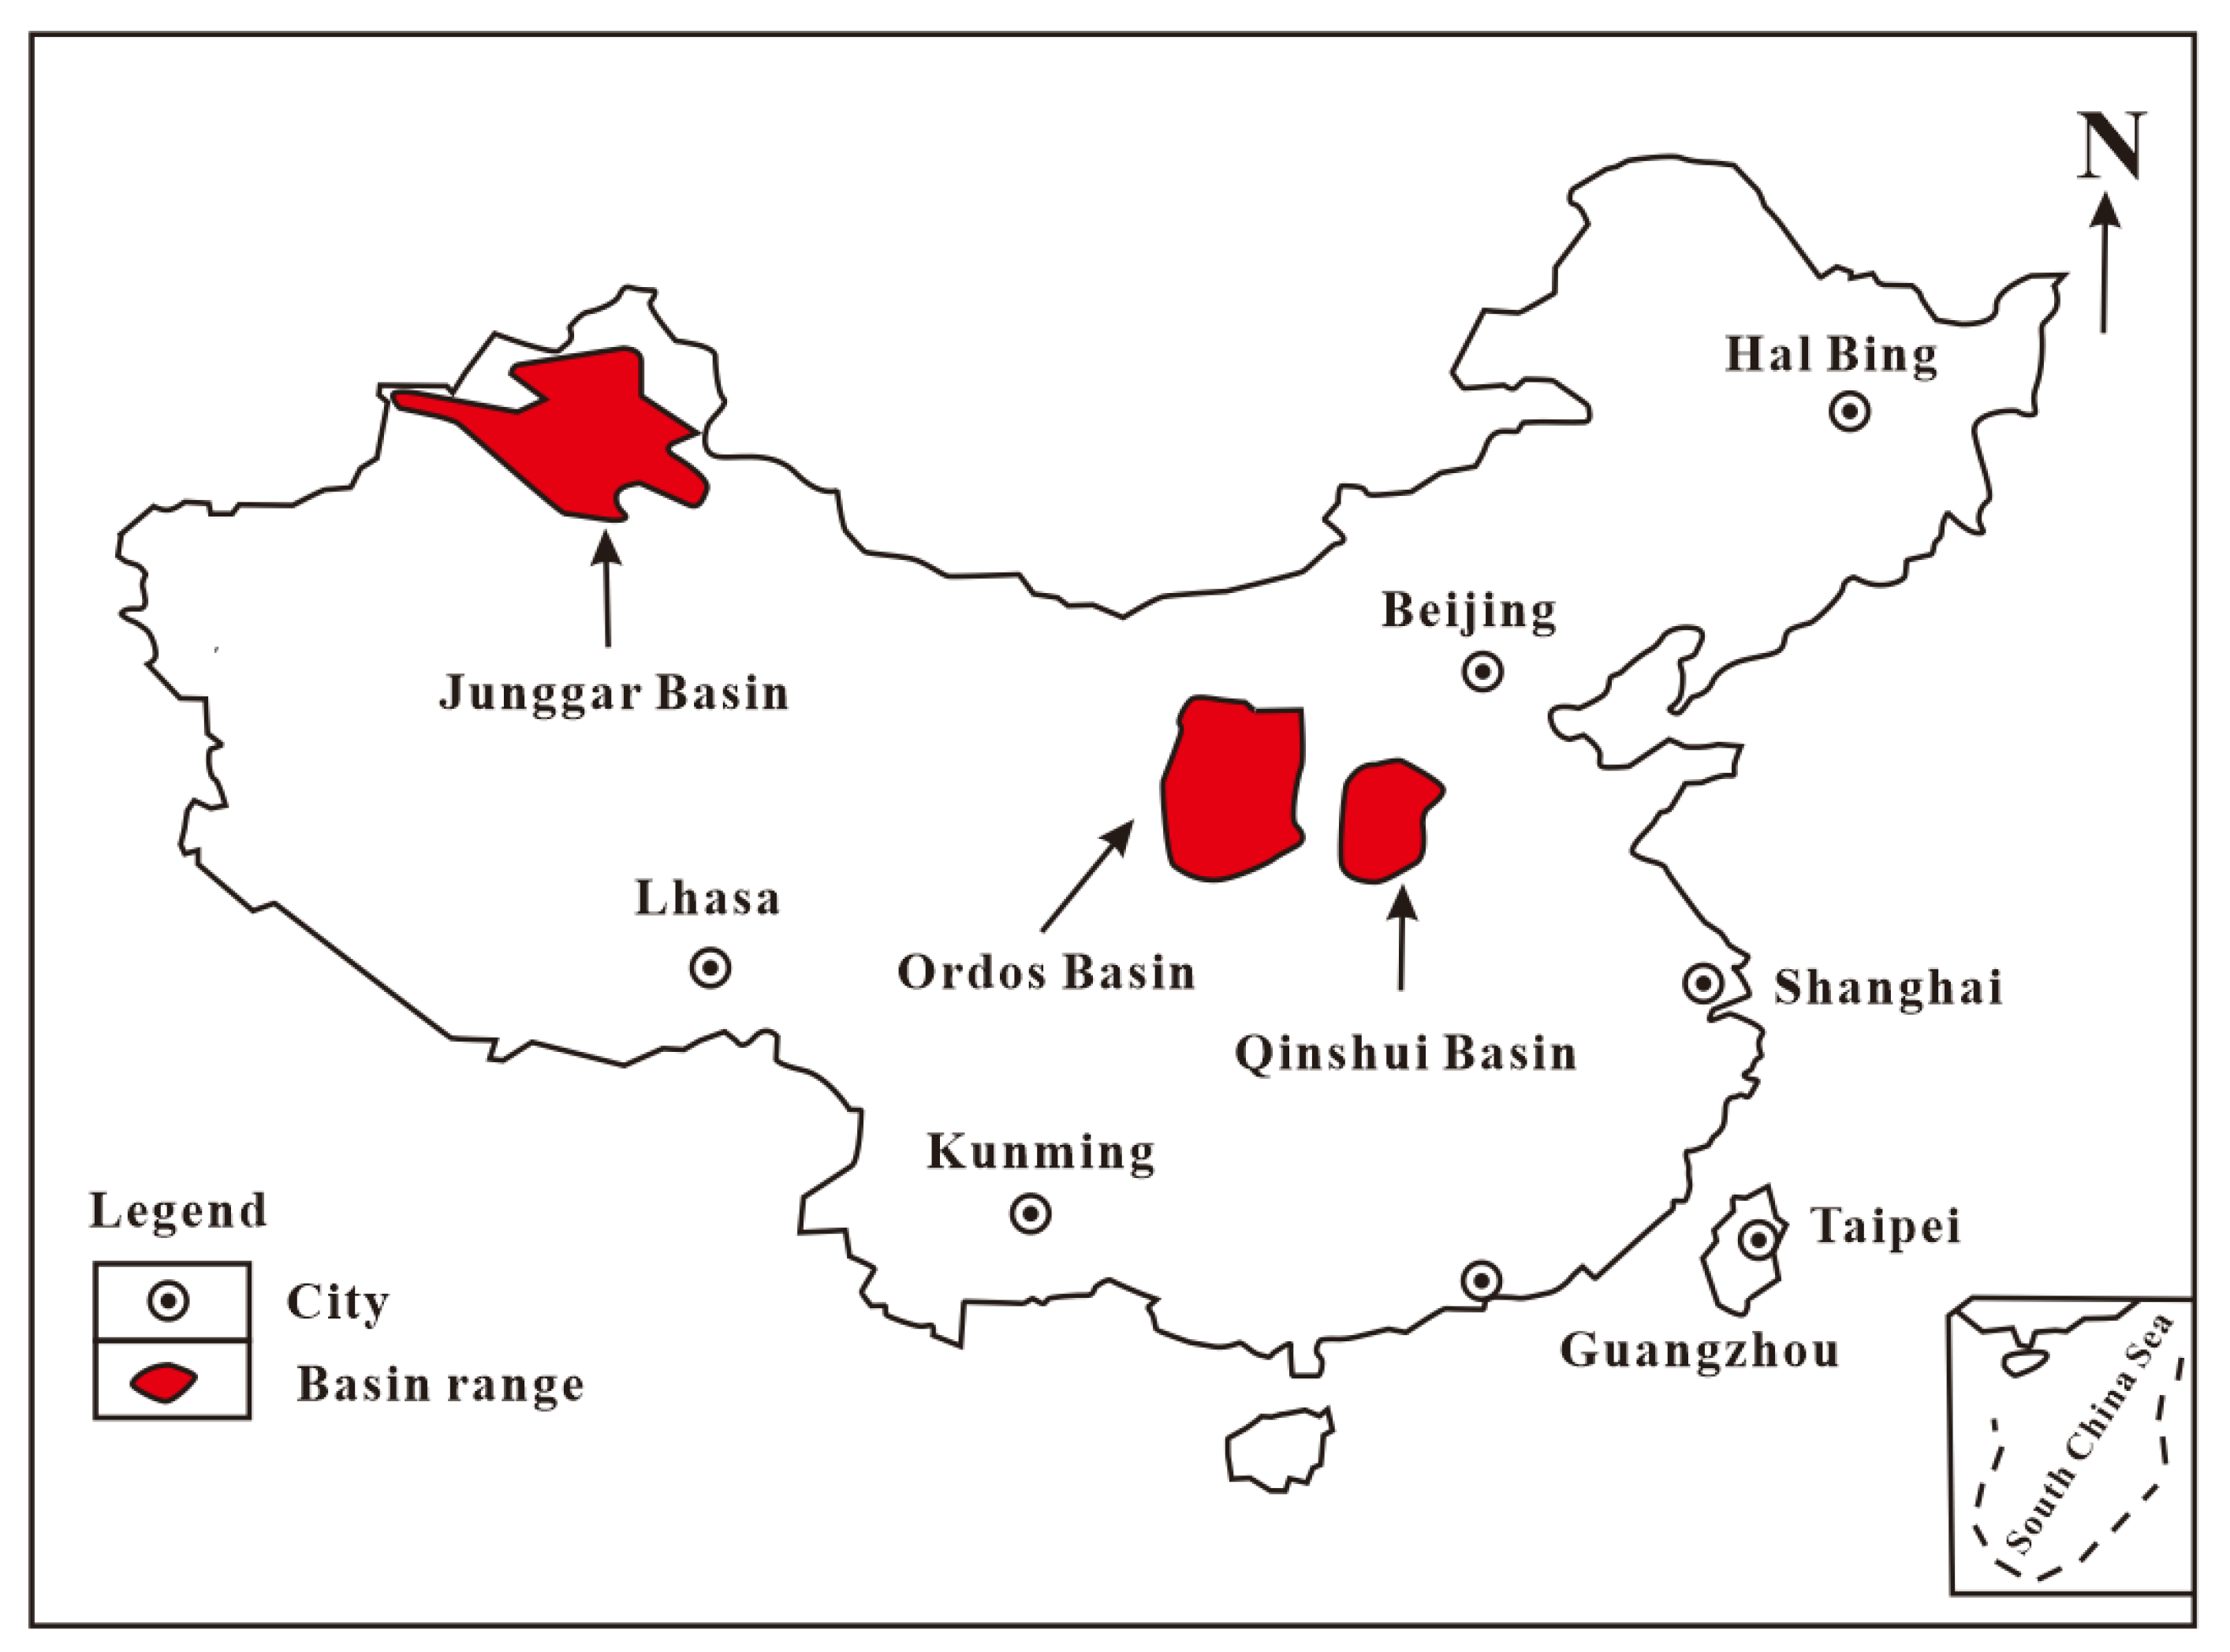
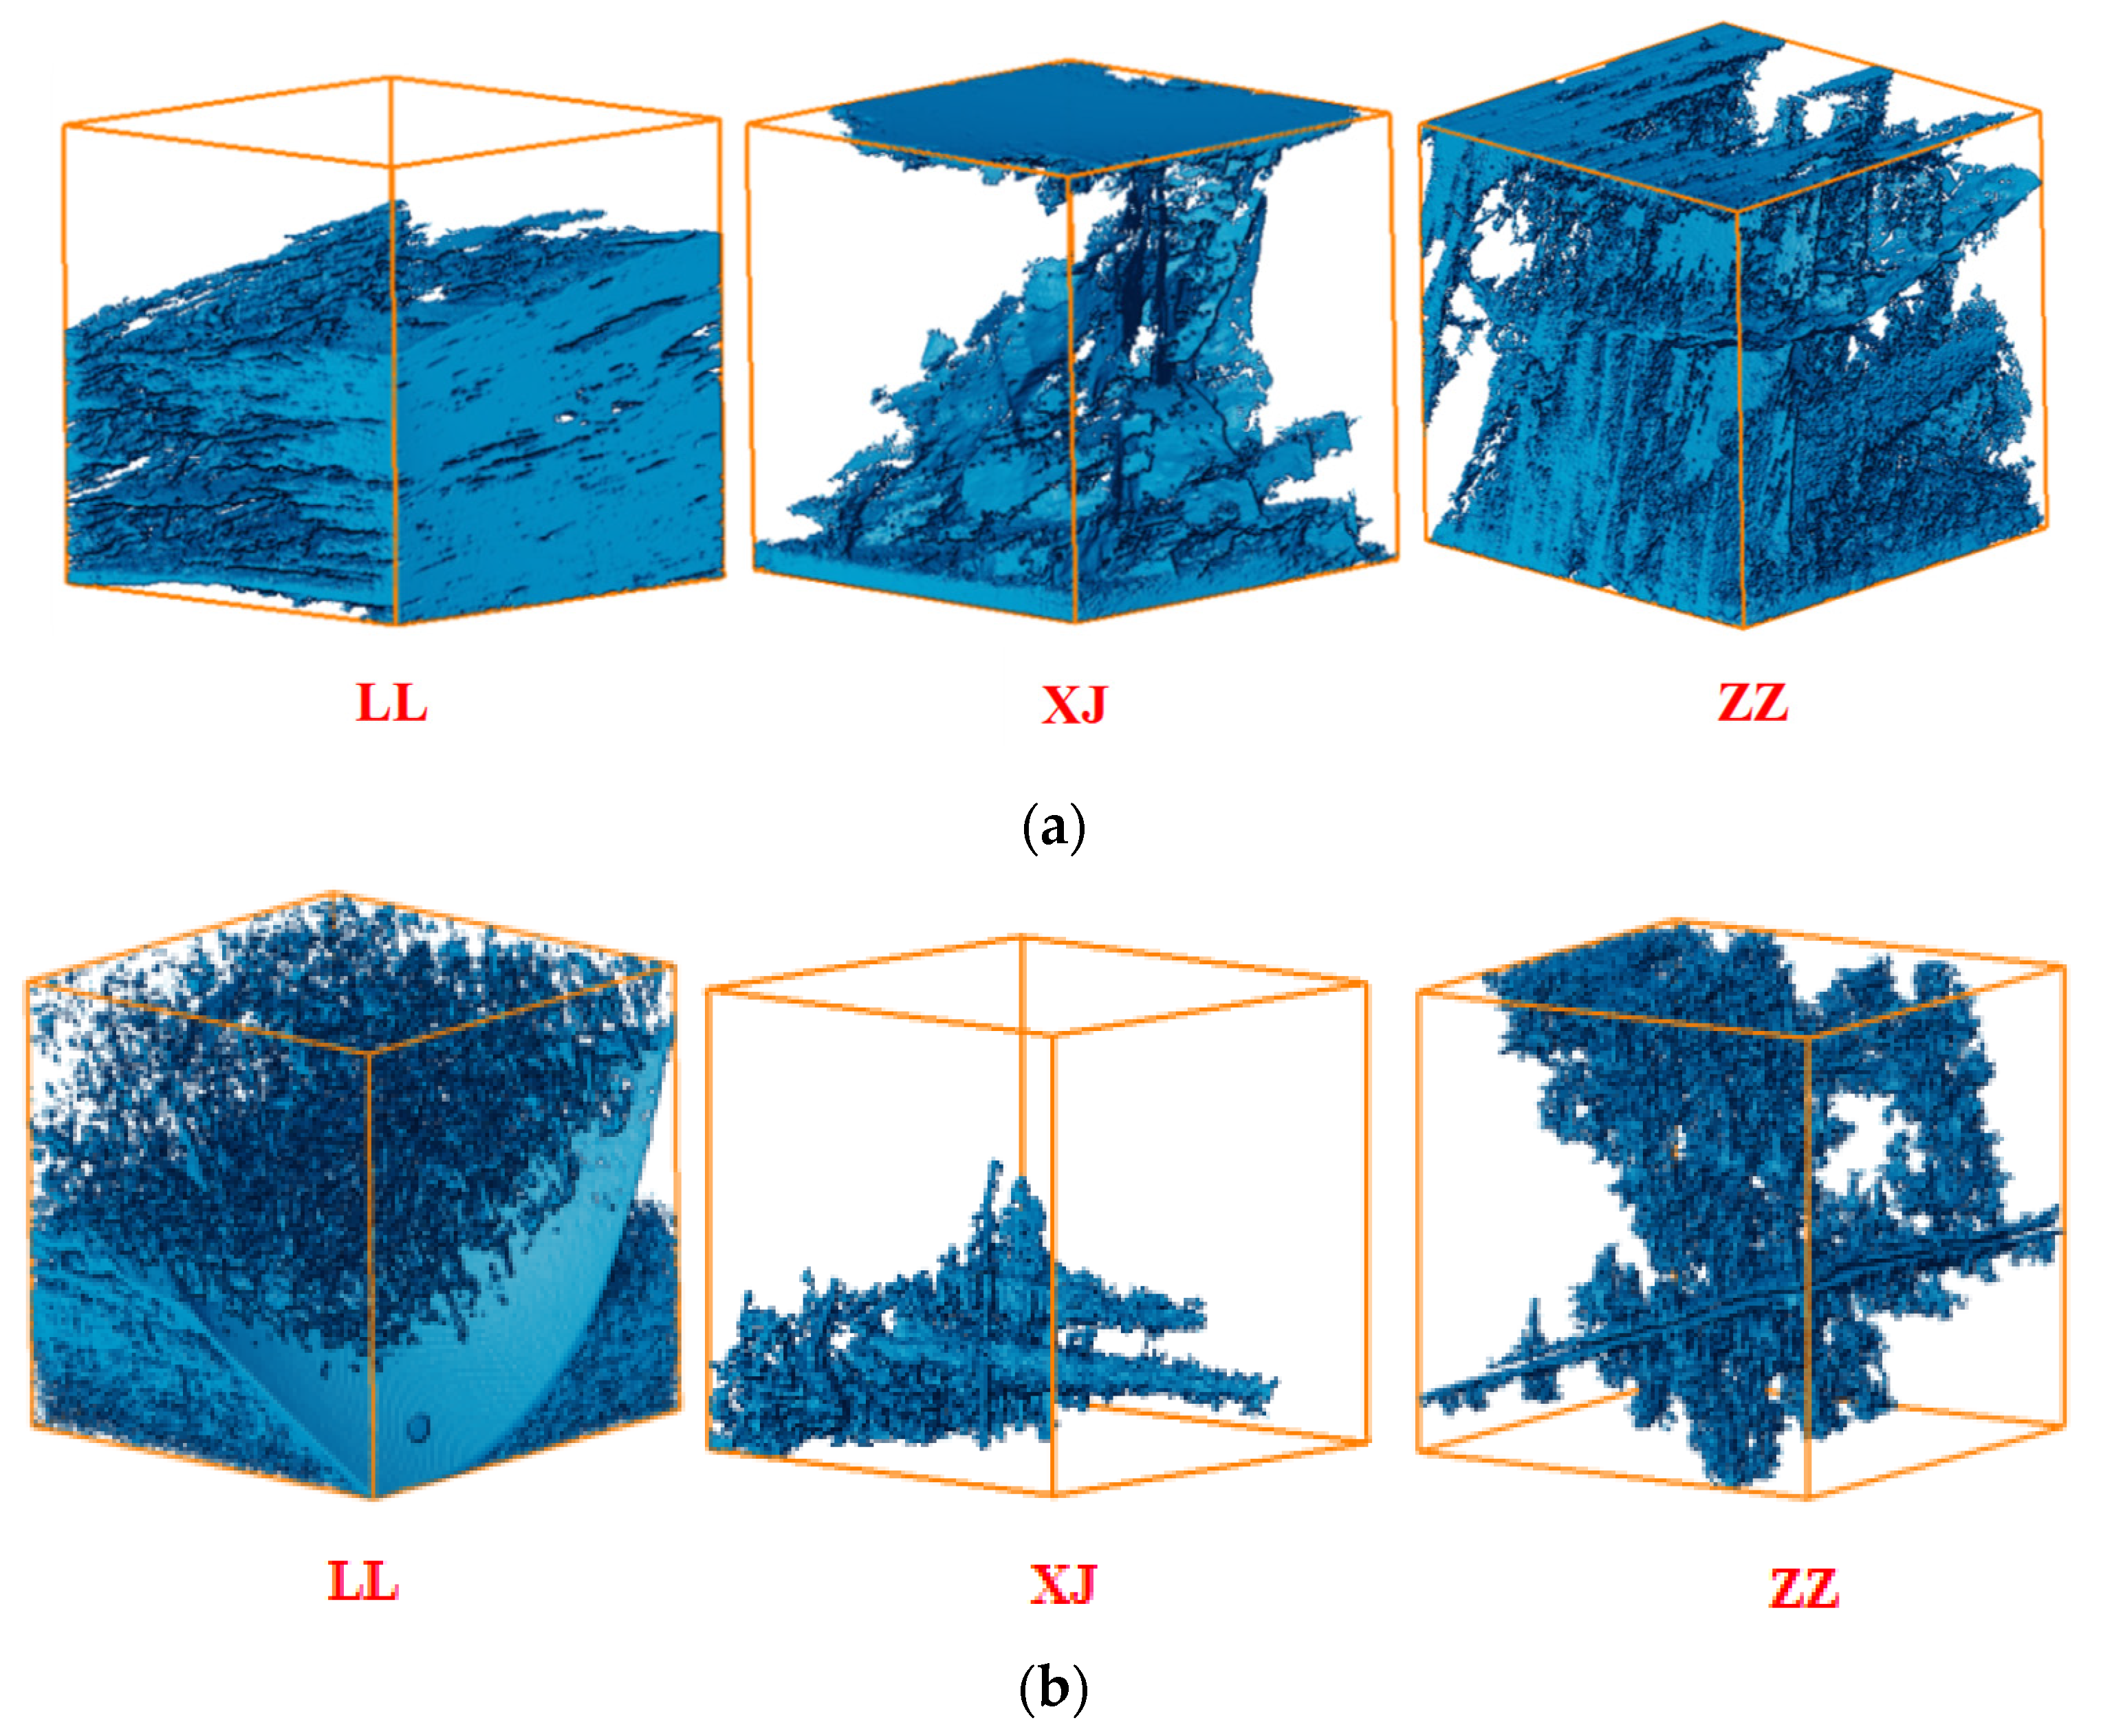
  • The comparison with the mercury injection experimental data indicated a small error in the 2D slices obtained by the CT scans, indicating the accuracy of the REV model obtained under the conditions of the nano-CT scanning. It can be seen from the pore space morphology that the middle- and high-rank coal samples are located in the central and southern part of Qinshui Basin and the eastern margin of Ordos Basin, which belong to the high yield and enrichment area of coalbed methane in China. Generally, they have favorable geological conditions, such as the enrichment of coalbed methane resources and high permeability, so the pores are more developed, while the low-rank coal samples are located in the southern margin of Junggar Basin. In some areas, the coal seams are rich in CO2, and the geological conditions are complex, so the pores are not developed. The interval of the surface porosity distribution was large, indicating strong heterogeneity with each sample.
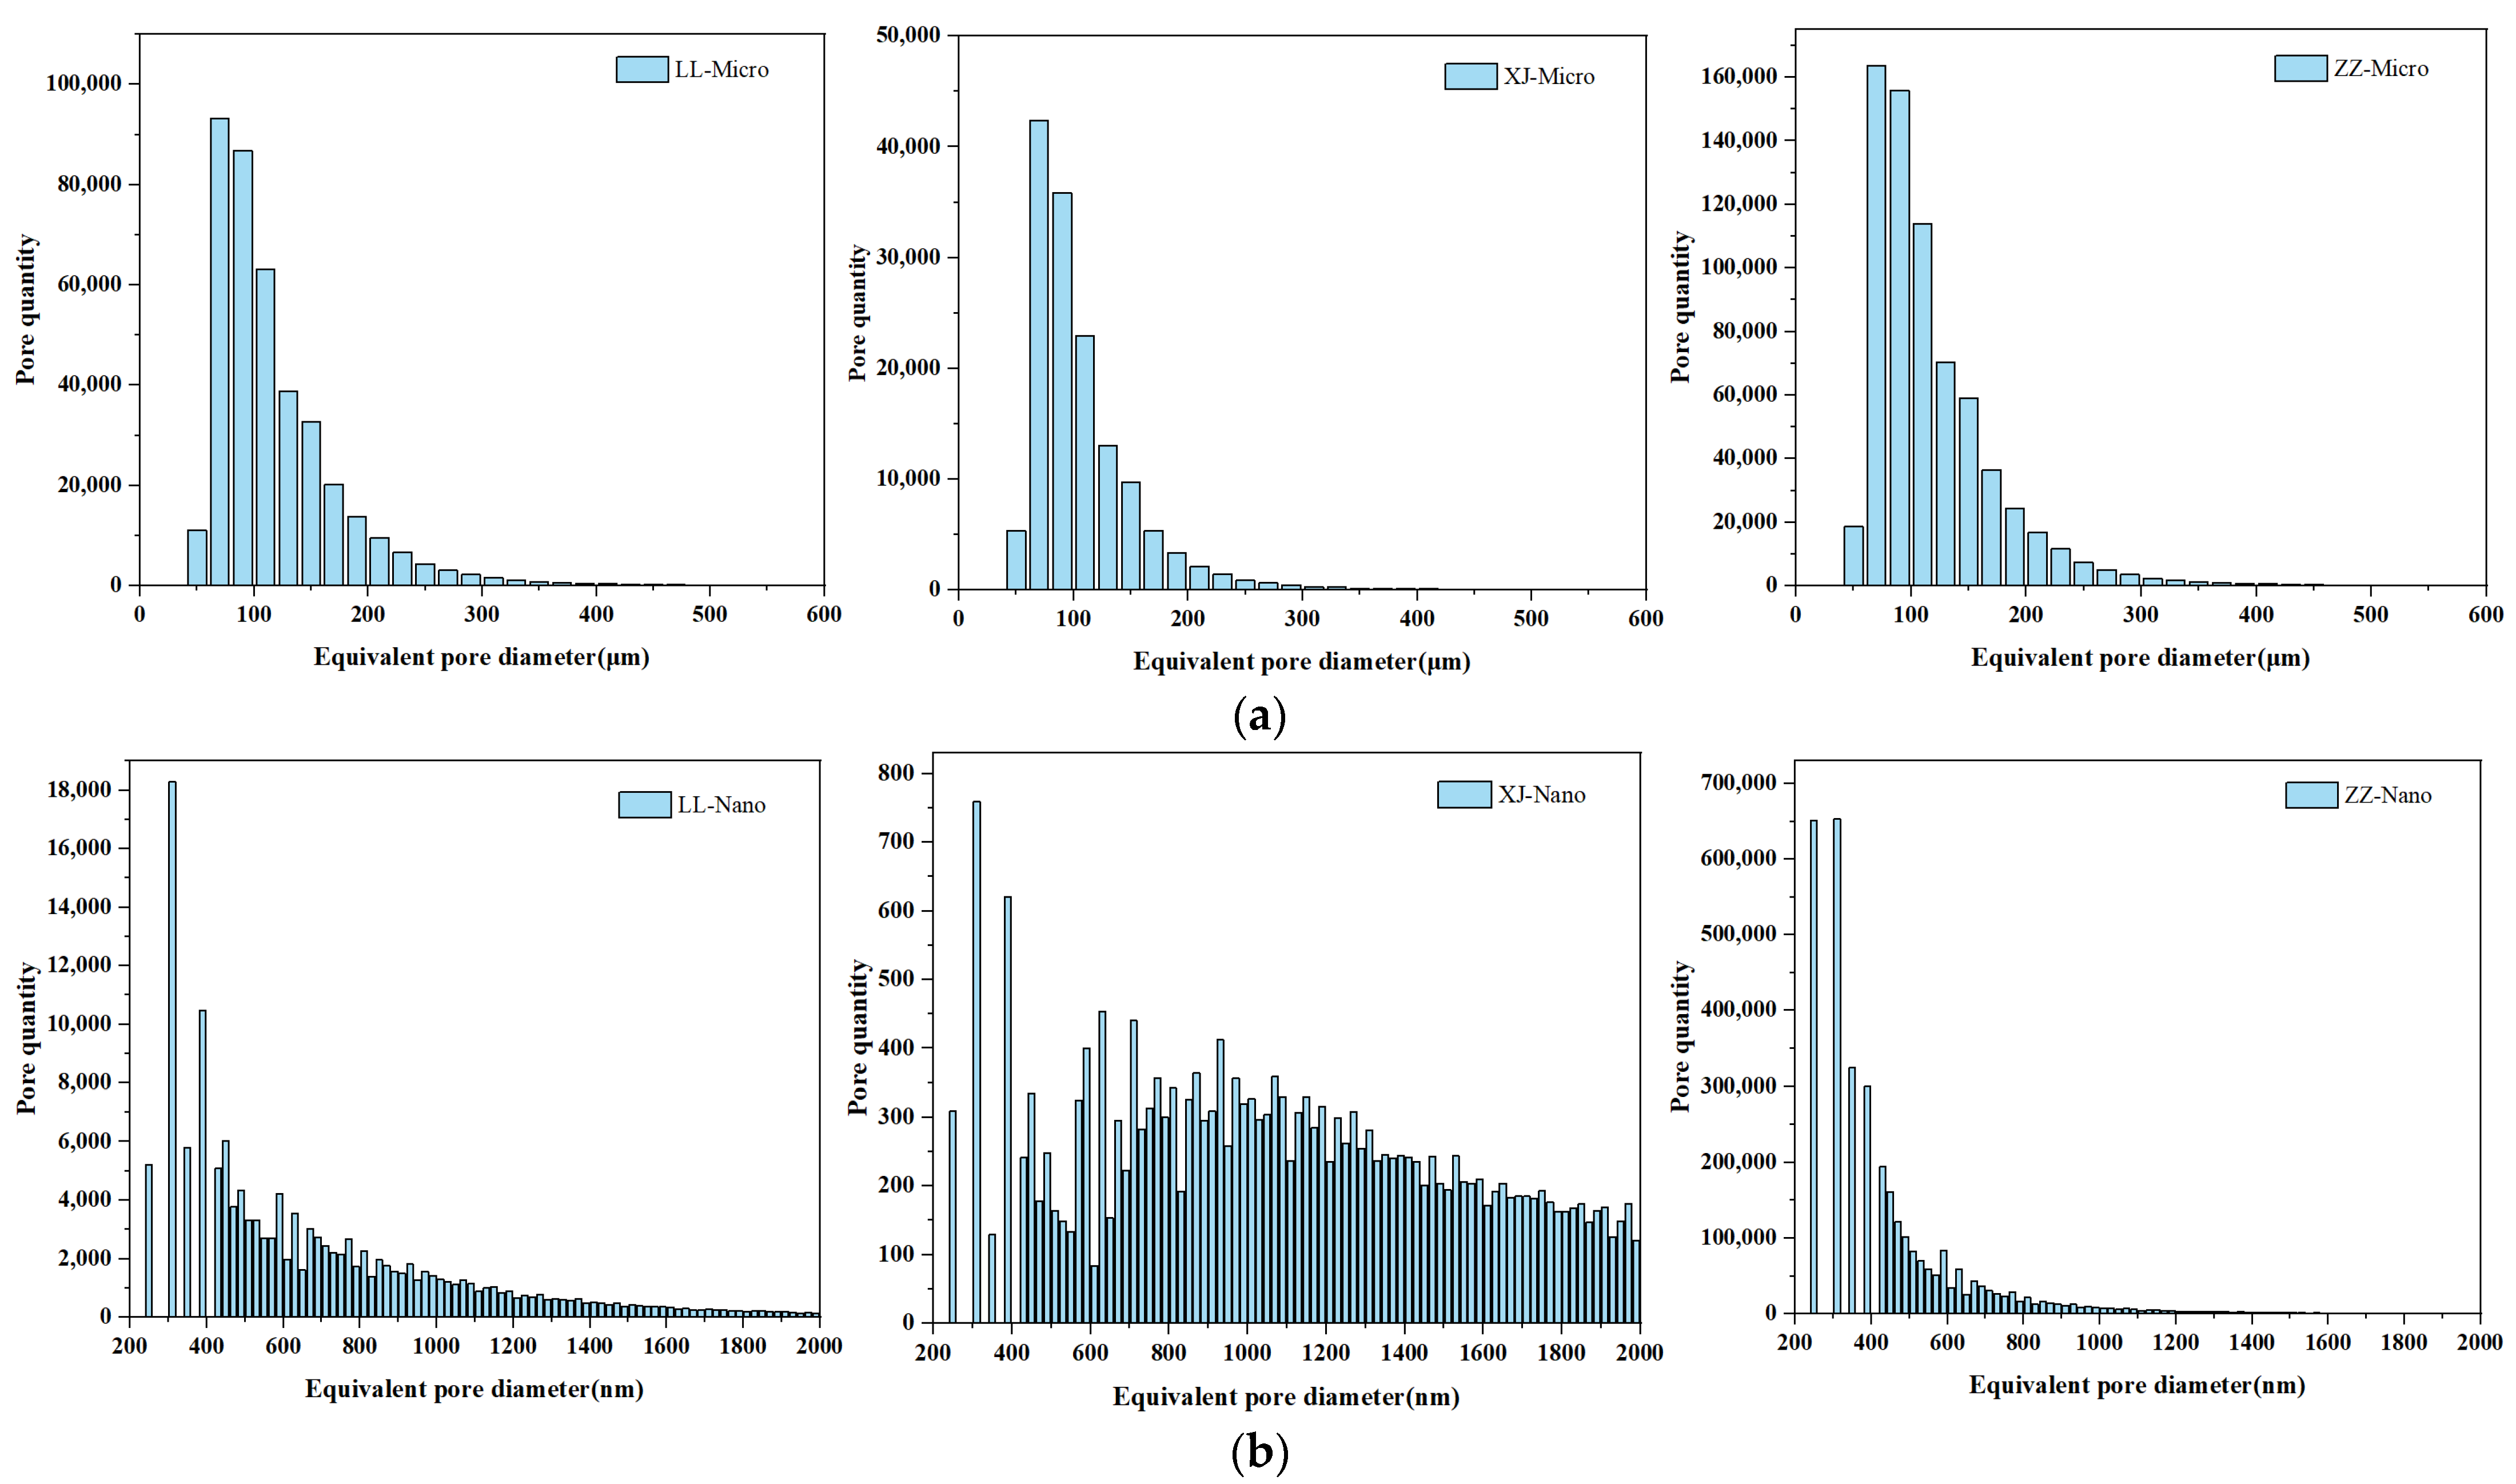
  • The micro-CT scanning revealed pores with an equivalent diameter of 50–200 μm, accounting for a large proportion in each coal sample. However, the average equivalent diameter of each sample was ~110 μm, and the maximum and minimum equivalent diameters were quite different, indicating general pore homogeneity. Whereas, under nano-CT scanning, each sample was distributed within the range of 200–2000 nm, and the equivalent diameter XJ was evenly distributed in each size.
  • The volume fractal dimension of each sample, observed under micro–nano-CT scanning, was ~2.5, with the surface fractal dimension exhibiting characteristics of fluctuation and general uniformity. The analysis of the fractal dimensions indicated that XJ exhibited the highest uniformity, while LL exhibited the roughest pore structure and lowest uniformity.
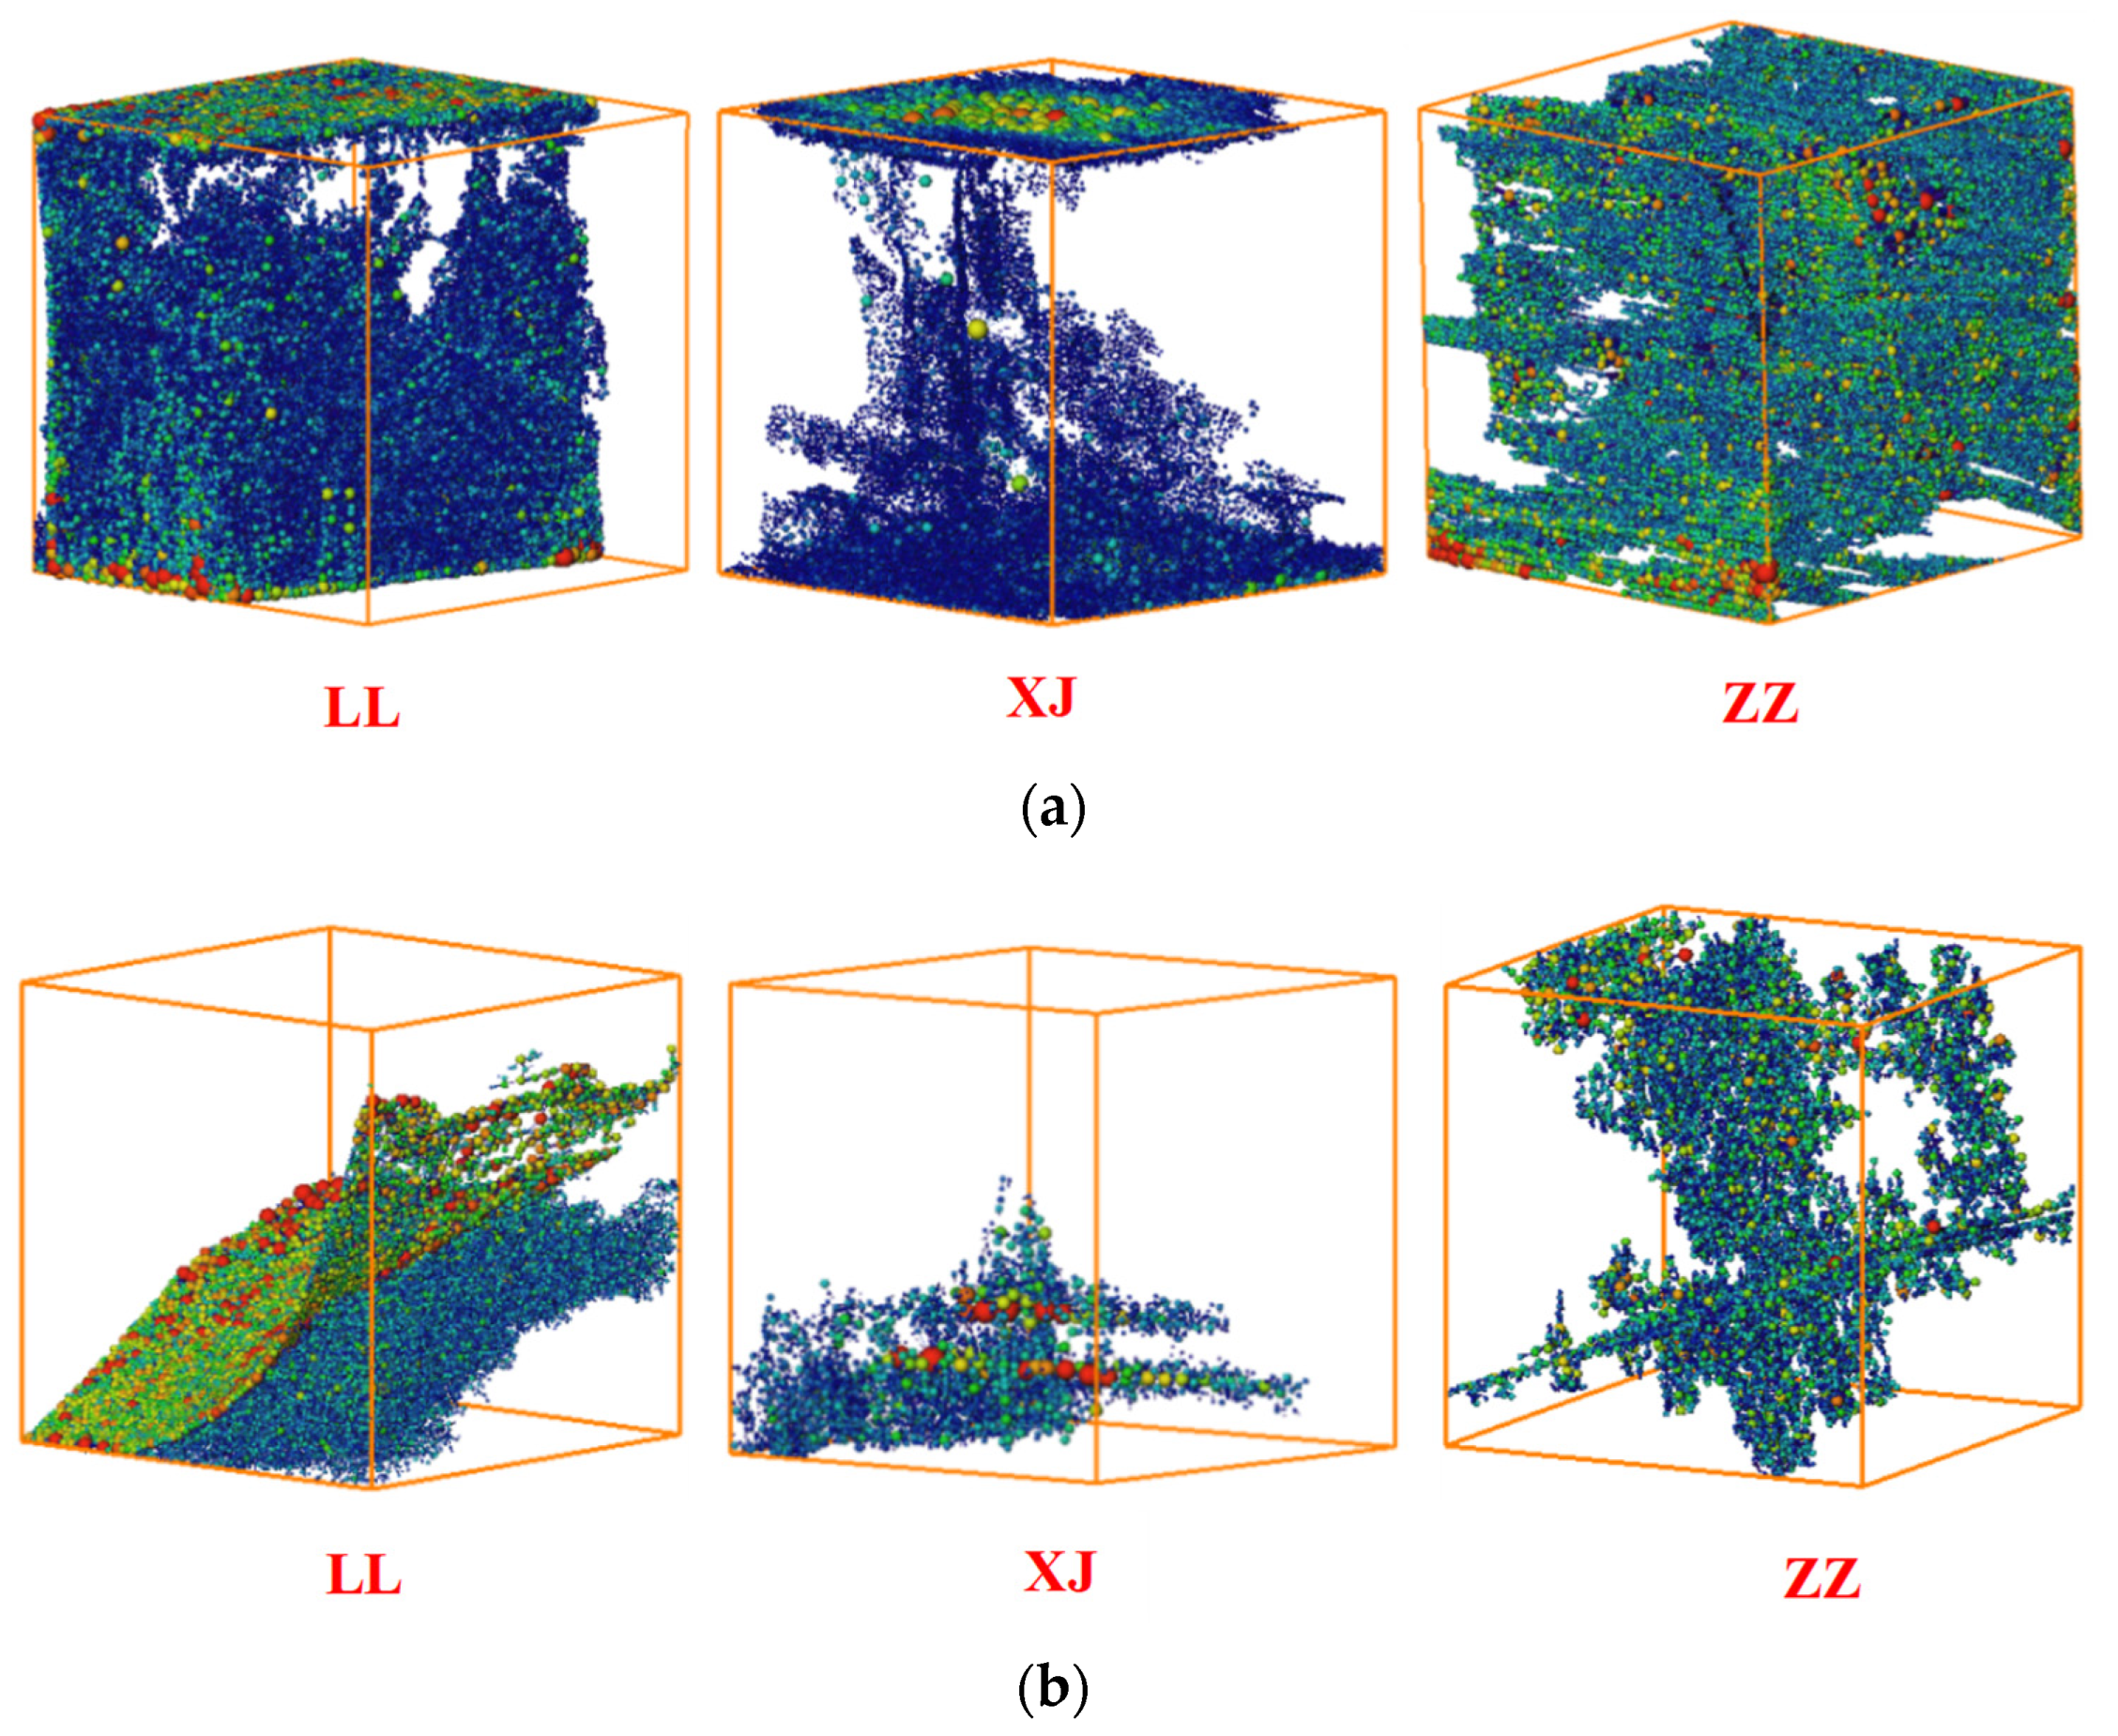
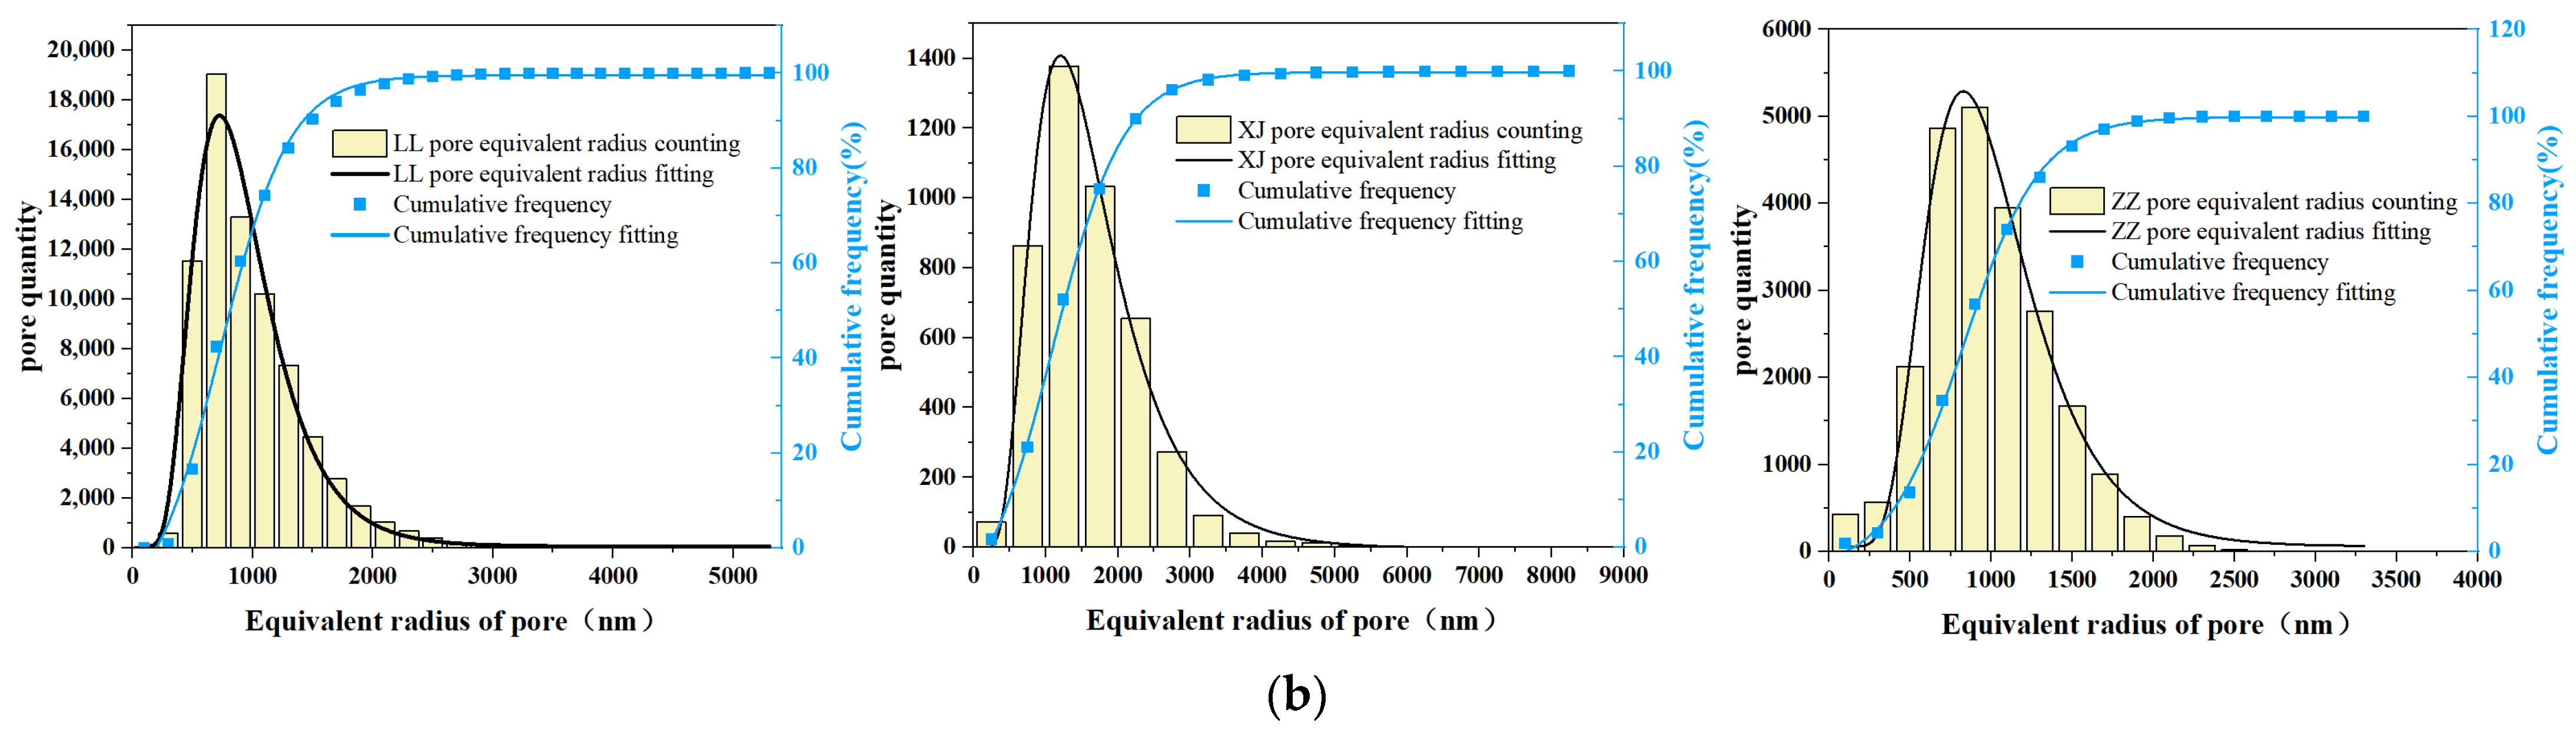
  • The pore equivalent radius and throat equivalent radius of each sample exhibited unimodal distributions. Despite the topological structure of each sample being relatively complex, the coordination number proportion of 0–20 was the largest, indicating excellent connectivity and suitability for seepage simulation. The large–medium pores of the medium-rank coal were more developed compared with the low- and high-rank coal. Thus, the low- and high-rank coal exhibited relatively more micro-pores. The analysis of the pore size distributions indicated a wide span and uneven distribution.
  • This study covers the coal samples of three low–medium–high coal ranks, but the different geographical locations will lead to some pore structure differences in coal samples of the same coal rank. Therefore, the pore structure characteristics of each coal rank in this study cannot represent the coal samples in all places. The follow-up work can select coal samples from different places for the same coal rank for the quantitative analysis of the pore structure, which is convenient for the optimization of CBM surface development blocks.

Author Contributions

Conceptualization, J.S. and Y.Y.; methodology, J.S. and Y.Y.; software, J.S. and Y.Y.; formal analysis, J.S. and Y.Y.; writing—original draft preparation, J.S. and Y.Y.; writing—review and editing, J.S., Y.Y. and Y.L.; supervision, Y.L.; funding acquisition, J.S. All authors have read and agreed to the published version of the manuscript.

Funding

This research was funded by the Natural Science Foundation of Henan Province (NO. 242300420222), the Key scientific and technological projects of Henan Provincial Department of Science and Technology (NO. 232102321139), the National Natural Science Foundation of China (NO. 42230804), the “Double First Class” Discipline Creation Project of the Department of Safety and Energy Engineering at Henan Polytechnic University (NO. AQ20230715), and the Fundamental Research Funds for the Universities of Henan Province (NO. NSFRF240811).

Institutional Review Board Statement

Not applicable.

Informed Consent Statement

Not applicable.

Data Availability Statement

The original contributions presented in the study are included in the article, further inquiries can be directed to the corresponding author.

Conflicts of Interest

The authors declare no conflicts of interest.

References

  1. Shen, Y.; Wang, X.; Zhao, C. Experimental study on multi-scale pore structure characteristics of tar-rich coal in Yushenfu mining area. Coalf. Geol. Explor. 2021, 49, 33–41. [Google Scholar]
  2. Guo, H.; Wang, K.; Cui, H. Experimental investigation on the pore and fracture structure of the reconstructed coal and its fractal characteristics. J. China Univ. Min. Technol. 2019, 48, 1206–1214. [Google Scholar]
  3. Ding, L.; Zhao, M.; Wei, Y. Impact from Medium to Low Rank Coal Vitrinite Micropore Structure on Methane Adsorptivity. China Coal Geol. 2021, 33, 17–21+30. [Google Scholar]
  4. Wang, L.; Wang, A.; Chen, L. Dynamic characteristics and crack propagation characteristics of gas-bearing coal under cyclic impact. J. Rock Mech. Eng. 2023, 42, 2628–2642. [Google Scholar]
  5. Nie, B.; Zhao, D.; Wang, M. Micro-damage model of gas-bearing coal under load and instability identification criteria. Coal J. 2024, 49, 707–719. [Google Scholar]
  6. Li, H.; Yao, Z.; Li, N. Analysis of Main Geological Controlling Factors of CBM Occurrence in Yanan Formation of Binchang Mining Area. China Coalbed Methane 2019, 16, 14–18. [Google Scholar]
  7. Liu, H.; Song, D.; He, X. Influence of coalification on microstructure characteristics of coal surface. Chin. J. Saf. Sci. 2020, 30, 121–127. [Google Scholar]
  8. Mou, P.; Pan, J.; Niu, Q.; Wang, Z.; Li, Y.; Song, D. Coal Pores: Methods, Types, and Characteristics. Energy Fuels 2021, 35, 7467–7484. [Google Scholar] [CrossRef]
  9. Jia, M.; Huang, W.; Li, Y. Quantitative Characterization of Pore Structure Parameters in Coal Based on Image Processing and SEM Technology. Energies 2023, 16, 1663. [Google Scholar] [CrossRef]
  10. Li, X.; Shao, Y.; Zhu, Y. Fractal Characteristics of Coal and Rock Pore Based on Low Temperature Liquid Nitrogen Adsorption Method. Sci. Technol. Eng. 2022, 22, 65–70. [Google Scholar]
  11. Yang, M.; Liu, L.; Zhang, X. Nuclear magnetic resonance experimental study on pore structure and fluid characteristics of coal at different ranks. Chin. J. Saf. Sci. 2021, 31, 81–88. [Google Scholar]
  12. Li, Y.; Zhang, Y.; Zhang, L. Characterization on pore structure of tectonic coals based on the methods of mercury injection, carbon dioxide adsorption and nitrogen adsorption. J. Coal 2019, 44, 1188–1196. [Google Scholar]
  13. Nie, B.; Ma, Y.; He, X. Micro-scale mechanism of coal and gas outburst: A preliminary study. J. China Univ. Min. Technol. 2022, 51, 207–220. [Google Scholar]
  14. Zhao, H.; Qin, F.; Li, Z. The influence of coal seam nano-pore structure on gas migration characteristics. J. Min. Saf. Eng. 2022, 39, 1256–1264+1271. [Google Scholar]
  15. Fan, C.; Jiang, X.; Fan, N. Scale Effect of Coal Porosity and Permeability Characteristics Based on CT 3D Reconstruction from a Micro perspective. Energy Fuels 2024, 38, 1813–1821. [Google Scholar] [CrossRef]
  16. Shang, S.; Gao, K.; Gao, Q. Influence of Fracture Development on Seepage Characteristics of Low porosity Rocks. Sci. Technol. Eng. 2023, 23, 9809–9819. [Google Scholar]
  17. Fan, N.; Wang, J.; Deng, C. Quantitative characterization of coal microstructure and visualization seepage of macropores using CT-based 3D reconstruction. J. Nat. Gas Sci. Eng. 2020, 81, 103384. [Google Scholar] [CrossRef]
  18. Wang, H.; Shi, Y.; Xu, D. Unconventional reservoirs pore structure characterization techniques and progress. Oil Gas Geol. Recovery 2019, 26, 21–30. [Google Scholar]
  19. Zhang, W.; Qiu, L. Characterization and Analysis of Pore Structure of Coal Based on CT 3D Reconstruction. Coal Technol. 2018, 37, 327–329. [Google Scholar]
  20. Wang, Y.; Meng, Q.; Gao, L. Research on Reconstruction and Quantitative Characterization of Three-dimensional Cracks in Pyrolysis Anthracite. J. Taiyuan Univ. Technol. 2021, 52, 211–218. [Google Scholar]
  21. Wang, X.; Pan, J.; Wang, K. Characteristics of micro-CT scale pore-fracture of tectonic ally deformed coal and their controlling effect on permeability. J. Coal 2023, 48, 1325–1334. [Google Scholar]
  22. Hao, J.; Shu, L.; Huo, Z.; Fan, Y.; Wu, S.; Li, Y.; Guo, X. Quantitative characterization of pore-fracture structure of medium and high-rank coal based on Micro-CT technology. Int. J. Coal Prep. Util. 2024, 44, 358–375. [Google Scholar] [CrossRef]
  23. GB 474-2008; Method for Preparation of Coal Sample. General Administration of Quality Supervision: Beijing, China, 2008.
  24. GB/T212-2008; Proximate Analysis of Coal. General Administration of Quality Supervision: Beijing, China, 2008.
  25. GB/T476-2008; Determination of Carbon and Hydrogen in Coal. General Administration of Quality Supervision: Beijing, China, 2008.
  26. GB/T19227-2008; Determination of Nitrogen in Coal. General Administration of Quality Supervision: Beijing, China, 2008.
  27. GB/T1574-2007; Test Method for Analysis of Coal Ash. General Administration of Quality Supervision: Beijing, China, 2007.
  28. Lyu, H.; Zou, J.; Zhao, J. Review on Development of Nano-Computed Tomography Imaging Technology. Adv. Laser Optoelectron. 2020, 57, 9–24. [Google Scholar]
  29. Ding, Z.; Gao, C.; Wang, Y. Quantitative analysis of meso-structured and representative elementary volume determination of low rank long flame coal. Coal Sci. Technol. 2023, 51, 116–129. [Google Scholar]
  30. Ding, Z.; Li, X.; Tang, Q. Study on the correlation between fractal characteristics of pore distribution and strength of sandstone particles. J. Rock Mech. Eng. 2020, 39, 1787–1796. [Google Scholar]
  31. Wu, J. Characteristics of coal micropores and their relationship with hydrocarbon migration and accumulation. China Sci. (B) 1993, 01, 77–84. [Google Scholar]
  32. Guo, Y.; Chen, X.; Chen, B. Analysis of foamed concrete pore structure of railway roadbed based on X-ray computed tomography. Constr. Build. Mater. 2021, 273, 121773. [Google Scholar] [CrossRef]
  33. Yang, Y.; Wang, D.; Yang, J. Fractal analysis of CT images of tight sandstone with anisotropy and permeability prediction. J. Pet. Sci. Eng. 2021, 205, 108919. [Google Scholar] [CrossRef]
  34. Guan, Q.; Dong, D.; Sun, S. Fractal characteristics of organic-rich shale pore structure and its geological implications: A case study of the Lower Silurian Longmaxi Formation in the Weiyuan block, Sichuan Basin. Nat. Gas Ind. 2024, 44, 108–118. [Google Scholar]
  35. Dong, H.; Blunt, M.J. Pore-network extraction from micro-computerized-tomography images. Phys. Rev. E 2009, 80(Pt2), 036307. [Google Scholar] [CrossRef] [PubMed]
  36. Niu, Y.; Cheng, M.; Cheng, Y. Reservoir modification effect of Ophiomorpha-Talassinoides ichnofabric in the Neogene Sanya Formation in northern Qiongdongnan Basin. Palaeogeography 2023, 25, 1407–1420. [Google Scholar]
  37. Sheng, J.; Yang, X.; Li, G. Application of Multiscale X-CT Imaging Digital Core Technique on Observing Micro-pore Structure of Carbonate Reservoirs. Mod. Geol. 2019, 33, 653–661+671. [Google Scholar]
  38. Silin, D.; Patzek, T. Pore space morphology analysis using maximal inscribed spheres. Phys. A Stat. Mech. Its Appl. 2006, 371, 336–360. [Google Scholar] [CrossRef]
  39. Shi, X.; Pan, J.; Pang, L. 3D Microfracture network and seepage characteristics of low-volatility bituminous coal based on Nano-CT. J. Nat. Gas Sci. Eng. 2020, 83, 103556. [Google Scholar] [CrossRef]
  40. Zhang, K.; Cheng, Y.; Wang, L. Pore network structure characterization based on gas occurrence and migration in coal. Coal J. 2022, 47, 3680–3694. [Google Scholar]
Figure 1. Distribution map of sampling sites.
Applsci 14 05198 g001
Figure 2. The starting point positions of the six faces of the binary image of the box-counting method.
Applsci 14 05198 g002
Figure 3. Different starting point positions of the box-counting 3D image.
Applsci 14 05198 g003
Figure 4. Evolution relationship of image porosity with box size at different scales. (a) LL; (b) XJ; (c) ZZ.
Applsci 14 05198 g004
Figure 5. Spatial structure: (a) micro-CT spatial structure; (b) nano-CT spatial structure.
Applsci 14 05198 g005
Figure 6. Connected pore space morphology of coal samples. (a) Connected pore space morphology of micro-CT samples; (b) connected pore space morphology of nano-CT samples.
Applsci 14 05198 g006
Figure 7. Trend diagram of surface porosity of each sample layer by layer.
Applsci 14 05198 g007
Figure 8. Histogram of pore equivalent diameter distribution of each sample. (a) Histogram of pore equivalent diameter distribution of micro-CT samples; (b) histogram of pore equivalent diameter distribution of nano-CT samples.
Applsci 14 05198 g008
Figure 9. Statistics of fractal dimensions for the xy slice surface of each sample.
Applsci 14 05198 g009
Figure 10. PNM structure of coal samples. (a) PNM structure of micro-CT sample; (b) PNM structure of nano-CT sample. The blue part of the figure represents the pore space. The pores in the figure are equivalent to spheres. The color from green to red represents that the pores are getting larger and larger.
Applsci 14 05198 g010
Figure 11. The pore equivalent radius distribution histogram of each sample. (a) Histogram of pore equivalent radius distribution of micro-CT samples; (b) histogram of pore equivalent radius distribution of nano-CT samples.
Applsci 14 05198 g011aApplsci 14 05198 g011b
Figure 12. Histogram of coordination number distribution of each sample. (a) Histogram of coordination number distribution of micro-CT samples; (b) histogram of coordination number distribution of nano-CT samples.
Applsci 14 05198 g012
Figure 13. Distribution histogram of equivalent throat radius of each sample. (a) Histogram of throat equivalent radius distribution of micro-CT samples; (b) histogram of throat equivalent radius distribution of nano-CT samples.
Applsci 14 05198 g013aApplsci 14 05198 g013b
Table 1. Results of industrial analysis and elemental analysis of coal samples.
SamplesRO/%Porosity/%Industrial AnalysisElemental Analysis
Mad/%Aad/%Vad/%Fcad/%C/%H/%O/%N/%
XJ0.645.17873.241.9228.4266.4279.554.1310.090.80
LL1.529.31140.9518.9310.3569.7779.433.282.891.54
ZZ3.467.86541.148.4810.9179.4771.653.163.971.50
Note: Mad—air-dried moisture; Aad—air-dried ash; Vad—air-dried volatile; FCad—air-dried base-fixed carbon.
Table 2. Porosity distribution of each sample.
CT TypeSample NameTotal PorosityConnected PorosityPressurized MercuryError
Micro-CTLL9.94%8.59%9.31%0.63%
XJ5.01%4.64%5.18%0.17%
ZZ7.93%6.10%7.87%0.06%
Nano-CTLL8.87%6.65%9.31%0.44%
XJ6.13%1.71%5.18%0.95%
ZZ7.89%1.70%7.87%0.02%
Note: “LL” means medium-rank coal sample name; “XJ” means low-rank coal sample name; “ZZ” means high-rank coal sample name.
Table 3. Pore equivalent diameter parameter table.
CT TypeSample NameEquivalent Pore Diameter (μm/nm)
MaxAvgMin
Micro-CTLL22,44411751
XJ18,27810651
ZZ20,02811651
Nano-CTLL10,0741761248
XJ63,8891656248
ZZ63,861454248
Note: “LL” means medium-rank coal sample name; “XJ” means low-rank coal sample name; “ZZ” means high-rank coal sample name.
Table 4. Statistics of fractal dimensions for each characterization unit sample.
CT TypeSample NameFractal Dimension DvSurface Fractal Dimension D
DminDavgDmax
Micro-CTLL2.571.141.471.74
XJ2.360.941.171.79
ZZ2.491.231.421.77
Nano-CTLL2.511.381.431.50
XJ2.300.871.081.41
ZZ2.331.101.281.39
Note: “LL” means medium-rank coal sample name; “XJ” means low-rank coal sample name; “ZZ” means high-rank coal sample name; ”Dv” means average value of surface fractal dimension.
Table 5. Pore parameter table.
CT
Type
SamplesTotal
Pores
Equivalent Radius of Pore (μm/nm)Coordination NumberSurface Area (μm2/nm2)
MaxAvgMinMaxAvgMinMaxAvgMin
Micro-CTLL193,056106216625795.6702.52 × 10106.36 × 1085.05 × 106
XJ59,998127218225756.5804.19 × 10108.20 × 1085.05 × 106
ZZ158,13792116325785.3601.72 × 10106.19 × 1085.05 × 106
Nano-CTLL73,7245223993124494.7605.83 × 1082.22 × 1071.20 × 105
XJ445080581592197383.5301.49 × 1095.23 × 1074.05 × 105
ZZ23,0473278982124213.9801.29 × 1094.07 × 1071.20 × 105
Note: “LL” means medium-rank coal sample name; “XJ” means low-rank coal sample name; “ZZ” means high-rank coal sample name; “Coordination Number” means the number of throats connected to each channel.
Table 6. Throat parameter data.
CT
Type
Sample
Name
Total
Throat
Throat Equivalent Radius (μm/nm)Throat Length (μm/nm)Surface Area (μm2/nm2)
MaxAvgMinMaxAvgMinMaxAvgMin
Micro-CTLL547,493111080103045478383.86 × 1092.91 × 1073.08 × 105
XJ197,30399899104317548503.12 × 1094.78 × 1073.08 × 105
ZZ423,852953768914469382.85 × 1092.44 × 1072.24 × 105
Nano-CTLL175,4834569535411.27 × 10428871536.55 × 1071.45 × 1065331
XJ78466255898481.64 × 10445165911.22 × 1083.81 × 1067353
ZZ45,9091865407481.60 × 10428912631.09 × 1076.90 × 1057352
Note: “LL” means medium-rank coal sample name; “XJ” means low-rank coal sample name; “ZZ” means high-rank coal sample name; “Throat equivalent” means a channel or pipe, usually used to transport fluid or gas.
Disclaimer/Publisher’s Note: The statements, opinions and data contained in all publications are solely those of the individual author(s) and contributor(s) and not of MDPI and/or the editor(s). MDPI and/or the editor(s) disclaim responsibility for any injury to people or property resulting from any ideas, methods, instructions or products referred to in the content.

