Abstract
A battery track engineering vehicle faces challenges such as derailment and other safety concerns when navigating an R20m minimum radius curve, primarily owing to its low vertical and horizontal stabilities. To address these issues, a methodology integrating genetic optimization algorithms with a rigid and flexible coupled multi-body dynamics simulation is proposed to optimize the primary suspensions of the bogie of the vehicle. Initially, a multi-objective optimization model combining rigid and flexible coupled multi-body dynamics of battery track engineering vehicles with a genetic optimization algorithm was formulated. Subsequently, the optimal Latin hypercube design was applied to analyze the sensitivity of vertical and horizontal stability to various suspension parameters. Finally, a non-dominated sorting genetic algorithm (NSGA-II) and an archive-based micro genetic algorithm (AMGA) were applied to optimize the primary suspensions to enhance stability. Consequently, a set of optimal suspension parameter combinations was obtained. A notable enhancement was observed in the lateral stability of the optimized battery track engineering vehicles by 23.33% and in the vertical stability by 3.5% when traversing the R20m minimum radius curve, thereby establishing a theoretical foundation for further improving the running safety of railway vehicles and resolving the shortcomings of less research on the smallest radius curve.
1. Introduction
With the development of urban rail transit, traditional track engineering vehicles suffer from drawbacks such as low efficiency, high energy consumption, and significant pollution. Consequently, the environmentally friendly battery track engineering vehicle has gained popularity. Each subway line is equipped with a certain number of battery track engineering vehicles. Faced with the complex and ever-changing route conditions of urban subway systems, the bogie, a crucial component of battery track engineering vehicles, requires optimal suspension parameters to ensure operational safety [1,2].
Researchers worldwide have conducted numerous studies on the optimization of the primary suspension parameters of the bogie. Ashtiani et al. [3] made a three-piece bogie wagon the subject of a study, minimized the vertical acceleration, and optimized the geometries of the inclined chisel for unloaded and heavily loaded scenarios. Yang et al. [4,5] showed that the lateral frame force depends upon the relative interplay of lateral bogie stiffness and the snubbing force for the subject suspension designs. Sun et al. [6] optimized vehicle body modal analysis on such basis. Zhou et al. [7,8,9] investigated the operational qualities such as stability and safety of a vehicle by establishing a rigid–flexible coupled model of a rail vehicle, and also revealed that elastic vibration cannot be neglected in vehicle dynamics. Ling et al. [10] established a subway vehicle–rail coupling dynamics model and investigated the impact of different matches between the primary suspension and fastener stiffness on vehicle dynamic performance. Guang et al. [11] explored the matching relation of six key suspension parameters to achieve optimal lateral dynamics. Yang et al. [12,13] established a virtual prototype Kriging model and radial basis function (RBF) model, and the genetic algorithm was used for multi-objective optimization to improve the vehicle operational performance. Bideleh et al. [14] showed that the dynamics response of a vehicle with wear/comfort Pareto-optimized values of bogie suspension was robust against uncertainties in the design parameters. Yao et al. [15] presented a method for the centralized optimization of key bogie suspension parameters based on vehicle lateral robust stability. Chen et al. [16] investigated the stability/wear Pareto optimization of bogie suspension parameters for high-speed passenger trains. Chen et al. [17,18,19] optimized the suspension parameters and selection of oscillator suspension and achieved Actuator optimal placement for high-speed trains to improve hunting stability.
In conclusion, the optimization of the bogie structure for the bogies of old internal diesel locomotive cars equipped with an external axle-box bogie has been extensively studied to improve the safety performance under various conditions, such as high speed, heavy load, or large radius curves. However, as a new type of popular construction vehicle, fewer investigations have focused on the improvement of the stability of the inner axle-box bogie for a battery track engineering vehicle passing through minimum radius curves. The horizontal sizes of the external axle-box bogie are much larger than those of the inner axle-box bogie, and the horizontal spans of the first and second series of the suspensions are larger, with a significant gap between the suspension forces of each series. This has a considerable impact on the horizontal motion of train components; therefore, considering the dynamics requirements, the parameters of the first series of suspensions of the traditional external axle-box bogie are not suitable for the inner axle-box bogie. In addition, when a track engineering vehicle passes through a minimum radius curve, the unevenness of the track and centrifugal force make derailment and other dangerous occurrences likely [20]. Therefore, optimizing bogie parameters for vehicles traversing minimum radius curves is essential to enhance operational stability.
Presently, the majority of research on vehicle suspension parameter optimization has relied on full rigid body models. As a result, significant disparities are often observed between the simulation outcomes and how the vehicle actually performs. Moreover, optimization objectives usually focus on singular objectives, and there is often a conflicting relationship between parameters, which hinders the realization of optimal vehicle dynamics. In order to solve the above problems, this study carried out flexible processing of a bogie and established a rigid and flexible coupled multi-body dynamics model of a battery track engineering vehicle with an inner axle-box bogie. Six primary suspension parameters were selected as the main research focus. Using the optimal Latin hypercube design [21] test method, the vertical and lateral stability of the engineering vehicle were calculated via simulation when the vehicle navigated straight lines and R20m minimum radius curves at a uniform speed. This facilitated quantitative analysis of the influence of the primary suspension parameters on the vertical and lateral stabilities. Finally, the non-dominated sorting genetic algorithm (NSGA-II) and archive-based micro genetic algorithm (AMGA) were applied to achieve multi-objective optimization of the primary suspensions with the goal of enhancing the stability of the vehicle as it navigated an R20m minimum radius curve.
2. Dynamics Modeling
2.1. Full Rigid Body Dynamics Model
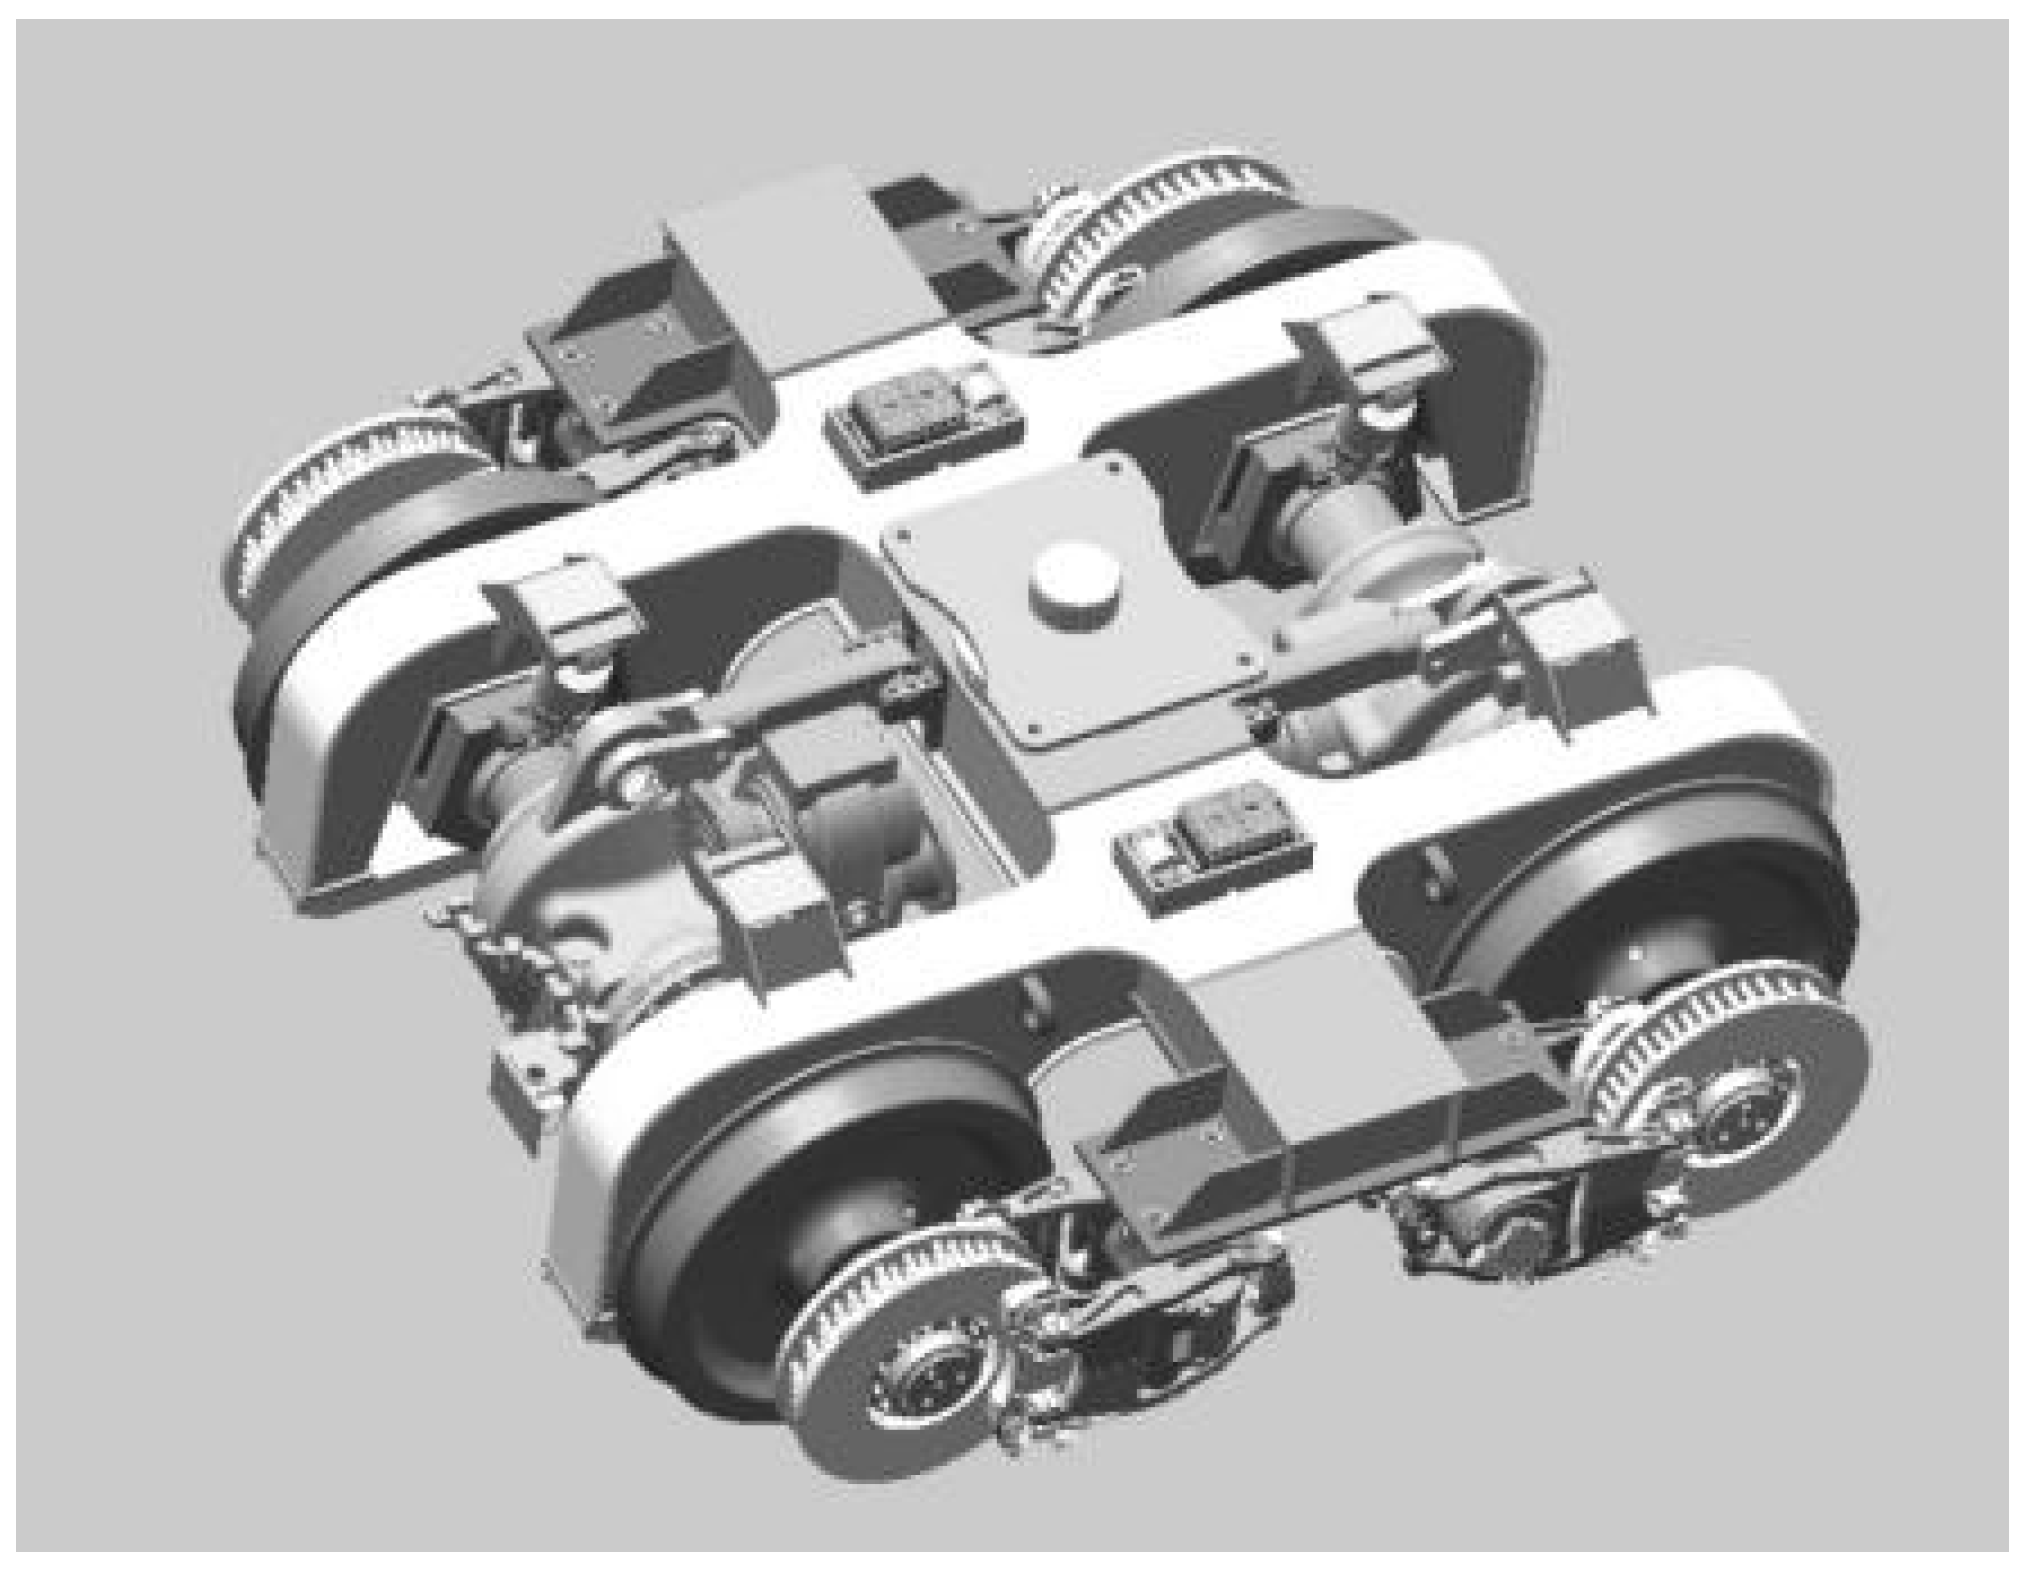
The battery track engineering vehicle adopts a shunting locomotive shape, with an axle-box built-in-type power bogie for its walking section. The inner axle-box bogie studied in this paper is shown in Figure 1. It has a shorter lateral span with a primary suspension system compared to an external axle-box bogie. Moreover, the combination of inner axle-box suspension and a V-type rubber spring reduces the friction resistance and the deformation of the suspension device when the construction vehicle passes through small radius curves, enabling it to navigate the R20m minimum radius curve. The frame is an H-type weldment consisting mainly of a beam and two side girders. The primary suspension devices, featuring significant static deflection, were set between the frame and the axle-box. This system comprises a V-shaped rubber spring and a vertical hydraulic shock absorber connected in parallel. The bearings of the transmission mechanism were coupled with the wheels in pairs to facilitate positioning. The axle-box device mainly consists of an axle-box positioning front cover, bearing box, tapered roller bearing, and through cover.

Figure 1.
Shaft housing inlay power bogie model.
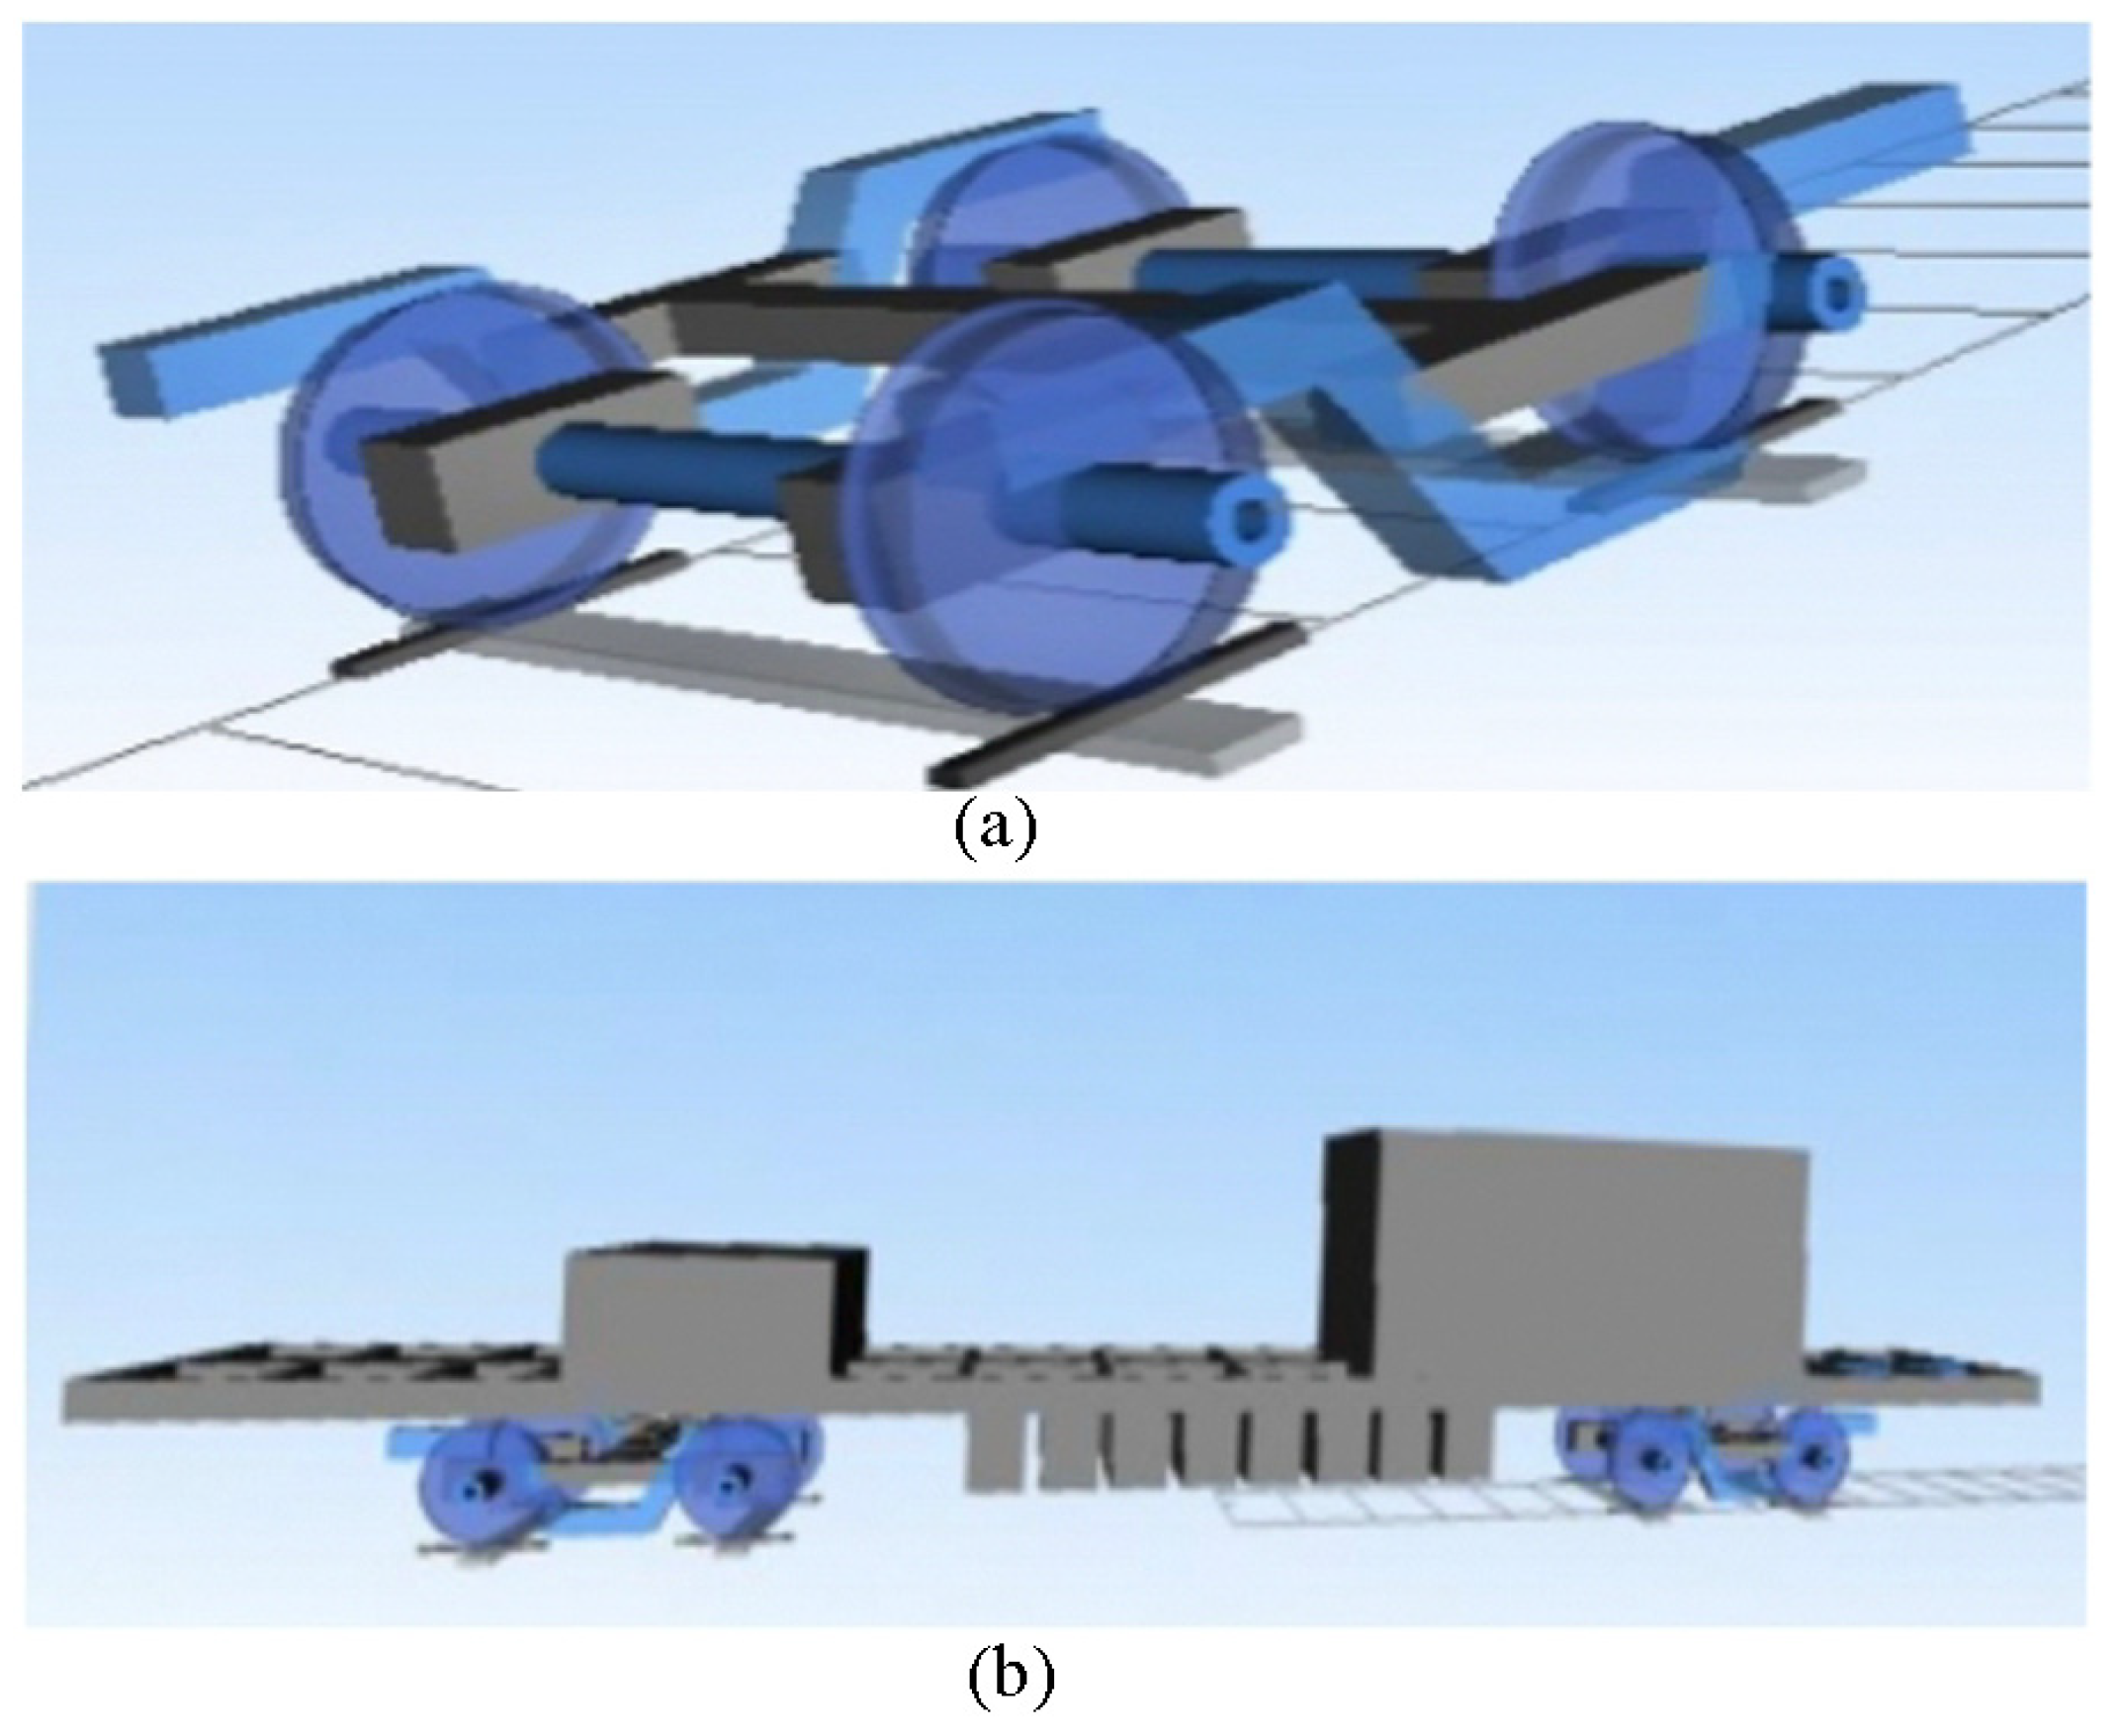
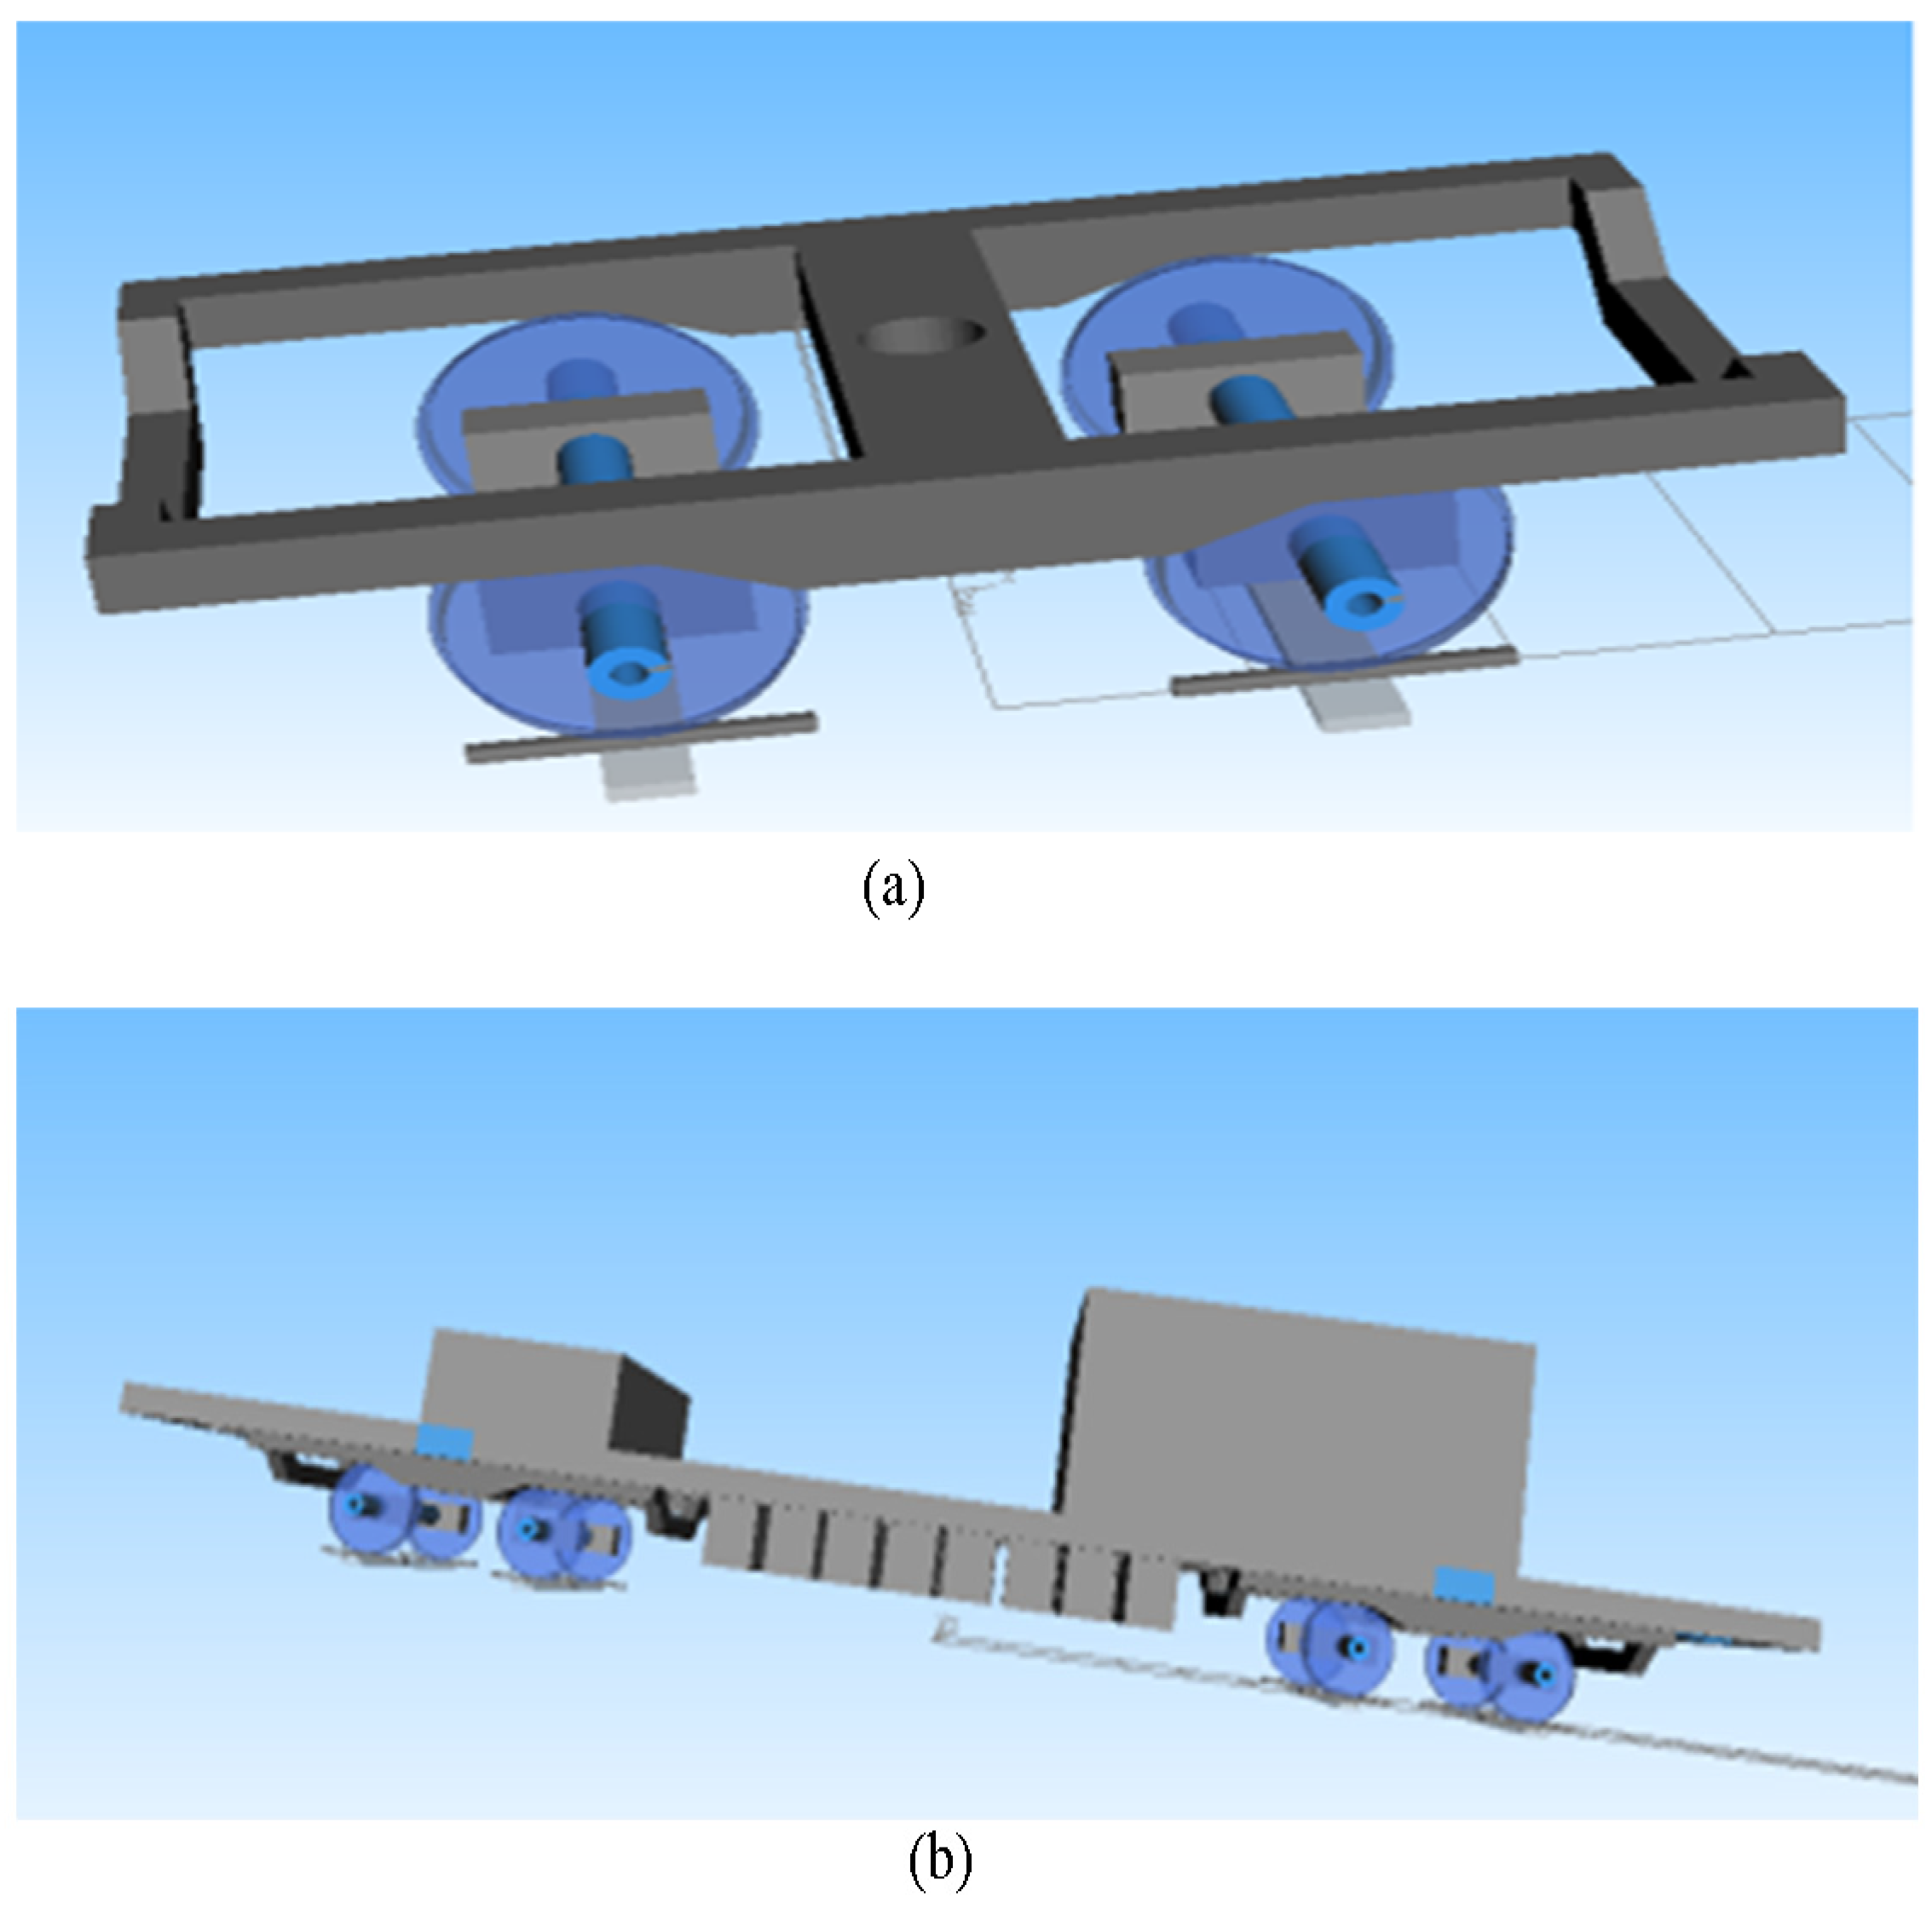
Based on the information provided by the manufacturer, the basic parameters of the battery engineering vehicle bogie are shown in Table 1. Modeling software was used to model the engineering vehicle and bogie. The full rigid body model of the bogie is shown in Figure 2a, and the full rigid body model of the entire vehicle is shown in Figure 2b.

Table 1.
Basic parameters of an engineering vehicle bogie.

Figure 2.
Full rigid body dynamics simulation model of the bogie (a) and the entire vehicle (b).
2.2. Rigid-Flexible Coupled Dynamics Model
Generating flexible body structures is pivotal in modeling vehicles with rigid–flexible coupling. First, finite element analysis software was employed to perform finite element discretization of the bogie structure. Then, modal analysis and substructure analysis were performed. The substructure analysis resolves the issue of excessive computation and the need for extensive computational space caused by the structural complexity. By simplifying the model of the structure to retain the essential components of the structure while maintaining the integrity of the overall structure, computational workload is significantly reduced [22]. Subsequently, a flexible frame was generated through the flexible body generation interface in the dynamics analysis software. Finally, the flexible frame was coupled with other components for simulation. The detailed process of generating the rigid–flexible coupling model is shown in Figure 3.
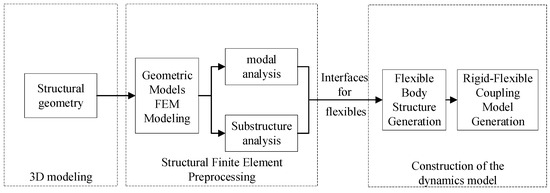
Figure 3.
Flowchart of the generation of the rigid–flexible coupling model.
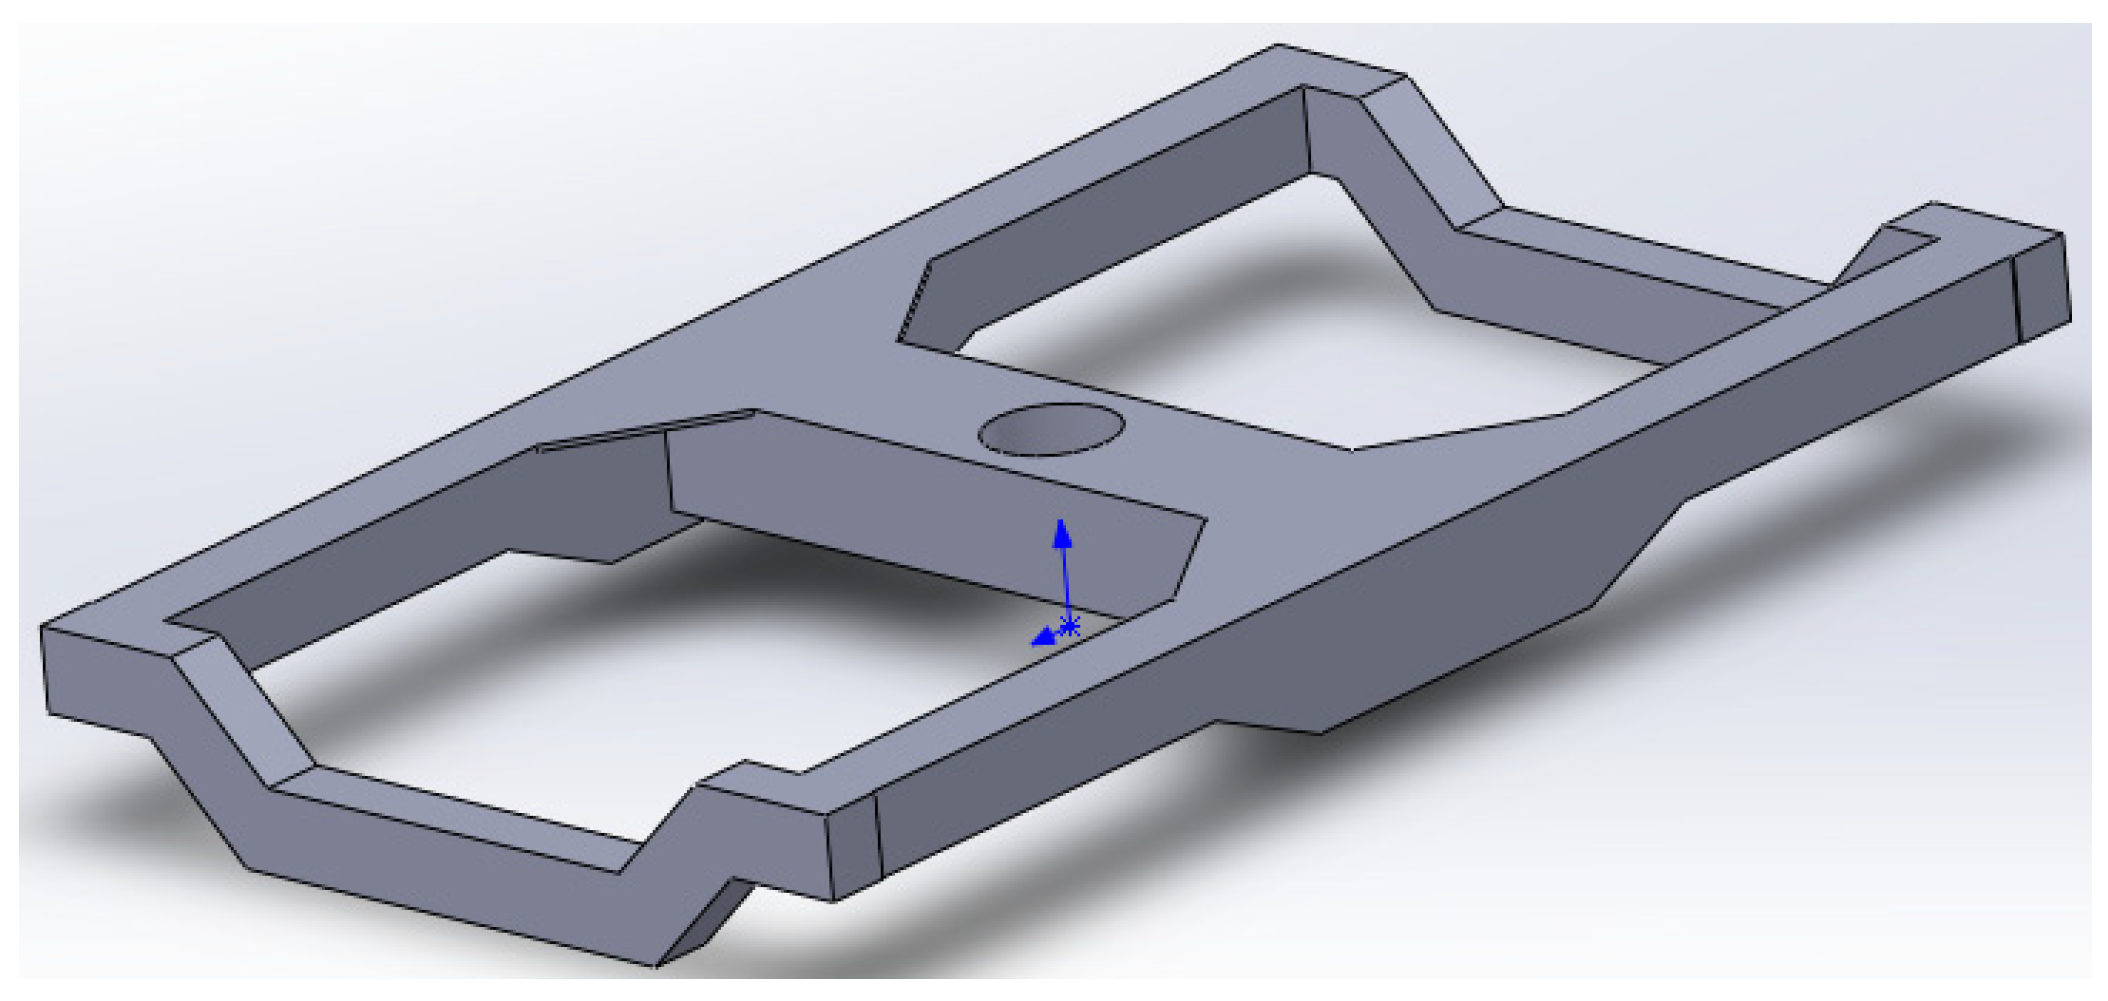
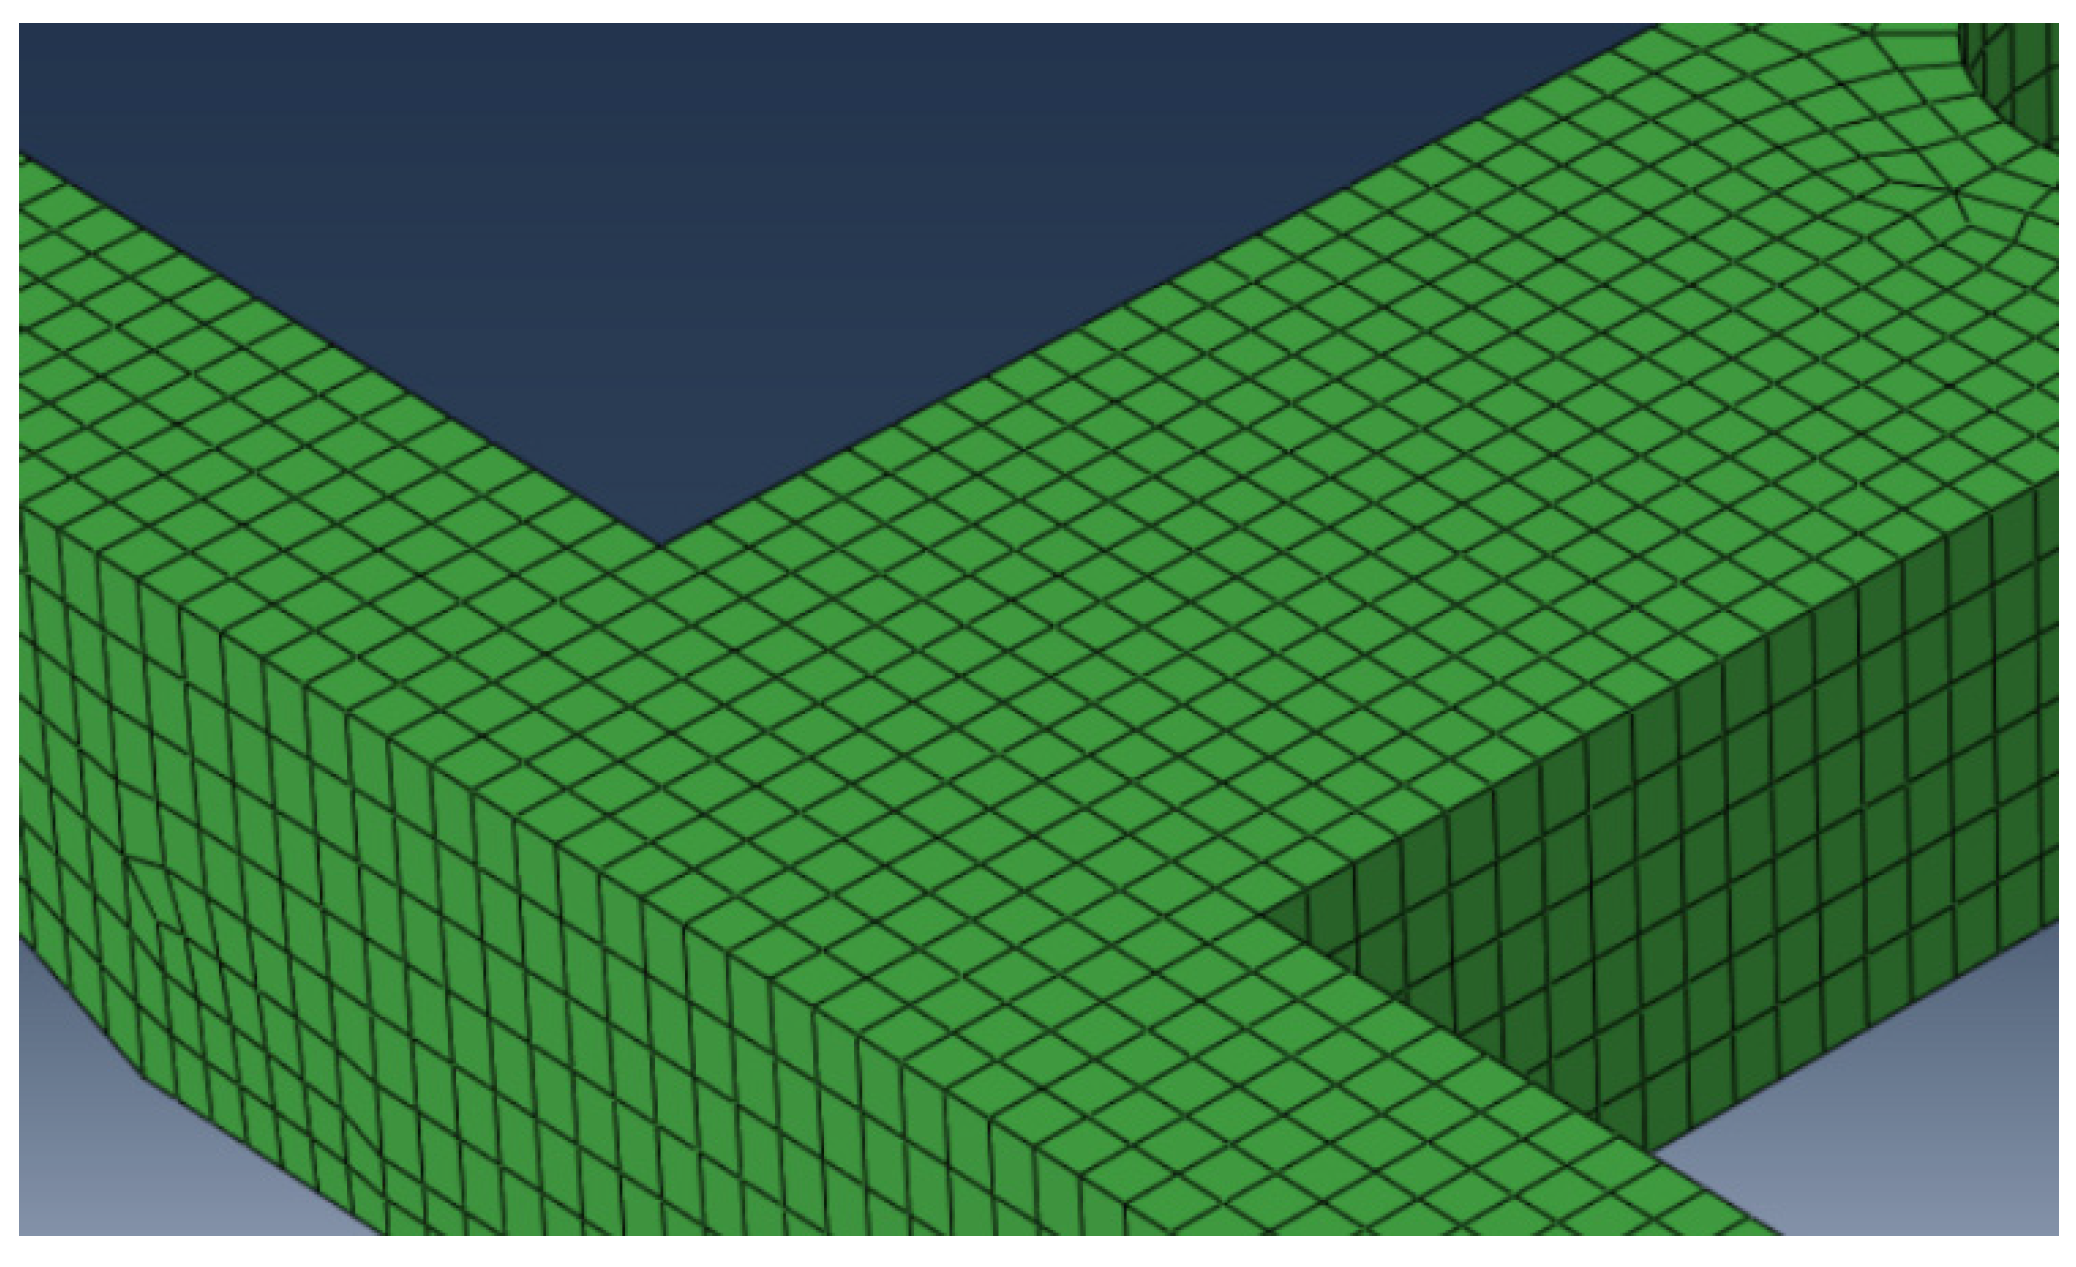
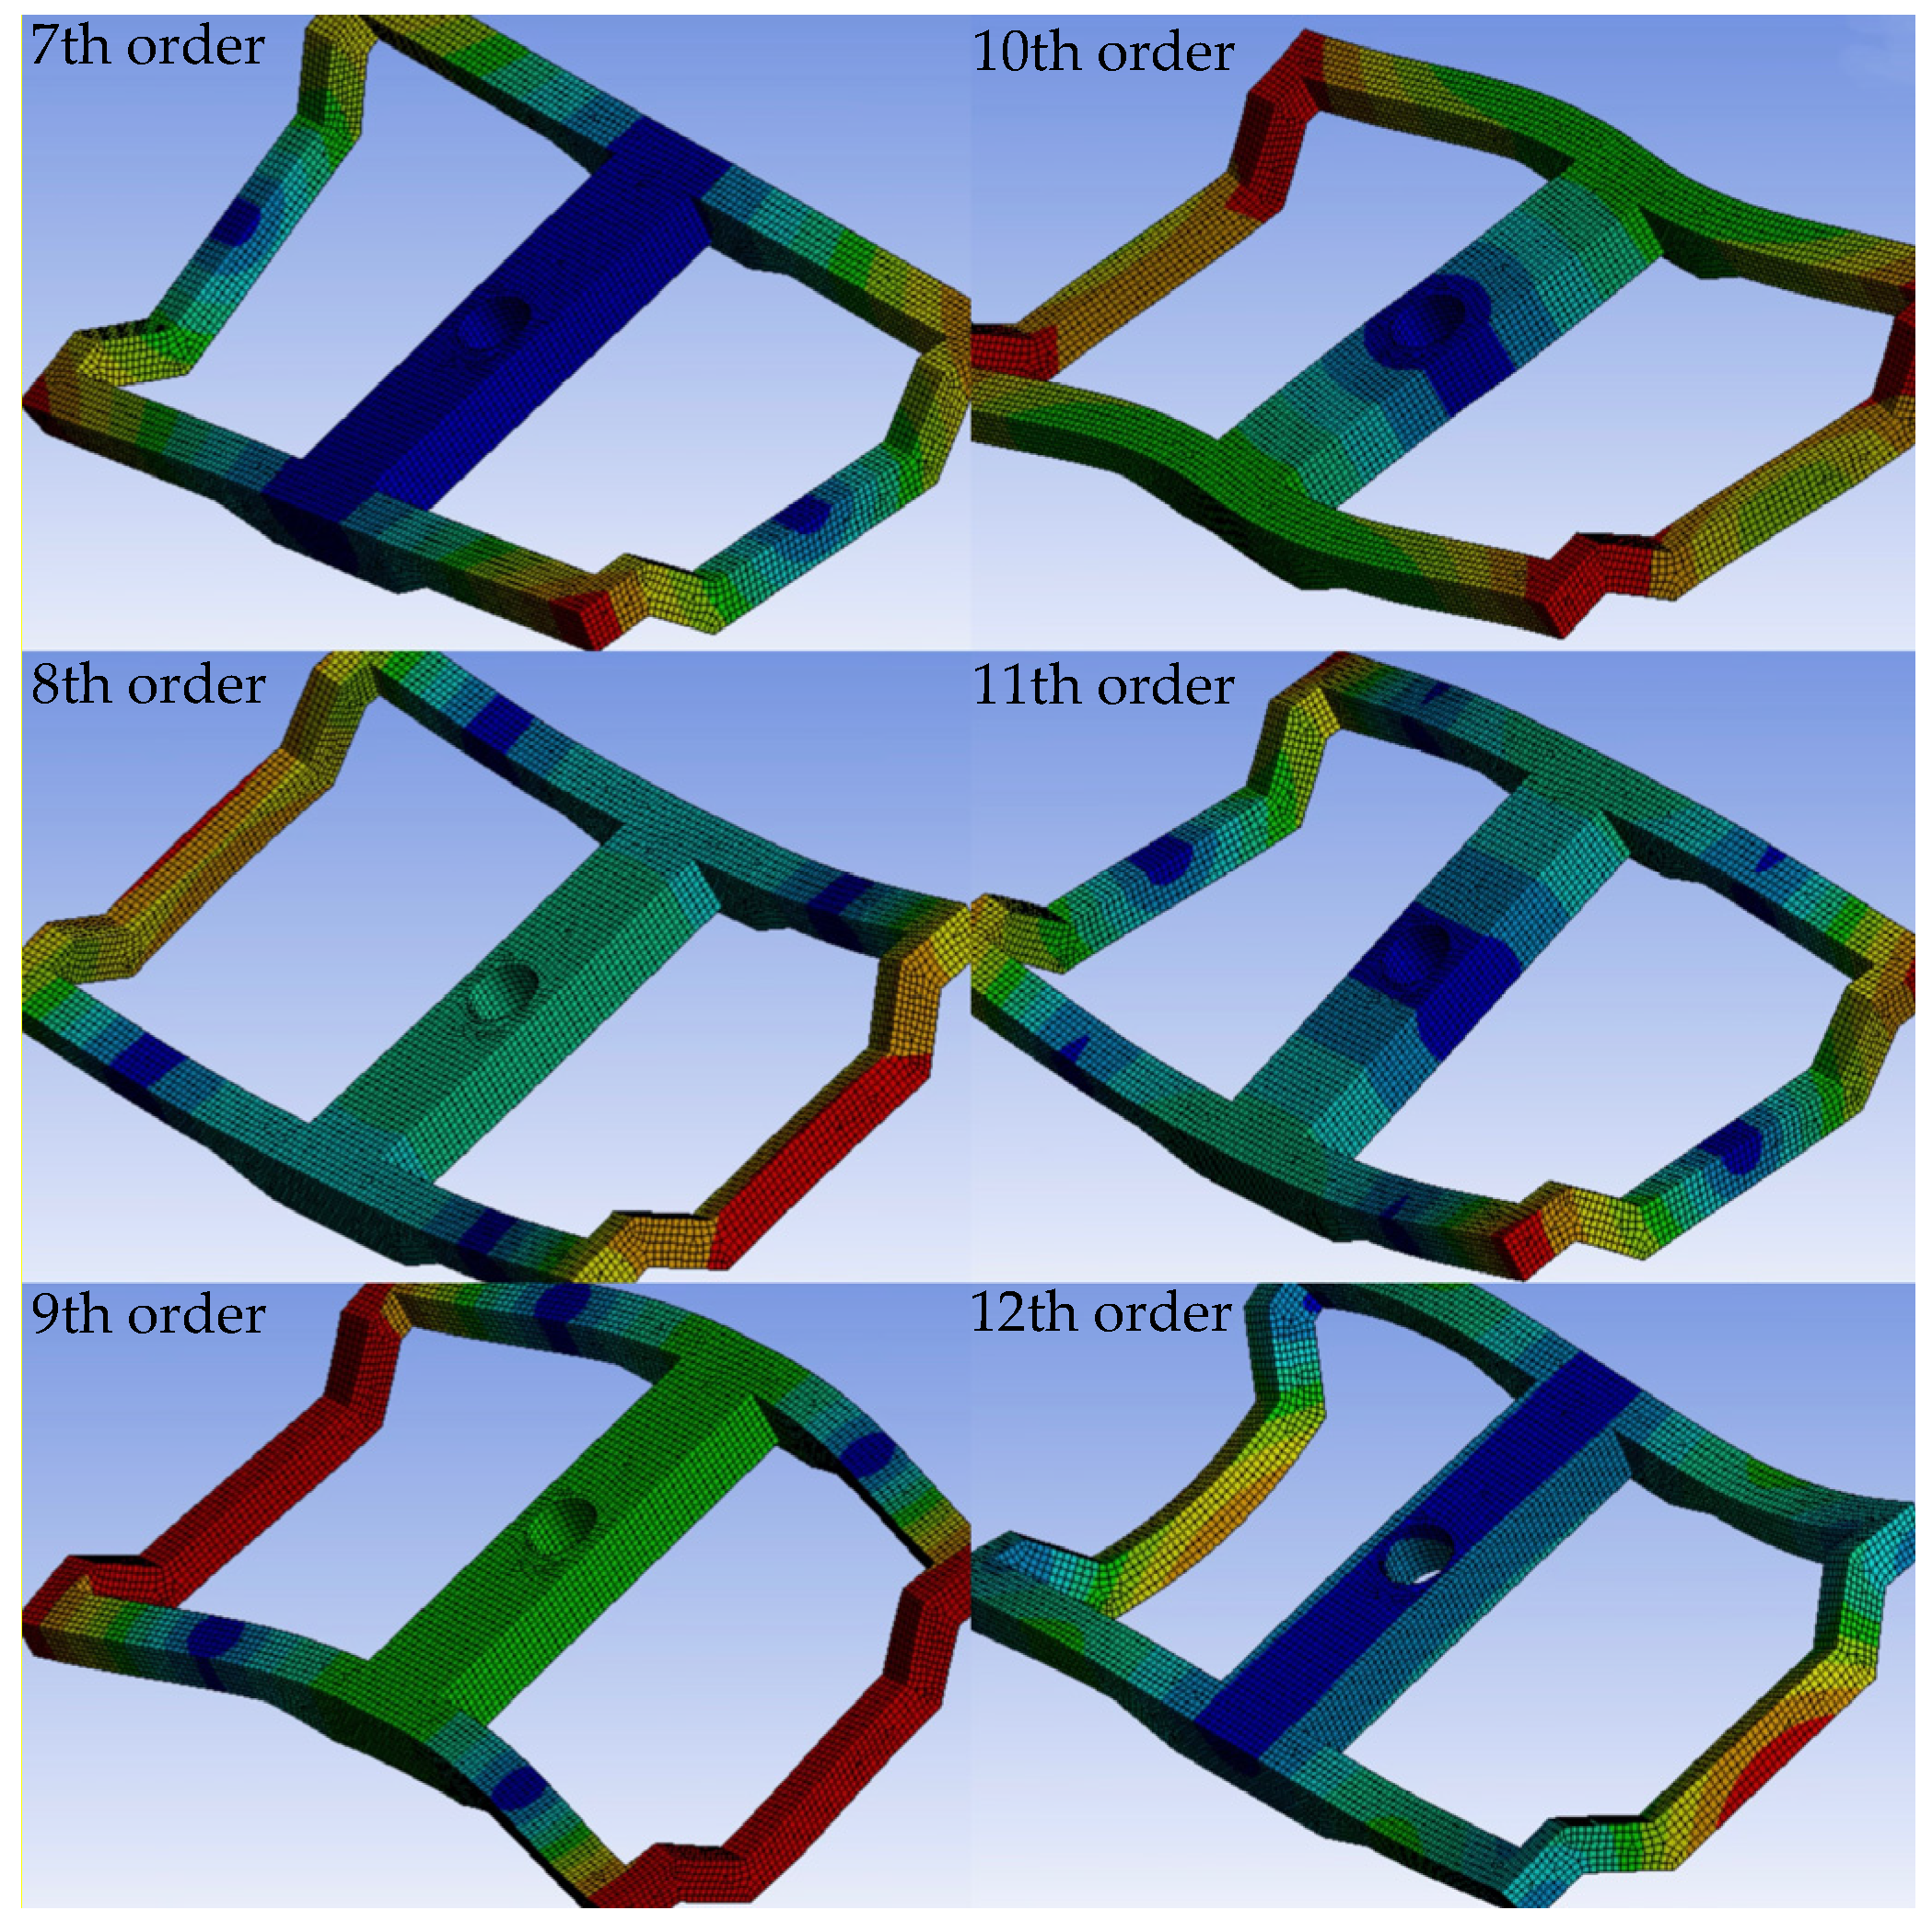
A 3D model of the bogie frame was constructed in 3D modeling software. The model of the simplified architecture is shown in Figure 4. Modal and substructure analyses of the frame were conducted using finite element analysis software to generate process documents of the modal analysis, stiffness matrix, and mass matrix. The architectural model generated a total of 34,480 elements and 46,372 nodes. The details of the delineated completed framing grid are shown in Figure 5. The material density of the frame was 7850 kg/m3. Its Young’s modulus was 210 GPa, and the Poisson’s ratio was 0.3. Among them, the first six modes of the frame were rigid, while the dynamics calculation primarily considered the flexible modes. Table 2 shows a comparison of the modal data ranging from the 7th to the 12th order, both before and after the substructural analysis was performed, and Figure 6 shows the corresponding vibration patterns for modes 7 through 12.
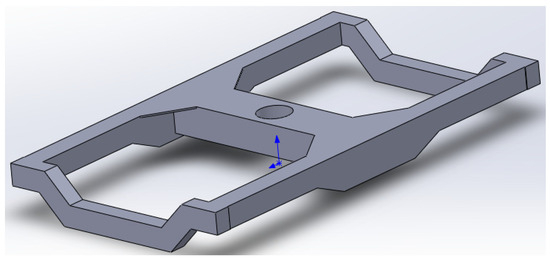
Figure 4.
Three-dimensional model of the architecture.

Figure 5.
Detailed framing grid.
Table 2.
Seventh- to twelfth-order modes before framing.

Figure 6.
Plot of vibration shapes corresponding to modes of order 7 to 12.
The bogie frame was replaced with a flexible body frame in the fully rigid body vehicle model. Force elements were established between the master nodes on the flexible frame and the mark points on other rigid components, such as the vehicle body and wheel pairs, to simulate a suspension system and positioning instrument. The bogie rigid–flexible coupling model is shown in Figure 7a, and the entire vehicle rigid–flexible coupling model is shown in Figure 7b.
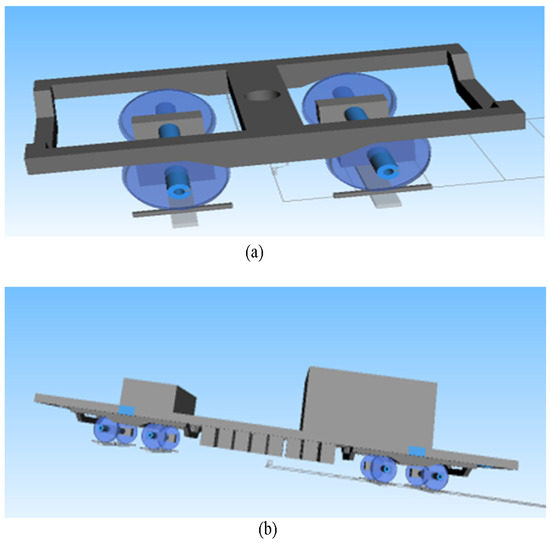
Figure 7.
Rigid–flexible coupling dynamics simulation model of the bogie (a) and the entire vehicle (b).
2.3. Installation of Roads
The total length of the simulation route was 3.5 km, the radius of the curve was 20 m, the radius of the gentle curve was 10 m to ensure smooth transitions between railroad segments [23], the maximum under-height was 10 mm, and the track excitation adopted the U.S. five-track spectrum. The speed of passing a straight line was 50 km/h, and the speed of passing a curve was 7 km/h.
3. Critical Speed Simulation for an Engineering Vehicle
In analyzing the stability of track engineering vehicles, a crucial evaluation index is the critical speed of the train. When the actual running speed of the track vehicle is close to or reaches the critical speed, the vibration of the vehicle intensifies, considerably affecting the stability of the vehicle operation, and even endangering the safety of the vehicle [24]. The nonlinear critical speed of the vehicle was used in this test for calculation and analysis.
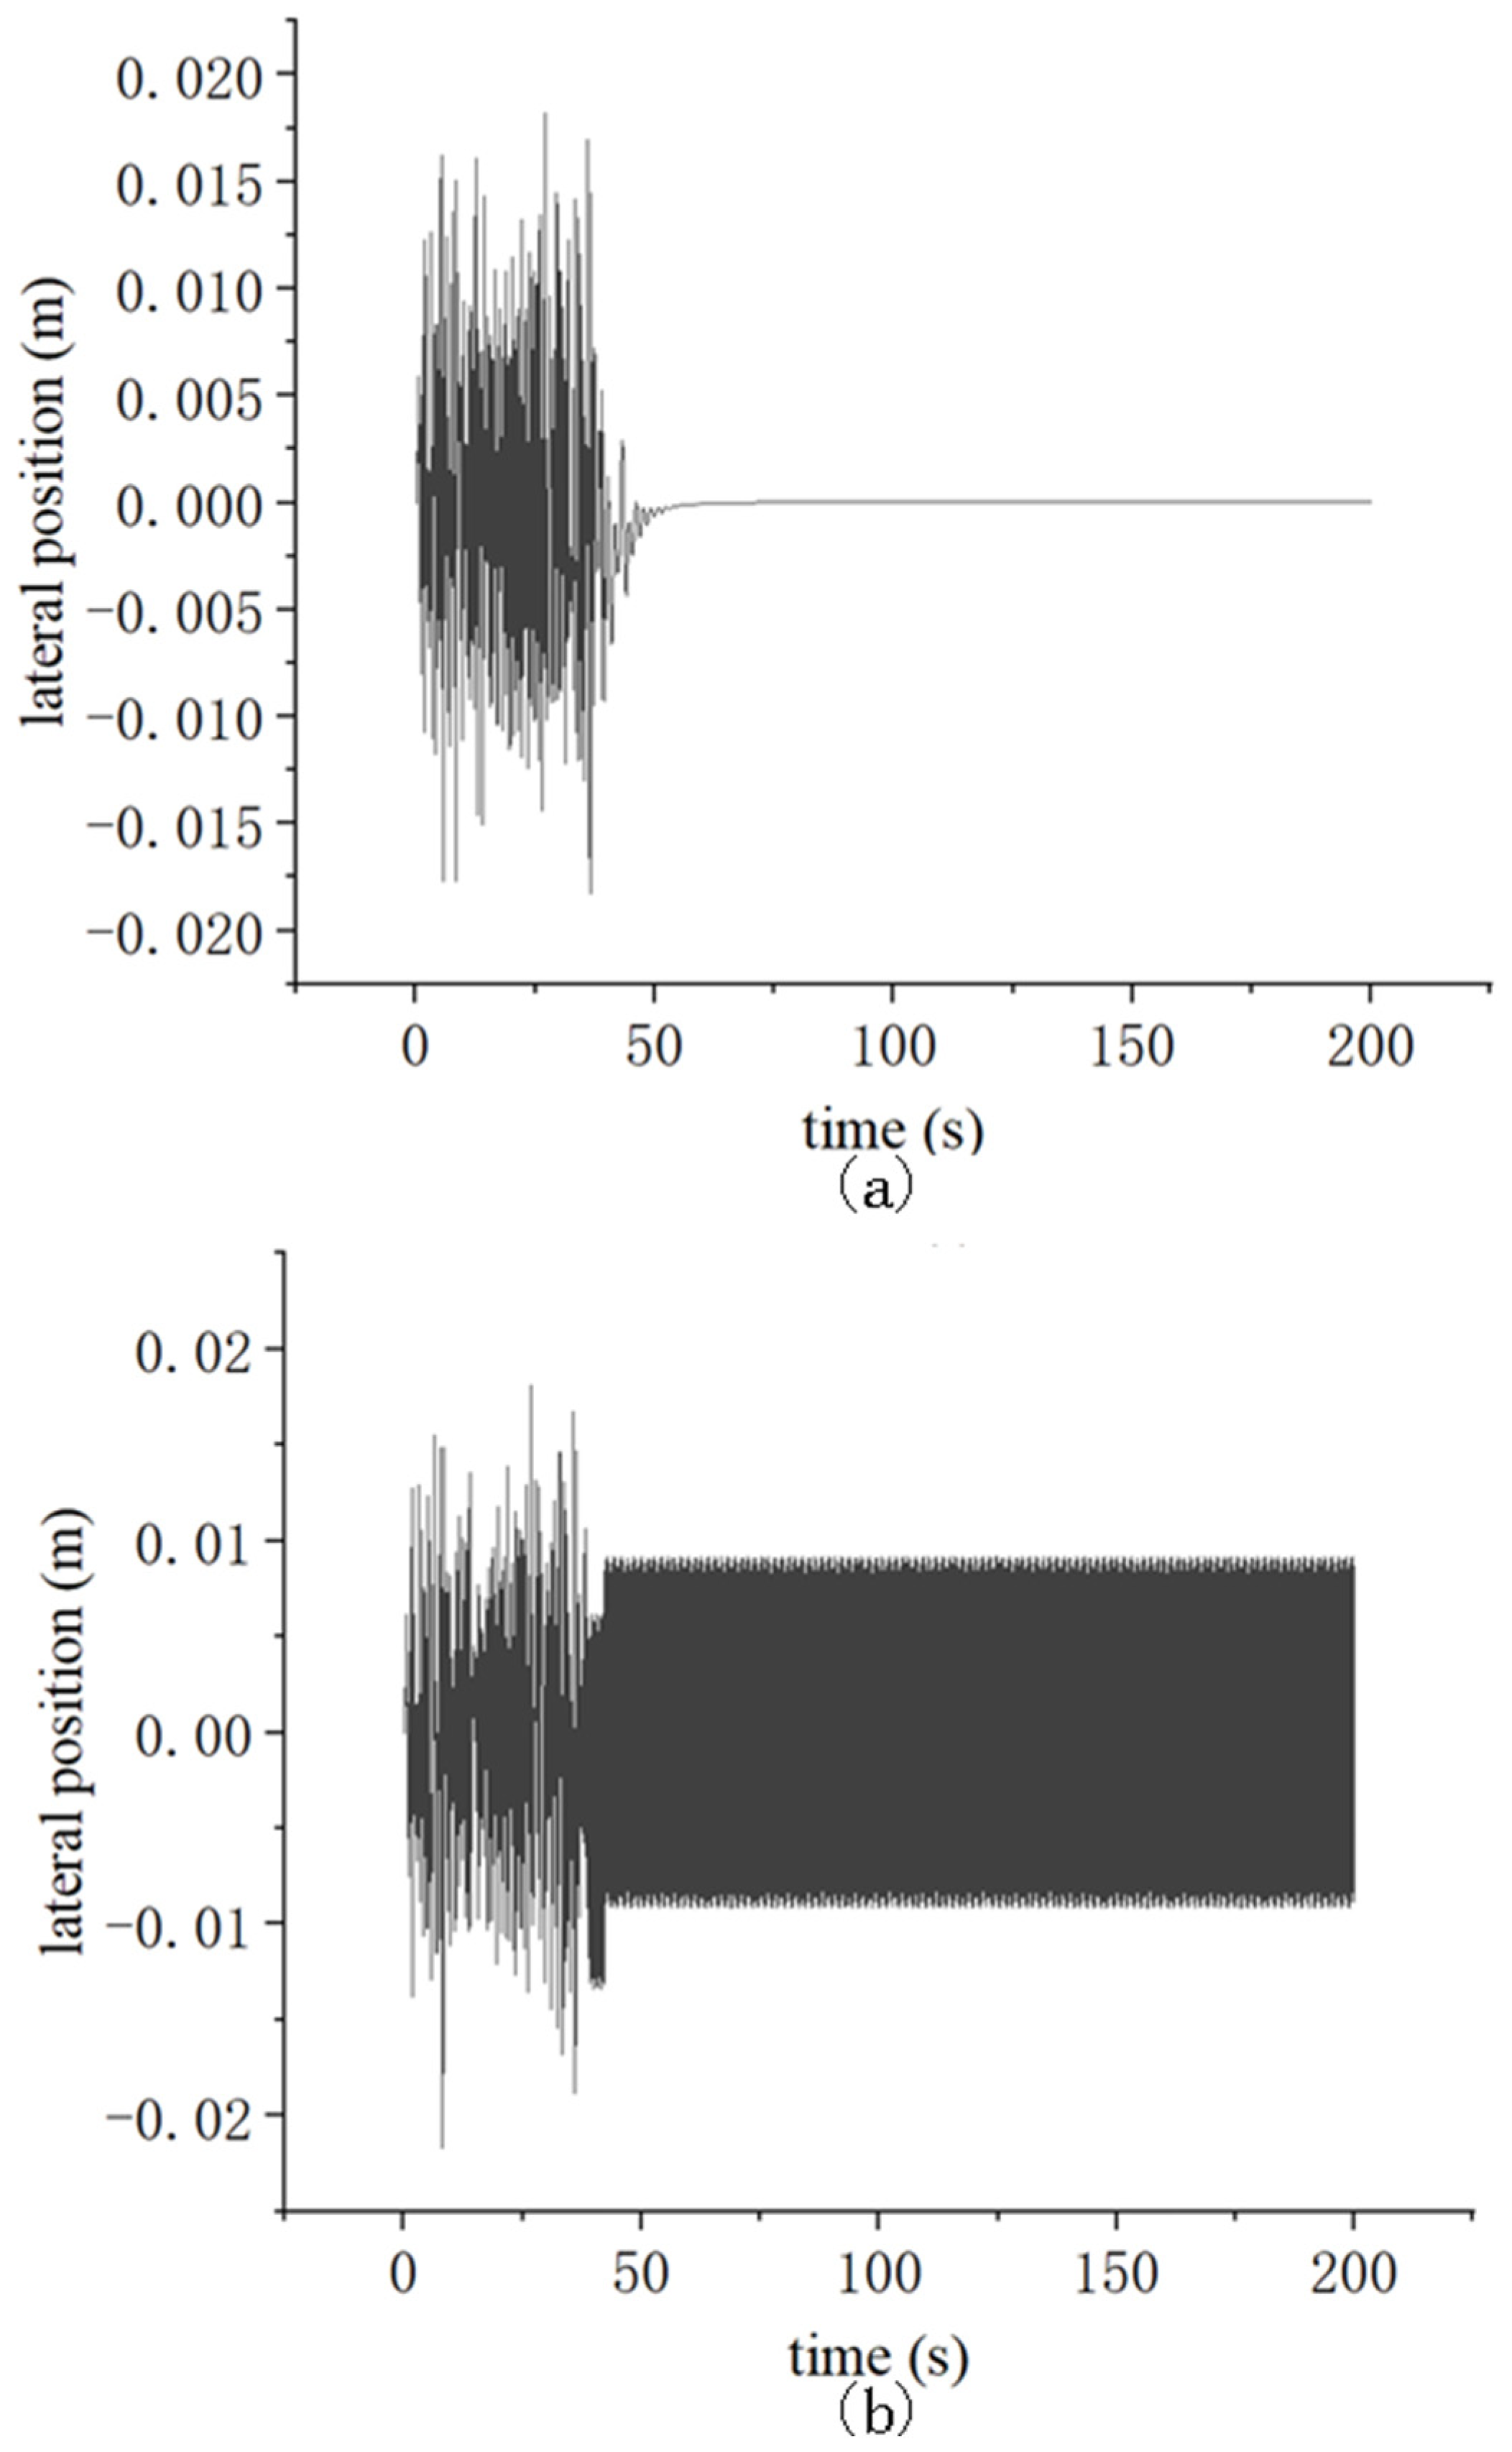
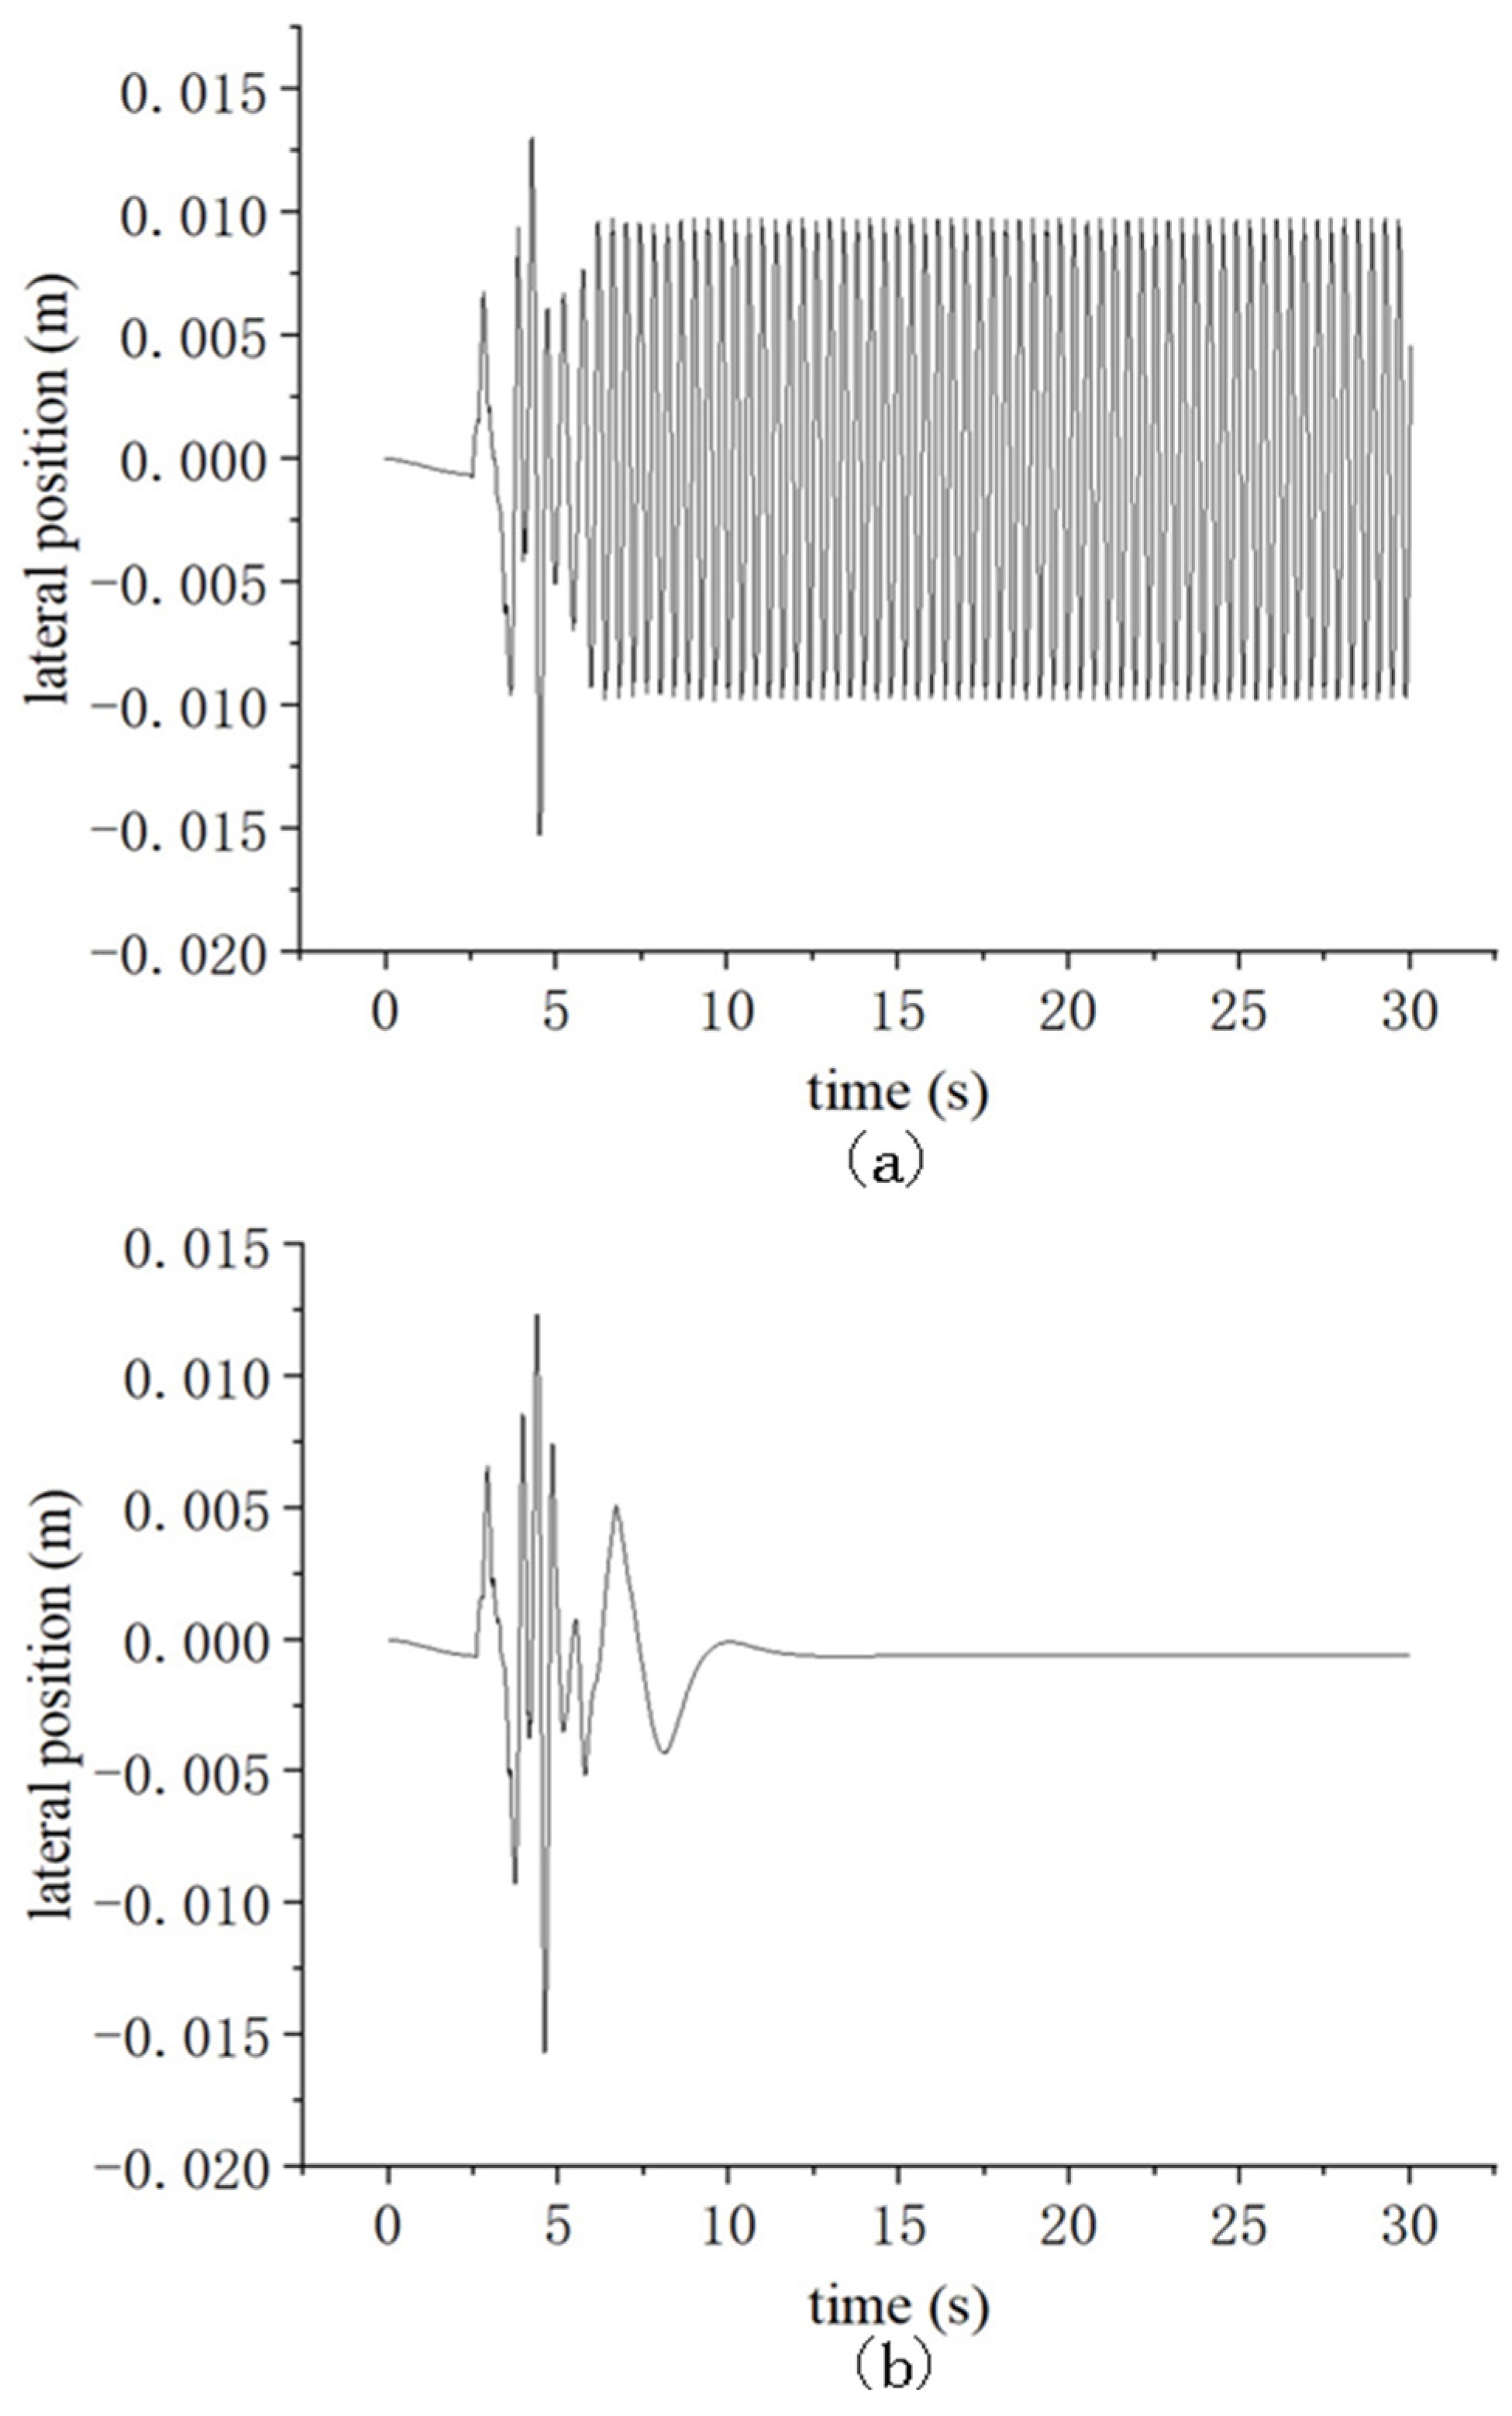
A 5 km long straight line section was set up, and the U.S. five-track spectrum upset spectrum excitation was applied in the 50–100 m section from the beginning of the route. The speed of the vehicle was gradually increased, and amount of transverse displacement of the first pair of wheels of the vehicle as the vehicle navigated the test route was determined. The critical speed was determined when the response no longer showed significant convergence, and equal magnitude shocks occurred. The simulation curves are shown in Figure 8 and Figure 9.

Figure 8.
Curves of the wheelset transverse displacement for the full rigid body model at 92 m/s (a) and 93 m/s (b).
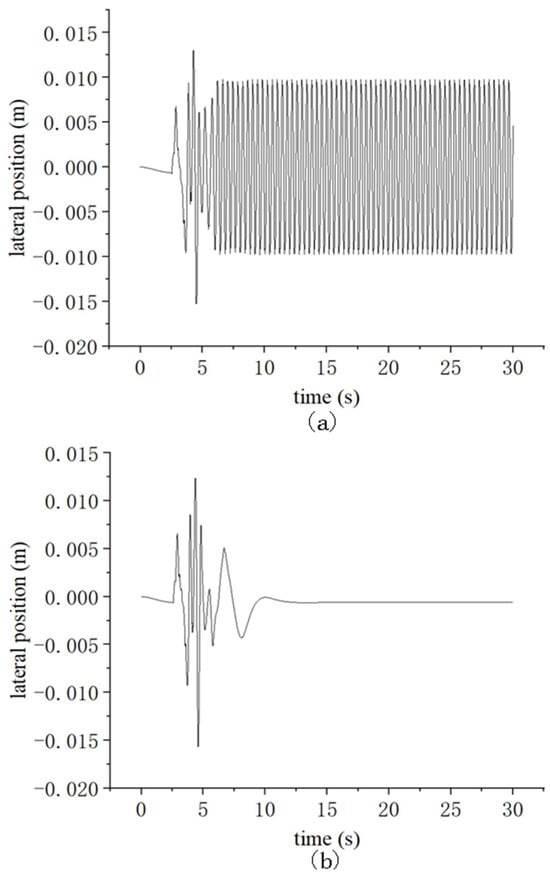
Figure 9.
Curves of wheelset transverse displacement for the rigid–flexible coupled model at 66 m/s (a) and 67 m/s (b).
Figure 8 and Figure 9 reveal that, when the critical speed is 93 km/h, the vehicle is considered a fully rigid body. As the elastic deformation of the bogie makes the convergence of the lateral movement of the vehicle in the operation worse, the critical speed is 67 km/h when considering the vibration of the bogie itself.
In summary, the actual design speed of the battery track engineering vehicle was 50 km/h. This speed was found to be lower than the critical speed determined through simulation and satisfied the operational design requirements. At the same time, considering the natural oscillation of the frame of the vehicle when optimizing the stability of the vehicle enhances the practical relevance of the optimization process by ensuring that the results are closer to what would actually occur during operation, thus providing more valuable insights for decision-making and design improvements.
4. Curve Passage Analysis
The safety of engineering vehicles traversing R20m minimum radius curves is structurally limited by the maximum allowable steering angle of the bogie. When a vehicle passes through a curve, the bogie is deflected and forms an angle with the body. The smaller the curve radius, the greater the steering angle of the bogie relative to the body. When the outer axle of the bogie approaches the outer track and the inner axle nears the inner track, and each axle end of the bogie reaches its lateral moment limit, the minimum radius of curvature through which the rail vehicle can pass is determined, as shown in Figure 10.
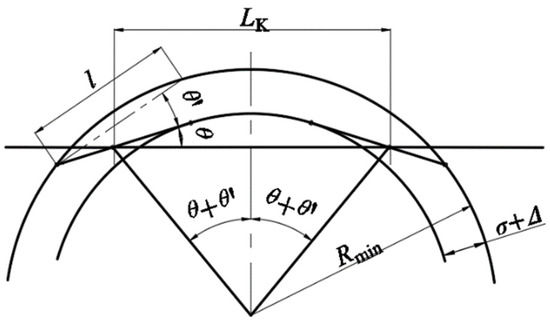
Figure 10.
Scenario in which the vehicle can navigate the minimum radius.
With reference to the design parameters of a certain type of inner axle-box bogie in China, the parameters of the track and wheel pairs required to analyze the ability of the battery track engineering vehicle to pass through curves are shown in Table 3.
Table 3.
Track and wheelset parameters.
According to the report “Locomotive General and Bogie” published by China Railway Publishing House in 2010, to simplify the calculation, assuming no transverse movements occur in any axes, the minimum curve radius that the engineering vehicle can safely navigate can be determined as follows:
X is the rotating heart distance of the wheelset and is calculated as
where = 1199.55 mm and = −400.5 mm
is the maximum angle of rotation permitted for the bogie design.
is the angle of the bogie due to the inner and outer rails.
is the minimum curve radius.
Calculations based on the data in Table 3 revealed that the battery track engineering vehicle passed through a minimum curve radius of = 19.49 m, demonstrating that it can navigate curves with a minimum radius of R20m.
5. Analysis of Correlation and Sensitivity
5.1. Theoretical Foundation
According to the “Dynamic Performance Evaluation and Test Method for Particular Class Vehicles and Tracked Machine” (GB/T17426-1998) published by the State Bureau of Quality and Technical Supervision in 6 July 1998 [25], the vertical and lateral stability of particular class vehicles and tracked machines can be evaluated by the maximum vibration acceleration and stability index.
The stability index is calculated as follows:
where W is the stability index; A is the vibration acceleration (m/s2); f is the vibration frequency (Hz); and F(f) is the frequency correcting coefficient.
Correlation analysis measures the extent to which different suspension parameters correlate with vertical and lateral accelerations. Sensitivity analysis studies analyze the sensitivity of changes in the vertical and lateral accelerations to changes in the primary suspension parameters, identifying parameters with a significant impact on the system or model [20], and determining the input parameters for the subsequent multi-objective optimization [26].
5.2. Process of Analysis
This simulation analysis involved six design variables, necessitating a simulation analysis method suitable for a high-dimensional design space. An optimal Latin hypercube design ensures that the selected sample points are uniformly distributed in the high-dimensional space defined by the six input parameters, allowing for a more comprehensive study of sample point combinations and yielding better experimental results with fewer samples. Thus, an optimal Latin hypercube design was used for data sampling in this study [27].
As shown in Table 4, was set, and a total of six primary suspension parameters were used as input variables, with lateral acceleration and vertical acceleration as the output variables. The input parameters were varied by ±20% from the original values to generate 350 sets of sample points for dynamics simulation. Finally, the sensitivity and correlation of each suspension parameter with the vertical and lateral acceleration responses were analyzed.
Table 4.
Key parameters.
5.3. Analysis of Results
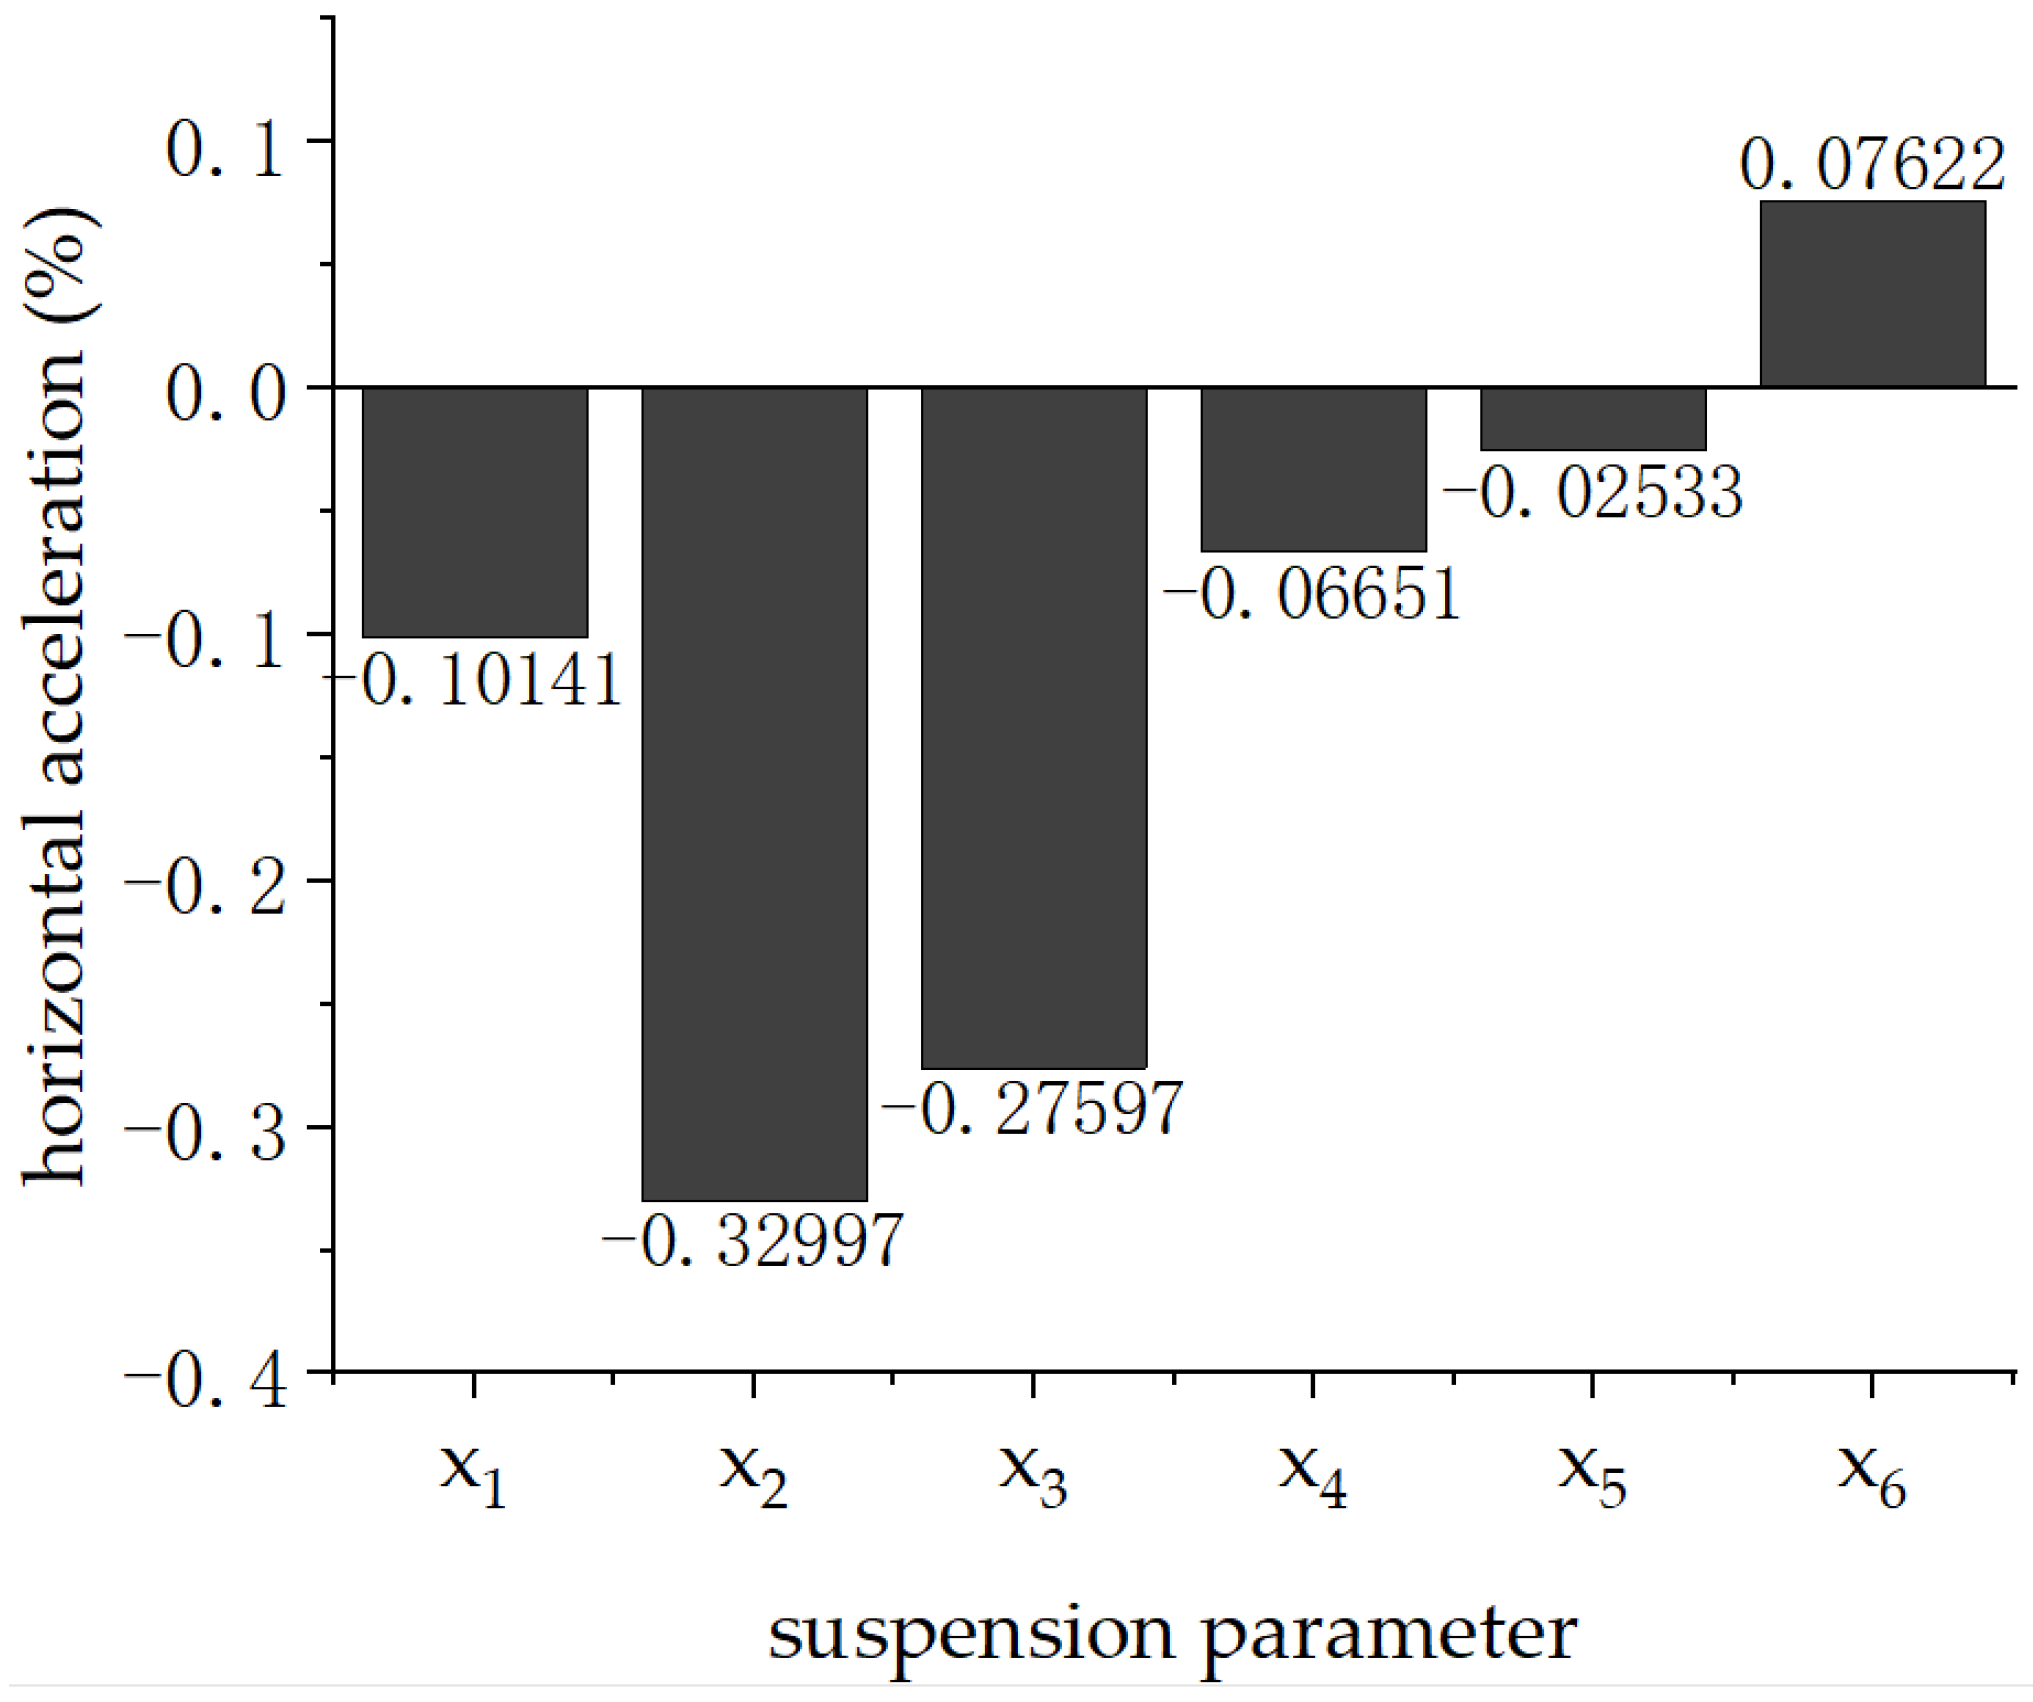
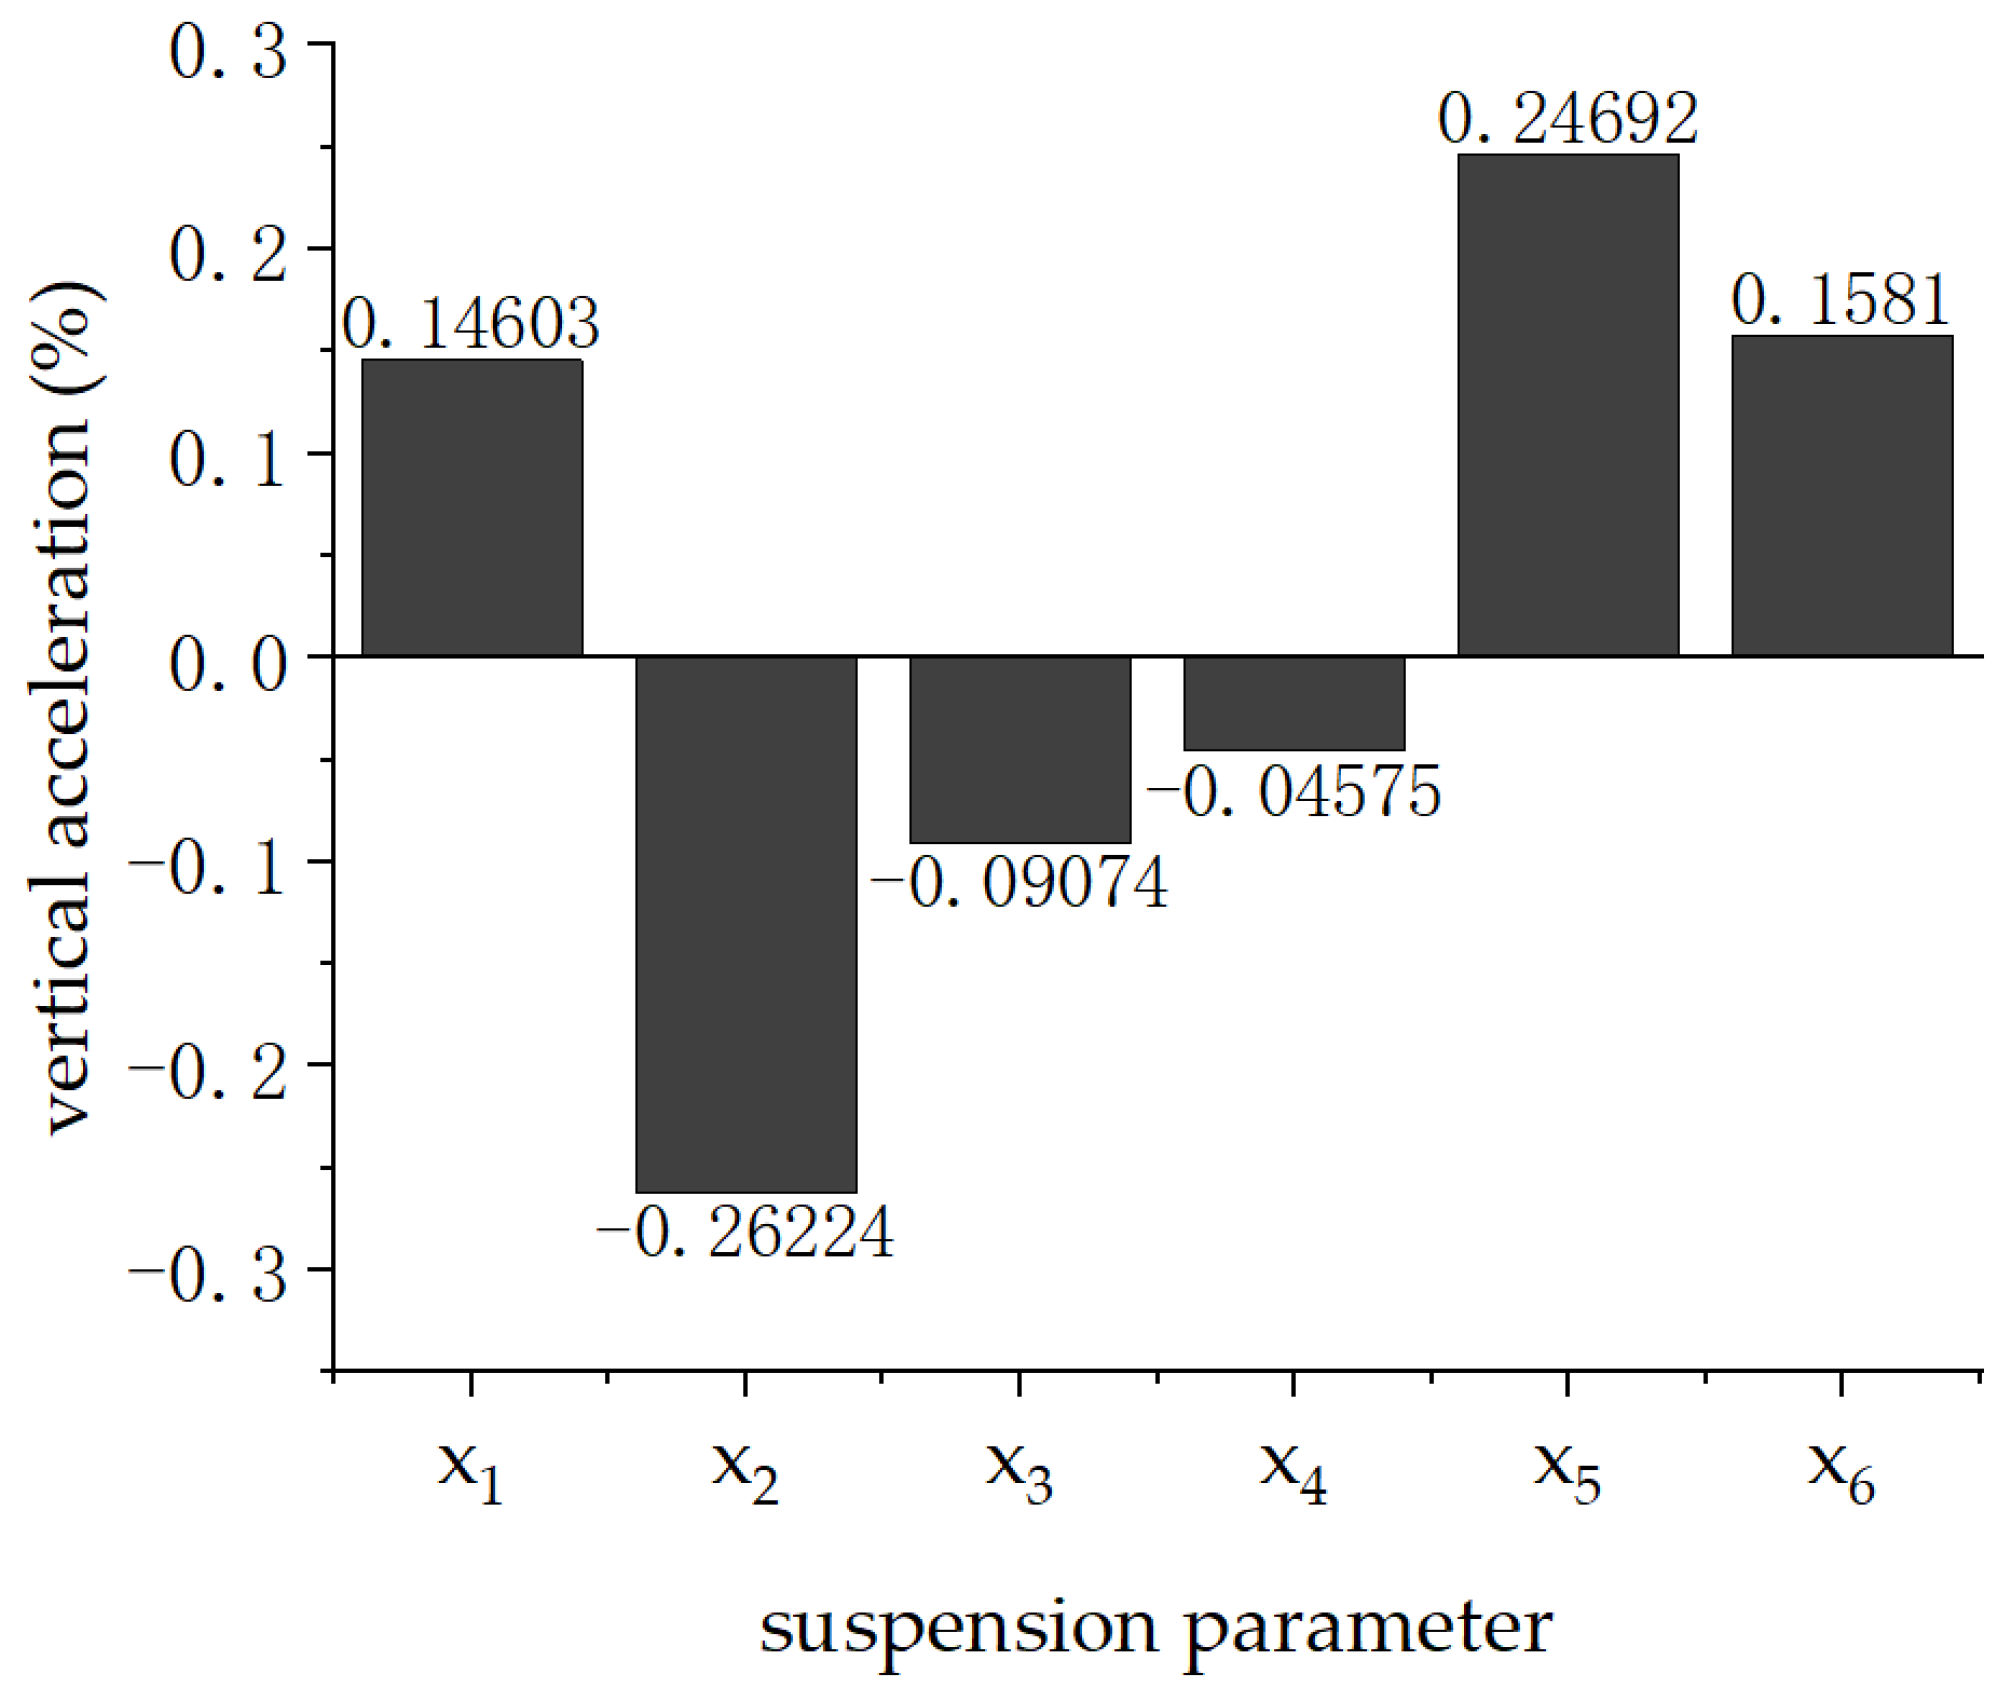
Figure 11 and Figure 12 show the correlation distributions of primary suspension parameters with vertical and horizontal acceleration, respectively. According to Figure 11, it can be seen that the lateral acceleration index has the largest correlation with the longitudinal stiffness , with a correlation value of 0.32997, and a negative correlation. Then, other large contribution to the lateral acceleration was made by the lateral damping and longitudinal damping , with the vertical stiffness and the lateral damping being negatively correlated. As evident from Figure 12, it can be seen that the magnitude of vertical acceleration has the largest correlation with longitudinal stiffness , with a correlation value of 0.26224 and a negative correlation. Then, other large contribution to the vertical acceleration was made by the vertical damping and the vertical stiffness , both of which have positive correlations.
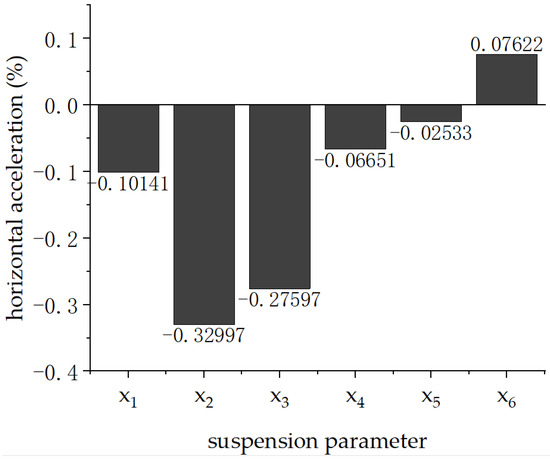
Figure 11.
Correlation diagram of primary suspension parameters and lateral acceleration.
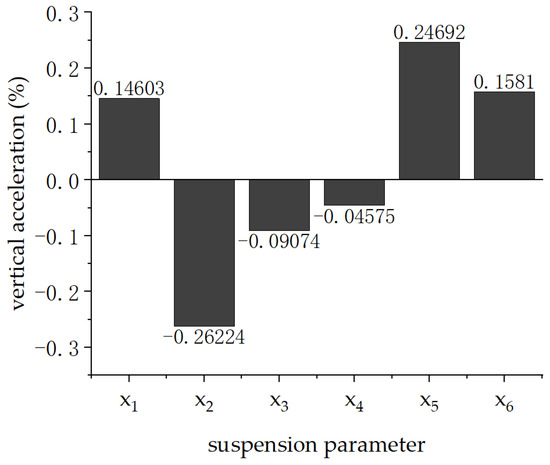
Figure 12.
Correlation diagram of primary suspension parameters and vertical acceleration.
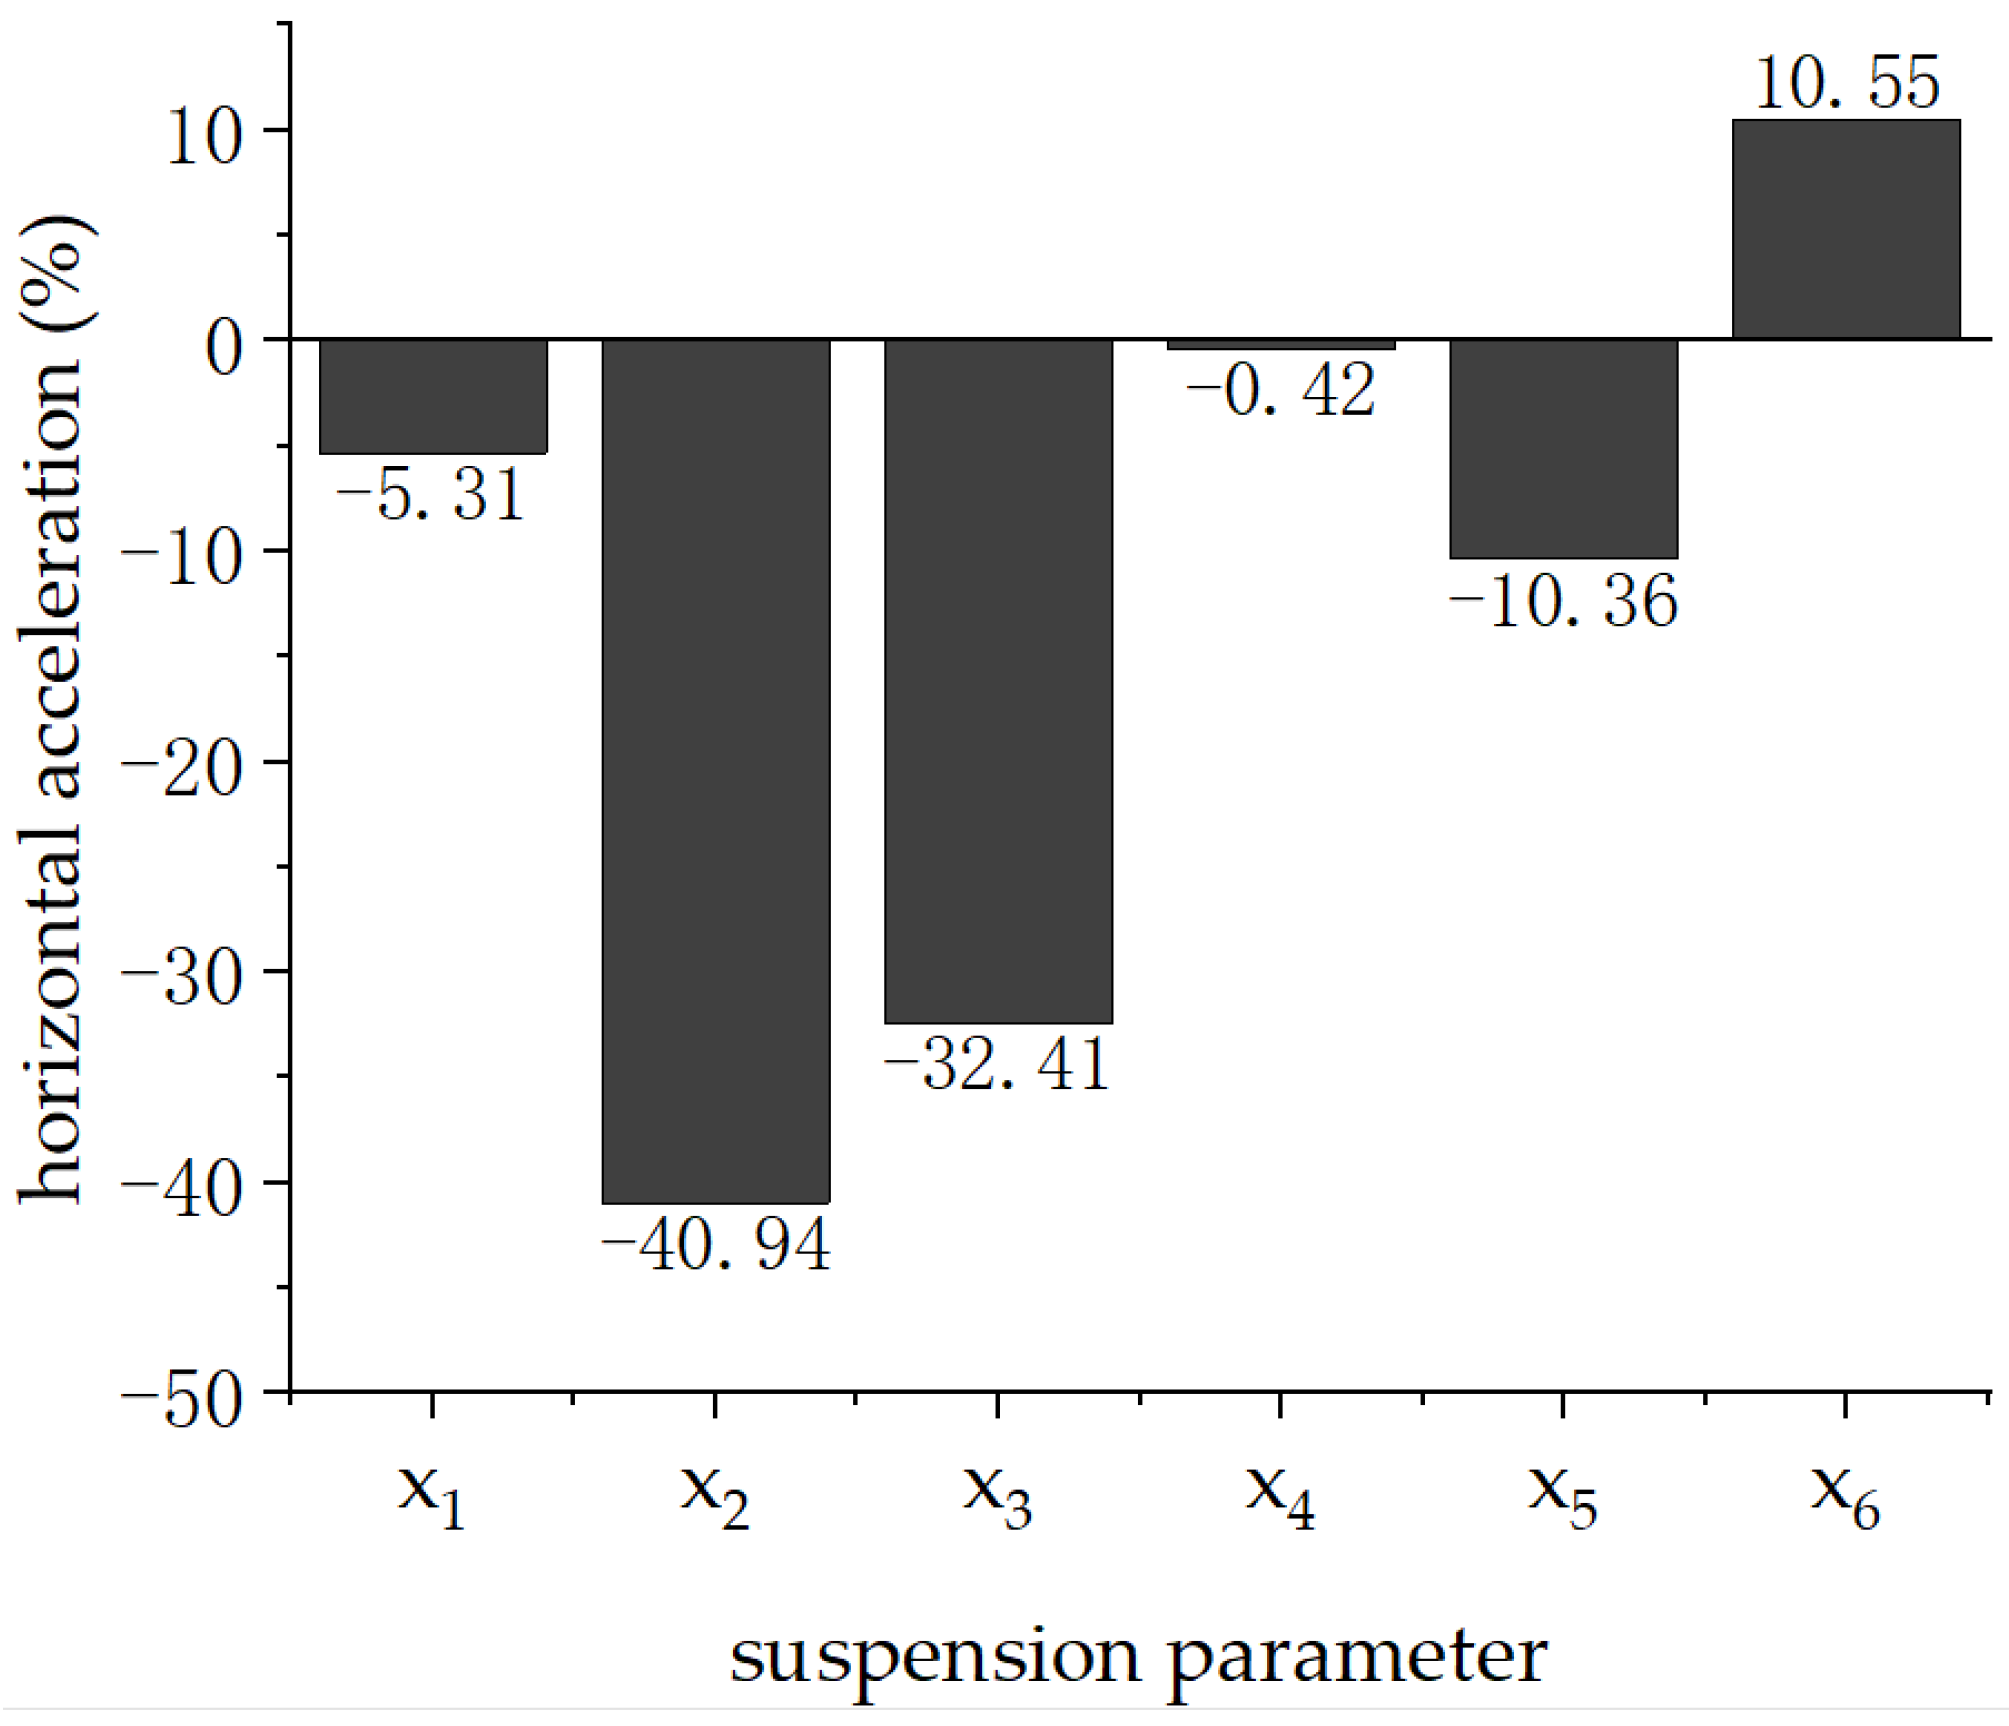
Figure 13 shows the contribution of each primary suspension parameter to the lateral stability index response. Evidently, longitudinal stiffness had a negative effect on the lateral stability index, with a contribution rate of more than 40%, and had the most influential effect. Then, the lateral damping and the vertical stiffness had an influence on the lateral stability. Lastly, the vertical damping had a negative influence on the lateral stability index, with an influence rate of more than 10%.
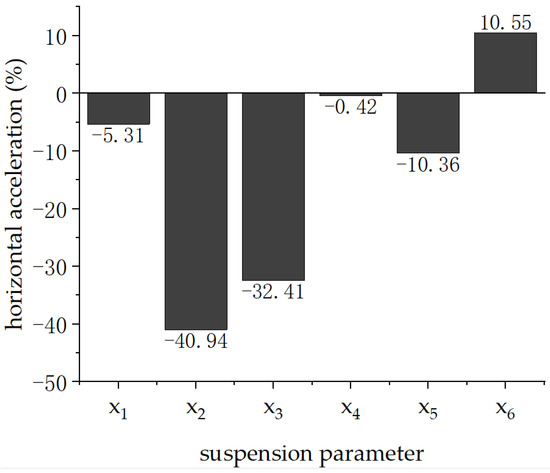
Figure 13.
Contribution rate of the primary suspension parameters to the lateral acceleration.
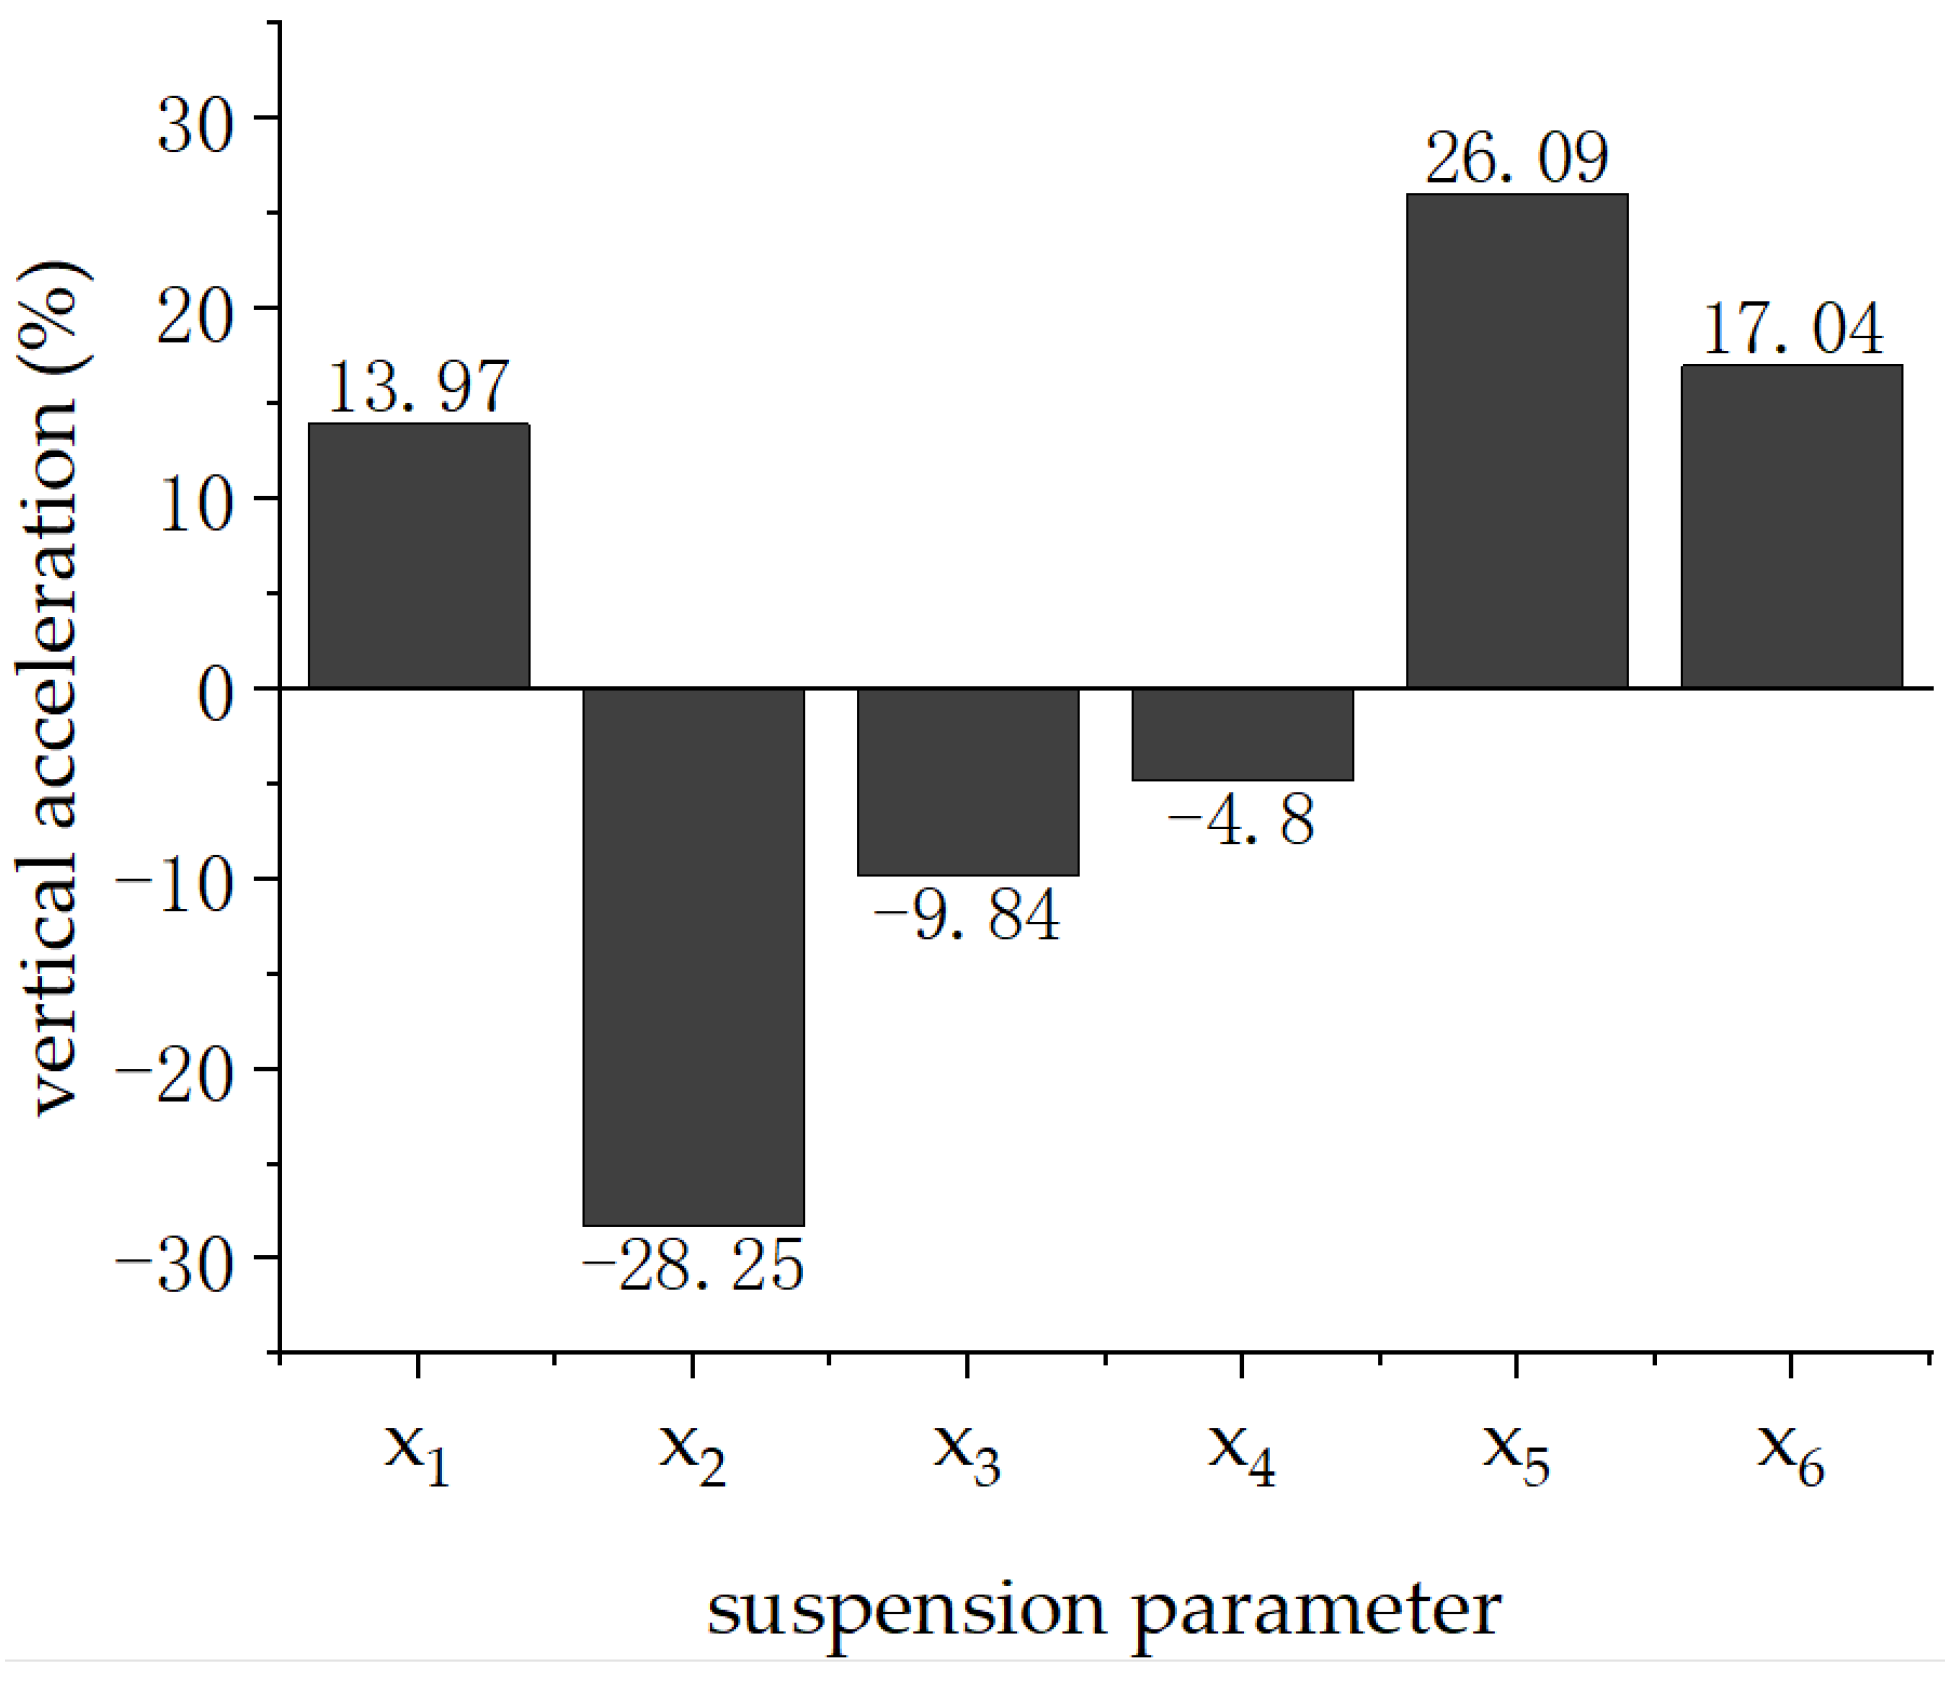
Figure 14 shows the contribution of each primary suspension parameter to the response of the vertical stability index. Evidently, the longitudinal stiffness had a negative effect on the vertical stability index, with a contribution rate of more than 25%, which was the most influential. Then, the vertical damping and vertical stiffness had a great influence on the vertical stability, with positive effects and a contribution rate of more than 15%. Lastly, the longitudinal damping had a positive effect and a contribution rate of more than 10%.
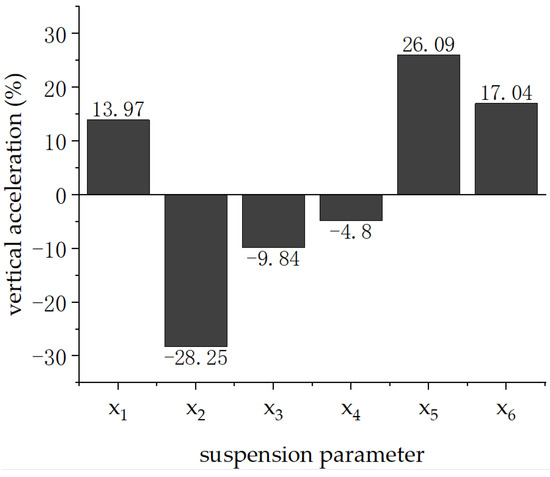
Figure 14.
Contribution rate of the primary suspension parameters to the vertical acceleration.
6. Multi-Objective Optimization
6.1. Theoretical Analysis
Based on the sensitivity analysis results, longitudinal stiffness , lateral damping , vertical damping , and vertical stiffness , which have a significant influence on vertical and lateral accelerations, were selected as input parameters for optimization. Vehicle dynamics systems have a high degree of nonlinearity and several input and output parameters. In addition, there are often conflicting relationships among the objectives in multi-objective optimization problems [28,29]. Therefore, it is necessary to measure the weights of multiple objectives and build a multi-objective optimization model for vertical and lateral smoothness as shown in Equation (6) [30,31].
Here,
xi: design variable where i = 1, 2, 3, 5;
ym(xi): sub-objective function of m, m = 1, 2; and
Pm: percentage of outcome weights for the mth sub-objective function.
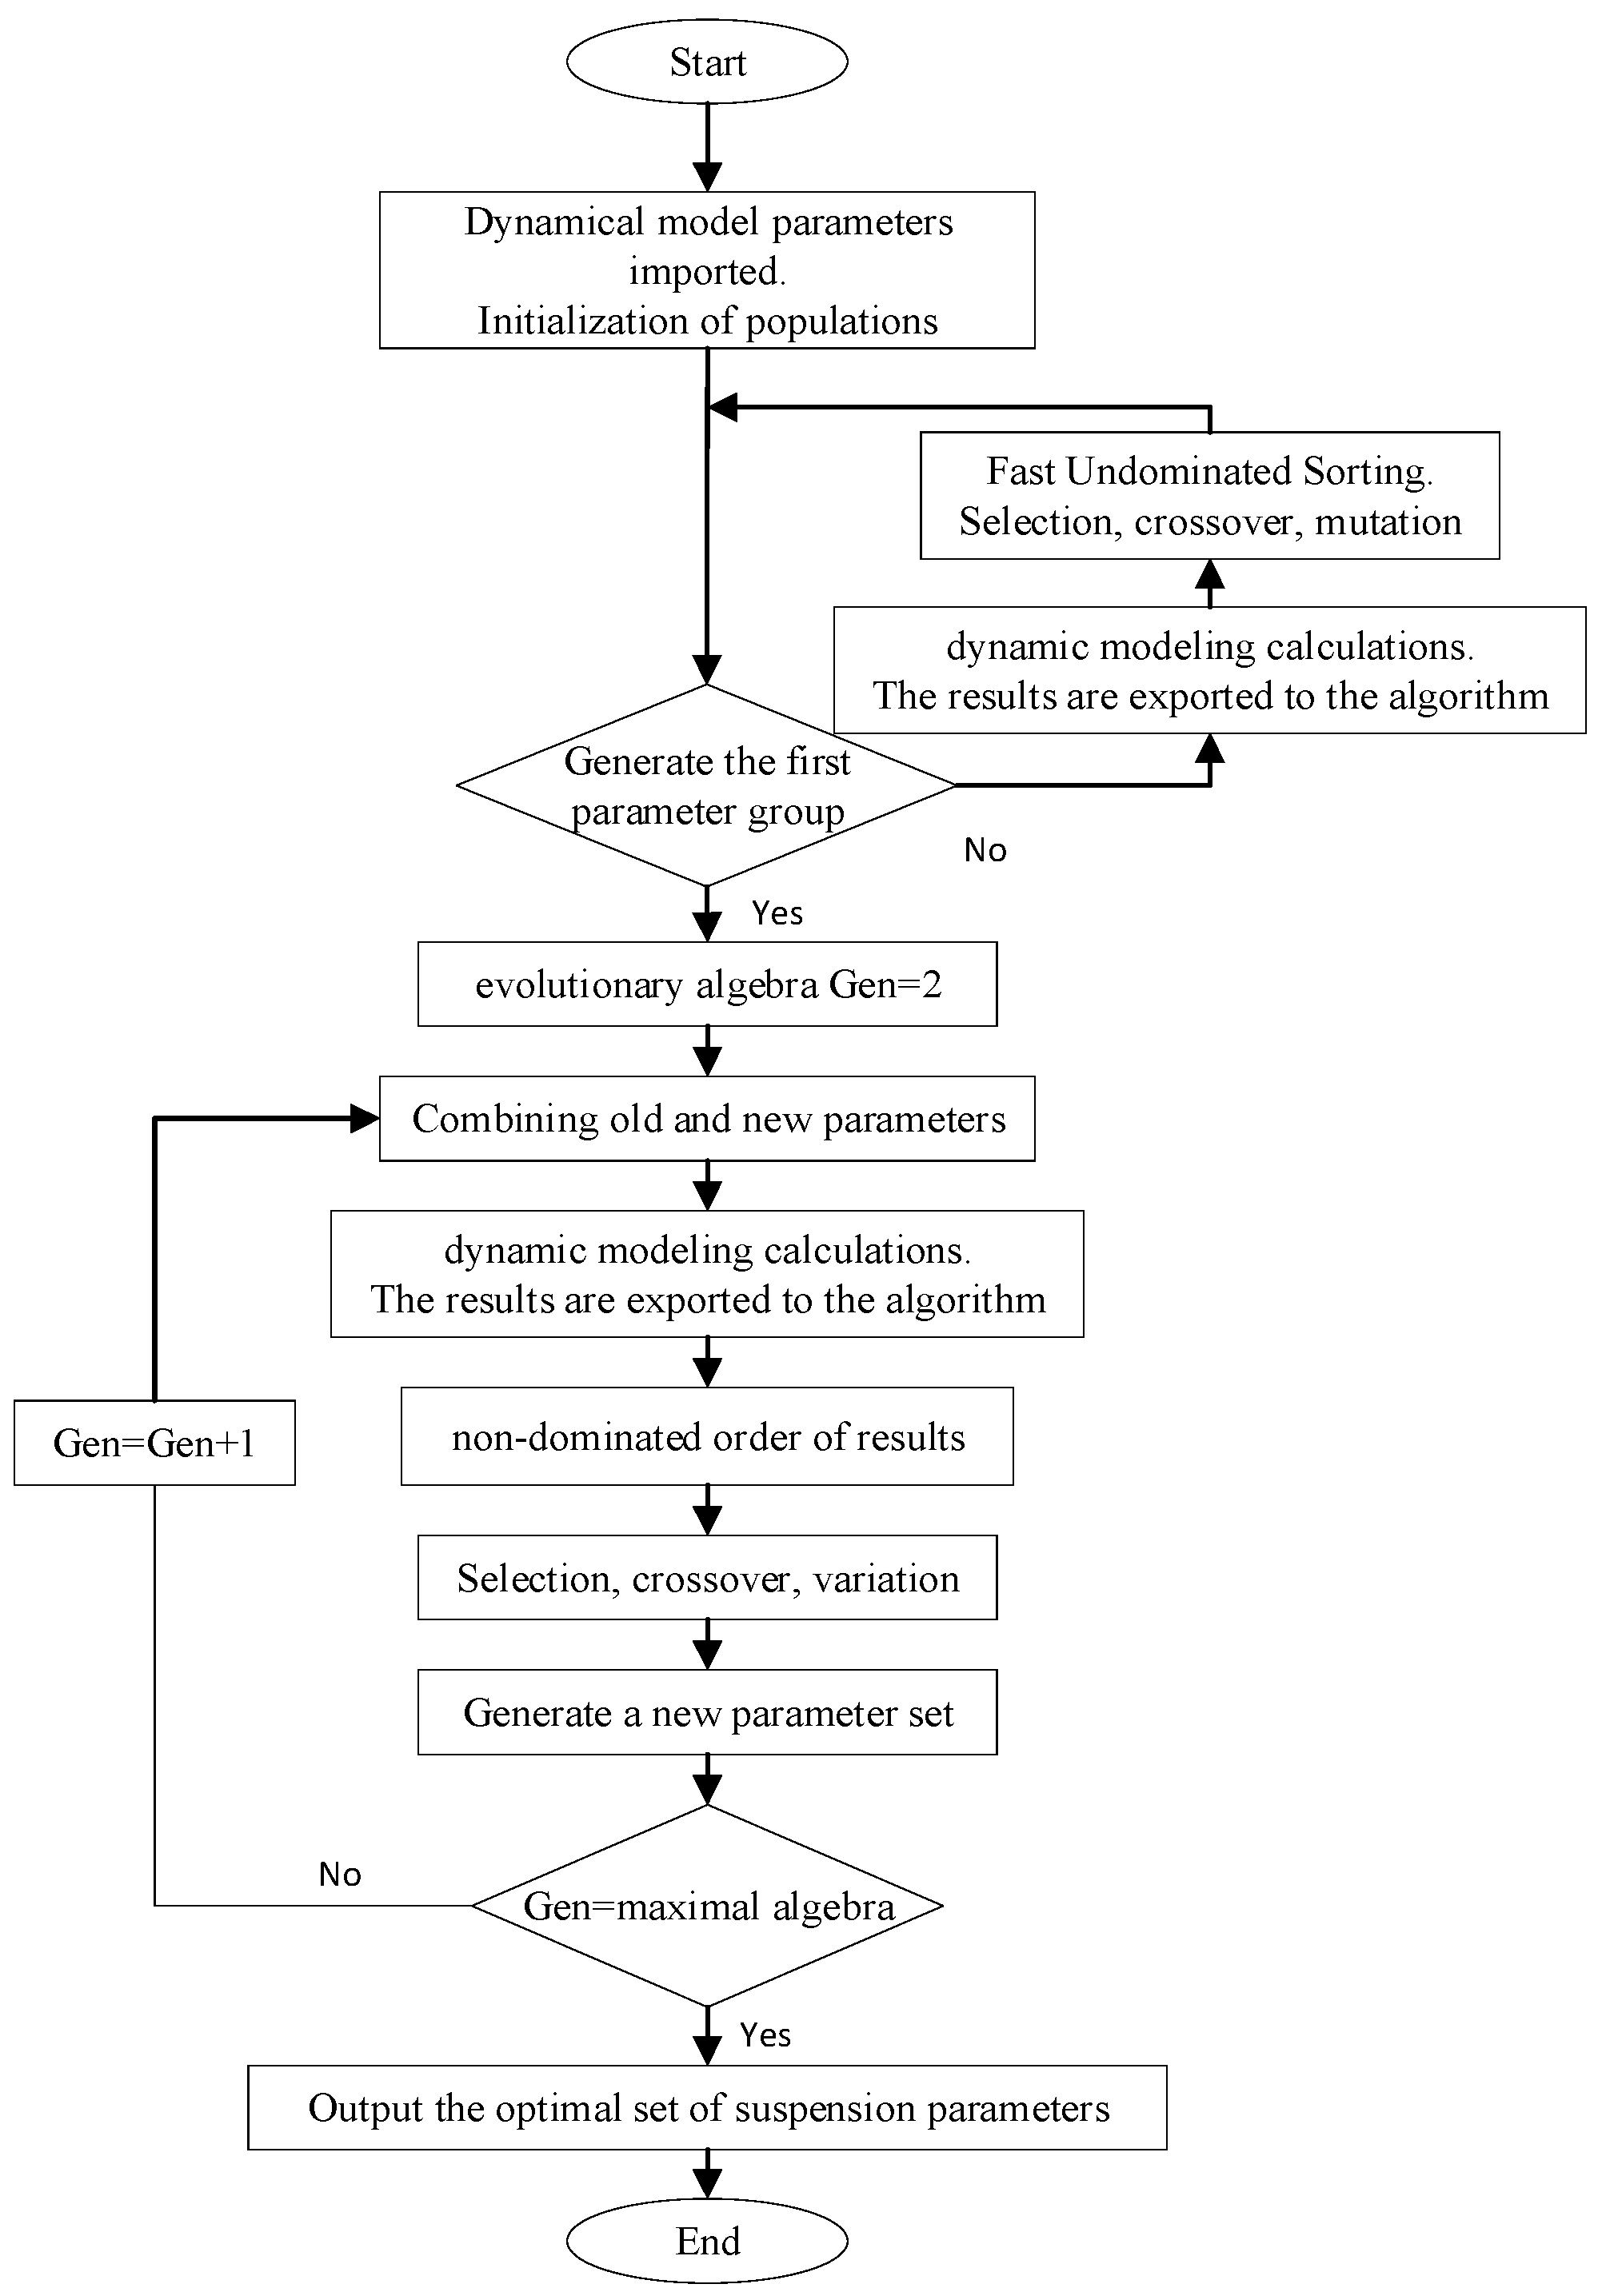
Common optimization design methods include the genetic optimization algorithm, particle swarm optimization algorithm, and ant colony optimization algorithm. Compared with the genetic optimization algorithm, the ant colony optimization algorithm is computationally time-consuming and complex when solving large-scale combinatorial optimization problems, while the particle swarm algorithm lacks dynamic regulation of speed and is prone to falling into local optimal solutions. Both the NSGA-II genetic algorithm [13,32] and the AMGA algorithm [33] exhibit robust global exploration capabilities, allowing for simultaneous comparison of multiple individuals and demonstrating potential parallelism. Moreover, they possess strong scalability, facilitating easy improvements [34]. Therefore, the two major genetic algorithms for the multi-objective optimization of train dynamic performance are both reliable. In this experiment, two algorithms were used separately for iterative optimization, and the best of the two results was selected as the final optimization method. The flow of the multi-objective optimization system for the primary suspension parameters of an inner axle-box bogie is shown in Figure 15.

Figure 15.
Multi-objective optimization design process of the primary suspension parameters of the bogie.
6.2. Evaluation Criteria
The operational safety performance index of the wheelset with the worst safety performance of the vehicle was used as the object of analysis. According to the provisions of the relevant sections of the “Dynamic Performance Evaluation and Test Method for Particular Class Vehicles and Tracked Machine” (GB/T17426-1998) [25], there are standards for dynamic performance indexes such as the disengage rail factor, wheel axle lateral force, and wheel load reduction rate, which affect the dynamic performance of the vehicle, as shown in Table 5.
Table 5.
Evaluation criteria for the dynamic performance indexes.
6.3. Optimization Process
First, the NSGA-II multi-objective solving method was employed, with vertical and lateral accelerations set as optimization objectives for the iterative optimization calculation of the suspension parameters of the model’s dynamic performance. Population sizes of 24 and 40 generations were used, the crossover probability was 0.9, and a total of 959 iterations were used to find one set of Pareto solution sets.
Subsequently, the AMGA was employed as the multi-objective solution method, with an initial scale number of 40,500 evaluations, a crossover probability of 0.9, and a mutation probability of 0.5. The aim of this optimization was to find a one-group Pareto solution set.
Finally, the optimized suspension parameters from both algorithms were applied to the model in the simulation calculation. The dynamics indexes of the calculated results were compared, and the set with superior results was selected as the final result.
6.4. Analysis of Results
The optimization results of the NSGA-II algorithm are given below. A comparison of the primary suspension parameters before optimization and after optimization are shown in Table 6, while a comparison of the simulation results before optimization of the algorithm and after optimization are shown in Table 7 [35].
Table 6.
Comparison of various suspension parameters before and after optimization using the NSGA-II algorithm.
Table 7.
Comparison of the dynamic indexes before and after optimization using the NSGA-II algorithm.
The optimization results of the AMGA algorithm are given below. A comparison of the suspension parameters before and after optimization are shown in Table 8, while a comparison of the simulation results before and after optimization are shown in Table 9.
Table 8.
Comparison of various suspension parameters before and after optimization using the AMGA algorithm.
Table 9.
Comparison of the dynamic indexes before and after optimization using the AMGA algorithm.
The dynamic simulation results reveal that, after primary suspension parameters were optimized by the two algorithms, the dynamic performance indexes of the bogie still conformed to the “Dynamic Performance Evaluation and Test Method for Particular Class Vehicles and Tracked Machine” (GB/T17426-1998) [25]. In particular, the optimization by the AMGA algorithm improved the vertical acceleration by 3.497% and the lateral acceleration by 23.333%, while that by the NSGA-II algorithm enhanced the vertical acceleration by 4.895% and the lateral acceleration by 11.667%.
In summary, the AMGA algorithm demonstrated a more salient effect on improving both the vertical and lateral accelerations. These results suggest that the AMGA algorithm is more adaptable when a battery track engineering vehicle with an inner axle-box bogie navigates a minimum radius curve of 20 m.
7. Conclusions
A full rigid body dynamics model and a rigid–flexible coupled model for the flexible frame of an inner axle-box bogie of a battery track engineering vehicle were established. Nonlinear critical speed analysis, curving performance theory analysis, and stability optimization were performed for the rigid–flexible coupled model of a battery track engineering vehicle.
We can draw the following conclusions:
(1) Correlation and sensitivity analyses of the primary suspension design variables of the bogie by the optimal Latin hypercube design methodology revealed that lateral acceleration correlates the most with Longitudinal stiffness and is most affected by Longitudinal stiffness, while vertical acceleration correlates the most with Longitudinal stiffness and is most affected by Longitudinal stiffness.
(2) Using the NSGA-II and AMGA algorithms, the primary suspension parameters were multi-objectively optimized by taking the minimum values of the lateral acceleration and vertical acceleration as the optimization objectives. The optimizations reduced the vertical acceleration of the vehicle from 0.715 to 0.69 during driving, which improved the stability of the vehicle by 3.497%. Furthermore, they reduced its lateral acceleration from 1.8 to 1.38, which improved its stability by 23.333%, and the optimization effect was evident.
Combining the dynamics model with the optimization algorithm for multi-objective optimization, the vertical and lateral stability of a battery track engineering vehicle navigating a minimum radius curve was significantly improved. This approach not only improved the performance of the vehicle but also demonstrated the effectiveness of the combined model and algorithm in enhancing its stability. The results of this study lay a theoretical foundation for the improvement of vehicle dynamics performance and the operational safety of rail vehicles.
Author Contributions
Conceptualization, J.Z. and Y.S.; methodology, J.Z. and M.Z.; software, J.Z.; validation, J.Z.; formal analysis, J.Z. and C.W.; investigation, C.W.; resources, C.W.; data curation, J.Z.; writing—original draft preparation, J.Z.; writing—review and editing, J.Z. and M.Z.; visualization, J.Z.; supervision, M.Z.; project administration, Y.S.; funding acquisition, Y.S. All authors have read and agreed to the published version of the manuscript.
Funding
This research was funded by Hubei Province, a major project of the Indian broad gauge ballast shaping car key technology research and manufacturing, grant number 2022EHB022.
Institutional Review Board Statement
Not applicable.
Informed Consent Statement
Not applicable.
Data Availability Statement
Data are available on request from the authors.
Conflicts of Interest
The authors declare no conflicts of interest.
References
- Xue, H.; Gobbi, M.; Matta, A. Multi-fidelity surrogate-based optimal design of road vehicle suspension systems. Optim. Eng. 2023, 24, 2773–2794. [Google Scholar] [CrossRef]
- Pandey, M.; Bhattacharya, B. Effect of bolster suspension parameters of three-piece freight bogie on the lateral frame force. Int. J. Rail Transp. 2020, 8, 45–65. [Google Scholar] [CrossRef]
- Ashtiani, H. Optimization of secondary suspension of three-piece bogie with bevelled friction wedge geometry. Int. J. Rail Transp. 2017, 5, 213–228. [Google Scholar] [CrossRef]
- Yang, Y.; Zeng, W.; Wang, T.; Liao, Y. Multi-objective optimization of suspension parameters for rail vehicles based on a virtual prototype surrogate model. J. Chin. Inst. Eng. 2016, 39, 746–754. [Google Scholar] [CrossRef]
- Pandey, M.; Bhattacharya, B. A Parametric Study Analysing the Effect of Bolster Suspension Parameters on the Carbody Dynamic Response in a Freight Wagon Fitted with Three-Piece Bogie. J. Vib. Eng. Technol. 2020, 8, 625–641. [Google Scholar] [CrossRef]
- Sun, W.; Zhou, J.; Gong, D.; You, T. Analysis of modal frequency optimization of railway vehicle car body. Adv. Mech. Eng. 2016, 8, 1687814016643640. [Google Scholar] [CrossRef]
- Zhou, J.; Goodall, R.; Ren, L.; Zhang, H. Influences of car body vertical flexibility on ride quality of passenger railway vehicles. Proc. Inst. Mech. Eng. Part F J. Rail Rapid Transit 2009, 223, 461–471. [Google Scholar] [CrossRef]
- Sharma, S.K.; Sharma, R.C.; Choi, Y.; Lee, J. Experimental and Mathematical Study of Flexible-Rigid Rail Vehicle Riding Comfort and Safety. Appl. Sci. 2023, 13, 5252. [Google Scholar] [CrossRef]
- Zhang, M.; Li, X.; Liu, X. Dynamic Performance Analysis of a Urban Rail Vehicle Based on Rigid-Flexible Coupling. In Advances in Material; AIP Publishing: Melville, NY, USA, 2019. [Google Scholar]
- Ling, L.; Jiang, P.; Wang, K.; Zhai, W. Nonlinear Stability of Rail Vehicles Traveling on Vibration-Attenuating Slab Tracks. J. Comput. Nonlinear Dyn. 2020, 15, 071005. [Google Scholar] [CrossRef]
- Li, G.; Wu, R.; Deng, X.; Shen, L.; Yao, Y. Suspension parameters matching of high-speed locomotive based on stability/comfort Pareto optimization. Veh. Syst. Dyn. 2022, 60, 3848–3867. [Google Scholar] [CrossRef]
- Yang, Y.; Zeng, W.; Qiu, W.-S.; Wang, T. Optimization of the suspension parameters of a rail vehicle based on a virtual prototype Kriging surrogate model. Proc. Inst. Mech. Eng. Part F J. Rail Rapid Transit 2016, 230, 1890–1898. [Google Scholar] [CrossRef]
- Manish, P.G.; Rommel, G.R.; Rituparna, D.; Bishakh, B. Surrogate-assisted multi-objective optimization of the dynamic response of a freight wagon fitted with three-piece bogies. Int. J. Rail Transp. 2021, 9, 290–309. [Google Scholar]
- Bideleh, S.M.M. Robustness analysis of bogie suspension components Pareto optimised values. Veh. Syst. Dyn. 2017, 55, 1189–1205. [Google Scholar] [CrossRef]
- Yao, Y.; Chen, X.; Li, H.; Li, G. Suspension parameters design for robust and adaptive lateral stability of high-speed train. Veh. Syst. Dyn. 2023, 61, 943–967. [Google Scholar] [CrossRef]
- Chen, X.; Shen, L.; Hu, X.; Li, G.; Yao, Y. Suspension parameter optimal design to enhance stability and wheel wear in high-speed trains. Veh. Syst. Dyn. 2024, 62, 1230–1252. [Google Scholar] [CrossRef]
- Chen, X.; Yao, Y.; Shen, L.; Zhang, X. Multi-objective optimization of high-speed train suspension parameters for improving hunting stability. Int. J. Rail Transp. 2022, 10, 159–176. [Google Scholar] [CrossRef]
- Zhang, X.; Wu, G.; Li, G.; Yao, Y. Actuator optimal placement studies of high-speed power bogie for active hunting stability. Veh. Syst. Dyn. 2020, 58, 108–122. [Google Scholar] [CrossRef]
- Yao, Y.; Li, G.; Sardahi, Y.; Sun, J.-Q. Stability enhancement of a high-speed train bogie using active mass inertial actuators. Veh. Syst. Dyn. 2019, 57, 389–407. [Google Scholar] [CrossRef]
- Xiao, Q.; Li, Q.; Chang, C. The influence of lateral shock absorber valve parameters on vehicle dynamic performance. J. Mech. Sci. Technol. 2015, 29, 1907–1911. [Google Scholar] [CrossRef]
- Jin, R.; Wei, C.; Sudjianto, A. An efficient algorithm for constructing optimal design ofcomputer experiments. J. Stat. Plan. Inference 2016, 134, 268–287. [Google Scholar] [CrossRef]
- Sharma, S.K.; Sharma, R.C.; Lee, J. Effect of Rail Vehicle-Track Coupled Dynamics on Fatigue Failure of Coil Spring in a Suspension System. Appl. Sci. 2021, 11, 2650. [Google Scholar] [CrossRef]
- Ambrosio, J. Train kinematics for the design of railway vehicle components. Mech. Mach. Theory 2010, 45, 1035–1049. [Google Scholar] [CrossRef]
- Bustos, A.; Tomas-Rodriguez, M.; Rubio, H.; Castejon, C. On the nonlinear hunting stability of a high-speed train bogie. Nonlinear Dyn. 2023, 111, 2059–2078. [Google Scholar] [CrossRef]
- GB/T17426—1998; State Bureau of Quality and Technical Supervision. Dynamic Performance Evaluation and Test Methodfor Particular Class Vehicles and Tracked Machine. China Railway Publishing House: Beijing, China, 1998.
- Zou, H.; Wu, Q.; Zou, X. Research on optimization Design of Suspension Parameters of railway vehicle bogies based on surrogate model. Multimed. Tools Appl. 2022. [Google Scholar] [CrossRef]
- Liu, Y.; Hu, T.; Zhuang, J.; Sheng, J. Optimal design of variable suspension parameters for variable-gauge trains based on the improved CRITIC method. J. Chin. Inst. Eng. 2023, 46, 638–648. [Google Scholar] [CrossRef]
- Yongzhi, J.; Pingbo, W.; Jing, Z.; Yingsheng, Z.; Yunchang, Z.; Shuai, W. Multi-parameter and multi-objective optimisation of articulated monorail vehicle system dynamics using genetic algorithm. Veh. Syst. Dyn. 2020, 58, 74–91. [Google Scholar]
- Jinfeng, Z.; Zixu, Z.; Xueyan, Z.; Yichen, M.; Weihong, C. Study on the influence of uneven settlement and small curve radius on metro train running safety and riding comfort. Structures 2023, 51, 1806–1820. [Google Scholar]
- Fossati, G.G.; Miguel, L.F.F.; Casas, W.J.P. Multi-objective optimization of the suspension system parameters of a full vehicle model. Optim. Eng. 2019, 20, 151–177. [Google Scholar] [CrossRef]
- Ling, Q.; Dai, J.; He, X.; Chen, S.; Chen, Z. Allocation Optimization of Multi-Axis Suspension Dynamic Parameter for Tracked Vehicle. Complexity 2021, 2021, 8961020. [Google Scholar] [CrossRef]
- Zhang, J.; Wang, C.; Zhou, H.; Lu, H. Sensitivity analysis and multi-objective optimization of the virtual track train parameters considering the coupling effect between vehicles. Proc. Inst. Mech. Eng. Part D J. Automob. Eng. 2023, 238, 09544070231151994. [Google Scholar] [CrossRef]
- Cui, L.; Luo, J.; Su, Z.; Li, Y.; Li, J.; Zhu, Z.; Ma, G. Fast Optimization of Null-Flux Coils for Superconducting Electrodynamic Suspension Train with RSM and AMGA. IEEE Trans. Appl. Supercond. 2022, 32, 3602308. [Google Scholar] [CrossRef]
- Zeng, W.; Yang, Y.; Qiu, W.-S.; Xie, H.; Xie, S.-C. Optimization of the target profile for asymmetrical rail grinding in sharp-radius curves for high-speed railways. Adv. Mech. Eng. 2017, 9, 1687814016687196. [Google Scholar] [CrossRef]
- Yang, Y.; He, Q.; Cai, C.; Li, R.; Zhu, S. Multi-objective optimization of the dynamic performance of a suspended monorail vehicle based on an effective surrogate model. Eng. Optim. 2023. [Google Scholar] [CrossRef]


Disclaimer/Publisher’s Note: The statements, opinions and data contained in all publications are solely those of the individual author(s) and contributor(s) and not of MDPI and/or the editor(s). MDPI and/or the editor(s) disclaim responsibility for any injury to people or property resulting from any ideas, methods, instructions or products referred to in the content. |
© 2024 by the authors. Licensee MDPI, Basel, Switzerland. This article is an open access article distributed under the terms and conditions of the Creative Commons Attribution (CC BY) license (https://creativecommons.org/licenses/by/4.0/).