Article

A Novel Techno-Economical Control of UPFC against Cyber-Physical Attacks Considering Power System Interarea Oscillations

by
Muntasser Ahmed Mosleh Mosleh
* and
Nurettin Umurkan
Department of Electrical Engineering, Yildiz Technical University, Istanbul 34220, Turkey
*
Author to whom correspondence should be addressed.
Appl. Sci. 2024, 14(12), 5254; https://doi.org/10.3390/app14125254
Submission received: 28 April 2024 / Revised: 12 June 2024 / Accepted: 14 June 2024 / Published: 17 June 2024

Abstract

:
In the field of electrical engineering, there is an increasing concern among managers and operators about the secure and cost-efficient operation of smart power systems in response to disturbances caused by physical cyber attacks and natural disasters. This paper introduces an innovative framework for the hybrid, coordinated control of Unified Power Flow Controllers (UPFCs) and Power System Stabilizers (PSSs) within a power system. The primary objective of this framework is to enhance the system’s security metrics, including stability and resilience, while also considering the operational costs associated with defending against cyber-physical attacks. The main novelty of this paper lies in the introduction of a real-time online framework that optimally coordinates a power system stabilizer, power oscillation damper, and unified power flow controller to enhance the power system’s resilience against transient disturbances caused by cyber-physical attacks. The proposed approach considers technical performance indicators of power systems, such as voltage fluctuations and losses, in addition to economic objectives, when determining the optimal dynamic coordination of UPFCs and PSSs—aspects that have been neglected in previous modern research. To address the optimization problem, a novel multi-objective search algorithm inspired by Harris hawks, known as the Multi-Objective Harris Hawks (MOHH) algorithm, was developed. This algorithm is crucial in identifying the optimal controller coefficient settings. The proposed methodology was tested using standard IEEE9-bus and IEEE39-bus test systems. Simulation results demonstrate the effectiveness and efficiency of this approach in achieving optimal system recovery, both technically and economically, in the face of cyber-physical attacks.

1. Introduction

1.1. Importance

In contemporary power systems, instability presents a significant challenge, disrupting the normal operation of the system and impacting its security and financial aspects. Neglecting the timely resolution of power system oscillations can lead to either system instability, deviations from optimal operating conditions, or a complete blackout. Nevertheless, the widespread deployment and utilization of UPFCs in modern power systems has shown promising results in enhancing the capacity of transmission lines [1]. Currently, a wide array of Flexible Alternating Current Transmission System (FACTS) devices, including UPFCs and similar devices, has been introduced and integrated into practical power systems. The systematic application of a PSS in conjunction with a UPFC serves as an effective means to ensure power system stability and to mitigate the occurrence of Low-Frequency Oscillations (LFOs) that may arise during disturbances [1]. Furthermore, appropriately adjusting the parameters of both the PSS and UPFC in a coordinated manner to protect against cyber-physical attacks can offer a practical and advantageous solution for optimal and secure operation of the modern power system. This pertinent topic is further elucidated in the current paper. The following section delves into an exploration of relevant studies and research conducted in this specific field of interest.

1.2. Literature Review

The significance of a power system lies in its essential role of delivering secure and cost-efficient energy to consumers. To accomplish this goal, meticulous planning and the efficient management of the power system are imperative. Of particular importance is the precise control of power transmission lines, as it has a direct impact on the dependability and economic performance of the entire power grid. This article explores key facets of optimal power control, with a specific emphasis on mitigating low-frequency electromechanical oscillations that have the potential to jeopardize the stability and functionality of the power system [2]. Low-frequency electromechanical oscillations, characterized by local (0.7–2.0 Hz) and interarea (0.1–0.8 Hz) modes, pose a significant risk to the stability of power systems. It is imperative to effectively suppress these oscillations to ensure the safe operation of the grid. Groundbreaking research conducted by DeMello and Concordia in 1969 [3] initiated inquiries into the synchronization and damping of torques in power systems with weak damping characteristics. Their work underscored the pivotal role of Automatic Voltage Regulators (AVRs) that exhibit fast response times, low time constants, and high gains in augmenting the stability boundaries of power systems during disruptive events.
While AVRs with swift response times prove effective under normal circumstances, they exhibit limitations under high-load conditions, particularly in weak transmission systems. To address these constraints and mitigate their detrimental effects on power system stability, power system stabilizers (PSSs) are integrated into the excitation systems of synchronous machines. PSSs are engineered to introduce electric torque that is synchronized with changes in the rotor’s angular velocity, thereby supplying damping torque [4]. Properly tuned PSSs have demonstrated remarkable efficacy, especially in managing local oscillatory patterns [4]. However, there are instances where PSSs may encounter challenges in damping interarea oscillations [5]. To confront the issue of interarea oscillations, FACTS emerges as a promising alternative.
FACTS not only enhances the overall performance of power systems but also possesses the ability to dampen interarea oscillations when coupled with a Power Oscillation Damping (POD) controller [6]. This amalgamation offers a comprehensive solution to the intricate problem of power system stability, ensuring effective control of interarea oscillations. Recently, many scholars have conducted research on LFO damping. In [7], the authors investigated the design of damping and internal controllers for UPFCs concerning LFO damping. In [8], the enhancement of a power system’s dynamic stability was discussed, utilizing a STATCOM and an FLC-based stabilizer. Researchers examined the coordinated design of a PSO-based multi-machine power system stabilizer and TCSC damping controller in [2,9]. The authors of [10] explored the utilization of a unified power flow controller to manage power flow and increase bus voltage in a power transmission system. In [3,11], the authors scrutinized the impact of UPFC settings on power flow within a power system. The authors of [12] described the utilization of a unified power flow controller to augment the capacity of active power flow in a power system employing an IEEE 14-bus system. The mitigation of low-frequency oscillations in a connected power system was outlined in [13]. The authors of [14] provided a comprehensive analysis of the role of unified power flow regulation in voltage power transfer. In [3,15], the authors detailed how the performance of power system stability was enhanced by employing multiple damping controllers based on PSS and UPFC. The improvement of power system damping through TCSC and controller design based on genetic algorithms was explored in [16]. In [17], the authors presented the damping function of a unified power flow controller. The impact of a UPFC-based damping controller on the dynamic stability of the Iraqi power network was addressed by the authors of [18]. The optimal multi-objective design of robust power system stabilizers using a tunicate swarm algorithm was presented in [19]. In [3,20], the authors discussed the dynamic performance of a 48-pulse GTO thyristor-based interline unified power flow controller (IUPFC) system. The authors of [21] introduced an adaptive UPFC-based stabilizer for the damping of low-frequency oscillations. In [22], the authors elaborated on how support vector regression enhanced the stability of an installed PSS-UPFC power system. Particle swarm optimization was employed by the authors of [23] to develop an output feedback UPFC controller for the damping of electromechanical oscillations. In [24], the authors demonstrated the most effective tuning method for a unified power flow controller to reduce interarea oscillations in a multi-machine system using the firefly method. In [25], the authors described a STATCOM controller design that dampens low-frequency oscillations in the power system using a modified shuffling frog leaping algorithm. The positioning and application of STATCOM storage for the enhancement of the voltage stability of power systems integrated with wind farms were detailed by the authors of [26]. A study of the stability and dynamic performance improvements in an autonomous microgrid utilizing an adaptive fuzzy PI controller was documented in [23]. The authors of [24] outlined the enhancement of the dynamic properties of a fuzzy control system.
In recent years, additional modulation controllers (MCs) have been integrated into FACTS devices to mitigate interarea oscillations [27]. However, conventional regulation techniques do not ensure the optimal performance of power system controllers, highlighting the need for a simultaneous regulation solution for PSS parameters. Several approaches have been suggested for the coordination of the regulation of PSS and FACTS device parameters, primarily relying on parametric optimization models [28,29]. These models, such as the transient state model [30] and the closed-loop residuals model [31], utilize gradient-based nonlinear optimization methods to tackle the issue. Despite their computational efficiency, these methods often struggle to identify the global system optimum or appropriate starting points.

1.3. Research Gaps

Upon conducting a thorough evaluation of prior research endeavors, it becomes evident that none of the preceding studies have employed coordinated control of both the PSS and UPFC with the primary objective of facilitating real-time protection of the power system against cyber-physical attacks. Furthermore, these studies have overlooked the simultaneous consideration of the economic and technical facets of the power system. For instance, in references [21,32], there was a proposal for a coordinated design involving a power system stabilizer and a unified power flow controller. However, this study did not incorporate a controller for the UPFC, and it did not consider the economic aspects of the power system. Similarly, reference [3] focused on enhancing a power system stabilizer and unified power flow controller within a power system. This was achieved by utilizing statistical and testing datasets to assess system efficiency under varying load conditions. However, this research did not address other technical aspects of the system, such as voltage deviations and operational costs.

1.4. Contributions

After addressing the deficiencies observed in earlier research, this paper introduces an innovative, online, real-time framework designed to enable the coordinated control of power system stabilizers (PSSs) and unified power flow controllers (UPFCs) to protect against cyber-physical attacks. This comprehensive framework incorporates economic, technical, and network reliability goals, setting itself apart from prior studies in the following ways:
  • Real-time coordination framework: This paper introduces a real-time online framework that optimally coordinates a power system stabilizer (PSS), power oscillation damper (POD), and unified power flow controller (UPFC). The framework aims to reduce generation and operation costs while preventing system instability. This coordination is achieved through the utilization of a multi-objective Harris hawks optimization (MHHO) algorithm, which focuses on mitigating low-frequency oscillations and ensuring the economical operation of the power system.
  • Enhanced resilience:The proposed framework enhances the power system’s resilience against transient disturbances caused by cyber-physical attacks. This is achieved by adjusting power flow in transmission lines and changing the generation points of the generators.
  • Comprehensive optimization:The framework takes into account technical performance indicators of power systems, such as voltage fluctuations and power losses, in addition to economic objectives. This holistic approach ensures the optimal dynamic coordination of the UPFC and PSS.
In summary, this paper not only proposes a real-time coordination framework for PSSs and UPFCs but also enhances the system’s resilience against cyber-physical attacks. It considers both technical and economic aspects to achieve optimal system operation.

1.5. Organization

The remained of this paper is structured as follows. Following the presentation of an introduction and overview in the initial section, Section 2 is dedicated to the discussion of the conceptual model. Following this, Section 3 features the presentation of the mathematical formulation of the proposed method. Additionally, Section 4 addresses the modeling of the proposed method within the framework of a multi-objective optimization method, accompanied by a flowchart. Section 5 centers on the simulation and the subsequent discussion of the results derived from it. Finally, the main conclusions of the article are presented in the fifth section.

2. Conceptual Model

Figure 1 presents a conceptual model outlining a strategy for effectively managing UPFCs and PSSs in response to cyber-physical attacks. As depicted in this diagram, an all-encompassing model needs to possess the ability to flexibly harness all available resources within the network. This includes the ability to regulate power flow, optimize generation costs, and address technical aspects of the power system in a real-time and continuous manner through a hierarchical control framework. It is crucial to emphasize that this approach considers not only economic objectives but also technical parameters of the network, such as power system oscillations and various technical aspects like losses and voltage deviations.
To enhance clarity on the issue, as illustrated in Figure 1, when a cyber-physical attack such as a line outage or generator outage occurs in any area of the power system, such as area 2, it can disrupt the power and energy flow paths in other transmission lines. This disruption can push the power system into a non-optimal state in terms of both technical and economic operations. In some cases, it might even drive the system to an unstable point. To address this, the proposed approach utilizes real-time and online data (including frequency, voltage, and power) from Data Measurement Units (DMUs) installed at each bus within the system. Operating within a hierarchical control framework, this approach sends appropriate and practical control signals to the unified power flow controller (UPFC) and power system stabilizers (PSSs). The goal is to protect and stabilize the system against cyber-physical attacks, considering both the technical aspects (such as voltage and frequency deviations) and economic aspects (such as generation costs).
The following definitions of the symbols in Figure 1 should be noted:
V s : sending-side voltage in area 1;
V R : receiving-side voltage in area 2;
P s : sending-side active power in area 1;
P R : receiving-side active power in area 2;
V d u p f c : d-axis reference voltage of shunt controller in the UPFC;
V q u p f c : q-axis reference voltage of shunt controller in the UPFC;
P * : active power reference of series controller in the UPFC;
Q * : reactive power reference of series controller in the UPFC;
V C : voltage induced into the power line by the series converter of the UPFC;
L: Equivalent inductance in the receiving side of the power network;
[ K i ] U P F C : Coefficient controller of the UPFC.
[ K i , T i ] P S S : coefficient controller of the PSS.

3. Mathematical and Problem Formulations

In this section, the text addresses the mathematical problem formulation of a proposed method for achieving optimal coordinated control of UPFCs and PSSs in response to cyber-physical attacks based on the process stages illustrated in Figure 2. The discussion considers several factors, including the generation oscillation index, voltage deviations, and optimal generation cost. To improve the optimization of the multi-objective mathematical function, which is introduced later, a developed multi-objective optimization algorithm is utilized, and its intricacies are explained within this section. Consequently, the modeling of cost functions for the purpose of damping oscillations and addressing other techno-economic indices is thoroughly examined in the subsequent subsections.
As illustrated in Figure 1 and Figure 2, the proposed approach is used in two states of the system, namely (1) normal operation and (2) post cyber-physical attack. According to the proposed algorithm shown in Figure 2, the central processing control of the system receives input signal data at each time step of the simulation or in real-world scenarios. The central processing unit then analyzes the technical and economic objectives of the system and attempts to optimally coordinate the controllers of the power system stabilizers (PSSs) and unified power flow controller (UPFC) to move the power system to a stable and economically optimal operation point, whether in normal operation or during the post-disturbance period following a cyber-physical attack. For instance, as depicted in Figure 1, when a cyber-physical attack such as a line outage or generator outage occurs in any area of the power system, such as area 2, it can disrupt the power and energy flow paths in other transmission lines. This disruption can push the power system into a non-optimal state in terms of both technical and economic operations. In some cases, it might even drive the system to an unstable point. To address this, the proposed approach utilizes real-time and online data (including frequency, voltage, and power) from data measurement units (DMUs) installed at each bus within the system. Operating within a hierarchical control framework, this approach sends appropriate and practical control signals to the unified power flow controller (UPFC), as shown in Figure 3, and the power system stabilizers (PSSs). The goal is to protect and stabilize the system against cyber-physical attacks, considering both the technical aspects (such as voltage and frequency deviations) and economic aspects (such as generation costs).

3.1. Power System Modeling with UPFCs and PSSs

In the initial phase, as part of the process to evaluate the proposed method’s performance, the research team started by investigating a Single-Machine, Infinite-Bus (SMIB) power system. Figure 3 visually represents the key components of the SMIB power system, which predominantly comprise a synchronous generator, an infinite bus, and a UPFC.

3.1.1. Generator Modeling

The analysis of the power system under consideration in this study considers the dynamics of the stator, field, and damper windings. The quantities associated with the stator and rotor are expressed using the two-axis reference frames, also known as the two-axis d-q frames. The system equations for this power system are provided in references [4,8,15].
V d = R s i d + d d t ϕ q ω R ϕ q
V q = R s i q + d d t ϕ q + ω R ϕ d
V f d = R f d i f d + d d t ϕ f d
V k d = R k d i k d + d d t ϕ k d
V k q 1 = R k q 1 i k q 1 + d d t ϕ k q 1
V k q 2 = R k q 2 i k q 2 + d d t ϕ k q 2
where:
ϕ d = L d i d + L m d ( i f d + i k d ) ,         ϕ q = L q i q + L m q + i k q
ϕ f d = L f d i d + L m d ( i d + i k d ) ,         ϕ k d = L k d i k d + L m d ( i d + i f d )
ϕ k q 1 = L k q 1 i k q 1 + L m q i q ,         ϕ k q 2 = L k q 2 i k q 2 + L m q i q
The equations include different subscripts to represent various quantities, such as d for d-axis, q for q-axis, R for rotor, S for stator, f for field, and k for damper winding. Additionally, l represents leakage, and m represents magnetizing inductance. In addition to these equations, the following mechanical equations are also relevant to this system:
d d t ω r = 1 J ( P e F ω r P m )
d d t θ = ω r
where the rotor angular velocity is denoted by ω r , while θ represents the angular position. The electrical power is referred to as ( p e ), while ( p m ) stands for mechanical power. On the other hand, (J) is the inertia of the rotor, while (F) represents its friction. These parameters are crucial in analyzing and optimizing the performance of a power system under different operating conditions.
The symbols used in Equations (1)–(8) are defined as follows:
V d : d-axis voltage of the generator;
V q : q-axis voltage of the generator;
R s : equivalent resistance of the stator in the generator;
i d : d-axis current of the stator in the generator;
i q : q-axis current of the stator in the generator;
ϕ d : d-axis magnetic flux of the stator in the generator;
ϕ q : q-axis magnetic flux of the stator in the generator;
ω r : rotor angular velocity;
V f d : derivative d-axis voltage of the generator;
V f q : derivative q-axis voltage of the generator;
R f d : derivative of equivalent d-axis resistance of the generator’s stator;
R k d : derivative of equivalent q-axis resistance of the generator’s stator;
i f d : derivative d-axis current of the generator’s stator;
i k q 1 : derivative q-axis current of the generator’s stator;
ϕ k d : derivative d-axis magnetic flux of the generator’s stator;
ϕ k q 2 : derivative q-axis magnetic flux of the generator’s stator;
L d : d-axis inductance of the generator.
L q : q-axis inductance of the generator;
L m d : d-axis mutual inductance of the generator;
L m q : q-axis mutual inductance of the generator.

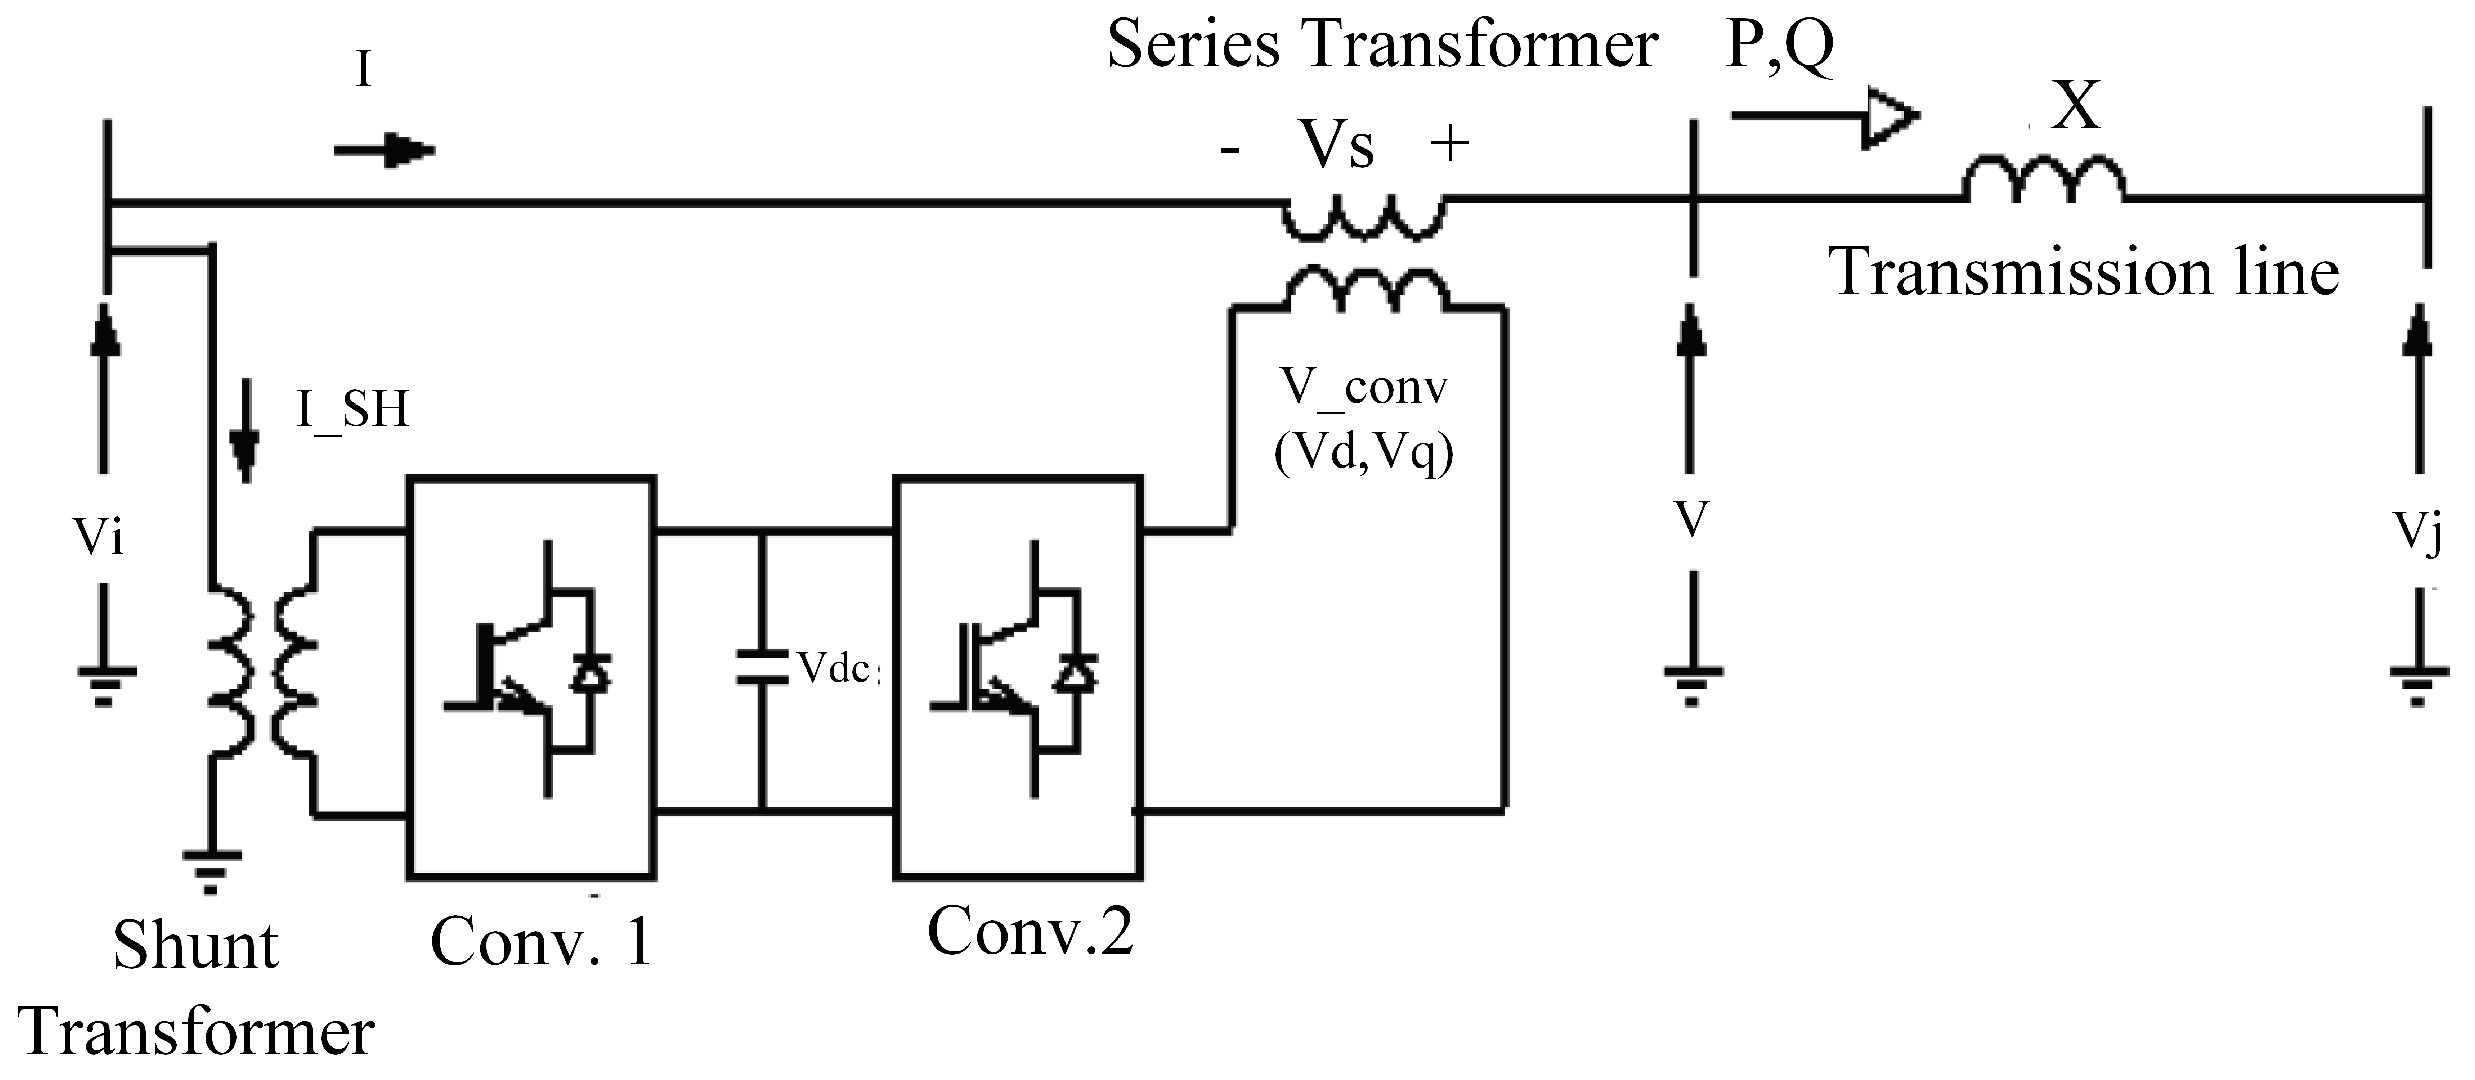
3.1.2. UPFC Modeling

The UPFC represents the most adaptable component within the FACTS group. It employs power electronics to manage the distribution of power within electrical grids [1]. The UPFC combines a shunt controller and a series controller, which are linked via a shared DC bus, as illustrated in Figure 3. This FACTS configuration offers significantly greater flexibility compared to the SSSC when it comes to managing active and reactive power on the transmission line.
With this setup, active power can be transferred from the shunt converter to the series converter via the DC bus. In contrast to the SSSC, where the injected voltage ( V s ) must remain in quadrature with the line current (I), here, the injected voltage ( V s ) can take on any angle relative to the line current.
When the magnitude of the V s is held constant and its phase angle ( ϕ ) relative to V 1 varies from 0 to 360 degrees, the path followed by the end of vector V 2 ( V 2 = V 1 + V s ) forms a circle, as depicted in Figure 4 in the phasor diagram.
As ϕ changes, the phase shift ( δ ) between voltages V2 and V3 at the two ends of the line also changes. Consequently, both the active power (P) and reactive power (Q) transmitted at one end of the line can be controlled using Equations (9) and (10).
The controllable region for the UPFC in the P-Q plane is represented by an enclosed ellipse, as illustrated in Figure 4 [3].
P = V 2 V 3 sin ( δ ) X
Q = V 2 ( V 2 V 3 cos ( δ ) ) X
In addition to enabling control of the active and reactive power of the transmission line, the UPFC offers an extra level of flexibility. Its shunt converter, which functions like a STATCOM, manages the V1 voltage by either absorbing or generating reactive power. Both the series and shunt converters employ Voltage-Sourced Converters (VSCs) connected on the secondary side of a coupling transformer. These VSCs utilize power electronic devices like GTOs, IGBTs, or IGCTs to generate a voltage from a DC voltage source. A shared capacitor on the DC side of the VSCs serves as the DC voltage source. There are two types of VSC technologies for these converters.
  • VSC employing GTO-based square-wave inverters and specialized interconnection transformers: Typically, four three-level inverters are utilized to create a 48-step voltage waveform. Special interconnection transformers are employed to mitigate the harmonics present in the square waves produced by individual inverters. In this VSC type, the fundamental voltage component is directly proportional to the voltage Vdc. Consequently, Vdc must be adjusted to control the injected voltage.
  • VSC employing IGBT-based Pulse-Width Modulation (PWM) inverters: This inverter type employs PWM techniques to synthesize a sinusoidal waveform from a DC voltage, typically with a chopping frequency in the kilohertz range. Harmonics are eliminated by installing filters on the AC side of the VSC. Unlike the GTO-based VSC, this type maintains a fixed DC voltage ( V d c ). To vary the voltage, adjustments are made to the modulation index of the PWM modulator.

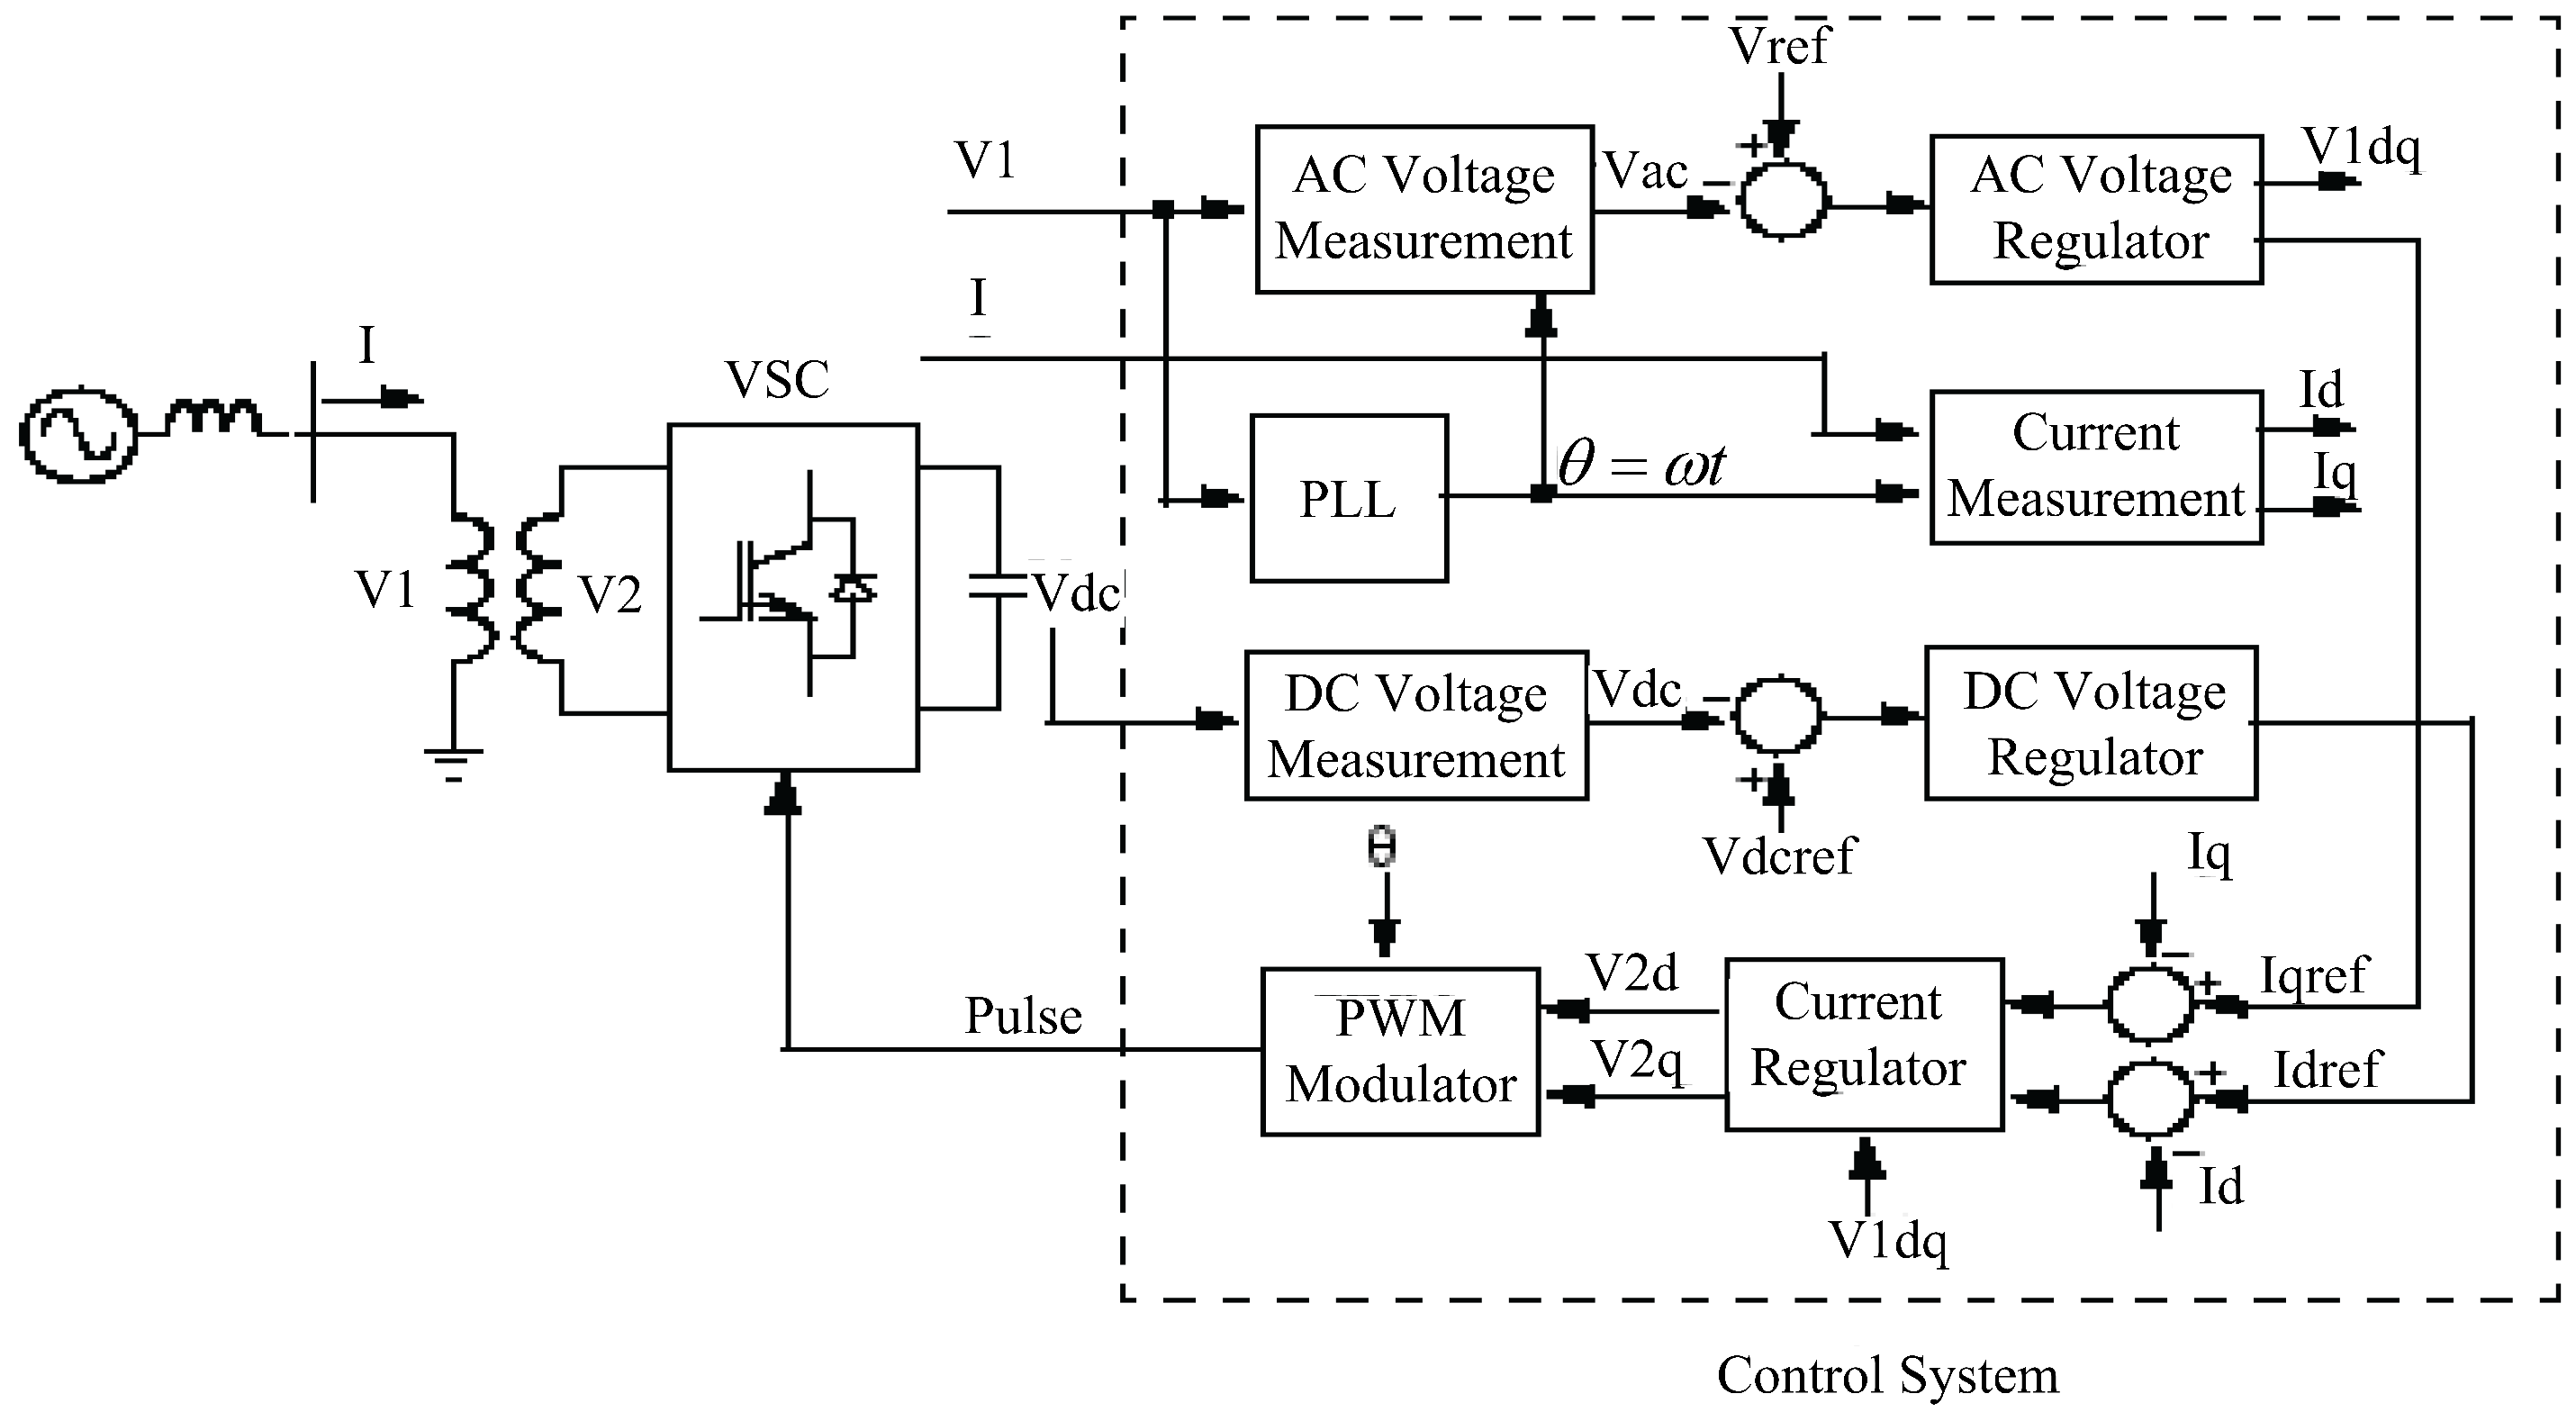
Control Framework of Shunt and Series Converter

The shunt converter control system illustrated in Figure 5 functions as a STATCOM and plays a dual role in regulating both the AC voltage at its terminals and the voltage of the DC bus. It employs a dual voltage regulation approach consisting of two interconnected control loops, namely an inner current control loop and an outer loop responsible for regulating AC and DC voltages.
As depicted in Figure 5, the control system comprises the following components [3]:
  • A phase-locked loop (PLL) that synchronizes with the positive-sequence component of the three-phase primary voltage ( V 1 ). The PLL output (angle) is used to calculate the direct-axis and quadrature-axis components of the AC three-phase voltage and currents (referred to as V d , V q , I d , and I q in the diagram).
  • Measurement systems that capture the d and q components of the AC positive-sequence voltage, the currents to be controlled, and the DC voltage ( V d c ).
  • An outer regulation loop, which encompasses an AC voltage regulator and a DC voltage regulator. The AC voltage regulator’s output is the reference current ( I q r e f ) for the current regulator. I q represents the current in quadrature with voltage and controls reactive power flow. The DC voltage regulator’s output is the reference current ( I d r e f ) for the current regulator, where I d is the current in phase with voltage and regulates active power flow.
  • An inner current regulation loop, comprising a current regulator. This current regulator manages the magnitude and phase of the voltage generated by the PWM converter (V2d and V2q) based on the reference currents, i.e., I d r e f and I q r e f , which are produced by the DC voltage regulator and the AC voltage regulator, respectively (in voltage control mode). The current regulator is further supported by a feed-forward-type regulator that predicts the V2 voltage output ( V 2 d and V 2 q ) based on the V 1 measurements ( V 1 d and V 1 q ) and the transformer leakage reactance.
The management of the series branch differs from that of the SSSC. In an SSSC, the series converter’s two degrees of freedom are employed to oversee the DC voltage and the reactive power. Conversely, in the case of a UPFC, these two degrees of freedom are utilized to govern the active power and the reactive power. Figure 6 illustrates a simplified block diagram of the series converter.
The series converter offers the flexibility to operate in either power flow control (automatic mode) or manual voltage injection mode. In power control mode, it compares the measured active power and reactive power with reference values to generate P and Q errors. These P and Q errors are then employed by two PI controllers to determine the V q and V d components of the voltage to be generated by the VSC. (Vq, which is aligned with V 1 , regulates active power, while V d , which is in phase with V 1 , manages reactive power). Conversely, in manual voltage injection mode, there is no need for regulators. Instead, the reference values for injected voltage ( V d r e f and V q r e f ) are used to create the converter voltage.

3.2. Proposed Approach based on the Coordinated Control of PSS and UPFC

The control structure presented in Figure 6 is used to manage the voltage injected by the UPFC, with input parameters including changes in active and reactive power and voltage. The output of the controller is V d and V q . The UPFC’s techno-economical structure includes various regulator gain blocks for both shunt and series converters. Figure 7 shows the PSS, which adds the output ( V s ) to the excitation system reference voltage ( V r e f ). Phasor measurements are continuously taken and can be transmitted in real time to control centers via optical fiber communication. However, delays in transmission can cause performance degradation, so delays are considered in controller design. A 15 ms delay is considered for the PSS time constant, and a 50 ms delay is considered for the damping controller with a 15 ms sensor delay [15].

3.3. Objective Function Formulation

The current study presents a multi-objective optimization model that involves conflicting objectives and does not have a unique solution. The goal is to achieve safe and optimal coordinated control of UPFCs and PSSs while satisfying constraints, which requires determining various pieces of information, such as unit commitment, controllable generation unit capacities, and power exchange with power tie lines for each hour of a day in advance. The ultimate objective is to achieve optimal and safe operation in response to a cyber-attack, considering all technical parameters of the network. To achieve this, this study uses modified mixed-nonlinear programming based on a Harris hawk formulation. The planning problem is formulated with a multi-objective function according to Equation (11).
min { F i ( K i UPFC , K i , T i PSS ) }
The equation above shows that the objective functions in the problem are represented by F and depend on the independent coefficient factors of controllers in the shunt, series UPFC, and PSSs. This means that the desired objective functions for this problem can be formulated based on following objectives. The main objective of this research is to reduce the power system oscillations that may occur due to disturbances caused by a transient cyber-attack. The oscillation of the system can be observed by analyzing the deviation in the rotor-angle speed of the generators. Therefore, the primary aim of this study can be stated as follows:
F 1 ( { K i } UPFC , { K i , T i } PSS ) = t = 0 t = t sim i | Δ ω i L | + i | Δ ω i I | · t d t
where t s i m is the simulation time range, ω i L is the local speed deviation of each generator, and ω i I it the interarea speed deviation.
The power system is simulated in the time domain for a specific duration, and the objective function is calculated based on the simulation results. The PSS and UPFC controllers are restricted within a specified range. As a result, an optimization problem is formulated using the following design approach.
min { F i ( K i UPFC , K i , T i PSS ) }
subjected to:
K i min K i K i max
T i min T i T i max
The range of the gain for the controllers (PSS and damping controller) is limited by K i m i n and K i m a x , which represent the lower and upper bounds, respectively. Similarly, T i m i n and T i m a x represent the lower and upper bounds for the time constants of the controllers (PSS and UPFC). Another crucial technical objective of the overall objective function is to ensure that the voltage remains within the acceptable range when responding to a physical cyber-attack on the power system. As a result, the voltage deviation factor can be computed at each simulation step as an additional objective [33].
F 2 ( { K i } UPFC , { K i , T i } PSS ) = V D = i = 1 N b V std V Base V i V Base 2
The equation below can also be used to attain the economic objective of the total objective function, which is the total generation cost of the system [33].
F 3 ( { K i } UPFC , { K i , T i } PSS ) = C Gen = i = 1 N C Gen , i , t OP + i = 1 N C Gen , i , t EMI
where C Gen , i , t OP represents the generation cost of each power plant unit, and C Gen , i , t EMI is the cost associated with the pollution of the units in each time interval (t) which can be defined as follows:
C Gen , i , t OP = a P Gen 2 + b P Gen + c if 0 < P Gen < P Gen rated 0 if P Gen = 0
C Gen , i , t EMI = ( C CO 2 × CO 2 + C SO 2 × SO 2 + C NO x × NO x ) × P Gen
where the parameters are defined as follows:
C ( C O 2 ) : penalty factor for CO2 production;
C ( S O 2 ) : penalty factor for SO2 production;
C ( N O x ) : penalty factor for NOx production.
The objective functions of a power system, which includes interaction between technical and economic aspects of the power system, aim to maximize their individual benefits under multi-objective conditions. To achieve optimal and safe coordinated control of the UPFC and PSSs, the entire power system can be expressed mathematically by considering different operational states for the power system according to Equation (18).
min { F Total } = χ 12 χ 12 χ p k F 1 F 2 F k
The weight coefficient, represented by χ p k in Equation (18), needs to be adjusted for each objective function based on specific events and system characteristics. These can include different system states during maintenance, the probability of element failure, and various error events that affect system performance. The weights are adjusted to reflect the importance of these events and characteristics in achieving the desired system performance. Assigning higher weights to certain objective functions increases their impact on the optimization process. The weight adjustment process requires careful consideration of each event and system feature to ensure an optimal and balanced solution for the multi-objective optimization problem. It should be noted the current study suggests that V q r e f remains constant in steady-state conditions, as V is observed to be zero. However, during dynamic conditions, an algorithm is applied to vary the injected voltage ( V q ) to dampen system oscillations. Since the power flow loop operates slowly during steady-state operation, V q r e f is assumed to remain constant. Therefore, the effective value of V q in dynamic conditions is formulated accordingly [34].
V q = V q ref + Δ V q

4. Developed Multi-Objective Optimization Method Based on Harris Hawks

Usually, multi-objective optimization is crucial for simultaneously minimizing multiple conflicting objectives while adhering to system constraints. The introduction of many scholarly works primarily focused on addressing single-objective optimization problems. Few researchers have attempted to tackle multi-objective problems, and in some cases, they could not conclusively prove the effectiveness of their proposed methods for both single- and multi-objective scenarios. In this study, we aim to solve both single- and multi-objective problems simultaneously and present the performance of our proposed HHO method. In essence, the multi-objective function can be defined as follows [35]:
Minimize , J m ( χ ¯ ) : m = 1 N ω m f m ( χ ¯ ) = sum ω 1 ω 2 · · ω m f 1 ( χ ¯ ) f 2 ( χ ¯ ) f m ( χ ¯ ) ,
subject to the following:
g ( χ ¯ ) = 0 h ( χ ¯ ) 0
In the above equations, J represents the multi-objective function comprising m functions, where f denotes each individual objective function, and w is a scalar weight applied to each objective, ranging from 0 to 1. Importantly, the sum of all weights is one. To address the multi-objective function in this study, the no-preference weighted sum approach is employed. This approach assigns no particular significance to any of the objectives but employs a heuristic to obtain a single optimal solution. Drawing inspiration from the Harris hawk, a highly intelligent and skilled predator bird in nature known for its remarkable group hunting abilities when pursuing potential prey (such as rabbits), an analogy is made. In this analogy, the initial population is likened to a group of hawks, each attempting to chase the target rabbit (representing the solution to the optimization problem) from various directions using seven distinct hunting strategies or surprise pounces. Initially, the leading hawk tries to capture the prey. If it fails to secure the animal due to the prey’s dynamic and evasive behavior, a switch in tactics occurs. Other members of the group (the hawks) then join in the pursuit to capture the escaped prey until it is seized. The key advantage of this collaborative tactic lies in the ability of the hawks to persistently chase the elusive rabbit, leading to its eventual capture through a combination of confusion and exhaustion. In the context of HHO, the candidate solutions are analogous to the Harris hawks themselves, while the optimal or global solution represents the targeted prey [36,37].
It is essential to note that the objective functions are designed to be either minimized or maximized, depending on the specific problem and how the objective function is defined. It is crucial to understand that solving a multi-objective optimization problem leads to a set of optimal solutions, whereas a single-objective optimization problem results in a single optimal solution. In the case of a bi-objective problem, each element in this set consists of a pair of values. From this standpoint, every element within this collection of optimal solutions is referred to as a Pareto-optimal solution, meaning it is not dominated by or inferior to any other solution in the set. The core principle behind the Pareto-optimal front hinges on the idea that it is impossible to enhance the value of one objective function without causing a detrimental impact on the values of other objective functions. Among the various available multi-objective optimization techniques, the epsilon-constraint method has proven to be exceptionally effective, particularly when compared to the weighted sum approach. In the weighted sum method, all objective functions receive weights and are combined into a single-objective function. However, it is worth noting that a well-known optimization technique like the epsilon-constraint method does come with two notable drawbacks that warrant careful consideration. When dealing with “p” objective functions, it becomes essential to define the range of “p-1” objective functions, as these objectives are treated as constraints in the problem [35].
In this paper, addressing these challenges entails the utilization of the lexicographic optimization technique to effectively ascertain the permissible range for each objective function. This approach serves to alleviate the initial limitation of this multi-objective optimization method. To confront the second issue concerning the efficiency and quality of the resulting solutions, we employ a modified epsilon-constraint technique. Consequently, this paper combines a hybrid approach involving the adapted epsilon-constraint and lexicographic optimization methods to resolve the presented multi-objective optimization dilemma characterized by conflicting objective functions. The core concept of this methodology revolves around designating one of the objective functions as the primary focus while treating all other functions as constraints within the problem, as outlined below.
min , f 1 ( χ ¯ ) f 2 ( χ ¯ ) e 2 , f p ( χ ¯ ) e p .
where “p” represents the count of objective functions, and “x” refers to the decision variable vector. As indicated by the expression above, the goal is to minimize all objective functions. As previously mentioned, it is vital to establish the permissible ranges for the “p-1 ” objective functions. This can be accomplished by utilizing a payoff matrix. To create this payoff matrix, the problem is initially solved as a single-objective optimization problem to determine the optimal values for each objective function. Subsequently, these values are used to compute the single optimal values for the other objective functions, denoted as f i ( χ ¯ i * ) and χ ¯ i * , respectively. The resulting matrix of outcomes is structured with rows that depict various combinations of objective function values. For a deeper comprehension and access to the associated equations, kindly consult the provided reference. It is worth highlighting that the remaining objective functions possess a sole optimal value.
f i ( χ ¯ i * ) , f 2 ( χ ¯ i * ) , f i 1 * ( χ ¯ i * ) , f i + 1 ( χ ¯ i * ) , f p ( χ ¯ i * ) .
The formation of the payoff matrix involves arranging the elements of each row (i) in a particular fashion.
f 1 ( χ ¯ i * ) , f 2 ( χ ¯ i * ) , f i ( χ ¯ i * ) , f p ( χ ¯ i * ) .
Q = f 1 * ( χ ¯ 1 * ) f i ( χ ¯ 1 * ) f p ( χ ¯ 1 * ) f 1 ( χ ¯ i * ) f i * ( χ ¯ i * ) f p ( χ ¯ i * ) f 1 ( χ ¯ p * ) f i ( χ ¯ p * ) f p * ( χ ¯ p * ) .
The payoff matrix, denoted as (p × q), is a square matrix in which each column (n) represents the optimal value of a specific objective function ( f n ), constrained within minimum and maximum values. Meanwhile, the utopia point ( f U ) signifies the optimal values of all objectives within an infeasible region.
f U = [ f 1 U , , f i U , , f p U ] = [ f 1 * ( χ ¯ 1 * ) , , f i * ( χ ¯ i * ) , , f p * ( χ ¯ p * ) ] .
On the contrary, the nadir point (denoted as f N ) designates the point within the objective region where all objective functions reach their most unfavorable values.
f N = [ f 1 N , , f i N , , f p N ] .
where
f i N = ( M a x / χ ¯ ) f i ( χ ¯ ) . Compliance with : x ¯ Ω .
The feasible region ( Ω ) includes the pseudo-nadir point, which closely resembles the nadir point, and it is represented as follows:
f SN = [ f 1 SN , , f i SN , , f p SN , ] .
f i SN = max { f i ( χ ¯ 1 * ) , , f i * ( χ ¯ i * ) , , f i ( χ ¯ p * ) } .
The range of objective functions is established by utilizing the utopia and pseudo-nadir points in accordance with the following formula:
f i U f i ( χ ¯ ) f i SN .
The objective space depicted in Figure 8 is defined by the number of objective function dimensions. The utopia, pseudo-nadir, and nadir points aid in illustrating the Pareto frontier by segmenting the ranges of objective functions into equal intervals with the assistance of intermediate grid points denoted as ( q 2 1 ) , , ( q p 1 ) . Consequently, this necessitates the solution of i = 2 p ( q i + 1 ) subproblems,
min f 1 ( χ ¯ ) ,
so that
f 2 ( χ ¯ ) e 2 , n 2 , , f p ( χ ¯ ) e p , np
where:
e 2 , n 2 = f 2 SN f 2 SN f 2 U q 2 × n 2 , n 2 = 0 , 1 , , q 2
e 2 , n 2 = f p SN f p SN f p U q p × np , np = 0 , 1 , , q p .
The approach entails addressing subproblems by incorporating the constraints from Equation (32) in addition to the primary problem’s constraints. This helps in deriving the Pareto-optimal front and removing infeasible solutions. The objective function constraints are converted into equalities using the slack variable method as part of this process.
Min , f 1 ( χ ¯ ) r 1 i = 2 P s i r i . Subject to f i ( χ ¯ ) + s i , n i = e i , n i , i = 2 , , p s i , n i R + . χ ¯ Ω .
The approach denoted as s 2 , , s p tackles scaling problems by introducing slack variables according to the formula in Equation (33). It also incorporates a term denoted as r 1 ( s i / r i ) into the objective function to manage discrepancies in objective scales. The objective function ranges are determined using the payoff matrix ( r i = f i S N f i U ) . This method employs the augmented epsilon-constraint approach to the multi-objective optimization process. In this process, the decision maker chooses the most desirable solution based on linear membership functions defined for each objective function using the fuzzy satisfying method.
μ F i ( χ ) = 1 F i ( χ ) F i min . F i max F i ( χ ) F i max F i min F i min F i ( χ ) F i max . 0 F i ( χ ) F i max .
The membership function assesses the degree of satisfaction of the objective function condition, where a value of 1 signifies full satisfaction, and 0 indicates no satisfaction. In this context, F i k stands for the value of each objective function, while μ i k represents the membership value in Pareto solution k. This membership function is formulated to minimize objective functions. The cumulative membership value ( μ i k ) determines the solution that strikes the most balanced compromise.
μ k = i = 1 P w i μ i k k = 1 M i = 1 P w i μ i k .
The weighting factor ( ω i ) is responsible for gauging the significance of each objective function (i) when the decision maker is choosing the optimal expansion plan according to system requirements. The solution with the highest μ i k value is selected as the most balanced solution, considering the weighted membership values.

5. Simulation Results and Discussion

To assess and evaluate the effectiveness of the suggested approach for coordinating the controller coefficients of PSSs and UPFCs in power systems, considering both economic and technical factors, this study employs the IEEE 9-bus and IEEE 39-bus test systems. In this investigation, a synchronous reference frame is employed to model these systems, and it assumes that the speed and rotor angle of each generator are compared with the reference generator (slack) angle.

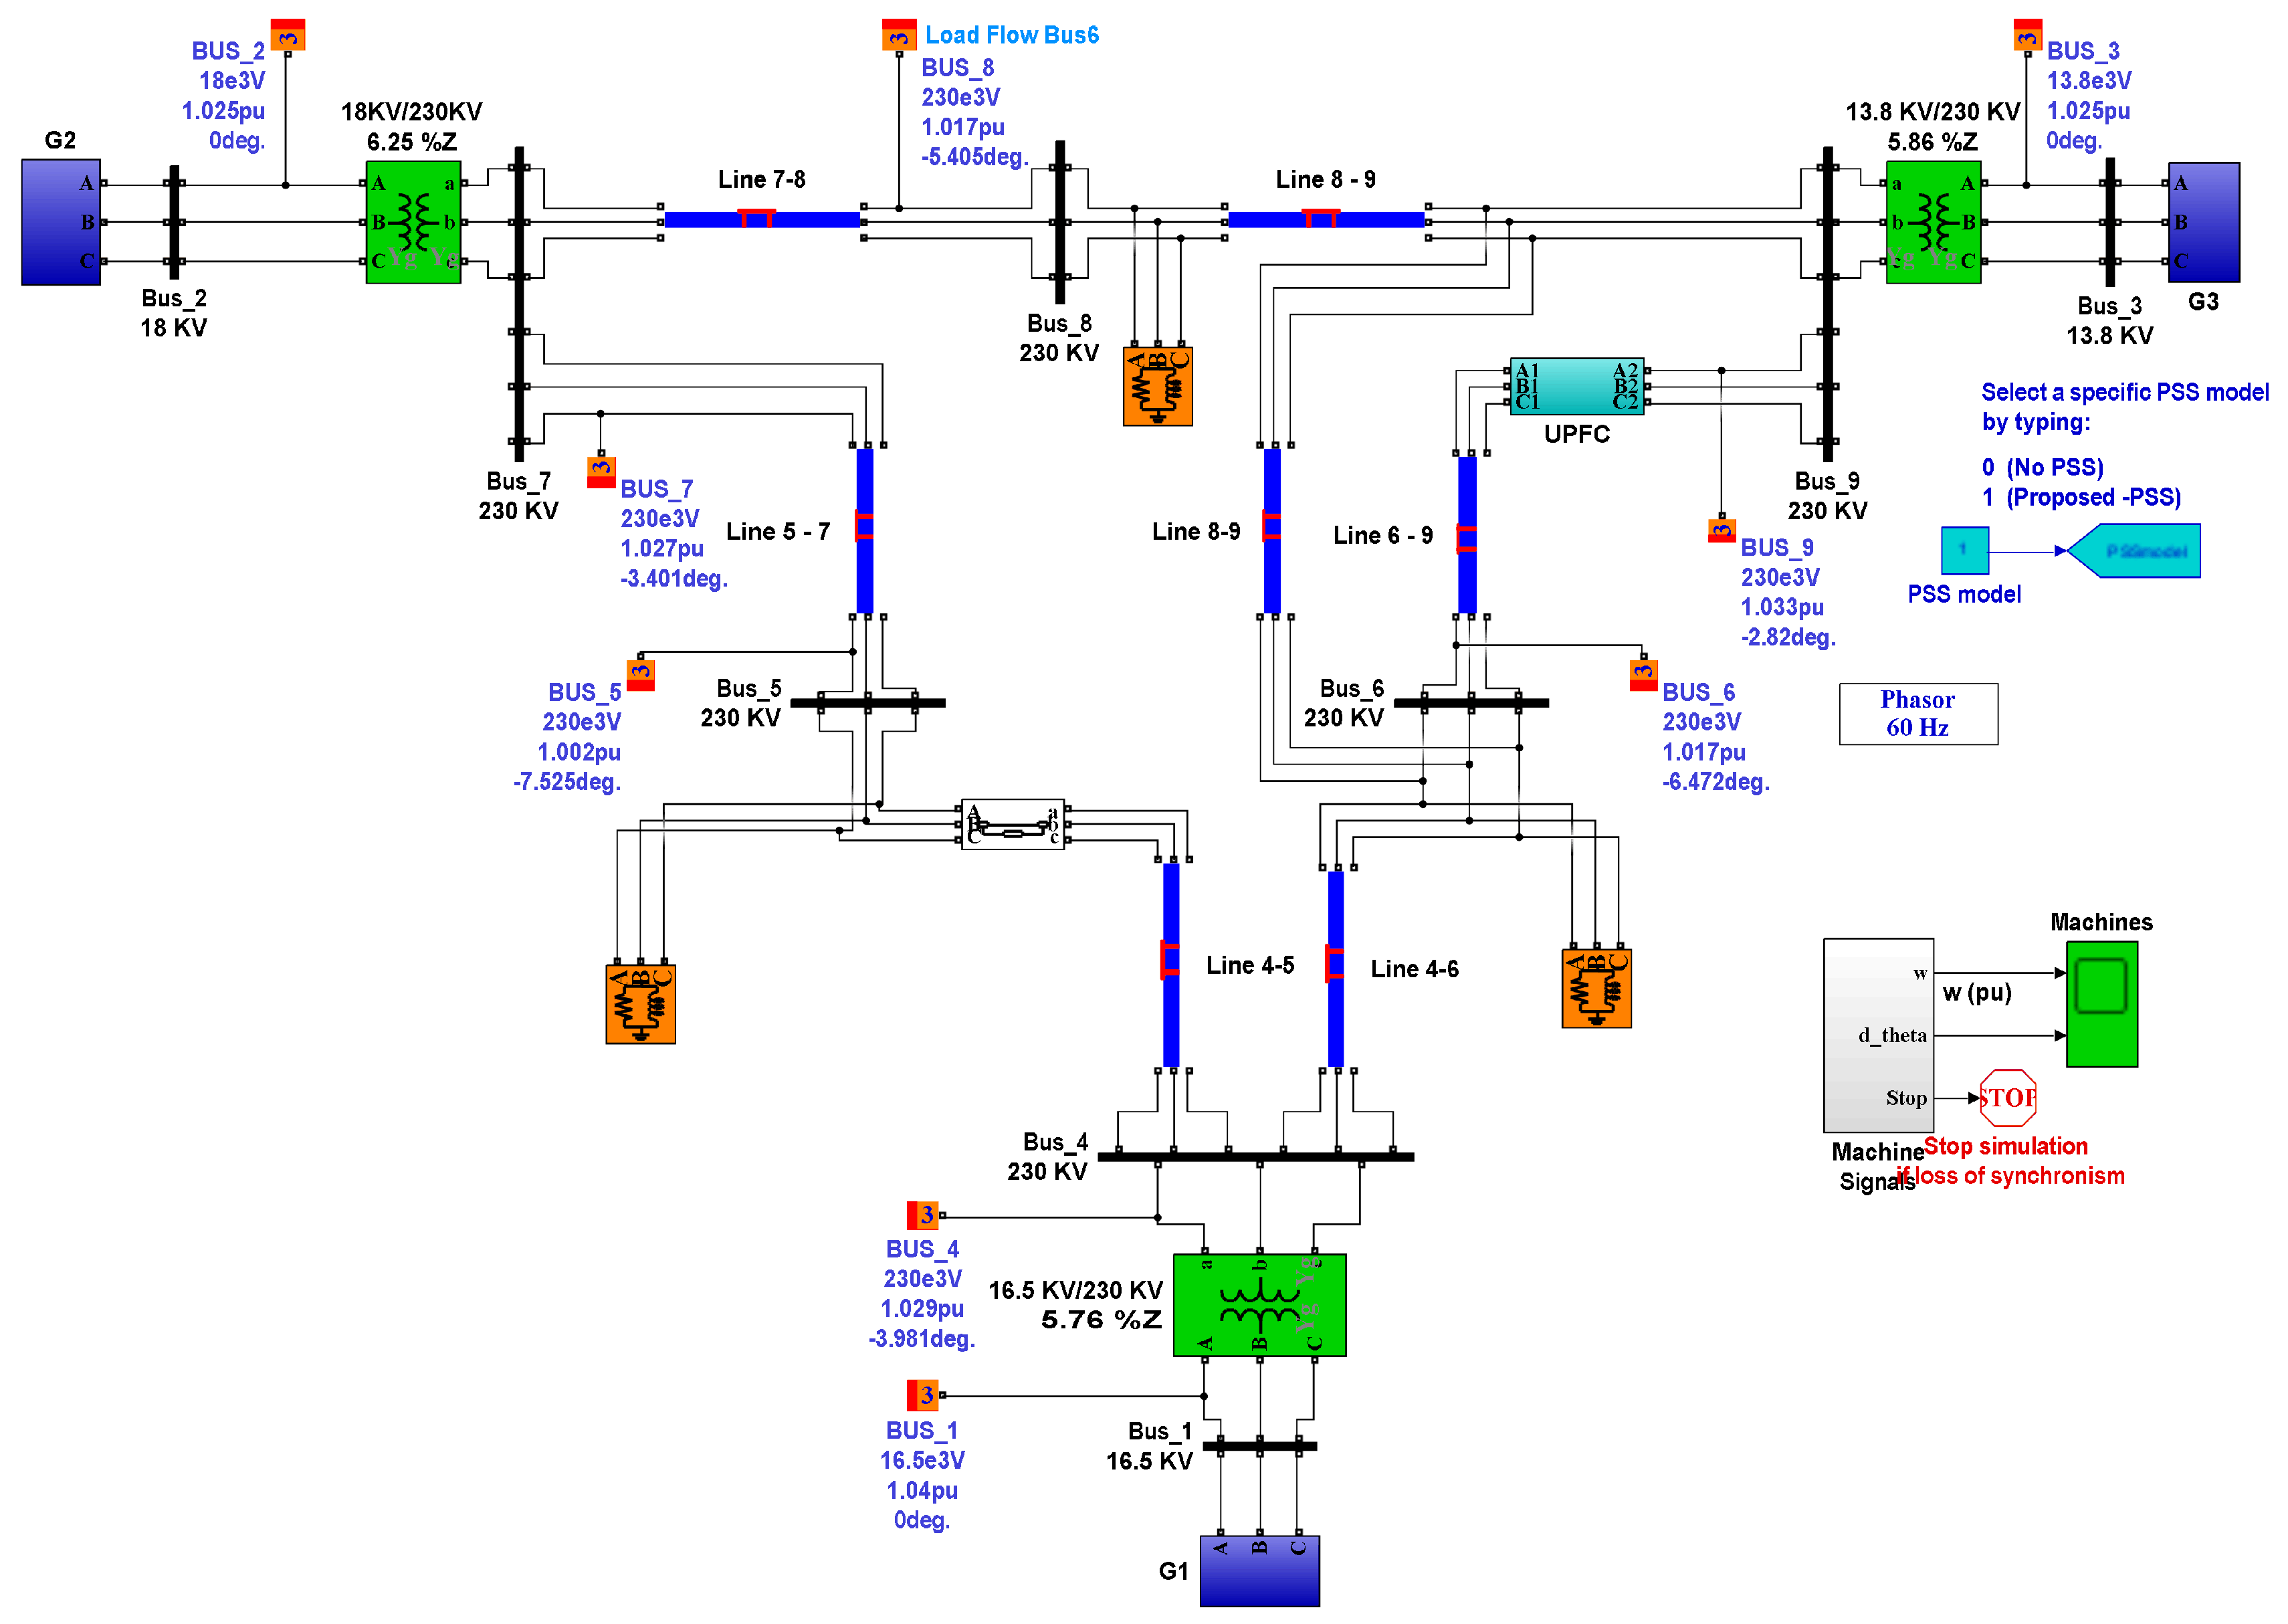
5.1. IEEE Nine-Bus Case Study

The IEEE nine-bus system comprises three generators and nine lines, as detailed in reference [38]. The simulation is based on a time step of 0.0001 s, with the rotor angle of generator 1 serving as the reference angle for the study. Additionally, a controllable UPFC device with an optimized coefficient controller is installed between buses 6 and 9 to manage the voltage and power flow between these buses, as shown in Figure 9.
The three-dimensional Pareto distribution chart of the final objective functions includes the total production cost (axis X), voltage deviations (axis Y), and total frequency deviations (axis Z) for the optimal and coordinated operation of PSSs and UPFCs, as shown in Figure 10. As observed in this chart, the most suitable operating point with the lowest production cost is equal to 1107.3, at which point there are the highest voltage and frequency deviations. On the other hand, the most suitable operating point with the lowest voltage deviation is equal to 0.145, at which point there are the highest production costs and frequency deviations. Additionally, the most suitable operating point with the lowest frequency deviation corresponds to a frequency deviation of 0.0029, where the objective functions of operating costs and voltage deviations are far from optimal conditions. Therefore, it can be said that the objectives in this network are conflicting with each other. Therefore, since in the present network, all three objective functions have the same importance, and the coefficients of the controllers are selected for conditions where all three objective functions are in optimal agreement. Therefore, it can be said that the proposed method provides an effective framework for system recovery with the desired objectives in the event of a cyber physical-attack or disruption in the power system.
Figure 11 and Figure 12 are centered on the following two key aspects: technical factors (total speed deviations and voltage deviation) and the total generation cost of the generators within the system. These aspects are evaluated when the coefficients of the coordinated controller for the UPFC and PSSs are optimized using both PM and various previous state-of-the-art research approaches. These figures reveal that the system and generators are in an optimally stable condition within the first 5 s of real-time simulation. However, in this case study, a cyber–physical attack leads to the sudden disconnection of the line between buses 4 and 5 at the 35 s mark.
As depicted in Figure 11 and Figure 12, PM exhibits the quickest response in restoring the power system to a stable state, with minimal generation costs compared to other previous state-of-the-art (SOTA) techniques. Additionally, Figure 12 indicates that the best performance in controlling the bus voltage is related to PM, with minimum voltage deviation throughout the operation. Regarding this aspect, Figure 13 illustrates how the optimal generation point and rotor angle of the generators change after the mentioned line outage for the PM method. PM promptly identifies the new stable rotor angle in real time compared to prior research, demonstrating the high accuracy and capability of the proposed approach in estimating the optimal secure operation point of the system in the face of cyber-physical attacks.
Table 1 offers a comparison of the performance of PM with previous SOTA research in terms of total generation cost, speed deviation, and voltage deviation for different scenarios involving cyber-physical attacks. The table highlights PM’s superiority in identifying the secure and optimal generation point of the system following disturbances, showcasing its accuracy and speed. It reports the minimum total generation cost across all scenarios for PM while also noting that PM exhibits the highest speed with the best accuracy in damping system oscillations with minimum voltage deviation.

5.2. IEEE 39-Bus Case Study

The next study will involve an evaluation of the IEEE 39-bus system [42]. The schematic diagram of the IEEE 39-bus test system, which includes 10 generators and 45 lines, is presented in Figure 13. Notably, Figure 14 illustrates the placement of a controllable UPFC in the line between bus 10 and 11. Similar to the previous case study, this study will focus on the optimized coordinated controller of UPFC and PSS to achieve an efficient response and establish the optimal and secure operating point of the power system against sudden disturbances, such as those caused by cyber-physical attacks. The simulation will assume a time step of 0.0001 s, and the rotor angle of generator 2 will serve as the reference angle for this analysis.
Figure 15 and Figure 16 are dedicated to examining the total speed deviation, total generation cost, and voltage deviation of the IEEE 39 bus test system. This analysis is conducted after optimizing the coefficient factors of the coordinated controller for UPFC and PSSs using Proportional-Integral control (PM) and various advanced research methods that have been previously developed. According to the findings presented in these figures, the power system and its generators are operating optimally and in a stable condition before the fifth second of real-time simulation. However, in the context of this case study, a sudden cyber-physical attack occurs at the hundredth second, resulting in the disconnection of the line between bus 4 and 14. Remarkably, as depicted in Figure 15 and Figure 16, PM exhibits the swiftest response in restoring the power system to a stable condition with the least generation cost and minimum voltage deviation throughout the operation time when compared to other previously established state-of-the-art techniques.
In this regard, as illustrated in Figure 17, it becomes evident that the optimal generation points and rotor angles of the generators within the system undergo a change following the mentioned line outage. As a result, PM dynamically establishes a new stable rotor angle point in real-time, distinguishing itself from previous research approaches. This demonstrates the high degree of accuracy and the capability of the proposed method in effectively determining the optimal and secure operational point of the system when confronted with cyber-physical attacks.
Table 2 provides a comparison of PM’s performance with previous SOTA research in terms of total generation cost, total speed deviation and voltage deviation under various scenarios involving cyber-physical attacks. It is evident from this table that PM outperforms previous methods significantly in identifying the secure and optimal generation point of the system following disturbances. This superiority is observed in terms of both accuracy and speed. Moreover, the table highlights that PM consistently achieves the lowest total generation cost across all scenarios. Additionally, when it comes to effectively dampening system oscillations with the highest speed and best accuracy, PM also stands out as the most capable approach among the considered methods.

6. Conclusions

This paper presents a novel approach to effectively coordinating the control of UPFCs and PSSs while simultaneously addressing both the security of the power system and its generation cost. This approach is versatile and suitable for real-time and online scenarios, even in the presence of sudden disruptions like cyber-physical attacks. To achieve this, the proposed method employs a modified hybrid technique that combines multi-objective optimization with the MOHH and Lexicographic optimization technique. This innovative concept is adaptable to various network models, encompassing both network-preserving and network-reduction-based applications. Furthermore, it takes into consideration the intricacies of the power system and its dynamic controller during real-time simulations. Consequently, this approach empowers power managers to strike a balance between cost-effective operation and the assurance of system safety. The method underwent testing using both the IEEE 9-bus and IEEE 39-bus test systems.
The simulation results demonstrate the power manager’s ability to swiftly and accurately identify a secure and cost-effective operating point for both the system and its generators in real-time scenarios, even in the presence of transient disturbances like a cyber-physical line outage. Additionally, the method exhibits the ability to continuously estimate the optimal secure operating point for the system and manage the power flow passing through the transmission line throughout the real-time simulation without compromising the assessment of transient stability details. As a result, this approach proves to be highly efficient, accurate, and straightforward, with minimal computational demands, making it well-suited for online and real-time applications.

Author Contributions

M.A.M.M.: Conceptualization, Methodology, Software, Data curation, Writing—Original draft preparation, Visualization, Investigation, Writing—Reviewing and Editing. N.U.: Conceptualization, Methodology, Software, Data curation, Writing—Original draft preparation, Visualization, Investigation, Writing—Reviewing and Editing. All authors have read and agreed to the published version of the manuscript.

Funding

This research received no external funding.

Institutional Review Board Statement

Not applicable.

Informed Consent Statement

Not applicable.

Data Availability Statement

All data available in the article.

Conflicts of Interest

The authors declare no conflicts of interest.

Abbreviations

The following abbreviations are used in this manuscript:
UPFCUnified Power Flow Controller
PSSPower System Stabilizer
MOHHMulti-Objective Harris Hawks
FACTSFlexible Alternating Current Transmission System
LFOLow-Frequency Oscillation
PODPower Oscillation Damping
PWMPulse-Width Modulation
ALOAnt Lion Optimization
DECLDeveloped epsilon-constraint and lexicographic methods
AVRAutomatic Voltage Regulator
IUPFCInterline Unified Power Flow Controller
STATCOMStatic Synchronous Compensator
SMIBSingle Machine, Infinite Bus
VSCVoltage-Sourced Converter
PSOParticle Swarm Optimization
PLLPhase-Locked Loop
V s Sending-side voltage in area 1
V R Receiving-side voltage in area 2
P s Sending-side active power in area 1
P R Receiving-side active power in area 2
P * Active power reference of series controller in UPFC
Q * Reactive power reference of series controller in UPFC
V d u p f c d-axis reference voltage of shunt controller in UPFC
V q u p f c q-axis reference voltage of shunt controller in UPFC
V c Voltage induced into the power line by the series converter of UPFC
LEquivalent inductance in receiving side of power network
[ K i ] U P F C Coefficient controller of UPFC
[ K i , T i ] P S S Coefficient controller of PSS
V d d-axis voltage of generator
V q q-axis voltage of generator
R s Equivalent resistance of the stator in the generator
i d d-axis current of the stator in the generator
i q q-axis current of the stator in the generator
ϕ d d-axis magnetic flux of the stator in the generator
ϕ q q-axis magnetic flux of the stator in the generator
ω r Rotor angular velocity
V f d Derivative d-axis voltage of the generator
V f q Derivative q-axis voltage of the generator
R f d Derivative of equivalent d-axis resistance of the generator’s stator
R k d Derivative of equivalent q-axis resistance of the generator’s stator
i f d Derivative d-axis current of the generator’s stator
i k q 1 Derivative q-axis current of the generator’s stator
ϕ k d Derivative d-axis magnetic flux of the generator’s stator
ϕ k q 2 Derivative q-axis magnetic flux of the generator’s stator
L d d-axis inductance of the generator
L q q-axis inductance of the generator
L m d d-axis mutual inductance of the generator
L m q q-axis mutual inductance of the generator

References

  1. He, P.; Shen, R.; Wen, F.; Pan, Q. Coordinated optimization of parameters of PSS and UPFC-PODCs to improve small-signal stability of a power system with renewable energy generation. J. Energy Eng. 2021, 147, 04020089. [Google Scholar] [CrossRef]
  2. Kumar, H.; Singh, P.R. Coordinated control of TCSC and UPFC to aid damping oscillations in the power system. Int. J. Electron. 2019, 106, 1938–1963. [Google Scholar] [CrossRef]
  3. Solomon, E.; Khan, B.; Boulkaibet, I.; Neji, B.; Khezami, N.; Ali, A.; Mahela, P.O.; Pascual Barrera, A.E. Mitigating Low-Frequency Oscillations and Enhancing the Dynamic Stability of Power System Using Optimal Coordination of Power System Stabilizer and Unified Power Flow Controller. Sustainability 2023, 15, 6980. [Google Scholar] [CrossRef]
  4. Rana, J.M.; Shahriar, S.M.; Shafiullah, M. Levenberg? Marquardt neural network to estimate UPFC-coordinated PSS parameters to enhance power system stability. Neural Comput. Appl. 2019, 31, 1237–1248. [Google Scholar] [CrossRef]
  5. Siddique, A.; Xu, Y.; Aslam, W. Enhancement of power quality and transient stability margin in coordination with UPFC and MB-PSS controller. In Proceedings of the 2018 International Conference on Mechatronic Systems and Robots, Singapore, 25–27 May 2018; pp. 30–36. [Google Scholar]
  6. Niu, Y. Coordinated Optimization of Parameters of PSS and UPFC-PODCs to Improve Small-Signal Stability of a Power System with Renewable Energy Generation. In Proceedings of the 2021 11th International Conference on Power, Energy and Electrical Engineering (CPEEE), Shiga, Japan, 26–28 February 2021; pp. 249–254. [Google Scholar] [CrossRef]
  7. Shafiullah, M.; Rana, J.M.; Shahriar, S.M.; Zahir, H.M. Low-frequency oscillation damping in the electric network through the optimal design of UPFC coordinated PSS employing MGGP. Measurement 2019, 138, 118–131. [Google Scholar] [CrossRef]
  8. Shahriar, S.M.; Shafiullah, M.; Rana, J.M. Stability enhancement of PSS-UPFC installed power system by support vector regression. Electr. Eng. 2018, 100, 1601–1612. [Google Scholar] [CrossRef]
  9. Neda, M.O. Optimal coordinated design of PSS and UPFC-POD using DEO algorithm to enhance damping performance. Int. J. Electr. Comput. Eng. 2020, 10, 6111–6121. [Google Scholar] [CrossRef]
  10. Fortes, V.E.; Martins, B.F.L.; Miotto, L.E.; Araujo, B.P.; Macedo, H.L.; Romero, R. Bio-Inspired Metaheuristics Applied to the Parametrization of PI, PSS, and UPFC?POD Controllers for Small-Signal Stability Improvement in Power Systems. J. Control. Autom. Electr. Syst. 2023, 34, 121–136. [Google Scholar] [CrossRef]
  11. MaleRizi, K.M.; Abazari, S.; Mahdian, N. Dynamic Stability Improvement of Power System with Simultaneous and Coordinated Control of DFIG and UPFC using LMI. Int. J. Ind. Electron. Control Optim. 2021, 4, 341–353. [Google Scholar]
  12. ToolaMoghadam, B.A.; Aghahadi, M.; Eslami, M.; Rashidi, S.; Arandian, B.; Nikolovski, S. Adaptive rat swarm optimization for optimum tuning of SVC and PSS in a power system. Int. Trans. Electr. Energy Syst. 2022, 2022, 4798029. [Google Scholar]
  13. Hossen, S.M.; Islam, R.M.; Shafiullah, M.; Fahim-Ul-Haque, M.; Ali, A. Tunicate swarm algorithm for power system stability enhancement in a SMIB-UPFC network. In Proceedings of the 2022 Second International Conference on Artificial Intelligence and Smart Energy (ICAIS), Coimbatore, India, 23–25 February 2022; pp. 1767–1772. [Google Scholar]
  14. Zamani, M.; Shahgholian, G.; Fathollahi, A.; Mosavi, A.; Felde, I. Improving Interarea Mode Oscillation Damping in Multi-Machine Energy Systems through a Coordinated PSS and FACTS Controller Framework. Sustainability 2023, 15, 16070. [Google Scholar] [CrossRef]
  15. Sabo, A.; Wahab, N.I.A.; Othman, M.L. Coordinated design of PSS and IPFC using FFA to control low frequency oscillations. In Proceedings of the 2021 IEEE 19th Student Conference on Research and Development, Kota Kinabalu, Malaysia, 23–25 November 2021; pp. 201–206. [Google Scholar]
  16. Alwan, O.H. A novel approach for coordinated design of TCSC controller and PSS for improving dynamic stability in power systems. Period. Eng. Nat. Sci. 2023, 11, 102–116. [Google Scholar] [CrossRef]
  17. Ming, L.; Yang, S.; Fei, L.; Shicun, L.; Shilong, W.; Xiankun, Q.; Yihui, L.; Chengning, L. Research on Controlled Series Complementary and PSS Coordinated Damping Control Method. In Proceedings of the 2022 Asian Conference on Frontiers of Power and Energy (ACFPE), Coimbatore, India, 23–25 February 2022; pp. 540–545. [Google Scholar]
  18. Darabian, M.; Bagheri, A.; Behzadpoor, S. A UPFC-based robust damping controller for optimal use of renewable energy sources in modern renewable integrated power systems. IET Gener. Transm. Distrib. 2022, 16, 4115–4131. [Google Scholar] [CrossRef]
  19. Hossen, S.M.; Haque, U.F.M. Tunicate Swarm Algorithm and Bat Algorithm for Power System Stability Enhancement in A Smib-Upfc Network; Department of Electrical and Electronic Engineering: Kota Kinabalu, Malaysia, 23–25 November 2021. [Google Scholar]
  20. Asad, M. Improving Power Flow Using Static Synchronous Series Compensator, The Egyptian International Journal of Engineering Sciences and Technology. Electr. Eng. 2021, 33, 69–74. [Google Scholar]
  21. Afaq, U.; Ali, F.; Hasan, A.; Rana, A.I.; Asif, M. Non-linear Synergetic Control of UPFC for Efficient Damping of Local and Inter-Area Oscillations. IEEE Trans. Power Syst. 2023, 39, 2106–2114. [Google Scholar] [CrossRef]
  22. Devarapalli, R.; Sinha, N.K.; García Márquez, F.P. A review on the computational methods of power system stabilizer for damping power network oscillations. Arch. Comput. Methods Eng. 2022, 29, 3713–3739. [Google Scholar] [CrossRef]
  23. Biswal, S.S.; Swain, R.D.; Rout, K.P. Inter-area and intra-area oscillation damping for UPFC in a multi-machine power system based on tuned fractional PI controllers. Int. J. Dyn. Control. 2022, 10, 1594–1612. [Google Scholar] [CrossRef]
  24. Mushtaq, B.; Mufti, M. Coordinated operation of fuzzy-based TCSC and SMES for low-frequency oscillation damping in interconnected power systems. Int. J. Circuit Theory Appl. 2023, 51, 2912–2941. [Google Scholar] [CrossRef]
  25. Kumar, A.; Bhadu, M. Wide-area damping control system for large wind generation with multiple operational uncertainty. Electr. Power Syst. Res. 2022, 213, 108755. [Google Scholar] [CrossRef]
  26. Radwan, M.M.; Azmy, M.A.; Ali, E.G.; ELGebaly, E.A. Optimal design and control loop selection for a STATCOM wide-area damping controller considering communication time delays. Int. J. Electr. Power Energy Syst. 2023, 149, 109056. [Google Scholar] [CrossRef]
  27. Eslami, M.; Babaei, B.; Shareef, H.; Khajehzadeh, M.; Arandian, B. Optimum design of damping controllers using modified Sperm swarm optimization. IEEE Access 2021, 9, 145592–145604. [Google Scholar] [CrossRef]
  28. Naghshbandy, H.A.; Faraji, A. Coordinated design of PSS and unified power flow controller using the combination of CWT and prony methods with the help of SPEA II multi-objective optimisation algorithm. IET Gener. Transm. Distrib. 2019, 13, 4900–4909. [Google Scholar] [CrossRef]
  29. Kamarposhti, A.M.; Colak, I.; Iwendi, C.; Band, S.S.; Ibeke, E. Optimal coordination of PSS and SSSC controllers in power system using ant colony optimization algorithm. J. Circuits, Syst. Comput. 2022, 31, 2250060. [Google Scholar] [CrossRef]
  30. Movahedi, A.; Niasar, H.A.; Gharehpetian, G. Designing SSSC, TCSC, and STATCOM controllers using AVURPSO, GSA, and GA for transient stability improvement of a multi-machine power system with PV and wind farms. Int. J. Electr. Power Energy Syst. 2019, 106, 455–466. [Google Scholar] [CrossRef]
  31. Shafiullah, M.; Pathan, M.; Shahriar, S.M.; Ali, A.; Hossain, I.M.; Alam, S.M. Real-time solution of PSS parameter tuning by GA-ANFIS in stabilizing the electrical power system. Arab. J. Sci. Eng. 2023, 48, 6925–6938. [Google Scholar] [CrossRef]
  32. He, P.; Pan, Z.; Fan, J.; Tao, Y.; Wang, M. Coordinated design of PSS and multiple FACTS devices based on the PSO-GA algorithm to improve the stability of wind–PV–thermal-bundled power system. Electr. Eng. 2023, 106, 2143–2157. [Google Scholar] [CrossRef]
  33. Al-Zaidi, W.K.M.; Inan, A. Optimal Placement of Battery Swapping Stations for Power Quality Improvement: A Novel Multi Techno-Economic Objective Function Approach. Energies 2023, 17, 110. [Google Scholar] [CrossRef]
  34. Khadanga, K.R.; Satapathy, K.J. Time delay approach for PSS and SSSC based coordinated controller design using hybrid PSO–GSA algorithm. Int. J. Electr. Power Energy Syst. 2015, 71, 262–273. [Google Scholar] [CrossRef]
  35. Heidari, A.A.; Mirjalili, S.; Faris, H.; Aljarah, I.; Mafarja, M.; Chen, H. Harris hawks optimization: Algorithm and applications. Future Gener. Comput. Syst. 2019, 97, 849–872. [Google Scholar] [CrossRef]
  36. Kamboj, K.V.; Nandi, A.; Bhadoria, A.; Sehgal, S. An intensify Harris Hawks optimizer for numerical and engineering optimization problems. Appl. Soft Comput. 2020, 89, 106018. [Google Scholar] [CrossRef]
  37. Hossain, A.M.; Noor, M.R.; K-Yau, A.L.; Azzuhri, R.S.; Z’Abar, M.R.; Ahmedy, I.; Jabbarpour, M.R. Multi-objective Harris hawks optimization algorithm based 2-Hop routing algorithm for CR-VANET. IEEE Access 2021, 9, 58230–58242. [Google Scholar] [CrossRef]
  38. Nallagalva, K.S.; Kirar, K.M.; Agnihotri, G. Transient stability analysis of the IEEE 9-bus electric power system. Int. J. Sci. Eng. Technol. 2012, 1, 161–166. [Google Scholar]
  39. He, P.; Fang, Q.; Jin, H.; Ji, Y.; Gong, Z.; Dong, J. Coordinated design of PSS and STATCOM-POD based on the GA-PSO algorithm to improve the stability of wind-PV-thermal-bundled power system. Int. J. Electr. Power Energy Syst. 2022, 141, 108208. [Google Scholar] [CrossRef]
  40. Diniz Costa Filho, R.N.; Paucar, V.L. Robust and coordinated tuning of PSS and FACTS-PODs of interconnected systems considering signal transmission delay using ant lion optimizer. J. Control. Autom. Electr. Syst. 2018, 29, 625–639. [Google Scholar] [CrossRef]
  41. Solomon, E. Damping of Low Frequency Oscillation through Optimal Sizing of Unified Power Flow Controller and Power System Stabilizer Employing Antlion Optimization. Energies 2022, 15, 3809. [Google Scholar]
  42. Ramos, A.R.; Kuiava, R.; Fernandes, C.T.; Pataca, C.L.; Mansour, R.M. IEEE PES Task Force on Benchmark Systems for Stability Controls; Tech. Rep.; Version 4.0; Pacific Northwest National Laboratory: Richland, WA, USA, 20 June 2014; pp. 1–49. [Google Scholar]
Figure 1. Schematic of conceptual model for coordinated control of UPFCs and PSSs.
Applsci 14 05254 g001
Figure 2. Flowchart of process stages of the proposed real-time coordinated control of UPFCs and PSSs against cyber-physical attacks.
Applsci 14 05254 g002
Figure 3. Schematic of a UPFC added to an SMIB system.
Applsci 14 05254 g003
Figure 4. Phasor diagram of P and Q control in UPFC.
Applsci 14 05254 g004
Figure 5. Controller structure diagram for the shunt component of the UPFC.
Applsci 14 05254 g005
Figure 6. Controller structure diagram for the series component of the UPFC.
Applsci 14 05254 g006
Figure 7. Structure diagram of the PSS controller.
Applsci 14 05254 g007
Figure 8. The Pareto set, which includes the utopia point, the nadir point, and the pseudo-Nadir point.
Applsci 14 05254 g008
Figure 9. Schematic of the simulated file of the IEEE 9−bus case.
Applsci 14 05254 g009
Figure 10. Three-dimensional Pareto diagram of optimal objective functions in the IEEE 9−bus network.
Applsci 14 05254 g010
Figure 11. Total cost and total speed deviation of IEEE 9−bus network for scenario of line outage between buses 4 and 5.
Applsci 14 05254 g011
Figure 12. Voltage deviation of IEEE 9−bus network for scenario of line outage between buses 4 and 5.
Applsci 14 05254 g012
Figure 13. Output power and rotor-angle generators in IEEE 9−bus network (for PM condition) for scenario of line outage between buses 4 and 5.
Applsci 14 05254 g013
Figure 14. Schematic of the simulated file of the IEEE 39−Bus.
Applsci 14 05254 g014
Figure 15. Total cost and total speed deviation of IEEE 39−Bus for scenario of line outage between bus 4 and 14.
Applsci 14 05254 g015
Figure 16. Voltage deviation of IEEE 39−Bus for scenario of line outage between bus 4 and 14.
Applsci 14 05254 g016
Figure 17. Output power and rotor angle generators in IEEE 39−Bus (for PM condition) for scenario of line outage between bus 4 and 14.
Applsci 14 05254 g017
Table 1. Comparison of performance between the PM and previous SOTA methods in different scenarios of cyber-attacks on the IEEE 9−bus network.
IndexesOperating
Cost ($)
Speed
Deviation (pu)
Voltage
Deviation (pu)
CPU-Time for
Optimization
Number of
Iterations
Disturbance
Line outage
between
buses 4 and 5
PM1107.480.000170.1714122.121
[32,39]1107.960.002560.1942186.4532
[3,40,41]1107.980.001860.203224549
Line outage
between
buses 7 and 8
PM1112.520.000110.1218122.121
[32,39]1113.840.003410.1621186.4532
[3,40,41]1113.720.002620.324524549
Line outage
between
buses 6 and 9
PM1101.410.000560.1023122.121
[32,39]1102.820.004230.1851186.4532
[3,40,41]1103.050.003840.352124549
Table 2. Comparison performance of the PM and Previous SOTA methods in different scenario of cyber-attack to the IEEE 39−Bus.
IndexesOperating
Cost (USD)
Speed
Deviation (pu)
Voltage
Deviation (pu)
CPU-Time for
Optimization
Number of
Iterations
Disturbance
Line outage
between
buses 4 and 14
PM1999.660.000540.19611119.2548
[32,39]199.930.00101.0152541.362
[3,40,41]1999.950.00111.018281271
Line outage
between
buses 2 and 39
PM2024.310.000410.12181119.2548
[32,39]2042.640.005410.9542541.362
[3,40,41]2032.210.006270.971281271
Line outage
between
buses 25 and 26
PM1959.720.000420.18311119.2548
[32,39]1962.280.002171.06182541.362
[3,40,41]1960.630.004511.0279281271
Disclaimer/Publisher’s Note: The statements, opinions and data contained in all publications are solely those of the individual author(s) and contributor(s) and not of MDPI and/or the editor(s). MDPI and/or the editor(s) disclaim responsibility for any injury to people or property resulting from any ideas, methods, instructions or products referred to in the content.

