Article

Metabolic Rate Measuring with Indirect Calorimetry for Thermal Comfort Evaluation

1
School of Environmental Science and Engineering, Tianjin University, Tianjin 300072, China
2
Key Laboratory of Efficient Utilization of Low and Medium Grade Energy (Tianjin University), Ministry of Education of China, Tianjin 300072, China
3
National Engineering Laboratory for Digital Construction and Evaluation Technology of Urban Rail Transit, Tianjin 300308, China
*
Author to whom correspondence should be addressed.
Appl. Sci. 2024, 14(13), 5363; https://doi.org/10.3390/app14135363
Submission received: 17 May 2024 / Revised: 30 May 2024 / Accepted: 3 June 2024 / Published: 21 June 2024

Abstract

:
The metabolic rate (MET) is a fundamental parameter influencing thermal comfort. In this paper, the MET is obtained by indirect calorimetry to propose equations and related laws applicable to the environment at an altitude of 4 m, so as to enrich the research. Here, experiments with 30 healthy male subjects are conducted at sitting, 2, 4, and 6 km/h walking speeds in various ambient environments controlled by the climate chamber. The MET, thermal sensation vote (TSV), and heart rate (HR) were collected during the experiments. The results indicate that the ambient environments have little impact on MET, but it is obvious for HR. The linear relationship between walking speed, HR, and MET is fitted to be MET = 28.38 × Speed + 62.25 and MET = 3.67 × HR − 195.56. Moreover, the TSV and five kinds of predicted mean vote (PMV) calculated by various sources of MET are compared. For sitting activity, a slight difference from the MET could cause a significant difference in PMV, which leads to the PMV that may be above, below, or close to the TSV. For the 2 km/h walking activity, five kinds of PMV are close to TSV. However, for the 4 km/h walking activity, PMV is always higher than TSV. These findings are significant in elucidating the relationship between MET and thermal comfort.

1. Introduction

Thermal comfort is perceived as an essential factor for the well-being and productivity of the occupants. Thermal comfort is defined as that “condition of mind that expresses satisfaction with the thermal environment and is assessed by subjective evaluation” by ASHRAE Standard 55 [1]. In the field of thermal comfort research, the results of Prof. Fanger [2] are most representative. To date, the predicted mean vote (PMV), which is proposed by him, is the broadest index of thermal comfort evaluation from all over the world. At present, lots of standards in Europe, the United States, China, and India are also written on this basis [3,4,5,6].
There are six fundamental parameters of the PMV index, which are air temperature, air humidity, mean radiant temperature, air velocity, clothing insulation, and metabolic rate (MET) [2]. The environmental parameters can often be measured with relatively simple and inexpensive equipment [3]. Moreover, the values of clothing insulation are always summed in individual garment insulation according to the standards in [1,3]. For example, if an adult man wears a short-sleeved garment with a clothing insulation of 0.05 clo Clo and a long-sleeved garment with a clothing insulation of 0.07 clo, the total garment clothing insulation is 0.12 Clo. On the contrary, the measurement of MET is complex. The simple and direct method is to read the ‘activity diary’ from the standards in [7,8], which is used in most thermal comfort studies [9,10]. Liu et al. used a vision-based approach to estimate MET to predict thermal sensation [9], whose MET data originates in ISO 8996-2004 [7]. For example, the MET is 55 W/m2 at sitting activity, and the MET is 110 W/m2 at 2 km/h walking activity without load. Wang et al. analyzed the relationship between thermal sensation and thermal comfort of people with different activity intensities in the urban park during winter in cold regions of China [10]. They graded the different activities based on the MET data in ASHRAE Standard 55 [1]. Despite the simplicity of this method, its accuracy is low, and there are often some mistakes. According to several recent studies, there are underestimation errors in the ‘activity diary’ of the ASHRAE Handbook [8]. The other method with slightly higher precision is to estimate MET by measuring the heart rate [11,12]. Lin et al. conducted a thermal responses experimental study, and the MET of the subjects was calculated by the HR [11]. Choi et al. investigated the possibility of using heart rate as a human factor for thermal sensation models [12]. Both of these methods cost little but may be less accurate.
As science and technology evolve, indirect calorimetry becomes a great way to measure MET [13]. It works by measuring the amount of oxygen consumption (VO2) and carbon dioxide output (VCO2) of the body over a period to calculate MET. This method is regarded as the gold standard of human metabolism measurement due to its significant accuracy, although it requires expensive and complex equipment [7,13]. Recently, this method has been adopted for thermal comfort studies [14,15,16,17,18,19,20]. Nomoto et al. measured the MET of college-age Japanese subjects during various office activities [14]. The findings showed that the standards overestimated the MET and resulted in a variance of thermally neutral temperature. Anand et al. obtained the MET of Indian subjects during sitting and walking activities and compared the PMV based on standards and observed MET [15]. However, many previous studies measured the MET only at a particular intensity of activity and resulted in somewhat restrictive applications. Therefore, it is necessary to develop some predictive equations for MET and investigate their application in thermal comfort.
The purpose of this research is to obtain the MET at various activities using indirect calorimetry, to develop the predictive equations for MET, and to investigate their application in thermal comfort. Firstly, the physiological parameters of some subjects are collected in various ambient environments. Next, the impacts of ambient environments on physiological parameters are studied separately. Finally, the predictive equations are fitted, and their applications in thermal comfort are compared with other standards and studies. These results are significant in elucidating the relationship between MET and thermal comfort.

2. Methodologies

This study was conducted during April–June 2023 in Tianjin, China. The experiments are conducted in an outdoor compartment of the climate chamber (Figure 1, only the left part: 4 m × 2 m × 3 m), which is located at Tianjin University. The ambient temperature is controlled by a precision air conditioner with a control range of −20–60 °C and an accuracy of ±0.3 °C. The relative humidity is controlled by a humidifier and a desiccant wheel device with a control range of 20–80% and an accuracy of ±10%.

2.1. Subjects

Thirty male subjects participated in the experiment, and they were college students from Tianjin University. All of them had no underlying diseases like cardiovascular disease and harmful habits like smoking. Their basic information was collected before the experiments (age: 22.9 ± 1.4, height: 1.76 ± 0.08 m, weight: 71.1 ± 12.2 kg, body surface area: 1.86 ± 0.17 m2). The body surface area (ADU) was estimated by the Dubois formula [21] as follows:
ADU = 0.202 × W0.425 × H0.725
where W is the weight of the subject, kg; H is the height of the subject, m; ADU is the subject’s body surface area, m2.

2.2. Environmental Parameter Measurements

Hot-wire anemometers (Figure 2a, Testo 416, Testo Ltd., Lenzkirch, Germany, accuracy ±0.1 m/s) were used to measure the air velocity, and the air velocity in the climate chamber was controlled to be less than 0.1 m/s. Temperature and humidity recorders (Figure 2b, UX100-011A, Hobo Co., Ltd., Bourne, MA, USA, temperature accuracy ±0.2 °C, RH accuracy ±2.5%) were set every 10 s and positioned at 0.5, 1.0, 1.5, and 2.0 m above the floor to measure the ambient temperature and relative humidity. During the experiment, the atmospheric pressure in Tianjin was 100.48 kPa.

2.3. Physiological Measurements

The portable metabolic device (Figure 3a, MetaMax 3B, Cortex Ltd., Leipzig, Germany) was used to measure the MET of the subjects. Table 1 displays the internal sensor type, measurement range, and precision. The O2 and CO2 concentration and flow rate were calibrated before the experiments. When using the device, a specialized mask (Figure 3b) was required to cover the subject’s mouth and nose, in order to collect the oxygen consumption (VO2) and carbon dioxide output (VCO2) of each breath. In general, energy in the body comes mainly from the oxidation of carbohydrates and fats. The amount of oxygen consumed and carbon dioxide produced by the oxidation of different energy substances varies. Therefore, the amount of carbohydrates and fats involved in oxidation can be obtained by measuring VO2 and VCO2, thus determining MET using the following equations [22]:
RQ = VCO2/VO2
EE = 5.88 × (0.23RQ + 0.77)
MET = EE × VO2/ADU
where VO2 is oxygen consumption, L/h; VCO2 is carbon dioxide output, L/h; RQ is the respiratory quotient; EE is the energetic equivalent, W × h/L; ADU is the subject’s body surface area, m2; MET is the metabolic rate, W/m2.
A heart rate tape (Figure 3c, Polar H10, Polar Ltd., Beijing, China, accuracy ±1 bpm) was used to record the HR of the subjects every 10 s during the experiments.
The temperature recorders (Figure 3d, DS1992L, Maxim Ltd., Wilmington, MA, USA, accuracy ±0.5 °C) were used to measure the skin temperature of the subjects every 10 s during the experiments. Four temperature records were placed at the right upper arm, left chest, right thigh, and calf, respectively. The mean skin temperature (mTsk) is calculated by the following equation [23]:
mTsk = 0.3 × Tarm + 0.3 × Tchest + 0.2 × Tthigh + 0.2 × Tcalf
where Tarm is the skin temperature of the right upper arm, °C; Tchest is the skin temperature of the left chest, °C; Tthigh is the skin temperature of the right thigh, °C; Tcalf is the skin temperature of the right calf, °C; mTsk is the mean skin temperature of the subject, °C.

2.4. Subjective Questionnaire

According to the ASHRAE Handbook [8], the thermal sensation vote (TSV) utilizes a 7-point scale. Its specific forms are given in Figure 4, and before the experiments, all subjects are trained and understand the meaning of the questionnaire exactly.

2.5. Experimental Procedure

In order to simulate four various thermal environments, this study set four ambient temperatures, which were 30 °C (hot), 24 °C (warm), 18 °C (cool), and 12 °C (cold), respectively. The atmospheric pressure was 100.48 kPa under each condition. Since the outdoor air in Tianjin was relatively dry during the experiment, the relative humidity was 30–40%, and it was easier to control and maintain stability by reducing the relative humidity with the dehumidification wheel than by increasing the relative humidity. Therefore, the relative humidity was constantly set at 30%. All subjects were requested to wear appropriate clothing under these four conditions. Table 2 gives the pertinent details about the clothing. Except for the down jacket, all clothing was made of cotton. Among them, men’s briefs and long johns were provided by the subjects themselves, and the rest of the clothes were provided by this experiment to ensure that the clothing insulation was the same.
Subjects are instructed to participate in the experiment at least three hours after the meal since eating increases MET significantly [16]. They are prohibited from drinking alcohol from the day before the start of the experiment until the end of the experiment. In addition, subjects receive at least one day of relaxation after participating in an experiment to prevent fatigue.
Figure 5 shows the experimental process. The subjects wear the clothing and equipment before entering the climate chamber. After 25 min of sedentary activity to acclimate to the environment, their Tsk, MET, and HR are measured. The participants experience a 5 min sitting period and three 10 min exercise periods with varying walking speeds (2, 4, and 6 km/h, respectively). Similar to Zhai’s study, activity intensity runs from low to high [16]. Moreover, before raising activity intensities each time, subjects are required to achieve subjective questionnaires verbally.

2.6. Statistical Analysis

On the basis of verifying the accuracy of MET and HR, this article tries to find an equation that is more applicable, for example, in low-elevation environments. The values of MET and HR pass the Kolmogorov–Smirnov test and conform to a normal distribution. The differences between physiological parameters at various conditions are studied with repeated measures analysis of variance (RM-ANOVA). The LSD test is used for pairwise comparisons. The significance is accepted when p < 0.05. Linear regressions and nonlinear registrations are used to obtain the relationship between the MET and activity intensity. In addition, linear regressions are used to obtain the relationship between the MET and HR.

3. Results and Discussion

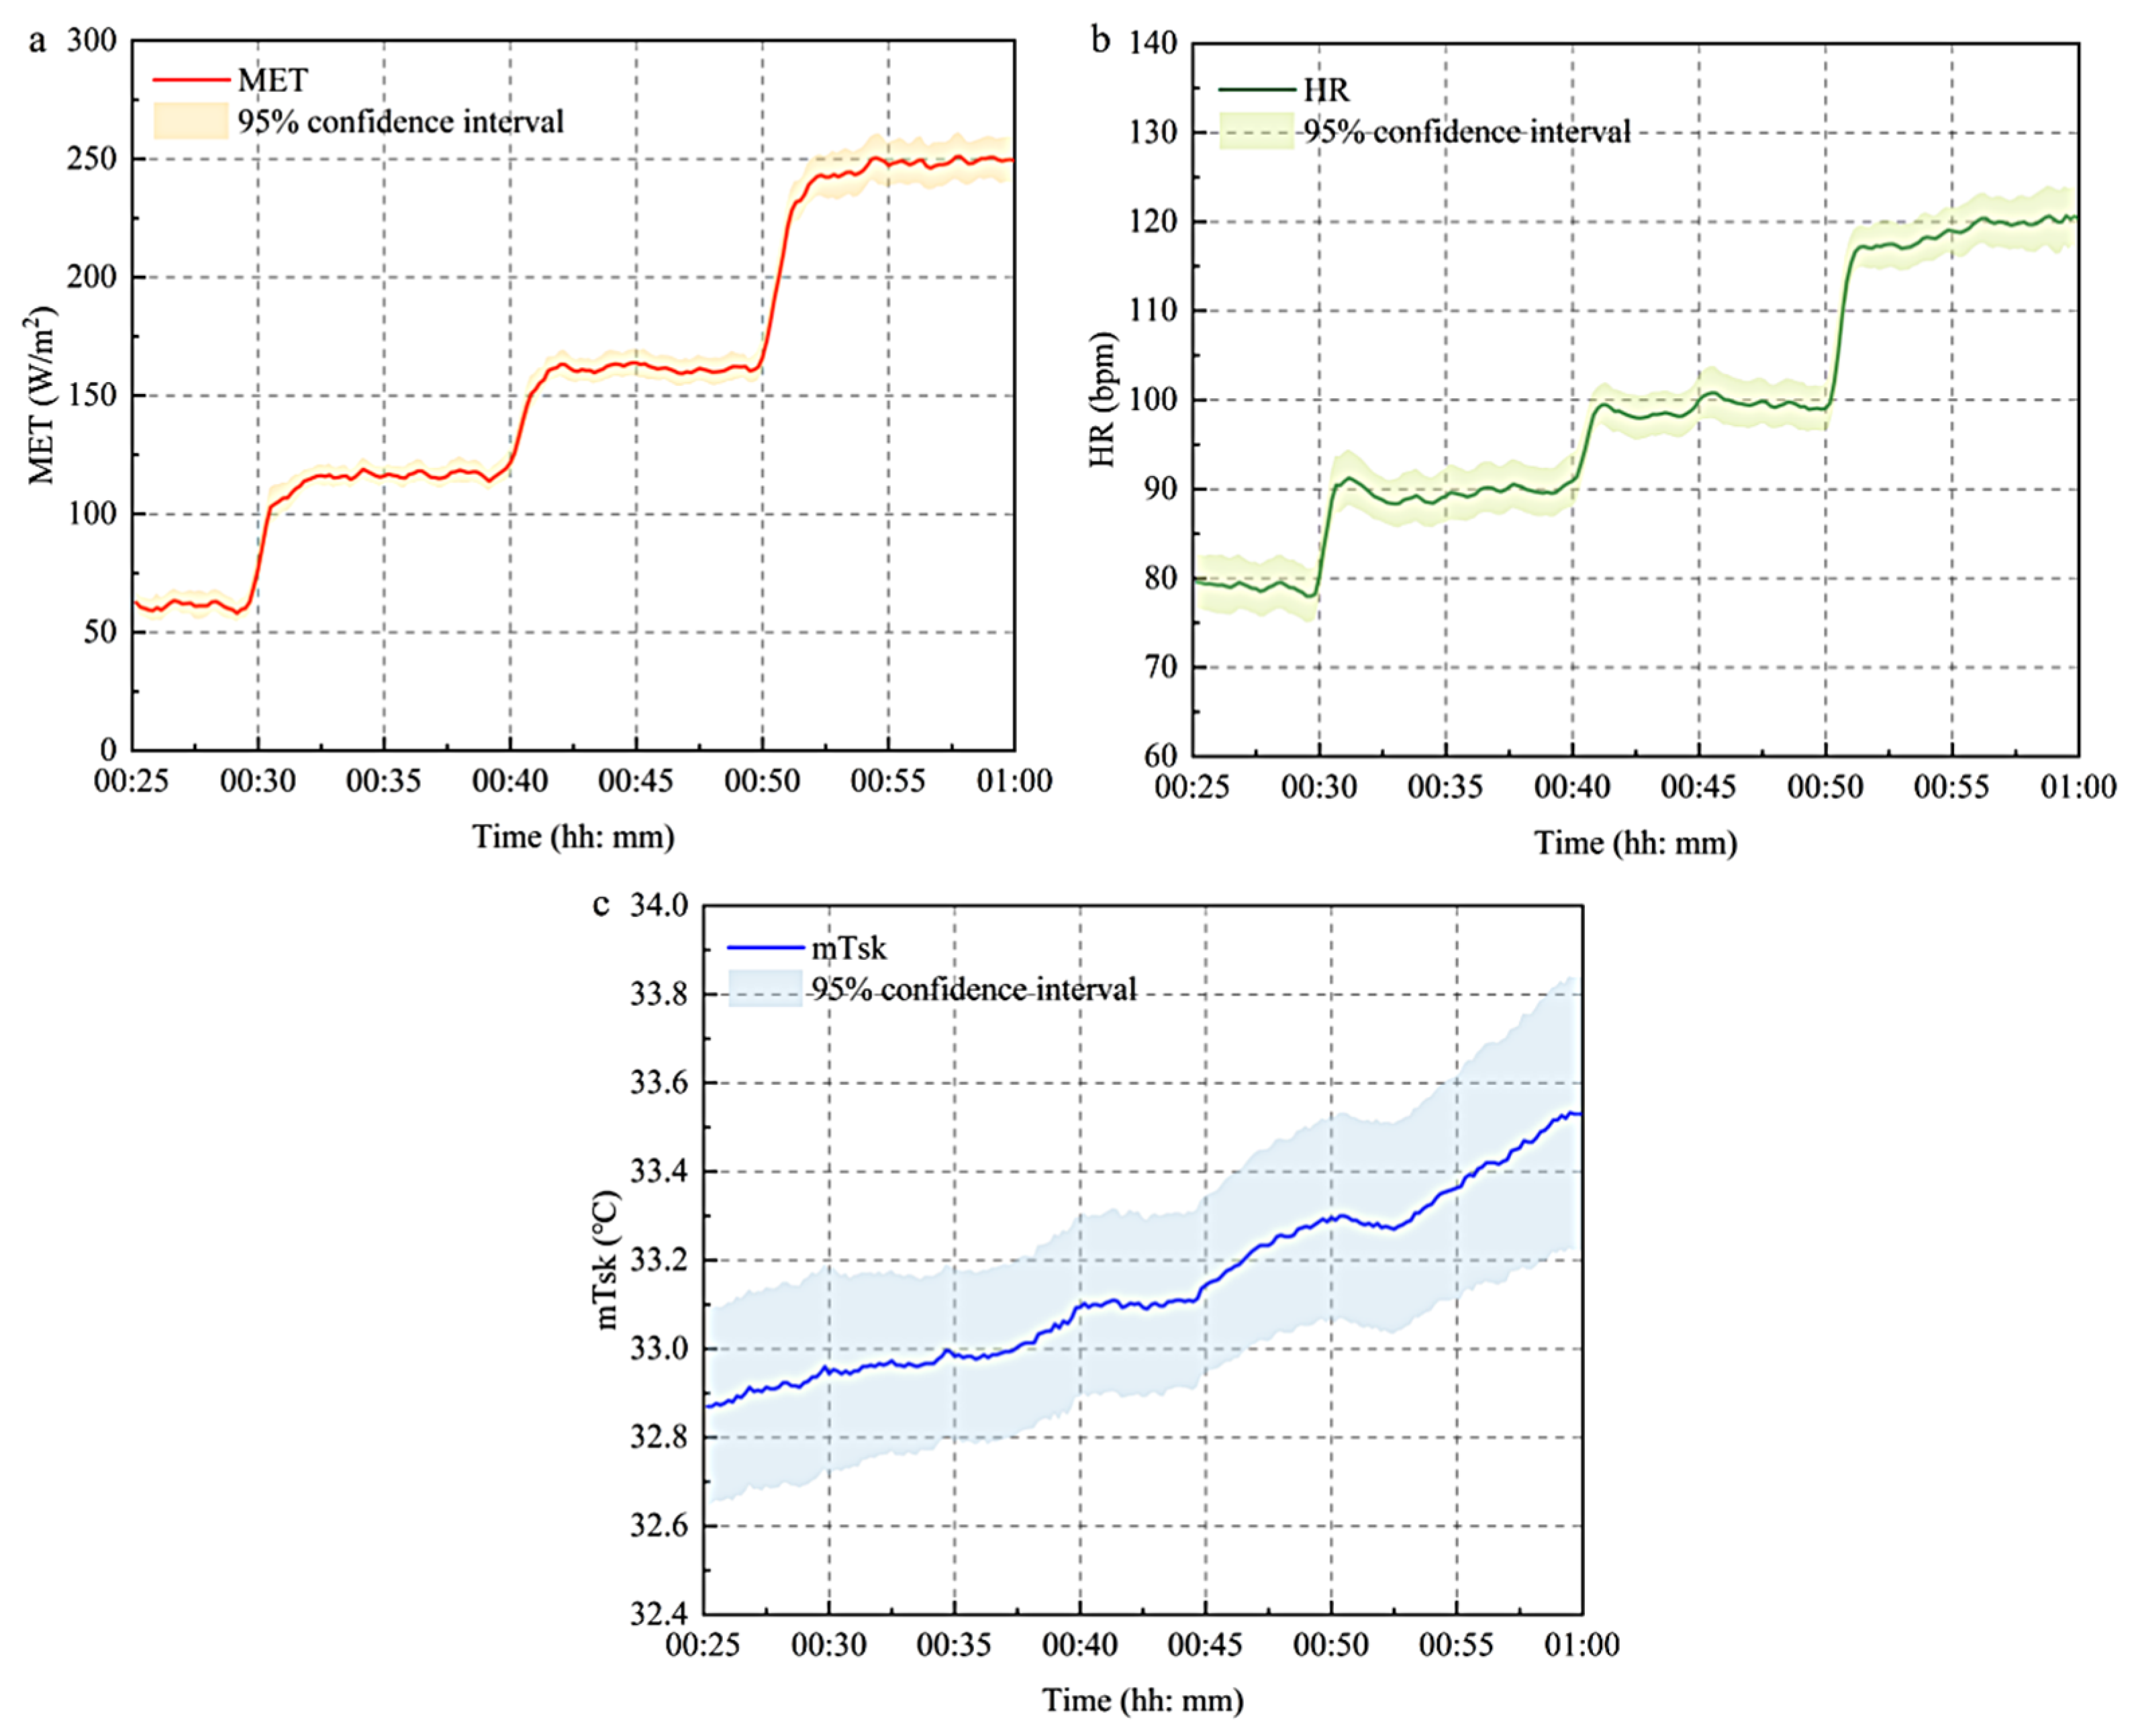
3.1. The Variation of Physiological Parameters over Time

The physiological parameters of subjects show analogous changes in cold, cool, warm, and hot environments. Figure 6 displays the variation of the mean values of MET, HR, and mTsk for 30 subjects in a warm environment (24 °C). The results indicate that the MET increases as subjects conduct higher activity intensity. The variation of MET can be categorized into the rising and stabilizing periods. Similar to several previous research projects [15,19,20], the rising period tends to end within a few minutes, followed by the stabilizing period. Therefore, the mean values on the final 5 min at each activity intensity represent the MET at that activity. The results of RM-ANOVA show that activity intensity has a significant impact on MET (F (3, 27) = 751.4, p < 0.001). The variation of HR is similar to that of MET, and it also can be divided into the rising and stabilizing periods. Therefore, the mean values on the final 5 min at each activity intensity represent the HR at that activity, and the results of RM-ANOVA show that activity intensity has significant impacts on HR (F (3, 27) = 521.8, p < 0.001). However, the variation of mTsk over time is distinct from that of MET and HR. The mTsk cannot be stabilized within 10 min at each activity intensity. Therefore, the values of mTsk keep increasing with time. According to several previous studies [20], mTsk can stabilize within 20 min. In summary, the varying activity intensity has significant impacts on the physiological parameters of the subjects. For MET and HR, they vary rapidly over time. However, compared to them, the variation of mTsk is slow and not very pronounced.

3.2. Comparisons of Physiological Parameters in Various Environments

Table 3 gives the monitored values of environmental parameters in four conditions. The climate chamber controls the ambient temperature, humidity, and air velocity.
The differences between physiological parameters in various environments are studied with RM-ANOVA. Figure 7 shows the values of MET in cold, cool, warm, and hot environments. For sitting activity, there are no significant differences in MET in four environments (F (3, 87) = 0.359, p = 0.783). For walking activity, the environments have little impact on MET when subjects walk at 2 km/h and 4 km/h (F (3, 87) = 1.369, p = 0.258, F (3, 87) = 1.737, p = 0.165, respectively). Otherwise, the impacts of environments (F (3, 87) = 5.845, p = 0.001) on MET are significant for 6 km/h walking activity. In fact, few outliers appear in 30 sample data under each condition, and the reason for the outliers may be related to the subject’s diet and physical condition on that day, which was eliminated during the analysis. The results of the LSD test indicate that the MET in the hot environment is significantly higher than that in the cold and warm environments (p = 0.006 and p < 0.01). According to the previous study [19], for high activity intensity, there are significant differences in MET in the hot environment due to the rising of subjects’ core temperature.
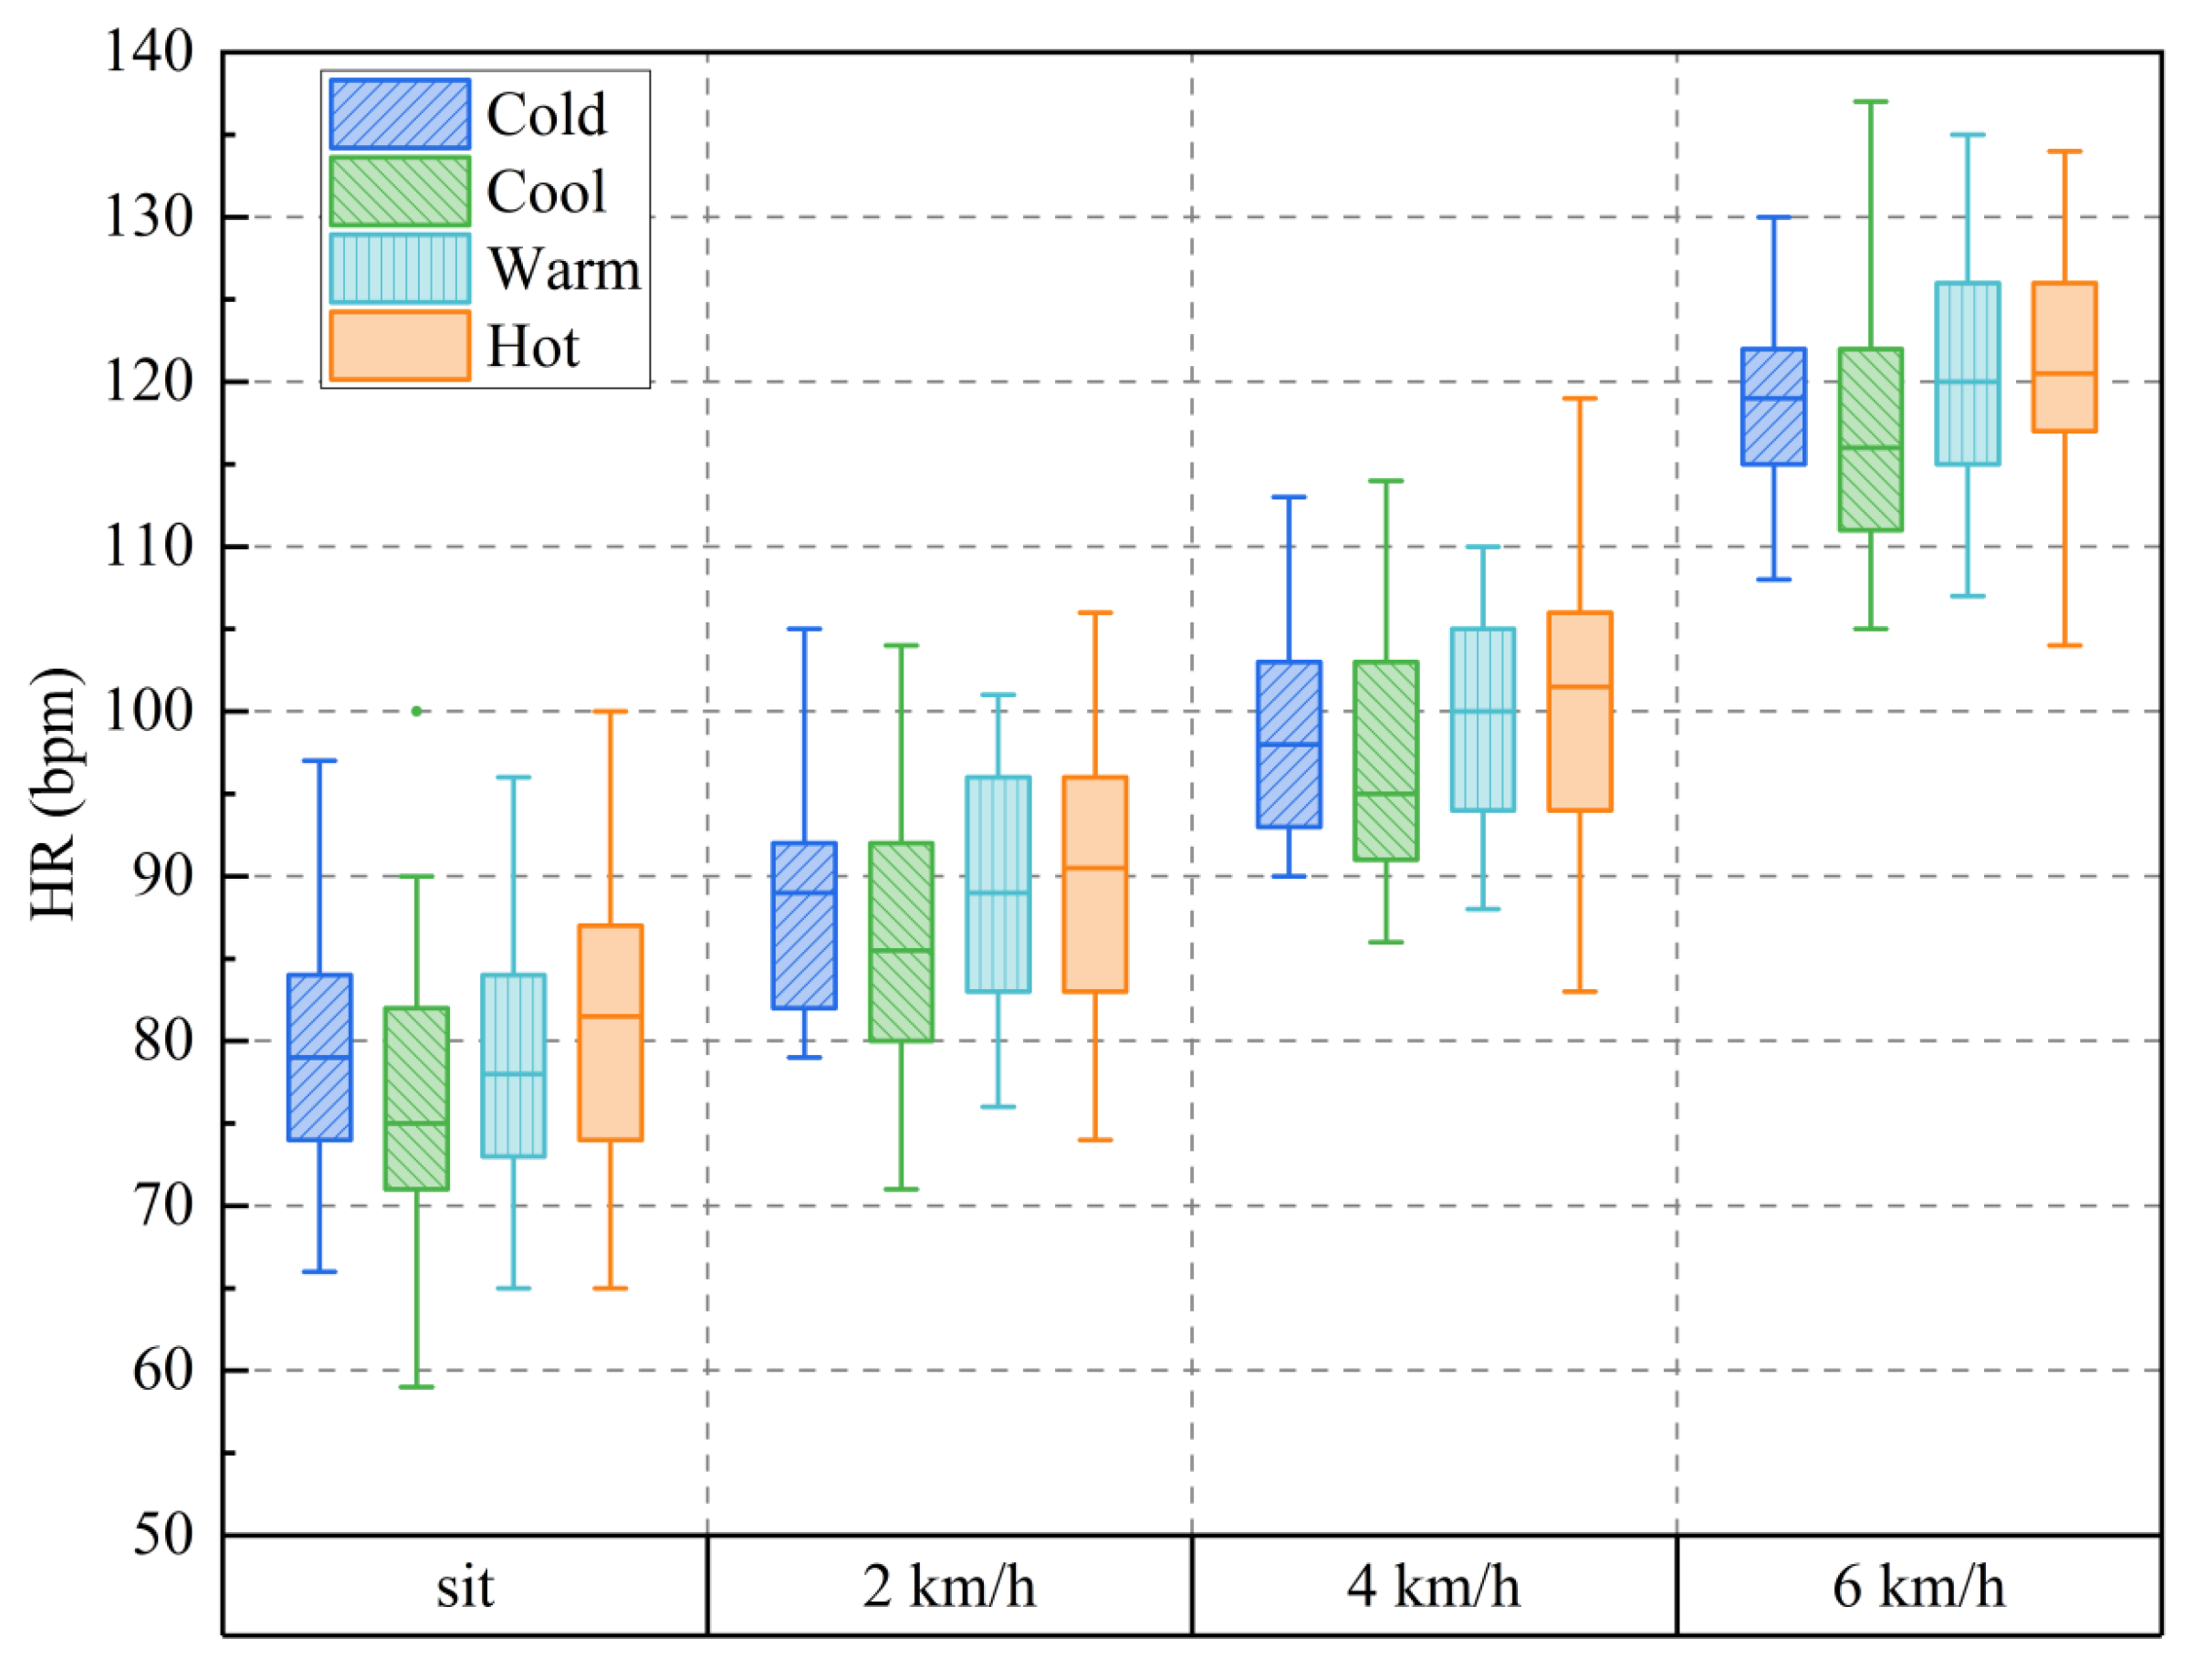
Figure 8 shows the values of HR in cold, cool, warm, and hot environments. For sitting and walking activities, different environments have significant impacts on HR (p = 0.037, p = 0.030, p = 0.026, and p = 0.006, respectively). For sitting activity, the LSD test results indicated that HR in the cool environment was significantly lower than that in the hot environment (p = 0.019). For 2 km/h walking, HR in the cool environment was significantly lower than in the warm and hot environments (p = 0.035 and p = 0.023). For 4 km/h walking, HR in the cool environment was significantly lower than that in the cold, warm, and hot environments (p = 0.045, p = 0.020, and p = 0.016). In addition, HR in the cool environment was significantly lower than that in the warm and hot environments (p = 0.017 and p = 0.003). In summary, HR in the cool environment was significantly lower than others.

3.3. Predictive Equations for MET Based on Walking Speed

As the observation method in ISO 8996-2004 mentioned, predictive equations can estimate the MET values of daily activities. In this study, all MET values at each activity intensity were considered as a whole since the varying environments have little impact on MET (except for the 6 km/h walking activity in the hot environment). The linear and nonlinear relationships between walking speed (km/h) and MET (W/m2) for 30 subjects (120 person-time) were fitted. In addition, some linear equations were fitted through the mean values of MET at each activity from other related research [7,8,15,20]. Figure 9a gives the linear relationships between walking speed and MET in this study, and Figure 9b shows the comparisons of this study and others. The specific details of the linear relationships are listed in Table 4.
The R2 of all equations is larger than 0.9, indicating that the linear correlation is a good representation of the relationship between MET and walking speed. However, there are disparities in the slopes and intercepts of them. The slope and intercept in the ASHRAE Handbook are the lowest in these studies, indicating that the MET values are evidently underestimated. The deviation is caused by the limitations of measuring equipment and most data come from investigations in the 20th century [24]. The slopes of Zhai’s and Anand’s studies are comparable and significantly higher than those of this study and ISO 8996. The reasons are that there is a lack of MET at high-activity intensities in Anand’s study, and the MET at high-activity intensities in Zhai’s study is higher. For Zhai’s study, the mean value of MET at 6 km/h walking is 284.4 W/m2, which is higher than that in this study (253.9 W/m2). This difference may be due to the influence of barometric pressure on the MET [25,26]. Liu et al. measured the MET of 5.4 km/h walking activity in various barometric pressures. The results showed that the MET in 0.95 atm is higher by 5.4% than that in 1 atm condition [25]. Zhai’s research is conducted in Xi’an, China, where the altitude is about 450 m, but this study is conducted in Tianjin, China, where the altitude is about 4 m. This results in a disparity in atmospheric pressure of about 0.05 atm between the two places. Therefore, the MET of 6 km/h walking activity in Zhai’s study is higher than in this study. It is worth noting that the intercept of this study is higher than others. It indicates that the MET of sitting activity in this study is higher than others. The reason is that the subjects of this study are younger than other studies, and they are more energetic. In summary, there are some discrepancies in these predictive equations for MET based on walking speed. When using these equations, it is necessary to take barometric conditions into account, especially at high activity intensities. In addition, the age difference causes the subjects to have a higher MET while conducting the sitting activity. The prediction equations in this study can provide a more accurate prediction of MET for people in schools, gyms, and other places in the plains.
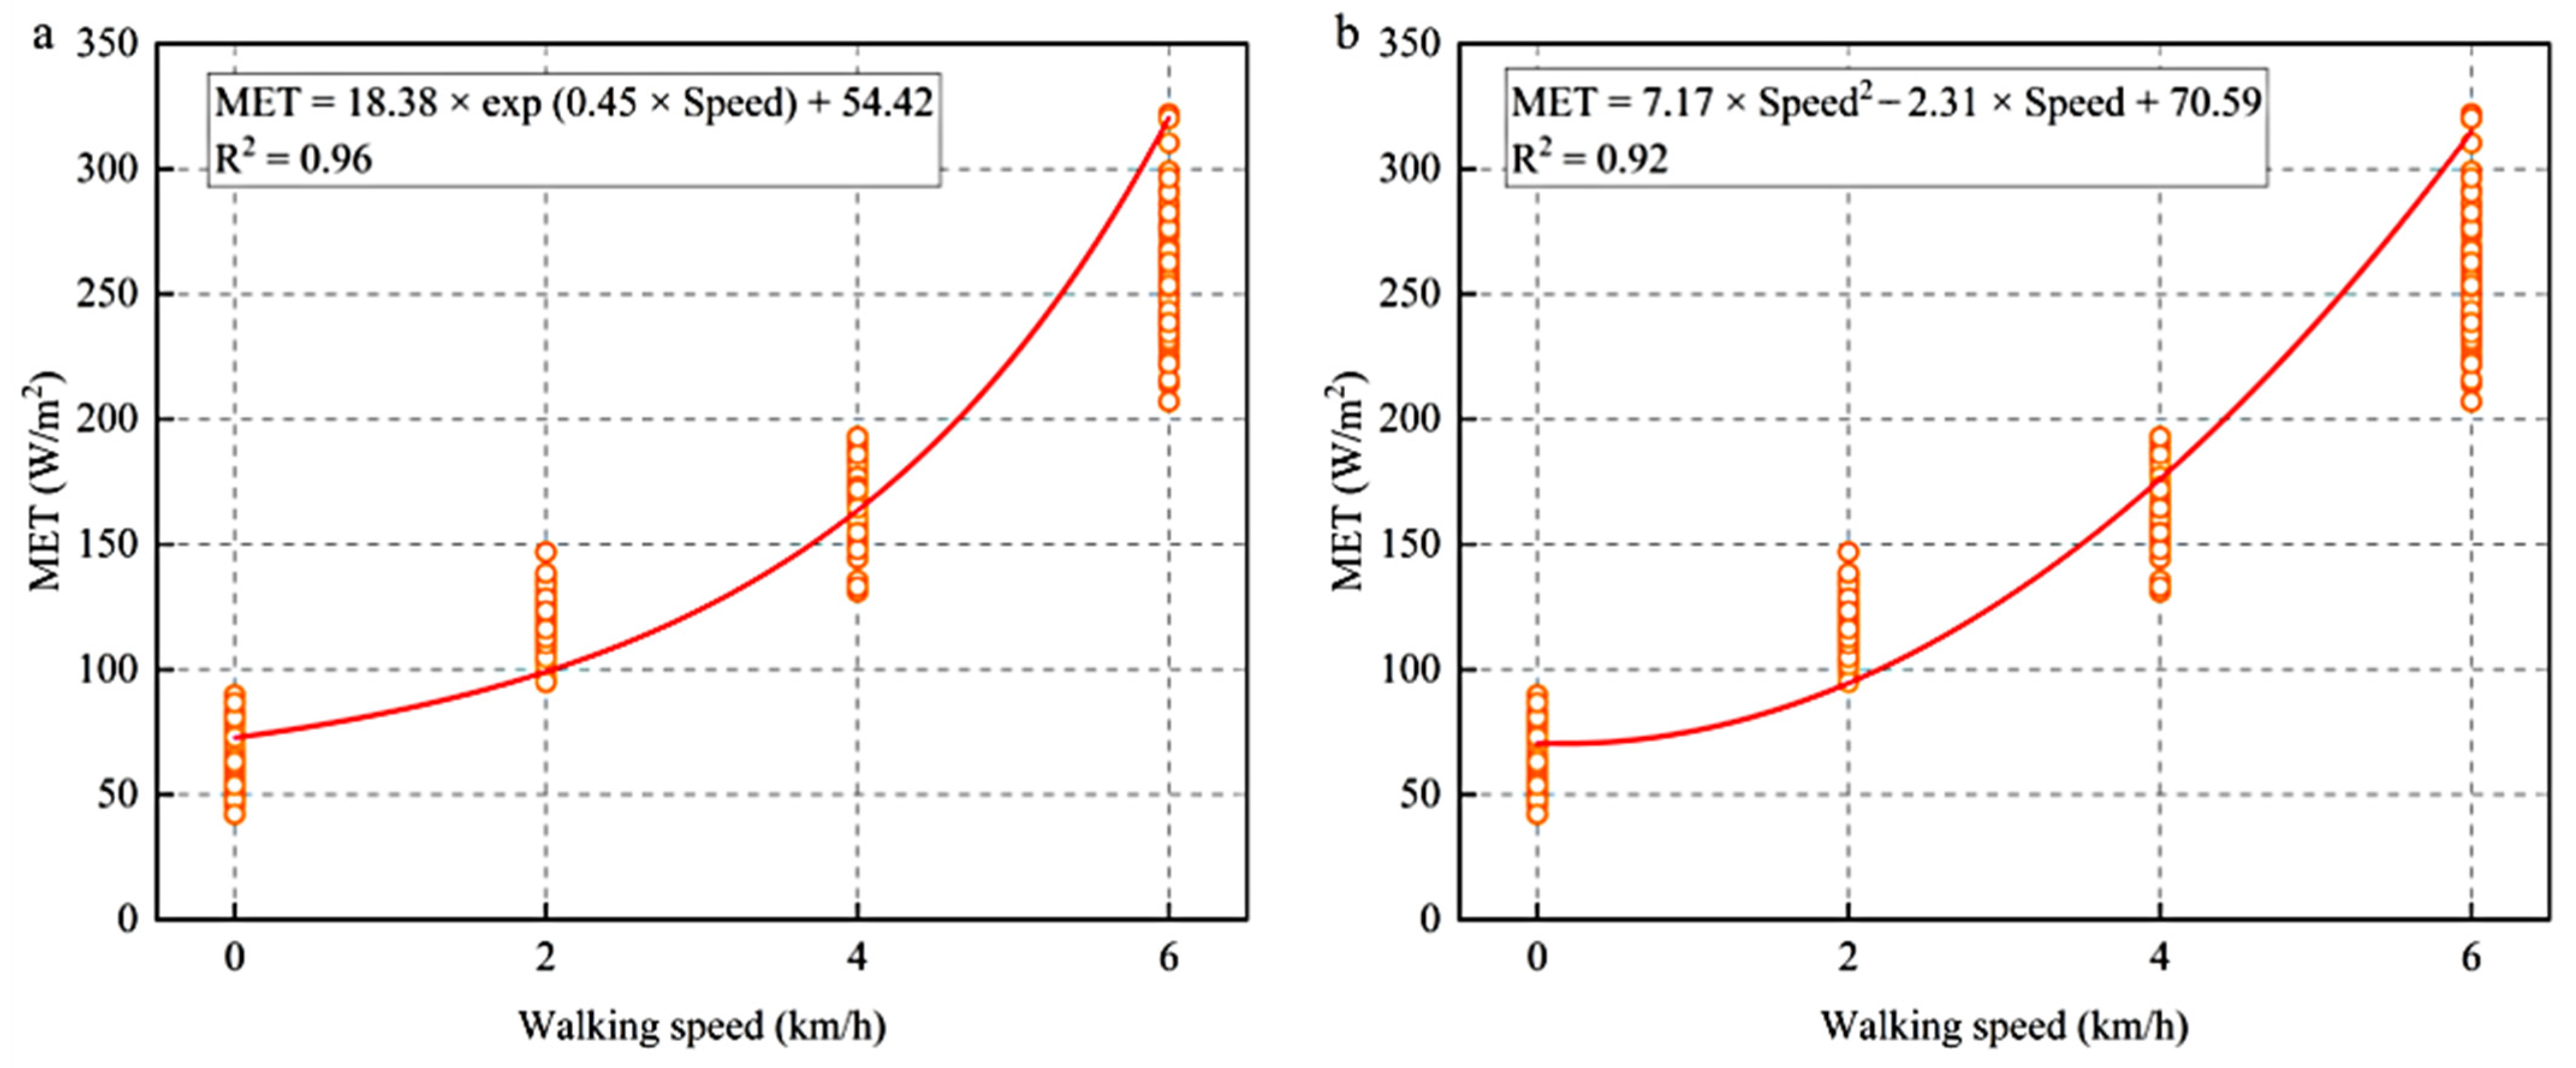
In addition to linear correlation, polynomial, exponential, and logarithmic fitting are commonly used. The logarithmic fitting results are poor, and the accuracy change caused by increasing the power in polynomial fitting is not significant. In order to be able to simplify the formula, the quadratic polynomial fitting is selected in this study. Figure 10 shows the linear relationships between walking speed and MET in this investigation. The exponential relationship is fitted in Figure 10a, and the quadratic polynomial relationship is fitted in Figure 10b. The R2 of them is lower than the linear relationship, and the forms are more complex. This shows that the linear relationship can better represent the relevance between MET and walking speed.

3.4. Predictive Equations for MET Based on HR

As the analysis method mentioned in ISO 8996-2004, the MET can be estimated by HR. The linear relationships between HR (bpm) and MET (W/m2) are fitted in this study. The predictive equation in the cool environment is obtained individually because the HR in the cool environment is significantly lower than that in other environments. Figure 11 gives the predictive equation for MET based on HR in cold, warm, and hot environments and the cool environment. The slope and intercept of the latter are lower than the former, although the R2 of them is equivalent. That means the RM (the heart rate increase values per unit of metabolic rate) of the latter is lower than the former.
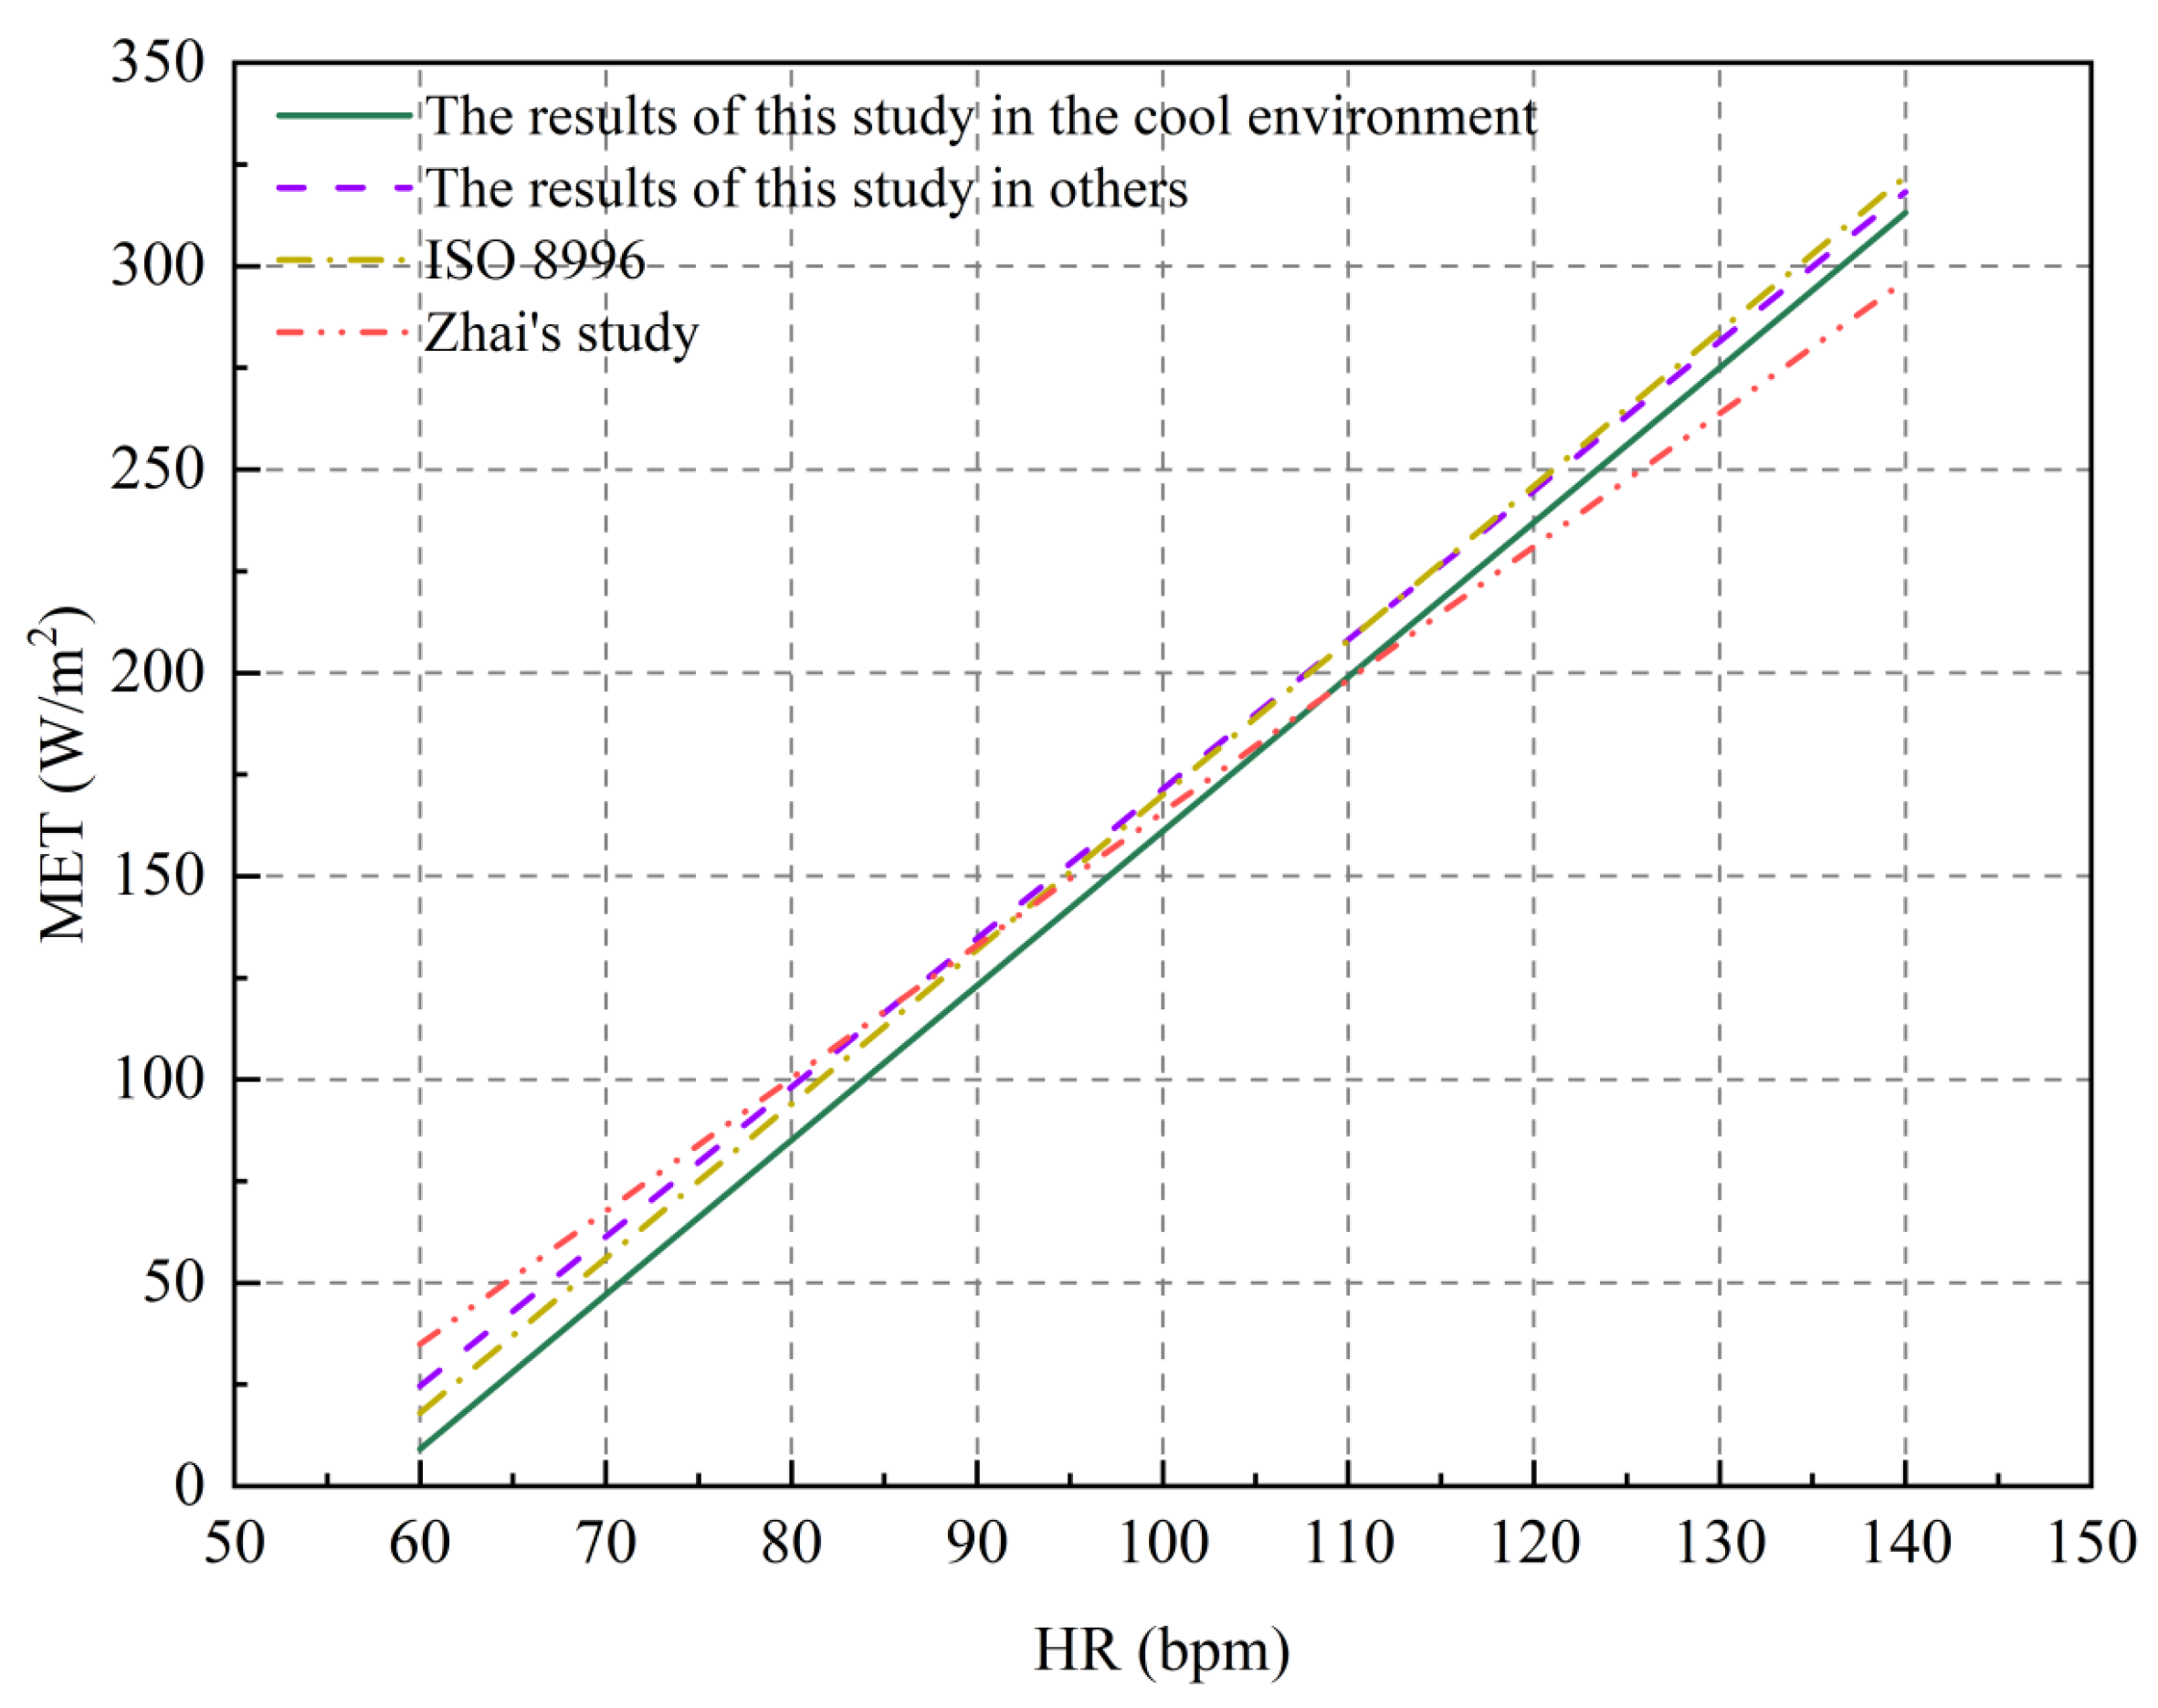
Zhai et al. measured the MET and HR of 30 males and obtained the linear relationship between HR and MET [20]. In addition, ISO 8996-2004 also gives the linear relationship (for 20-year-old 70 kg males) [7]. Figure 12 shows the comparisons of them and this study, and the specific forms of the predictive equations are listed in Table 5. The results indicate that the slopes of this study are similar to ISO 8996-2004, especially the slope in cold, warm, and hot environments, although the data come from different regions. However, the results of Zhai’s study are markedly distinct from the others, with higher slopes and intercepts. The RM of Zhai’s study is lower, which indicates that the subject may have better exercise levels. They have slower HR at high activity levels than this study and ISO 8996. Therefore, using predictive equations from this study and ISO 8996 may be more reasonable for most ordinary people (2250–3000 kcal/day for consumption) with limited exercise levels.

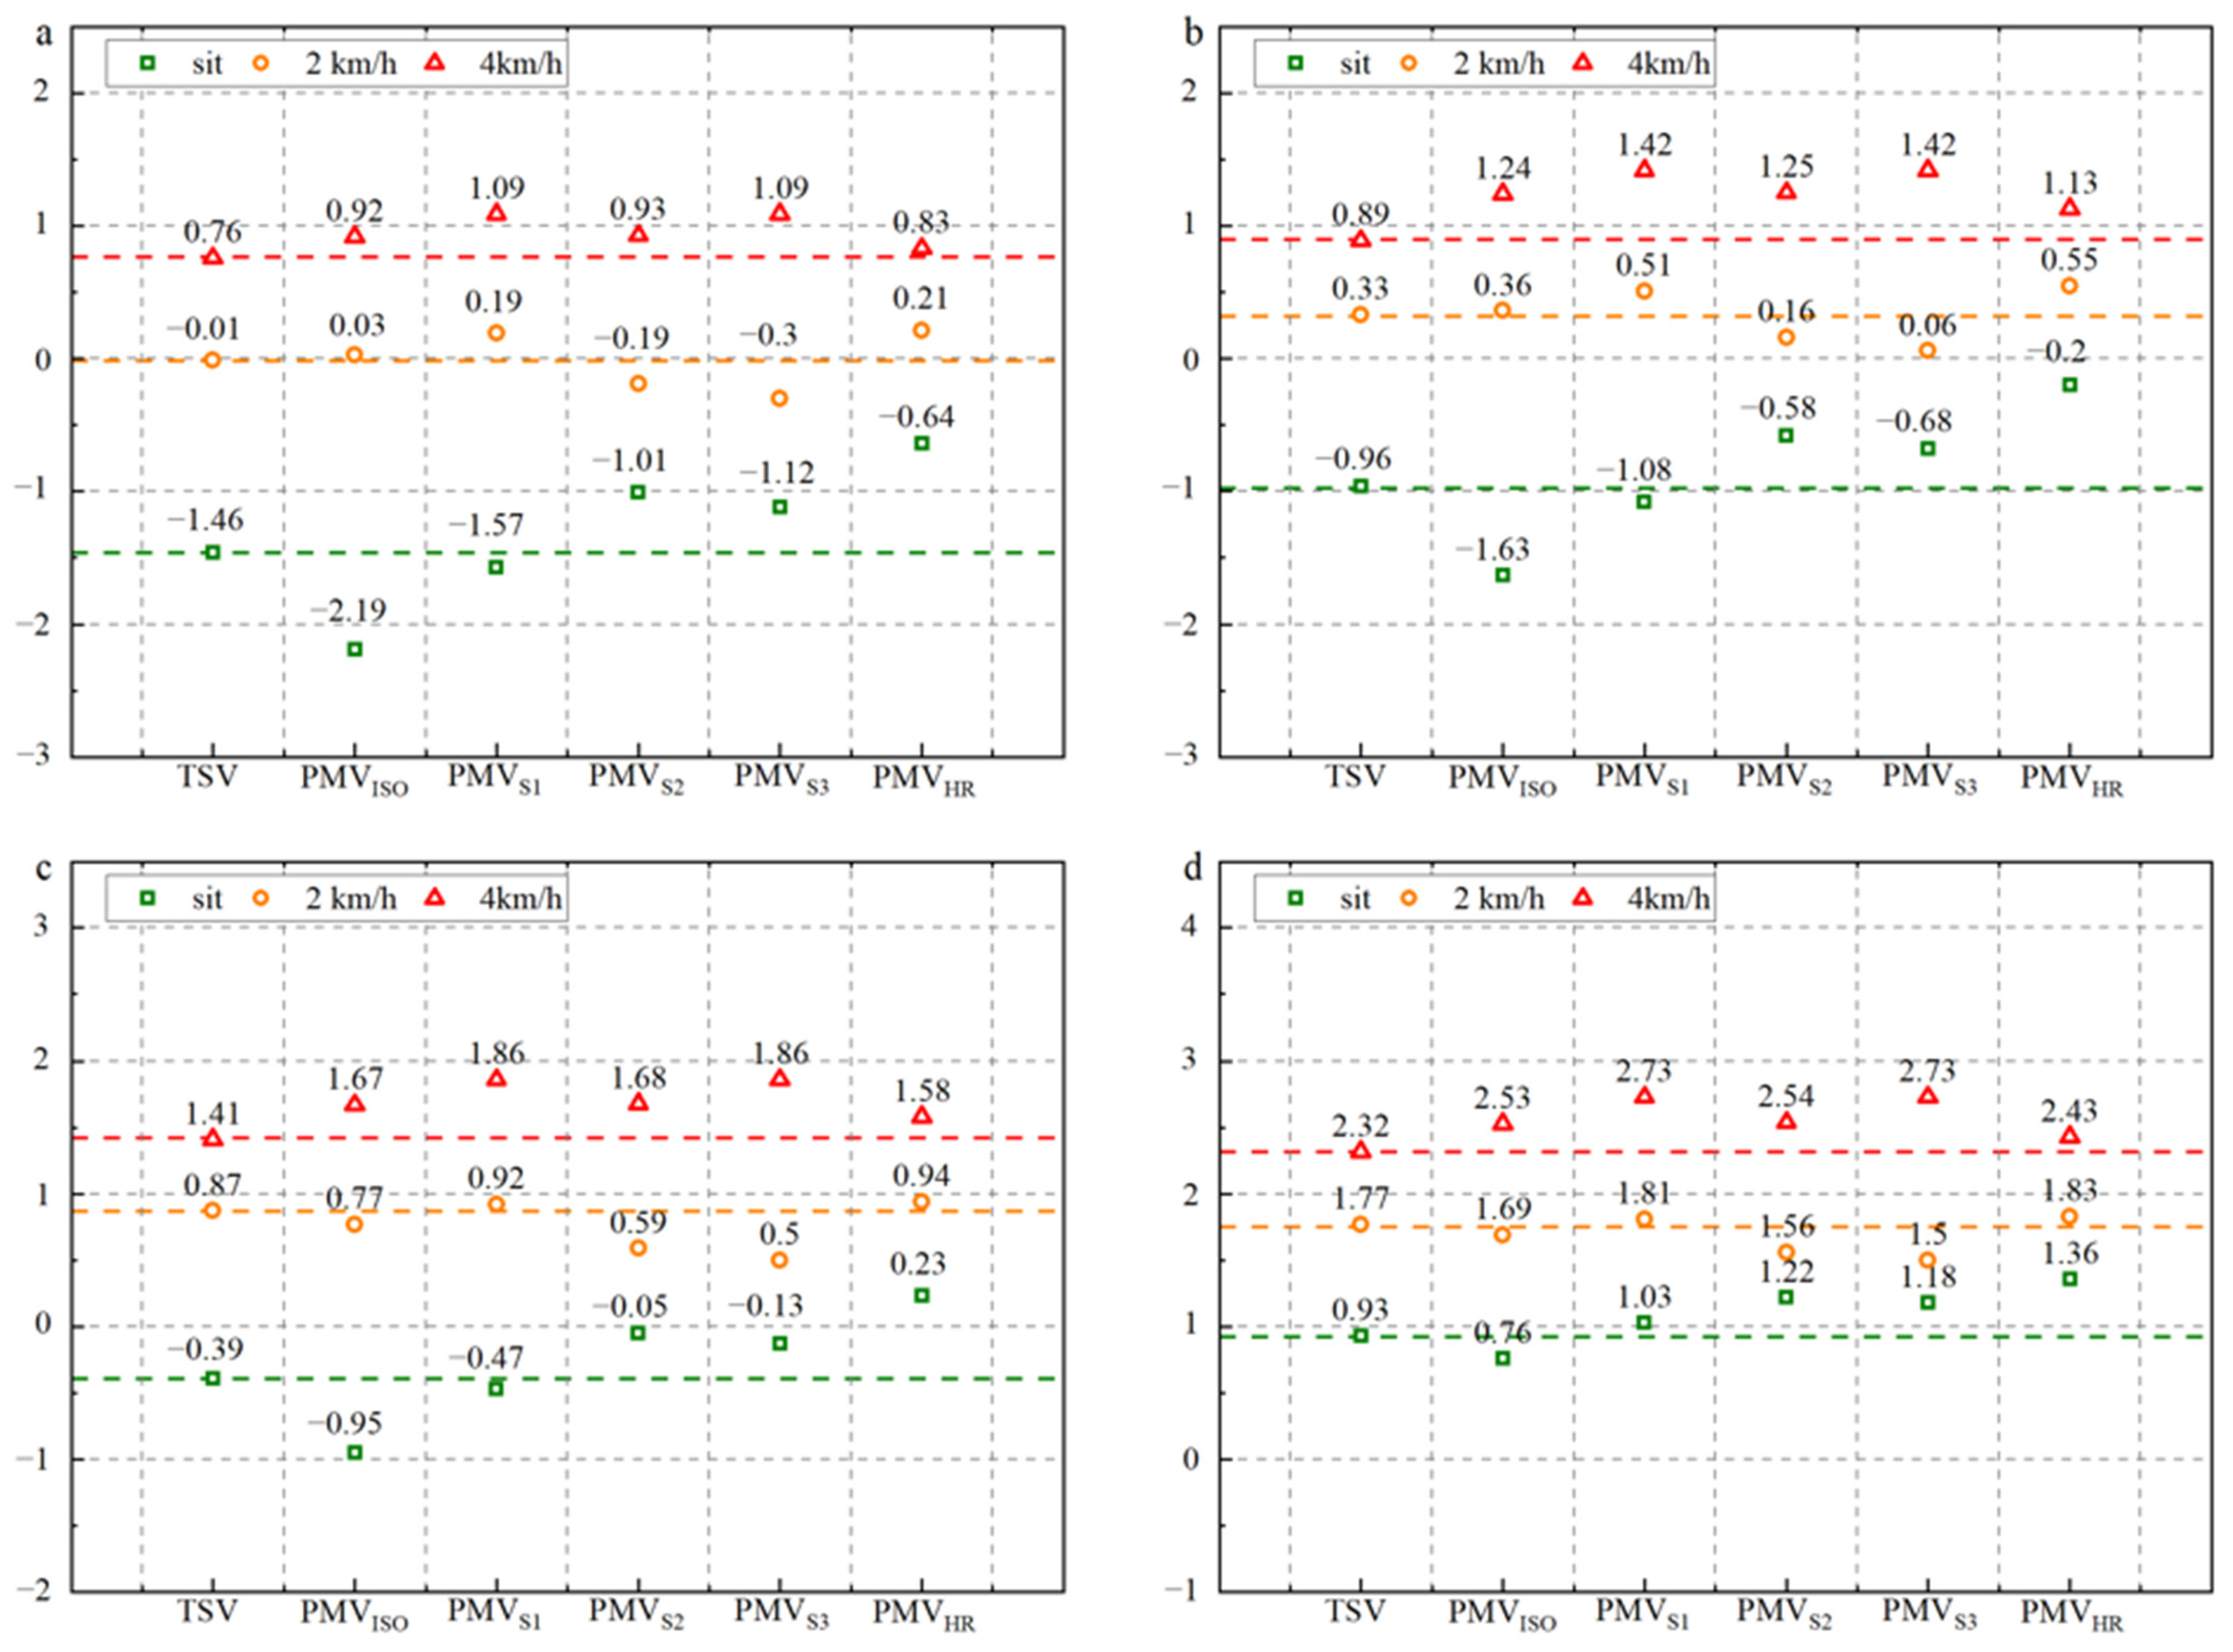
3.5. The Comparisons of TSV and PMV

According to ASHRAE Standard 55 [1], PMV is only applicable to predict the thermal sensation of the body at MET < 4 met. Therefore, this research compares the TSV and PMV of sitting and 2 km/h and 4 km/h walking. TSV is the mean value of the thermal sensation vote, which is collected after exercising each activity. PMVISO is calculated by formulas for PMV in ASHRAE Standard 55, whose values of MET are provided by the activity diary in ISO 8996-2004 [7]. PMVS1 is calculated by formulas for PMV, whose values of MET are provided by the linear predictive equation based on speed in this study. PMVS2 and PMVS3 are resourced from the exponential and quadratic polynomial equations in this study, respectively. Moreover, PMVHR is resourced from the predictive equations for MET based on HR in this study. Further, the values of MET in the cool environment are calculated by the individual equation. The comparisons of TSV and PMV in cold, cool, warm, and hot environments are shown in Figure 13.
The results show that the TSV is impacted significantly by the environments and activity intensities. For sitting activity, the TSV is <−0.5 in the cold and cool environments, and the TSV is >0.5 in the hot environment. It indicates that the subjects feel thermal stresses in these conditions. The subjects do not feel uncomfortable in the warm environment because the TSV is close to 0. It is worth noting that even though the subjects feel cold, hot, or comfortable in various environments, their MET is markedly unchanged. It suggests that the bodies do not feel strong thermal stresses to regulate heat dissipation due to the suitable clothing. For a 2 km/h walking activity, the subjects feel comfortable in the cold and cool environments according to the values of TSV, but they feel hot in the warm and hot environments. However, the subjects in all environments feel hot because the TSV is always higher than 0.5 for 4 km/h walking activity. It indicates that the subjects feel warmer at the higher activity intensity because it can raise the core temperatures of the bodies. In summary, the TSV always rises following the activity intensity increases and the environment becomes warm. It indicates that the body feels comfortable performing high-intensity activities in a cool environment. In contrast, the body feels comfortable performing low-intensity activities in a warm environment.
The discrepancies between TSV and the five kinds of PMV are significantly different at various activity intensities. For sitting activity in all environments, PMVS1 is close to TSV, PMVISO is always lower than TSV, but PMVS2, PMVS3, and PMVHR are consistently higher than TSV. For the 2 km/h walking activity, five kinds of PMV are not significantly different from TSV, although they are slightly lower or higher than TSV in all environments. For the 4 km/h walking activity, the TSV is always lower than PMV, indicating that PMV overestimates the actual thermal sensations of the human body. Interestingly, PMVS1 and PMVS3 are the same because the MET calculated by the linear equation is similar to the quadratic polynomial equation in this study. In summary, for sitting activity, a slight difference from the MET could cause a significant difference in PMV, which leads to the PMV that may be above, below, or close to the TSV. For 2 km/h walking activity, PMV is close to TSV. On the contrary, for 4 km/h walking activity, PMV is always higher than TSV, although PMV is calculated by five kinds of MET values. In addition, for low-intensity activities, PMVS1 is closer to TSV than others because the linear equation in this study predicts the MET more accurately.
Some interesting results are obtained by comparing the values of PMV at various activity intensities using the same source of MET. The distributions of PMVS1 and PMVS3 at various activity intensities are close to the distribution of TSV. The distribution of PMVS2 and PMVHR at various activity intensities is more compact than the distribution of TSV. However, the distributions of PMVISO are broader than that of TSV. The reason is that regardless of the method used to calculate MET, there are still some errors. For instance, MET at low activity is overestimated by using HR to estimate MET. Despite the strict control of the experimental procedure, HR at low activity intensities could still be influenced by some psychological factors, resulting in an increase in HR.
Since HR is actually a parameter of heat strain; therefore, the linear relationship between HR and TSV is fitted in this study, as shown in Figure 14. The results show that HR is positively correlated with TSV under the same activity, but HR tends to be lowest in cool environments. The trend of TSV is basically the same under different activities.

3.6. Limitation and Future Works

The subjects in this study are healthy male college students, like in the other research studies about metabolic rate and thermal comfort. According to the results of some previous studies, the MET and TSV of females are different from those of males [27,28]. Therefore, a sufficient number of female subjects should be recruited in the future. The relationship between walking speed and MET, as well as the relationship between HR and MET, should be investigated for female subjects. The physiologic parameters may vary among subjects of varying ages [15]. This calls for future studies to maximize sample size and set up experiments with varying age groups. In addition, in order to change the activity intensity of the subjects strictly, the treadmill is used to control the walking speed. Some studies compared the TSV of free walking and treadmill walking, finding slight differences between them [29]. These two kinds of walking need more detailed investigation in future work. The current research program requires field testing during various seasons. Subjects will be required to walk freely in a large enough field, rather than using a treadmill. A metronome or lead sign will be used to control the walking speed of the subjects during the experiments. Although this would not be as accurate as the walking speed determined by the treadmill, it would naturally imitate daily activities. Interesting conclusions may be obtained by comparing the differences between the two methods. Moreover, the influence of psychological factors on physiological parameters still cannot be circumvented in currently available studies, and the influence of psychological factors should be further explored.

4. Conclusions

In this study, the MET and HR are measured and compared in various environments. The predictive equations for MET based on walking speed and HR are developed, respectively. In addition, their applications in thermal comfort are investigated. The main conclusions are as follows:
(1)
The environments have little impact on MET, except the MET of 6 km/h walking in the hot environment, which is about 10 W/m2 higher than that in the cold and warm environments (p = 0.006 and p < 0.01). On the contrary, the HR of all activities in the cool environment is significantly lower at 3–7 bpm than that in the other environments (p < 0.05).
(2)
The linear, exponential, and quadratic polynomial relationships between walking speed and MET are fitted. Compared to most research, there are higher intercepts and lower slopes of linear predictive equations in this study. That means that the values of MET at low activity are higher than others, and the values of MET at high activity are lower in this study. In addition, the linear relationship can better represent the relevance between MET and walking speed than the exponential and quadratic polynomial relationships.
(3)
The linear relationships between HR and MET at the cool and the other environments are fitted, respectively: MET = 3.67 × HR − 195.56 and MET = 3.80 × HR − 218.90. The slope and intercept of the latter are higher than the former, although the R2 of them is equivalent (0.77 and 0.76). It indicates that the RM in the cool environment is lower than the others.
(4)
The TSV and PMV from various sources of MET at sitting and 2 km/h and 4 km/h walking are collected and compared. The TSV always rises following the increase in activity intensity, and the environment becomes warm. For the sitting activity, a slight difference from the MET could cause a significant difference in PMV, which leads to a PMV that may be above, below, or close to the TSV. For the 2 km/h walking activity, five kinds of PMV are close to TSV. On the contrary, for the 4 km/h walking activity, the PMV is always higher than the TSV.

Author Contributions

Conceptualization, R.J., X.L., H.Z., T.Y., and W.Z.; Project Administration, H.Z.; Supervision, T.Y.; Writing—Review and Editing, R.J., X.L., and W.Z. All authors have read and agreed to the published version of the manuscript.

Funding

This work is supported by the Science and Technology Research and Development Program of China State Railway Group Co., Ltd. (No. L2021G011) and the National Engineering Research Center for Digital Construction and Evaluation of Urban Rail Transit.

Institutional Review Board Statement

The study was conducted in accordance with the Declaration of Helsinki, and approved by the Ethics Committee of Tianjin University (protocol code: TJUE-2024-338 and date of approval: 31 March 2023).

Informed Consent Statement

Informed consent was obtained from all subjects involved in this study.

Data Availability Statement

The data presented in this study are available on request from the corresponding author.

Conflicts of Interest

The authors declare that this study received funding from Science and Technology Research and Development Program of China State Railway Group Co., Ltd. The funder was not involved in the study design, collection, analysis, interpretation of data, the writing of this article or the decision to submit it for publication.

References

  1. ANSI/ASHRAE Standard 55-2020; Thermal Environmental Conditions for Human Occupancy. American Society of Heating, Refrigerating and AirConditioning Engineers: Atlanta, GA, USA, 2020.
  2. Fanger, P.O. Assessment of man’s thermal comfort in practice. Br. J. Ind. Med. 1973, 30, 313–324. [Google Scholar] [CrossRef] [PubMed]
  3. ISO 7730; Ergonomics of the Thermal Environment—Analytical Determination and Interpretation of Thermal Comfort Using Calculation of the PMV and PPD Indices and Local Thermal Comfort Criteria. International Organization for Standardization: Geneva, Switzerland, 2010.
  4. d’Ambrosio Alfano, F.R.; Ianniello, E.; Palella, B.I. PMV-PPD and acceptability in naturally ventilated schools. Build. Environ. 2013, 67, 129–137. [Google Scholar] [CrossRef]
  5. Manu, S.; Shukla, Y.; Rawal, R.; Thomas, L.E.; de Dear, R. Field studies of thermal comfort across multiple climate zones for the subcontinent: India Model for Adaptive Comfort (IMAC). Build. Environ. 2016, 98, 55–70. [Google Scholar] [CrossRef]
  6. Ning, H.; Wang, Z.; Zhang, X.; Ji, Y. Adaptive thermal comfort in university dormitories in the severe cold area of China. Build. Environ. 2016, 99, 161–169. [Google Scholar] [CrossRef]
  7. ISO 8996; Ergonomics of the Thermal Environment—Determination of Metabolic Rate. International Organization for Standardization: Geneva, Switzerland, 2004.
  8. ASHRAE. ASHRAE Handbook Fundamentals; American Society of Heating, Refrigerating and AirConditioning Engineers: Atlanta, GA, USA, 2021. [Google Scholar]
  9. Liu, J.; Foged, I.W.; Moeslund, T.B. Automatic estimation of clothing insulation rate and metabolic rate for dynamic thermal comfort assessment. Pattern Anal. Appl. 2022, 25, 619–634. [Google Scholar] [CrossRef]
  10. Wang, K.; Wang, Y.; Xue, S. Study on the Thermal Comfort of People with Different Activity Intensities in the Urban Park During Winter in Cold Regions of China. Build. Sci. 2023, 39, 97–103. [Google Scholar]
  11. Lin, Y.; Jin, H.; Jin, Y.; Kang, J. Experimental study on the effects of exercise intensity and thermal environment on thermal responses. Build. Environ. 2023, 232, 110067. [Google Scholar] [CrossRef]
  12. Choi, J.-H.; Loftness, V.; Lee, D.-W. Investigation of the possibility of the use of heart rate as a human factor for thermal sensation models. Build. Environ. 2012, 50, 165–175. [Google Scholar] [CrossRef]
  13. Luo, M.; Wang, Z.; Ke, K.; Cao, B.; Zhai, Y.; Zhou, X. Human metabolic rate and thermal comfort in buildings: The problem and challenge. Build. Environ. 2018, 131, 44–52. [Google Scholar] [CrossRef]
  14. Nomoto, A.; Hisayama, R.; Yoda, S.; Akimoto, M.; Ogata, M.; Tsutsumi, H.; Tanabe, S.-i. Indirect calorimetry of metabolic rate in college-age Japanese subjects during various office activities. Build. Environ. 2021, 199, 107909. [Google Scholar] [CrossRef]
  15. Anand, V.; Sendhil, D.; Rajasekar, E. Estimating the metabolic rate and associated physiological response for Indian subjects through climate chamber experiments. Build. Environ. 2022, 207, 108466. [Google Scholar] [CrossRef]
  16. Zhai, Y.; Elsworth, C.; Arens, E.; Zhang, H.; Zhang, Y.; Zhao, L. Using air movement for comfort during moderate exercise. Build. Environ. 2015, 94, 344–352. [Google Scholar] [CrossRef]
  17. Zhai, Y.; Zhao, S.; Gao, Y.; Song, W.; Yang, L.; Zhang, H.; Arens, E. Preferred temperatures with and without air movement during moderate exercise. Energy Build. 2020, 207, 109565. [Google Scholar] [CrossRef]
  18. Jia, X.; Wang, J.; Zhu, Y.; Ji, W.; Cao, B. Climate chamber study on thermal comfort of walking passengers at different moving speeds. Build. Environ. 2022, 224, 109540. [Google Scholar] [CrossRef]
  19. Liu, X.; Liu, S.; Zhang, H.; Ye, T.; Na, Y.; Zheng, W. An investigation of college students on metabolic rate considering activity intensity, ambient temperature and clothing insulation. Build. Environ. 2023, 245, 110865. [Google Scholar] [CrossRef]
  20. Zhai, Y.; Li, M.; Gao, S.; Yang, L.; Zhang, H.; Arens, E.; Gao, Y. Indirect calorimetry on the metabolic rate of sitting, standing and walking office activities. Build. Environ. 2018, 145, 77–84. [Google Scholar] [CrossRef]
  21. Bois, D.; Bois, E. A height-weight formula to estimate the surface area of man. Proc. Soc. Exp. Biol. Med. 1916, 13, 77–78. [Google Scholar] [CrossRef]
  22. Nishi, Y. Measurement of Thermal Balance of Man. In Studies in Environmental Science; Cena, K., Clark, J.A., Eds.; Elsevier: Amsterdam, The Netherlands, 1981; pp. 29–39. [Google Scholar]
  23. Liu, W.; Deng, Q.; Ma, W.; Hao, H.; Zhao, J. Feedback from human adaptive behavior to neutral temperature in naturally ventilated buildings: Physical and psychological paths. Build. Environ. 2013, 67, 240–249. [Google Scholar] [CrossRef]
  24. Buskirk, E.R. Problems related to the caloric cost of living. Bull. N. Y. Acad. Med. 1960, 36, 365–388. [Google Scholar] [PubMed]
  25. Liu, G.; Qi, F.; Hu, S.; Li, A.; Wang, H.; Wang, M.; Tong, L. Experiment and Thermal Sensation Estimating Model at Different Active Levels Under Hypobaric Condition Based on Principal Component Analysis. In Proceedings of the 8th International Symposium on Heating, Ventilation and Air Conditioning, Volume 1: Indoor and Outdoor Environment, Xi’an, China, 19–21 October 2013; Springer: Berlin/Heidelberg, Germany, 2014; pp. 289–296. [Google Scholar] [CrossRef]
  26. Cui, W.; Wang, H.; Wu, T.; Ouyang, Q.; Hu, S.; Zhu, Y. The influence of a low air pressure environment on human metabolic rate during short-term (<2 h) exposures. Indoor Air 2017, 27, 282–290. [Google Scholar] [CrossRef]
  27. Kingma, B.; Lichtenbelt, W.v.M. Energy consumption in buildings and female thermal demand. Nat. Clim. Change 2015, 5, 1054–1056. [Google Scholar] [CrossRef]
  28. Lazzer, S.; Bedogni, G.; Lafortuna, C.L.; Marazzi, N.; Busti, C.; Galli, R.; De Col, A.; Agosti, F.; Sartorio, A. Relationship Between Basal Metabolic Rate, Gender, Age, and Body Composition in 8780 White Obese Subjects. Obesity 2010, 18, 71–78. [Google Scholar] [CrossRef]
  29. Hall, C.; Figueroa, A.; Fernhall, B.; Kanaley, J.A. Energy expenditure of walking and running: Comparison with prediction equations. Med. Sci. Sports Exerc. 2004, 36, 2128–2134. [Google Scholar] [CrossRef]
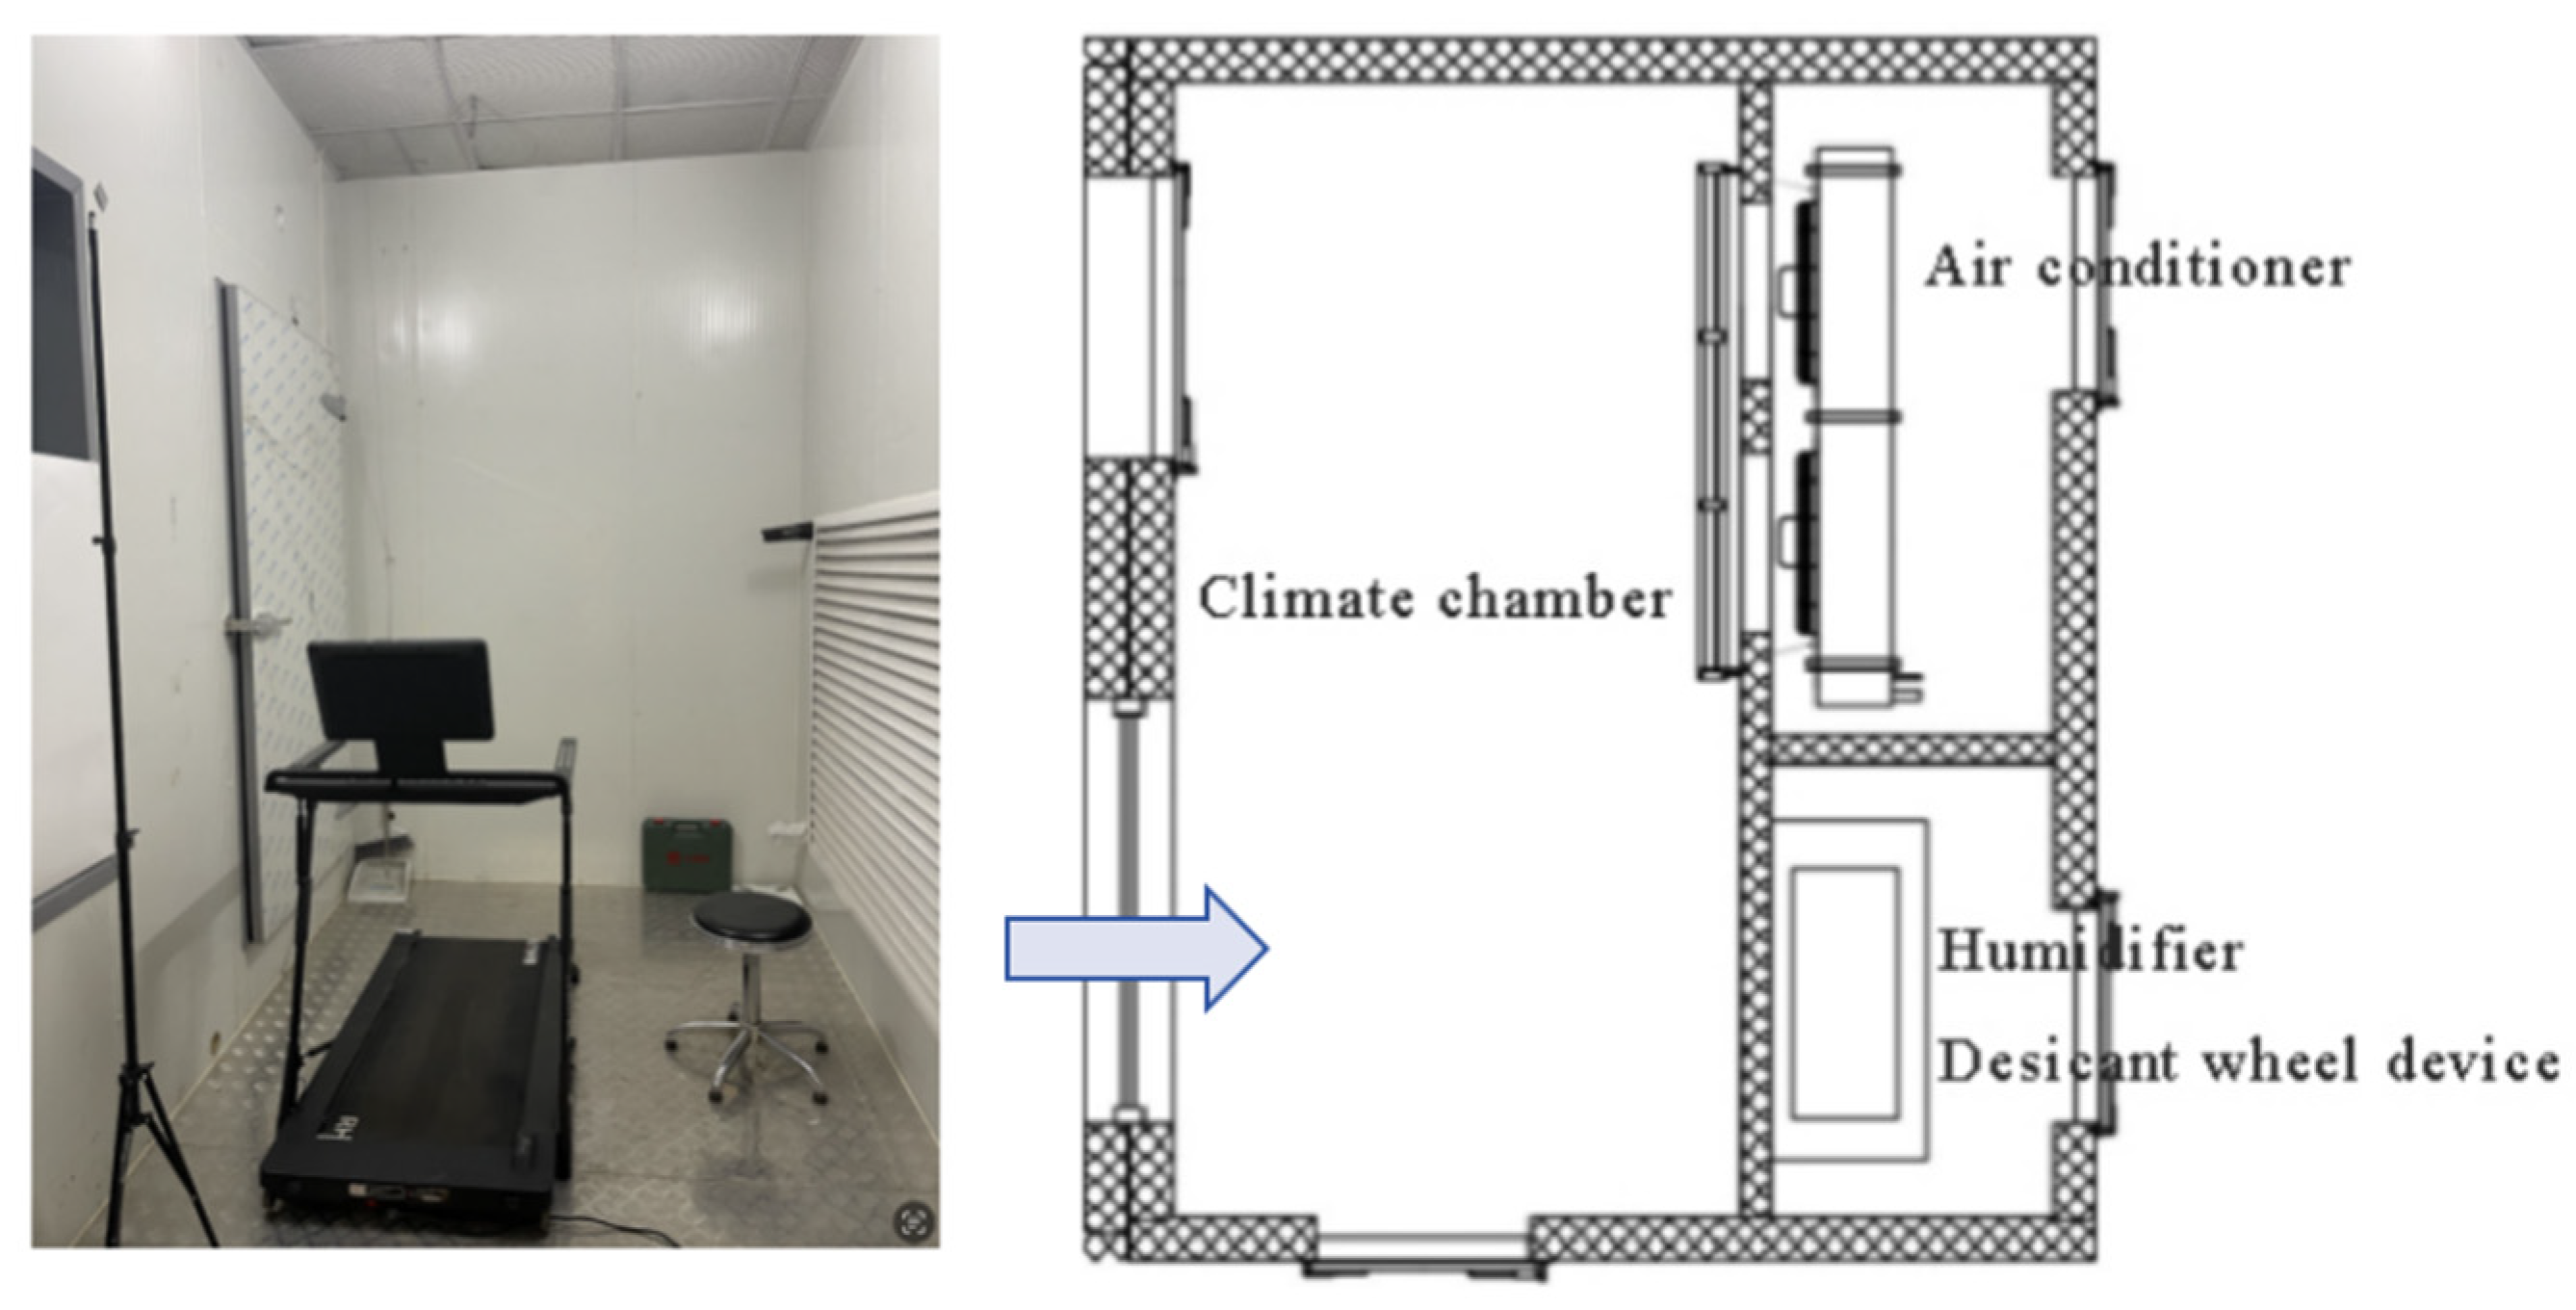
Figure 1. Climate chamber.
Applsci 14 05363 g001
Figure 2. (a) Testo 416, (b) UX100-011A.
Applsci 14 05363 g002
Figure 3. (a) MetaMax 3B, (b) the specialized mask (c) Polar H10, (d) DS1992L.
Applsci 14 05363 g003
Figure 4. The thermal sensation vote.
Applsci 14 05363 g004
Figure 5. Experimental process.
Applsci 14 05363 g005
Figure 6. The variation of (a) MET, (b) HR, (c) mTsk over time.
Applsci 14 05363 g006
Figure 7. Variation of MET in various environments.
Applsci 14 05363 g007
Figure 8. Variation of HR in various environments.
Applsci 14 05363 g008
Figure 9. (a) The linear relationships between walking speed and MET, (b) the comparisons of this study and other studies.
Applsci 14 05363 g009
Figure 10. (a) The quadratic polynomial relationships, (b) the exponential relationships.
Applsci 14 05363 g010
Figure 11. (a) The predictive equations for MET based on HR in the cold, warm, and hot environments, (b) the predictive equation for MET based on HR in the cool environment.
Applsci 14 05363 g011
Figure 12. Comparison of this study and others.
Applsci 14 05363 g012
Figure 13. The comparisons of TSV and PMV in the (a) cold, (b) cool, (c) warm, and (d) hot environments.
Applsci 14 05363 g013
Figure 14. Linear relationship between HR and TSV.
Applsci 14 05363 g014
Table 1. Description of internal sensors.
SensorsTypeRangeAccuracy
FlowDigital turbine≤20.1 L/s±2%
O2Electrochemistry0–100%<0.1 vol %
CO2Nondispersive infrared0–13%<0.1 vol %
Table 2. Clothing description.
Conditions30241812
ClothingMen’s briefsMen’s briefsMen’s briefsMen’s briefs
DetailsT-shirtLong-sleeved shirtLong-sleeved shirtLong-sleeved shirt
Walking shortsStraight trousersLong johnsLong johns
Short socksShort socksJacketDown jacket
SneakersSneakersStraight trousersStraight trousers
Short socksShort socks
SneakersSneakers
Table 3. Environmental parameters.
ParametersColdCoolWarmHot
Temperature (°C)12.1 ± 0.317.9 ± 0.424.0 ± 0.229.8 ± 0.3
Humidity (%)29.1 ± 3.730.2 ± 3.529.9 ± 2.928.2 ± 3.3
Air velocity (m/s)0.070.090.100.09
Atmospheric pressure (kPa)100.48100.48100.48100.48
Table 4. The specific details of the linear relationships.
ResearchLinear RelationshipsR2Data Sources
This studyMET = 28.38 × Speed + 62.250.99China
Anand’s studyMET = 33.30 × Speed + 52.400.97India
Zhai’s studyMET = 34.44 × Speed + 54.330.95China
ISO 8996MET = 28.65 × Speed + 53.780.99Europe
ASHRAE HandbookMET = 24.65 × Speed + 50.600.94America
Table 5. The specific forms of the linear relationships.
ResearchLinear RelationshipsR2Data Sources
This study in the cool environmentMET = 3.67 × HR − 195.560.77China
This study in other environmentsMET = 3.80 × HR − 218.900.76China
Zhai’s studyMET = 3.27 × HR − 161.300.68China
ISO 8996MET = 3.80 × HR − 210.00Europe
Disclaimer/Publisher’s Note: The statements, opinions and data contained in all publications are solely those of the individual author(s) and contributor(s) and not of MDPI and/or the editor(s). MDPI and/or the editor(s) disclaim responsibility for any injury to people or property resulting from any ideas, methods, instructions or products referred to in the content.