Article

P-EcStat: A Versatile Design of Photoelectrochemical and Electrochemical Sensing System with Smartphone Interface via Bluetooth Low Energy

by
Anh Hao Huynh Vo
1,2,
Viet Cuong Tran
3,*,
Trung Tin Tran
1,2,4,
Thien Trang Nguyen
1,2,
Anh Duong Nguyen
1,2,
My Hoa Huynh Tran
3 and
Trung Nghia Tran
1,2,*
1
Laboratory of Laser Technology, Faculty of Applied Science, Ho Chi Minh City University of Technology (HCMUT), 268 Ly Thuong Kiet Street, District 10, Ho Chi Minh City 72409, Vietnam
2
Vietnam National University Ho Chi Minh City (VNUHCM), Linh Trung Ward, Thu Duc, Ho Chi Minh City 71308, Vietnam
3
VKTECH Research Center, NTT Hi-Tech Institute, Nguyen Tat Thanh University, 298-300A Nguyen Tat Thanh Street, Ward 13, District 4, Ho Chi Minh City 72820, Vietnam
4
Faculty of Physics and Physics Engineering, University of Science, VNUHCM, 227 Nguyen Van Cu Street, District 5, Ho Chi Minh City 72711, Vietnam
*
Authors to whom correspondence should be addressed.
Appl. Sci. 2024, 14(13), 5420; https://doi.org/10.3390/app14135420
Submission received: 6 June 2024 / Revised: 19 June 2024 / Accepted: 20 June 2024 / Published: 22 June 2024

Abstract

:
Electrochemical and photoelectrochemical sensors are a rapidly developing field in analytical chemistry. However, commercial systems often lack versatility and affordability, hindering wider adoption. Additionally, the absence of integrated excitation light sources limits their application in photoelectrochemical sensing. Here, we present a highly precise, versatile, affordable measurement system for both electrochemical and photoelectrochemical sensing applications. The system incorporates a three-electrode potentiostat with a synchronized excitation light source. This design enables the system to perform conventional electrochemical measurements like cyclic voltammetry, chronoamperometry, and photoelectrochemical amperometric measurements with controlled light excitation. The developed measurement system operates within a voltage range suitable for a measurable current range of 1 nA to 18 mA, with a high precision of 99%. The excitation source is a monochromatic LED system offering seven distinct wavelengths with digitally controlled intensity via a digital-to-analog converter. Furthermore, an Android-based user interface allows wireless system control via Bluetooth Low Energy. The report also details the construction of a photoelectrochemical experiment using copper (II) oxide nanorods synthesized by the hydrothermal process as the photoactive material employed to test the experiment on a potassium ferricyanide/potassium ferrocyanide solution. This user-friendly system allows broader exploration of electrochemical and photoelectrochemical sensing applications.

1. Introduction

Sensor technology has emerged as a critical foundation for the era of information technology, along with advances in science and technology. A sensor device can convert environmental events into measurable signs that impact various fields of everyday life. Within the realm of sensors, biological and chemical sensors are a small branch but play a necessary role in a wide range of research, leading to the development of various methods such as electrochemical, electronic, optical, and mechanical techniques. However, meeting the increasing demands of reducing product costs, improving sensitivity, and increasing sensor performance is still challenging. To accommodate these requirements, electrochemical (EC) and photoelectrochemical (PEC) sensors have seen particularly noteworthy developments, driven by parallel progress in materials science [1,2].
EC and PEC methods are two widely researched sensing techniques for analytical applications. They share similar characteristics, including the signal conversion mechanism, the basic components in measurement instrumentation, and a wide range of applications. The working principle of EC-based and PEC-based sensors is shown in Figure 1 with the measurement device called a potentiostat in the conventional three-electrode configuration, including the reference electrode (RE), counter electrode (CE), and working electrode (WE). The mechanism of these sensors hinges on the interaction between a target species and the sensor’s catalytic material surface-coated on the WE, facilitating target identification in which both rely on converting chemical signals into electrical signals. Research efforts in these fields are mainly directed towards diversifying sensor materials, utilizing different types and structural forms of nanomaterials with or without labels to enhance identification performance, sensitivity, and specificity in the analysis of interest [1,2,3,4,5,6,7,8,9,10,11]. Consequently, EC and PEC sensors have become powerful tools in analytical chemistry, offering broad applicability in diverse fields such as food safety [5,12,13,14,15,16,17,18], environmental monitoring [18,19,20,21,22,23], and health diagnostics [3,18,24,25,26,27,28,29,30,31,32,33,34].
EC sensors function by using receptors immobilized on the surface of the electrode. When an external potential signal is applied, these receptors facilitate redox reactions with target analytes that are adsorbed or bound to the electrode surface. The EC sensor was first reported more than a century ago when Friedrich Cremer demonstrated the glass electrode for pH sensitivity [35]. EC sensors continue to be actively developed due to their diverse reported signals and the low detection limits in theory [36]. EC-based techniques allow for the obtaining of different signals, including voltage, current, and impedance signals, leading to the emergence of many measurement techniques, such as amperometry, potentiometry, voltammetry, and impedimetry. In addition, the same electrical form of the stimulated signal and the collected signal of the EC sensors leads to easy miniaturization of the measurement systems, making them flexible and reducing the cost. Due to their flexibility, reliability, fast response, and cost-effectiveness, EC sensors are ideal for point-of-care (POC) applications such as the ubiquitous glucose meter [37,38,39,40]. In addition, electrochemical sensors have also been widely used in industrial and civil environments to detect toxic gases [41]. In recent years, strategies for the development of EC sensors have been related to enhancing selectivity and detection limits [42,43,44] alongside the discipline of nanoscience and nanotechnology.
In addition to the advantages of EC-based sensors, they also have limitations. The electrical consistency of the stimulation and collection signals can limit the sensitivity due to background noise from the excitation signal. To address this issue, the PEC-based technique is an option worth considering because of the external excitation source. Emerging from the foundation of EC sensors, PEC sensors boast a more recent origin, yet have witnessed rapid development in the past four decades. PEC sensors leverage conventional electrochemical techniques but incorporate a photoactive material on the electrode surface. The generated electron–hole pairs formed following suitable photon absorption by the photoactive material layer, caused by the electronic change state between the valence band and the conduction band, interact with the target analyte, generating a separate signal of the target analyte’s redox reactions from the light excitation signal. This key distinction significantly reduces background noise, enhancing sensor sensitivity and lowering detection limits. Moreover, this method is relatively easy to use compared to other optical sensing methods, such as luminescence or fluorescence, because of the demand for complex image processing systems. However, despite their great potential for development, sensors based on photoelectrochemical techniques are only largely being developed in the laboratory environment due to insufficient photoconversion efficiency and the photobleaching effect [2]. Therefore, the development of this type of sensor is also associated with the interdisciplinary fields of material science and nanotechnology, which use semiconducting materials to improve the properties of photocatalytic sensing, serving many different applications [45,46,47].
EC and PEC sensors rely heavily on the potentiostat for analytical chemistry applications. This instrument plays a critical role by precisely controlling the applied voltage and capturing the electrical signals generated from redox reactions during analysis. While numerous reports detail laboratory-built potentiostats [48,49,50,51,52], they are typically designed specifically for EC measurements. Conversely, most PEC studies utilize expensive, multifunctional commercial potentiostats with separate, non-integrated excitation light sources. This separation creates experimental setups that can be cumbersome and prone to inconsistencies. Recent advancements in PEC measurement systems are promising, exemplified by the portable lactate detection system developed by José L. Bott-Neto et al. [53]. Similarly, Alexander Scott et al. [54] and Zhenghan Shi et al. [55] have reported PEC systems designed for POC applications. However, these designs often cater to specific purposes and lack the versatility required for broader PEC research despite the similar characteristics of both methods, which can complement each other due to their merits during the development phase of sensor materials. Therefore, alongside the significant advancements in materials science enabling EC and PEC sensors, developing a universal measurement system capable of seamlessly handling both sensor types remains crucial to capture the merits of both sensors.
This work presents a comprehensive design and development of a measurement system for EC and PEC sensing applications. The system incorporates a custom-designed measurement circuit that utilizes integrated monochrome light-emitting diodes (LEDs) as the excitation light source for PEC applications, an Android-based user interface developed for user interaction and data acquisition, and an experimental chamber designed to conduct the measurements. Experiments investigating potential PEC applications were conducted using copper (II) oxide (CuO) material synthesized via the hydrothermal method, serving as the photoactive material.

2. Materials and Methods

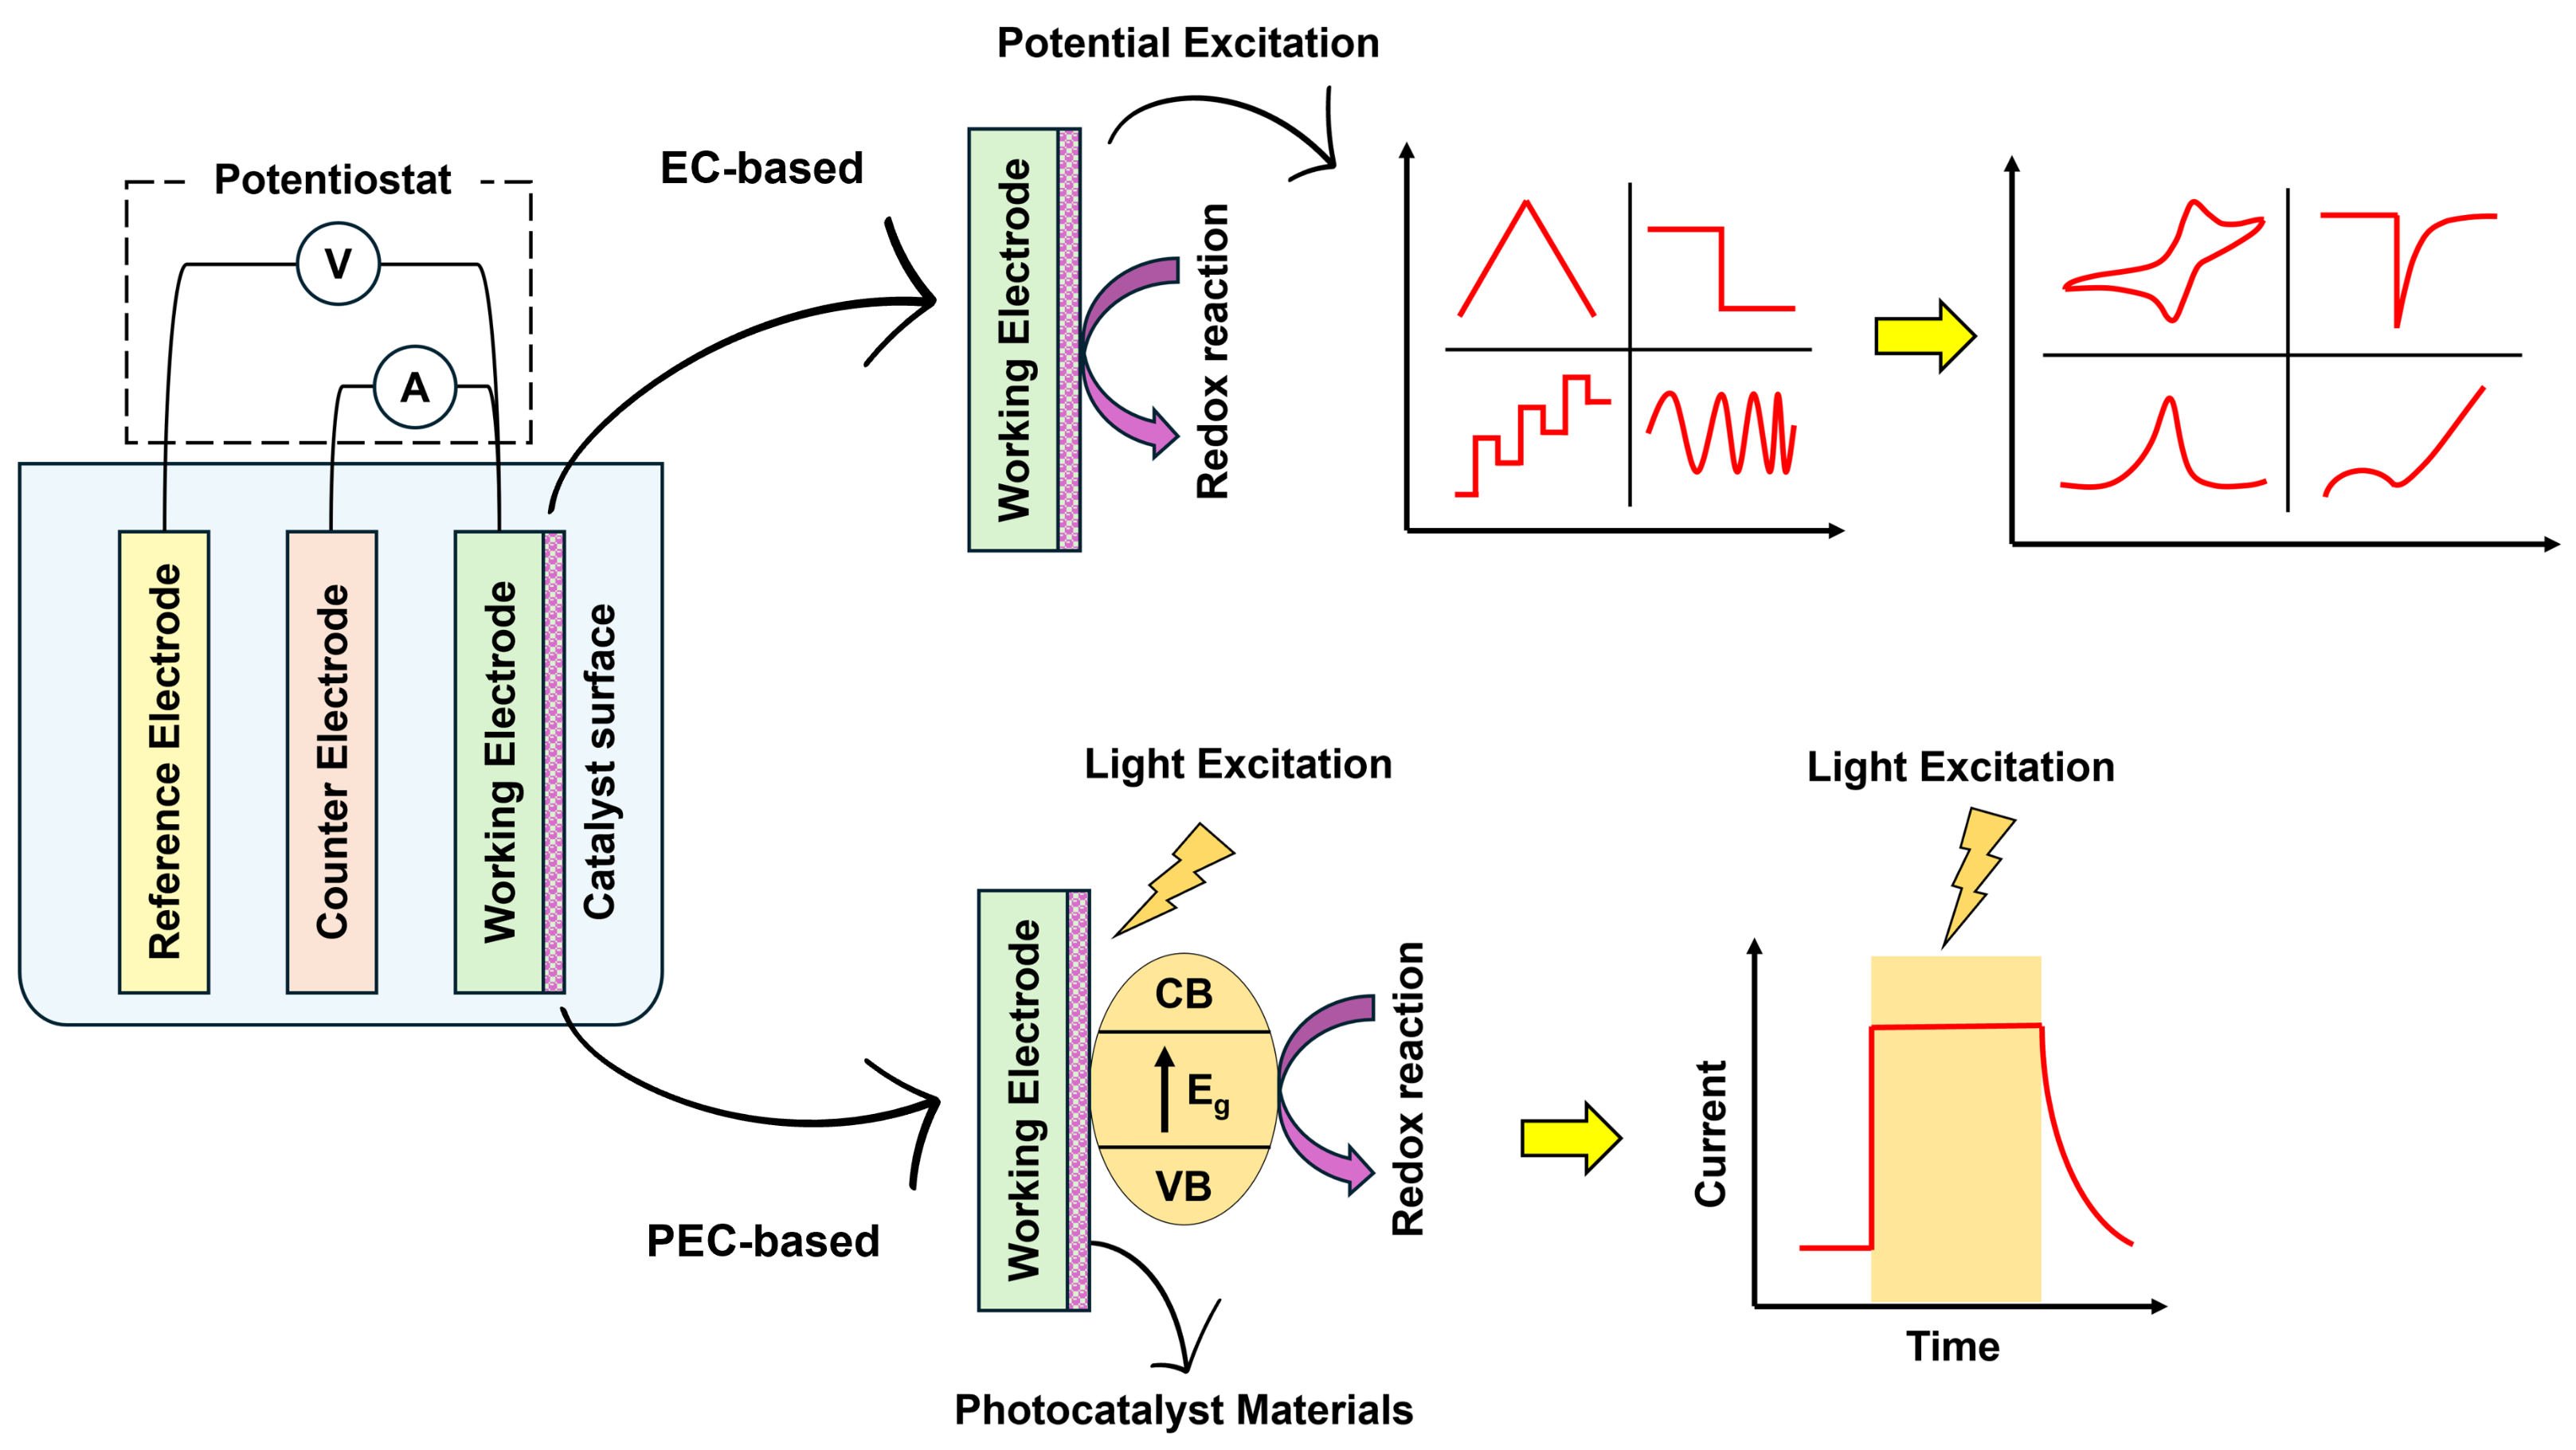
2.1. Electrochemical and Photoelectrochemical Versatile System Design

The fully designed system for EC and PEC sensing applications integrates four key components: a potentiostat circuit to control and measure the EC signal; an integrated LED light system serving as an excitation source for PEC analysis; a dedicated experimental chamber; and an Android-based user interface for control and data acquisition. Figure 2 depicts the conceptual system designed in this work, highlighting these four main components.

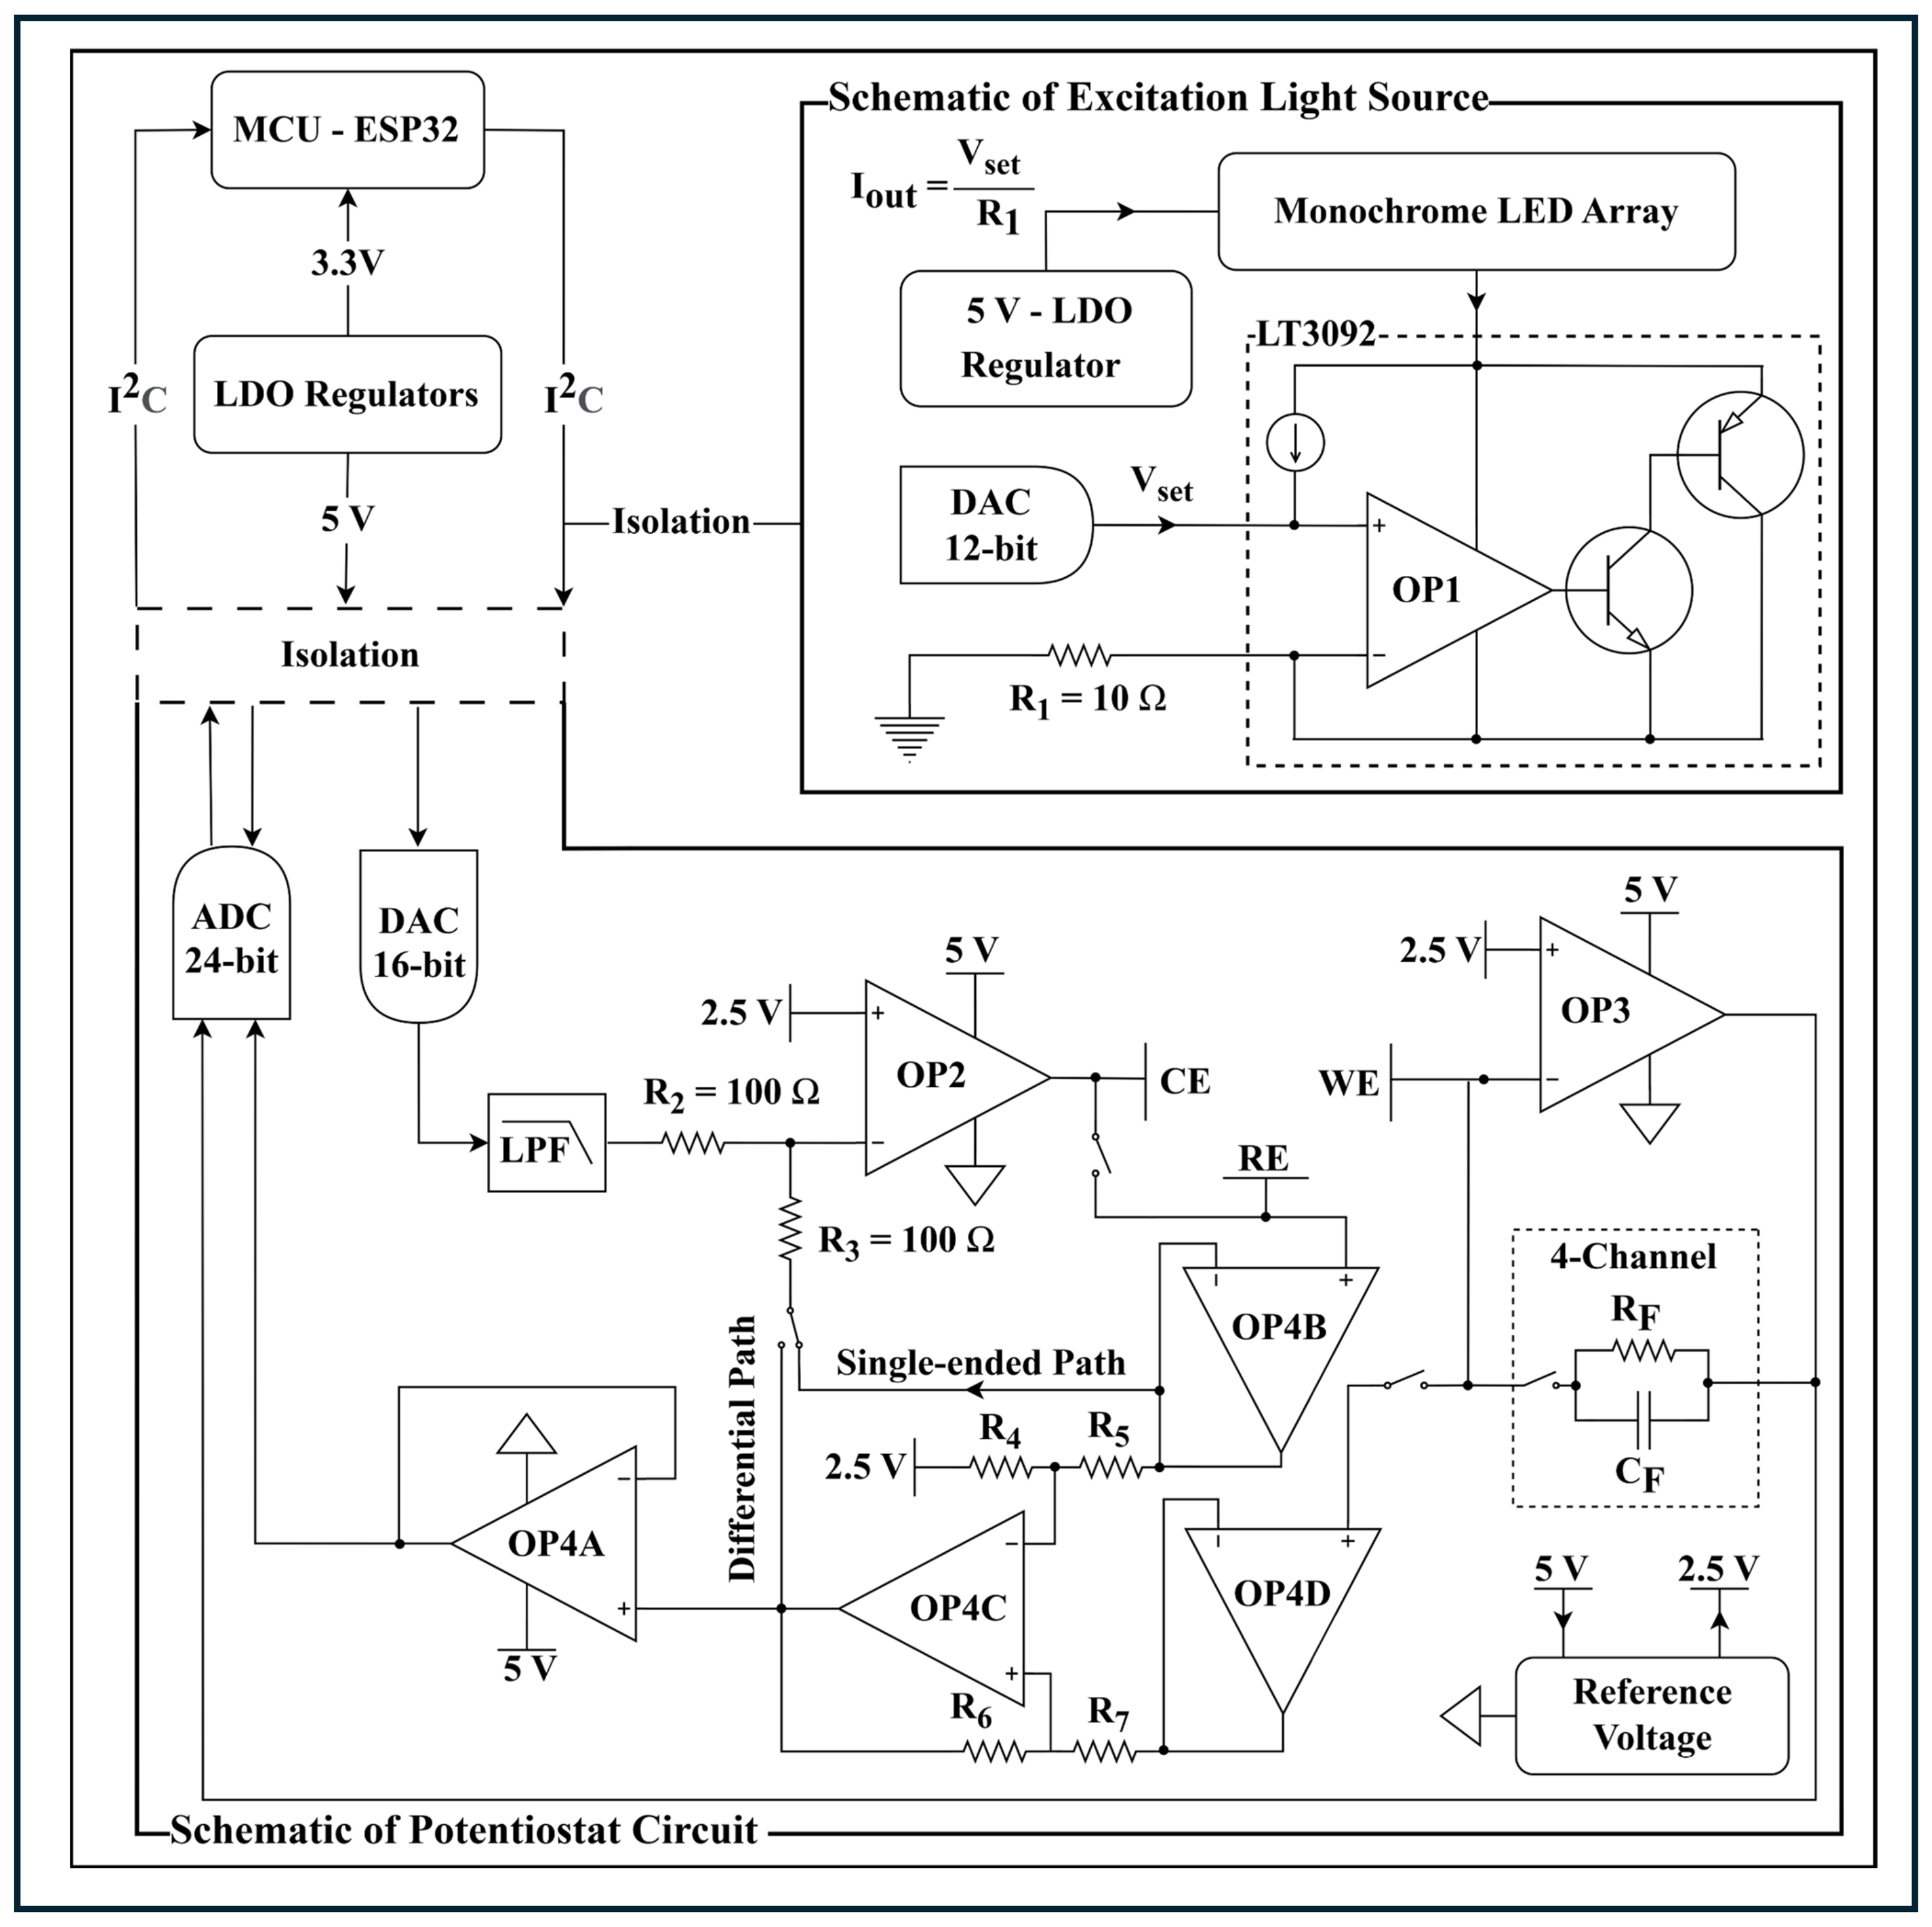
2.1.1. Potentiostat Circuit

The potentiostat is a fundamental EC tool with diverse analytical applications. Its core function is to maintain a constant potential difference between the WE and RE within an EC cell [56]. It simultaneously measures the current flowing through the WE, with the CE adjusting this current to ensure stable cell potential control [56]. Figure 3 illustrates the schematic of our designed potentiostat, based on the DeFord circuit [57]. This design is adaptable to two-electrode configurations by shorting the CE and RE via an analog switch (TMUX1113). To achieve a nominal ±2.5 V working range, we employed a 2.5 V reference (REF3425) as the potentiostat’s virtual reference point while using a separate 5 V low-dropout regulator (LDO regulator) ADP7105-5.0 for other components. The 16-bit digital-to-analog converter (DAC, DAC80501) generates the voltage setpoint for the control amplifier stage, which utilizes one operational amplifier (LMP7721, denoted as OP2) and three from a quad operational amplifier package (OPA4388, OP4B-D). User-selectable single-ended or differential modes are enabled through switched feedback paths from the RE. OP4B and OP4D function as voltage followers, in which only the OP4B operates in single-ended mode. In differential mode, OP4B-D forms a differential amplifier with the positive input of OP4D shorted to the WE and the differential gain of 1 (R4 = R5 = R6 = R7). The output of this feedback signal to the control amplifier (differential amplifier in differential mode or OP4B in single-ended mode) feeds into the positive input of OP4A, configured as an electrometer. This signal is then sent to a 24-bit analog-to-digital converter (ADC, ADS122C04) to measure the actual WE–RE control potential. Leveraging an ADC of 2000 samples per second (sps), the circuit offers a selectable scan rate or sampling interval for data acquisition, depending on the selected measurement. Users can choose from six scan rates (20 mV/s, 50 mV/s, 100 mV/s, 200 mV/s, 500 mV/s, and 1000 mV/s) to analyze signal changes over time or select one of seven sample intervals (40 sps, 90 sps, 180 sps, 350 sps, 660 sps, 1200 sps, and 2000 sps) for capturing data points at specific intervals. To measure the current through the WE, the OP3 (LMP7721) has the role of a trans-impedance amplifier (TIA), converting the current on the WE into a voltage (I/V converter). This converter offers four parallel channels with feedback resistors and capacitors providing sensitivities of 10 mA/V, 100 µA/V, 1 µA/V, and 10 nA/V. The feedback capacitor values ensure a consistent 3386 Hz TIA gain bandwidth across all feedback resistor settings. This converted voltage is then also fed into the ADC for acquisition. For the microcontroller unit (MCU), ESP32 was used to control the potentiostat circuit using the Inter-Integrated Circuit (I2C) communication in which the LDO regulator ADP7105-3.3 is the power supply for this MCU. The MCU ESP32 also supports Bluetooth Low Energy (BLE) for interaction with the Android-based user interface. Additionally, in the designed potentiostat circuit, another 4-channel resistor with the same resistance values as the TIA’s feedback resistors was also used as the internal calibration for adjusting the TIA’s gain value and the DAC output value.

2.1.2. Monochrome LED Excitation Light System

Figure 3 also depicts the designed excitation light source circuit. This circuit controls the output current based on a control signal from a DAC. The two main components used to achieve this purpose are a 12-bit DAC (AD5622) and a 2-terminal programmable current source (LT3092). An array of seven monochrome LEDs (with wavelengths of 385 nm, 405 nm, 470 nm, 525 nm, 630 nm, and 720 nm) is placed before the input power supply of LT3092, which is provided by a 5 V LDO regulator (LM7805). The current output of the LM7805 regulator has a linear relationship with the combined output voltage of the DAC (AD5622) and the resistor R1 (shown in Figure 3), allowing for a current range of 0.5 to 200 mA. Using this principle, the output current is set according to the maximum DC forward current of each monochrome LED. The DAC AD5622 is also controlled by the MCU ESP32 through the I2C protocol, in which the I2C isolator (ISO164) is used to prevent noise from affecting the potentiostat circuit.

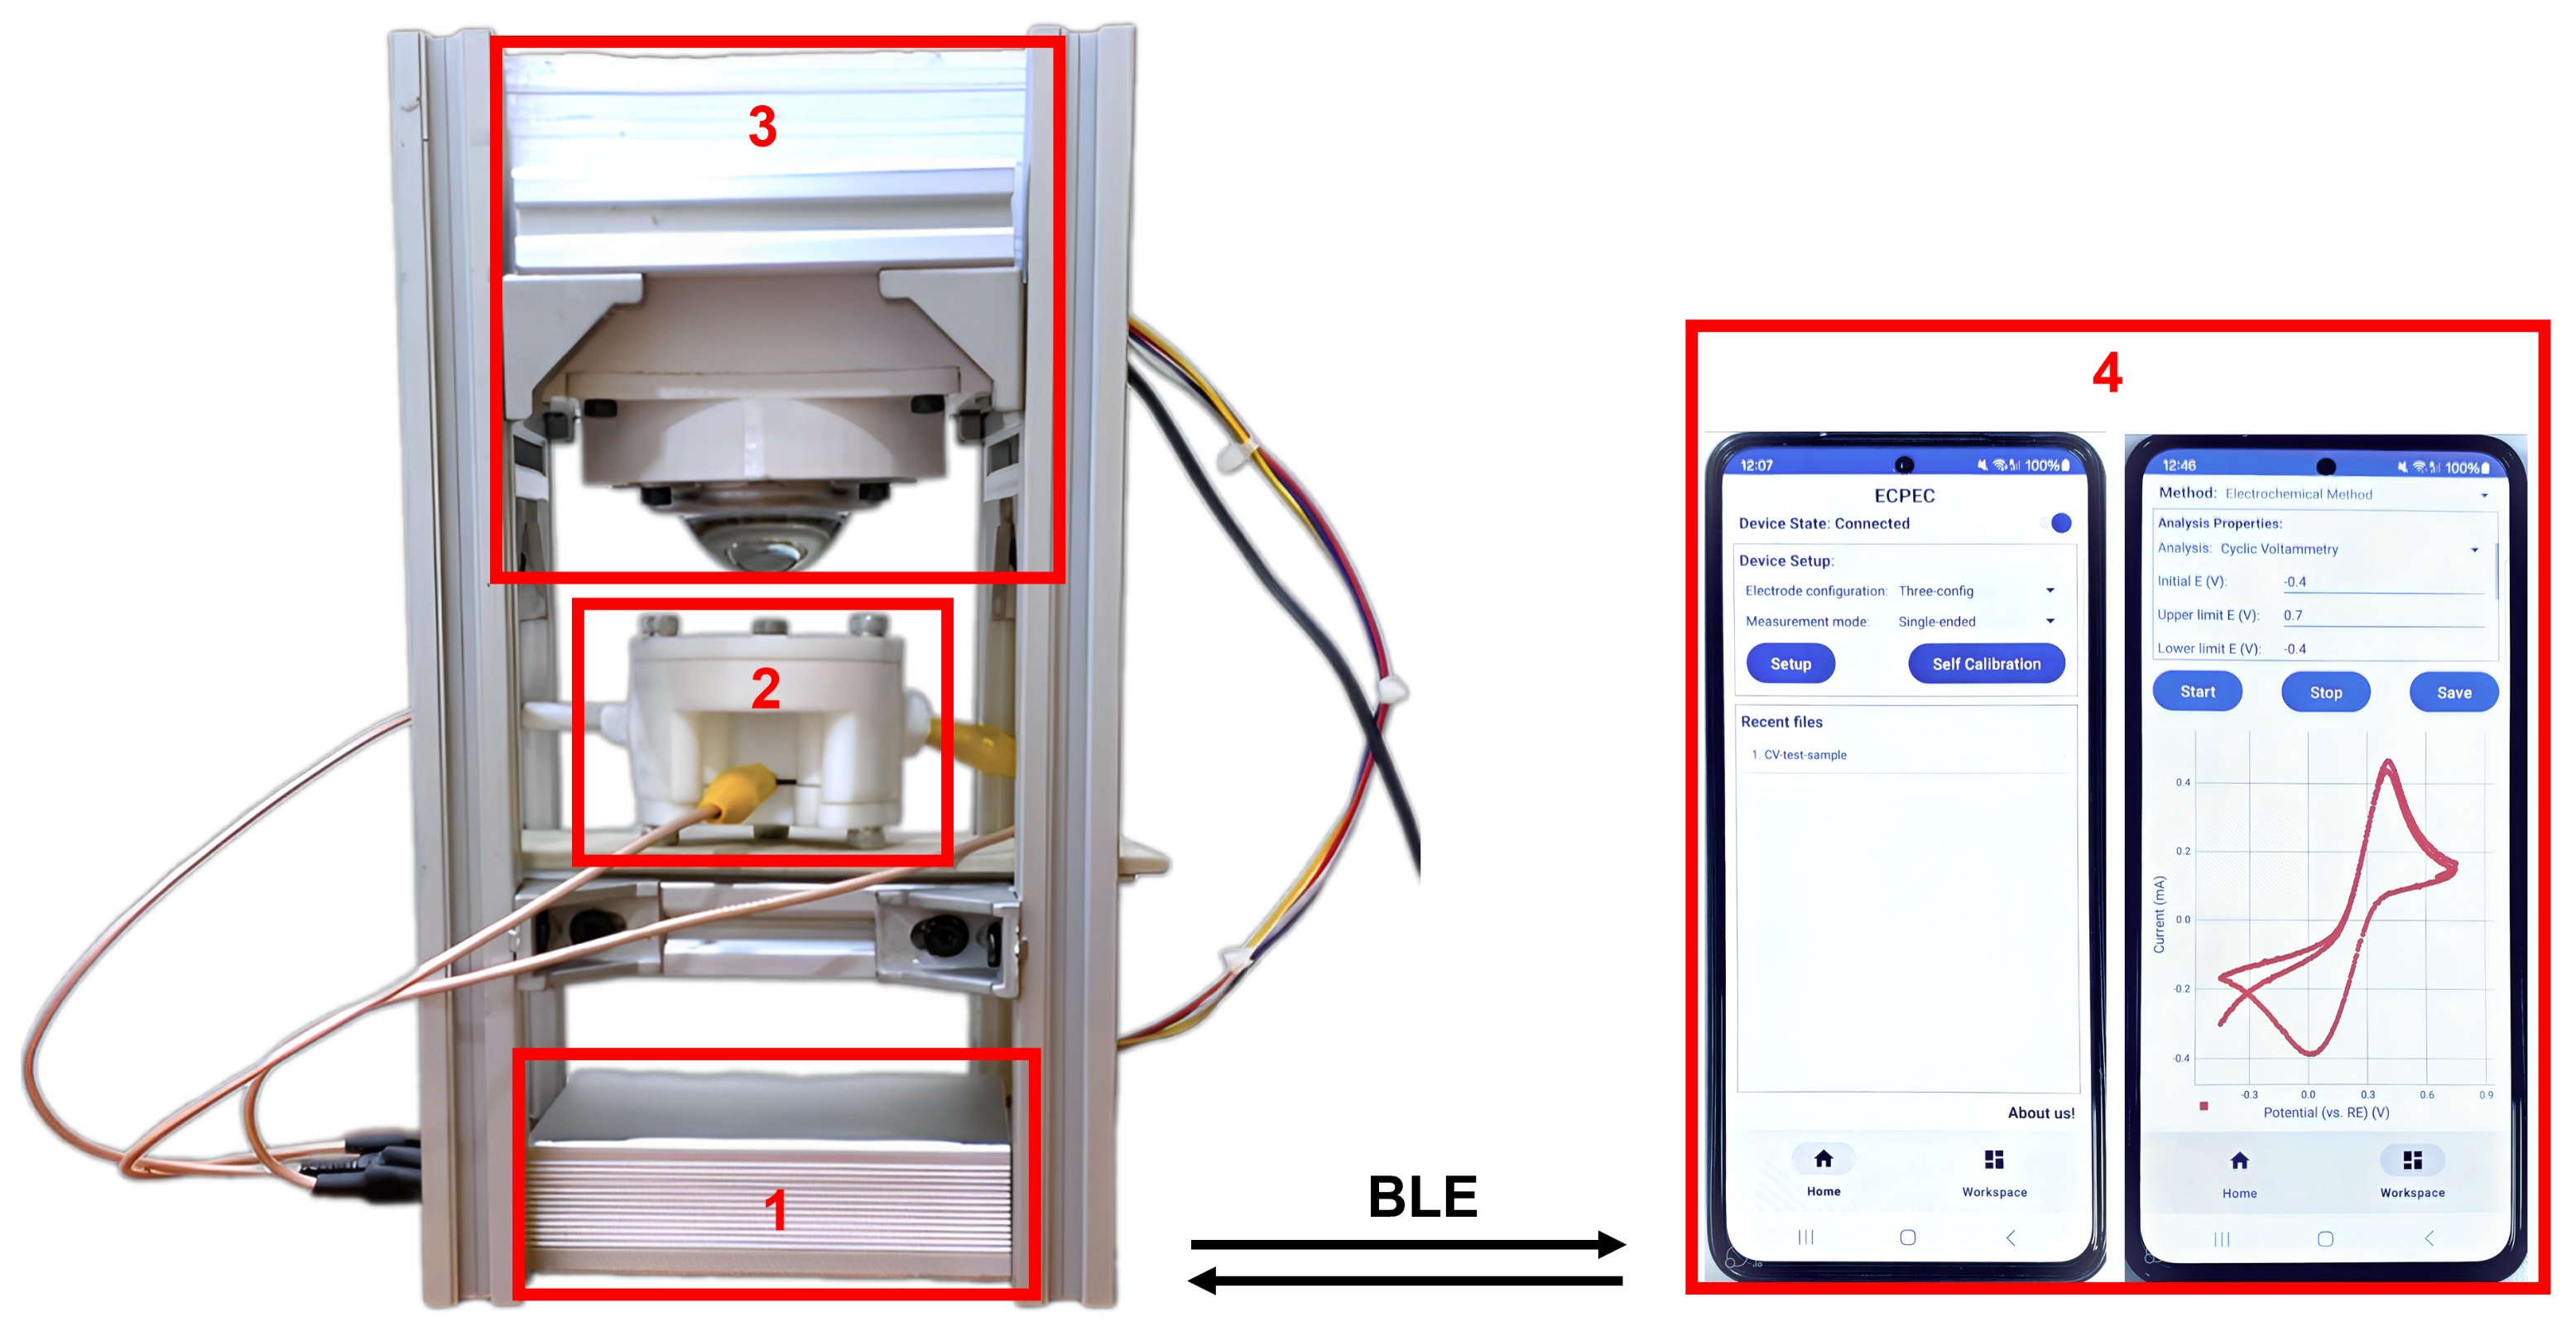
2.1.3. Experimental Chamber Design

Figure 4 shows the design of the EC-PEC experimental chamber. Due to its high mechanical and chemical durability, PTFE plastic was chosen for the chamber’s fabrication, including the body, top, bottom, and two electrode sealing screws. The design is compatible with REs and CEs with a cover diameter of 6 mm. A sapphire window is placed on top of the chamber body, allowing excitation light to excite the material layers of interest in PEC sensing applications. This window also protects the sample from unwanted factors, as some PEC analyses can take several minutes. Moreover, the main purpose of the designed chamber is to allow researchers to investigate the properties of materials coated on electrodes, such as indium tin oxide (ITO) as a WE, which serves for sensing applications. In particular, the measuring chamber requires a sample volume of below 2 mL, significantly reducing the sample and solvent needed for experiments.

2.1.4. User Interface Based on Android Bluetooth Low Energy

As mentioned, this project uses the ESP32 MCU to communicate with an Android device via the BLE protocol. The user interface, named ECPEC, is built using the Kotlin programming language for Android and allows users to connect directly to the hardware using its universally unique identifier (UUID). This is a user-friendly platform where all functionalities are displayed on the screen through a bottom navigation bar with two main sections: home navigation and workspace navigation. Home navigation provides functionalities for electrode configuration, measurement mode selection, and automatic device calibration, allowing the user to define parameters based on specific needs. The workspace fragment focuses on initiating and managing measurements. Users can choose the desired measurement mode and its associated parameters. The measured results are displayed in real time on the workspace screen as a scatter plot, allowing for visualization of the data points collected during measurements. Following completion of the measurement, users can save the data as a comma-separated value (CSV) file. These saved data are stored directly in the Android device’s memory and can be accessed from the home navigation screen through external CSV reader applications on the Android device.

2.2. Evaluation Methods

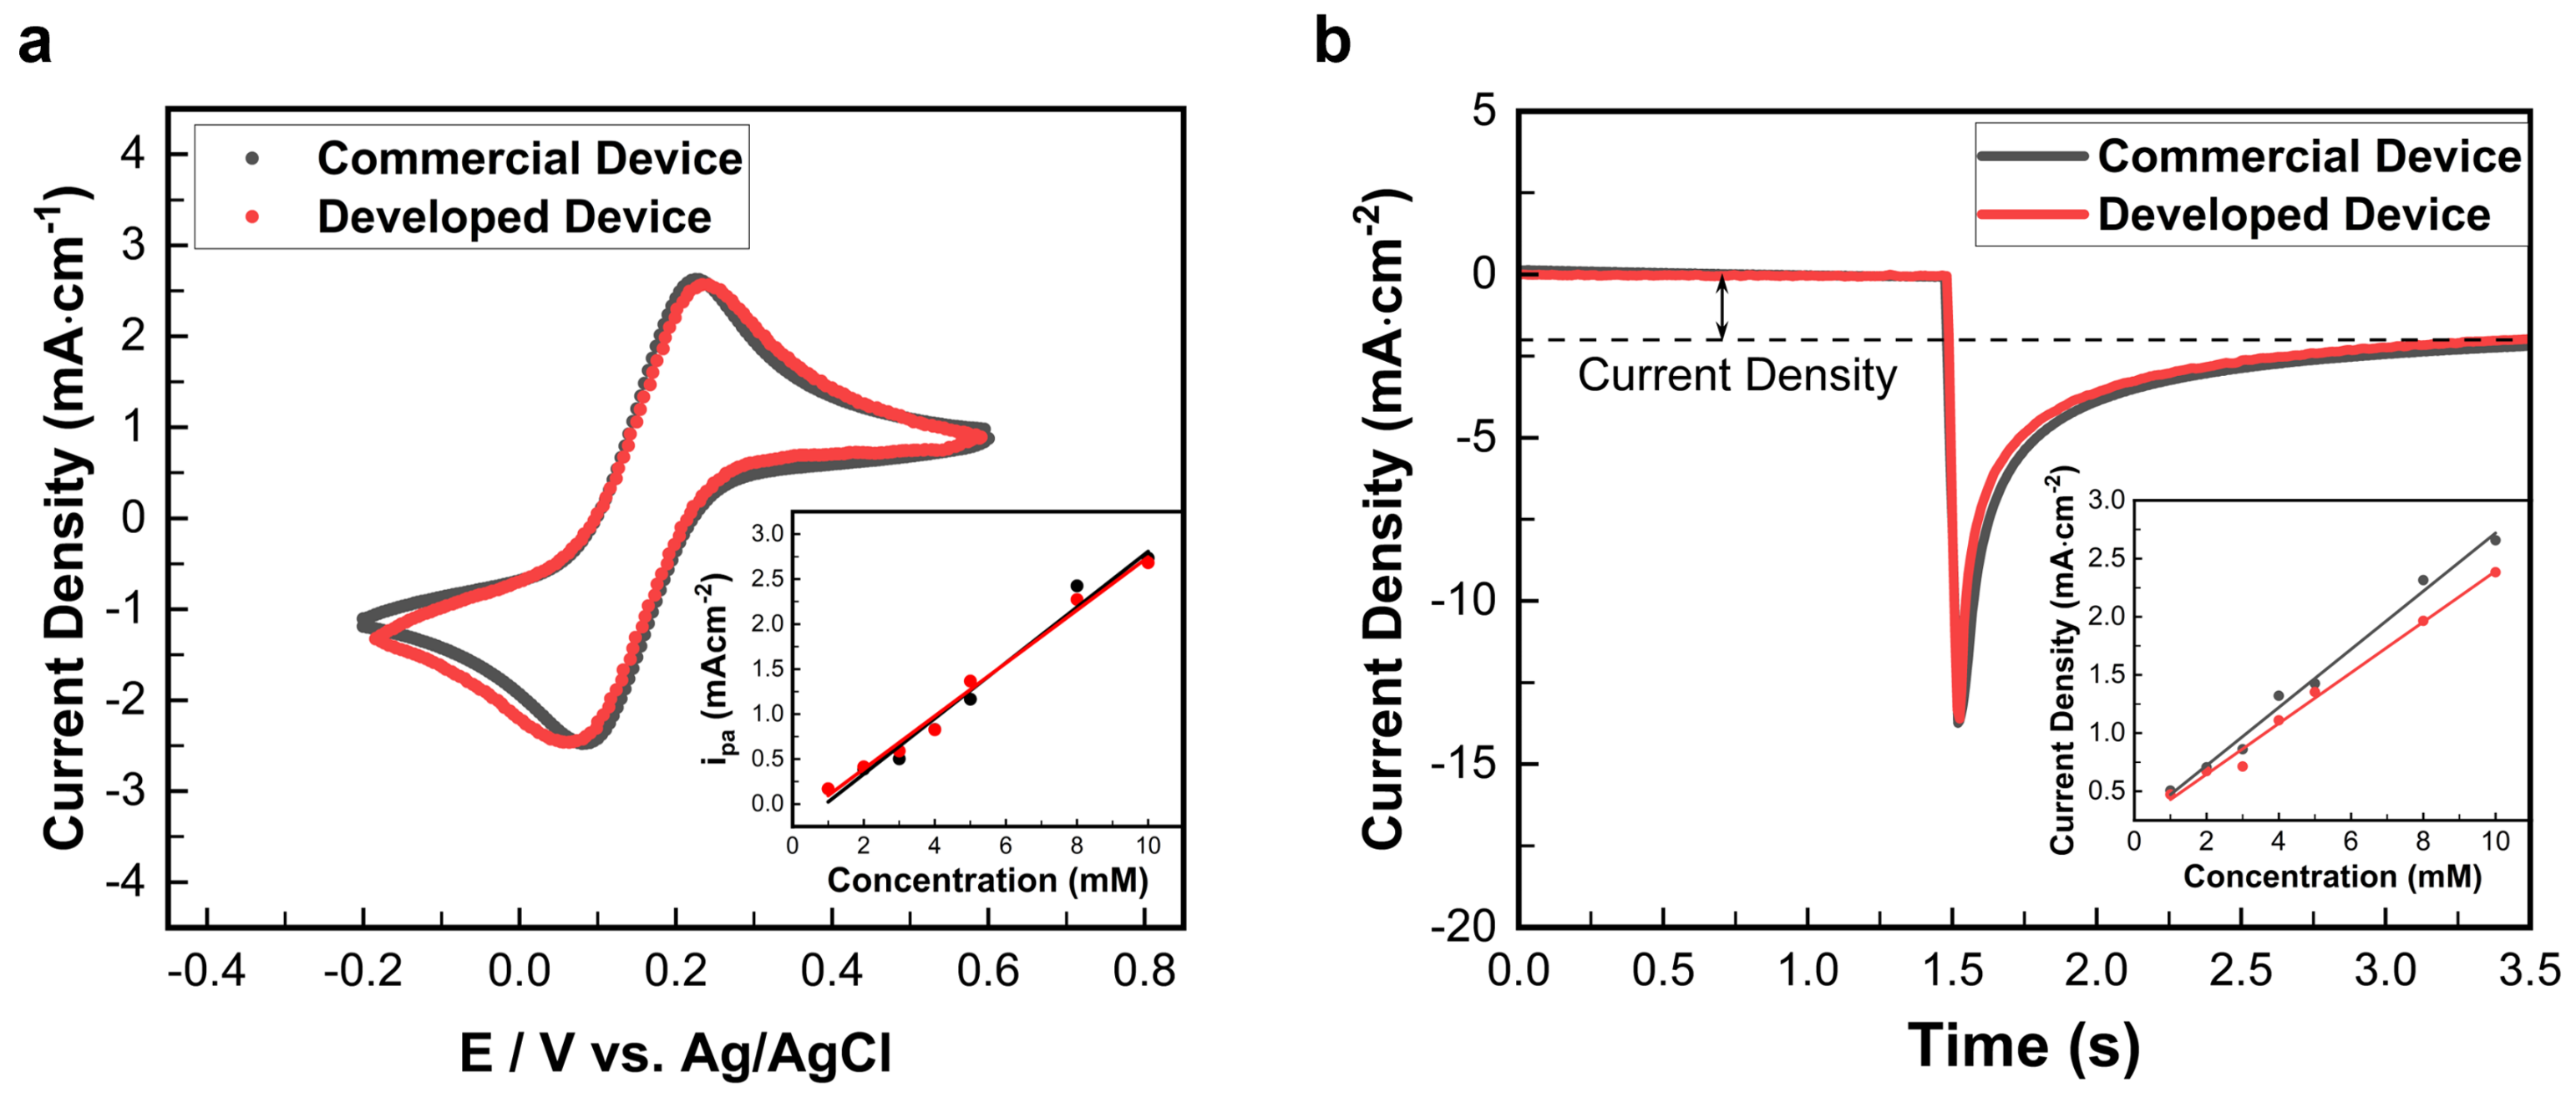
2.2.1. Calibration and Accuracy Evaluation

For the calibration of the potentiostat, one of the four internal calibration resistors is selected, which corresponds to the value of the selected TIA feedback resistor (100 Ω , 10 k Ω , 1 M Ω , and 100 M Ω , with a tolerance of 0.1%). The designed potentiostat is set to two electrode configurations, and the electrodes are set to contact each side of the calibrated resistor using the analog switch TMUX1104. The DAC is set to sweep the output voltage in the range of 0 to 5 V, which is related to the nominal operating range of the potentiostat ±2.5 V. At each DAC output value, the ADC reads the value of the electrometer and the current-to-voltage (I/E) converter in which the electrometer value is used to set the right voltage between the WE and RE, while the I/E converter value is used to measure the actual voltage value of the cell. Using the least-squares regression method, the measured voltage and current values are then used to calculate a linear transfer function (y = ax + b). In this equation, y represents the TIA voltage, x is the applied voltage measured by the electrometer, a is the calculated slope (gain coefficient), and b is the calculated intercept (offset voltage). Because of the non-ideal properties of the components, this calibration is crucial to ensuring measurement accuracy. Electrochemical and photoelectrochemical measurements involve the measurement of current generated during redox reactions. Therefore, calibration of the measurement circuit ensures the accuracy and precision of the current obtained in electrochemical and photoelectrochemical experiments. The accuracy of this procedure calibration for the designed potentiostat is directly related to the accuracy of the 24-bit ADC AD122C04 when the calibrated values are calculated on the returned data of the ADC.
Because the excitation light source uses monochrome LED lights with different wavelengths and electrical parameters, each LED was applied to the current, which is the maximum DC forward current mentioned in the datasheet of each LED. To calibrate the current source on the excitation LED light source, a digital multimeter (Fluke 87V) was used to measure the current, in which the current was controlled by the DAC AD5622. After the current source is calibrated, it is set to the suitable value for each LED used in the excitation light source. The spectrum of the excitation light source is measured by a Stellar-net PS300 spectroradiometer.
An external resistor array was used to assess the current measurement range of the designed potentiostat. The array consisted of eight resistors with varying values: 100 Ω , 1 k Ω , 10 k Ω , 100 k Ω , 1 M Ω , 10 M Ω , 100 M Ω , and 1 G Ω . Fixed voltages, with values of 1 V or 0.1 V depending on the theoretical value calculated by Ohm’s law, were applied on each resistor in this array to achieve different current ranges. The resistor with the highest resistance (1 G Ω ) had a tolerance of 1%, while the remaining resistors had a tolerance of 0.1%. The evaluation resembled an amperometric technique commonly used in EC methods. The process was carried out for 60 s at each resistor value with a sampling interval of 20 sps. This sampling rate allows us to minimize the noise from the powerline because of the 50/60 Hz rejection and its harmonic signal coming from the ADS122C04 with a decrease of over −80 db. In this way, the intrinsic accuracy of the device was evaluated by analyzing the variation in the measured current values.

2.2.2. Electrochemical Analysis

To perform the EC analysis, two basic methods, chronoamperometry (CA) and cyclic voltammetry (CV), were used. The sample solution includes potassium ferricyanide ( K 3 F e ( C N ) 6 ) and potassium ferrocyanide ( K 4 F e ( C N ) 6 ) at different concentrations in a 0.1 M electrolytic solution of potassium chloride ( K C l ). In CV measurement, the scan rate is set to 100 mV/s, with the potential scan rate ranging from −0.2 V to 0.6 V. In CA, the sample was poised at 0 V for 1.5 s before a 0.4 V pulse was applied at 2 s with sampling for 5 ms. The electrode system includes a rhodium-plated CE (CE model 7—metal foam, Redoxme AB, Norrköping City, Sweden), a platinum wire (metal wire electrode—ST 0.6, Redoxme AB, Norrköping City, Sweden) acting as the WE, and a silver/silver chloride ( A g / A g C l ) RE (silver/silver chloride refillable RE—6 mm dia, Redoxme AB, Norrköping City, Sweden). The results were compared to the commercial potentiostat DY2100 (Digi-Ivy, Inc., Austin, TX, USA), which acts as a reference device.

2.2.3. Photoelectrochemical Analysis

For the PEC experiment, CuO nanorods (NRs) were used as the WE, because of promising characteristics for sensor applications, particularly in the photoelectrochemical sensing technique. In particular, C u O exhibits semiconductive properties with a narrow bandgap, allowing it to utilize visible light for biosensing. This is advantageous compared to materials like zinc (II) oxide and tin (IV) oxide, which possess wider bandgaps and require UV light for excitation, which can be detrimental to biological elements in the test. Furthermore, C u O is a cost-effective and widely available material for the testing experiment. The CE and RE were the same as those used previously. The PEC experiment used the photoamperometry technique, where a constant potential of −0.2 V was applied to the cell. The excitation light cycled on and off every 60 s with a pulse width of 30 s, following a quiet time of 150 s. The excitation wavelength was chosen based on the absorbance spectrum of C u O NRs.
The PEC sensing process essentially requires a photoactive material where the reaction occurs on its surface after the excitation light is harvested. As mentioned, this report used C u O NRs as a photoactive material due to their semiconductive properties and their capability to harvest visible light. The C u O NRs were synthesized using the hydrothermal method. Briefly, a 50 mL solution of 0.1 M copper (II) nitrate ( C u ( N O 3 ) 2 ) (≥99.5%, Merck KGaA, Darmstadt, Germany) was first prepared before adding 0.8 g of sodium hydroxide ( N a O H ) (≥99%, Merck KGaA, Darmstadt, Germany). The pH of the mixture was adjusted to 7 using H N O 3 (Merck KGaA, Darmstadt, Germany), and then, stirred for 30 min. After that, the prepared mixture was subjected to hydrothermal annealing at 180 °C for 18 h. The resulting mixture was rinsed and centrifuged to obtain the sample C u O NRs that were finally spray coated on to the I T O electrode. The properties (crystal structure, morphology, and absorbance spectrum) of the C u O NRs were also evaluated.

3. Results and Discussion

3.1. Hardware System Characteristics

The main hardware system consists of three fabricated printed circuit boards (PCBs), shown in Figure 5. The first PCB (Figure 5a) is a four-layer potentiostat circuit that controls light excitation using a 9-volt battery for power. The current source circuit is connected via a 4-wire bus to control the DAC (Figure 5b), which in turn regulates the output current supplied to the monochrome LED array in the third PCB (Figure 5c).
Figure 6 illustrates the current measurement range and accuracy of the measurement system described in this report. The black data points represent the correlation between the theoretical current values calculated using Ohm’s law ( I ideal ) and the average of measured current values ( I mean ) presented on a logarithmic scale. The system exhibits a wide measurement range, spanning from 1 nA to 18 mA, with a relative standard deviation (RSD) shown by the red points consistently below 1%. However, for current values below 1 nA the RSD increases above 1%. In particular, the RSD for a current of 0.1 nA exceeds 10%. In simpler terms, the designed system offers high current measurement precision in the range of 1 nA to 18 mA, with a precision of 99%. This relationship is further corroborated by the fitted line (blue line) in Figure 6a, which has a slope of 0.99917 and an intercept of −0.00369, with an R-square value close to 1, indicating a strong correlation. The precision of the designed circuit is evaluated by the accuracy of testing the array resistor and its intrinsic precision. In this case, current values from 10 nA to 18 mA have a tolerance below 1.01% of the range due to the 0.1% tolerance of the tested resistors, with values ranging from 100 Ω to 100 M Ω .
The laboratory-designed system demonstrates significant promise for practical applications by achieving high precision in the 1 nA range, a crucial requirement for highly sensitive biosensors. In an electrochemical biosensor for the detection of glycerin that uses amperometry techniques the current difference between 0 mM and 25 mM only reaches around 25 nA [58]. A measurement device lacking sufficient resolution would not be able to detect such a low limit. Minimizing circuit interference and noise is critical for achieving measurement precision. This requires careful circuit design techniques and the selection of appropriate components. The chosen TIA LMP7721 plays a vital role in low-current measurement due to its exceptionally low input bias current of 3 femtoamperes. This characteristic makes it ideal for converting low currents to voltages. Additionally, the chosen ADC ADS122C04 allows for digital filtering of the 50/60 Hz power line noise, further reducing interference. However, the circuit design itself is paramount for optimal performance. The implementation of a guard region around the analog signal region isolates the analog circuitry from the activity of the MCU and other digital components on the same circuit board. In addition, a 4-layer PCB layout was employed, where the signal layer is placed between two dedicated ground planes on the outer layers. These design choices effectively reduce white noise from temperature, high-frequency noise from the digital components’ activity, and power line interference, contributing to the system’s high-precision capability.
Figure 6b shows the spectrum of the excitation LED light source in this report. It has seven wavelengths: 385 nm, 405 nm, 470 nm, 525 nm, 590 nm, 630 nm, and 720 nm. The largest full width at half maximum (FWHM) is 37 nm, observed at the 470 nm wavelength. A wide selection of excitation LEDs allows the selection of wavelengths appropriate to the sensor material that is being investigated with PEC measurements. Table 1 compares several potentiostat systems designed for electrochemical and photoelectrochemical systems in recent years, including the available electroimpedance spectroscope (EIS) measurements.

3.2. Electrochemical and Photoelectrochemical Experiment Characteristics

3.2.1. Electrochemical Experiments

Figure 7 presents the results of the EC measurements using a K 3 F e ( C N ) 6 / K 4 F e ( C N ) 6 solution in 0.1 M K C l . Data from our system (red line, red data points) are compared to a reference commercial device (black line, black data points). Figure 7a depicts cyclic voltammograms for 10 mM K 3 F e ( C N ) 6 / K 4 F e ( C N ) 6 , with the anodic peak current (ipa) used for evaluation. Figure 7b shows chronoamperograms for 1 mM K 3 F e ( C N ) 6 / K 4 F e ( C N ) 6 , where the difference in current density between the pre-pulse and steady-state current serves as the evaluation metric. The EC measurements demonstrate consistent results between the two devices, with minor deviations observed at some concentrations.
The couple of the ferricyanide ion ( F e ( C N ) 6 3 ) and ferrocyanide ion ( F e ( C N ) 6 4 ) serves as a well-defined redox system in these electrochemical experiments. The reaction depicted in Equation (1) represents the reversible reduction of F e ( C N ) 6 3 to F e ( C N ) 6 4 (forward reaction) and the corresponding oxidation process (reserve reaction).
F e ( C N ) 6 3 + e F e ( C N ) 6 4
The CV experiment offers a valuable tool to probe the electrochemical behavior of this redox couple. As the applied potential is positively scanned during a CV experiment, F e ( C N ) 6 3 undergoes oxidation on the surface of the electrode, resulting in a characteristic ipa on the voltammogram. In contrast, when the potential scan is reversed, F e ( C N ) 6 4 reduction occurs at the electrode, leading to a cathodic peak current (ica). Although the CA provides complementary information. Applying a potential of −0.4 V in a CA experiment favors the reduction of F e ( C N ) 6 3 due to its more negative reduction potential compared to the oxidation potential of F e ( C N ) 6 4 . The concentration of the F e ( C N ) 6 3 / F e ( C N ) 6 4 couple significantly affects both CV and CA experiments. Increasing the concentration in CV experiments leads to higher peak currents (ipa and ica) due to the greater availability of redox species for reactions in the WE. Similarly, in CA experiments, a higher concentration results in a higher initial current but a slower current decay due to the larger initial pool of F e ( C N ) 6 3 available near the electrode surface, which takes longer to deplete. Consequently, the differential current density of the initial stage and the steady stage after 2 s increases according to the increase in F e ( C N ) 6 3 / F e ( C N ) 6 4 . In this study, both commercial and developed devices exhibited a linear increase with increasing K 3 F e ( C N ) 6 / K 4 F e ( C N ) 6 concentration. However, the deviations in the results, as clearly shown in Figure 7b with the commercial device’s slope value of 0.2498 (black line) and the slope value of the developed device of 0.2182 (red line), could potentially arise from slight variations in asynchronous experimental setups or electrode positioning.

3.2.2. Photoelectrochemical Experiment

Figure 8 presents the characterization of the synthesized C u O NRs used as the WE in the PEC measurements. The C u O characterization results comprise (a) the X-ray diffraction (XRD) pattern, confirming the crystal-line of synthesized C u O NRs; (b) the UV–vis spectrum of C u O NRs with an inset depicting the Tauc plot for bandgap determination based on light absorption properties; and (c,d) scanning electron microscope (SEM) images revealing the morphology of the synthesized C u O NRs. The XRD pattern confirms the synthesized material is CuO. The pattern (Figure 8a) matches the characteristic lattice peaks of C u O referenced in the Crystallography Open Database (COD ID: 1011148). The experimental peaks are observed at positions close to 32.51° (110), 35.64° (002), 38.60° (111), 48.69° (112), 53.67° (020), 58.47° (202), 61.57° (113), 68.21° (220), and 75.29° (004). The UV–vis spectrum (Figure 8b) reveals a strong light absorption region for C u O NRs between 400 nm and 550 nm, indicative of its absorbance property. The Tauc plot analysis of the absorption spectrum yields a bandgap energy of 1.31 eV for the synthesized C u O NRs. In particular, the bandgap energy of C u O is known to vary depending on morphology (petal-like: 1.73 eV; bulk: 1.2 eV; ellipsoid-like: 1.371 eV; plate-like: 1.447 eV; boat-like: 1.429 eV; flower: 1.425 eV) [65]. This value falls within the reported range for various C u O morphologies documented in the literature [65], suggesting a good agreement with previous findings. The SEM analysis (Figure 8c,d) reveals that the synthesized C u O material exhibits a morphology dominated by rod-like structures with some interwoven particles.
The absorption spectrum and bandgap analysis (Tauc plot) of the C u O photoactive material identified a 405 nm monochrome LED as the optimal excitation source for PEC measurements. Figure 9a depicts the photocurrent response (red line) of the system containing 5 mM K 3 F e ( C N ) 6 / K 4 F e ( C N ) 6 measured over 750 s. The black line represents the baseline current measured during the “OFF state” (no light excitation). The difference between the “ON state” (light excitation) and “OFF state” currents signifies the photocurrent generated by light-induced redox reactions. As illustrated in Figure 9b, increasing the concentration of redox species in the electrolyte solution leads to a corresponding increase in the observed negative photocurrent density. This phenomenon is primarily attributed to the concentration dependence of the F e ( C N ) 6 3 reduction reaction. Under light excitation, the C u O photoelectrode absorbs photons, promoting electrons to the conduction band. These photo-generated electrons then participate in the reduction reaction at the WE. The F e ( C N ) 6 3 ions in the solution act as electron acceptors, undergoing reduction to F e ( C N ) 6 4 according to the forward reaction in Equation (1).
As the concentration of F e ( C N ) 6 3 increases, the number of electron acceptors available increases proportionally. This leads to greater participation of photo-generated electrons in the reduction reaction, consequently generating a higher magnitude of negative photocurrent density. This PEC measurement setup effectively demonstrates the fundamental principle of a PEC sensor using K 3 F e ( C N ) 6 / K 4 F e ( C N ) 6 as a target analyte and C u O as the photoactive material. In this PEC experiment, although the photocurrent density obtained is not as high as the signals in EC measurements due to the different WE electrodes (hundreds of nA· cm 2 compared to mA· cm 2 ), the results of the PEC experiment show the ability to test on real samples with ultrahigh sensitivity when combined with other more photoactive materials in other experiments and target species.

4. Conclusions

The development of versatile measurement systems is crucial to the advancement of both EC and PEC sensor technologies, which are highly dependent on advances in materials science. This work presents a novel and versatile measurement system that is applicable to both types of sensors. The system incorporates a potentiostat circuit with a current measurement range of 1 nA to 18 mA and a high precision of 99%. It also features an external excitation light source comprised of seven monochrome LEDs with user-selectable wavelengths (385 nm, 405 nm, 470 nm, 525 nm, 590 nm, 630 nm, and 720 nm). The power for these LEDs is supplied by a current source controlled by a DAC signal. The experiment chamber, designed to investigate various EC and PEC sensor materials with sample volumes below 2 mL, facilitates easy experimentation and saves the sample solution. The wireless measurement system communicates via BLE with the Android-based user interface, where measurement results are stored as CSV files on the device’s memory. Furthermore, to demonstrate the system functionality for PEC applications, we employed C u O as the photoactive material and F e ( C N ) 6 3 / F e ( C N ) 6 4 as the target analyte for a representative experiment. The development of this flexible EC-PEC system lays the foundation for further research on these promising sensor technologies. One potential application could involve comparing the sensing properties of different materials in electrochemical and photoelectrochemical techniques for a specific target object, comparison of the effectiveness of each method in this scenario and demonstration of the advantages of one approach over the other.

Author Contributions

Conceptualization, A.H.H.V., T.T.T. and V.C.T.; methodology, A.H.H.V., M.H.H.T., T.N.T. and A.D.N.; software, A.H.H.V.; validation, M.H.H.T., V.C.T. and T.T.N.; formal analysis, A.H.H.V.; investigation, A.H.H.V., T.N.T. and A.D.N.; resources, T.T.T., V.C.T. and T.T.N.; data curation, A.H.H.V. and T.T.N.; writing—original draft preparation, A.H.H.V.; writing—review and editing, V.C.T. and T.T.T.; visualization, A.H.H.V. and T.T.T.; supervision, M.H.H.T., V.C.T. and T.T.N.; project administration, T.T.N.; funding acquisition, T.T.T., V.C.T. and T.T.N. All authors have read and agreed to the published version of the manuscript.

Funding

This research is funded by Vietnam National University Ho Chi Minh City (VNU-HCM) under grant number B2022-20-01/HĐ-KHCN.

Institutional Review Board Statement

Not applicable.

Informed Consent Statement

Not applicable.

Data Availability Statement

The raw data supporting the conclusions of this article will be made available by the authors on request.

Acknowledgments

We acknowledge Ho Chi Minh City University of Technology (HCMUT), VNU-HCM for supporting this study. The authors are grateful to Daniel M. Jenkins of University of Hawai’i at Mānoa, Honolulu, HI 96822, USA for his guidance during the early stages of this study and his valuable assistance with the experiments.

Conflicts of Interest

The authors declare no conflicts of interest.

References

  1. Zhu, C.; Yang, G.; Li, H.; Du, D.; Lin, Y. Electrochemical Sensors and Biosensors Based on Nanomaterials and Nanostructures. Anal. Chem. 2015, 87, 230. [Google Scholar] [CrossRef] [PubMed]
  2. Zang, Y.; Fan, J.; Ju, Y.; Xue, H.; Pang, H. Current Advances in Semiconductor Nanomaterial-Based Photoelectrochemical Biosensing. Chem. Eur. J. 2018, 24, 14010. [Google Scholar] [CrossRef] [PubMed]
  3. Maduraiveeran, G. Nanomaterials-based portable electrochemical sensing and biosensing systems for clinical and biomedical applications. J. Anal. Sci. Technol. 2022, 13, 35. [Google Scholar] [CrossRef]
  4. Ramya, M.; Senthil Kumar, P.; Rangasamy, G.; Uma shankar, V.; Rajesh, G.; Nirmala, K.; Saravanan, A.; Krishnapandi, A. A recent advancement on the applications of nanomaterials in electrochemical sensors and biosensors. Chemosphere 2022, 308, 136416. [Google Scholar] [CrossRef] [PubMed]
  5. Curulli, A. Nanomaterials in Electrochemical Sensing Area: Applications and Challenges in Food Analysis. Molecules 2020, 25, 5759. [Google Scholar] [CrossRef] [PubMed]
  6. Brainina, K.; Stozhko, N.; Bukharinova, M.; Vikulova, E. Nanomaterials: Electrochemical Properties and Application in Sensors. Phys. Sci. Rev. 2018, 3, 20188050. [Google Scholar] [CrossRef]
  7. Li, Z.; Lu, J.; Wei, W.; Tao, M.; Wang, Z.; Dai, Z. Recent advances in electron manipulation of nanomaterials for photoelectrochemical biosensors. Chem. Commun. 2022, 58, 12418. [Google Scholar] [CrossRef]
  8. Zhou, Y.; Yin, H.; Ai, S. Applications of two-dimensional layered nanomaterials in photoelectrochemical sensors: A comprehensive review. Coord. Chem. Rev. 2021, 447, 214156. [Google Scholar] [CrossRef]
  9. Kempahanumakkagari, S.; Deep, A.; Kim, K.-H.; Kumar Kailasa, S.; Yoon, H.-O. Nanomaterial-based electrochemical sensors for arsenic—A review. Biosens. Bioelectron. 2017, 95, 106. [Google Scholar] [CrossRef]
  10. Yang, L.; Zhang, S.; Liu, X.; Tang, Y.; Zhou, Y.; Wong, D.K.Y. Detection signal amplification strategies at nanomaterial-based photoelectrochemical biosensors. J. Mater. Chem. B 2020, 8, 7880. [Google Scholar] [CrossRef] [PubMed]
  11. Hu, Y.; Xu, Z. Application of Photocatalytic Nanomaterials in Photoelectrochemical Biosensors. J. Phys. Conf. Ser. 2021, 1948, 012144. [Google Scholar] [CrossRef]
  12. Liu, S.; Meng, S.; Wang, M.; Li, W.; Dong, N.; Liu, D.; Li, Y.; You, T. In-depth interpretation of aptamer-based sensing on electrode: Dual-mode electrochemical-photoelectrochemical sensor for the ratiometric detection of patulin. Food Chem. 2023, 410, 135450. [Google Scholar] [CrossRef] [PubMed]
  13. Li, J.; Wang, C.; Chen, X.; Huang, M.; Fu, Q.; Li, R.; Wang, Y.; Li, C.; Zhao, P.; Xie, Y.; et al. A non-enzymatic photoelectrochemical sensor based on g-C3N4@CNT heterojunction for sensitive detection of antioxidant gallic acid in food. Food Chem. 2022, 389, 133086. [Google Scholar] [CrossRef] [PubMed]
  14. Xing, L.; Zhang, W.; Fu, L.; Lorenzo, J.M.; Hao, Y. Fabrication and application of electrochemical sensor for analyzing hydrogen peroxide in food system and biological samples. Food Chem. 2022, 385, 132555. [Google Scholar] [CrossRef] [PubMed]
  15. Hou, X.; Xu, H.; Zhen, T.; Wu, W. Recent developments in three-dimensional graphene-based electrochemical sensors for food analysis. Trends Food Sci. Tech. 2020, 105, 76. [Google Scholar] [CrossRef]
  16. Ge, L.; Liu, Q.; Hao, N.; Kun, W. Recent developments of photoelectrochemical biosensors for food analysis. J. Mater. Chem. B 2019, 7, 7283. [Google Scholar] [CrossRef] [PubMed]
  17. Song, Y.; Wang, C.; Sha, J.; Liu, X.; Han, L.; Li, L. Photoelectrochemical sensor based on the sensitive interface of photosensitive electrode for the detection of hydrogen peroxide in dried bean curds. J. Food Compos. Anal. 2023, 119, 105237. [Google Scholar] [CrossRef]
  18. Silah, H.; Erkmen, C.; Demir, E.; Uslu, B. Modified indium tin oxide electrodes: Electrochemical applications in pharmaceutical, biological, environmental and food analysis. TrAC-Trend Anal. Chem. 2021, 141, 116289. [Google Scholar] [CrossRef]
  19. Lochab, A.; Sharma, R.; Kumar, S.; Saxena, R. Recent advances in carbon based nanomaterials as electrochemical sensor for toxic metal ions in environmental applications. Mater. Today Proc. 2021, 45, 3741. [Google Scholar] [CrossRef]
  20. Tajik, S.; Beitollahi, H.; Nejad, F.G.; Dourandish, Z.; Khalilzadeh, M.A.; Jang, H.W.; Venditti, R.A.; Varma, R.S.; Shokouhimehr, M. Recent Developments in Polymer Nanocomposite-Based Electrochemical Sensors for Detecting Environmental Pollutants. Ind. Eng. Chem. Res. 2021, 60, 1112. [Google Scholar] [CrossRef] [PubMed]
  21. Rebelo, P.; Costa-Rama, E.; Seguro, I.; Pacheco, J.G.; Nouws, H.P.A.; Cordeiro, M.N.D.S.; Delerue-Matos, C. Molecularly imprinted polymer-based electrochemical sensors for environmental analysis. Biosens. Bioelectron. 2021, 172, 112719. [Google Scholar] [CrossRef] [PubMed]
  22. Khanmohammadi, A.; Jalili Ghazizadeh, A.; Hashemi, P.; Afkhami, A.; Arduini, F.; Bagheri, H. An overview to electrochemical biosensors and sensors for the detection of environmental contaminants. J. Iran. Chem. Soc. 2020, 17, 2429. [Google Scholar] [CrossRef]
  23. Chen, W.; Liu, S.; Fu, Y.; Yan, H.; Qin, L.; Lai, C.; Zhang, C.; Ye, H.; Chen, W.; Qin, F.; et al. Recent advances in photoelectrocatalysis for environmental applications: Sensing, pollutants removal and microbial inactivation. Coord. Chem. Rev. 2022, 454, 214341. [Google Scholar] [CrossRef]
  24. Wang, X.; Lu, T.; Cai, Z.; Han, D.; Ye, X.; Liu, Z. A Photoelectrochemical Sensor for Real-Time Monitoring of Neurochemical Signals in the Brain of Awake Animals. Anal. Chem. 2024, 96, 6079–6088. [Google Scholar] [CrossRef] [PubMed]
  25. Liu, Y.; Zhong, L.; Zhang, S.; Wang, J.; Liu, Z. An ultrasensitive and wearable photoelectrochemical sensor for unbiased and accurate monitoring of sweat glucose. Sens. Actuators Chem. 2022, 354, 131204. [Google Scholar] [CrossRef]
  26. Yan, T.; Zhang, G.; Yu, K.; Chai, H.; Tian, M.; Qu, L.; Dong, H.; Zhang, X. Smartphone light-driven zinc porphyrinic MOF nanosheets-based enzyme-free wearable photoelectrochemical sensor for continuous sweat vitamin C detection. Chem. Eng. J. 2023, 455, 140779. [Google Scholar] [CrossRef]
  27. Wang, L.; Pagett, M.; Zhang, W. Molecularly imprinted polymer (MIP) based electrochemical sensors and their recent advances in health applications. Sens. Actuators Rep. 2023, 5, 100153. [Google Scholar] [CrossRef]
  28. Wang, Y.; Rong, Y.; Ma, T.; Li, L.; Li, X.; Zhu, P.; Zhou, S.; Yu, J.; Zhang, Y. Photoelectrochemical sensors based on paper and their emerging applications in point-of-care testing. Biosens. Bioelectron. 2023, 236, 115400. [Google Scholar] [CrossRef] [PubMed]
  29. Jin, X.; Baghayeri, M.; Nodehi, M.; Koshki, M.-S.; Ramezani, A.; Fayazi, M.; Xu, Y.; Hua, Z.; Lei, Y.; Makvandi, P. Evaluation of thallium ion as an effective ion in human health using an electrochemical sensor. Environ. Res. 2023, 238, 117026. [Google Scholar] [CrossRef] [PubMed]
  30. Hernández-Rodríguez, J.F.; Rojas, D.; Escarpa, A. Electrochemical Sensing Directions for Next-Generation Healthcare: Trends, Challenges, and Frontiers. Anal. Chem. 2021, 93, 167. [Google Scholar] [CrossRef] [PubMed]
  31. Tonelli, D.; Gualandi, I.; Scavetta, E.; Mariani, F. Focus Review on Nanomaterial-Based Electrochemical Sensing of Glucose for Health Applications. Nanomaterials 2023, 13, 1883. [Google Scholar] [CrossRef] [PubMed]
  32. Ching, C.T.; Van Hieu, N.; Cheng, T.-Y.; Fu, L.-S.; Sun, T.-P.; Liu, M.-Y.; Huang, S.-H.; Yao, Y.-D. Liver Cancer Detection by a Simple, Inexpensive and Effective Immunosensor with Zinc Oxide Nanoparticles. Sensors 2015, 15, 29408. [Google Scholar] [CrossRef] [PubMed]
  33. Wu, J.-Y.; Ching, C.T.; Wang, H.-M.D.; Liao, L.-D. Emerging Wearable Biosensor Technologies for Stress Monitoring and Their Real-World Applications. Biosensors 2022, 12, 1097. [Google Scholar] [CrossRef]
  34. Ching, C.T.-S.; Chou, M.-Y.; Jiang, S.-J.; Huang, S.-H.; Sun, T.-P.; Liu, W.-H.; Liu, C.-M. Tissue electrical properties monitoring for the prevention of pressure sore. Prosthetics Orthot. Int. 2011, 35, 386–394. [Google Scholar] [CrossRef] [PubMed]
  35. Cremer, M. Über die Ursache der Elektromotorischen Eigenschaften der Gewebe, Zugleich ein Beitrag zur Lehre von den polyphasischen Elektrolytketten; Publishing House: Oldenbourg, Germany, 1906. [Google Scholar]
  36. Baranwal, J.; Barse, B.; Gatto, G.; Broncova, G.; Kumar, A. Electrochemical Sensors and Their Applications: A Review. Chemosensors 2022, 10, 363. [Google Scholar] [CrossRef]
  37. Kirazoğlu, M.; Benli, B. Recent Point of Care (PoC) Electrochemical Testing Trends of New Diagnostics Platforms for Vitamin D. ChemistrySelect 2023, 8, e202301600. [Google Scholar] [CrossRef]
  38. Gonçalves, M.d.L.; Truta, L.A.N.; Sales, M.G.F.; Moreira, F.T.C. Electrochemical Point-of Care (PoC) Determination of Interleukin-6 (IL-6) Using a Pyrrole (Py) Molecularly Imprinted Polymer (MIP) on a Carbon-Screen Printed Electrode (C-SPE). Anal. Lett. 2021, 54, 2611. [Google Scholar] [CrossRef]
  39. Bai, Y.; Guo, Q.; Xiao, J.; Zheng, M.; Zhang, D.; Yang, J. An inkjet-printed smartphone-supported electrochemical biosensor system for reagentless point-of-care analyte detection. Sens. Actuators Chem. 2021, 346, 130447. [Google Scholar] [CrossRef]
  40. Roy, D.; Singh, P.; Halder, S.; Chanda, N.; Mandal, S. 3-D printed electrode integrated sensing chip and a PoC device for enzyme free electrochemical detection of blood urea. Bioelectrochemistry 2021, 142, 107893. [Google Scholar] [CrossRef] [PubMed]
  41. Nazemi, H.; Joseph, A.; Park, J.; Emadi, A. Advanced Micro- and Nano-Gas Sensor Technology: A Review. Sensors 2019, 19, 1285. [Google Scholar] [CrossRef] [PubMed]
  42. Gao, Y.; Guo, Y.; He, P.; Liu, Z.; Chen, Y. Enhanced sensitivity and selectivity of an electrochemical sensor for real-time propofol monitoring in anesthesia. Alex. Eng. J. 2024, 87, 47. [Google Scholar] [CrossRef]
  43. Ghanbari, M.H.; Norouzi, Z.; Etzold, B.J.M. Increasing sensitivity and selectivity for electrochemical sensing of uric acid and theophylline in real blood serum through multinary nanocomposites. Microchem. J. 2023, 191, 108836. [Google Scholar] [CrossRef]
  44. Abdallah, A.B.; El-kholany, M.R.; Molouk, A.F.S.; Ali, T.A.; El-Shafei, A.A.; Khalifa, M.E. Selective and sensitive electrochemical sensors based on an ion imprinting polymer and graphene oxide for the detection of ultra-trace Cd(ii) in biological samples. RSC Adv. 2021, 11, 30771. [Google Scholar] [CrossRef] [PubMed]
  45. Dai, H.; Zhang, S.; Hong, Z.; Li, X.; Xu, G.; Lin, Y.; Chen, G. Enhanced Photoelectrochemical Activity of a Hierarchical-Ordered TiO2 Mesocrystal and Its Sensing Application on a Carbon Nanohorn Support Scaffold. Anal. Chem. 2014, 86, 6418. [Google Scholar] [CrossRef] [PubMed]
  46. Nischk, M.; Mazierski, P.; Wei, Z.; Siuzdak, K.; Kouame, N.A.; Kowalska, E.; Remita, H.; Zaleska-Medynska, A. Enhanced photocatalytic, electrochemical and photoelectrochemical properties of TiO2 nanotubes arrays modified with Cu, AgCu and Bi nanoparticles obtained via radiolytic reduction. Appl. Surf. Sci. 2016, 387, 89. [Google Scholar] [CrossRef] [PubMed]
  47. Wang, J.; Liu, Z. Recent advances in two-dimensional layered materials for photoelectrochemical sensing. TrAC-Trend Anal. Chem. 2020, 133, 116089. [Google Scholar] [CrossRef]
  48. Sarkar, S.; Bhattacharya, M. SStat: Wi-Fi and Bluetooth integrated Multimodal “Do-It-Yourself” Electrochemical Potentiostat. In Proceedings of the IECON 2020 The 46th Annual Conference of the IEEE Industrial Electronics Society, Singapore, 18–21 October 2020. [Google Scholar] [CrossRef]
  49. Krorakai, K.; Klangphukhiew, S.; Kulchat, S.; Patramanon, R. Smartphone-Based NFC Potentiostat for Wireless Electrochemical Sensing. Appl. Sci. 2021, 11, 392. [Google Scholar] [CrossRef]
  50. Irving, P.; Cecil, R.; Yates, M.Z. MYSTAT: A compact potentiostat/galvanostat for general electrochemistry measurements. HardwareX 2021, 9, e00163. [Google Scholar] [CrossRef] [PubMed]
  51. Hoilett, O.S.; Walker, J.F.; Balash, B.M.; Jaras, N.J.; Boppana, S.; Linnes, J.C. KickStat: A Coin-Sized Potentiostat for High-Resolution Electrochemical Analysis. Sensors 2020, 20, 2407. [Google Scholar] [CrossRef] [PubMed]
  52. Jenkins, D.M.; Lee, B.E.; Jun, S.; Reyes-De-Corcuera, J.; McLamore, E.S. ABE-Stat, a Fully Open-Source and Versatile Wireless Potentiostat Project Including Electrochemical Impedance Spectroscopy. J. Electrochem. Soc. 2019, 166, B3056. [Google Scholar] [CrossRef]
  53. Bott-Neto, J.L.; Martins, T.S.; Buscaglia, L.A.; Santiago, P.V.B.; Fernández, P.S.; Machado, S.A.S.; Oliveira, O.N., Jr. A portable system for photoelectrochemical detection of lactate on TiO2 nanoparticles and [Ni(salen)] polymeric film. Sens. Actuators B Chem. 2021, 345, 130390. [Google Scholar] [CrossRef]
  54. Scott, A.; Sakib, S.; Saha, S.; Zhitomirsky, I.; Soleymani, L. A portable and smartphone-operated photoelectrochemical reader for point-of-care biosensing. Electrochim. Acta 2022, 419, 140347. [Google Scholar] [CrossRef]
  55. Shi, Z.; Dai, C.; Deng, P.; Wu, Y.; Liu, G.; An, Z.; Liang, H.; Zhang, F.; Lu, Y.; Liu, Q. Smartphone-based portable photoelectrochemical biosensing system for point-of-care detection of urine creatinine and albumin. Lab Chip 2023, 23, 3424. [Google Scholar] [CrossRef] [PubMed]
  56. Colburn, A.W.; Levey, K.J.; O’Hare, D.; Macpherson, J.V. Lifting the lid on the potentiostat: A beginner’s guide to understanding electrochemical circuitry and practical operation. Phys. Chem. Chem. Phys. 2021, 23, 8100. [Google Scholar] [CrossRef] [PubMed]
  57. Matsubara, Y. A Small yet Complete Framework for a Potentiostat, Galvanostat, and Electrochemical Impedance Spectrometer. J. Chem. Edu. 2021, 98, 3362. [Google Scholar] [CrossRef]
  58. Wang, Q.; Liu, Y.; Campillo-Brocal, J.C.; Jiménez-Quero, A.; Crespo, G.A.; Cuartero, M. Electrochemical biosensor for glycine detection in biological fluids. Biosens. Bioelectron. 2021, 182, 113154. [Google Scholar] [CrossRef] [PubMed]
  59. Li, Y.; Liu, G.; Ji, D.; He, Y.; Chen, Q.; Zhang, F.; Liu, Q. Smartphone-based label-free photoelectrochemical sensing of cysteine with cadmium ion chelation. Analyst 2022, 147, 1403. [Google Scholar] [CrossRef] [PubMed]
  60. Anshori, I.; Mufiddin, G.F.; Ramadhan, I.F.; Ariasena, E.; Harimurti, S.; Yunkins, H.; Kurniawan, C. Design of smartphone-controlled low-cost potentiostat for cyclic voltammetry analysis based on ESP32 microcontroller. Sens. Bio-Sens. Res. 2022, 36, 100490. [Google Scholar] [CrossRef]
  61. Cordova-Huaman, A.V.; Jauja-Ccana, V.R.; La Rosa-Toro, A. Low-cost smartphone-controlled potentiostat based on Arduino for teaching electrochemistry fundamentals and applications. Heliyon 2021, 7, e06259. [Google Scholar] [CrossRef] [PubMed]
  62. Bianchi, V.; Boni, A.; Fortunati, S.; Giannetto, M.; Careri, M.; Munari, I.D. A Wi-Fi Cloud-Based Portable Potentiostat for Electrochemical Biosensors. IEEE Trans. Instrum. Meas. 2020, 69, 3232. [Google Scholar] [CrossRef]
  63. Adams, S.D.; Doeven, E.H.; Quayle, K.; Kouzani, A.Z. MiniStat: Development and Evaluation of a Mini-Potentiostat for Electrochemical Measurements. IEEE Access 2019, 7, 31903. [Google Scholar] [CrossRef]
  64. Ahmad, R.; Surya, S.G.; Sales, J.B.; Mkaouar, H.; Catunda, S.Y.C.; Belfort, D.R.; Lei, Y.; Wang, Z.L.; Baeumner, A.; Wolfbeis, O.S.; et al. KAUSTat: A Wireless, Wearable, Open-Source Potentiostat for Electrochemical Measurements. In Proceedings of the 2019 IEEE SENSORS, Montreal, QC, Canada, 27–30 October 2019. [Google Scholar] [CrossRef]
  65. Khan, M.A.; Nayan, N.; Shadiullah; Ahmad, M.K.; Soon, C.F. Surface Study of CuO Nanopetals by Advanced Nanocharacterization Techniques with Enhanced Optical and Catalytic Properties. Nanomaterials 2020, 10, 1298. [Google Scholar] [CrossRef] [PubMed]
Figure 1. The working principle of EC-based and PEC-based sensors.
Applsci 14 05420 g001
Figure 2. The conceptual EC−PEC system includes (1) potentiostat; (2) EC-PEC experimental chamber; (3) monochrome excitation light source; and (4) Android−based user interface.
Applsci 14 05420 g002
Figure 3. Schematic of the designed circuits: includes the schematic of excitation light source and the schematic of potentiostat circuit.
Applsci 14 05420 g003
Figure 4. The designed EC-PEC chamber with the assembled cell (a), the top view (b), and its components (c).
Applsci 14 05420 g004
Figure 5. The fabricated PCB circuits: (a) potentiostat circuit, (b) current source controlled by DAC, and (c) monochrome LED array.
Applsci 14 05420 g005
Figure 6. (a) The correlation between the mean of measured current and the theoretically calculated current (black points) with its RSD (red points) and (b) the spectrum of the designed excitation monochrome LED source.
Applsci 14 05420 g006
Figure 7. (a) Cyclic voltammogram of 10 mM K 3 F e ( C N ) 6 / K 4 F e ( C N ) 6 in 0.1 M K C l solution. The inset shows the ipa dependence on the concentration of K 3 F e ( C N ) 6 / K 4 F e ( C N ) 6 . (b) Chronoamperogram of 1 mM K 3 F e ( C N ) 6 / K 4 F e ( C N ) 6 in 0.1 M K C l solution. The inset depicts the dependence of the differential current density between the pre−pulse state and the steady−state current following the pulse on the concentration of K 3 F e ( C N ) 6 / K 4 F e ( C N ) 6 .
Applsci 14 05420 g007
Figure 8. (a) XRD pattern, (b) UV−VIS spectrum with inset of Tauc plot, and (c,d) SEM images of the synthesized C u O NRs.
Applsci 14 05420 g008
Figure 9. (a) Photo−amperogam of 5 mM K 3 F e ( C N ) 6 / K 4 F e ( C N ) 6 in 0.1 M K C l and (b) the cycle in ON−time excitation period of 450 s to 480 s with various concentrations of K 3 F e ( C N ) 6 / K 4 F e ( C N ) 6 .
Applsci 14 05420 g009
Table 1. Features comparison of P-EcStat to some lab-made potentiostat platforms for EC and PEC measurements in recent years.
Designed SystemMeasurementsNumber of Integrated LightsCurrent RangeSupported EISSoftware InterfaceWireless Communication
P-EcStat (this work)EC-PEC71 nA–18 mAAndroid-basedBLE
Shi et al. (2023) [55]PEC3Smartphone-basedBluetooth
Li et al. (2022) [59]EC-PEC1Smartphone-basedBluetooth
Scott et al. (2022) [54]PEC4±10 µAAndroid-basedBLE
Anshori et al. (2022) [60]EC±300 µAAndroid-basedBluetooth
Bott-Neto et al. (2021) [53]PEC1
Cordova-Huaman et al. (2021) [61]EC±225 µAAndroid-basedBluetooth
MYSTAT (2021) [50]EC±200 mAWindows/OSX/Linux
Matsubara Y. (2021) [57]EC100 mALabview-based
Bianchi et al. (2019) [62]ECWifi cloud-based
MiniStat (2019) [63]EC±225 µA
KAUSTat (2019) [64]EC±500 µASmartphone-basedBLE
ABE-Stat (2019) [52]ECAndroid-basedWifi
✓ Supported feature. ✠ Unsupported/unpresented/undefined feature.
Disclaimer/Publisher’s Note: The statements, opinions and data contained in all publications are solely those of the individual author(s) and contributor(s) and not of MDPI and/or the editor(s). MDPI and/or the editor(s) disclaim responsibility for any injury to people or property resulting from any ideas, methods, instructions or products referred to in the content.

