Article

Visual Analysis of Carbendazim Residues in Carrot Tubers via Postionization Mass Spectrometry Imaging

MOE Key Laboratory of Laser Life Science & Guangdong Provincial Key Laboratory of Laser Life Science, Guangzhou Key Laboratory of Spectral Analysis and Functional Probes, College of Biophotonics, South China Normal University, Guangzhou 510631, China
*
Author to whom correspondence should be addressed.
Appl. Sci. 2024, 14(13), 5431; https://doi.org/10.3390/app14135431
Submission received: 15 May 2024 / Revised: 13 June 2024 / Accepted: 19 June 2024 / Published: 22 June 2024

Abstract

:
Carbendazim (CBZ) residues in food are a severe threat to food safety, and their detection is a challenging problem in food science. We introduce here a new method based on laser desorption postionization mass spectrometry imaging (LDPI-MSI) for detecting CBZ residues in carrots. In the novel LDPI-MSI method, two distinct laser beams simultaneously exert dissociation and ionization, which offers several advantages over traditional techniques based on single-photon matrix-assisted laser desorption/ionization mass spectrometry imaging (MALDI-MSI), including simplified sample preparation, streamlined operation workflow, and a lower limit of detection (LOD). The LOD, in the proposed method, has been lowered to 0.019 ppm. Coupled with mass spectrometry imaging (MSI), the LDPI-MS method enabled in situ detection of small molecular compounds, such as chemical pesticides, and provided comprehensive and accurate results. The image obtained from the characteristic mass spectrometric signature of CBZ at m/z 191 illustrated that most of the CBZ could not enter the carrot tubers directly, but a small amount of CBZ entered the carrot root and was mainly concentrated in the central xylem. The results suggest that the proposed method could potentially be used in pesticide analysis.

1. Introduction

Excessive or improper use of pesticides adversely affects ecosystems and wildlife, increasing the level of pesticides in agricultural products and leaking into groundwater from farmland, which ultimately may altogether endanger human health [1,2,3]. Among many types of fungicidal pesticides, carbendazim (CBZ) is a broad-spectrum systemic fungicide, one widely applied to various crops in China, primarily via foliar spraying and seed treatment [4,5]. Therefore, to minimize the overuse of pesticides and prevent soil and water pollution, it is necessary to reassess the pesticide application process and find its correlation with the process of pesticide absorption in plants [6,7]. This also applies to contact pesticides deposited on the surface of plants [8,9]. Carrot root rot, a common and frequent fungal disease, is primarily manifested during the post-harvest storage period, leading to significant yield and quality losses [10]. Early disease stages can be effectively mitigated by drenching with a 600-fold diluted solution of 50% CBZ wettable powder [11]. The kinetics of CBZ degradation in plant roots exhibit a typical half-life ranging from 1 to 5 days, potentially causing residue accumulation [12,13].
According to international standards, pesticide residues can be tested by various methods, mainly including chromatographic (column chromatography and thin-layer chromatography), electrochemical, and HPLC–MS methods [14,15,16]. Zhou et al. applied ultrahigh-performance liquid chromatography (UHPLC–MS) to determine metabolites and pesticide residues in tea leaves, achieving precision and a low limit of detection (LOD), better than that in the existing methods; however, these methods comprise several steps, which is a time-consuming and labor-intensive procedure that does not provide in situ information on the distribution of pesticide residues in the tea samples [12]. Hossein et al. developed a new electrochemical molecularly-imprinted polymer aptasensor, demonstrating exceedingly high sensitivity and enhanced selectivity in CBZ detection. However, special and complex preprocessing steps were required, possibly affecting the accuracy of quantitative results [17].
In addition to traditional chemical analysis methods, laser ionization mass spectrometry analysis methods have been developed in recent years, and these have benefitted from novel ion source technologies. Secondary ion mass spectrometry (SIMS), thermal desorption ionization (DART), matrix-assisted laser desorption ionization (MALDI), and laser desorption postionization (LDPI) have been developed, and they require almost no sample preparation [18,19,20]. The applicability of ionization mass spectrometry analysis methods has been demonstrated for a variety of analytes, e.g., biological and environmental samples including alkaloids in plants, phospholipids in mammalian tissues, and lipids and proteins in bacteria [21,22]. Substantial progress was made in the last decade in MALDI-MS analyses for complex protein samples, especially biomolecules, because innovative “soft ionization” MS techniques offered advantages in sample-integrity preservation, strong molecular ion peaks, and high sensitivity [23,24]. However, interference peaks can be generated from matrices used in the MALDI–MS detection methods in the low-molecular-weight region, which may adversely affect the detection of target compounds. Consequently, MALDI is satisfactorily employed for high-molecular-weight molecules, such as proteins, carbohydrates, and proenzymes, while the results for substances with a relative molecular weight lower than five hundred, such as amino acids, are often unsatisfactory [25,26,27,28].
LDPI-MS has a working principle similar to that of MALDI-MS, and yet, there are some important differences [29]. LDPI-MS utilizes two experimental lasers with different energies to complete the sample desorption and ionization processes separately. The method was previously used to detect the distribution of polycyclic aromatic hydrocarbons in gasoline aerosols and analyze drugs and biomaterials [30,31].
The ionization process in LDPI-MS mainly involves two independent steps: desorption gasification and ionization after desorption. In the first step, a sample is irradiated with a desorption laser; typically, a low-energy infrared laser is applied. The laser effectively vaporizes stable and non-volatile substances within a few microseconds, facilitating the gasification process [32]. Generally, gaseous particles formed upon the sample’s vaporization aggregate into small, electroneutral gaseous clusters which float at a vertical distance of approximately 1 mm from the sample platform. After the vaporization process is completed, a second laser beam is applied after a certain delay time. In general, the ionization laser used in LDPI-MS is a vacuum ultraviolet (VUV) laser, with its photon energy reaching 10.48 eV. This energy level is higher than the ionization energy of most molecules. Therefore, gasification and ionization of target molecules can be achieved using single-photon energy, which also helps minimize the generation of abundant ion fragments [33].
LDPI-MS has several unique advantages over other types of ionization sources. First, fewer fragment peaks form due to the soft VUV-laser single-photon ionization, resulting in a greater proportion of intact molecular peaks and improved experimental accuracy [34]. Second, the separate utilization of two laser beams provides a basis for optimizing the experimental operation and makes it more convenient [35]. Finally, the LDPI ionization method effectively avoids interference effects, like those caused by matrix additives in MALDI methods, which is advantageous in detecting relatively small molecules such as CBZ, as discussed in this paper [36]. In addition, this research method can be used in imaging mode to study the in situ distribution of compounds across the entire sample area. Previously, it has been widely used in biomedical research, drug metabolism research, proteomics, lipidomics, materials science, and other fields. It is particularly suitable for applications that require high sensitivity and rapid spatial imaging of small-molecule compounds, such as the distribution of functional molecules in cell tissues and the distribution of drugs in organisms [37].
Keeping in mind the aforementioned elaboration, we propose here a novel method for the in situ detection of CBZ pesticide residues in plant roots and stems. The method is based on LDPI combined with TOF-MSI, and it offers advantages such as not requiring sample preprocessing, enabling single-step in-situ imaging, and performing simultaneous analyses of multiple datasets, outperforming the existing methods for pesticide residue analysis.

2. Materials and Methods

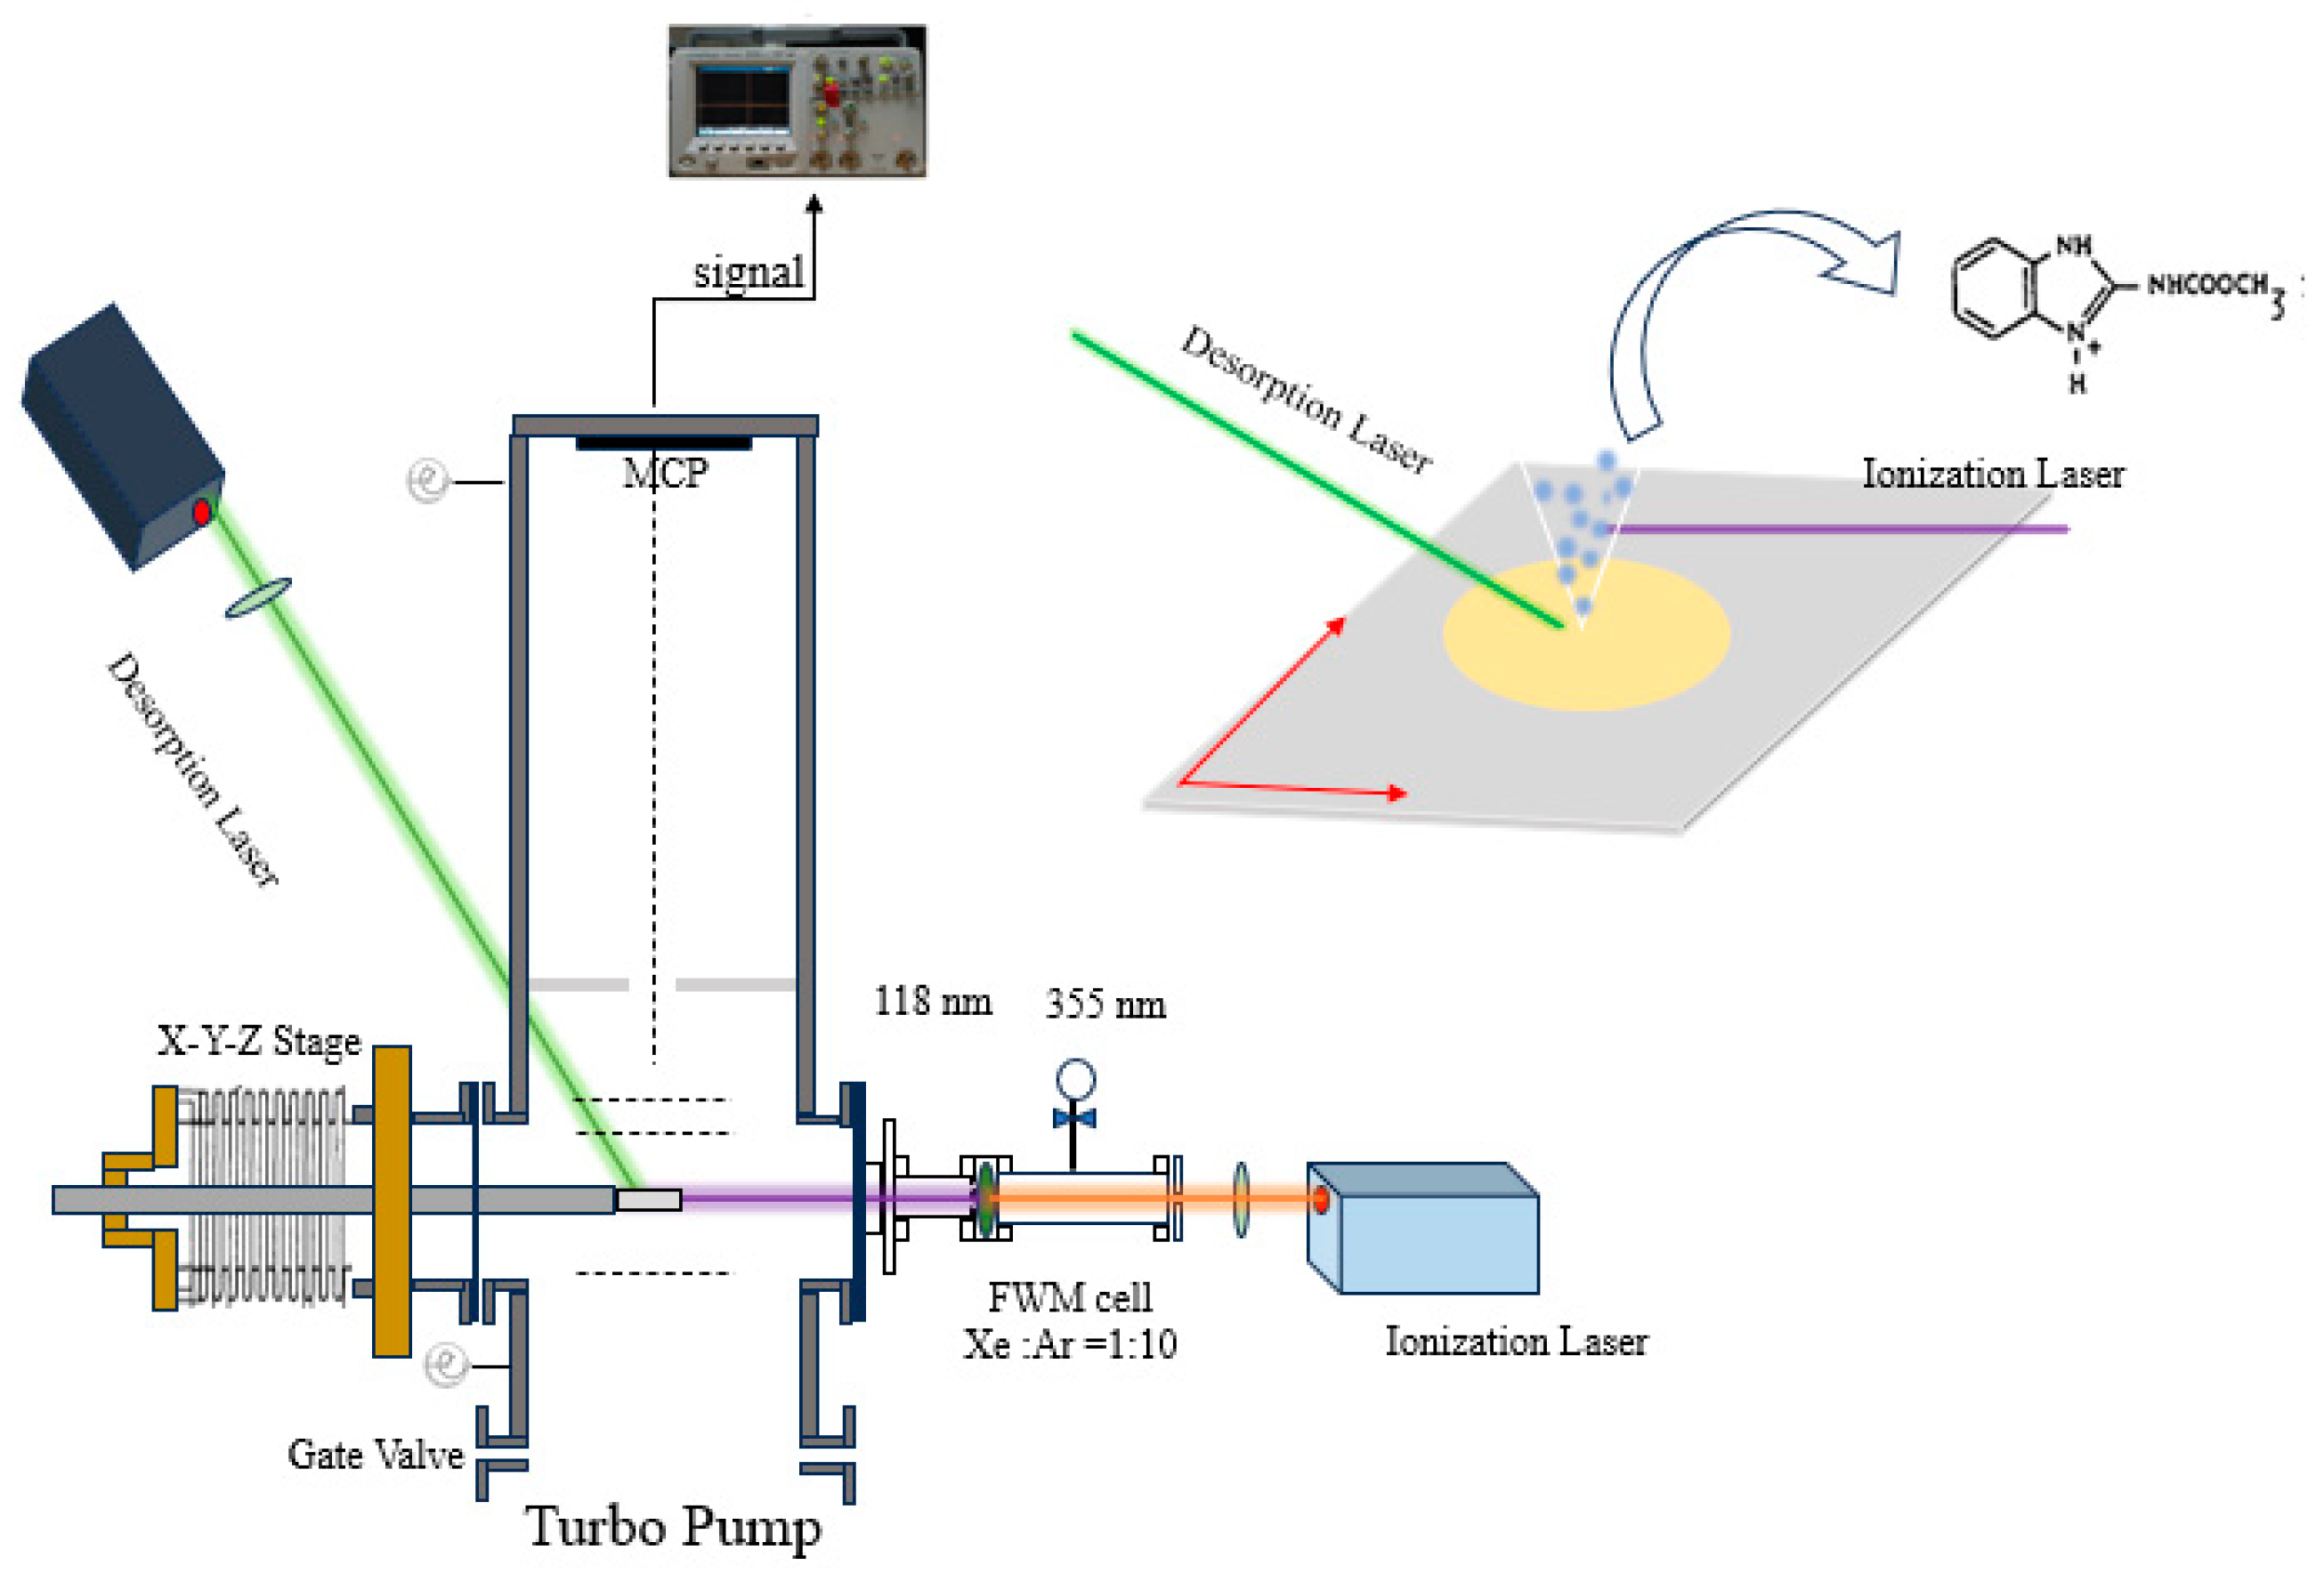
2.1. LDPI-TOF-MSI Apparatus

The home-built apparatus is shown in Figure 1. The mass spectrometry imaging system used in this study was integrated and constructed with multiple functional components, including a custom-designed linear time-of-flight-mass spectrometer (TOF-MS), vacuum system, laser system, and delay control system. An X-Y-Z stage was used for sample transfer during the imaging run [38]. A home-made TOF-MS system was used in this study. The details of the apparatus have been described previously, and only a brief introduction is given here [39].
In this experiment, the laser light sources used included two nanosecond-scale solid-state lasers. The desorption laser, a 532 nm Nd:YAG solid-state laser (Minilite, Continuum, Inc., Milpitas, CA, USA) with a 10 Hz repetition rate, was focused on a small spot with a size of 0.5 mm2 through a reflection and focusing lens. By controlling the pulse energy range within 0.5–3 mJ (10–60 mW/cm2), desorption of sample molecules can be achieved. The ionization laser source used in this experiment consisted of vacuum ultraviolet (VUV) 118 nm, 10.5 eV photons generated by nonlinear optical frequency mixing with another 1064 nm laser (INDI-40-10 YAG, Spectra Physics, Inc., Milpitas, CA, USA). Briefly, a 355 nm laser for ionization is generated through the frequency tripling crystal (FTC) of the fundamental frequency light produced by the 1064 nm laser, and the emitted light is focused by a focusing lens (f = 25 cm) before entering a homemade mixed gas cell. Specifically, this gas cell was filled with a high-purity nonlinear medium consisting of a phase-matched 1:10 Xe/Ar gas mixture at 160 Torr to generate 118 nm photons by the use of four-wave mixing and an MgF2 lens (which can cause separation of the ultraviolet and VUV beams at the YAG third harmonic (n = 1.39 at 355 nm) and ninth harmonic (n = 1.67 at 118 nm) wavelengths), which are used for the output port. Finally, the 118 nm laser spot generated through this process can be focused to approximately 1 mm2 above the sample. Then, the sample is completely ionized by coordination with the X-Y-Z platform [40]. As shown in Figure S1, the ion lenses are used to adjust and focus the ion beam so that ions can hit the detector more accurately. The ion signals were collected by a 22 mm diameter ternary position-sensitive detector (microchannel plate, MCP). The outputs corresponding to the ion signals were digitized, averaged, and recorded using a digital storage oscilloscope.

2.2. Material and Reagents

Carrots (Guangzhou local market, approximately 100 g in total) were stored at 20 °C for no more than 15 days. Carbendazim (C9H9N3O2, >97%) was purchased from Aladdin (Shanghai, China). Alcohol (C2H5OH) was obtained from Guangzhou Chemical Reagent Factory (Guangzhou, China). Graphite powder (99.85%, Aladdin, Shanghai, China) was obtained. O.C.T. (optimal cutting temperature, a water-soluble mixture of polyethylene glycol and polyvinyl alcohol) Compound (SAKULA®, made in Whitestone, NY, USA) was acquired. All reagents were of analytical grade or higher, and all aqueous solutions were prepared using high-purity water (≥18 MΩ/cm2), obtained by passing distilled and deionized water through an ELGA water purification system. Standard solutions (0.5−10 nmol/mL) were prepared by appropriate dilution of stock carbendazim.

2.3. Experimental Procedure

This study aims to analyze pesticide residues in the underground part of the carrot’s main root. Therefore, it was necessary to treat the carrot plants to eliminate interference from other effects. Carrot plants were divided into leaves, fleshy taproots, and roots [41]. The fleshy taproot originates from the lower hypocotyl and the upper part of the root. Therefore, a portion of the taproot can grow above the soil; the boundaries between aboveground and underground taproots were marked with string, serving as an experimental target. In addition, all petioles and leaves of the experimental plants were cut off in advance and placed in a prepared solution, after which the flask was covered with Parafilm® to inhibit the translocation by water evapotranspiration [42,43]. An overview of the experimental procedure is shown in Figure 2. First, before preparing the samples, it was essential to prepare and cultivate the carrot plants. In the second step, CBZ was added and cot-cultured with the sample. For the sake of the experiments, carrot plants were cultivated in glass flasks containing 100 mL of complete nutrient solution in order to maintain the biological activity; the cultivated portion matched the marked area. In this process, 1.0 g of carbendazim was added to the experimental group to form a 10 mg/mL culture solution, while the control group received the powder equivalent of 1.0 g complete nutrient solution to balance the concentration. This process simulated the actual conditions of soil spraying and root irrigation with agricultural pesticides. Three parallel experiments were performed for each group. The specific culture conditions of carrot tubers sample were as follows: during the experiment, the carrot root samples were cultured in 100 mL complete nutrient solution containing 10 mg/mL carbendazim for 2 h at a temperature of about 20 °C and a period of shaking was maintained every 5 min. In the third step, the samples were sliced and prepared. The complete carrot samples were dried to remove residual solution from the surfaces using absorbent filter paper. Afterward, the selected tissues (1 cm below the mark, about 200 mm2) were quickly cut, and then embedded in an O.C.T. compound freezing medium within 5 min after collection. Tissue sections with a thickness of 100 μm were obtained at −20 °C using a cryostat (Leica’s CM1850, Wetzlar, Hesse, Germany) and deposited on flat sapphire substrates for LDPI-MS analysis. In the fourth step, after the completion of sample preparation, with the use of an accurate three-dimensional mobile platform, and according to the preset 70 μm step size and using the zigzag scanning mode, the treated sample was gradually scanned and analyzed, in order to ensure the comprehensive coverage of the entire sample surface and efficient analysis. Through the above steps, which were followed to complete the collection of specific mass spectrum peak signals, the original mass spectrometry image map was obtained, and then the image was optimized by Matlab R2022a and other software, with techniques such as denoising and shadow removal. Finally, the pesticide residues in the sample could be visually displayed through color coding.

3. Results

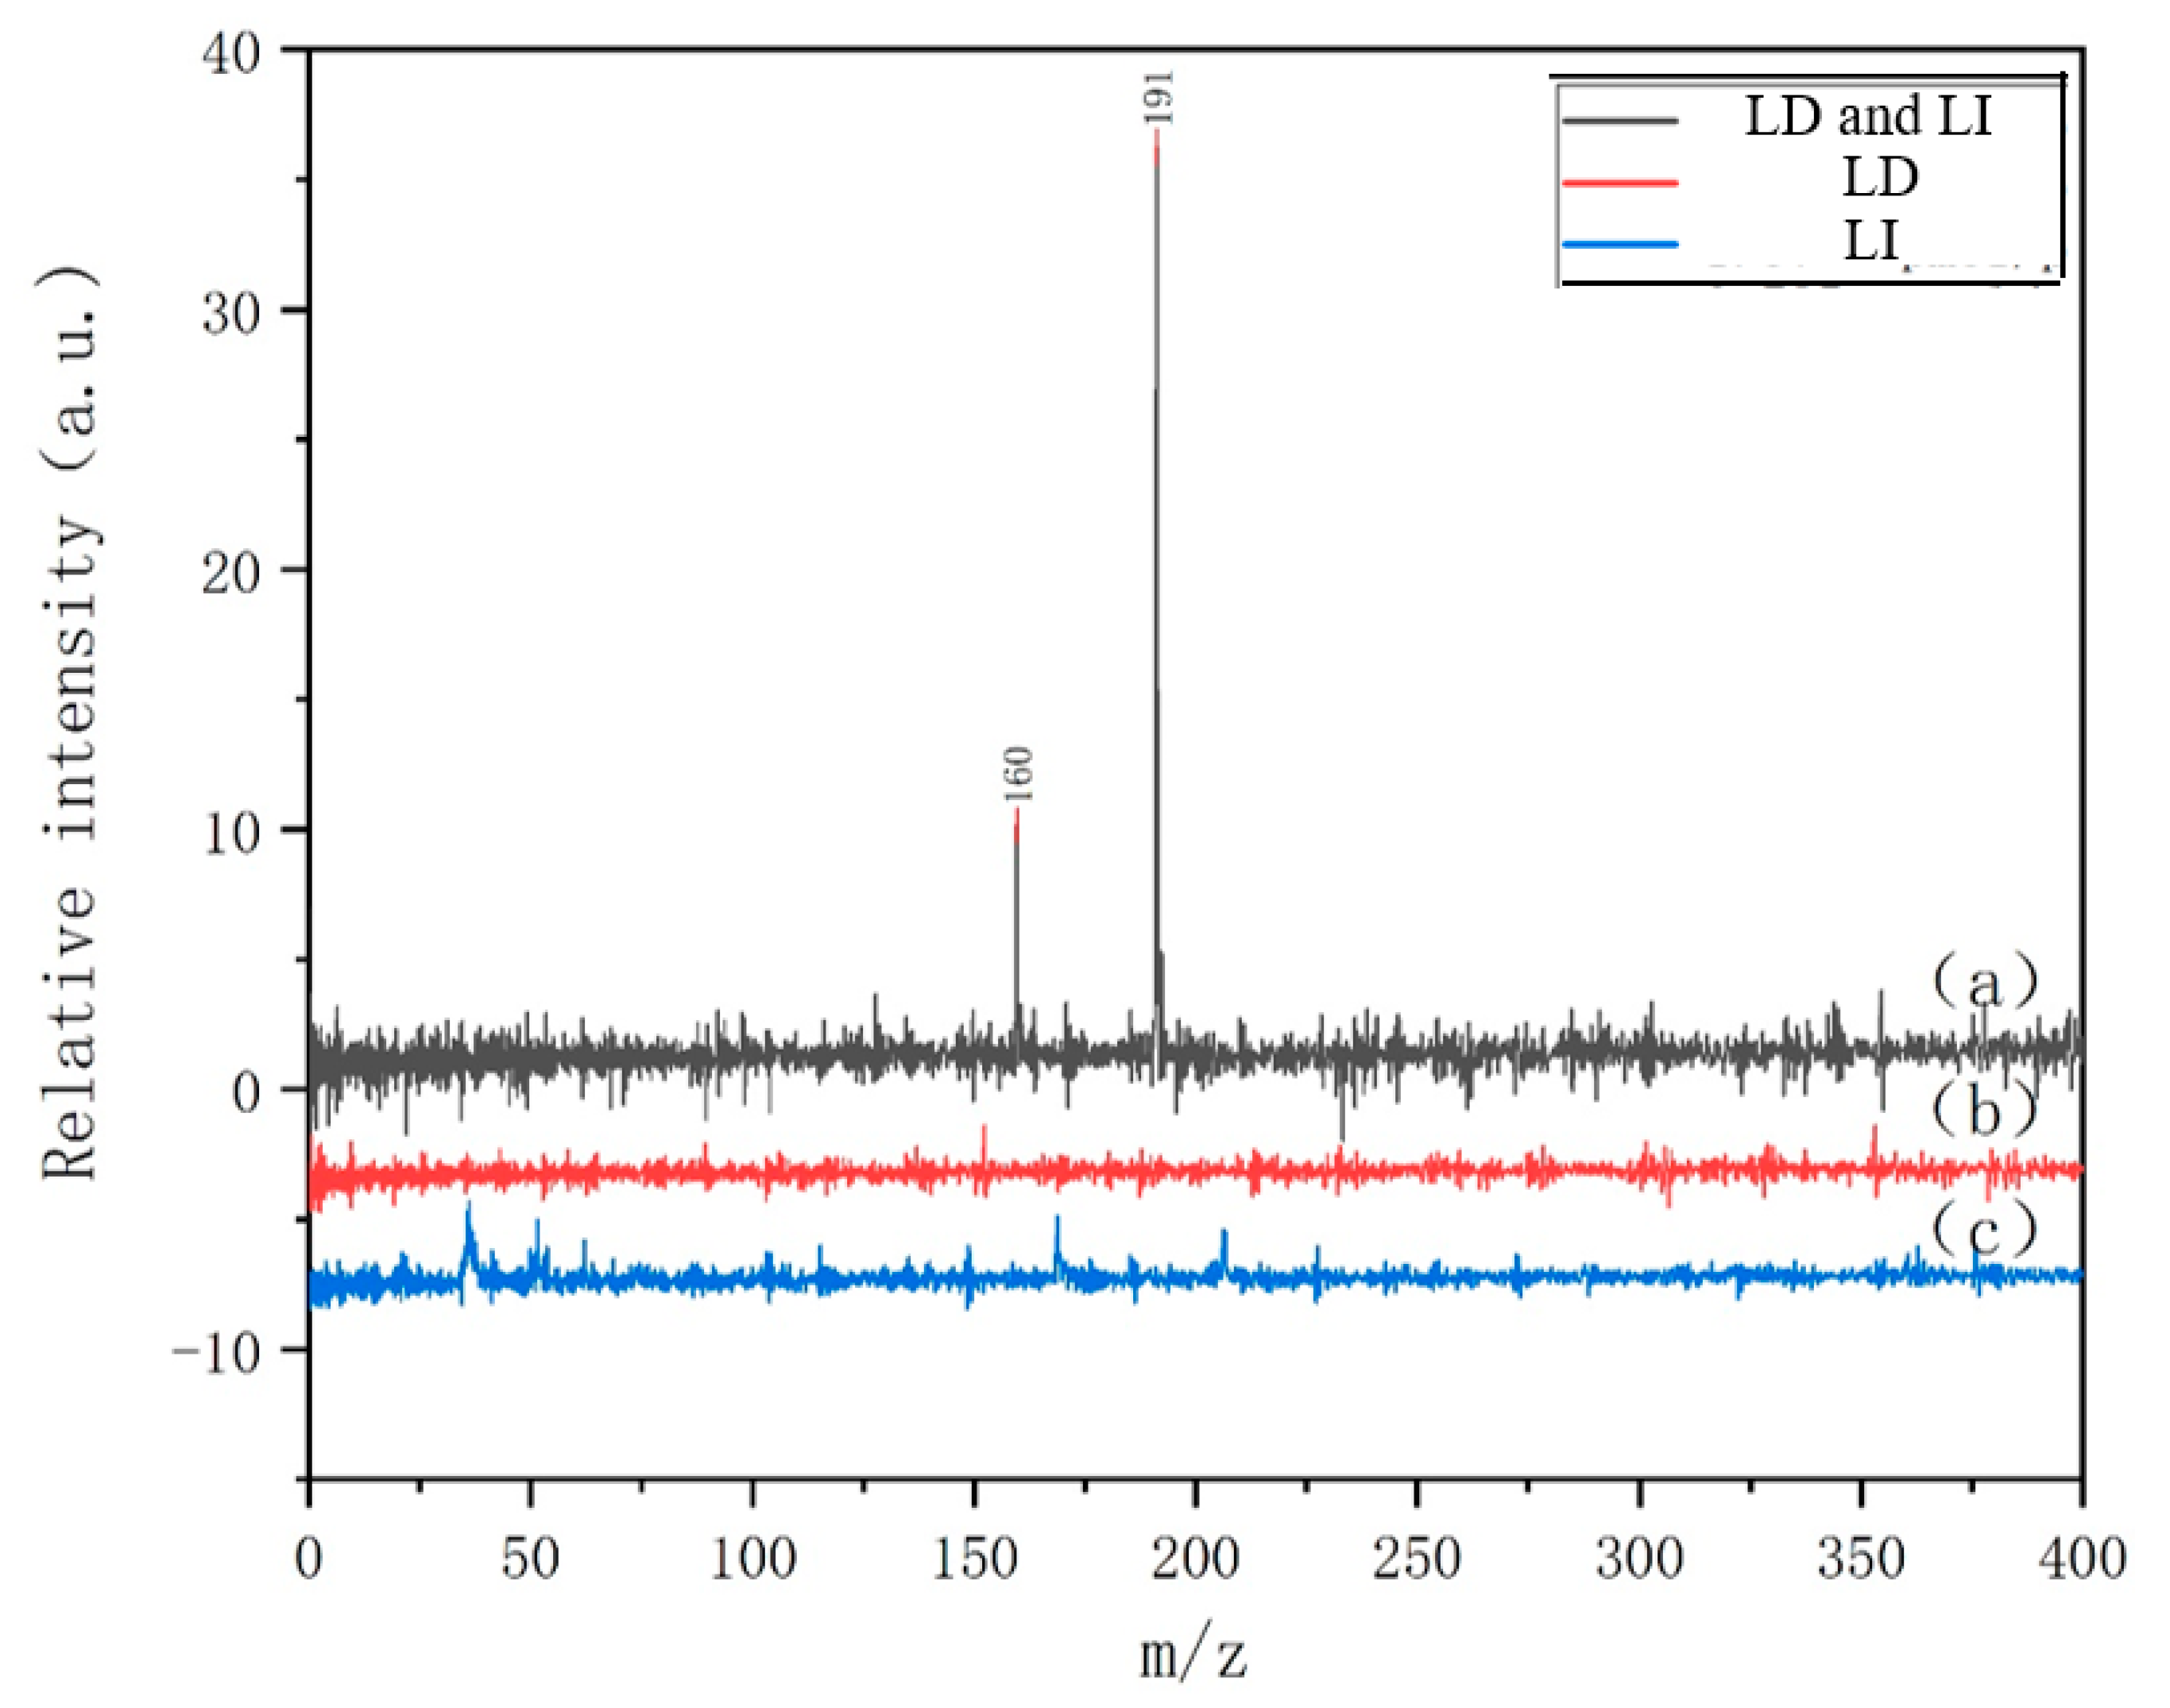
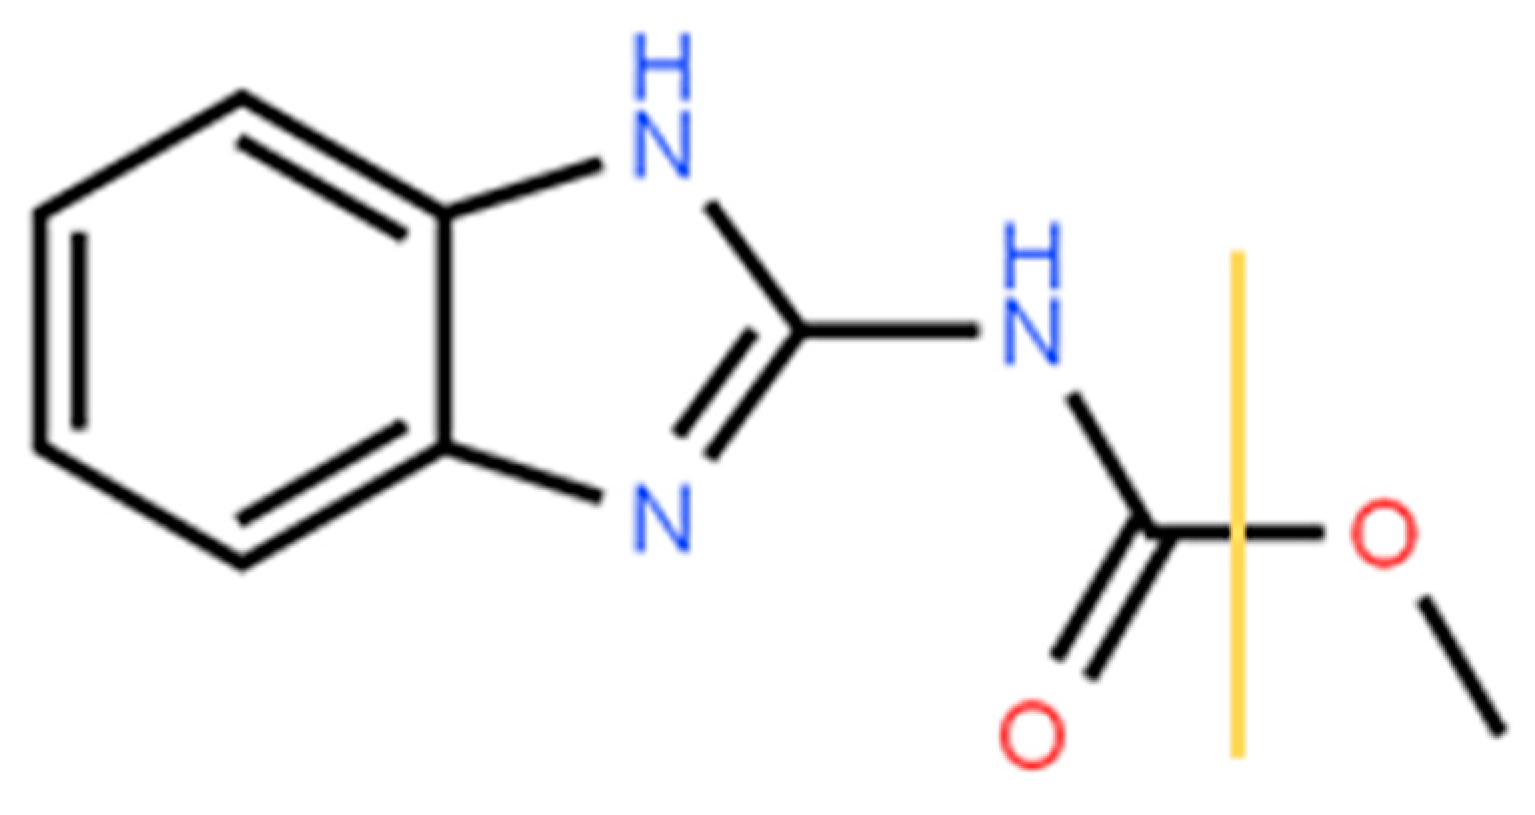
3.1. LDPI-MS Analysis of the Pure Sample of Carbendazim

The experiment first needs to determine the carbendazim LDPI-MS signal, and because the experiment uses a mode of two-beam laser action, it also needs to determine whether this mode will interfere with the quality of the carbendazim spectrum signal.
Figure 3 shows the LDPI-MS of the pure CBZ sample that covered the plate. After irradiation with the 532 nm infrared laser, the CBZ sample was desorbed, and gaseous clusters were formed. Figure 3b,c show no significant MS signals when solely the desorption laser or the ionization laser was used, since their separate application cannot generate a complete mass spectrum; the characteristic peaks of the target molecule can be generated only when both lasers work simultaneously. These gaseous clusters, containing several neutral CBZ molecules, automatically float toward the ionization base and undergo ionization with the 118 nm VUV laser after a delay of approximately 25 μs. The ionized species are then focused, accelerated, repulsed, and deflected by the electric field force before they cross the mass spectrometer’s free-flight tube, and they are ultimately detected by the MCP, producing experimental signals. Here, single-photon ionization using a 118 nm VUV laser was used as a soft ionization process. The experimental requirement for soft ionization is an ionization energy of the substance molecules of less than 10.48 eV. Theoretical calculations and previous experimental studies showed that the ionization energy of CBZ is lower than 10.48 eV, so the selected target pesticide molecules fully met the experimental requirements.
As shown in Figure 3a, two dominant peaks, with relative molecular masses of 191 and 160, appear in the mass spectrum. In order to verify that this mass spectrum is being obtained under the combined action of desorption light and ionization light, we use desorption light and ionization light to perform separate experiments on the sample. Figure 3b,c show the mass spectra under separate photoionization and electron ionization effects, respectively. Figure 3a presents the mass spectrum resulting from the combined action of both laser sources, further indicating that the CBZ mass spectrum cannot be obtained solely by desorption or ionization laser operations. The characteristic signal peaks of the target compound can only be successfully detected when both the desorption laser and ionization laser work together, emphasizing the importance of combined desorption and ionization processes. The peak at m/z 191 is assigned to the CBZ molecular ion with a relative molecular mass of 191 and is referred to as the parent ion peak. The peak at m/z 160 is plausibly attributed to the CBZ fragment ion [C8H6N3O]+, because the desorption ionization stage of molecular clusters is a continuous process in which the internal energy of some molecules continuously increases, leading to fragmentation. The main bond-cleavage types for possible molecular fragmentation are depicted in Figure 4, with the predominant fragment having a relative molecular mass of 160. In subsequent experiments, the fragments at m/z 191 and m/z 160 were taken as the characteristic mass signals of CBZ [44].

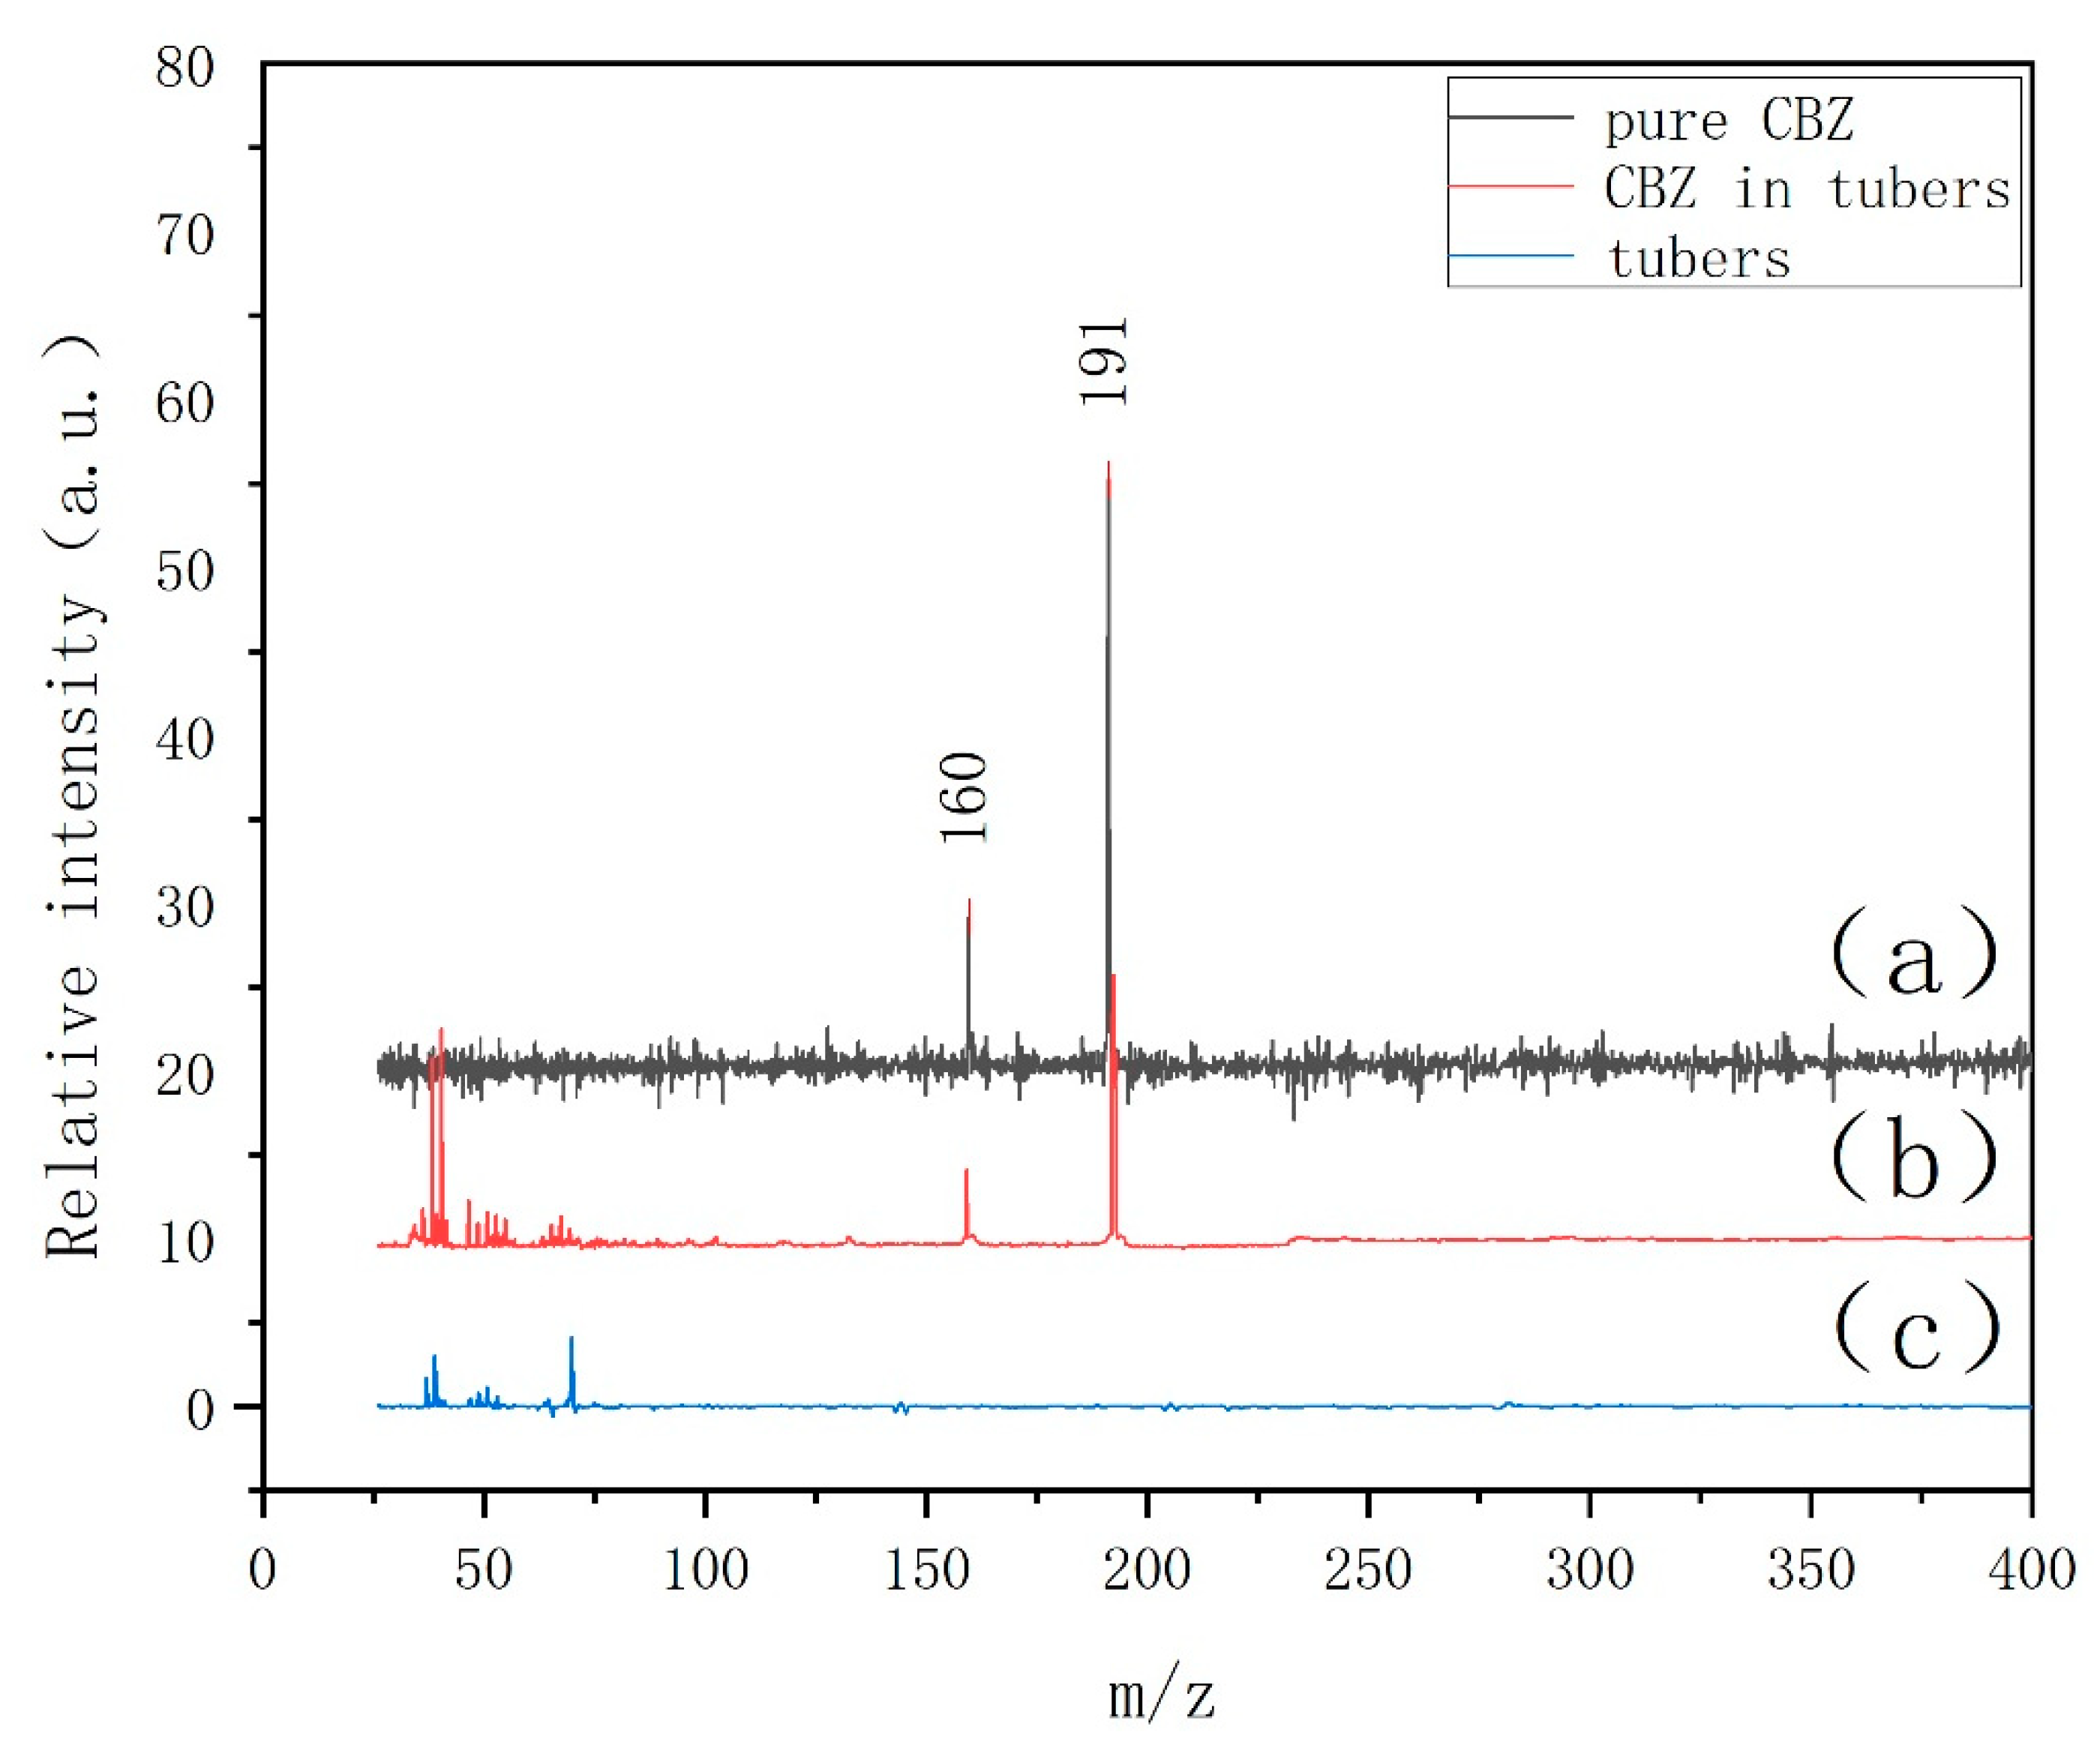
3.2. LDPI-MS Analysis of Carbendazim in Carrot Tissue

To validate the feasibility of the experimental procedure, we conducted a comparative study to verify whether the applied LDPI-MS method can be used to detect CBZ within carrot tuber tissues. Figure 5a,b compare the MS signals of pure CBZ samples and carrot tuber samples after cultivation in CBZ, while Figure 5b,c compare the MS signals of carrot tuber samples after cultivation in CBZ with those of clean carrot tuber samples. These findings demonstrate that the carrot tuber samples cultivated in CBZ exhibit two characteristic peaks, at m/z 191 and m/z 160, well-matching with the mass spectrometry signals of pure CBZ samples. In the low m/z range below 100, we also observe a series of background peaks. Comparing them with the MS data of carrot tuber samples without pesticides, it can be concluded that these peaks could originate from fragments of cellulose, sugars, cellular enzymes, and other molecules in the carrot tubers. Additionally, there are no characteristic MS peaks at m/z 191 or m/z 160 in the carrot samples without CBZ, further confirming that these two peaks are derived from CBZ molecules. Since the MS peaks solely generated by carrot tubers are mainly concentrated below m/z 100, this indicates that the plant background itself does not interfere with the targeted molecule. Furthermore, it is possible to scan the characteristic peaks at m/z 191 and m/z 160 to obtain the desired intensity information for the CBZ molecular signals. These results further validate the applicability of the proposed experimental method for pesticide residue detection on the surface of carrot tubers.

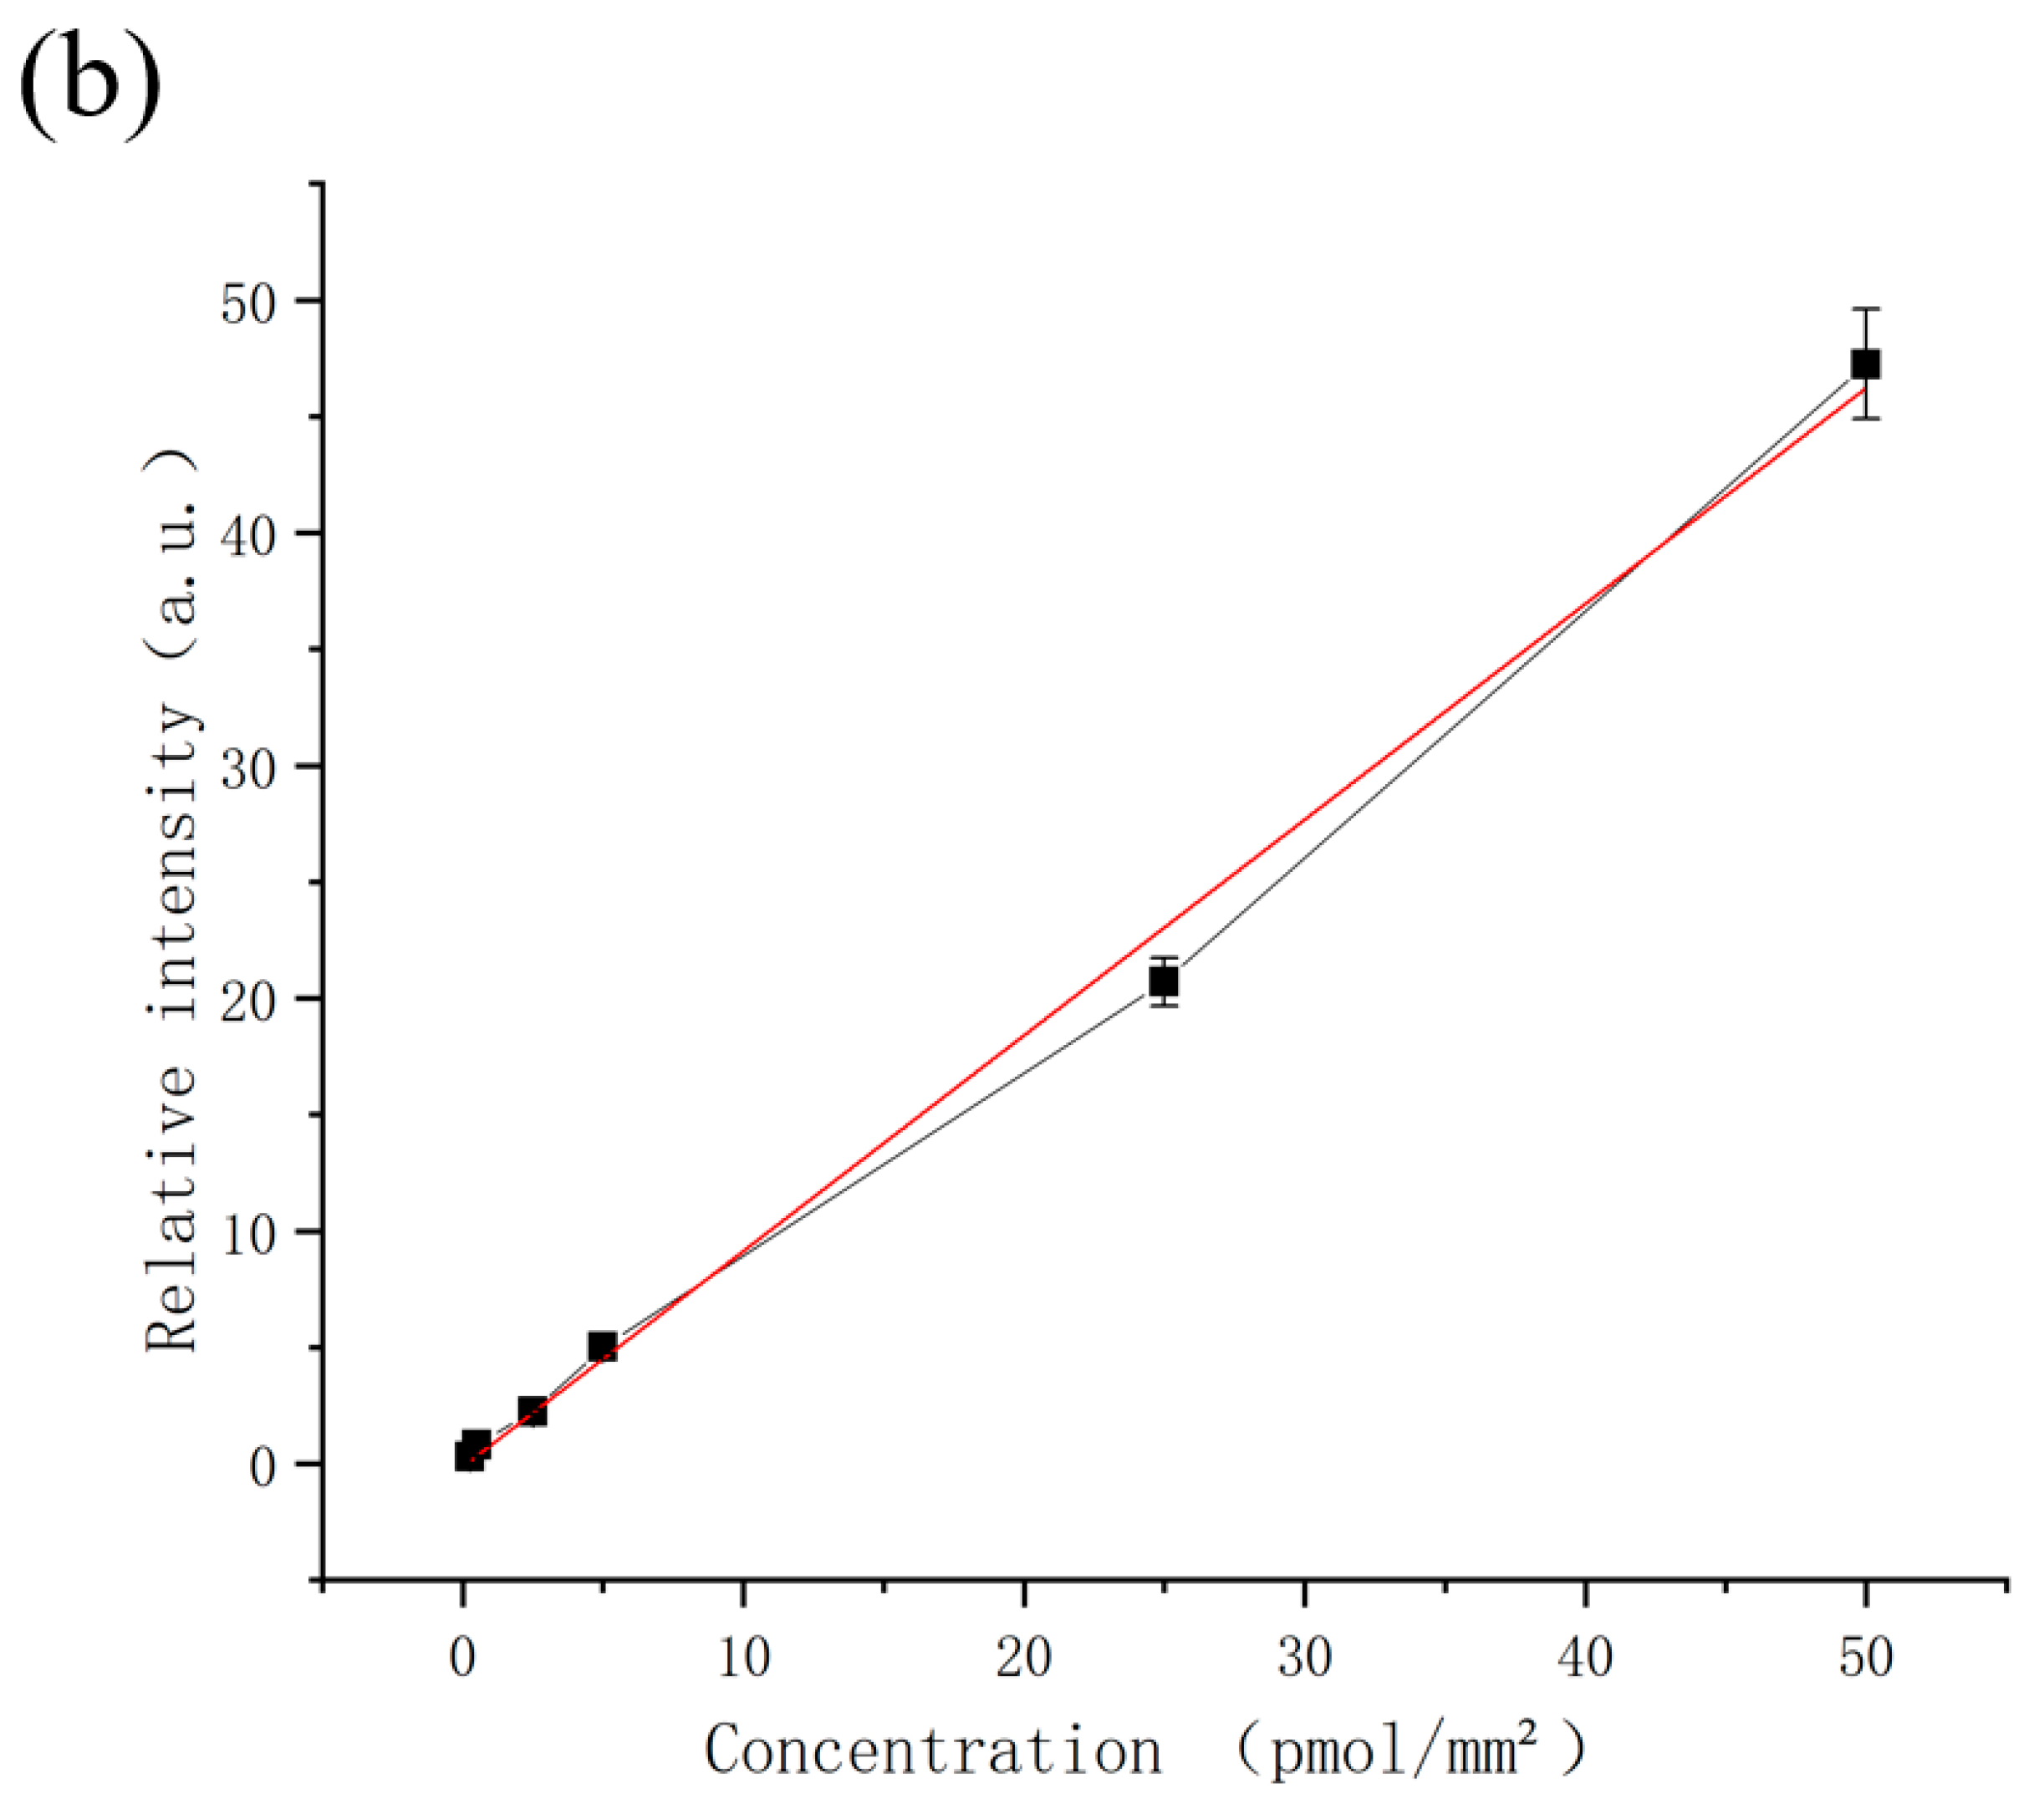
3.3. Signal Linearity and Limit of Detection

Based on the previous assessment, CBZ molecules are ionized through the combined action of two laser beams, so the relevant operating parameters of the two laser beams are directly related to the experimentally obtained MS signal intensity and resolution. There is a trade-off between achieving a desirable sensitivity and achieving a reasonable spectral resolution. We first studied the effects related to the instrument construction, specifically, the spatial distance, Z, between the sample surface and the VUV ionization laser, and the time delay control, T, between the two laser beams. According to previous experimental findings, there is a critical value for the MS resolution, above which the intensity of MS signals may decrease. Therefore, we optimized both the resolution and signal intensity of the mass spectrometer used. To achieve this, we adjusted the time delay, T, between the two laser beams, and the distance, Z, between the entry alumina rod and the VUV ionization laser, and then measured the spatial resolution of the m/z 191 characteristic peak of the MS spectrum. Based on the experimental results shown in Figure 6a, the optimal resolution of the CBZ molecular MS signal is achieved when the time delay between the two laser beams, T, is 25 μs and the distance between the entry alumina rod and the VUV ionization laser, Z, is 2.5 mm. Similarly, the optimal signal intensity of the CBZ molecular mass spectrometry signal is obtained when the time delay between the two laser beams, T, is 22.5 μs and the distance between the entry alumina rod and the VUV ionization laser, Z, is 2.0 mm, as shown in Figure 6b. Considering both factors, we selected the following experimental conditions: a time delay of 22 μs between the two laser beams and a distance of 2.0 mm between the alumina rod and the ionization laser; these achieved an optimal effect of more than 80%.
In this study, the experimental intensity and resolution of the multi-residue signal were also influenced by sample preparation conditions. The concentration of multiple residues, the temperature of the water bath, the frequency of agitation during cultivation, and the thickness of the slices all influenced the detection results. To investigate the effects of sample preparation on CBZ residue detection in carrot tubers, it is necessary to discuss the influence of these factors on final residue distribution during sample cultivation. Table 1 lists the effects of cultivation temperature, agitation frequency during cultivation, and slice thickness during sample preparation on the multi-residue content of the samples. All other experimental conditions remained constant, and the multi-residue content was indicated by a signal intensity at m/z 191. Based on the results in Table 1, the water bath temperature (15–25 °C) exhibits a minor impact on the residual level of multiple residues in the carrot tubers under the selected experimental conditions, with a variation of approximately 5% when the water bath temperature increases. Therefore, a temperature of 20 °C, which closely approximates the temperature at which carrots grow, was chosen as the water bath temperature for the experiment. In terms of agitation frequency, little difference exists between agitation every 5 or every 10 min.; only the presence of agitation has a significant impact, which may be related to the water solubility of multiple residues, since agitation can enhance the adsorption of multiple residues onto the surface of carrot tubers. On the other hand, theoretically, the thickness of slices should be positively correlated with the signal intensity. However, considering the actual laser efficiency, excessively thick slices may result in incomplete sample vaporization, e.g., a thickness of 50 μm leads to difficulties in sample preparation, sample breakage, and issues related to secondary ionization. Considering the above data, the optimal experimental conditions for this experiment were chosen as follows: a thickness of all slices of 100 μm, and all the samples were placed in a water bath at 20 °C, and shaken every 5 min.
To establish a relationship between the MS signal intensity and the actual concentration of CBZ, systematic experiments were performed. Since the signal measurement of CBZ molecules involves absorption from a 532-nm laser, only the content of CBZ molecules at a single point needs to be calculated in the experiment. The sample has an approximately rectangular shape, with dimensions of 20 mm in length and 10 mm in width. The surface concentration of CBZ was calculated by evenly spreading 1 μL of 15.7 pmol/L standard sample solution over an area of approximately 200 mm2. The 532 nm laser was used; it had a diameter of ~200 μm and an area of ~0.314 mm2.
As shown in Figure 7a,b, the CBZ concentration of the sample ranges from 0.25 to 50 nmol/mm2 (0.0785–15.7 pmol/L). The concentration is estimated based on the average value of at least five measurements. The linear regression equation is represented as Y = −0.11811 + 0.92533X, with R2 = 0.99488. Y denotes the electrical signal intensity detected for the m/z 191 target, expressed in millivolts (mV), and X represents the CBZ concentration on the sample slice. The lowest detected CBZ concentration in the present study is 0.157 pmol/mm2, indicating that the LOD (S/N = 3) for residual CBZ in carrot tubers, using this experimental method, reaches 3.14 pmol/sampling point. Herein, the LOD is estimated to be 0.019 ppm. Specific calculations are given in the Supporting Information.

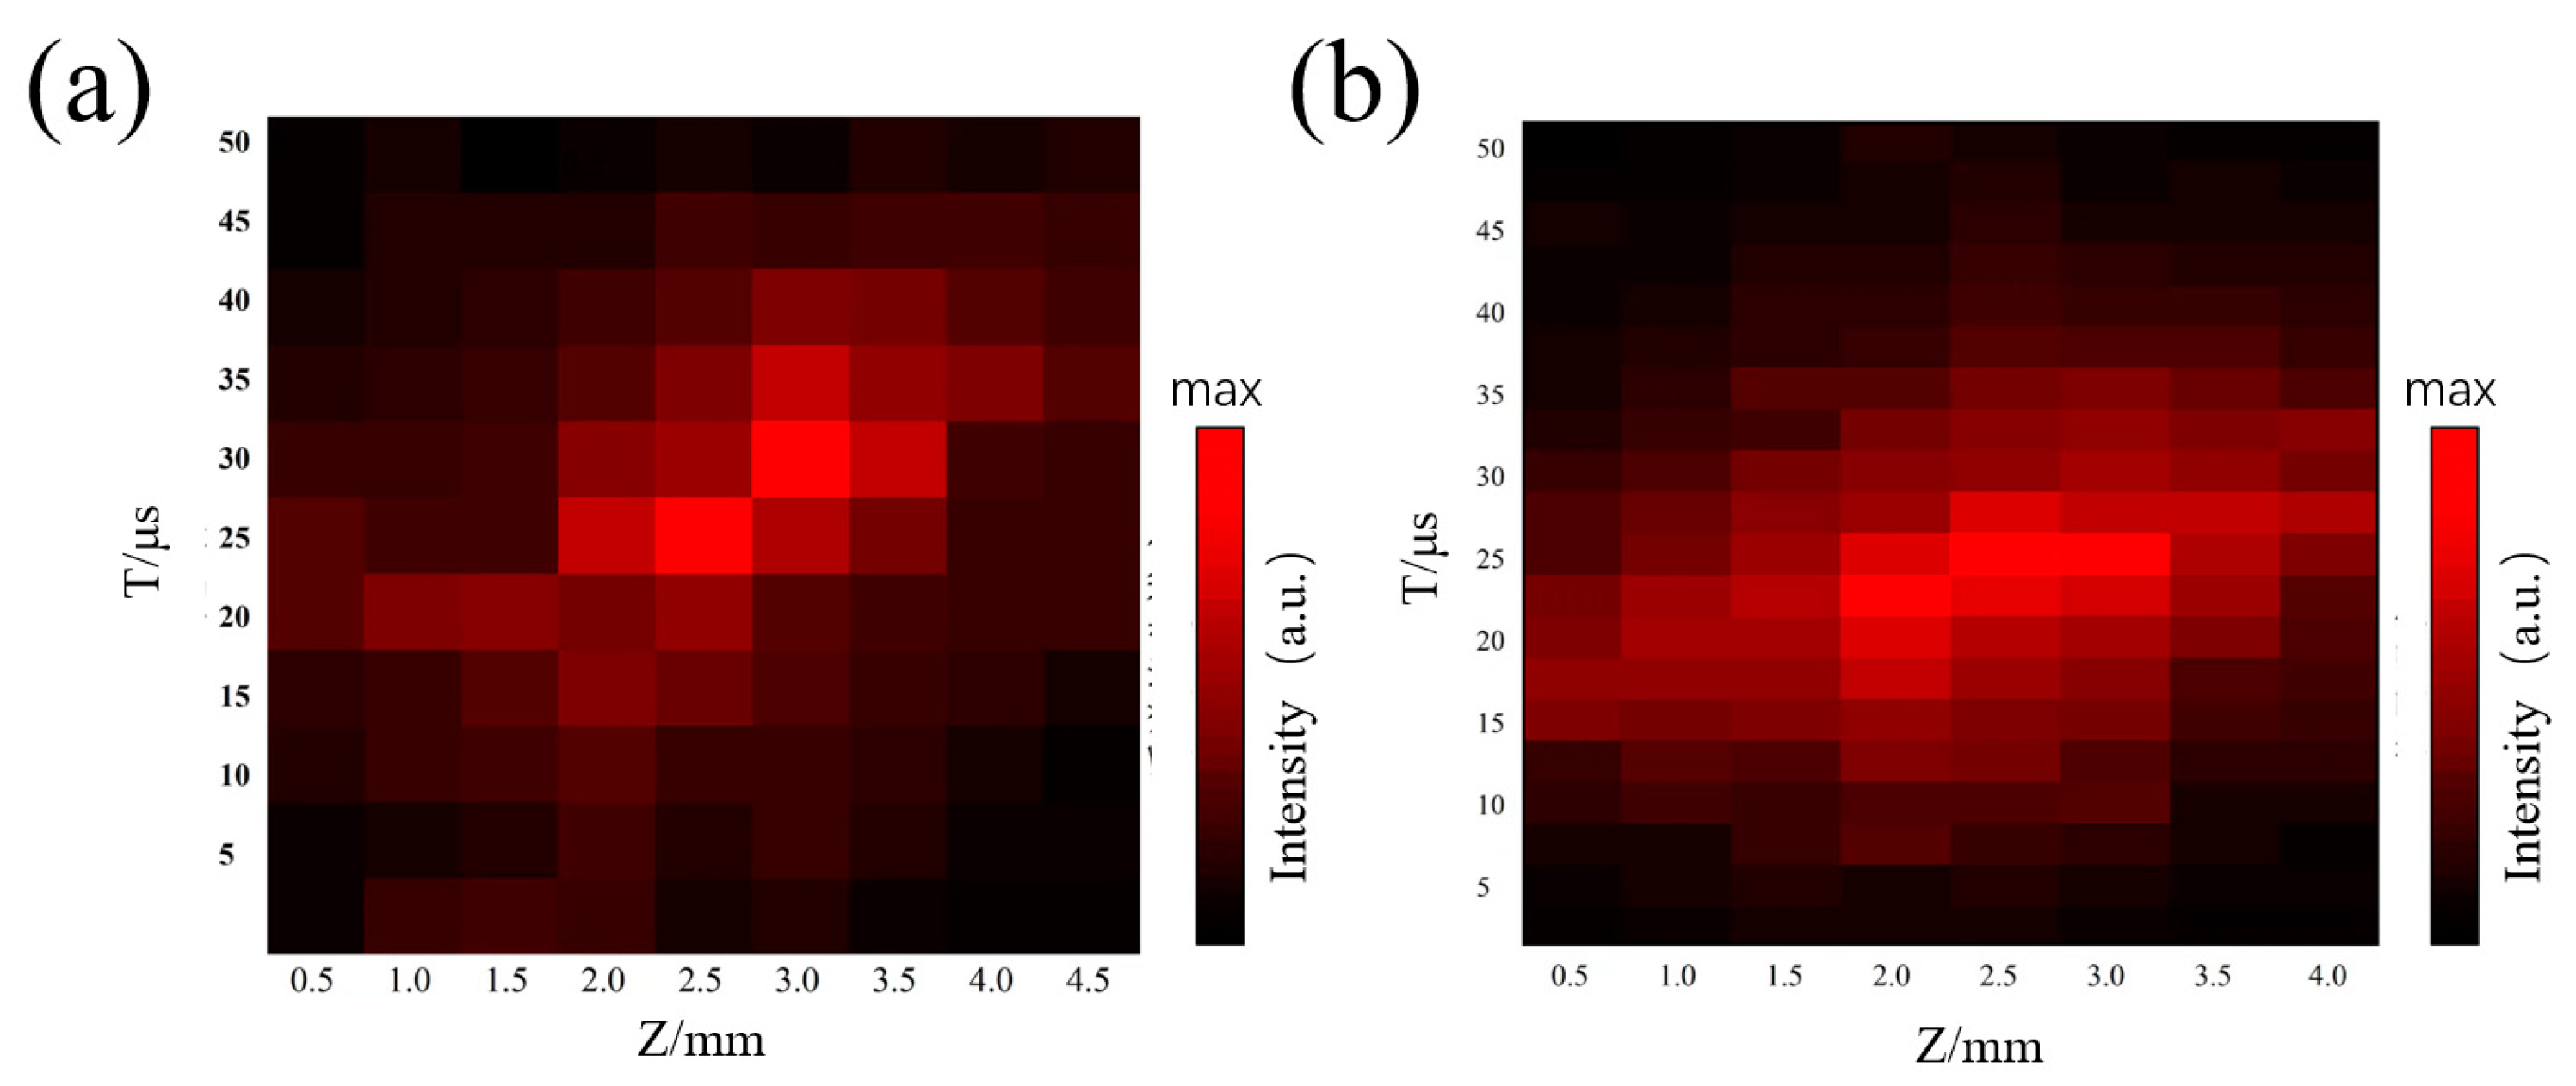
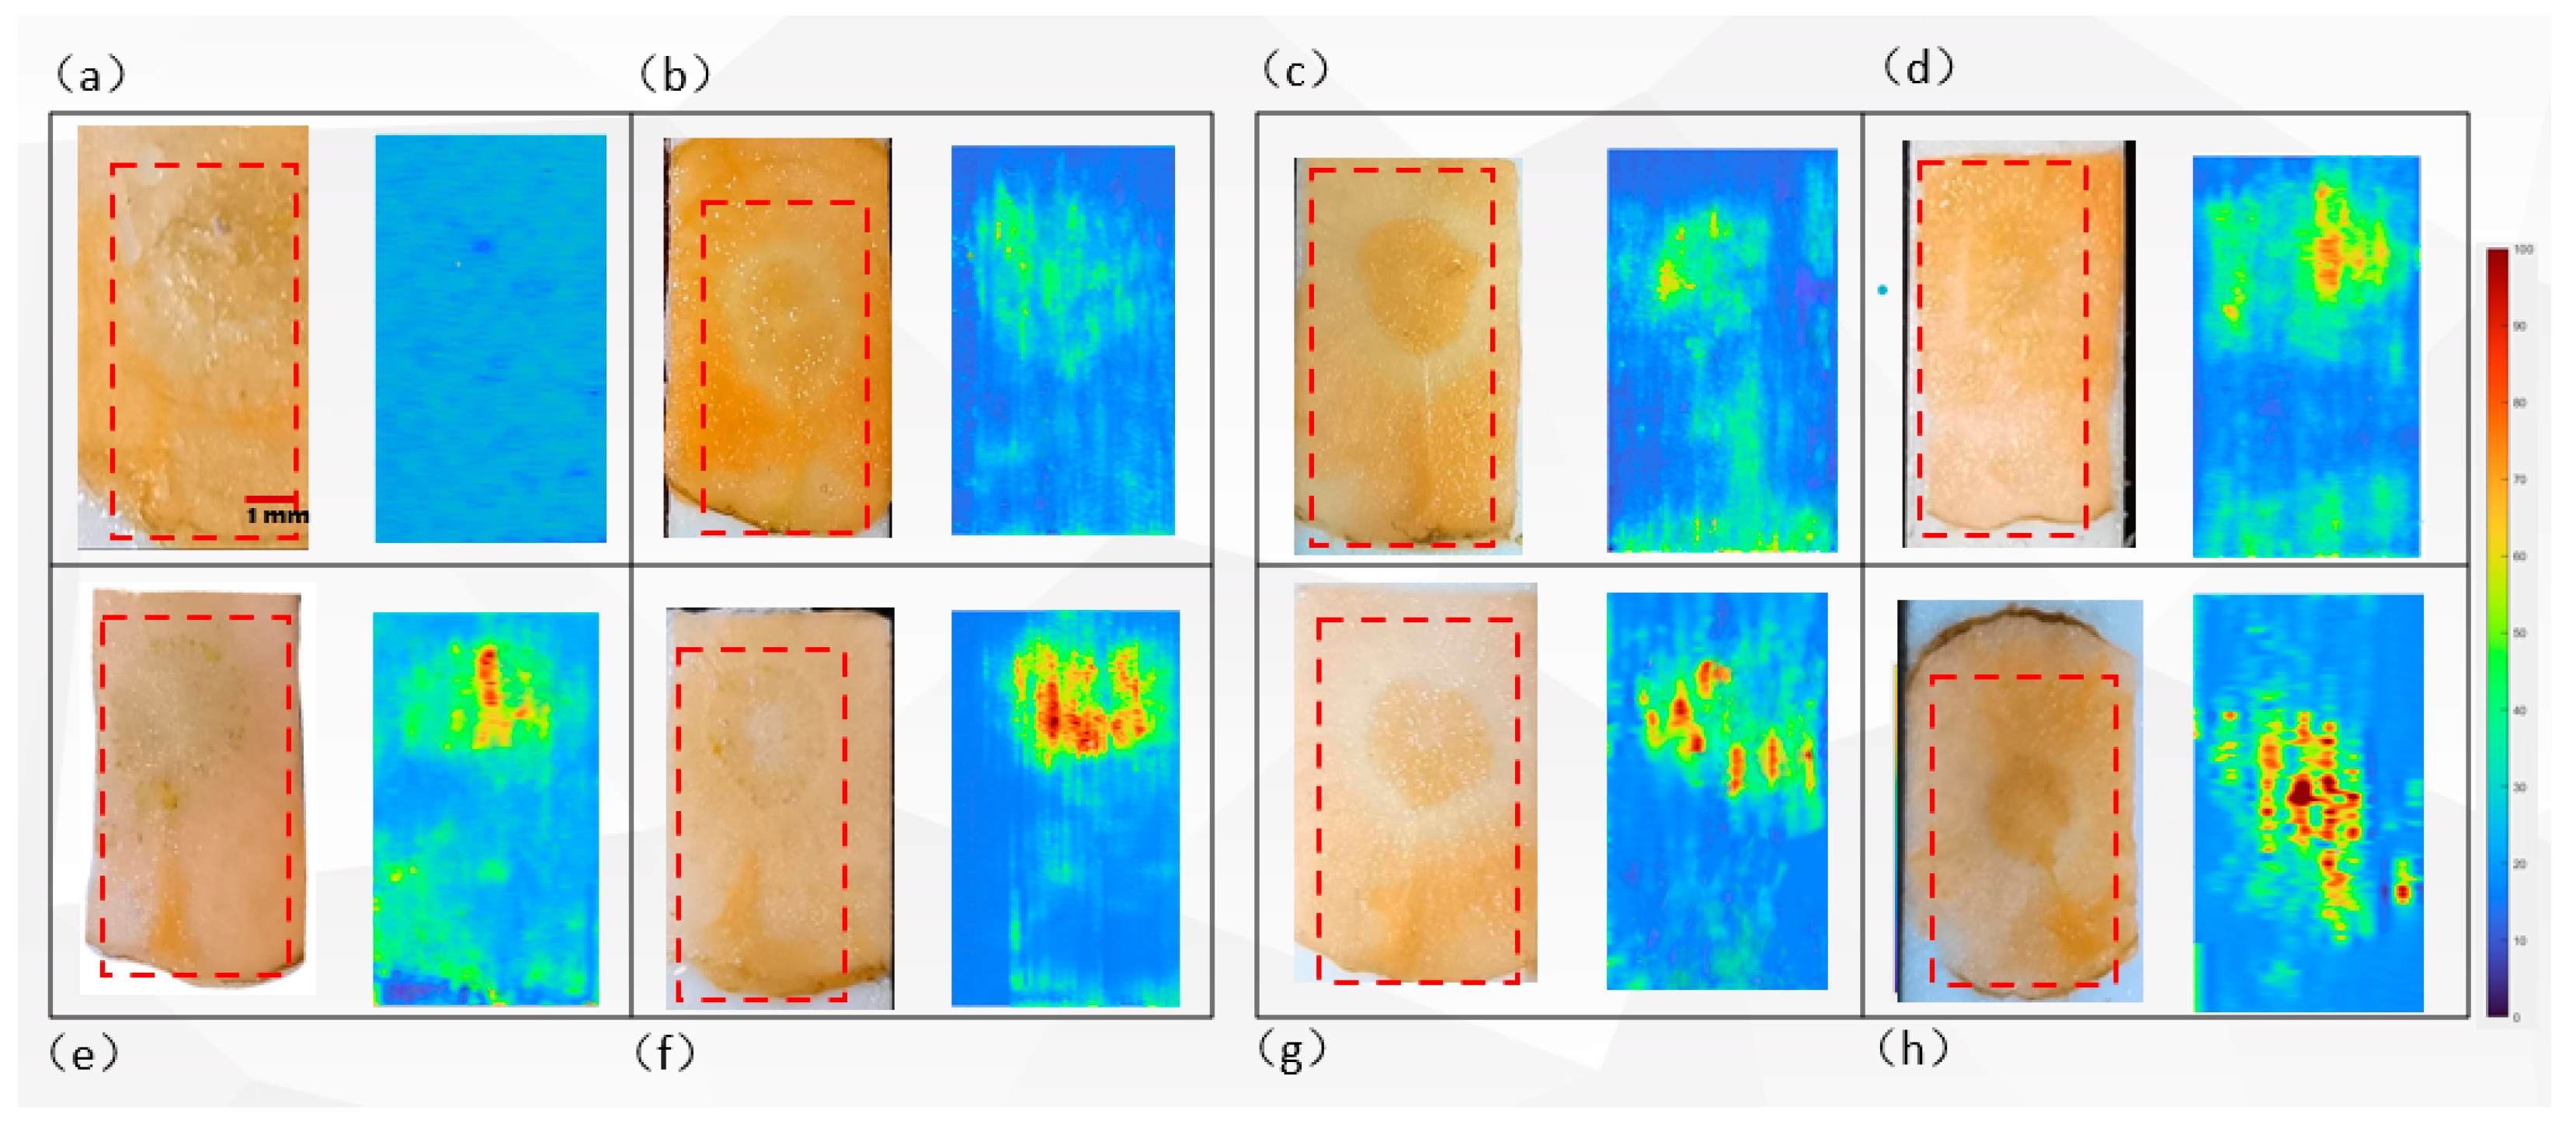
3.4. LDPI-MS Imaging of Carbendazim Residue in Carrot Tubers

In the LDPI-MSI experiments, carrot tuber samples were cultivated underwater, and a section approximately 1 cm from the cross-section was taken for histological LDPI-MSI analyses. Figure 8 shows optical images and LDPI-MSI maps of sample sections treated with a CBZ solution of 15.7 pmol/L for different durations. Based on these images, the dynamic process through which CBZ enters carrot tubers from the solution can be inferred. As illustrated in Figure 8, the left panel shows an optical image of the sectioned sample, in which the structural features of the carrot tuber tissue are well preserved. The red dashed box in Figure 8a represents the sample area scanned by the sample stage in the y-direction. The sample stage moves at a speed of 250 μm/s in the y-direction and in steps of 200 μm in the x-direction. The MS data collected at each corresponding point were used to construct the MS imaging map in Figure 8b through an integrated analysis of peak intensities at specific points. The right panel of Figure 8 shows an MS image of the scanned spectrum of the m/z 191 characteristic peak of CBZ residues in carrot tubers. The blue color represents the background, while different colors in the MS image indicate different levels of CBZ pesticide residues at different positions. The color differences clearly reveal variations in the residue distribution within different tissue regions, showing a strong correlation with the distinct tissue regions observed in Figure 8a. As can be seen from Figure 8b, even if the surface has been cleaned, the content of carbendazim is higher on the surface of the carrot tubers (the bottom edge of the figure), which may be due to the direct contact with the culture medium. A small portion of the CBZ molecules form a close bond with the cortical cells through adsorption and other ways, which is difficult to simply clean. Secondly, less phloem remains. The contamination of the phloem may be due to the absorption of CBZ to the cortex, which is too thin (about 125 μm) to prevent inward diffusion, and carbendazim molecules enter the interior through structures such as vascular bundles. The residues of CBZ in the center of the image were the highest. This may be caused by the continued diffusion of the highly adsorbed CBZ into the internal tissues, and the gradient of CBZ diffusion rate in different tissues is very different. Because CBZ is a weakly lipophilic molecule (log P = 1.52), its diffusion rate in the hydrophilic xylem is much higher than that in the hydrophobic phloem. Most of the CBZ molecules passing through the epidermis are transported rapidly and accumulate in the xylem, and almost no tissue retention occurs in the phloem. This is reflected in all panels of Figure 9.
As seen in Figure 9, a pattern appears between the residue levels of CBZ in carrot tubers and the cultivation time. Obviously, a large amount of CBZ cannot easily penetrate the carrot epidermis, and it accumulates on the outer surface of the epidermis, and can be removed by washing with water. The removal of leaves has inhibited the transpiration process of the carrots, and the entry of CBZ is most likely related to the permeability of the epidermis. As the cultivation time increased, a small amount of CBZ entered and aggregated in the central xylem of the cross-section, while CBZ remained scarce in the cambium layer between the epidermis and xylem. This difference may be attributed to differences in hydrophobicity among different tissues in carrot tubers [45]. More in-depth structural information is required to reveal the affinity of CBZ to different tissues in plant bodies [46]. This may involve research on the binding mode of CBZ molecules with tissue cells, physicochemical properties, and molecular dynamics to provide a deeper understanding of the plant’s interaction with CBZ.

4. Conclusions

This study reported the application of LDPI-MS (Laser Desorption Ionization Mass Spectrometry) for in situ detection of CBZ pesticide residues in carrot tubers. The method offered several advantages, such as simplified sample preparation, minimal matrix interference, and rapid and convenient analysis, having a particular advantage in detecting both endogenous and exogenous compounds, particularly small molecules. The LOD of the present method reached 0.019 ppm. The LDPI-MS imaging results demonstrated viable visual differentiation of the levels of CBZ residues using distinct colors, effectively providing in situ molecular information on pesticide absorption within the tissues. The distribution of CBZ in carrot tubers was closely related to the tissue structure and morphology of carrot itself. Most CBZ molecules could not penetrate the epidermis of carrot, and mainly accumulated on the outer surface of the epidermis after washing. Since the leaves of the carrot were removed in the experiment, the transpiration of the carrot was inhibited, so the entry of CBZ is likely related to the permeability of the epidermis. With prolonged culturing time, we found that small amounts of CBZ molecules were able to enter and accumulate in the central xylem of the cross section, while relatively small amounts of CBZ were present in the cambium between the epidermis and the xylem. This difference in distribution may be related to differences in hydrophobicity among different tissues in carrot tubers. Furthermore, by analyzing images at different stages of slicing, dynamic information regarding the distribution of drug molecules within tissues was obtained, supporting theoretical investigations of exogenous drug metabolism. Clearly, LDPI-MS can be considered an effective and promising method, providing significant insight into plant metabolomics and pesticide residue analysis.
Compared with traditional MSI, LDPI-MSI greatly improves the sensitivity of the analysis through postionization technology and can detect more molecules that are not ionized under conventional conditions. It is particularly suitable for applications that require high sensitivity and rapid spatial imaging of small-molecule compounds, such as determining the distribution of functional molecules in cell tissues and the distribution of drugs in organisms. Despite multiple advantages offered by this technique, laboratory equipment used in our experiments currently exhibits a lower imaging resolution, compared to existing commercial devices. Additionally, the analysis of experimental data has yet to be refined to the level of absolute quantification. However, the integration of novel machine-learning techniques has the potential to overcome these challenges. Addressing these limitations would further enhance the application spectrum of LDPI-MS and contribute to its advancement in the fields of plant metabolomics and pesticide residue analysis.

Supplementary Materials

The following supporting information can be downloaded at: https://www.mdpi.com/article/10.3390/app14135431/s1, Figure S1: The schematic diagram of ion lens of time-of-flight mass spectrometer in this experiment; Figure S2: The time-of-flight mass spectrometer in this experiment; Figure S3: Spatial distribution of carbendazim dominate ion at m/z 160. The MSI data of this image and Figure 7b were obtained at the same time; Figure S4: Comparison of carrot sample LDPI-MS with or without carbendazim residue; Figure S5: Mass spectrum of Carbendazim by ESI-MS and carbendazim possible fragmentation pathways in LDPI-MS; Table S1: Effect of delay T between two laser beams and distance Z between the sample surface and ionization laser on mass spectrometry resolution; Table S2: Effect of delay T between two laser beams and distance Z between the sample surface and ionization laser on mass spectrometry peak relative intensity.

Author Contributions

Experiment, T.W.; data processing, T.W. and H.Z.; funding acquisition, project administration, resources, review and editing, Y.H. All authors have read and agreed to the published version of the manuscript.

Funding

This work was supported by the Guangdong Basic and Applied Basic Research Foundation (2020A1515110243, 2021A1515012344).

Institutional Review Board Statement

Not applicable.

Informed Consent Statement

Not applicable.

Data Availability Statement

The original contributions presented in the study are included in the article/Supplementary Material, further inquiries can be directed to the corresponding author.

Conflicts of Interest

The authors declare no conflicts of interest.

References

  1. Rozell, D. Using population projections in climate change analysis. Clim. Chang. 2017, 142, 521–529. [Google Scholar] [CrossRef]
  2. Zhang, J.J.; Yang, H. Metabolism and detoxification of pesticides in plants. Sci. Total Environ. 2021, 790, 148034. [Google Scholar] [CrossRef] [PubMed]
  3. Ucker, F.E.; Kalaoun, T.C.; Matias, R.K.; Gerônimo, F.H.C.; Ucker, L.C.F.; Silva, D.L. Consequences of Excessive Application of Pesticides and Impacts on the Environment and Human Healt. Int. J. Adv. Eng. Res. Sci. 2023, 10, 39–50. [Google Scholar] [CrossRef]
  4. Chakwiya, A.; Van der Linde, E.J.; Korsten, L. In vitro sensitivity testing of Cladobotryum mycophilum to carbendazim and prochloraz manganese. S. Afr. J. Sci. 2015, 111, 7. [Google Scholar] [CrossRef]
  5. Brauer, V.S.; Rezende, C.P.; Pessoni, A.M.; De Paula, R.G.; Rangappa, K.S.; Nayaka, S.C.; Gupta, V.K.; Almeida, F. Antifungal Agents in Agriculture: Friends and Foes of Public Health. Biomolecules 2019, 9, 521. [Google Scholar] [CrossRef] [PubMed]
  6. Ben Mordechay, E.; Mordehay, V.; Tarchitzky, J.; Chefetz, B. Fate of contaminants of emerging concern in the reclaimed wastewater-soil-plant continuum. Sci. Total Environ. 2022, 822, 153574. [Google Scholar] [CrossRef]
  7. Zhou, T.; Guo, T.; Wang, Y.; Wang, A.; Zhang, M. Carbendazim: Ecological risks, toxicities, degradation pathways and potential risks to human health. Chemosphere 2023, 314, 137723. [Google Scholar] [CrossRef]
  8. Martins, T.S.; Machado, S.A.S.; Oliveira, O.N.; Bott-Neto, J.L. Optimized paper-based electrochemical sensors treated in acidic media to detect carbendazim on the skin of apple and cabbage. Food Chem. 2023, 410, 135429. [Google Scholar] [CrossRef]
  9. Watanabe, E.; Kobara, Y.; Yogo, Y. Rapid and Simple Analysis of Pesticides Persisting on Green Pepper Surfaces Swabbing with Solvent-Moistened Cotton. J. Agric. Food Chem. 2012, 60, 9000–9005. [Google Scholar] [CrossRef]
  10. Michalik, B.; Simon, P.W.; Gabelman, W.H. Assessing Susceptibility of Carrot Roots to Bacterial Soft Rot. HortScience 1992, 27, 1020–1022. [Google Scholar] [CrossRef]
  11. da Silva, C.L.; de Lima, E.C.; Tavares, M.F.M. Investigation of preconcentration strategies for the trace analysis of multi-residue pesticides in real samples by capillary electrophoresis. J. Chromatogr. A 2003, 1014, 109–116. [Google Scholar] [CrossRef]
  12. Zhou, L.; Jiang, Y.; Lin, Q.; Wang, X.; Zhang, X.; Xu, J.; Chen, Z. Residue transfer and risk assessment of carbendazim in tea. J. Sci. Food Agric. 2018, 98, 5329–5334. [Google Scholar] [CrossRef]
  13. Singh, S.; Singh, N.; Kumar, V.; Datta, S.; Wani, A.B.; Singh, D.; Singh, K.; Singh, J. Toxicity, monitoring and biodegradation of the fungicide carbendazim. Environ. Chem. Lett. 2016, 14, 317–329. [Google Scholar] [CrossRef]
  14. Crapnell, R.D.; Adarakatti, P.S.; Banks, C.E. Electroanalytical overview: The sensing of carbendazim. Anal. Methods 2023, 15, 4811–4826. [Google Scholar] [CrossRef]
  15. Suresh, I.; Selvaraj, S.; Nesakumar, N.; Rayappan, J.B.B.; Kulandaiswamy, A.J. Nanomaterials based non-enzymatic electrochemical and optical sensors for the detection of carbendazim: A review. Trends Environ. Anal. Chem. 2021, 31, e00137. [Google Scholar] [CrossRef]
  16. Wang, S.-Y.; Shi, X.-C.; Liu, F.-Q.; Laborda, P. Chromatographic Methods for Detection and Quantification of Carbendazim in Food. J. Agric. Food Chem. 2020, 68, 11880–11894. [Google Scholar] [CrossRef]
  17. Khosropour, H.; Keramat, M.; Laiwattanapaisal, W. A dual action electrochemical molecularly imprinted aptasensor for ultra-trace detection of carbendazim. Biosens. Bioelectron. 2024, 243, 115754. [Google Scholar] [CrossRef]
  18. Peacock, P.M.; Zhang, W.-J.; Trimpin, S. Advances in Ionization for Mass Spectrometry. Anal. Chem. 2016, 89, 372–388. [Google Scholar] [CrossRef]
  19. Fan, J.; Ma, W.; Yu, Y.; Li, Y.; Nie, Z. Recent advances in entirely hand-held ionization sources for mass spectrometry. Anal. Bioanal. Chem. 2023, 416, 2057–2063. [Google Scholar] [CrossRef] [PubMed]
  20. Luo, J.H. Basic principle from electrospray ionization to soft ionization mass spectrometry and development of ion source. ChemRxiv 2022, 10, 2432–2434. [Google Scholar] [CrossRef]
  21. OMirgorodskaya, O.A.; Shevchenko, A.A.; Chernushevich, I.V.; Dodonov, A.F.; Miroshnikov, A.I. Electrospray-ionization-time-of-flight-mass-spectrometry-in-protein-chemistry. Anal. Chem. 2002, 66, 99–107. [Google Scholar] [CrossRef]
  22. Wang, C.; Qin, L.-Y.; Li, D.-M.; Hu, L.-G.; Xue, J.-J.; Zhai, X.-P.; Wang, Q.; Guo, L.; Tang, L.; Xie, J.-W. Doped nanomaterial facilitates 3D printing target plate for rapid detection of alkaloids in laser desorption/ionization mass spectrometry. Anal. Bioanal. Chem. 2023, 415, 6825–6838. [Google Scholar] [CrossRef]
  23. Yang, Z.; Chang, Z.; Deng, K.; Gu, J.; Wu, Y.; Sun, Q.; Luo, Q. Reactive Matrices for MALDI-MS of Cholesterol. Anal. Chem. 2023, 95, 16786–16790. [Google Scholar] [CrossRef]
  24. Drzeżdżon, J.; Jacewicz, D.; Sielicka, A.; Chmurzyński, L. MALDI-MS for polymer characterization—Recent developments and future prospects. TrAC Trends Anal. Chem. 2019, 115, 121–128. [Google Scholar] [CrossRef]
  25. Xiang, L.; Wang, F.; Bian, Y.; Harindintwali, J.D.; Wang, Z.; Wang, Y.; Dong, J.; Chen, H.; Schaeffer, A.; Jiang, X.; et al. Visualizing the Distribution of Phthalate Esters and Plant Metabolites in Carrot by Matrix-Assisted Laser Desorption/Ionization Imaging Mass Spectrometry. J. Agric. Food Chem. 2022, 70, 15311–15320. [Google Scholar] [CrossRef]
  26. Lu, Q.; Xu, Z.; You, X.; Ma, S.; Zenobi, R. Atmospheric Pressure Mass Spectrometry Imaging Using Laser Ablation, Followed by Dielectric Barrier Discharge Ionization. Anal. Chem. 2021, 93, 6232–6238. [Google Scholar] [CrossRef]
  27. Shariatgorji, M.; Källback, P.; Gustavsson, L.; Schintu, N.; Svenningsson, P.; Goodwin, R.J.A.; Andren, P.E. Controlled-pH Tissue Cleanup Protocol for Signal Enhancement of Small Molecule Drugs Analyzed by MALDI-MS Imaging. Anal. Chem. 2012, 84, 4603–4607. [Google Scholar] [CrossRef]
  28. Wang, P.; Giese, R.W. Recommendations for quantitative analysis of small molecules by matrix-assisted laser desorption ionization mass spectrometry. J. Chromatogr. A 2017, 1486, 35–41. [Google Scholar] [CrossRef]
  29. Peterson, D.S. Matrix-free methods for laser desorption/ionization mass spectrometry. Mass Spectrom. Rev. 2006, 26, 19–34. [Google Scholar] [CrossRef]
  30. Li, X.; Hang, L.; Wang, T.; Leng, Y.; Zhang, H.; Meng, Y.; Yin, Z.; Hang, W. Nanoscale Three-Dimensional Imaging of Drug Distributions in Single Cells via Laser Desorption Post-Ionization Mass Spectrometry. J. Am. Chem. Soc. 2021, 143, 21648–21656. [Google Scholar] [CrossRef] [PubMed]
  31. Trevor, J.L.; Lykke, K.R.; Pellin, M.J.; Hanley, L. Two-Laser Mass Spectrometry of Thiolate, Disulfide, and Sulfide Self-Assembled Monolayers. Langmuir 1998, 14, 1664–1673. [Google Scholar] [CrossRef]
  32. Cui, Y.; Veryovkin, I.V.; Majeski, M.W.; Cavazos, D.R.; Hanley, L. High Lateral Resolution vs Molecular Preservation in near-IR fs-Laser Desorption Postionization Mass Spectrometry. Anal. Chem. 2014, 87, 367–371. [Google Scholar] [CrossRef]
  33. Soltwisch, J.; Kettling, H.; VENS-Cappell, S.; Wiegelmann, M.; Muthing, J.; Dreisewerd, K. Mass spectrometry imaging with laser-induced postionization. Science 2015, 348, 211–215. [Google Scholar] [CrossRef]
  34. Gasper, G.L.; Takahashi, L.K.; Zhou, J.; Ahmed, M.; Moore, J.F.; Hanley, L. Laser Desorption Postionization Mass Spectrometry of Antibiotic-Treated Bacterial Biofilms Using Tunable Vacuum Ultraviolet Radiation. Anal. Chem. 2010, 82, 7422–7478. [Google Scholar] [CrossRef]
  35. Soltwisch, J. Mass spectrometry imaging with MALDI-2. Nat. Methods 2015, 12, 387. [Google Scholar] [CrossRef]
  36. Akhmetov, A.; Moore, J.F.; Gasper, G.L.; Koin, P.J.; Hanley, L. Laser desorption postionization for imaging MS of biological material. J. Mass Spectrom. 2010, 45, 137–145. [Google Scholar] [CrossRef]
  37. Holbrook, J.H.; Kemper, G.; Hummon, A. Quantitative Mass Spectrometry Imaging: Therapeutics & Biomolecules. Chem. Commun. 2024, 60, 2137–2151. [Google Scholar] [CrossRef]
  38. Lu, Q.; Hu, Y.; Chen, J.; Jin, S. Laser Desorption Postionization Mass Spectrometry Imaging of Folic Acid Molecules in Tumor Tissue. Anal. Chem. 2017, 89, 8238–8243. [Google Scholar] [CrossRef]
  39. Nie, W.; Lu, Q.; Hu, T.; Xie, M.; Hu, Y. Visualizing the distribution of curcumin in the root of Curcuma longa via VUV-postionization mass spectrometric imaging. Analyst 2022, 148, 175–181. [Google Scholar] [CrossRef] [PubMed]
  40. Hanley, L.; Zimmermann, R. Light and Molecular Ions: The Emergence of Vacuum UV Single-Photon Ionization in MS. Anal. Chem. 2009, 11, 4174–4182. [Google Scholar] [CrossRef] [PubMed]
  41. Que, F.; Wang, G.-L.; Feng, K.; Xu, Z.-S.; Wang, F.; Xiong, A.-S. Hypoxia enhances lignification and affects the anatomical structure in hydroponic cultivation of carrot taproot. Plant Cell Rep. 2018, 37, 1021–1032. [Google Scholar] [CrossRef]
  42. Panadés, R.; Ibarz, A.; Esplugas, S. Photodecomposition of carbendazim in aqueous solutions. Water Res. 2000, 34, 2951–2954. [Google Scholar] [CrossRef]
  43. Dettenmaier, E.M.; Doucette, W.J.; Bugbee, B. Chemical Hydrophobicity and Uptake by Plant Roots. Environ. Sci. Technol. 2009, 43, 324–329. [Google Scholar] [CrossRef]
  44. Ahn, S.; Lee, J.-Y.; Kim, B. Accurate Determination of Carbaryl, Carbofuran and Carbendazim in Vegetables by Isotope Dilution Liquid Chromatography/Tandem Mass Spectrometry. Chromatographia 2020, 84, 27–35. [Google Scholar] [CrossRef]
  45. Roman, M.; Dobrowolski, J.C.; Baranska, M.; Baranski, R. Spectroscopic Studies on Bioactive Polyacetylenes and Other Plant Components in Wild Carrot Root. J. Nat. Prod. 2011, 74, 1757–1763. [Google Scholar] [CrossRef] [PubMed]
  46. Létondor, C.; Pascal-Lorber, S.; Laurent, F. Uptake and distribution of chlordecone in radish: Different contamination routes in edible roots. Chemosphere 2015, 118, 20–28. [Google Scholar] [CrossRef] [PubMed]
Figure 1. Schematic drawing of the LDPI-MSI system. Schematic diagram of the laser desorption postionization mass spectrometer imaging apparatus and the sample held with an X-Y-Z stage. The right panel represents the sample chamber.
Applsci 14 05431 g001
Figure 2. Experimental flow chart of mass spectrometry imaging of pesticide residues.
Applsci 14 05431 g002
Figure 3. LDPI-MS of carbendazim: (a) the LDPI mass spectrum of carbendazim with dual photon action; (b) the LDPI mass spectrum of carbendazim without postionization; and (c) the LDPI mass spectrum of carbendazim without laser desorption.
Applsci 14 05431 g003
Figure 4. CBZ possible fragmentation pathways in LDPI-MS.
Applsci 14 05431 g004
Figure 5. Mass spectra of carbendazim by LDPI-MS: (a) pure carbendazim sample, (b) carrot tubers with carbendazim, and (c) carrot tubers without carbendazim.
Applsci 14 05431 g005
Figure 6. Effect of delay T between two laser beams and distance Z between the sample surface and ionization laser on the LDPI: (a) mass spectrometry resolution and (b) peak relative intensity.
Applsci 14 05431 g006
Figure 7. Mass spectra of carrot tubers treated with carbendazim by LDPI-MS: (a) mass spectra of carbendazim at different concentrations, and (b) the standard curve of mass spectra of carbendazim. The concentration of symbols represented in (b) correspond to different surface concentration in (a).
Applsci 14 05431 g007aApplsci 14 05431 g007b
Figure 8. LDPI-MS images of the carrot tubers: (a) optical image of carrot tubers with carbendazim residue, and (b) spatial distribution of carbendazim dominant ion at m/z 191.
Applsci 14 05431 g008
Figure 9. LDPI-MS images of carrot tubers cultured with carbendazim for different durations. In each graphic, the image on the left is the optical image of the sample, and the image on the right is the LDPI-MSI image at m/z 191. Graphics (ah) represent cultivation durations of 0, 10, 15, 30, 60, 90, and 120 min, and more than 24 h, respectively.
Applsci 14 05431 g009
Table 1. The impacts of different experimental conditions on residual carbendazim in carrot tubers.
ConditionCBZ (m/z 191) Signal Intensity (a.u.)
VariateDuplicate Experimental DataAverage
Temperature (°C)1546.345.846.647.145.546.3
2046.849.248.546.150.248.2
2547.346.748.051.154.249.4
Shaking frequency (/min)038.241.038.537.638.138.7
546.849.248.546.150.248.2
1045.847.350.048.946.347.7
Thickness (μm)5025.324.823.924.123.924.4
10046.849.248.546.150.248.2
15055.251.654.555.354.054.1
The standard experimental conditions were as follows: a thickness of all slices of 100 μm, and all of the samples were placed in a water bath at 20 °C and shaken every 5 min. The conditions are consistent with the standard conditions, with the exception of the control variable conditions.
Disclaimer/Publisher’s Note: The statements, opinions and data contained in all publications are solely those of the individual author(s) and contributor(s) and not of MDPI and/or the editor(s). MDPI and/or the editor(s) disclaim responsibility for any injury to people or property resulting from any ideas, methods, instructions or products referred to in the content.

