Abstract
The limit cycle oscillation (LCO) in the transonic buffet on the fixed supercritical airfoil OAT15A under Ma = 0.73, AoA = 3.5° and , is successfully simulated by means of the Reynolds Stress Model. Further, the buffet lock-in phenomena under prescribed pitch conditions near the buffet onset are also studied by evaluating the modified energy exchange based on the pitching component of the moment coefficients as well as the normalized relative phase map between the pitching component of the moment coefficients and the airfoil’s angular velocity. The zero energy transfer branches in the modified energy map fail to indicate the lock-in boundaries, while the normalized phase map generally outlines the lock-in boundaries for small pitch amplitudes near the buffet onset, which suggests that the lock-in occurs where the moment is in phase with the angular velocity at small pitch amplitudes near the buffet onset. For pitch amplitudes larger than , the lock-in onset deviates from the phase shift, possibly due to the fact the instantaneous angle of attack can be lower than the buffet onset where the buffet phenomena may vanish.
1. Introduction
The transonic buffet refers to the non-linear phenomenon that the shock moves back and forth in a specific period on the suction side of the airfoil under the interaction between the shock and the boundary layer (Type II) or on both of the airfoil surfaces (Type I), which gives rise to the drastic fluctuation of the lift and the moment. Various physics mechanisms, such as the shock wave, K-H instability, shock-induced intermittent flow separation, the generation and propagation of sound, and so on, are involved [1]. When aircraft go through constant low-frequency buffet conditions combining specific upstream Mach numbers () with angles of attack (AoA), the fatigue life of the structures can be reduced, which poses risks to the performance of aircraft. As a consequence, it is of great importance to study the mechanisms of transonic buffets in aerospace.
Tijdeman observed three types of transonic buffet phenomenon [2]. Type A oscillation refers to a small and sinusoidal motion of shock on the upper surface of an airfoil; Type B oscillation refers to a larger motion of the shock with the shock vanishing at some particular phases during the downstream excursion; and Type C oscillation refers to the behavior that compression waves accumulate somewhere downstream so as to form a shock, while on the other hand, the shock gradually evolves into a weak shock or compression wave until leaving the leading edge of the airfoil when the shock travels upstream. Experimental and numerical results show that the main difference among these three types of transonic buffets is due to Reynolds number (Re) effects.
There are mainly two theories to shed light on the buffet phenomena, despite the fact that the mechanisms behind the buffet are still not fully understood. Lee [3,4] proposed a self-sustained oscillation model, as Figure 1 illustrates, that defines a close loop in which perturbations emanating from the shock travel downstream at the speed of . When they reach the trailing edge, upward Kutta waves propagate within the subsonic area above the separated shear layer at a speed of until they reach the shock. According to Lee, the estimated buffet frequency can be expressed as Equation (1):
refers to the buffet frequency, refers to the mean location of the shock on the upper surface, refers to the chord, and denotes the velocity propagating upward. and can be derived using various approaches like the cross-correlation method, phase shift, wavenumber-frequency spectrum, and so on. However, some researchers argue that Lee’s model may not be suitable. Paladini et al. [5] pointed out that the path between the trailing edge and the shock outside the boundary layer is not strictly necessary for the instability, even though the acoustic waves can be superimposed on the buffet phenomena based on unsteady Reynolds-averaged Navier–Stokes equations simulations (URANS) locally filtered with a selective frequency damping (SFD) technique. Moise et al. [6] found that the wave propagation speed does not match their simulations and that these waves are associated with vortex shedding, which plays no major role in buffet. In contrast to Lee’s model [3,4], Crouch et al. [7,8] established that the transonic buffet is actually a global linear instability. The global instability linearizes the Reynolds averaged Navier–Stokes equations (RANS) to study the most unstable eigenmode of the flow field and determine the buffet onset, which is consistent with a supercritical Hopf bifurcation.
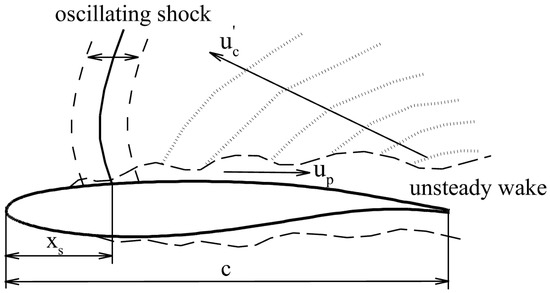
Figure 1.
Lee’s self-sustained oscillation model.
As a peculiar case of buffet, the lock-in phenomenon is generally defined as the synchronization of the buffet frequency with the airfoil excitation/natural frequency. It occurs when the excitation/natural frequency and the fixed airfoil buffet frequency are close, about the ratio of 1, with sufficient moving amplitudes. In the lock-in region, the lift coefficient oscillates more drastically than that of the buffet on the fixed airfoil. Davis and Malcolm [9] discovered that the airfoil aerodynamic coefficients resonated tremendously when the NACA 64A010 airfoil was moving at a certain pitch frequency in their experiments, and Despré [10] found similar resonances when the OAT15A airfoil flaps were in harmonic vibration at an excitation frequency near the buffet frequency. Given a prescribed oscillating motion of the airfoil, Raveh and fellows [11,12,13,14] conducted simulations on the NACA0012 lock-in phenomena in deep buffet conditions and owed the LCO of the system to the phase lag/lead between the lift and the excitation movement, and their further works on aeroelastic airfoils also supported this point of view. Gao et al. [15,16] established a linear reduced-order model (ROM) to study the frequency lock-in phenomena on an aeroelastic airfoil and found that the coupling of one structural mode and one fluid mode leads to frequency shift. Hartmann et al. [17] carried out experiments on the prescribed oscillating airfoils and discovered a reduced level of shock oscillation and that the lock-in is only related to the major changes in the flow conditions and phase lagged by the time it takes until the altered pressure waves generated in the trailing-edge region reach the shock, which proves that Lee’s model is still fit for the lock-in phenomenon. Note that in spite of considerable numerical simulations that deprive Lee’s model of its feasibility in the transonic buffet, experimental results from Hartmann et al. [17,18] and Feldhusen-Hoffman et al. [19,20,21] all confirm that the buffet is driven by an acoustic feedback loop.
Recently, energy maps have been adopted for flow-induced pitching airfoil or flutter analysis [22,23,24]. These studies focus on fabricating the energy extraction as a function of pitch oscillation’s amplitudes and frequencies, or as a function of pitch oscillation’s amplitudes and which provides convenience in quantitatively determining the flutter boundary. The flutter means the instability of the structure under the interaction of the flow, where the LCOs of the aerodynamic coefficients manifest. In the transonic flutter of one degree of freedom (1-DOF) for pitch and two degrees of freedom (pitch and heave), the lower and upper boundaries are pinned down for the equilibrium energy transfer from the flow, where the instantaneous moment is in phase with the airfoil’s angular velocity near the mean AoA [24]. But for the transonic buffet lock-in, where there is not only a phase difference between the moment and the pitch motion but also unstable characteristics of the flow, the boundary can be altered due to the complex shock/boundary interaction, which has not yet been illustrated from the perspective of the energy exchange. The utilization of the energy maps or energy extraction in the present study may give new insights into the mechanism of the lock-in phenomenon.
This study aims to analyze the energy exchange between the airfoil and the flow when buffet lock-in occurs under given pitch oscillations near the buffet onset, where small pitch amplitudes should have significant impacts, and to try to relate the lock-in boundaries to the pitching component of the moment or of the flow field. The paper is structured as follows: The instruction is followed by the theoretical background of the energy map used in this study in Section 2 and the numerical set-up and validation in Section 3. Section 4 exhibits and explains the results in detail through the modified energy map proposed in this study and the relative phase map. The concluding remarks are given in Section 5.
2. Energy Map and Model for Amplitude Growth
For a forced spring-mass-damper oscillator illustrated in Figure 2 that uses a linear torsional spring with the spring constant k and the damping coefficient b, mounted on a rigid airfoil with a chord length of c at the elastic axis , the governing equation is written as:
where I, M, and are the moments of inertia with respect to , the aerodynamic pitch moment with respect to and the equilibrium angular position of the spring, respectively.
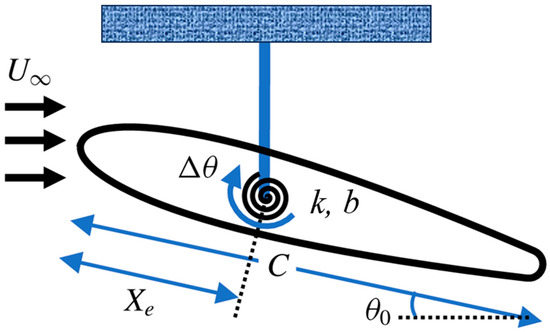
Figure 2.
The aeroelastic structural system for a one degree-of-freedom (1-DOF) pitch.
Menon et al. [22] established a model for the amplitude growth and the equilibrium for the flow-induced flutter of the airfoil, given that the pitch motion and are sinusoidal, i.e., and . The multiplication of to Equation (2) results in
which can be described by the growth of the energy in the system as follows:
In Equation (4) and denote the energy absorbed from the flow by the airfoil and the energy lost due to the damping, respectively. By integrating Equation (4) over an oscillation cycle period T with the cycle beginning at we can further achieve
where represents the net energy extraction of the airfoil within a cycle. Under the assumption of sinusoidal pitch motion, the amplitude shift over a cycle is derived from Equation (5) as follows:
where . If the pitch oscillation occurs at the natural structural frequency the amplitude growth can be simplified as follows:
or
where .
The equilibrium is obtained when , i.e.,
according to the Poincaré map. Only when
or
can the system aforementioned be stable. The fact that Equations (9) and (11) are both satisfied determines whether the system will equilibrate if the airfoil is allowed to flutter freely.
3. Numerical Setup and Validation
3.1. Test Case Description
Molton and Jacquin [25] conducted experiments on the supercritical airfoil OAT15A in the S3Ch wind tunnel in Onera’s Chalais Meudon Center. The test section of the wind tunnel has a square cross section, and the size of the test chamber is . The chord length of the OAT15A airfoil is . The thickness of the airfoil is 12.5%, and the thickness of the trailing edge is 0.5% of the chord length. The transition locations are fixed at 0.07c on both the upper and lower surfaces. The incoming Mach number is , Reynolds number , the stagnation point pressure , and the far field temperature . The AoA ranges from to . The experiments showed that the buffet onset was at the designed condition, and the larger the AoA, the more drastic the shock oscillation. Buffet frequencies, in all cases, remained around 69–70 Hz (the Strouhal number ). Further LDV measurements were carried out at an AoA of . The AoA of is chosen for numerical verification of the fixed airfoil in this study.
For prescribed airfoil pitch motion validation, we test the simulation against the wind tunnel experiments of the oscillating NACA0012 airfoil (AGARD CT5 case) conducted by Landon [26]. The mean AoA is while the maximum pitch amplitude is , with the reduced frequency , where denotes the forced pitching frequency and denotes the incoming velocity. In this test case, the chord length c is set at 1 m, with the pivot point at 0.25c, , .
3.2. Numerical Setup
In this study, ANSYS Fluent 2021R1 software is utilized to solve the test cases.
The two-dimensional (2D) mesh demonstrated in Figure 3 is used to simulate the buffet flow of the OAT15A airfoil. The height of the first layer is which ensures all y+ < 1 on the first layer. The pressure-far field boundary is at least 30c away from the airfoil. The surface of the airfoil is distributed with grid points, and around the shock oscillation region, the mesh is refined to achieve . The number of normal grids is and the streamwise grid number in the wake region is 121, with a total grid number of around 110,400 for the whole domain. This mesh setup is termed the medium-size mesh. In this study, the Stress-Omega Reynolds Stress Model (RSM) is chosen as the turbulence model in the flow solver. The Stress-Omega Reynolds Model is constructed by taking the second-moments of the exact momentum equations, yielding four excess transport equations for the Reynolds stresses as well as an equation for the dissipation rate for the closure. RSM has proved its applicability in buffet reproduction. In contrast, Menter’s k − ω Sher-Stress Transport (SST) model is also applied in the test case to evaluate its performance against RSM.
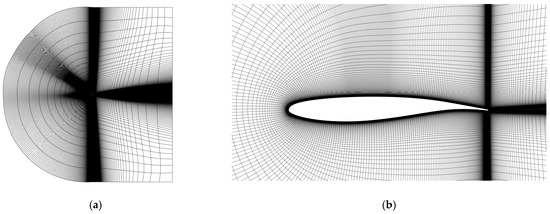
Figure 3.
Computational domain of the test case: (a) the whole domain; (b) grids around the airfoil.
For the two flow solvers, the solution process goes as follows: by means of the density-based method, the iterative steady solution is calculated in advance in each turbulence model. After the steady solution is converged, the simulation is switched to the unsteady calculation in the RSM/SST model (URANS solver) to speed up the convergence of the calculation, with the ROE flux construction form, the third-order Monotone Upstream-Centered Scheme for Conservation (MUSCL) discretization in the flow, the second-order upwind discretization in the turbulent kinetic energy and dissipation rate, the least squares cell-based method in gradient calculation, and the second-order implicit dual-time stepping advancement enabled. Specifically, the coefficient of the baseline model in the SST model, which indicates the eddy viscosity level, is mildly reduced to promote flow unsteadiness, as Giannelis et al. [27] suggested. In this study, the time step is chosen as with a minimum of 20 inner iterations in each physical time step.
3.3. Numerical Verification
The time-averaged pressure coefficient and the root-mean-square error (RMSE) of the suction side pressure derived by the RSM and the SST are compared with the experiment in Figure 4. The trend and slope of from the RSM match well with the experiment, while the RMS slightly underestimates the shock motion for the simulated upmost position of the shock, which is downward of the upmost position measured in the experiment, as Figure 4a exhibits. The mean shock location of the RMS is at 0.49c, close to the experimental mean location at 0.45c. The magnitude of pressure fluctuation is well predicted by the RSM compared with the experiment. On the other hand, however, though the SST yields the shock oscillation, the SST presents an inferior performance as the curve deviates a lot from the experiment and the shock motion is much overestimated, as shown in Figure 4b. The magnitude of pressure fluctuations is also underestimated by the SST. The shape of both the and the pressure RMSE cannot be seen as similar to those in the experiment, probably because the SST may generate another flow separation phenomenon that sustains the shock oscillation. Compared with the literature [27,28], the inferior performance of the SST model in this study may result from the different resolution of the grid around the shock, and on the other hand, from the different spatial discretization precision (second-order MUSCL in [27] and third-order MUSCL in this paper), since the buffet simulation is highly sensitive to the grid resolution [29,30] and the numerical discretization scheme [31,32]. To regenerate a mesh setup that meets all requirements of SST and incorporates third-order spatial discretization precision is out of the scope of our discussion. Therefore, the RSM is adopted in the further investigation of this paper.
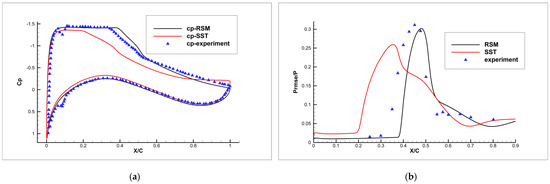
Figure 4.
(a) The mean pressure coefficient of simulations and the experiment; (b) the pressure RMSE of simulations and the experiment.
Apart from the aforementioned verification, the grid independence on the OAT15A airfoil buffet is also investigated using a coarse mesh and a fine mesh compared with the medium size mesh. The numerical results are presented in Table 1. All meshes are tested with the same turbulence model and the same timestep size. With a coarse mesh, the calculated buffet frequency is higher than the experimental and medium or fine mesh, and the amplitude of the lift coefficient is much smaller than other mesh tests. The simulated buffet frequencies from the medium and fine mesh are very close to the experimental result, and the amplitude of are similar too, indicating that the accuracy of the medium and fine mesh is sufficient for the calculation. Considering the balance between accuracy and efficiency, the medium size mesh is used for the following sections.

Table 1.
Information on the test mesh and simulated results on OAT15A buffet.
Figure 5 shows the transient flow velocity contours and streamlines in the vicinity of the airfoil derived by the RSM within a complete buffet period. Phase 1 and phase 5 mark the most upstream and downstream positions during the oscillation of the shock wave, respectively. In the downstream excursion (phase 1 to phase 5), the shock gradually strengthens, and the separation shear layer grows thinner and gradually attaches to the airfoil surface. When the shock travels from the downstream to the upstream (phase 5 to phase 8), the shock weakens and the shear layer becomes thick again, making the separation significant. Figure 5 demonstrates that the RSM used in this study is able to reproduce the oscillation of the shock on the upper surface of the airfoil. However, the URANS simulation used in this study is not capable of capturing the vortex shedding or delicate structures within the shear layer. To study the development of the turbulent structures and their influence upon the separation and the wake in the buffet, one may refer to the approaches on the prolate spheroid and bluff bodies by means of large-eddy simulation [33,34,35]. The buffet frequency calculated by the RSM using the medium mesh is () from the Fast Fourier Transform (FFT) of the lift coefficient, which is acceptable compared with the experiment frequency of 69–70 Hz ().
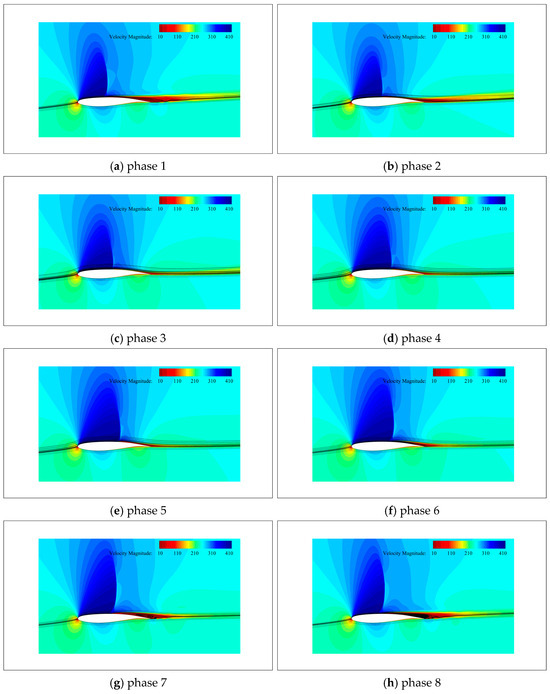
Figure 5.
Transient velocity contours and the streamlines around the airfoil in a complete buffet cycle.
The computational domain for NACA0012 forced pitching contains 361 grids on the airfoil surface, 136 grids on the wall in the in the normal direction, and 121 grids in the wake, covering about 84,000 structural cells. The pressure field is about 40 chord lengths away from the airfoil. Except that the timestep for the pitch is set at 0.0001 s, the RSM model used here remains the same as in the static OAT15A buffet simulation, with the mesh moved in the way of the rigid body. As Figure 6 shows, both the lift coefficient and moment coefficient from the simulation are in good agreement with the experiment. Thus, the mesh motion method can be adopted for pitching in this study.
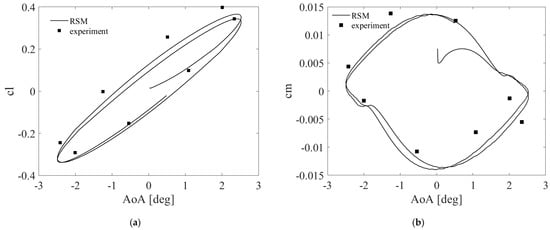
Figure 6.
AoA versus (a) and (b) for RSM simulation and AGARD CT5 case.
4. Results and Discussions
4.1. Energy Exchange of the Buffet on the Prescribed Pitching Airfoil
The OAT15A airfoil is mounted in a 1-DOF pitch operating at an initial angle of attack of = , with conditions of the coming stream, far field pressure, etc. the same as the fixed OAT15A airfoil. The pivot point is fixed at of the airfoil around the mean shock location. The pitch motion of the airfoil is defined as follows:
where denotes the excitation frequency of the pitch motion and denotes the amplitude of the pitch oscillation. The positive direction of the pitch motion goes counterclockwise. Raveh et al. [14] suggested that the amplitude of the pitch motion should not be too small; otherwise, the aerodynamic buffet response cannot be affected for airfoils in deep buffet conditions, yet near the buffet, onset small disturbances should have a noticeable influence. The experimental buffet AoA onset of the OAT15A airfoil at identical conditions with the test case in Section 3.1 is about [25], which determines that should be small enough to ensure the occurrence of buffet. Furthermore, to allow the lock-in and LCO to occur, the system’s damping must approach zero so that the system is on the brink of instability. The pitch system in this study thus has no damping. According to the definition in Equation (5), the energy extraction from the flow by the airfoil, regardless of damping, is defined as follows:
where is the aerodynamic moment about the elastic axis and is the period of the pitch oscillation. In this section, the evolution of the energy extraction in Equation (13) in a continuous form
is also investigated. The prescribed pitch frequencies with various pitch amplitudes are given in Table 2, and the pitch cases are all calculated after the same timestep of the buffet on the fixed airfoil, recording at least 50,000 steps each.
Table 2.
Prescribed pitch motion frequencies for OAT15A airfoil.
In Figure 7, the time-accurate energy evolution from the flow and the moment coefficient of are plotted, as well as the energy extraction of each cycle. Leaving out the first several transient cycles, the energy extraction from Case 1 to Case 4 reveals a negative energy transfer from the flow to the airfoil. As the pitch frequency grows, the flow transfers positive energy to the airfoil in Case 5, where . The energy extraction evolution from Case 3 to Case 5 is defined as the linear stage in this paper, where the energy exchange within each cycle is approximately the same after the lift coefficients reach constant LCOs as time develops. From Case 1 and Case 2 and from Case 6 to Case 9, the energy evolution exhibits an oscillating characteristic compared with the former cases, referred to as the linear stage, where the exact energy exchange within each cycle varies from negative to positive, modulated by a secondary frequency lower than the excitation. The energy evolution in these cases is thus defined as the non-linear stage and seems unlikely to reach a stationary regime as time develops, implying a rather independent motion between the pitch excitation and the buffet. The oscillating behavior of the non-linear stage poses a challenge for determining the exact energy extraction over a pitch period. In this sense, the energy extraction in Equation (13) should be modified to address the non-linear stage of the energy evolution.
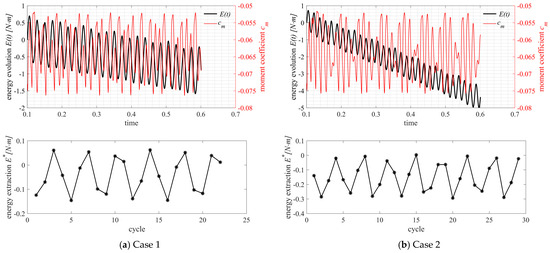
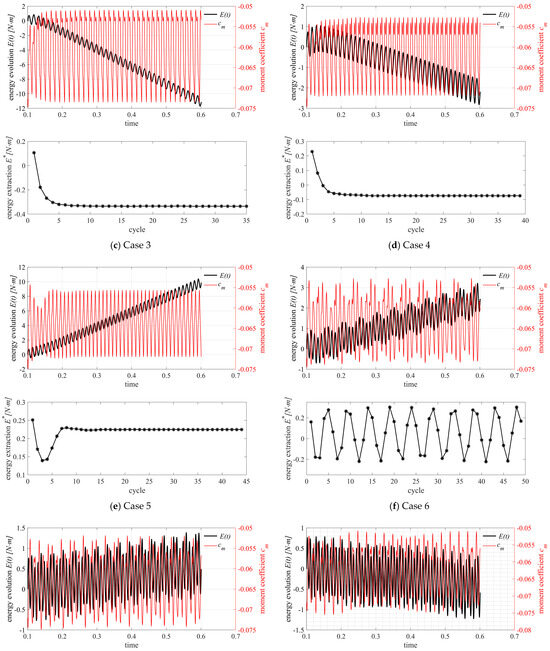
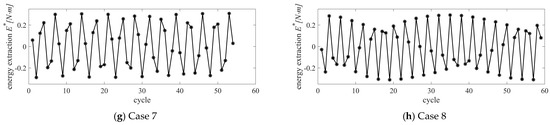
Figure 7.
The energy evolution and the energy extraction in each cycle of all cases at .
4.2. Harmonic Analysis
The frequency contents of the energy extraction evolution and the moment coefficient of for example are also discussed in this section by the Fast-Fourier Transform (FFT) as Figure 8 demonstrates. From Case 3 to Case 5 both and present a mono-frequency characteristic under 100 Hz: the buffet frequency locks onto the pitch motion frequency, and the buffet frequency vanishes. This synchronization of frequencies is the typical lock-in phenomenon reported by Raveh et al. [11], as they studied a transonic buffet on an oscillating NACA0012 airfoil and found that only when the airfoil oscillated at frequencies close enough to the buffet frequency would lock-in occur. The linear stage of the energy evolution from Case 3 to Case 5 results from the fact that the LCO moment of the airfoil and the motion possess the same frequency. In Case 1 and Case 2 and Case 6 to Case 9, however, and display responses in the airfoil motion and the buffet frequency showing no existence of the lock-in phenomena. The buffet frequency lock-in phenomenon is reminiscent of the vortex-induced vibration of the flow past a cylinder, where most researchers owed the inducement to resonance [36,37].
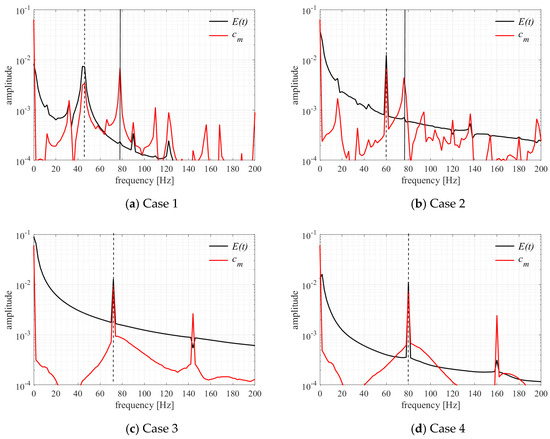
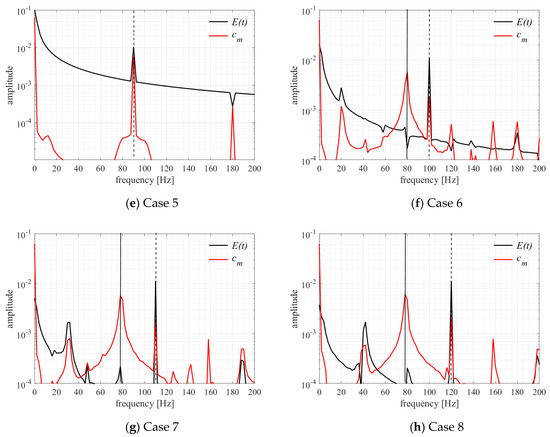
Figure 8.
Frequency contents of all cases at . (Black solid: buffet frequency; black dashed: pitch frequency).
In the following discussion, we lay emphasis on the pitching component of the moment coefficient , since it possesses a constant phase lag/lead with respect to the airfoil pitch motion, is one of the most dominant components in FFT, and is clear to determine its part of energy donation within a pitching period. While we have acquired the amplitude of the pitching component from FFT, the phase angle of the pitching component is also required. The phase difference to the angular velocity of the airfoil is also derived from the FFT. We have evaluated cases with a pitch amplitude of a wider range from to . The gain model of the amplitude of the pitching motion component and the airfoil pitch amplitude is given in Figure 9. The phase differences are presented in Figure 10. From Figure 10, it is clear that for a certain pitch amplitude, the relative phase curve undergoes two shifts from positive to negative, or vice versa, as the pitching frequency grows. Before the phase shifts, the value of the relative phase decreases as the pitch frequency increases, which conforms with Raveh et al. [12] and Iovnovich et al. [13] as they studied the prescribed pitch motion of the NACA0012 airfoil in deep buffet or pre-buffet conditions. The discrepancy between this study and theirs is that we study pitch motion with the mean slightly exceeding the buffet onset, where small pitch amplitude should have a more significant influence on the lock-in phenomena compared with pitch motion in a deep buffet. In the previous study of Iovnovich and Raveh [13], the pitch amplitude of the airfoil was to ensure linear response at pre-buffet conditions, and they found damped resonance peaks for mean . For smaller AoA the response gain decays monotonically with increased pitch frequency. In this study, as Figure 9 shows, the resonance peak frequency reduces as grows, which is also a trend of damped resonance peaks for larger pitch amplitudes above the buffet onset conditions. Also, as continues to increase where the minimum can be far below the buffet onset, it is possible to predict a monotonically decreasing behavior of the response gain, as Iovnovich and Raveh [13] suggested based on Figure 9, indicating the decline of the nonlinear effect that dominates the shock buffet oscillation. In deep buffet conditions, however, a frequency sweep study in the range where the buffet shows complete lock-in to the pitch frequency in [11,12,13] showed only one phase shift in the moment at around the buffet frequency, which was supposed to relate to the aeroelastic instability instead of the frequency synchronization itself. The pitch amplitudes in their studies are actually large. In this study, two phase shifts spotted in Figure 10 may be indicators for the lock-in boundary at conditions slightly above the buffet onset, where small pitch amplitudes can affect the buffet and trigger the synchronization of frequency. Figure 9 and Figure 10 can also be seen as the Bode diagram of the prescribed airfoil pitch dynamic system.
Figure 9.
Gain of the amplitude of the pitching component and the airfoil pitch amplitude .
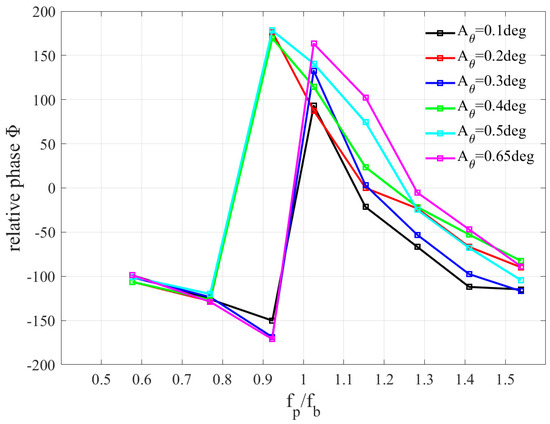
Figure 10.
Relative phase between and the angular velocity versus frequency ratio .
4.3. Lock-In Boundaries Determination
The energy map is firstly applied to seek the lock-in boundaries of the prescribed pitching airfoil. The energy extraction is modified to only take advantage of the pitching component of , which is noted as and the equation goes as:
Further, Equation (15) can be transformed to a constant considering that the phase difference between the angular velocity and the FFT amplitude of the marked as are known from FFT analysis in 4.1. The final form of the modified energy extraction is
where is approximated by .
The modified energy map based on Equation (16) as a function of the airfoil pitch amplitude and the frequency ratio is plotted in Figure 11, interpolated from 40 data points presented in Figure 9 and Figure 10 through cubic spline, where the frequency responses of selected test cases are also marked. The positive contour level suggests that the airfoil absorbs energy from the flow and should develop an unstable flutter, while the negative contour level means that the flow extracts energy from the airfoil motion and the airfoil motion should decay over time in an unforced case. The zero-contour level is usually related to flutter instability. The sign of the modified energy map is determined by according to Equation (16), and two branches of exist on the map (solid line), conforming to the transonic flutter boundary branches in [24]. We can see that for both upper and lower frequency bounds at , there are regions corresponding to the stable range where allowing the airfoil to pitch sustainably without extra damping, and also regions corresponding to the unstable range for where small perturbations can break the equilibrium. However, these zero-energy transfer boundaries do not indicate the lock-in boundaries, and they are not even close to the lock-in boundaries. According to Gao et al. [15,16], the lock-in is in essence 1-DOF flutter caused by the linear coupling between the structural mode and the fluid mode that leads to the instability of the structure. The zero energy exchange, on the other hand, is an usual indicator for the flutter boundary in stable flows [23,24]. Such discrepancy suggests that the idea of the energy transfer between the flow and the airfoil may fail to explain lock-in phenomena in unstable flows like transonic buffets, for the exact energy extraction varies drastically within each pitching cycle under the influence of the buffet outside the lock-in regime.
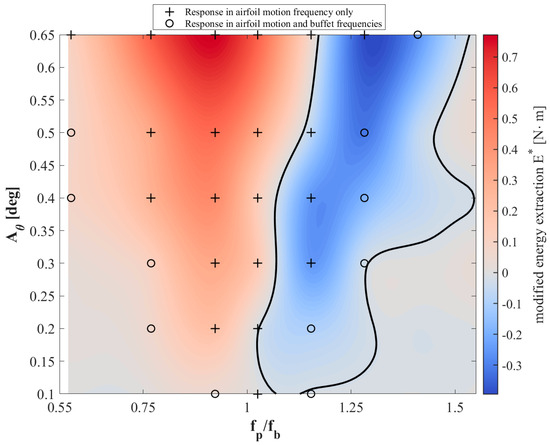
Figure 11.
Modified energy map and the frequency response of the moment coefficient. Solid line: the flutter boundary at .
Alternatively, we plot the normalized relative phase map defined by based on the data points shown in Figure 10 to avoid discontinuity, along with the frequency responses of the test cases marked in Figure 12. The phase shifts, where is exactly in phase with the angular velocity, generally outline the lock-in region except for onset at . Such agreement indicates that the lock-in phenomena under small pitch amplitude near buffet onset are strongly related to the phase shift of the pitching component of the moment coefficient or the pitching component of the flow, regardless of the buffet component. In this sense, the lock-in boundaries are still within the range of flutter, considering that the flutter boundary occurs where the moment is in phase with the angular velocity in stable flows [24]. For the lock-in onset at or higher, the idea of linear flutter may start to lose strength to account for the lock-in phenomena on the prescribed pitching airfoil since the unstable flow field with larger airfoil pitch amplitudes is gradually and naturally dominated by the airfoil motion because the instantaneous AoA can be far below the buffet onset where the shock oscillation may vanish. The idea that relative phase shift results in the lock-in of an oscillating airfoil near the transonic buffet onset of this paper supplements the view of Iovnovich and Raveh [13] from a nonlinear perspective.
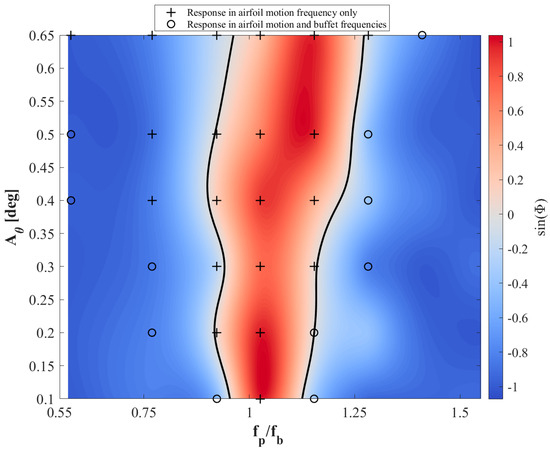
Figure 12.
The normalized relative phase map and the frequency response of the moment coefficient. Solid line: phase shift at .
5. Conclusions
In this paper, the modified energy map as a function of the pitch amplitude and the excitation frequency and the relative phase map between the pitching component of the moment and the airfoil’s angular velocity are applied to analyze the buffet lock-in phenomena on a prescribed pitch airfoil near the buffet onset. The buffet lock-in boundary is extracted based on the normalized relative phase map for small pitch amplitudes. We therefore give some concluding remarks:
- The modified energy map, which is based on the pitching component of the moment coefficient, fails to indicate the buffet lock-in boundaries for small pitch amplitudes near the buffet onset with the zero-energy transfer index.
- The zero-contour level in the normalized relative phase map of the pitching component of the moment coefficients and the airfoil’s angular velocity generally outlines the buffet lock-in offset as well as the lock-in onset for pitching amplitude less than , indicating that the lock-in phenomena are probably related to the phase shift for small pitch amplitudes near the buffet onset.
- The discrepancy between the lock-in onset and the phase shift for is possibly due to the fact that the instantaneous AoA can be far below the buffet onset (pre-buffet regime), where the shock oscillation vanishes.
Author Contributions
Conceptualization, L.W.; Methodology, W.L. and G.Y.; Software, L.W. and Y.Z.; Validation, G.Z., W.L. and Y.Z.; Investigation, L.W.; Resources, G.Z. and G.Y.; Writing—original draft, L.W.; Writing—review and editing, G.Z., W.L., Y.Z. and G.Y.; Visualization, L.W.; Supervision, G.Z., W.L., and G.Y.; Project administration, G.Y.; Funding acquisition, G.Y. All authors have read and agreed to the published version of the manuscript.
Funding
This work is supported by the National Natural Science Foundation of China (Grant No. 12372171).
Institutional Review Board Statement
Not applicable.
Informed Consent Statement
Not applicable.
Data Availability Statement
The data that support the findings of this study are available from the corresponding author upon reasonable request.
Acknowledgments
The authors give thanks to all co-working fellows for their generous help regarding this work.
Conflicts of Interest
The authors have no conflicts to disclose.
Nomenclature
| K-H | Kelvin–Helmholtz |
| AoA | angle of attack |
| Mach number | |
| Reynolds number | |
| Strouhal number | |
| far-field velocity | |
| density of the air | |
| stagnant pressure | |
| far-field temperature | |
| chord length | |
| dimensional buffet frequency (Hz) | |
| dimensional pitching frequency (Hz) | |
| pressure coefficient | |
| lift coefficient | |
| pitch moment coefficient | |
| component of the moment coefficient corresponding to the prescribed pitch motion frequency | |
| dimensional pitch moment | |
| pitch angle | |
| angular velocity of the pitch motion | |
| initial angle of the pitch motion | |
| amplitude of the pitch motion | |
| amplitude of the FFT component of corresponding to the pitch motion frequency | |
| relative phase between and |
References
- Giannelis, N.F.; Vio, G.A.; Levinski, O. A Review of Recent Developments in the Understanding of Transonic Shock Buffet. Prog. Aerosp. Sci. 2017, 92, 39–84. [Google Scholar] [CrossRef]
- Tijdeman, H. Investigations of the Transonic Flow around Oscillating Airfoils. Ph.D. Thesis, Delft University of Technology, Delft, The Netherlands, 1977. [Google Scholar]
- Lee, B.H.K. Oscillatory Shock Motion Caused by Transonic Shock Boundary-Layer Interaction. AIAA J. 1990, 28, 942–944. [Google Scholar] [CrossRef]
- Lee, B.H.K. Self-Sustained Shock Oscillations on Airfoils at Transonic Speeds. Prog. Aerosp. Sci. 2001, 37, 147–196. [Google Scholar] [CrossRef]
- Paladini, E.; Marquet, O.; Sipp, D.; Robinet, J.-C.; Dandois, J. Various Approaches to Determine Active Regions in an Unstable Global Mode: Application to Transonic Buffet. J. Fluid Mech. 2019, 881, 617–647. [Google Scholar] [CrossRef]
- Moise, P.; Zauner, M.; Sandham, N.D. Large-Eddy Simulations and Modal Reconstruction of Laminar Transonic Buffet. J. Fluid Mech. 2022, 944, A16. [Google Scholar] [CrossRef]
- Crouch, J.D.; Garbaruk, A.; Magidov, D.; Travin, A. Origin of Transonic Buffet on Aerofoils. J. Fluid Mech. 2009, 628, 357–369. [Google Scholar] [CrossRef]
- Crouch, J.D.; Garbaruk, A.; Magidov, D. Predicting the Onset of Flow Unsteadiness Based on Global Instability. J. Comput. Phys. 2007, 224, 924–940. [Google Scholar] [CrossRef]
- Davis, S.S.; Malcolm, G.N. Transonic Shock-Wave/Boundary-Layer Interactions on an Oscillating Airfoil. AIAA J. 1980, 18, 1306–1312. [Google Scholar] [CrossRef][Green Version]
- Despre, C.; Caruana, D.; Mignosi, A.; Reberga, O.; Correge, M. Buffet Active Control-Experimental and Numerical Results. In Proceedings of the Active Control Technology for Enhanced Performance Operational Capabilities of Military Aircraft, Land Vehicles and Sea Vehicles, Braunschweig, Germany, 8–11 May 2000; p. 14. [Google Scholar]
- Raveh, D.E.; Dowell, E.H. Frequency Lock-in Phenomenon for Oscillating Airfoils in Buffeting Flows. J. Fluids Struct. 2011, 27, 89–104. [Google Scholar] [CrossRef]
- Raveh, D.E. Numerical Study of an Oscillating Airfoil in Transonic Buffeting Flows. AIAA J. 2009, 47, 505–515. [Google Scholar] [CrossRef]
- Iovnovich, M.; Raveh, D.E. Transonic Unsteady Aerodynamics in the Vicinity of Shock-Buffet Instability. J. Fluids Struct. 2012, 29, 131–142. [Google Scholar] [CrossRef]
- Raveh, D.E.; Dowell, E.H. Aeroelastic Responses of Elastically Suspended Airfoil Systems in Transonic Buffeting Flows. AIAA J. 2014, 52, 926–934. [Google Scholar] [CrossRef]
- Gao, C.; Zhang, W.; Li, X.; Liu, Y.; Quan, J.; Ye, Z.; Jiang, Y. Mechanism of Frequency Lock-in in Transonic Buffeting Flow. J. Fluid Mech. 2017, 818, 528–561. [Google Scholar] [CrossRef]
- Gao, C.; Zhang, W.; Ye, Z. New Viewpoint on the Mechanism of Transonic Single-Degree-of-Freedom Flutter. Aerosp. Sci. Technol. 2016, 52, 144–156. [Google Scholar] [CrossRef]
- Hartmann, A.; Klaas, M.; Schröder, W. Coupled Airfoil Heave/Pitch Oscillations at Buffet Flow. AIAA J. 2013, 51, 1542–1552. [Google Scholar] [CrossRef]
- Hartmann, A.; Feldhusen, A.; Schröder, W. On the Interaction of Shock Waves and Sound Waves in Transonic Buffet Flow. Phys. Fluids 2013, 25, 026101. [Google Scholar] [CrossRef]
- Feldhusen-Hoffmann, A.; Lagemann, C.; Loosen, S.; Meysonnat, P.; Klaas, M.; Schröder, W. Analysis of Transonic Buffet Using Dynamic Mode Decomposition. Exp. Fluids 2021, 62, 66. [Google Scholar] [CrossRef]
- Feldhusen, A.; Hartmann, A.; Klaas, M.; Schröeder, W. Impact of Alternating Trailing-Edge Noise on Buffet Flows. In Proceedings of the 31st AIAA Applied Aerodynamics Conference, San Diego, CA, USA, 24–27 June 2013; American Institute of Aeronautics and Astronautics: Reston, VA, USA, 2013. [Google Scholar]
- Feldhusen-Hoffmann, A.; Statnikov, V.; Klaas, M.; Schröder, W. Investigation of Shock–Acoustic-Wave Interaction in Transonic Flow. Exp. Fluids 2018, 59, 15. [Google Scholar] [CrossRef]
- Menon, K.; Mittal, R. Flow Physics and Dynamics of Flow-Induced Pitch Oscillations of an Airfoil. J. Fluid Mech. 2019, 877, 582–613. [Google Scholar] [CrossRef]
- Huang, G.; Dai, Y.; Yang, C. Energy Extraction in the Dynamic Modes of Flow for Airfoil’s Laminar Separation Flutter. Phys. Fluids 2022, 34, 083601. [Google Scholar] [CrossRef]
- Turner, J.; Seo, J.H.; Mittal, R. Analysis of the Flow Physics of Transonic Flutter Using Energy Maps. In Proceedings of the AIAA SCITECH 2023 Forum, National Harbor, MD, USA, 23–27 January 2023; American Institute of Aeronautics and Astronautics: Reston, VA, USA, 2023. [Google Scholar]
- Jacquin, L.; Molton, P.; Deck, S.; Maury, B.; Soulevant, D. Experimental Study of Shock Oscillation over a Transonic Supercritical Profile. AIAA J. 2009, 47, 1985–1994. [Google Scholar] [CrossRef]
- Landon, R.H. NACA0012. Oscillatory and Transient Pitching; AGARD R-702, DATA SET 3; Advisory Group for Aerospace Research and Development North Atlantic Treaty Organization: Neuilly sur Seine, France, 1982. [Google Scholar]
- Giannelis, N.F.; Levinski, O.; Vio, G.A. Origins of Atypical Shock Buffet Motions on a Supercritical Aerofoil. Aerosp. Sci. Technol. 2020, 107, 106304. [Google Scholar] [CrossRef]
- Giannelis, N.F.; Levinski, O.; Vio, G.A. Influence of Mach Number and Angle of Attack on the Two-Dimensional Transonic Buffet Phenomenon. Aerosp. Sci. Technol. 2018, 78, 89–101. [Google Scholar] [CrossRef]
- Schulte am Hülse, S.; Lutz, T.; Krämer, E. On the Capability of Unsteady RANS to Predict Transonic Buffet. In Proceedings of the Third Symposium “Simulation of Wing and Nacelle Stall”, Braunschweig, Germany, 21–22 June 2012. [Google Scholar]
- Iovnovich, M.; Raveh, D.E. Reynolds-Averaged Navier-Stokes Study of the Shock-Buffet Instability Mechanism. AIAA J. 2012, 50, 880–890. [Google Scholar] [CrossRef]
- Brunet, V. Computational Study of Buffet Phenomenon with Unsteady RANS Equations. In Proceedings of the 21st AIAA Applied Aerodynamics Conference, Orlando, FL, USA, 23–26 June 2003; American Institute of Aeronautics and Astronautics: Reston, VA, USA, 2003. [Google Scholar]
- Goncalves, E.; Houdeville, R. Turbulence Model and Numerical Scheme Assessment for Buffet Computations. Int. J. Numer. Meth. Fluids 2004, 46, 1127–1152. [Google Scholar] [CrossRef]
- Ortiz-Tarin, J.L.; Nidhan, S.; Sarkar, S. High-Reynolds-Number Wake of a Slender Body. J. Fluid Mech. 2021, 918, A30. [Google Scholar] [CrossRef]
- Brandao, F.L.; Kumar, P.; Mahesh, K. Large-Eddy Simulation of Elliptic Hydrofoil Tip Vortex Cavitation under Incipient Conditions. Int. J. Multiph. Flow 2024, 174, 104795. [Google Scholar] [CrossRef]
- Plasseraud, M.; Kumar, P.; Mahesh, K. Large-Eddy Simulation of Tripping Effects on the Flow over a 6:1 Prolate Spheroid at Angle of Attack. J. Fluid Mech. 2023, 960, A3. [Google Scholar] [CrossRef]
- Govardhan, R.N.; Williamson, C.H.K. Defining the ‘Modified Griffin Plot’ in Vortex-Induced Vibration: Revealing the Effect of Reynolds Number Using Controlled Damping. J. Fluid Mech. 2006, 561, 147. [Google Scholar] [CrossRef]
- Willden RH, J.; Graham JM, R. Three Distinct Response Regimes for the Transverse Vortex-Induced Vibrations of Circular Cylinders at Low Reynolds Numbers. J. Fluids Struct. 2006, 22, 885–895. [Google Scholar] [CrossRef]


Disclaimer/Publisher’s Note: The statements, opinions and data contained in all publications are solely those of the individual author(s) and contributor(s) and not of MDPI and/or the editor(s). MDPI and/or the editor(s) disclaim responsibility for any injury to people or property resulting from any ideas, methods, instructions or products referred to in the content. |
© 2024 by the authors. Licensee MDPI, Basel, Switzerland. This article is an open access article distributed under the terms and conditions of the Creative Commons Attribution (CC BY) license (https://creativecommons.org/licenses/by/4.0/).