
Field Compaction Characteristics of Ultra-Thin Porous Friction Course Based on Laboratory Simulation


Abstract
1. Introduction
2. Experimental Design
2.1. Experimental Objective
- To analyze the compaction characteristics of the MCM-designed UPFC mixes with different thicknesses, the SGC method was used to simulate field compaction.
- The compaction mechanism of the UPFCs with different thicknesses was analyzed using the DEM.
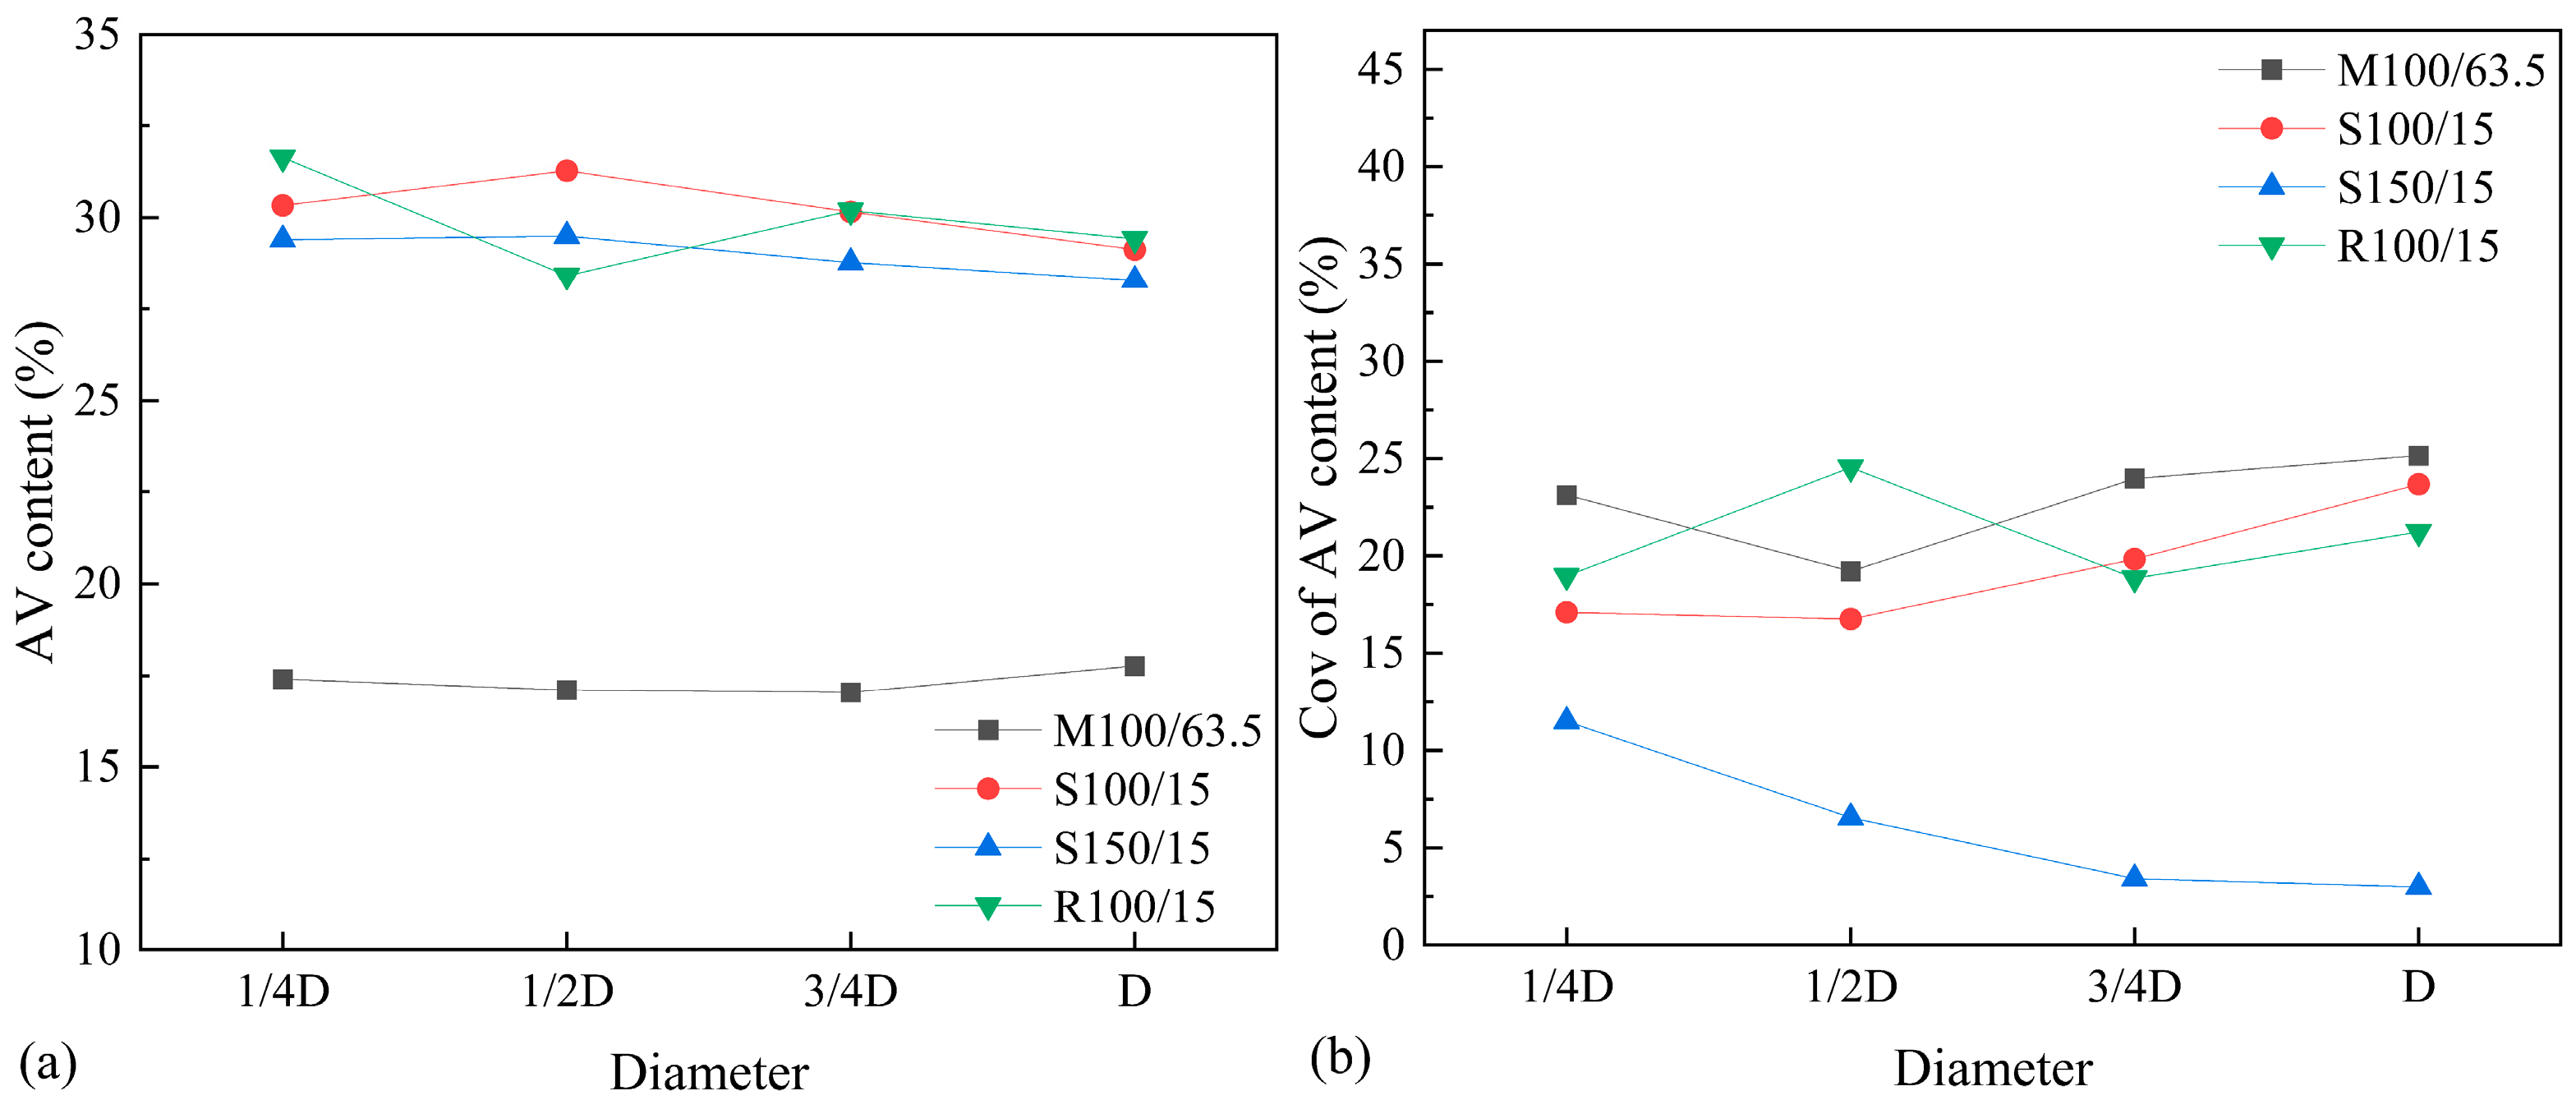
- To analyze the relationship between the AV characteristics of the MCM-designed laboratory specimens and the simulated field cores molded using the SGC and RWC methods, we evaluated the rationality of the UPFC mixes designed using the MCM.
2.2. Raw Materials and Mix Design
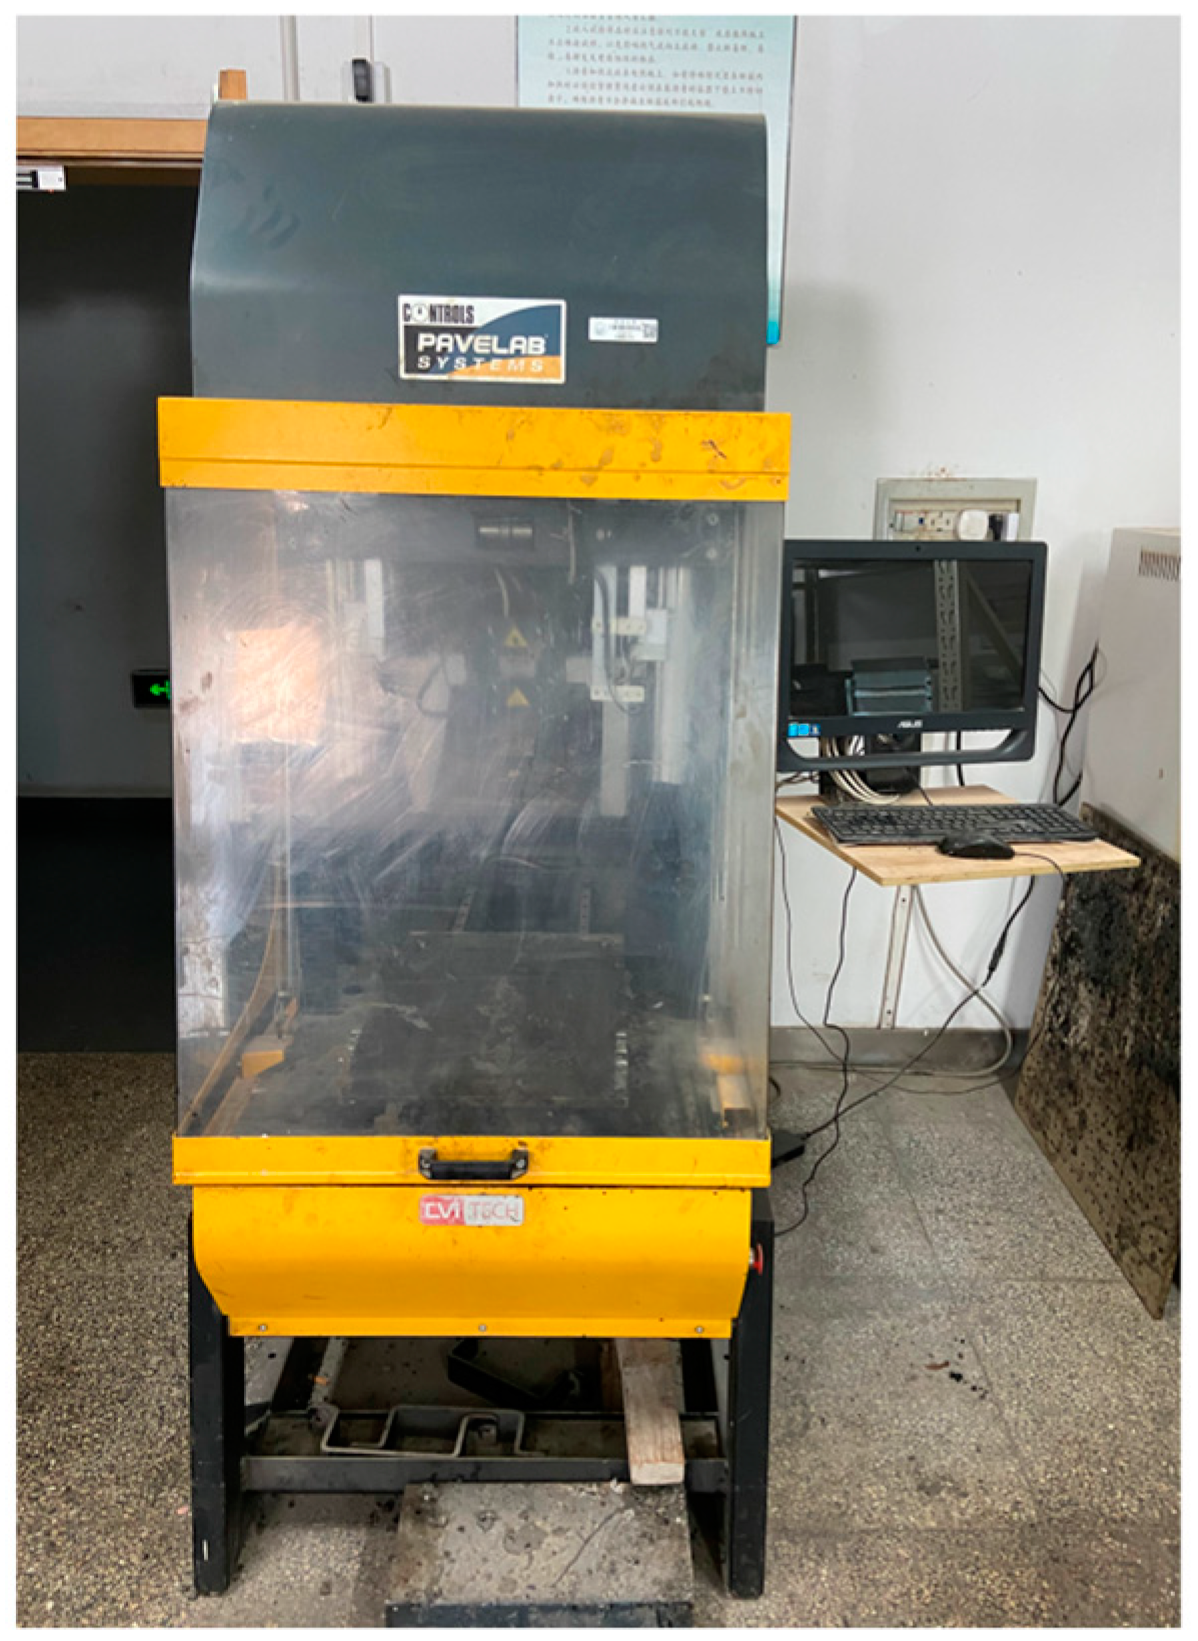
2.3. Methodology and Testing
2.3.1. Compaction Characteristics of OGFC-5 UPFC with Different Thicknesses
2.3.2. Compaction Mechanism of OGFC-5 UPFC with Different Thicknesses
2.3.3. AV Characterization of OGFC-5 UPFC Based on CT Scanning
3. Results and Discussion
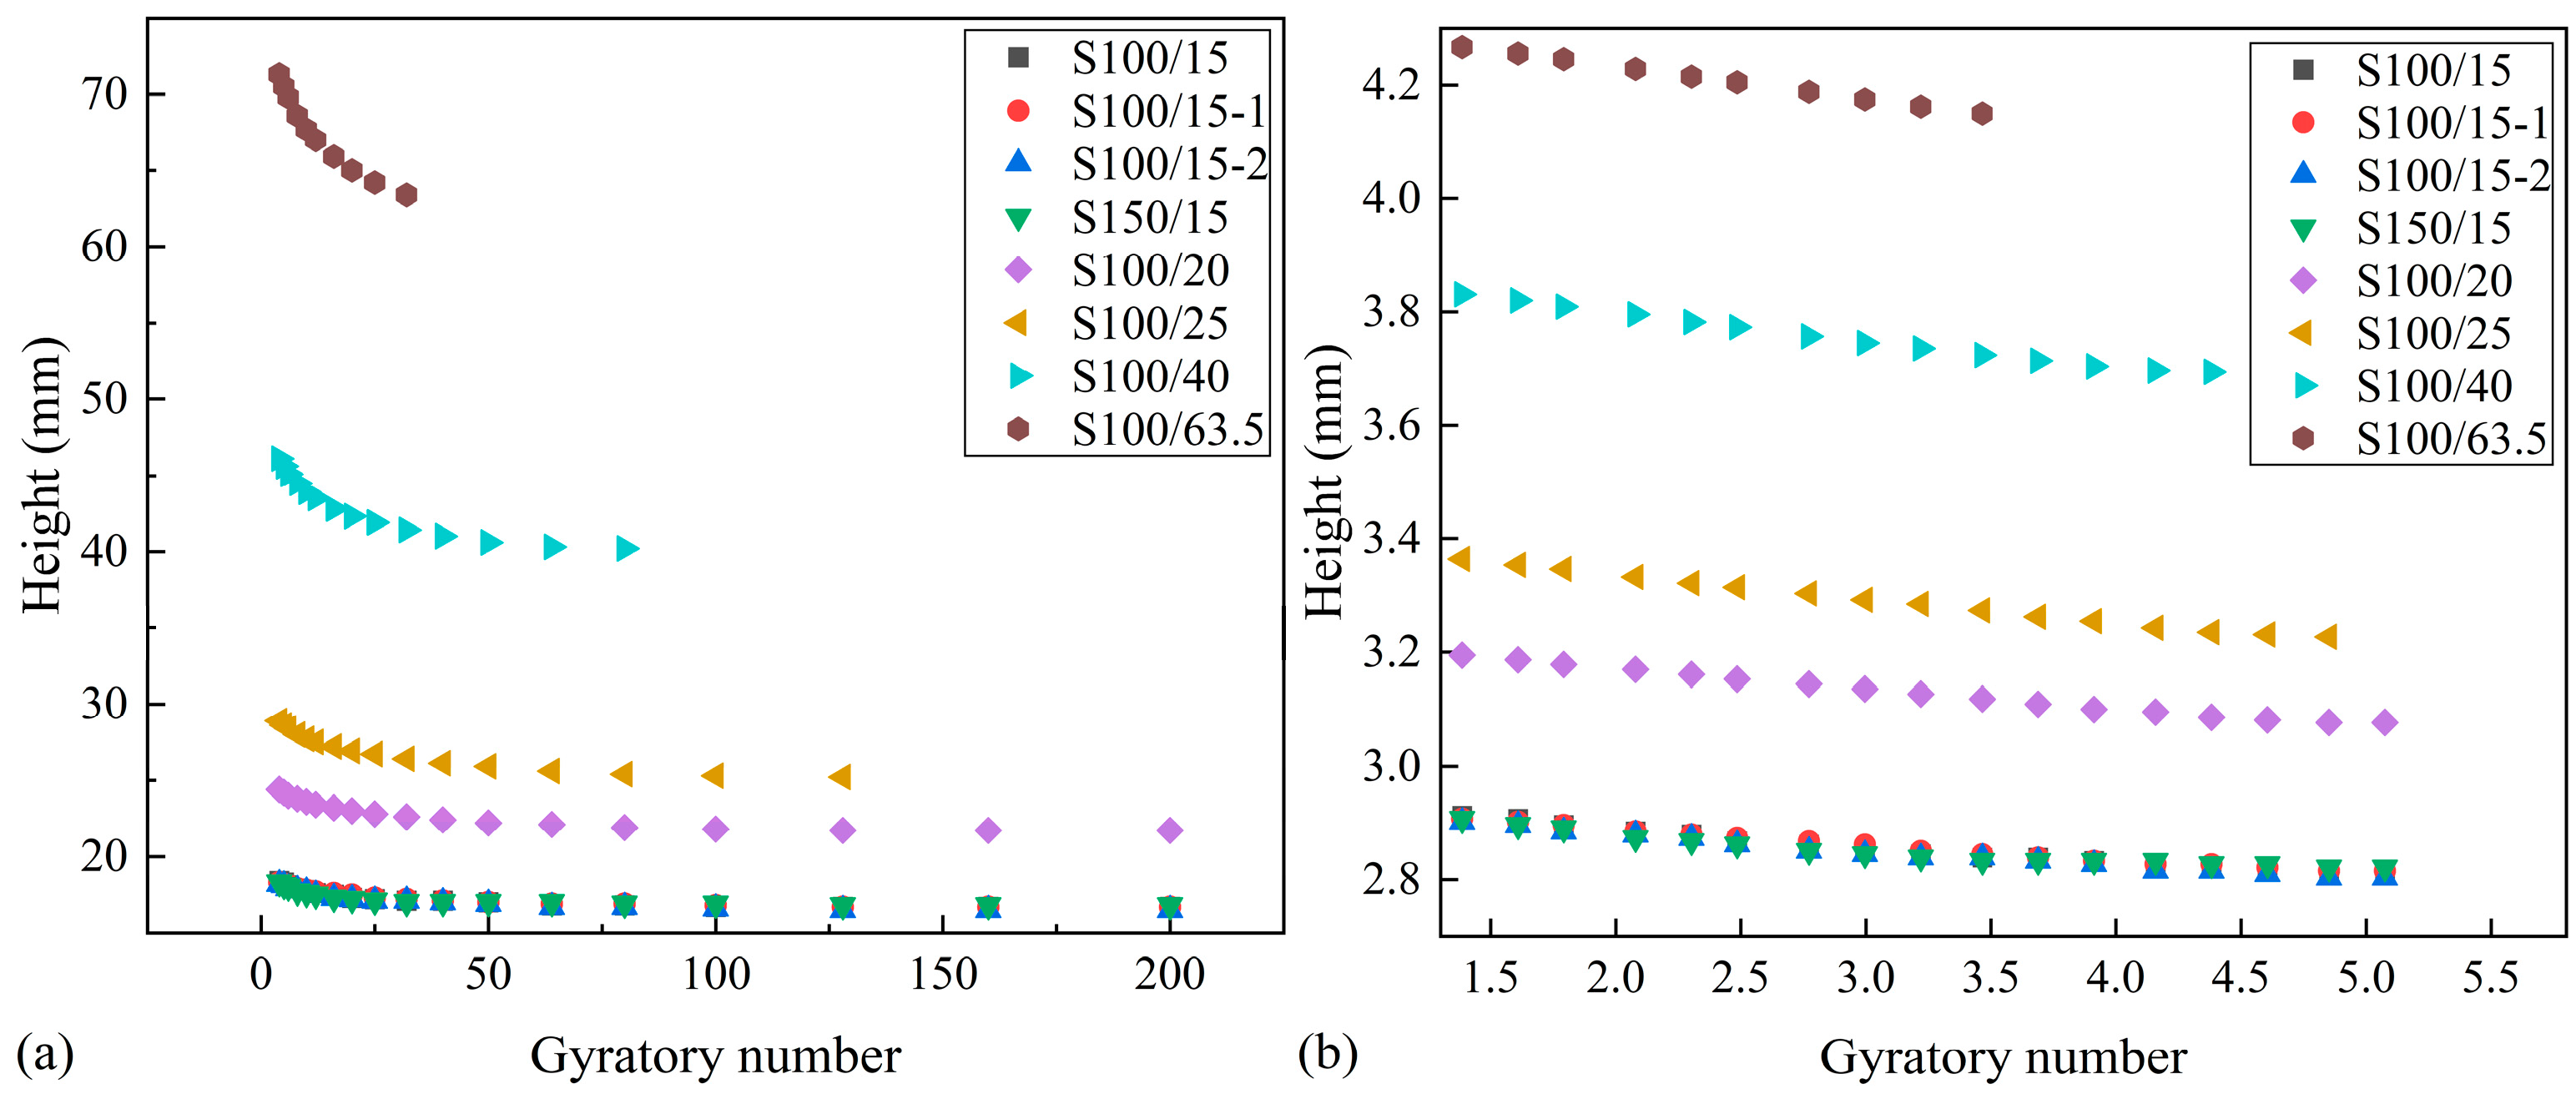
3.1. Compaction Properties of OGFC-5 UPFC with Different Thickness
3.2. Compaction Mechanism of OGFC-5 UPFC with Different Thickness
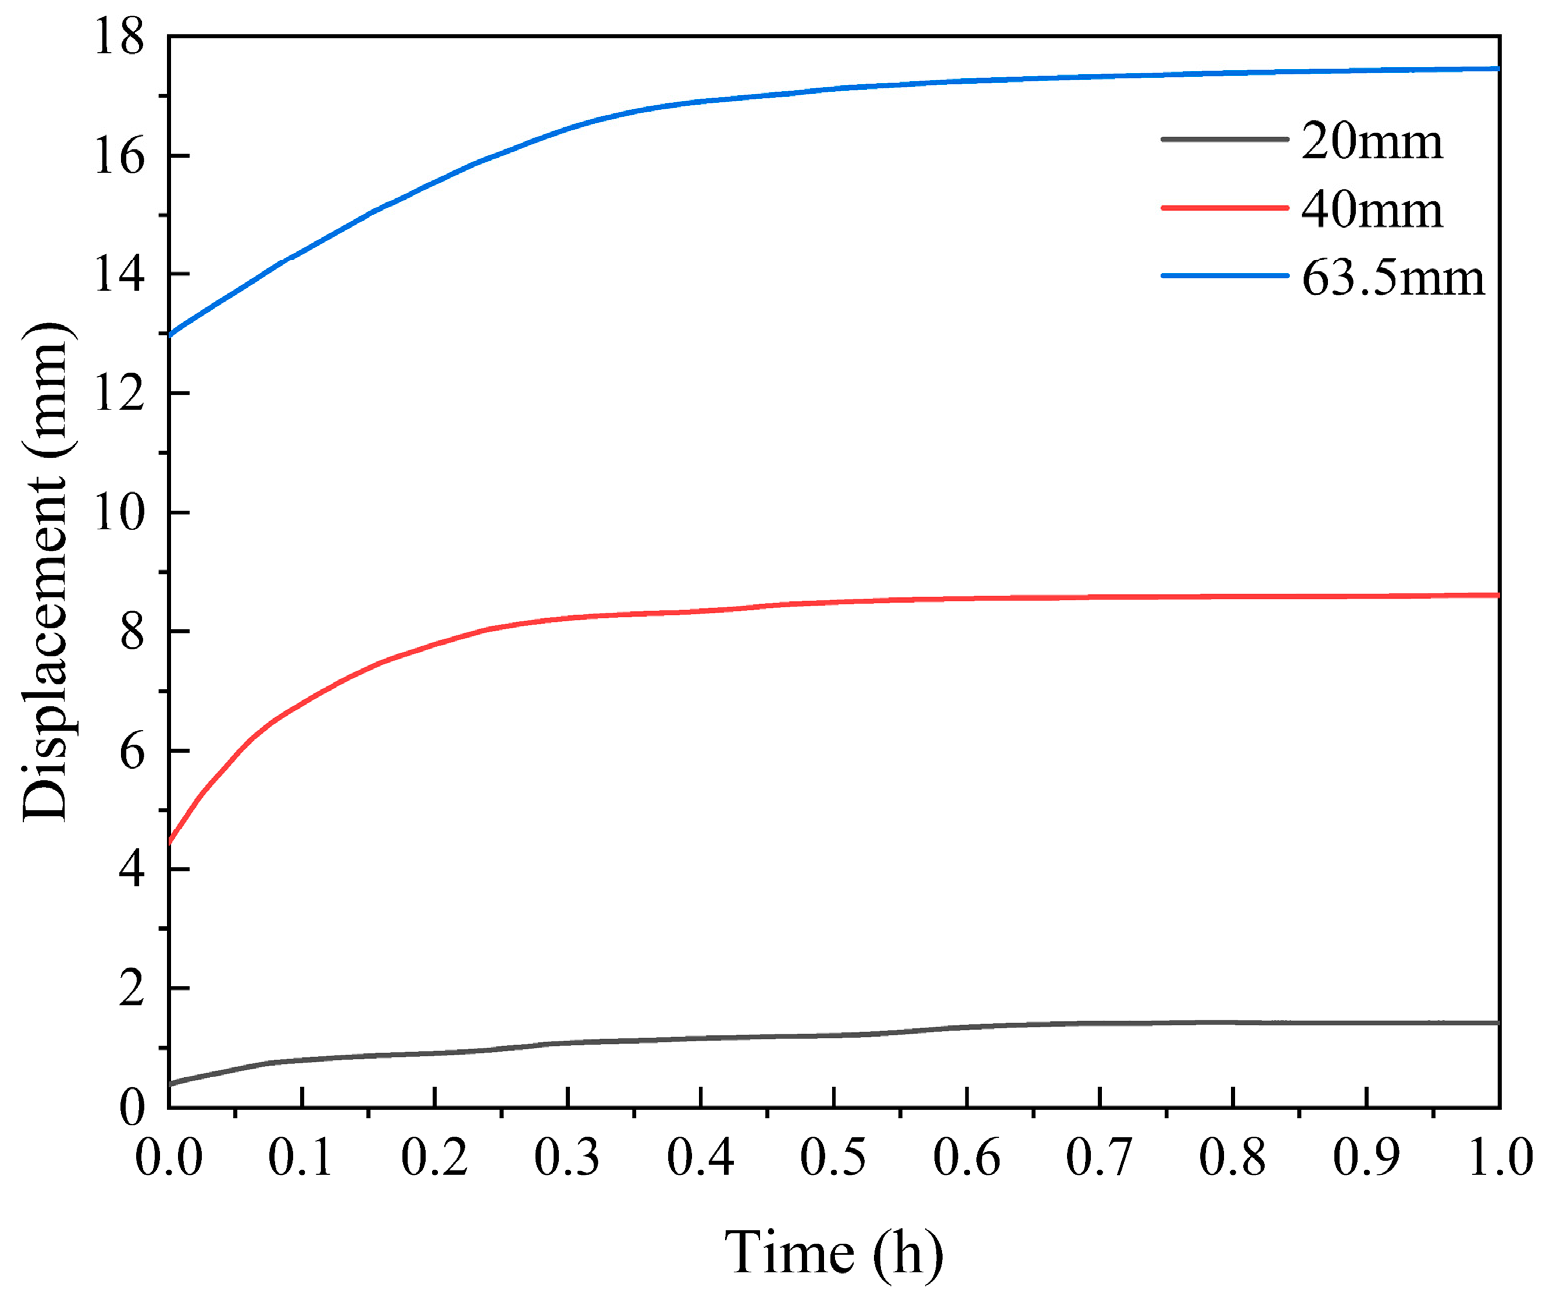
3.2.1. Displacement and Stress of Loading Wall
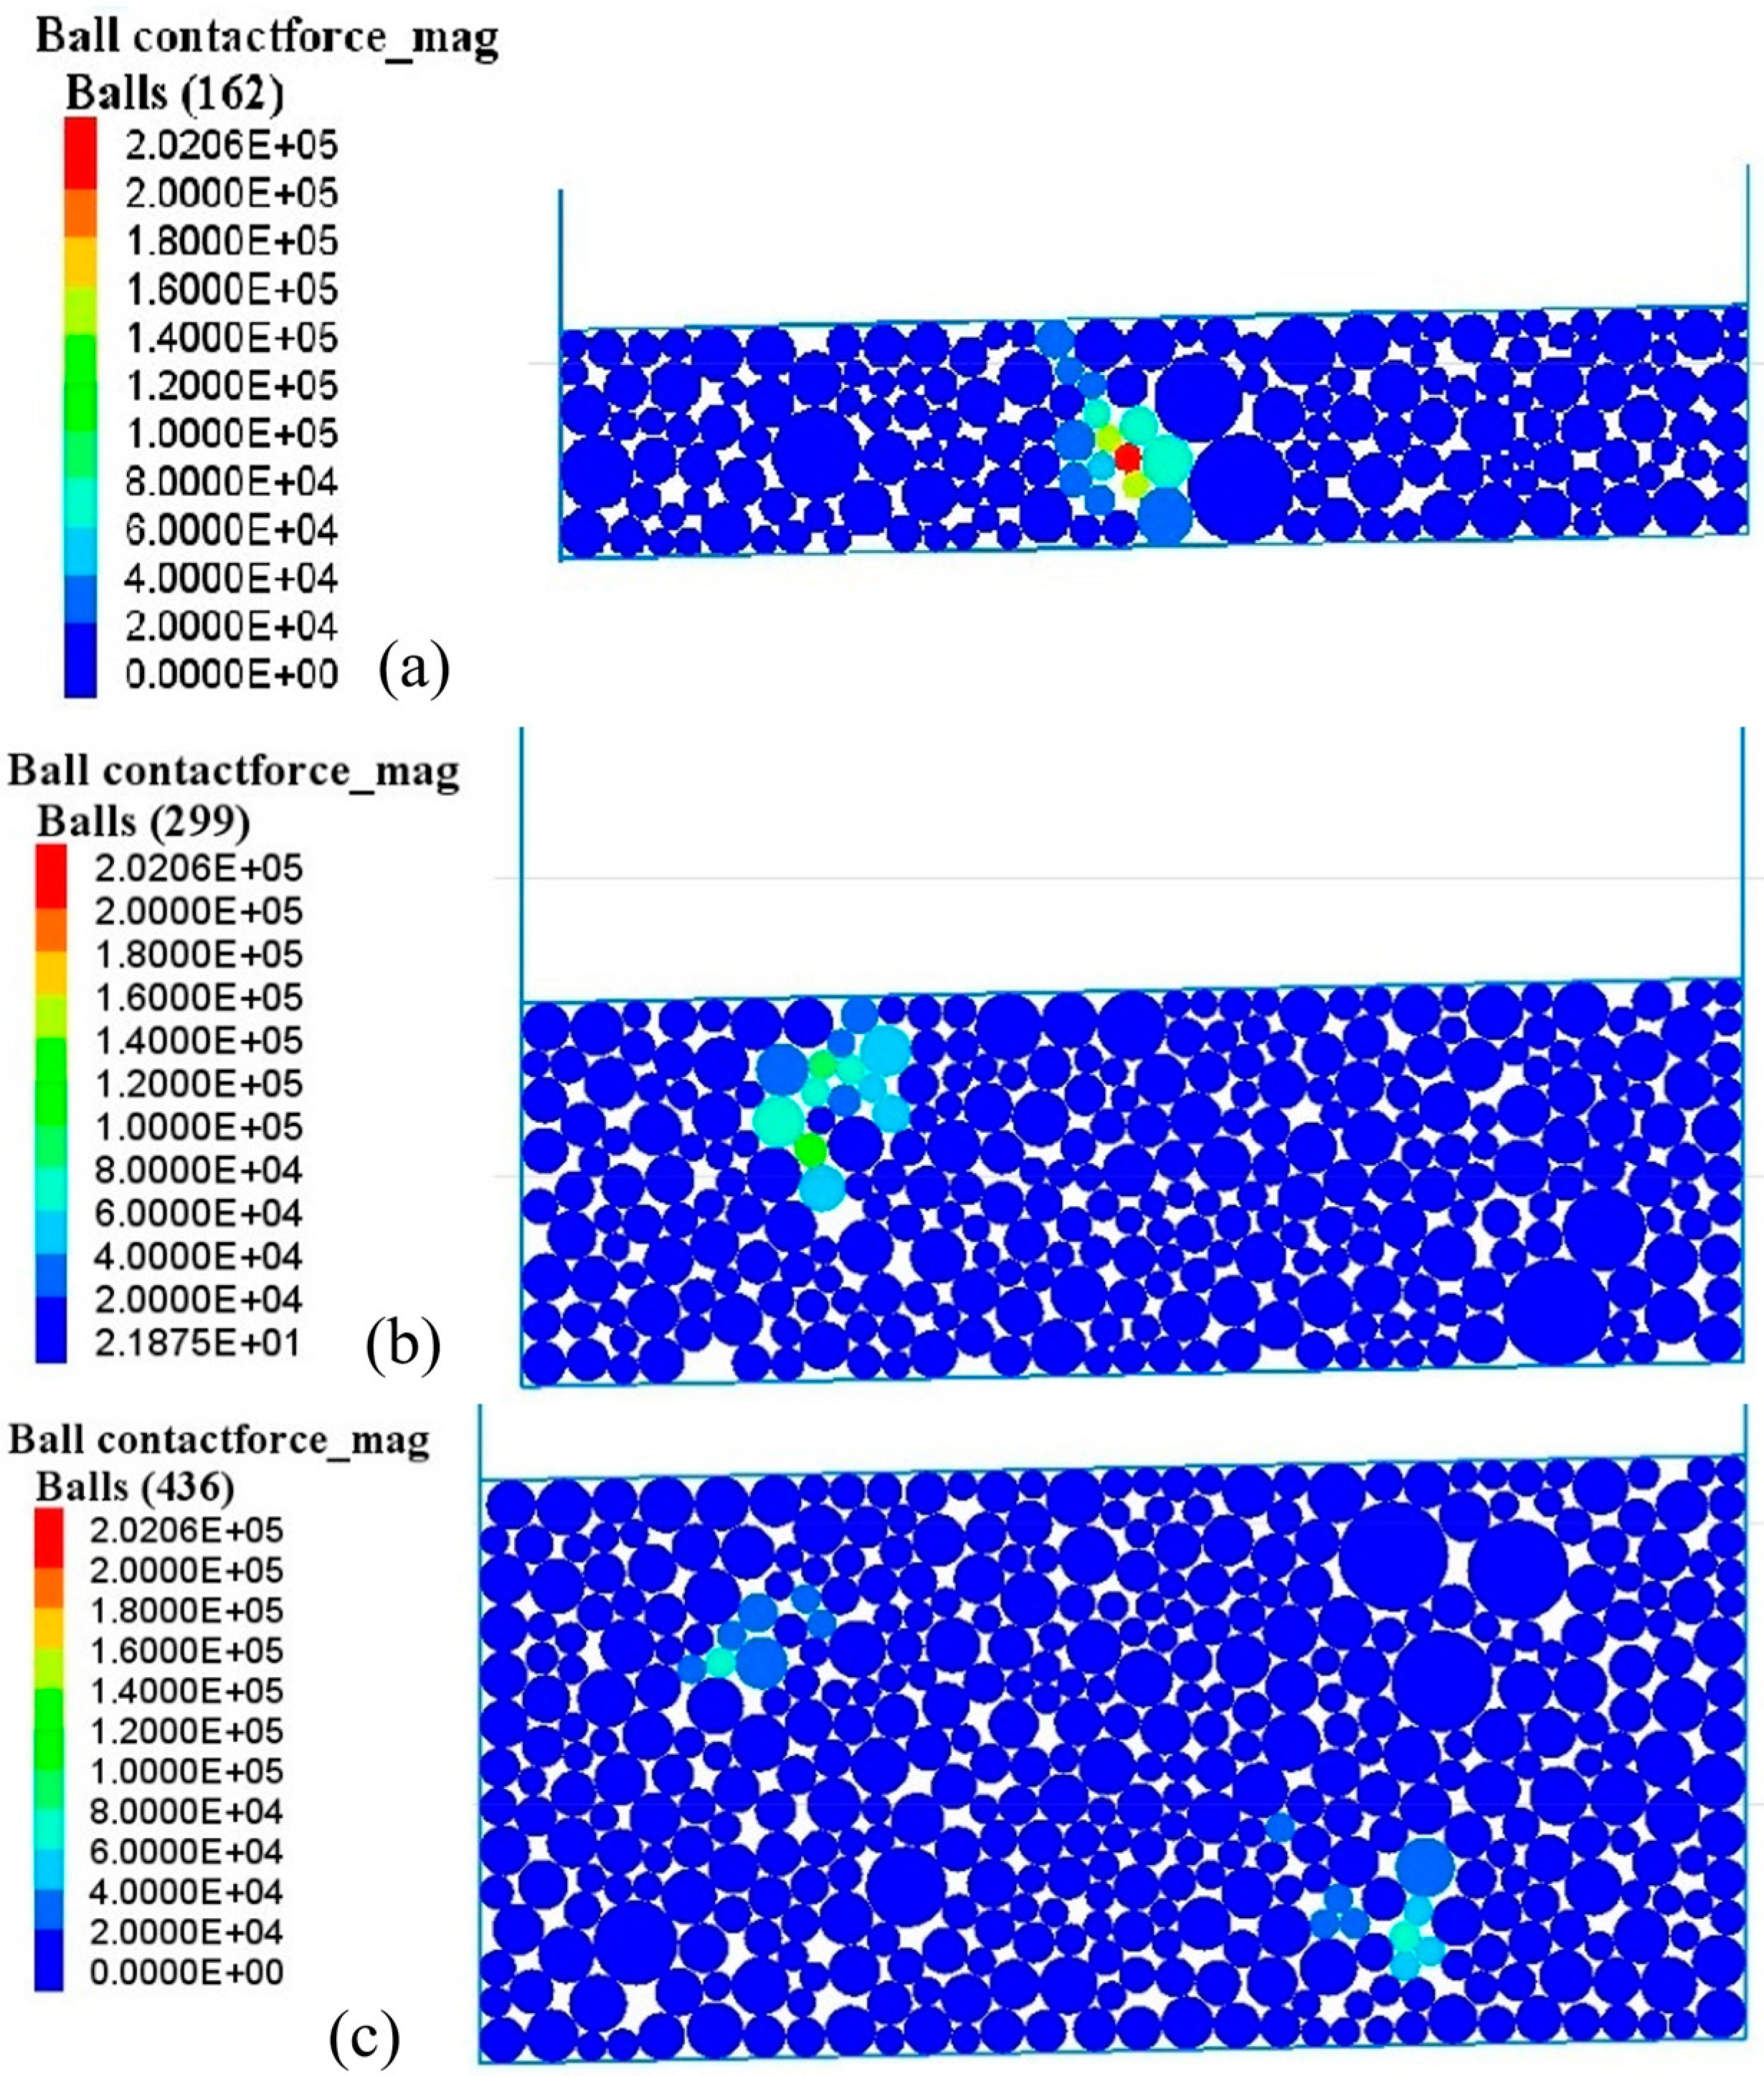
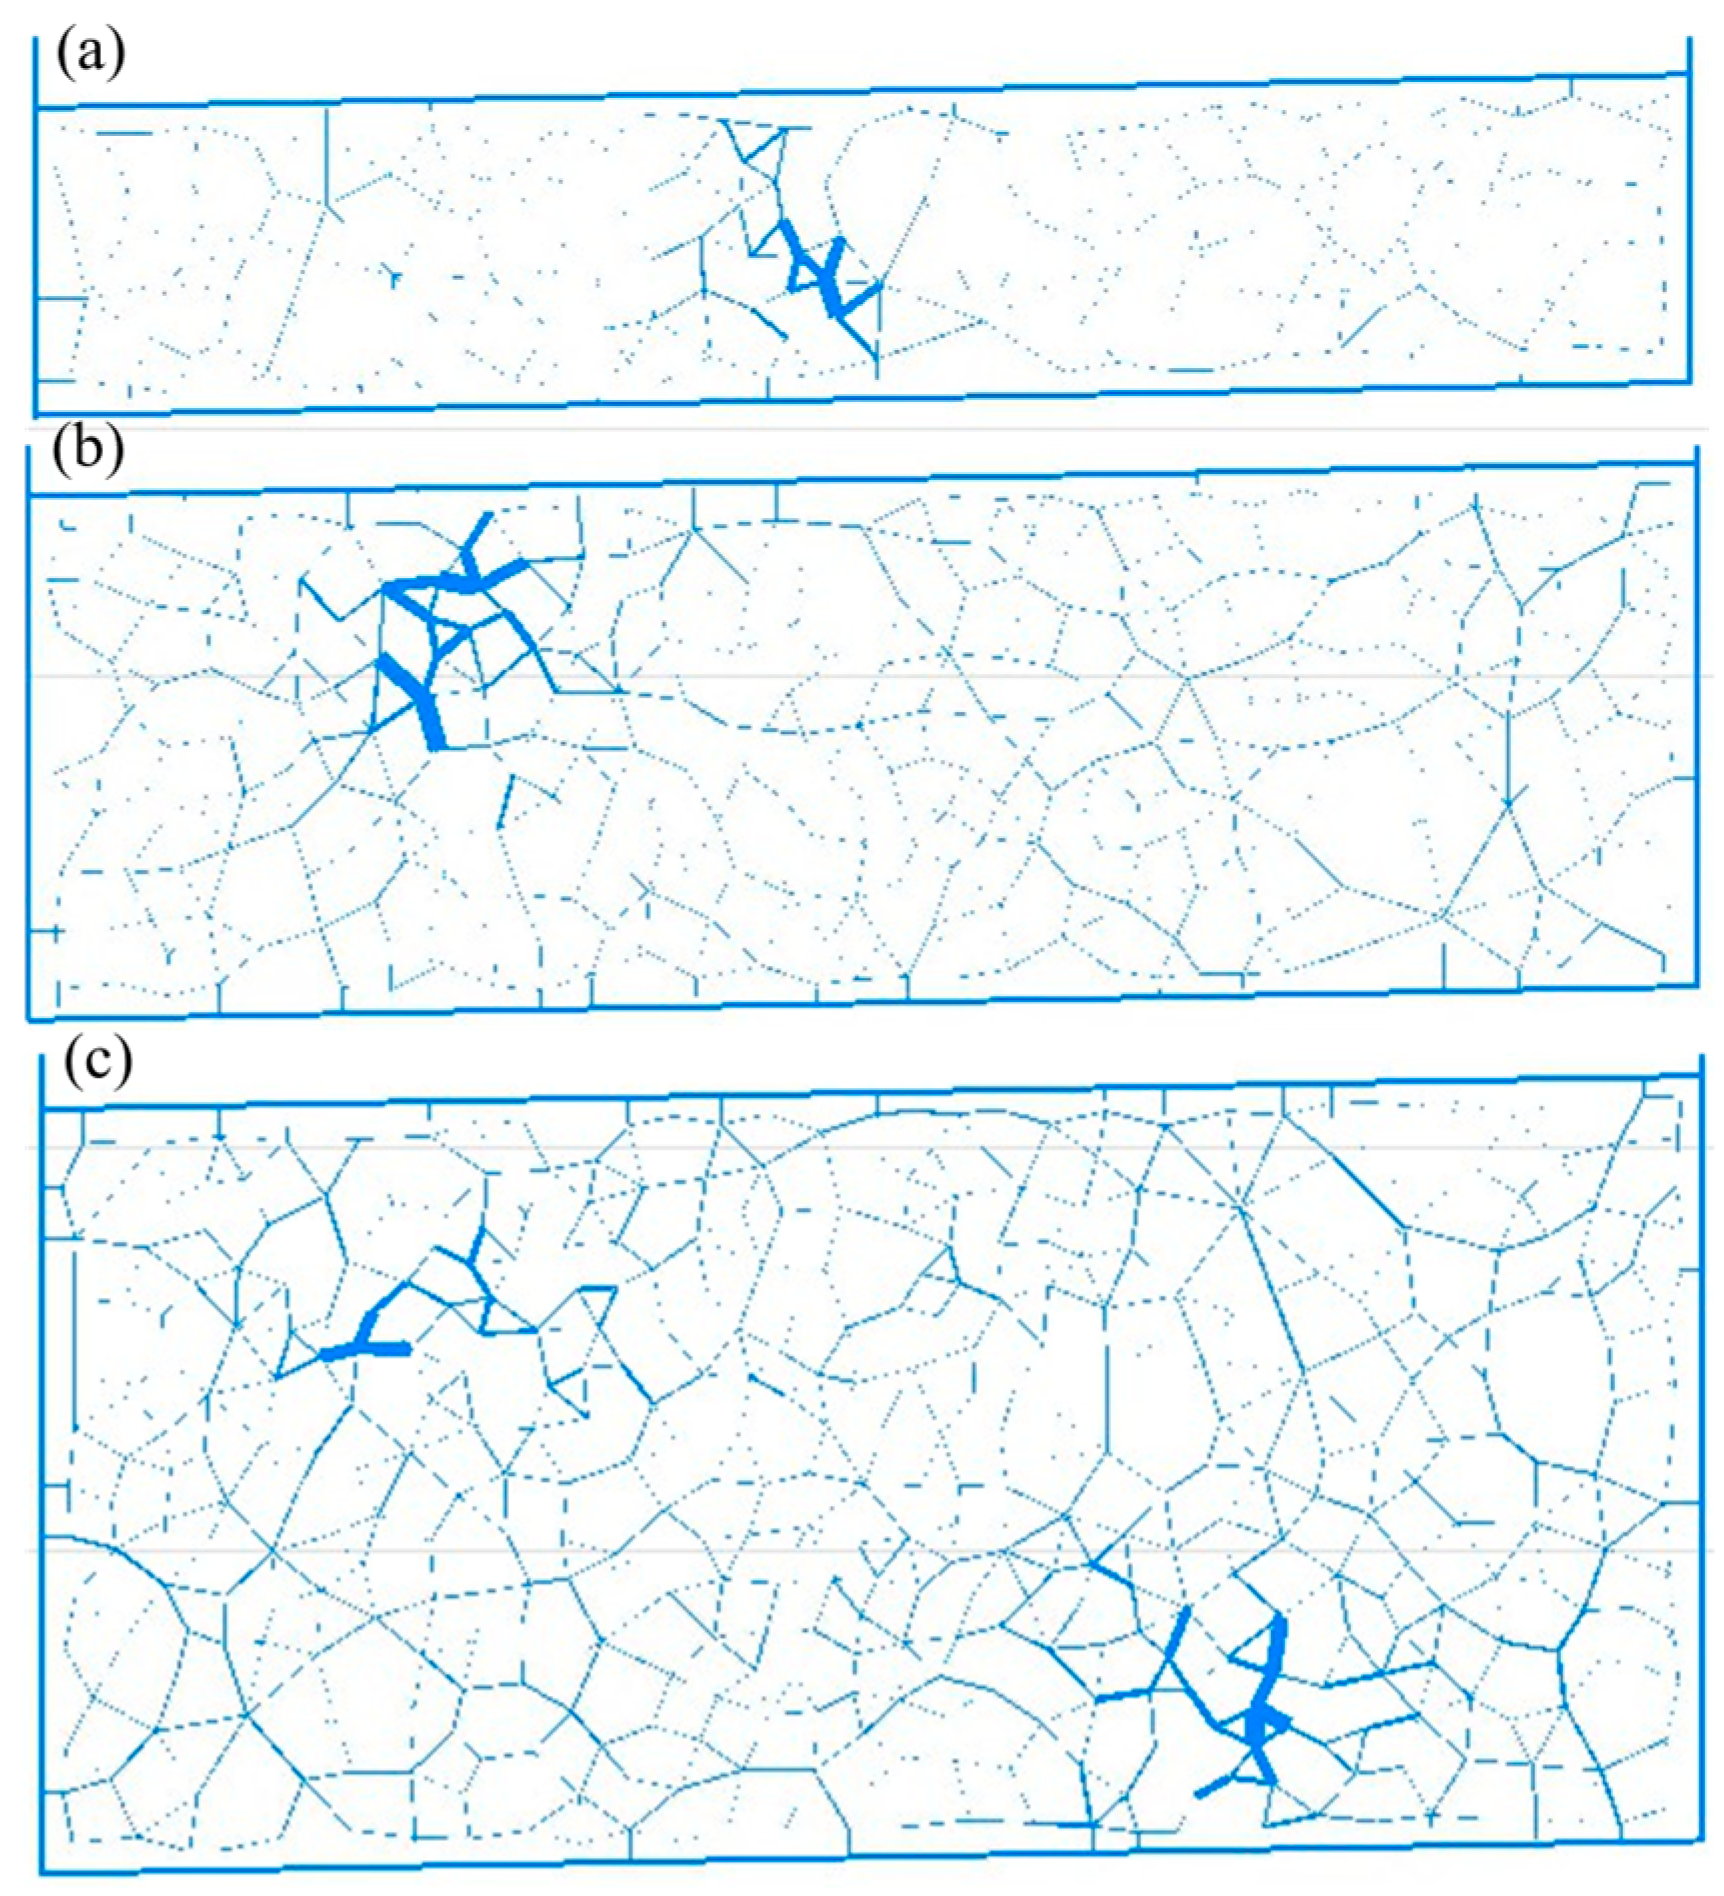
3.2.2. Micromechanical Response
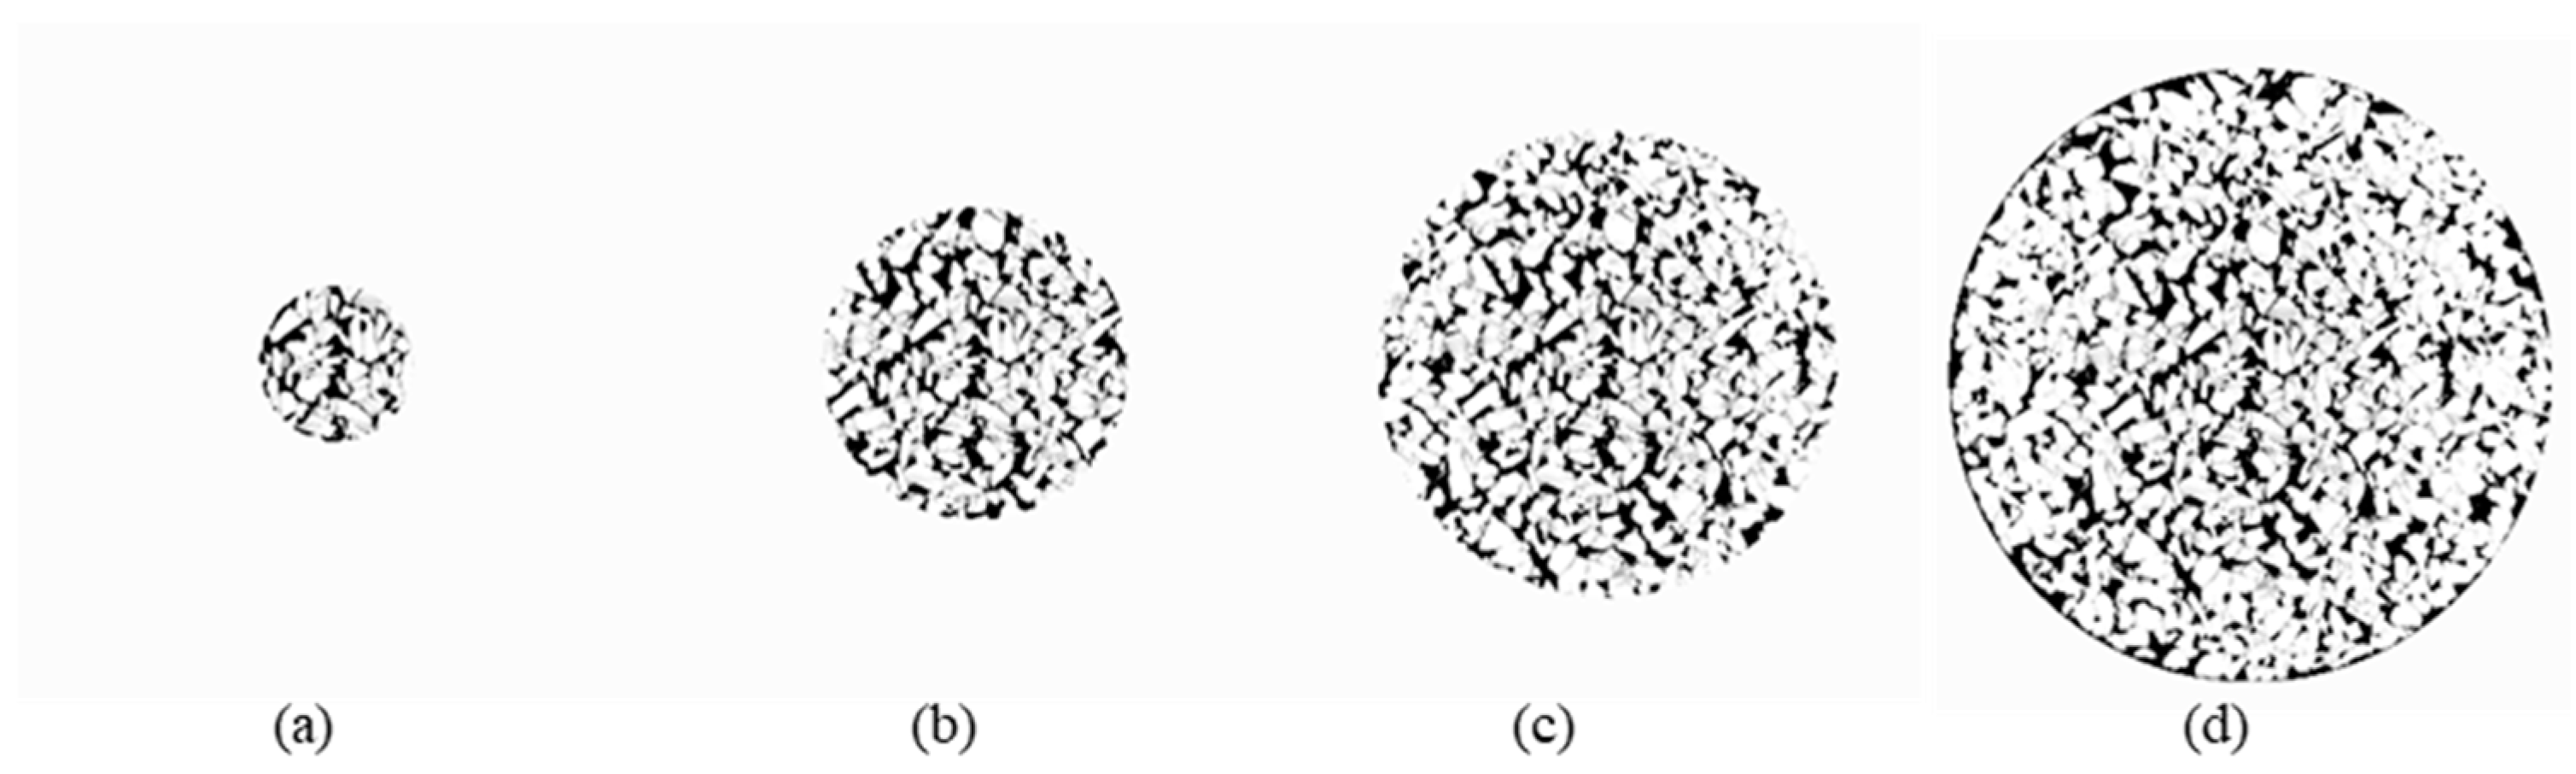
3.3. AV Characterization of OGFC-5 UPFC Based on CT Scanning
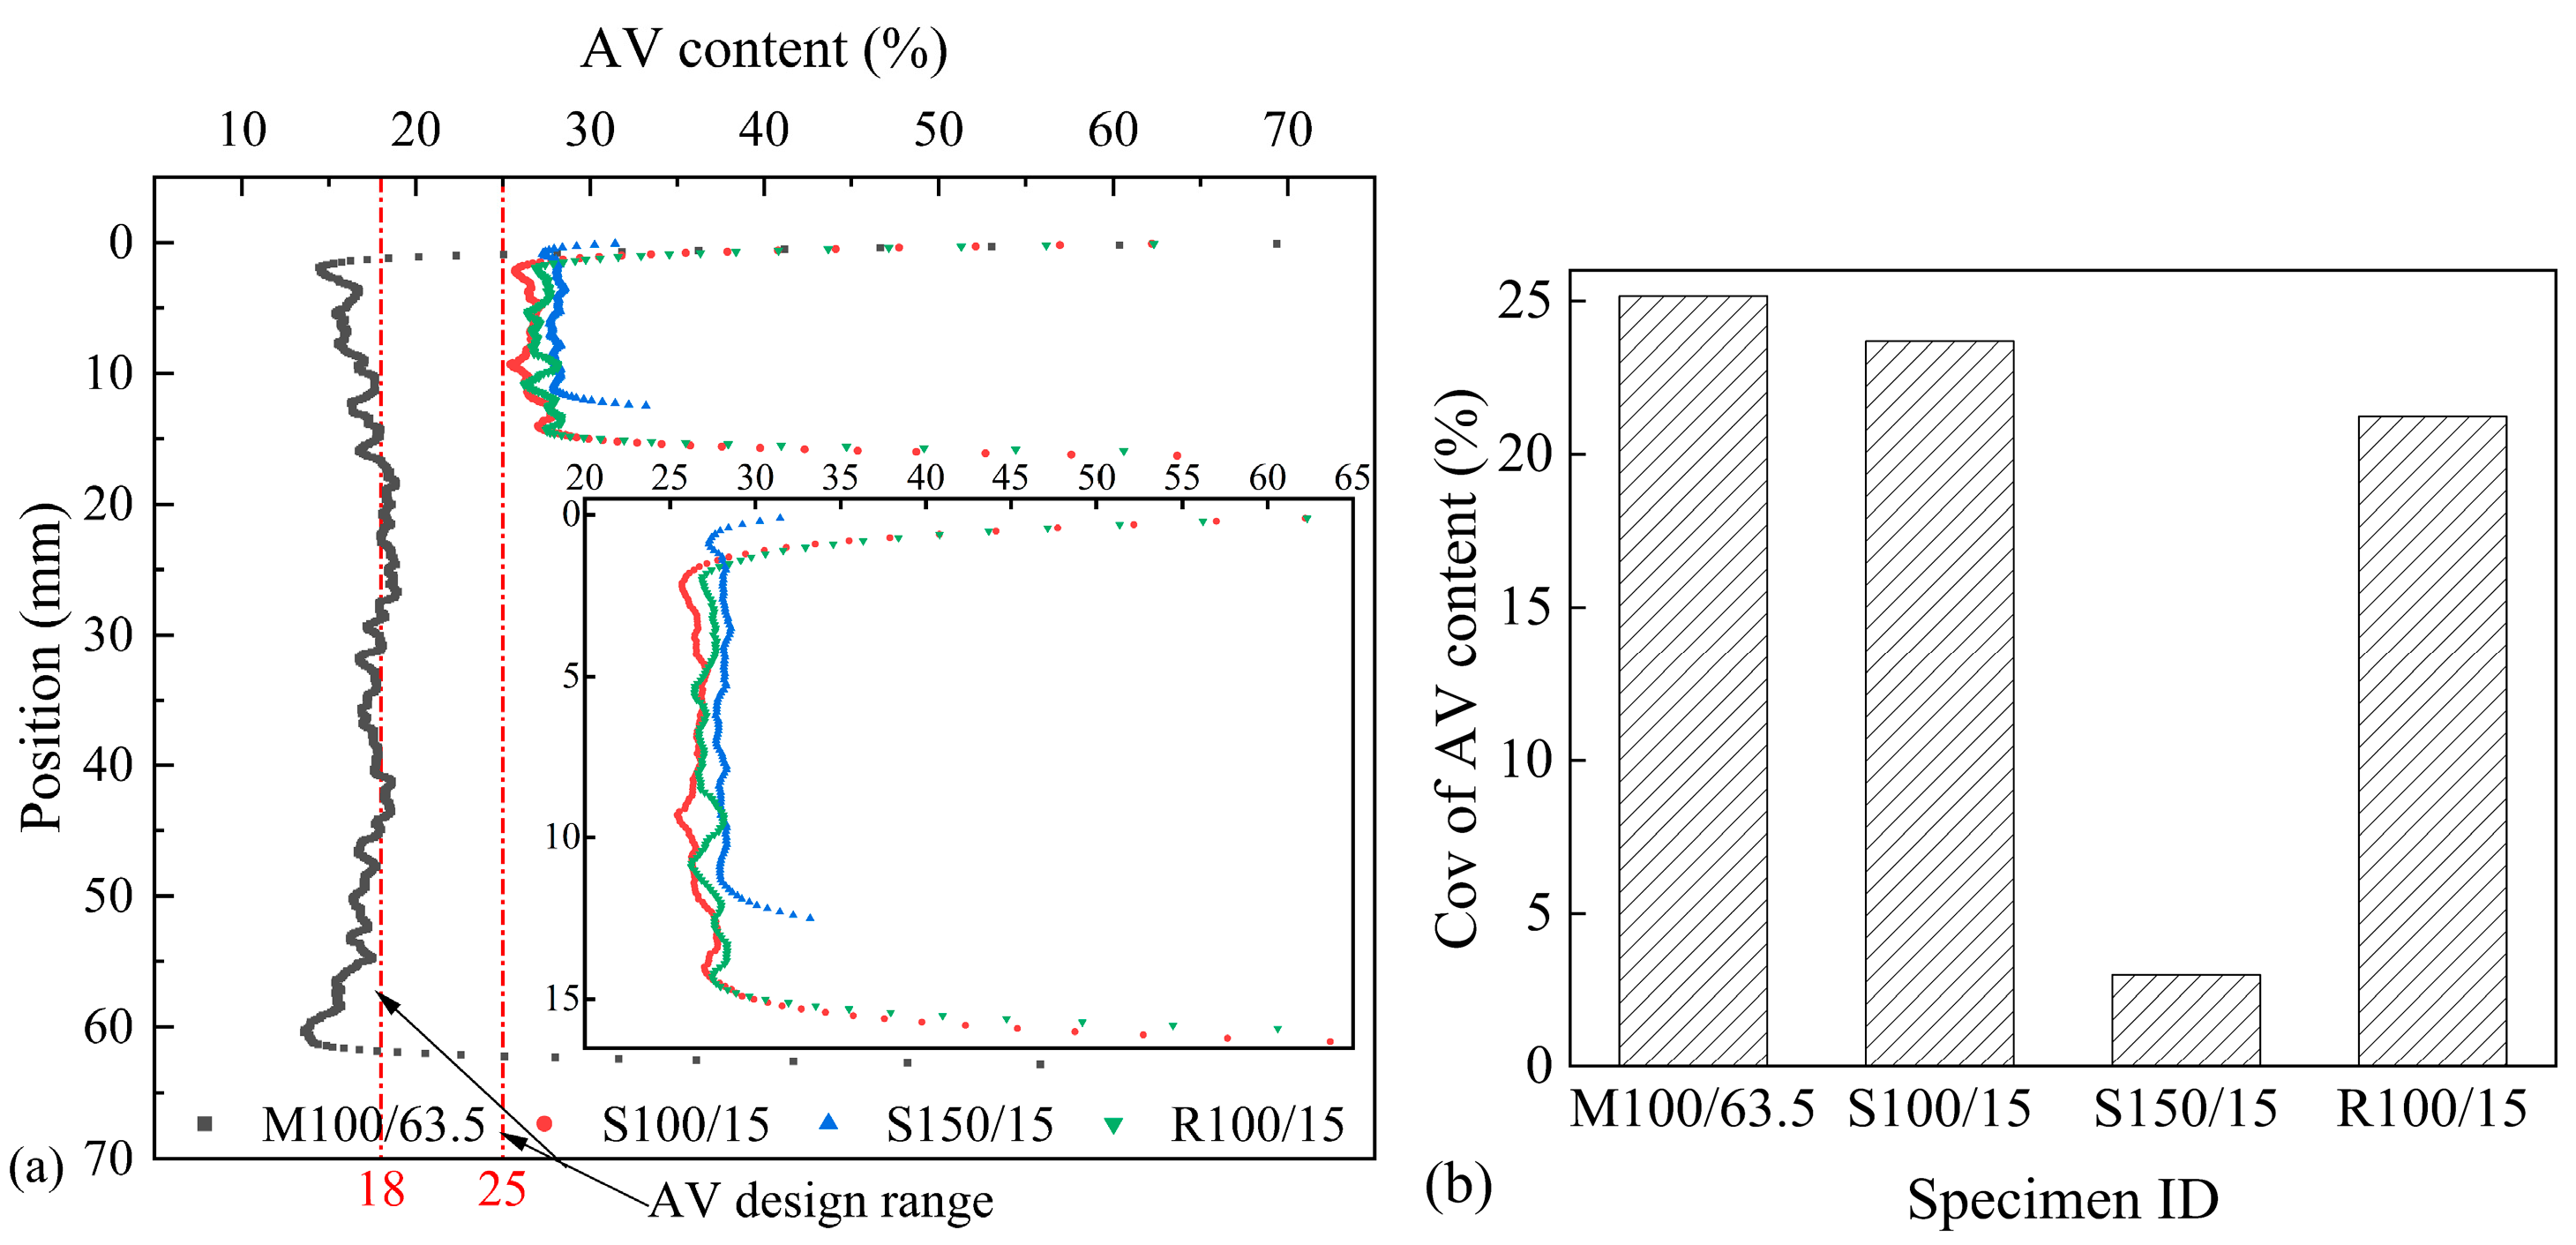
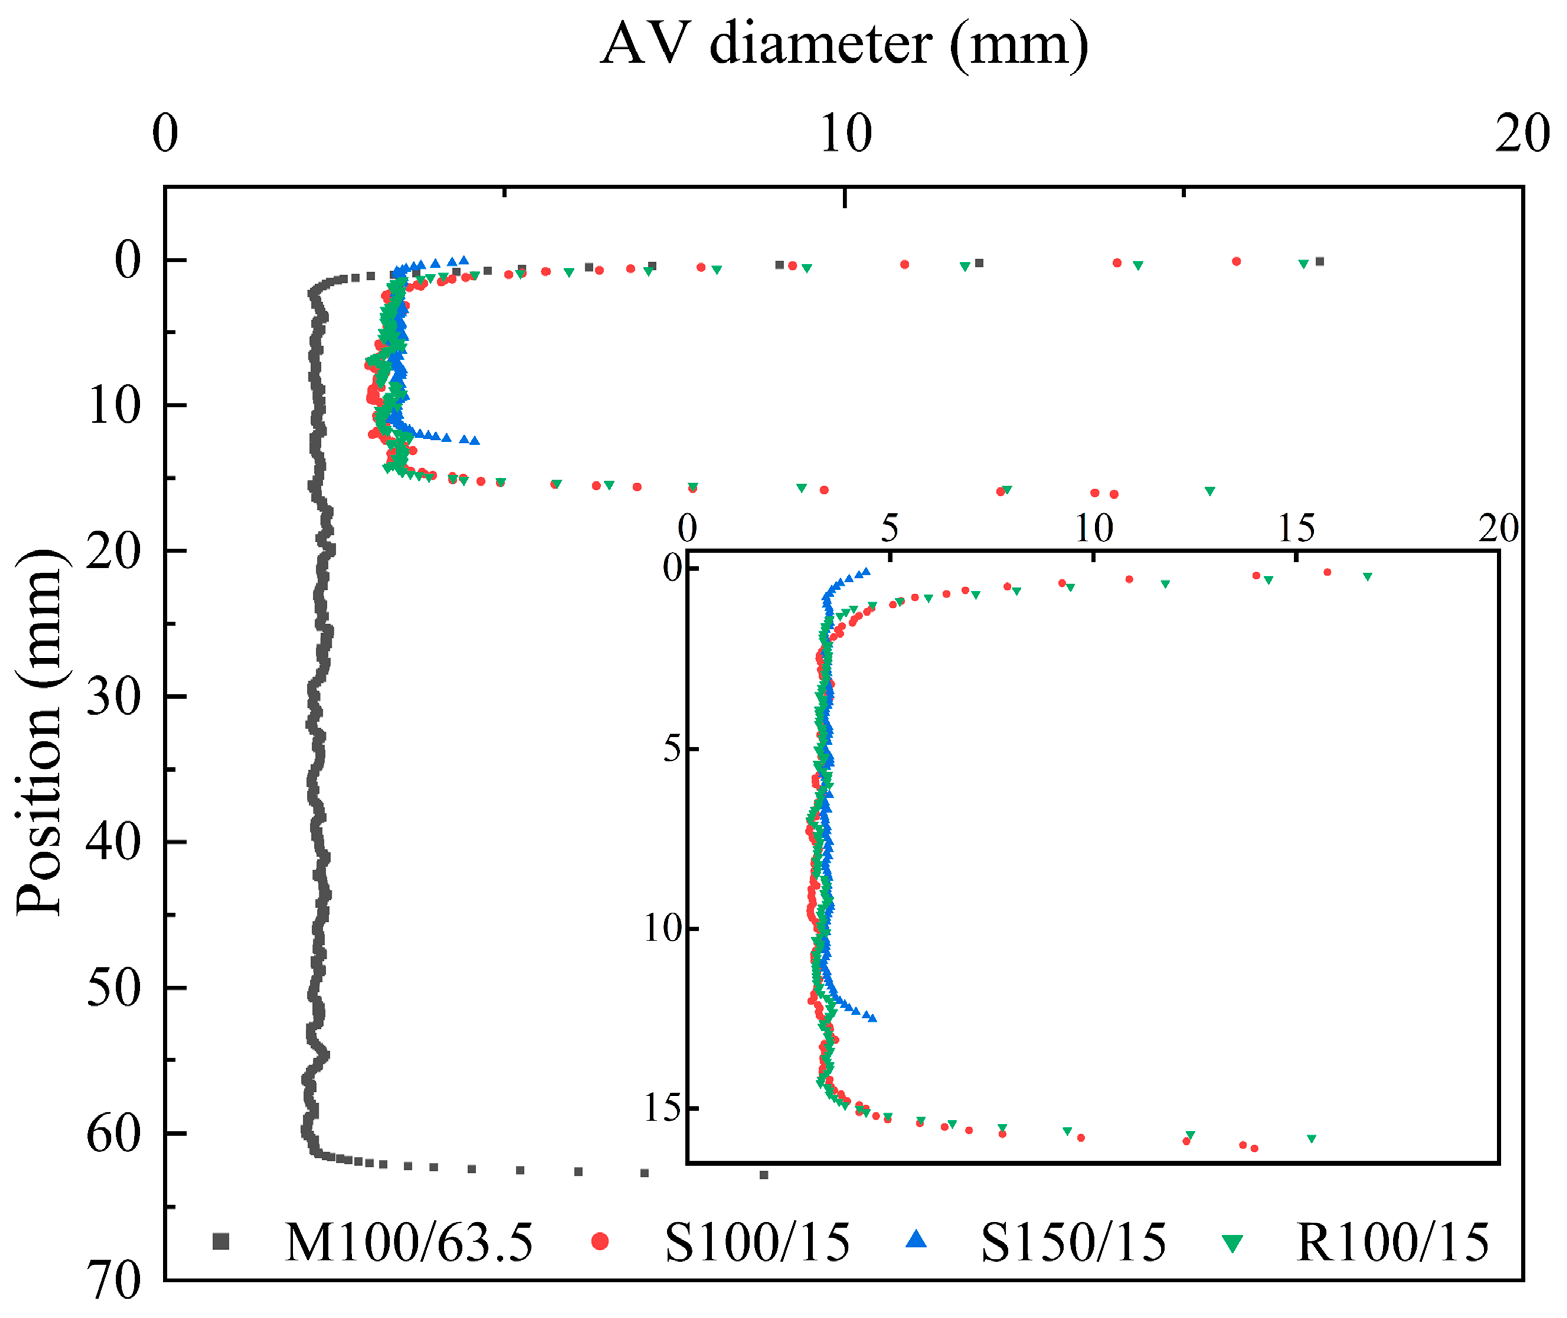
3.3.1. Vertical Distribution
3.3.2. Horizontal Distribution
4. Conclusions
- (1)
- The compaction-test data demonstrate that the simulated field specimens with thicknesses of 15 and 20 mm barely achieved the target compaction thicknesses. All the UPFC specimens of different thicknesses failed to meet the AV requirements of the UPFC mixes designed via the MCM.
- (2)
- As the compaction thickness decreased, the values of parameters a and k also decreased. The initial compaction density of the UPFC specimen decreased, which resulted in compaction difficulties.
- (3)
- According to the results of the SGC test based on the DEM, the smaller the height of the virtual specimen, the earlier its displacement and stress reached a stable state. Moreover, as the model decreased in height, the DH value; that is, the compacted thickness per unit height of the model, decreased, and the model was more difficult to compact.
- (4)
- DEM models with different thicknesses exhibited several force concentration regions. Compared to that of the 63.5 mm model, the maximum contact normal force of the 20 mm and 40 mm models increased by 266% and 800%, respectively. The decrease in the UPFC thickness strengthened the strong force chain in quantity and strength inside the specimen, resulting in difficulty in evenly diffusing and transferring pressure inside the specimen.
- (5)
- Based on the results of the UPFC specimens obtained using CT scanning, a small compaction thickness was conducive to uniform compaction. The AV distributions of the Marshall specimens were quite different in the vertical and horizontal directions from those of the UPFC specimens that simulated the field compaction. The MCM-designed UPFCs showed poor consistency with the field compaction.
- (6)
- According to the investigation results, the MCM-designed UPFC is not in compliance with on-site construction. In order to better align with actual construction and ensure the performance of the UPFC, potential paths to improve UPFC designs from the perspective of mixture design include reducing the height of the MCM design specimens and changing the UPFC design methods.
Author Contributions
Funding
Institutional Review Board Statement
Informed Consent Statement
Data Availability Statement
Conflicts of Interest
References
- Suresha, S.N.; George, V.; Ravi Shankar, A.U. Effect of aggregate gradations on properties of porous friction course mixes. Mater. Struct. 2009, 43, 789–801. [Google Scholar] [CrossRef]
- Kandhal, P.S.; Mallick, R.B. Open Graded Friction Course: State of the Practice; Transportation Research Board, National Research Council: Washington, DC, USA, 1998. [Google Scholar]
- Chen, J.-S.; Yang, C.H. Porous asphalt concrete: A review of design, construction, performance and maintenance. Int. J. Pavement Res. Technol. 2021, 13, 601–612. [Google Scholar] [CrossRef]
- Im, S.; You, T.; Kim, Y.-R.; Nsengiyumva, G.; Rea, R.; Haghshenas, H. Evaluation of Thin-Lift Overlay Pavement Preservation Practice: Mixture Testing, Pavement Performance, and Lifecycle Cost Analysis. J. Transp. Eng. Part B Pavements 2018, 144, 04018037. [Google Scholar] [CrossRef]
- Alvarez, A.E.; Martin, A.E.; Estakhri, C. A review of mix design and evaluation research for permeable friction course mixtures. Constr. Build. Mater. 2011, 25, 1159–1166. [Google Scholar] [CrossRef]
- Wu, W.; Jiang, W.; Xiao, J.; Yuan, D.; Wang, T.; Ling, X. Investigation of LAS-based fatigue evaluation methods for high-viscosity modified asphalt binders with high-content polymers. Constr. Build. Mater. 2024, 422, 135810. [Google Scholar] [CrossRef]
- Son, S.; Al-Qadi, I.L.; Zehr, T. 4.75 mm SMA Performance and Cost-Effectiveness for Asphalt Thin Overlays. Int. J. Pavement Eng. 2015, 17, 799–809. [Google Scholar] [CrossRef]
- Yu, J.; Chen, F.; Deng, W.; Ma, Y.; Yu, H. Design and performance of high-toughness ultra-thin friction course in south China. Constr. Build. Mater. 2020, 246, 118508. [Google Scholar] [CrossRef]
- Yu, J.; Yang, N.; Chen, F.; Chen, Y.; Lin, Z.; Yu, H. Design of Cold-Mixed High-Toughness Ultra-Thin Asphalt Layer towards Sustainable Pavement Construction. Buildings 2021, 11, 619. [Google Scholar] [CrossRef]
- Liu, Z.; Wang, X.; Luo, S.; Yang, X.; Li, Q. Asphalt mixture design for porous ultra-thin overlay. Constr. Build. Mater. 2019, 217, 251–264. [Google Scholar] [CrossRef]
- Liu, Z.; Luo, S.; Quan, X.; Wei, X.; Yang, X.; Li, Q. Laboratory evaluation of performance of porous ultra-thin overlay. Constr. Build. Mater. 2019, 204, 28–40. [Google Scholar] [CrossRef]
- Ding, L.; Wang, X.; Zhang, K.; Zhang, M.; Yang, J.; Chen, Z. Durability evaluation of easy compaction and high-durability ultra-thin overlay. Constr. Build. Mater. 2021, 302, 124407. [Google Scholar] [CrossRef]
- Tian, J.; Luo, S.; Liu, Z.; Yang, X.; Lu, Q. Determination of Construction Parameters of Porous Ultra-Thin Overlays Based on Laboratory Compaction Studies. Materials 2020, 13, 4496. [Google Scholar] [CrossRef] [PubMed]
- Hunter, A.E.; McGreavy, L.; Airey, G.D. Effect of compaction mode on the mechanical performance and variability of asphalt mixtures. J. Transp. Eng. 2009, 135, 839–851. [Google Scholar] [CrossRef]
- Suresha, S.N.; Varghese, G.; Shankar, A.U.R. Characterization of porous friction course mixes for different Marshall compaction efforts. Constr. Build. Mater. 2009, 23, 2887–2893. [Google Scholar] [CrossRef]
- Norhidayah, A.H.; Mahmud, M.Z.H.; Ramadhansyah, P.J. Air Void Characterisation in Porous Asphalt Using X-Ray Computed Tomography. Adv. Mater. Res. 2014, 911, 443–448. [Google Scholar] [CrossRef]
- Alvarez, A.E.; Martin, A.E.; Estakhri, C. Effects of densification on permeable friction course mixtures. J. Test. Eval. 2009, 37, 11–20. [Google Scholar] [CrossRef]
- Alvarez, A.E.; Martin, A.E.; Estakhri, C. Internal structure of compacted permeable friction course mixtures. Constr. Build. Mater. 2010, 24, 1027–1035. [Google Scholar] [CrossRef]
- Wang, S.; Zhao, S.; Al-Qadi, I.L. Real-Time Density and Thickness Estimation of Thin Asphalt Pavement Overlay During Compaction Using Ground Penetrating Radar Data. Surv. Geophys. 2019, 41, 431–445. [Google Scholar] [CrossRef]
- Khan, Z.A.; Wahab, H.I.A.-A.; Asi, I.; Ramadhan, R. Comparative study of asphalt concrete laboratory compaction methods to simulate field compaction. Constr. Build. Mater. B 1998, 12, 373–384. [Google Scholar] [CrossRef]
- Liu, P.; Xu, H.; Wang, D.; Wang, C.; Schulze, C.; Oeser, M. Comparison of mechanical responses of asphalt mixtures manufactured by different compaction methods. Constr. Build. Mater. 2018, 162, 765–780. [Google Scholar] [CrossRef]
- Ji, X.; Han, B.; Hu, J.; Li, S.; Xiong, Y.; Sun, E. Application of the discrete element method and CT scanning to investigate the compaction characteristics of the soil–rock mixture in the subgrade. Road Mater. Pavement Des. 2020, 23, 397–413. [Google Scholar] [CrossRef]
- Li, Y.; Jiang, W.; Shan, J.; Li, P.; Lu, R.; Lou, B. Characteristics of void distribution and aggregate degradation of asphalt mixture specimens compacted using field and laboratory methods. Constr. Build. Mater. 2021, 270, 121488. [Google Scholar] [CrossRef]
- Hekmatfar, A.; Shah, A.; Huber, G.; McDaniel, R.; Haddock, J.E. Modifying laboratory mixture design to improve field compaction. Road Mater. Pavement Des. 2015, 16, 149–167. [Google Scholar] [CrossRef]
- Masad, E.; Muhunthan, B.; Shashidhar, N.; Harman, T. Internal Structure Characterization of Asphalt Concrete Using Image Analysis. J. Comput. Civil Eng. 1999, 13, 88–95. [Google Scholar] [CrossRef]
- Zhang, C.; Wang, H.; You, Z.; Yang, X. Compaction characteristics of asphalt mixture with different gradation type through Superpave Gyratory Compaction and X-ray CT Scanning. Constr. Build. Mater. 2016, 129, 243–255. [Google Scholar] [CrossRef]
- Arambula, E.; Masad, E.; Martin, A.E. Influence of Air Void Distribution on the Moisture—Susceptibility of Asphalt Mixes. J. Mater. Civil Eng. 2007, 13, 655–664. [Google Scholar] [CrossRef]
- Chen, J.; Huang, B.; Chen, F.; Shu, X. Application of discrete element method to Superpave gyratory compaction. Road Mater. Pavement Des. 2012, 13, 480–500. [Google Scholar] [CrossRef]
- Wang, S.; Miao, Y.; Wang, L. Investigation of the force evolution in aggregate blend compaction process and the effect of elongated and flat particles using DEM. Constr. Build. Mater. 2020, 258, 119674. [Google Scholar] [CrossRef]
- Wu, W.; Cavalli, M.C.; Jiang, W.; Kringos, N. Differing perspectives on the use of high-content SBS polymer-modified bitumen. Constr. Build. Mater. 2024, 411, 134433. [Google Scholar] [CrossRef]
- JTG F40-2004; Technical Standards of the Chinese Technical Specifications for Construction of Highway Asphalt Pavements. National Standards of the People’s Republic of China: Beijing, China, 2004.
- Lu, X.; Chen, T.; Chen, Z.; Liu, W.; Lin, H. Optimization gradation of permeable asphalt mixture PAC-16. China Meas. Test 2024, 50, 60–67. [Google Scholar]
- Lin, H.; Du, X.; Zhong, C.; Wu, P.; Liu, W.; Sun, M.; Zhang, H. Distribution Properties of Internal Air Voids in Ultrathin Asphalt Friction Course. J. Wuhan Univ. Technol. Mater. Sci. Ed. 2023, 38, 538–546. [Google Scholar] [CrossRef]
- Du, X.; Gao, L.; Rao, F.; Lin, H.; Zhang, H.; Sun, M.; Xu, X. Damage Mechanism of Ultra-thin Asphalt Overlay (UTAO) based on Discrete Element Method. J. Wuhan Univ. Technol. Mater. Sci. Ed. 2024, 39, 473–486. [Google Scholar] [CrossRef]
- Masad, E.; Arambula, E.; Ketcham, R.; Abbas, A.; Martin, A.E. Nondestructive measurements of moisture transport in asphalt mixtures. Asph. Paving Technol.-Proc. 2007, 76, 919. [Google Scholar]
- Watson, D.E.; Masad, E.; Ann Moore, K.; Williams, K.; Cooley, L.A., Jr. Verification of voids in coarse aggregate testing: Determining stone-on-stone contact of hot-mix asphalt mixtures. Transp. Res. Record 2004, 1891, 182–190. [Google Scholar] [CrossRef]
- Bi, Y.; Huang, J.; Pei, J.; Zhang, J.; Guo, F.; Li, R. Compaction characteristics assessment of Hot-Mix asphalt mixture using Superpave gyratory compaction and Stribeck curve method. Constr. Build. Mater. 2021, 285, 122874. [Google Scholar] [CrossRef]
- Ren, J.; Yin, C. Investigating mechanical characteristics of aggregate structure for road materials. Int. J. Pavement Eng. 2020, 23, 372–386. [Google Scholar] [CrossRef]
- Liu, G.; Han, D.; Zhao, Y.; Zhang, J. Effects of asphalt mixture structure types on force chains characteristics based on computational granular mechanics. Int. J. Pavement Eng. 2020, 23, 1008–1024. [Google Scholar] [CrossRef]
- Muraya, P.M. Homogeneous test specimens from gyratory compaction. Int. J. Pavement Eng. 2007, 8, 225–235. [Google Scholar] [CrossRef]


| Sieve size (mm) | 9.5 | 4.75 | 2.36 | 1.18 | 0.6 | 0.3 | 0.15 | 0.075 |
| Passing rate (%) | 100.0 | 92.1 | 16.1 | 11.7 | 9.8 | 7.9 | 7.2 | 5.0 |
| Mix Design Method | Target Size of Specimen (mm) | OAC (%) | Target AV Ratio (%) | Measured AV Ratio (%) | |
|---|---|---|---|---|---|
| Diameter | Height | ||||
| Marshall | 101.6 | 63.5 | 6.0 | 18.0 | 17.9 |
| Compaction Parameters | The Value of Compaction Parameters | |||||||
|---|---|---|---|---|---|---|---|---|
| Target height (mm) | 15 | 15 | 15 | 15 | 20 | 25 | 40 | 63.5 |
| Target Radius (mm) | 100 | 100 | 100 | 150 | 100 | 100 | 100 | 100 |
| Vertical pressure (kPa) | 600 | 600 | 800 | 600 | 600 | 600 | 600 | 600 |
| Angle of internal gyration (°) | 1.15 | 1.72 | 1.15 | 1.15 | 1.15 | 1.15 | 1.15 | 1.15 |
| Specimen ID | S100/15 | S100/15-1 | S100/15-2 | S150/15 | S100/20 | S100/25 | S100/40 | S100/63.5 |
| Model Parameters | Value | ||
|---|---|---|---|
| Kelvin model | Spring | shear stiffness (Pa·m) | 5.1 × 10⁷ |
| Normal stiffness (Pa·m) | 5.1 × 10⁷ | ||
| Dashpot | Normal stiffness (Pa·m·s) | 3.6 × 10⁶ | |
| shear stiffness (Pa·m·s) | 3.6 × 10⁶ | ||
| Maxwell model | Spring | shear stiffness (Pa·m) | 4.3 × 10⁹ |
| Normal stiffness (Pa·m) | 4.3 × 10⁹ | ||
| Dashpot | Normal stiffness (Pa·m·s) | 1.8 × 10⁹ | |
| shear stiffness (Pa·m·s) | 1.8 × 10⁹ | ||
| Specimen ID | Molding Method | Target Specimen Size (Diameter × Height) | Measured Specimen Size (Diameter × Height) | Target AV Ratio (%) | Measured AV Ratio (%) |
|---|---|---|---|---|---|
| M100/63.5 | Marshall | 101.6 mm × 63.5 mm | 101.6 mm × 63.0 mm | 18 | 17.9 |
| S100/15 | SGC | 100 mm × 15 mm | 100 mm × 16.7 mm | 27.2 | |
| S150/15 | SGC | 150 mm × 15 mm | 150 mm × 16.8 mm | 26.5 | |
| R100/15 | RWC | 100 mm × 15 mm | 100 mm × 17.0 mm | 27.4 |
| Specimen ID | S100/15 | S100/15-1 | S100/15-2 | S150/15 | S100/20 | S100/25 | S100/40 | S100/63.5 |
|---|---|---|---|---|---|---|---|---|
| Gyratory number | 200 | 200 | 200 | 200 | 200 | 128 | 80 | 32 |
| Height | 16.7 | 16.7 | 16.5 | 16.8 | 21.7 | 25.2 | 40.2 | 63.4 |
| AV ratio | 27.2% | 27.3% | 27.3% | 26.5% | 24.4% | 18.6% | 18.3% | 19.1% |
| Specimen ID | S100/15 | S100/15-1 | S100/15-2 | S150/15 | S100/20 | S100/25 | S100/40 | S100/63.5 |
|---|---|---|---|---|---|---|---|---|
| k | 0.030 | 0.027 | 0.028 | 0.023 | 0.035 | 0.041 | 0.048 | 0.058 |
| a | 2.949 | 2.942 | 2.936 | 2.925 | 3.241 | 3.418 | 3.894 | 4.348 |
| R2 | 0.978 | 0.990 | 0.983 | 0.903 | 0.996 | 0.995 | 0.992 | 0.999 |
| UPFC Height/mm | 20 | 40 | 63.5 |
| Displacement of loading wall/mm | 1.42 | 8.61 | 17.46 |
| DH | 0.07 | 0.22 | 0.27 |
Disclaimer/Publisher’s Note: The statements, opinions and data contained in all publications are solely those of the individual author(s) and contributor(s) and not of MDPI and/or the editor(s). MDPI and/or the editor(s) disclaim responsibility for any injury to people or property resulting from any ideas, methods, instructions or products referred to in the content. |
© 2024 by the authors. Licensee MDPI, Basel, Switzerland. This article is an open access article distributed under the terms and conditions of the Creative Commons Attribution (CC BY) license (https://creativecommons.org/licenses/by/4.0/).
Share and Cite
Du, X.; Lin, H.; Sun, M.; Liu, W.; Zhang, H. Field Compaction Characteristics of Ultra-Thin Porous Friction Course Based on Laboratory Simulation. Appl. Sci. 2024, 14, 5489. https://doi.org/10.3390/app14135489
Du X, Lin H, Sun M, Liu W, Zhang H. Field Compaction Characteristics of Ultra-Thin Porous Friction Course Based on Laboratory Simulation. Applied Sciences. 2024; 14(13):5489. https://doi.org/10.3390/app14135489
Chicago/Turabian StyleDu, Xiaobo, Hongwei Lin, Mutian Sun, Wenchang Liu, and Hongchao Zhang. 2024. "Field Compaction Characteristics of Ultra-Thin Porous Friction Course Based on Laboratory Simulation" Applied Sciences 14, no. 13: 5489. https://doi.org/10.3390/app14135489
APA StyleDu, X., Lin, H., Sun, M., Liu, W., & Zhang, H. (2024). Field Compaction Characteristics of Ultra-Thin Porous Friction Course Based on Laboratory Simulation. Applied Sciences, 14(13), 5489. https://doi.org/10.3390/app14135489