Article

Experimental Investigation of a Point Absorber Wave Energy Converter Using an Inertia Adjusting Mechanism

1
Faculty of Mechanical Engineering, Ho Chi Minh City University of Technology and Education, Ho Chi Minh City 700000, Vietnam
2
School of Mechanical Engineering, University of Ulsan, 93 Deahak-ro, Nam-gu, Ulsan 44610, Republic of Korea
*
Author to whom correspondence should be addressed.
Appl. Sci. 2024, 14(13), 5506; https://doi.org/10.3390/app14135506
Submission received: 3 June 2024 / Revised: 19 June 2024 / Accepted: 20 June 2024 / Published: 25 June 2024

Abstract

:
This study proposes a novel point absorber wave energy converter (WEC) utilizing an inertial adjusting mechanism for performance evaluation. A conceptual design is introduced to explain the WEC’s functionality. Adjustable masses are incorporated to tune the natural frequency of the power take-off (PTO) system, matching the excitation frequencies of incoming waves. To analyze the system’s behavior, a coupled mechanical and hydrodynamic time domain simulation is presented. This simulation, built primarily in MATLAB/Simulink, focuses on a truncated floating buoy connected to a bidirectional gearbox. Since the WEC operates under various wave conditions, hydrodynamic parameters are determined and simulated in the frequency domain using ANSYS AQWA wave interaction software (version number 2021R1). Finally, a prototype is constructed and tested in a wave tank. Test results under different wave conditions are presented and compared to assess the proposed WEC’s performance.

1. Introduction

The exploitation and use of renewable energy have become hot topics in recent years because of environmental reasons such as climate change, the greenhouse effect, and the oil crisis. Wave energy is one of the renewable energy sources with potential for exploitation and energy production thanks to the vastness of the ocean. The development of wave energy utilization was reviewed by Antonio F. de O. Falcao in [1]. Yongxing Zhang et al. presented the principles of wave energy power in [2], which include the technical principle of wave energy power generation, the realization of WECs, and the performance evaluation of converters. Jian Qin et al. introduced a point-absorber wave energy converter featuring a magnetic tristable mechanism that comprised coaxial inner and outer magnetic rings [3]. There are three main locations for operating a WEC: offshore, nearshore, and onshore [4], each with its unique wave energy characteristics. For the offshore and nearshore areas, the point absorber WEC has more advantages thanks to its size and spherical float, which can exploit many wave directions with many different types of PTO. These include hydraulic PTOs [5,6,7,8], which use the piston’s up-and-down movement to make the hydraulic motor rotate; PTO linear generators [9,10,11], which use the float’s movement to activate the stator and rotor to generate electricity; and mechanical PTOs, which have been successfully used by CorPower Ocean to extract five times more energy per ton [12]. Haitao Liu et al. introduced a control method designed to enhance the resonance of a Dual-Port Direct-Drive wave energy converter by fine-tuning both the dual electromagnetic force and electromagnetic spring force [13]. On the other hand, WECs installed onshore need a bigger space to operate. However, the Eco Wave Power company, which uses hydraulic PTO, succeeded in this field when they solved the commercial problems due to low costs implicit in the installation, maintenance, and connection to the electrical grid, but still maintained high reliability for controlling the system in harsh climate conditions [14,15].
For WECs using a mechanical PTO, the authors et al. have carried out several studies on the point absorber types [16,17,18]. These papers show the significant contributions of conceptual design, which can increase the capture width ratio. Here, a conceptual design of the variable inertia hydraulic flywheel (VIHF) was employed to control the natural frequency of the PTO [16]. Moreover, a control stiffness mechanism was proposed in [17], and an optimum control strategy was applied in [18] to investigate the performance of the proposed design under the modeling program. A WEC is composed of a floating buoy and an upper structure placed over the floating buoy connected by a spring and a ball screw with a rotational mass, which converted linear motion to rotational motion, and the ball screw is connected to a rotating generator [19]. Moreover, some important approaches in modeling WEC in the frequency and time domains were presented in [20,21,22,23,24]. A frequency domain analysis on a generic WEC based on a two-body point absorber was performed in [20]. The hydrodynamic parameters are obtained with ANSYS AQWA, and numerical modeling and simulation in both the frequency and time domains were presented in [21]. Three different geometric shapes of the floating buoy were tested to obtain the hydrodynamic parameters for different sea states in [22]. Silvia et al. presented a numerical model of the coupled buoy-generator system. The output power was maximized by adding a submerged object to bring the system into resonance with the incident regular wave frequencies in [23]. An onshore WEC using the ball-screw in the elastohydrodynamic lubrication regime was modeled and simulated in the time domain in [24]. To improve the converted efficiency, the optimal control algorithms have been applied to maximize the harvesting energy [25,26,27]. Mirko P. et al. compared the model predictive control and optimal causal control for one degree of freedom heaving point absorber in a range of wave conditions in [25]. A WEC composed of a point absorber, a hinged arm, and a direct mechanical drive PTO system was addressed in [26]. Maximum power point tracking algorithms were applied to increase the capture width ratio. Model predictive control was applied to a Wavestar prototype to maximize energy extraction in [27]. All previous papers have addressed the significant contributions in the design, modeling, and control of the WEC. In order to create a new vision for increasing wave energy extraction, an adjusting mechanism for a WEC can be proposed, and experimental investigations are needed to evaluate the performance of the proposed WEC.
In this paper, a novel point absorber wave energy converter (WEC) using an inertial adjusting mechanism is proposed to investigate the performance. A new conceptual design of an inertial adjusting mechanism is proposed to carry out experiments under different working conditions. Here, some added masses are employed to adjust the natural frequency of the power take-off (PTO) into the excitation frequencies of the incident waves. A coupled mechanical and hydrodynamic time domain simulation of the truncated floating buoy connected to the bidirectional gearbox is presented. The simulation is based primarily on MATLAB/Simulink. Due to working in different wave conditions, the determination of the hydrodynamic parameters is calculated and simulated in the frequency domain using the ANSYS AQWA wave interaction simulation software (version number 2021R1). Then, a prototype is fabricated and exploited in a wave tank test. Finally, the test results of the prototype under different wave conditions are presented. In each test, buoy elevation, speed, and induced torque were measured and recorded. Additionally, the mean incident wave power and generated power were determined to calculate the WEC’s overall efficiency. The results from the wave tank tests are compared to evaluate the performance of the proposed WEC.

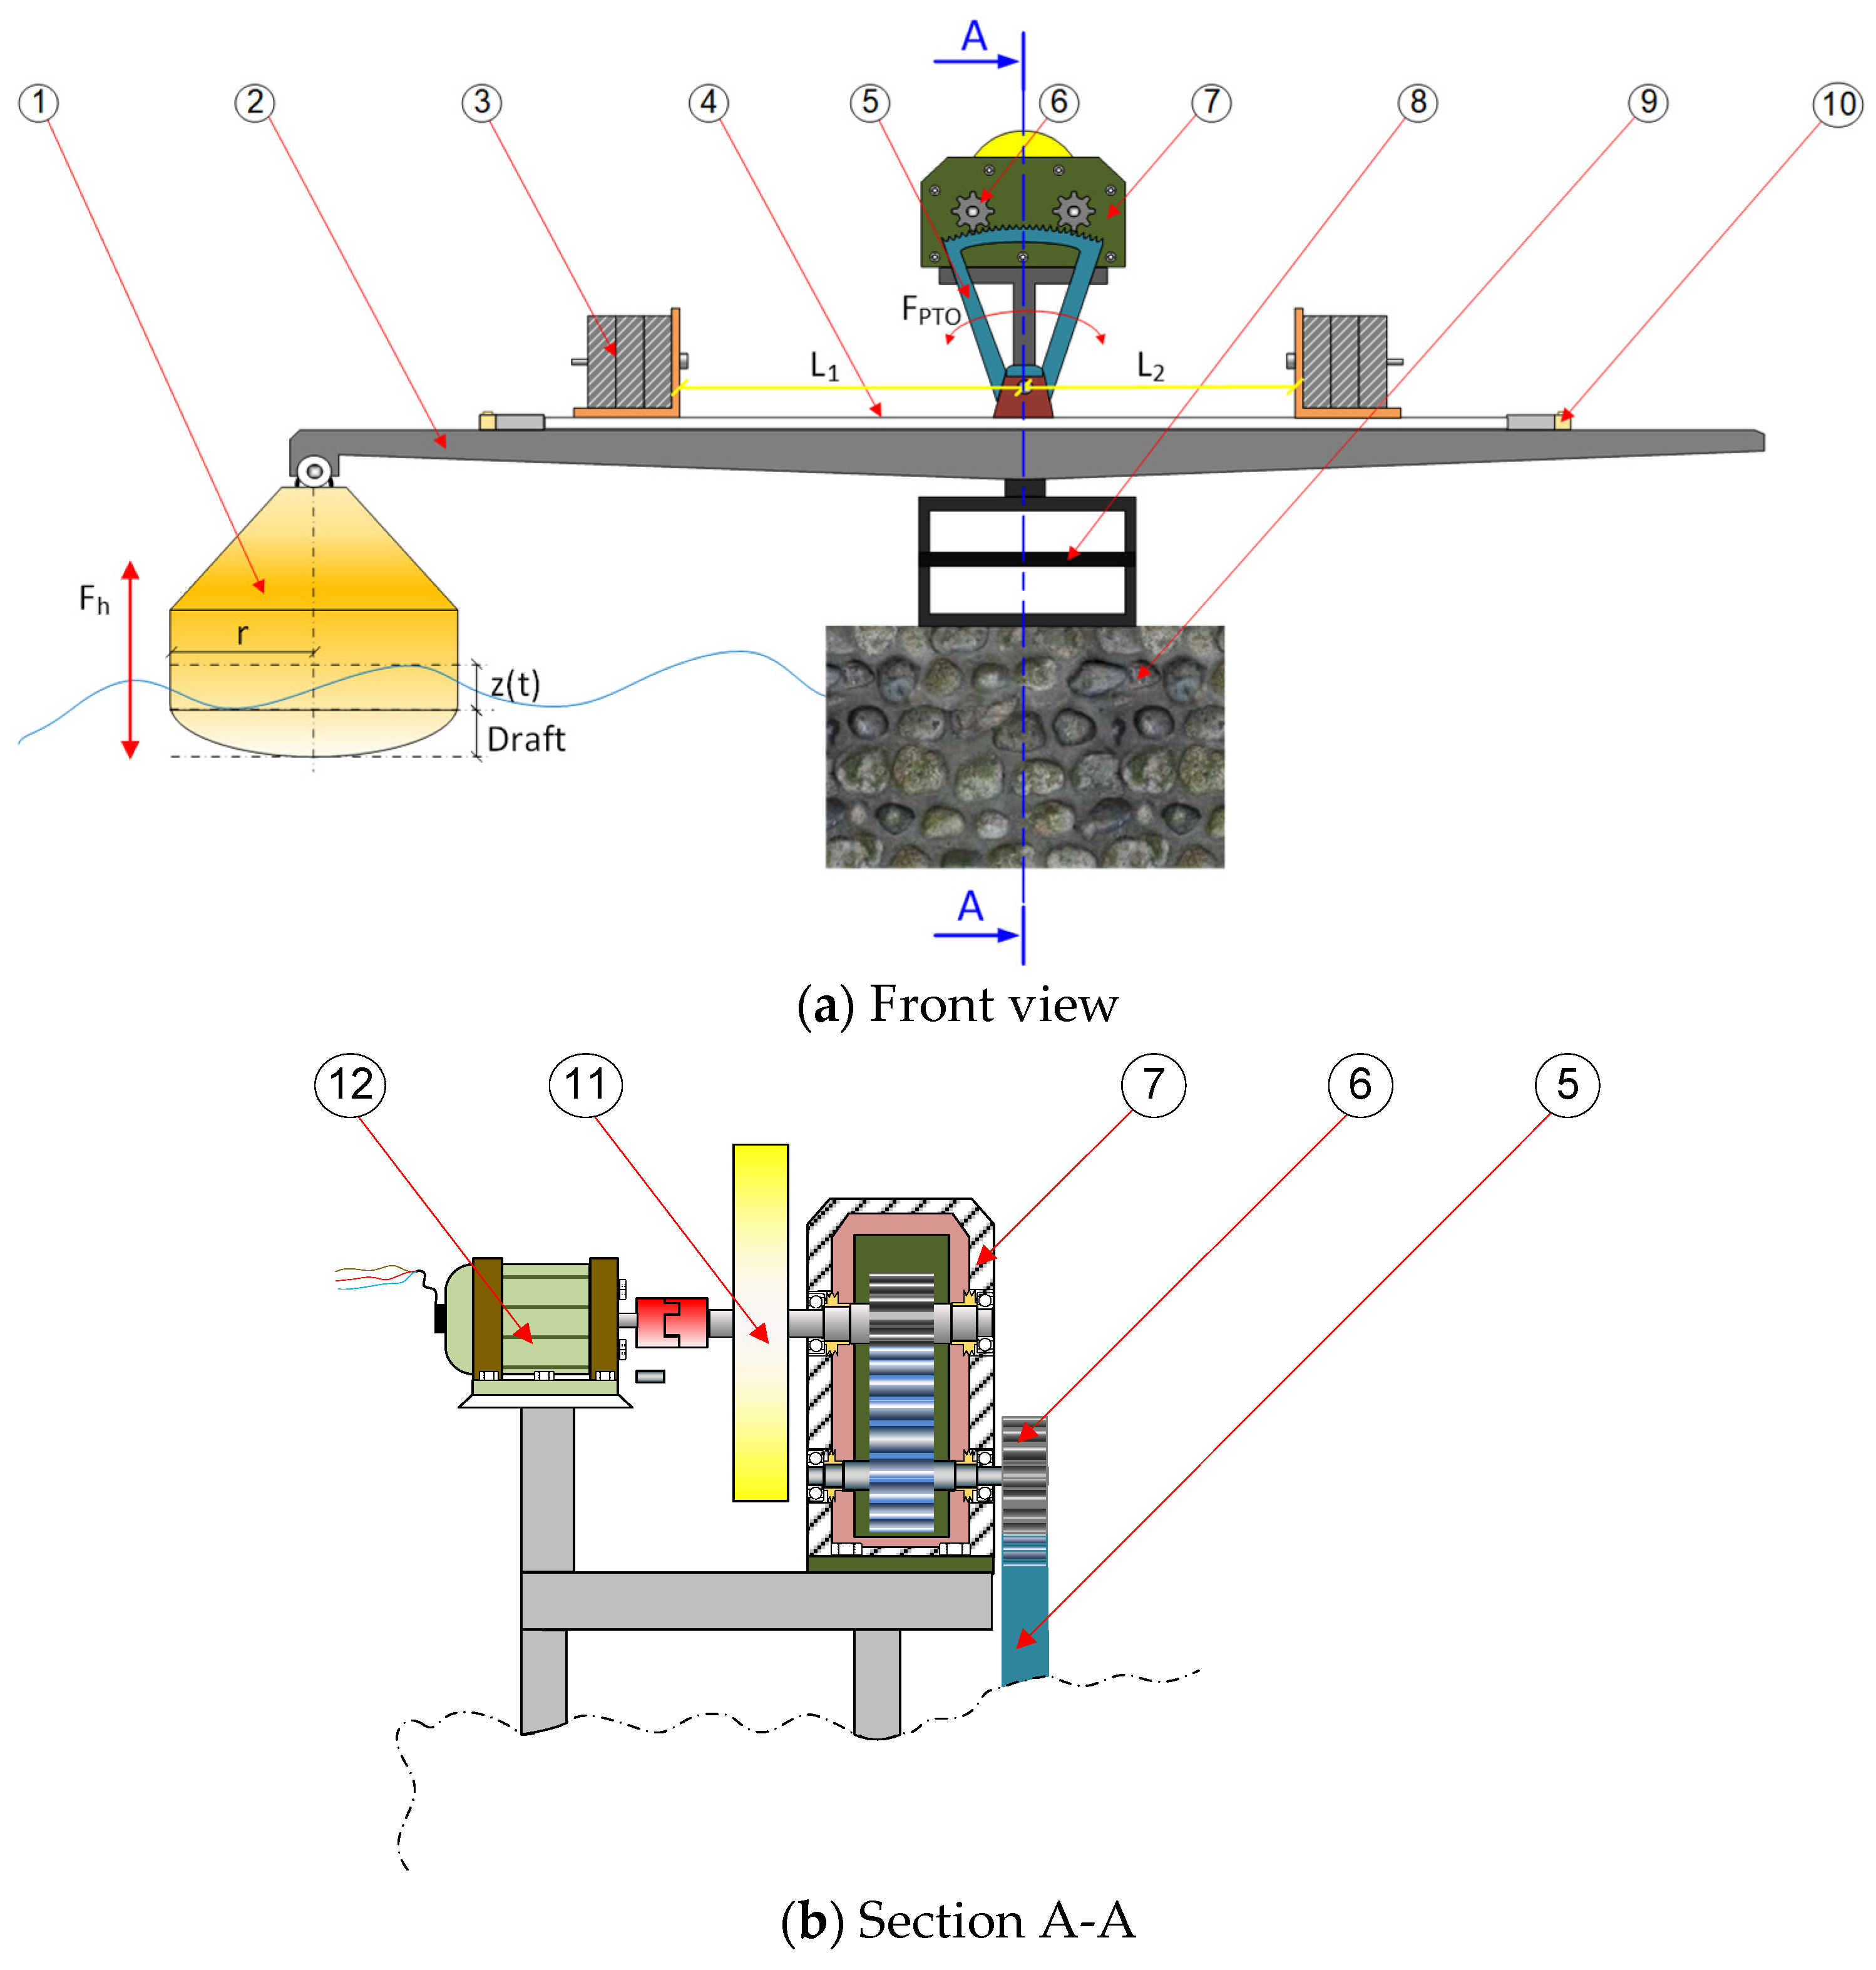
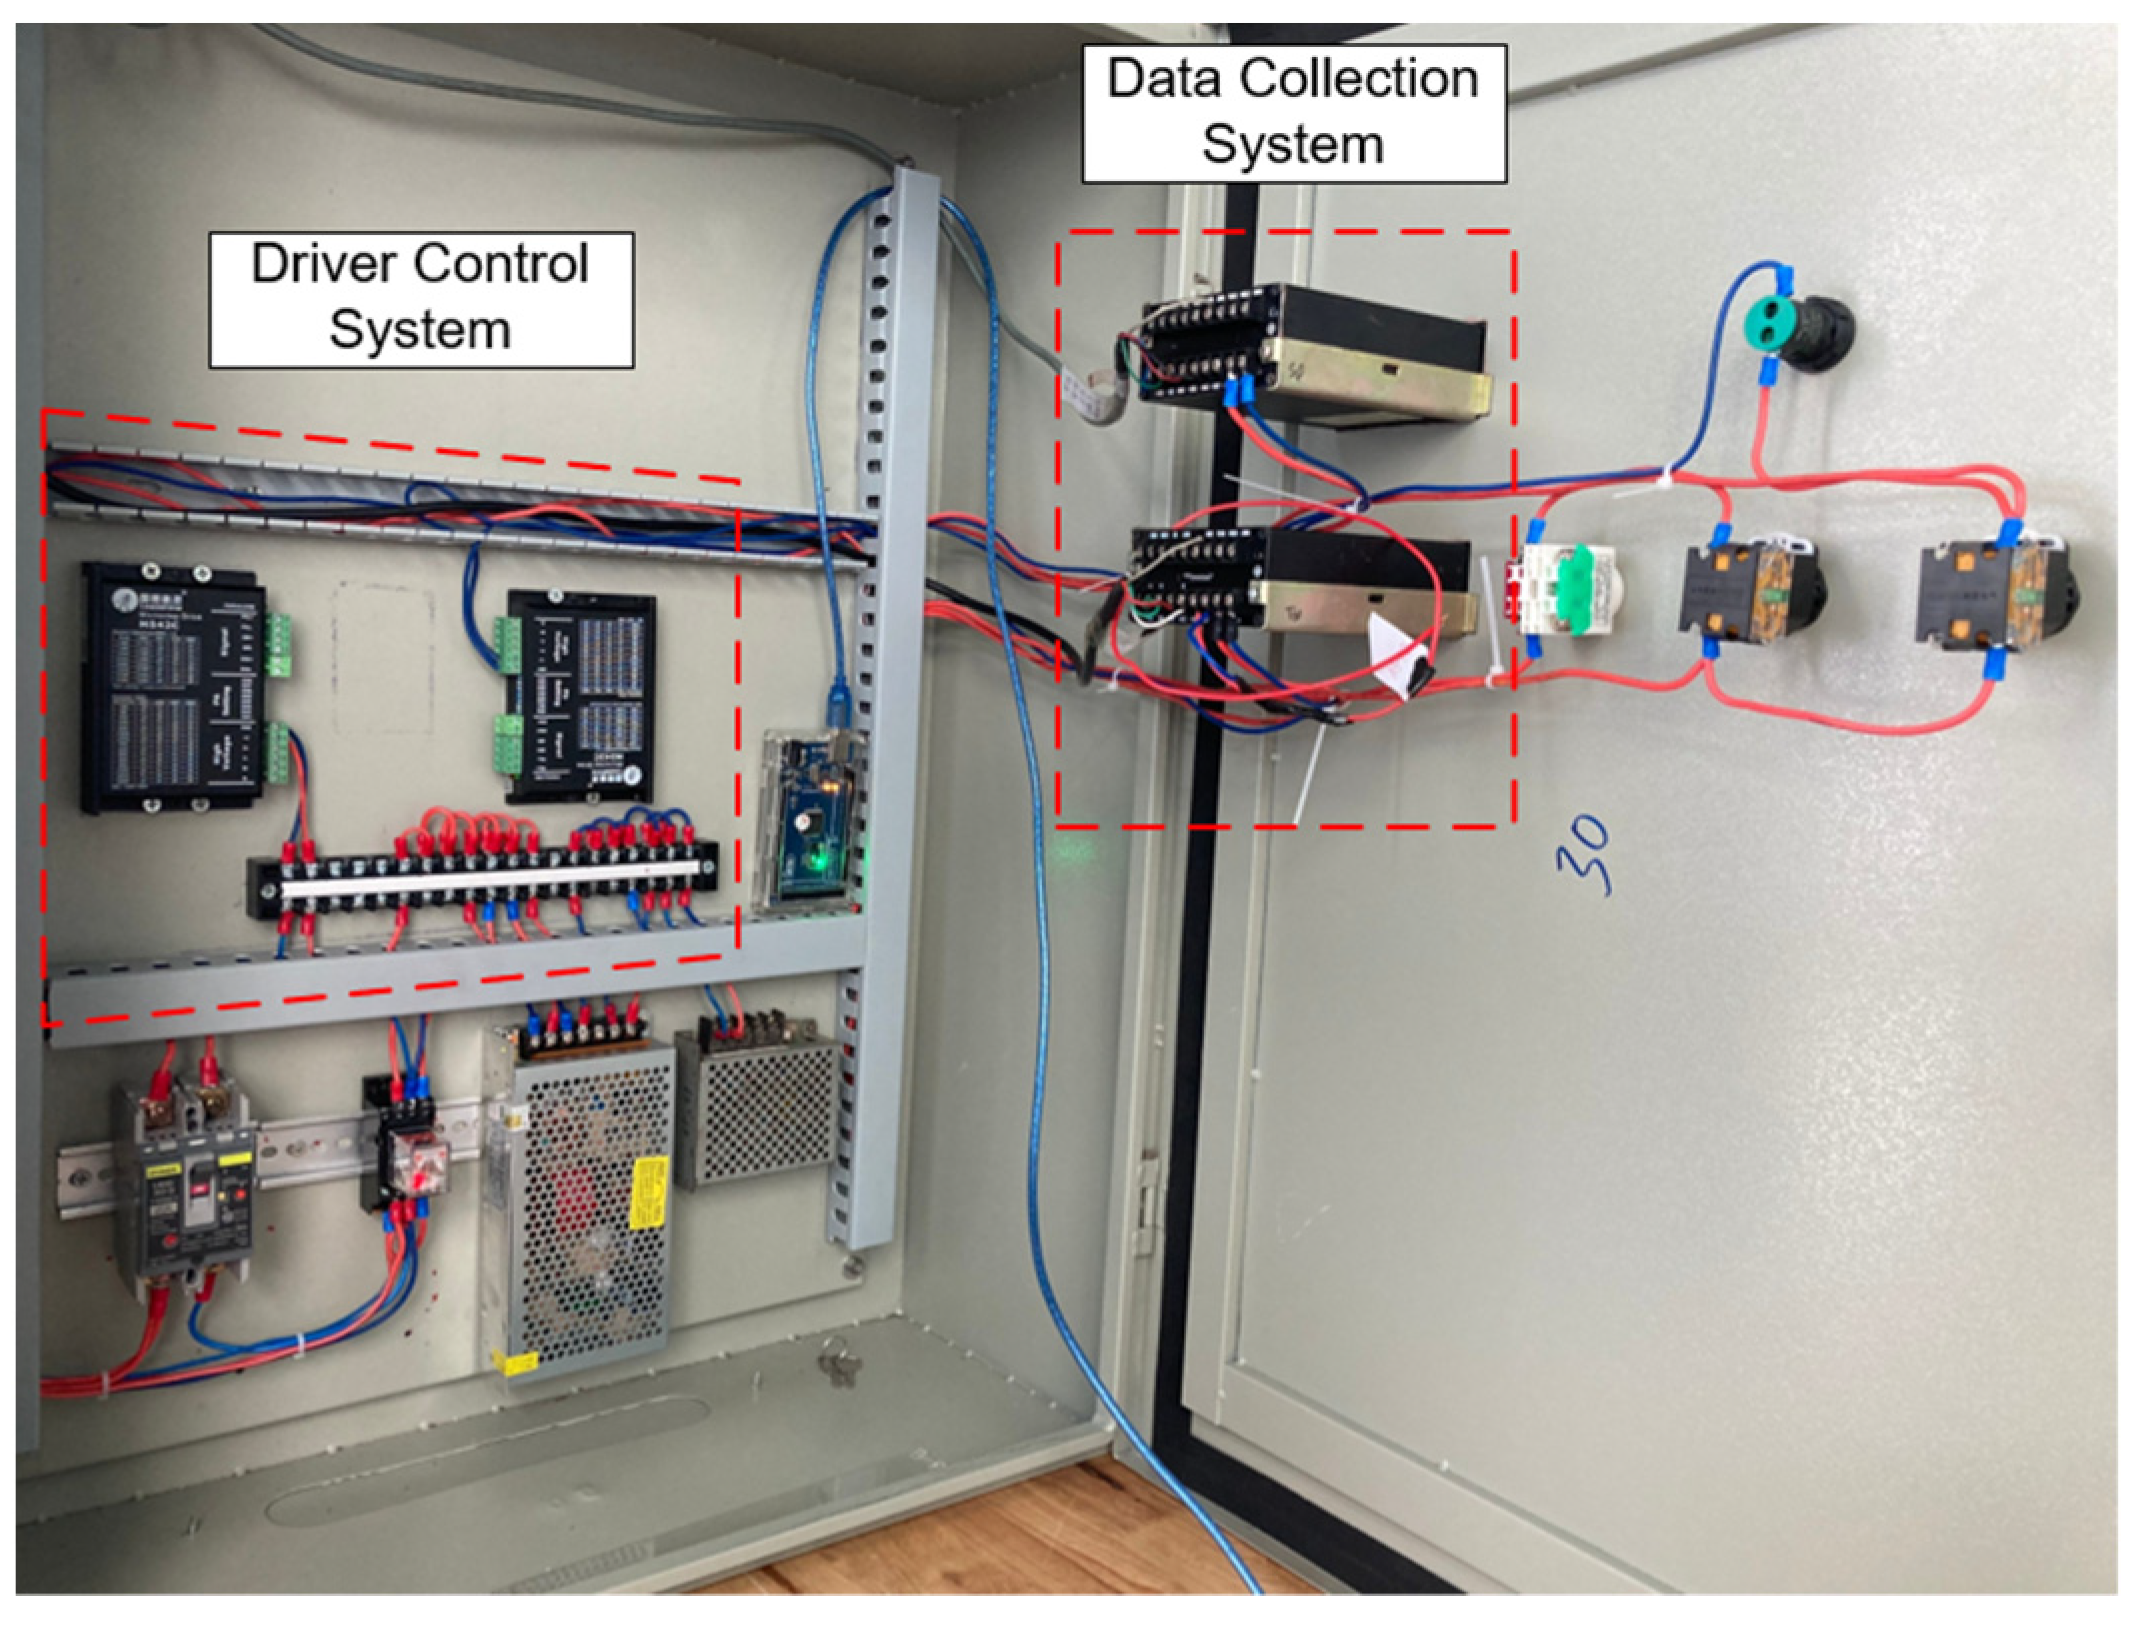
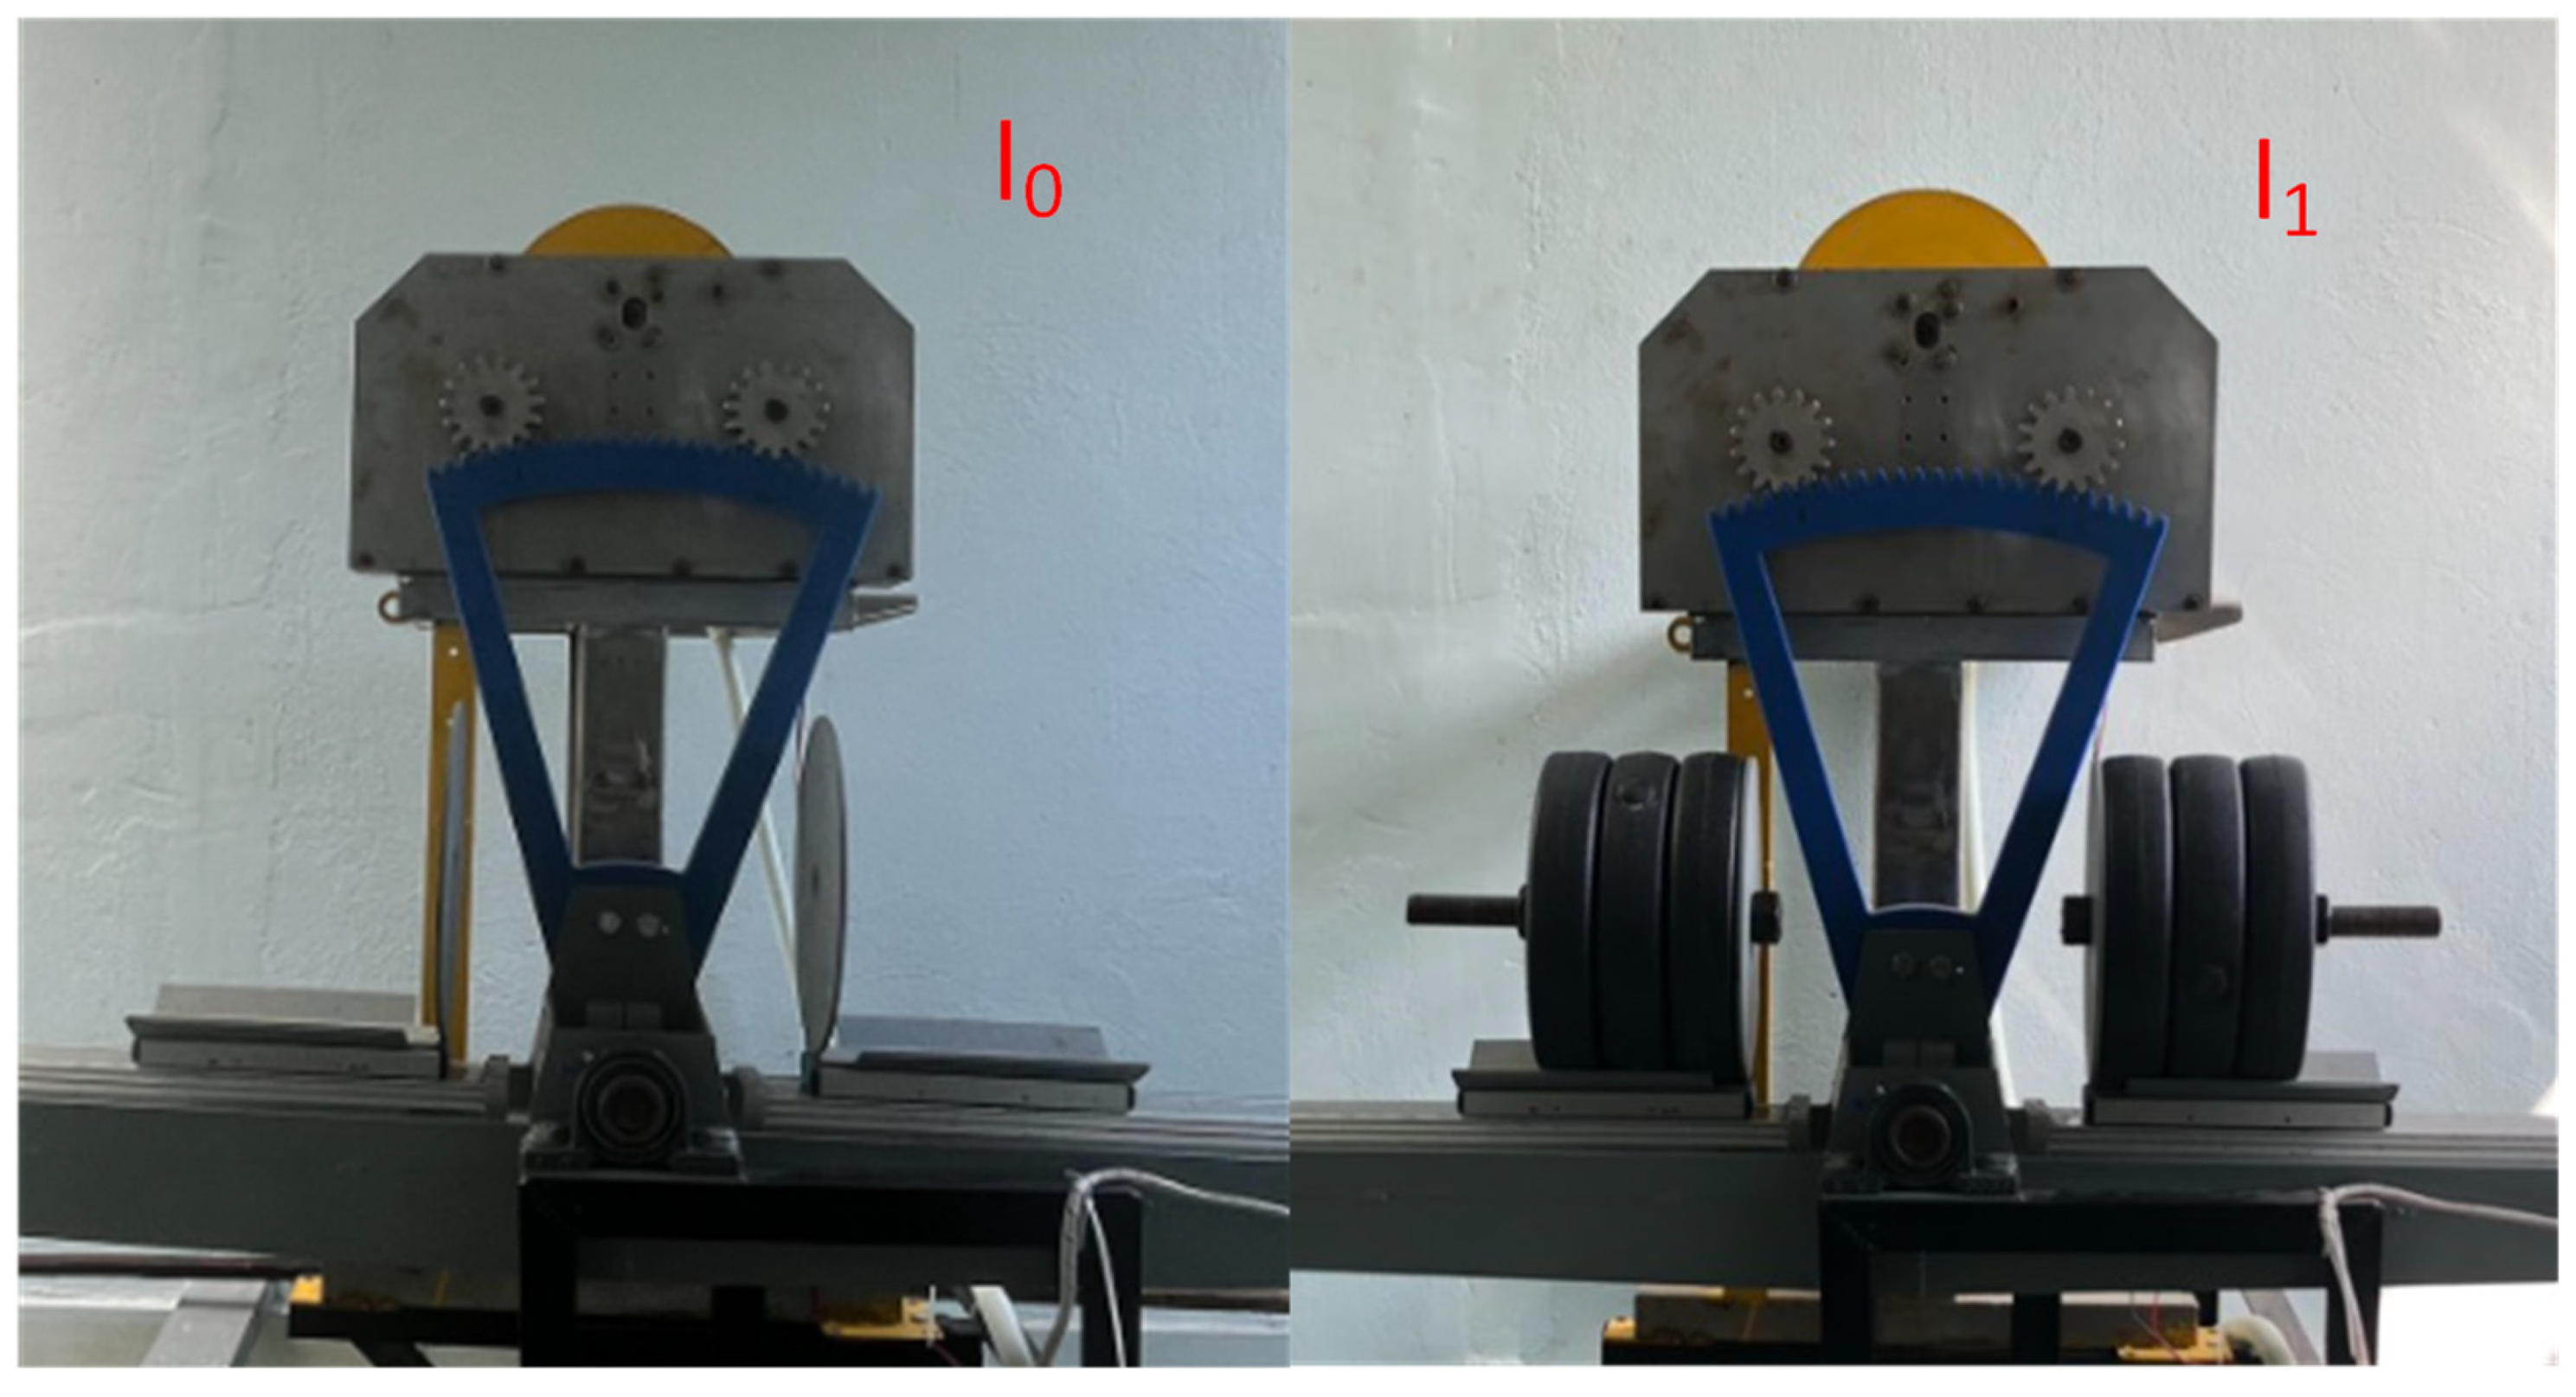
2. System Description

Figure 1 shows the configuration of the WEC. Under wave interaction, the floating buoy 1 is forced to move up and down. An arm 2 fixed to the floating buoy is rotated about the main axis. A quarter-gear 5 fixed to the arm 2 drives the converter gearbox 7 by engaging input gear 6. In gearbox 7, two bidirectional rotations of quarter-gear 6 are converted into one directional motion of the output shaft. The output shaft is connected to the flywheel to improve rotation movement so that the generator can improve its performance. Moreover, two added masses 3 are employed to adjust the inertial of the PTO. Here, the mass positions are adjusted by a crew and nut mechanism, which is driven by the stepped motor 10. Therefore, the inertial supplementary of the proposed WEC can be adjusted to the optimal values which can improve the performance and width capture ratio of the PTO system.

3. Analysis Model

Under a regular wave, the wave elevation can be expressed as
η = A sin ω t
where A is the wave amplitude and ω is the wave frequency.

3.1. Hydrodynamic Model

The Hydrodynamic Forces Acting on the Float Are Given by the following Equation
F h = F e + F r + F v + F s
where F e is the excitation force which is the sum of the Froude-Kryluv force and the diffraction force [28,29]. F r is the radiation-damping force that is produced by the harmonic oscillations of the rigid body with calm free waters. F v is the viscous damping forces on the oscillated body and F s is the hydrostatic restoring force that actuates the floating buoy to hydrostatic equilibrium.
First, the excitation force obtained in [28] can be expressed as follows:
F e = f 3 A sin ( ω t + φ )
where f 3 is the excitation force’s coefficient and φ is the phase difference between the wave and the excitation force. These coefficients were also obtained by using ANSYS AQWA software (version number 2021R1).
F r = m a z ¨ R r z ˙
where m a is the added mass and R r is the radiation damping coefficient [29]. These coefficients were obtained by using ANSYS AQWA software (version number 2021R1).
F v = 1 2 ρ C d A 0 ( z ˙ η ˙ ) | z ˙ η ˙ |
where C d is the drag coefficient, normally it is equal to one and A 0 is the water plane area of the buoy at rest.
F s = S b z
where S b is the hydrostatic stiffness and can be obtained in the following equation
S b = π ρ g a 2
where ρ is the density of the water environment, g is the gravity of the Earth, and a is the radius of the buoy at the water section.

3.2. Hydrodynamic Parameters Calculation

To obtain the hydrodynamic parameters, a design of the floating buoy was implemented by 3D design software. The geometry parameters of the floating buoy are shown in Figure 2. These parameters are set into ANSYS AQWA software (version number 2021R1). The 3D file, including the geometrical parameters, is added to the workspace in ANSYS AQWA. The mesh can be divided manually or automatically to optimize the process. The mass center and inertia pre-obtained in the 3D model are also set in ANSYS AQWA. The wave boundary conditions, consisting of the wave frequency range and wave direction, are set to calculate the hydrodynamic parameters. In this paper, the wave frequency is set to range from 0.1 rad/s to 4 rad/s to approximate the ocean wave frequency range at 1m water depth. Among the simulation results, there are four main parameters, including the excitation force’s coefficient, added mass, the radiation damping coefficient, and the phase angle. These coefficients, noted as f 3 , m a , R r , and φ , were then obtained and plotted in Figure 3.

3.3. PTO Model

The PTO force is obtained by the following equation:
F P T O = F sup + F f + F g
where F sup is the supplementary force induced by the added inertial. F g is the induced force by the generator and the flywheel and F f is the friction force.
The supplementary force F sup is calculated by
F sup = I s l a z ¨
I s = I 0 + I a
where I 0 and I a are the initial inertia and the added inertia of the PTO system, respectively. Here, I a can be calculated by the following equation:
I a = m 1 l 1 2 + m 2 l 2 2
where m 1 and m 2 are the added mass on the two sides of the center point, and l 1 and l 2 are the distance from m 1 and m 2 to the center point, respectively.
The resistive force from the generator F g , discussed in detail in the previous work [28], is expressed in (12). The resistive force from the generator consists of the flywheel and the generated torque, which is only taken into account when the instantaneous speed n is larger than the generator speed θ ˙ . The instantaneous speed n caused by the velocity of the floating buoy is obtained in (13).
F g = { ( T f l + T g ) l a × i G B ,   for   n θ ˙ 0 ,   otherwise
n = z ˙ l a i G B
where T f l represents the torque generated by the flywheel’s rotational inertia and is directly proportional to the derivative of θ ; l a is the arm length; the induced torque of the generator is T g , which is assumed to be proportional to the derivative of θ ; and i G B is the transmission ratio from the quarter-gear to the output shaft of the gearbox.
The friction force F f can be modeled using Brian Amstrong’s proposed method and presented in
F f = ( F c + ( F b r F c ) e ( c F | z ˙ | ) s i g n ( z ˙ ) + f v z ˙
where f v is the viscous friction coefficient; F b r is the breakaway friction force, which is the sum of the Coulomb and static frictions at zero velocity; and c F is the transition approximation coefficient, which is used to approximate the transition between the static and the Coulomb frictions. F c is the Coulomb friction that opposes motion with a constant force at any velocity.

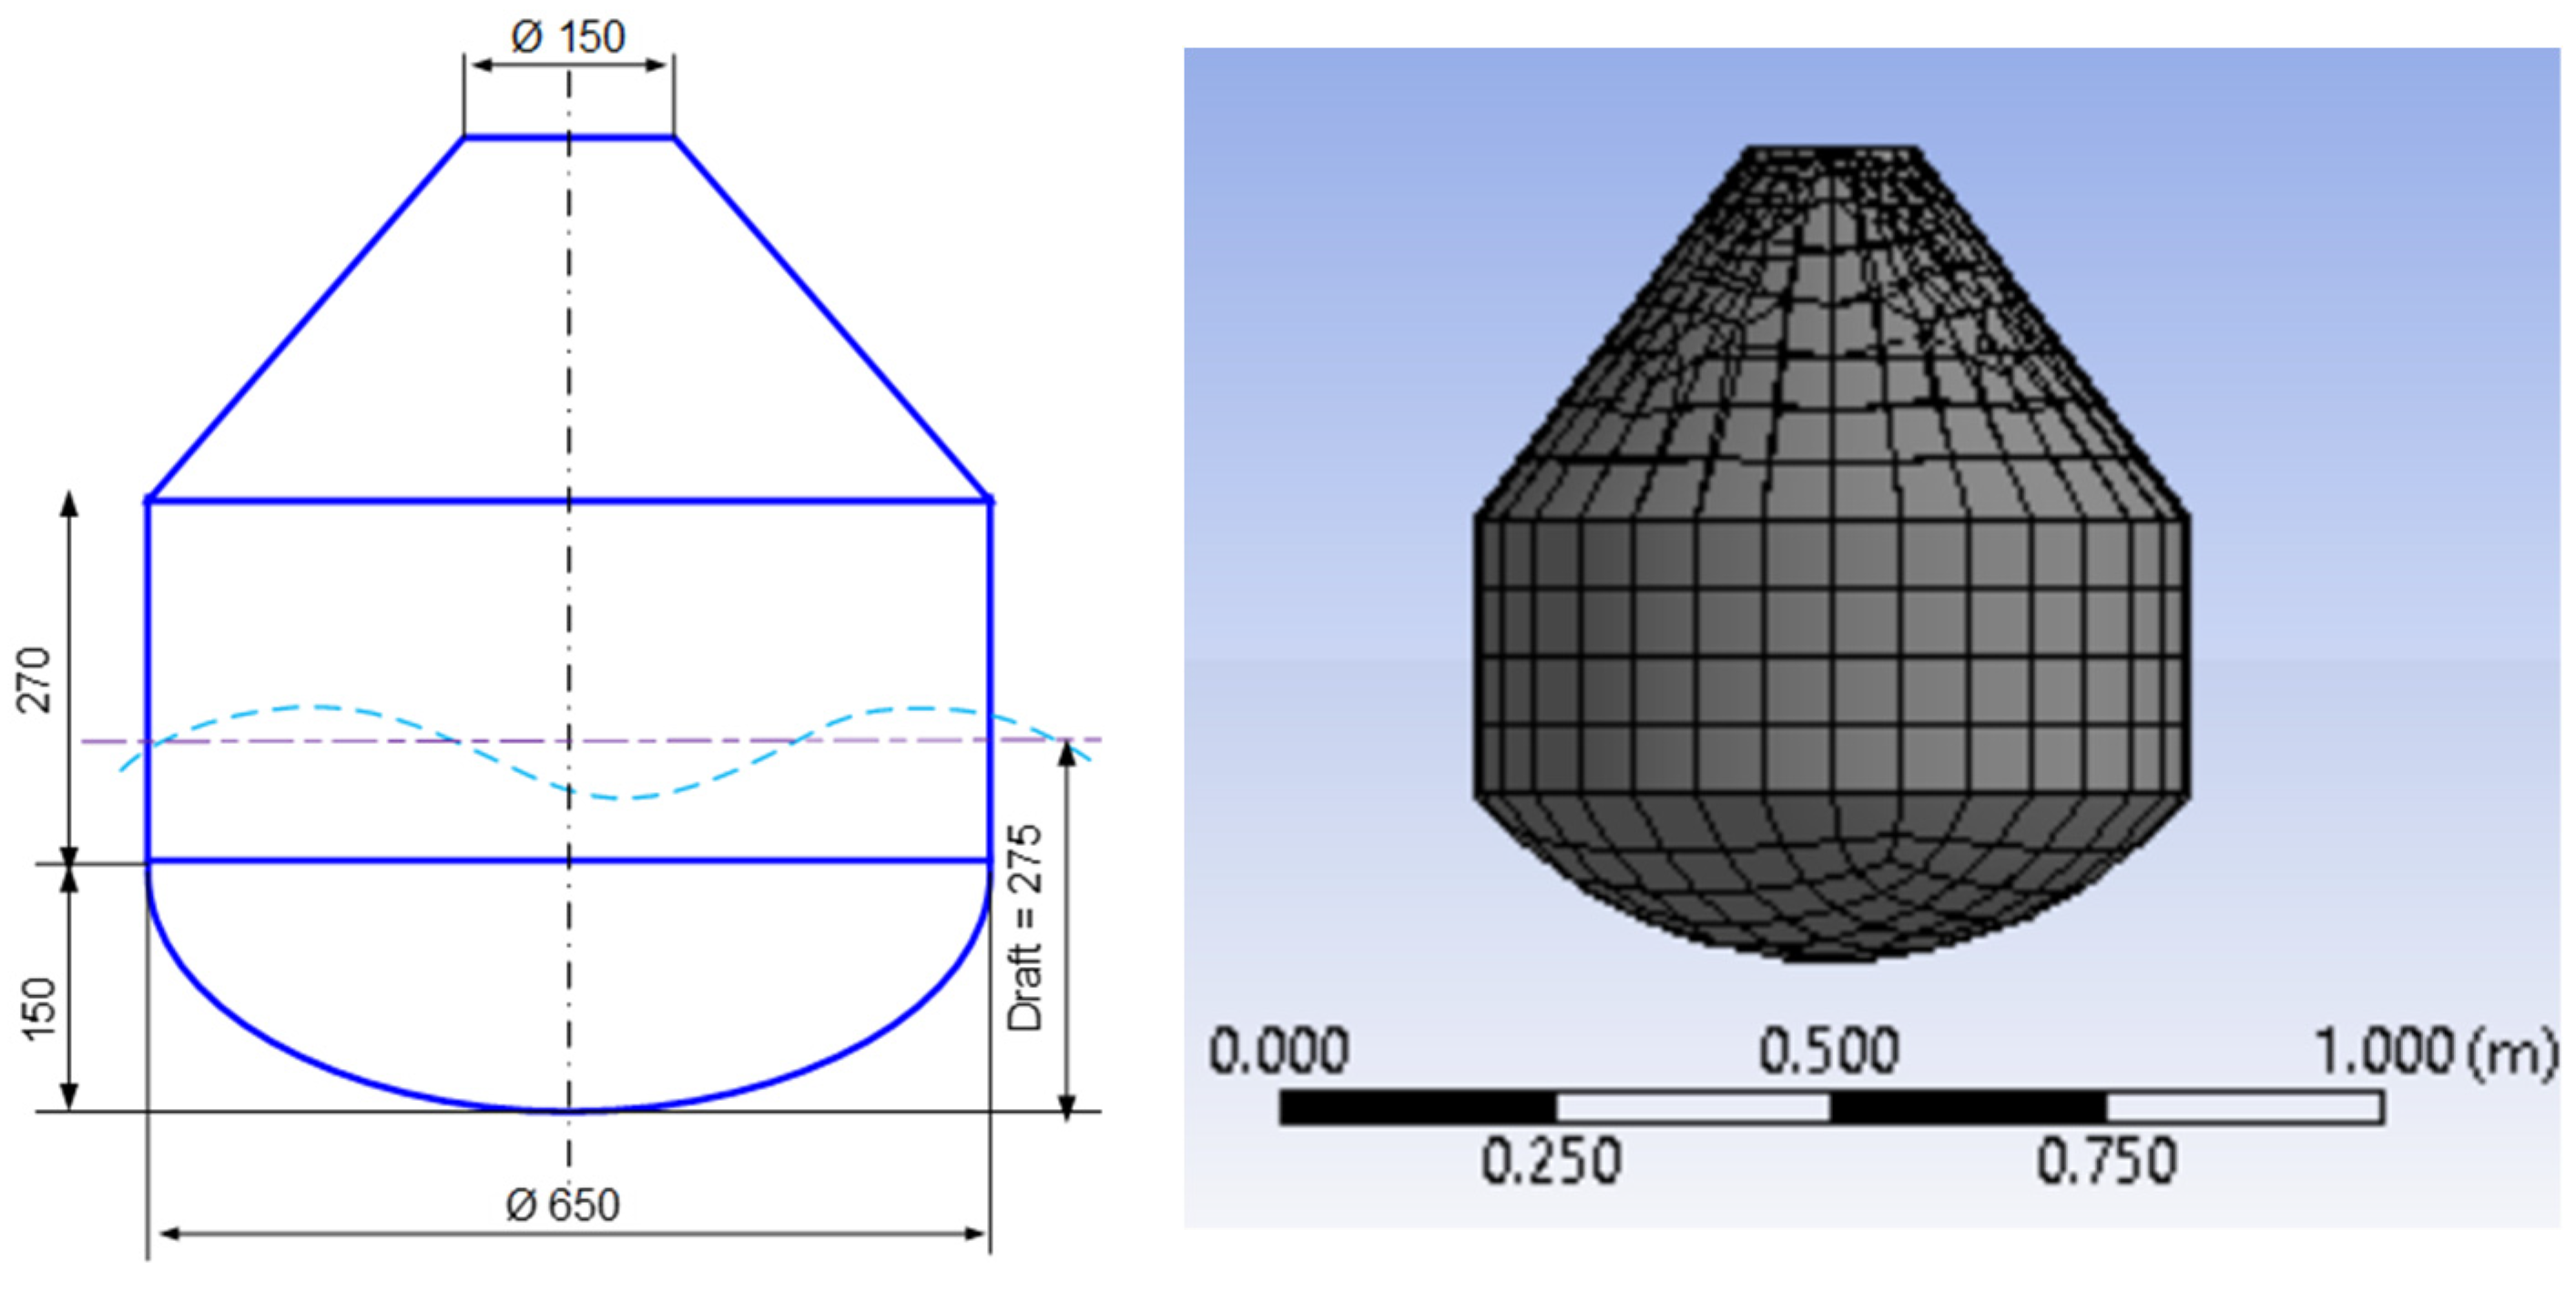
3.4. Floating Buoy Model

The translational motion z of the floating buoy in the vertical direction is determined by applying Newton’s second law and can be expressed as
m b z ¨ = F h + F P T O
where m b is the mass of the floating buoy.
Substituting (2)–(6) and (8)–(9) into (15), the motion of the floating buoy in the vertical direction is simulated by the following equation
( m b + m a + I s l a ) z ¨ + R r z ˙ + S b z = f 3 A sin ( ω t + φ ) F v F g F f

3.5. Generator Model

The motion of the generator coupled with the flywheel is obtained by employing Newton’s second law for the rotational body as follows
T d T g = I f l θ ¨
where T d is the driving torque, consisting of the hydrodynamic force, supplementary forces, and frictional force from the PTO system, as expressed in Equation (18). Here, the driving torque is only taken into account when the instantaneous speed is faster than the generator speed. Otherwise, the driven gear is decoupled from the driving gear due to one-way bearings.
T d = { ( F h F sup F f ) i G B × l a ,   for   n θ ˙ 0 ,   otherwise
In this paper, a torque simulator was employed to simulate the resistive torque from the generator. The resistive torque was assumed to be the first order of the rotational angular speed θ ˙ and is expressed in (19). Here, R g is the generator’s coefficient which is manipulated to adjust the resistive torque from the generator. Then, the generated power obtained from the resistive torque and the angular speed is expressed in (20).
T g = R g θ ˙
P g = T g θ ˙

3.6. Energy Conversion Efficiency

By using linear super-positioning [29], the mean wave energy density, including kinematic and potential energy, is obtained as follows
E = 1 8 ρ g H 2
where H is the wave height, and the group velocity for constant water depth h is obtained by
C g = 1 2 g ω D ( k h )
where k is the angular repetency and can be defined as the number of radians per unit distance in the following equation
k = 2 π λ
where λ is the wavelength and D ( k h ) is the depth function [29] and can be defined as
D ( k h ) = [ 1 + 2 k h sinh ( 2 k h ) ] tanh ( k h )
Then, the mean wave power is obtained by
P m = E C g
Then, the absorption wave power acting on the floating buoy can be predicted in the following equation
P w = P m d
where d (the capture width of the device) is the horizontal extension of the floating buoy.
Finally, the overall efficiency of the proposed WEC is defined as the ratio of the generated power and the absorption wave power, and expressed as
η o = P g P w
According to [29], the energy absorption efficiency can be increased by adjusting the natural frequencies to resonate with the incident waves. The wave frequencies are usually lower than the natural frequency of the PTO system. Therefore, the inertial supplementary can be added to bring the natural frequency close to the regular wave frequencies. Then, the natural frequency of the PTO system can be expressed as
ω n = S b m b + m a + I s l a ω

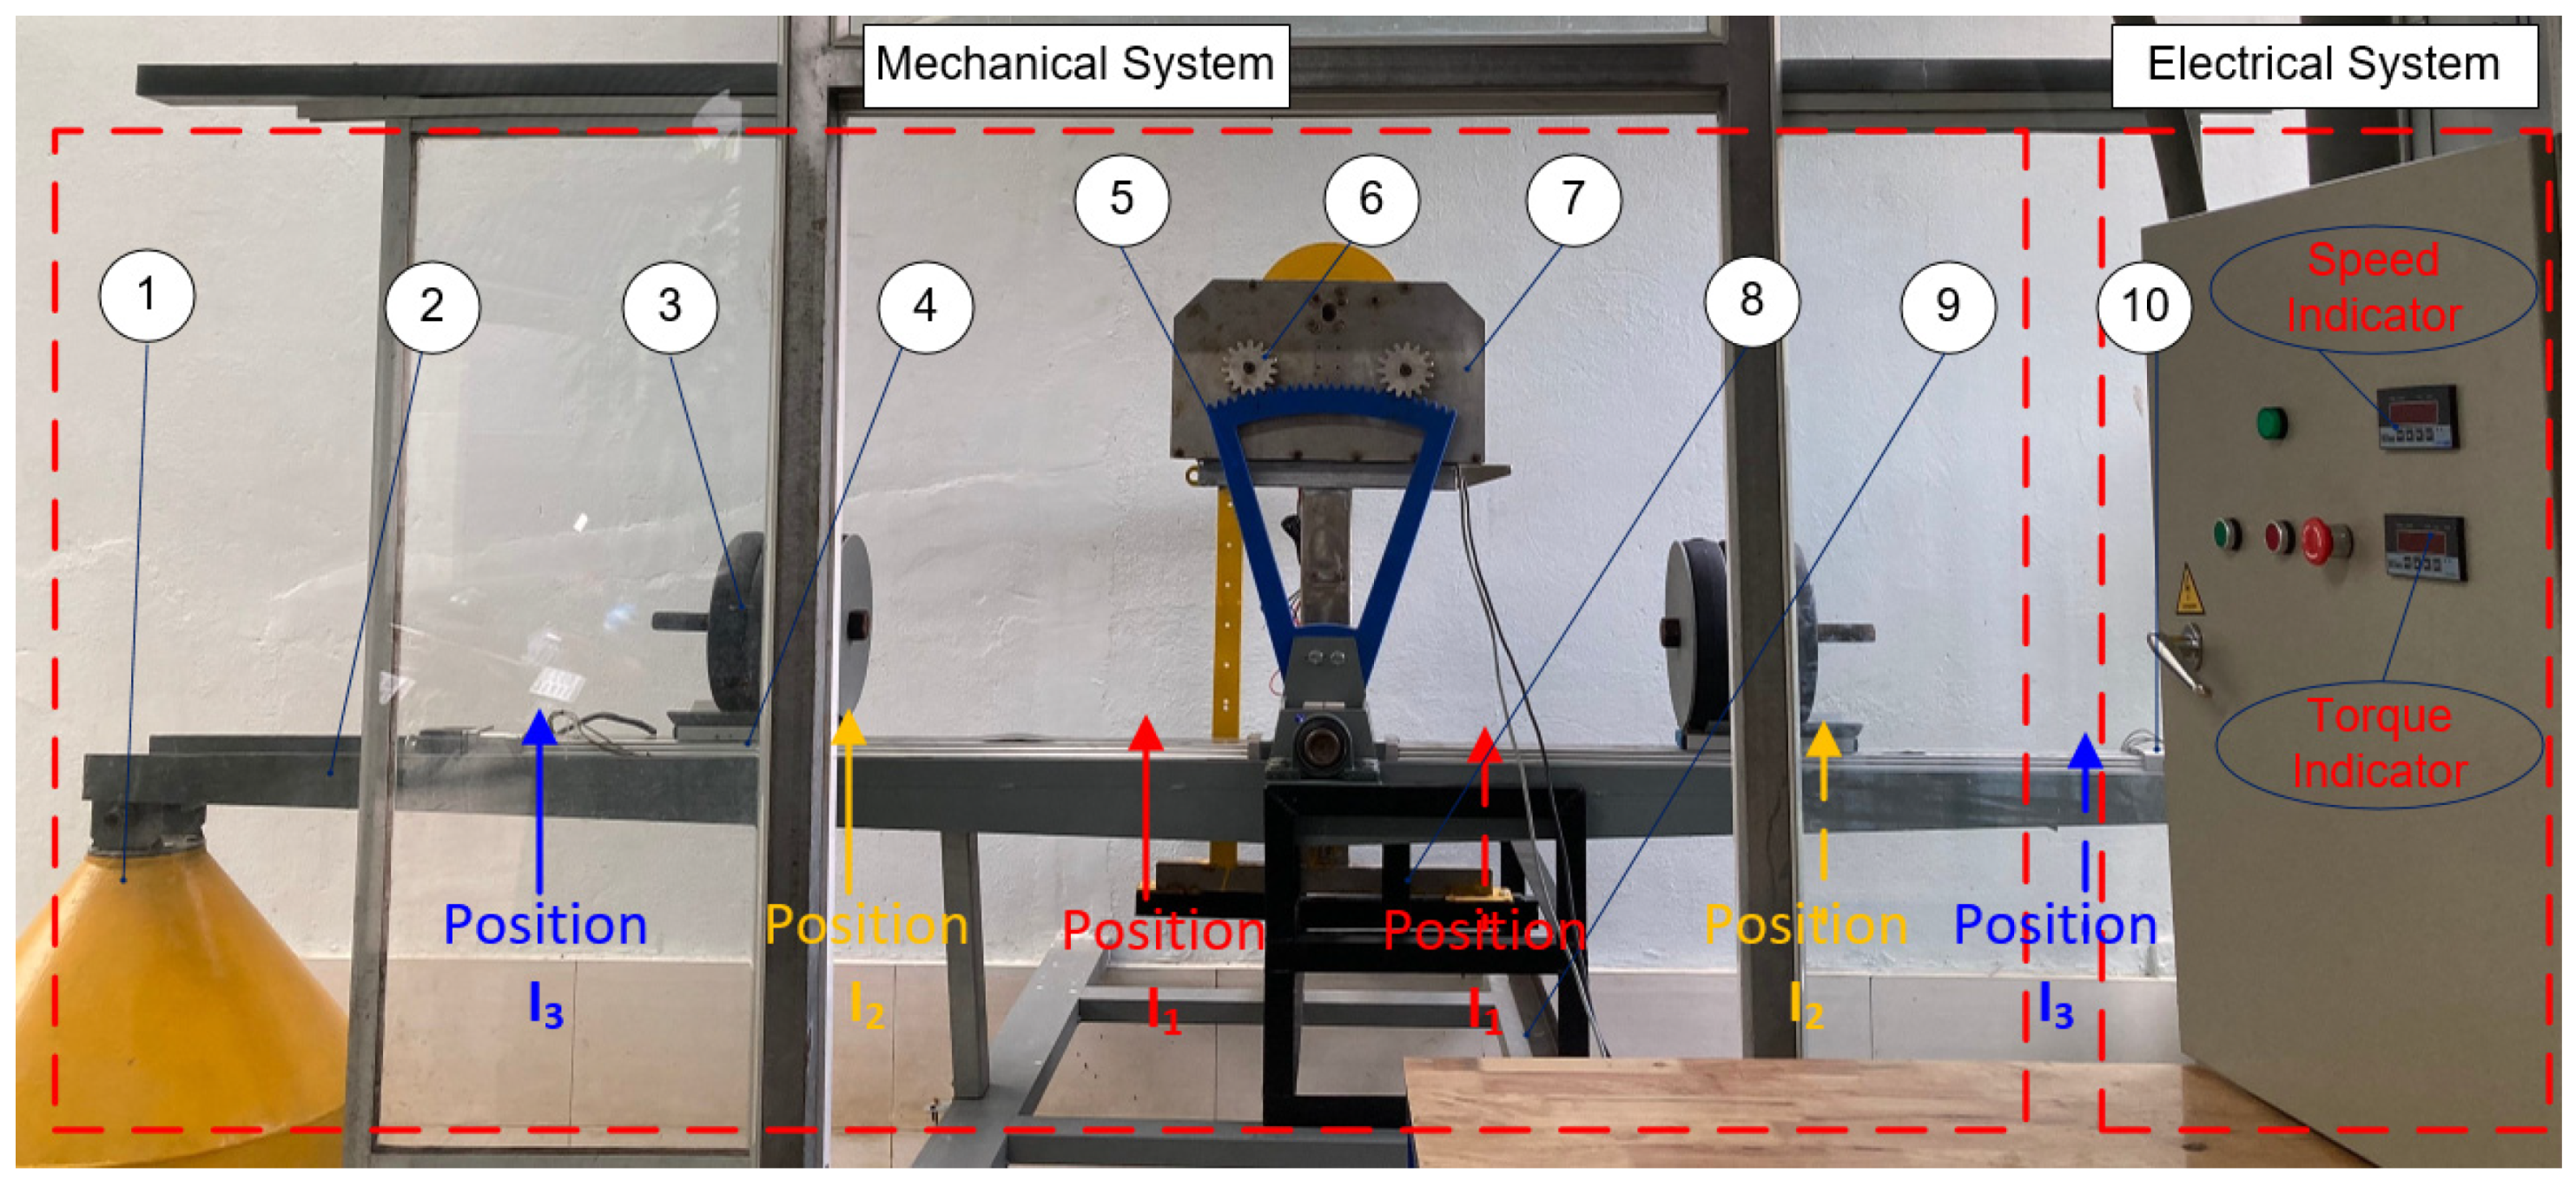
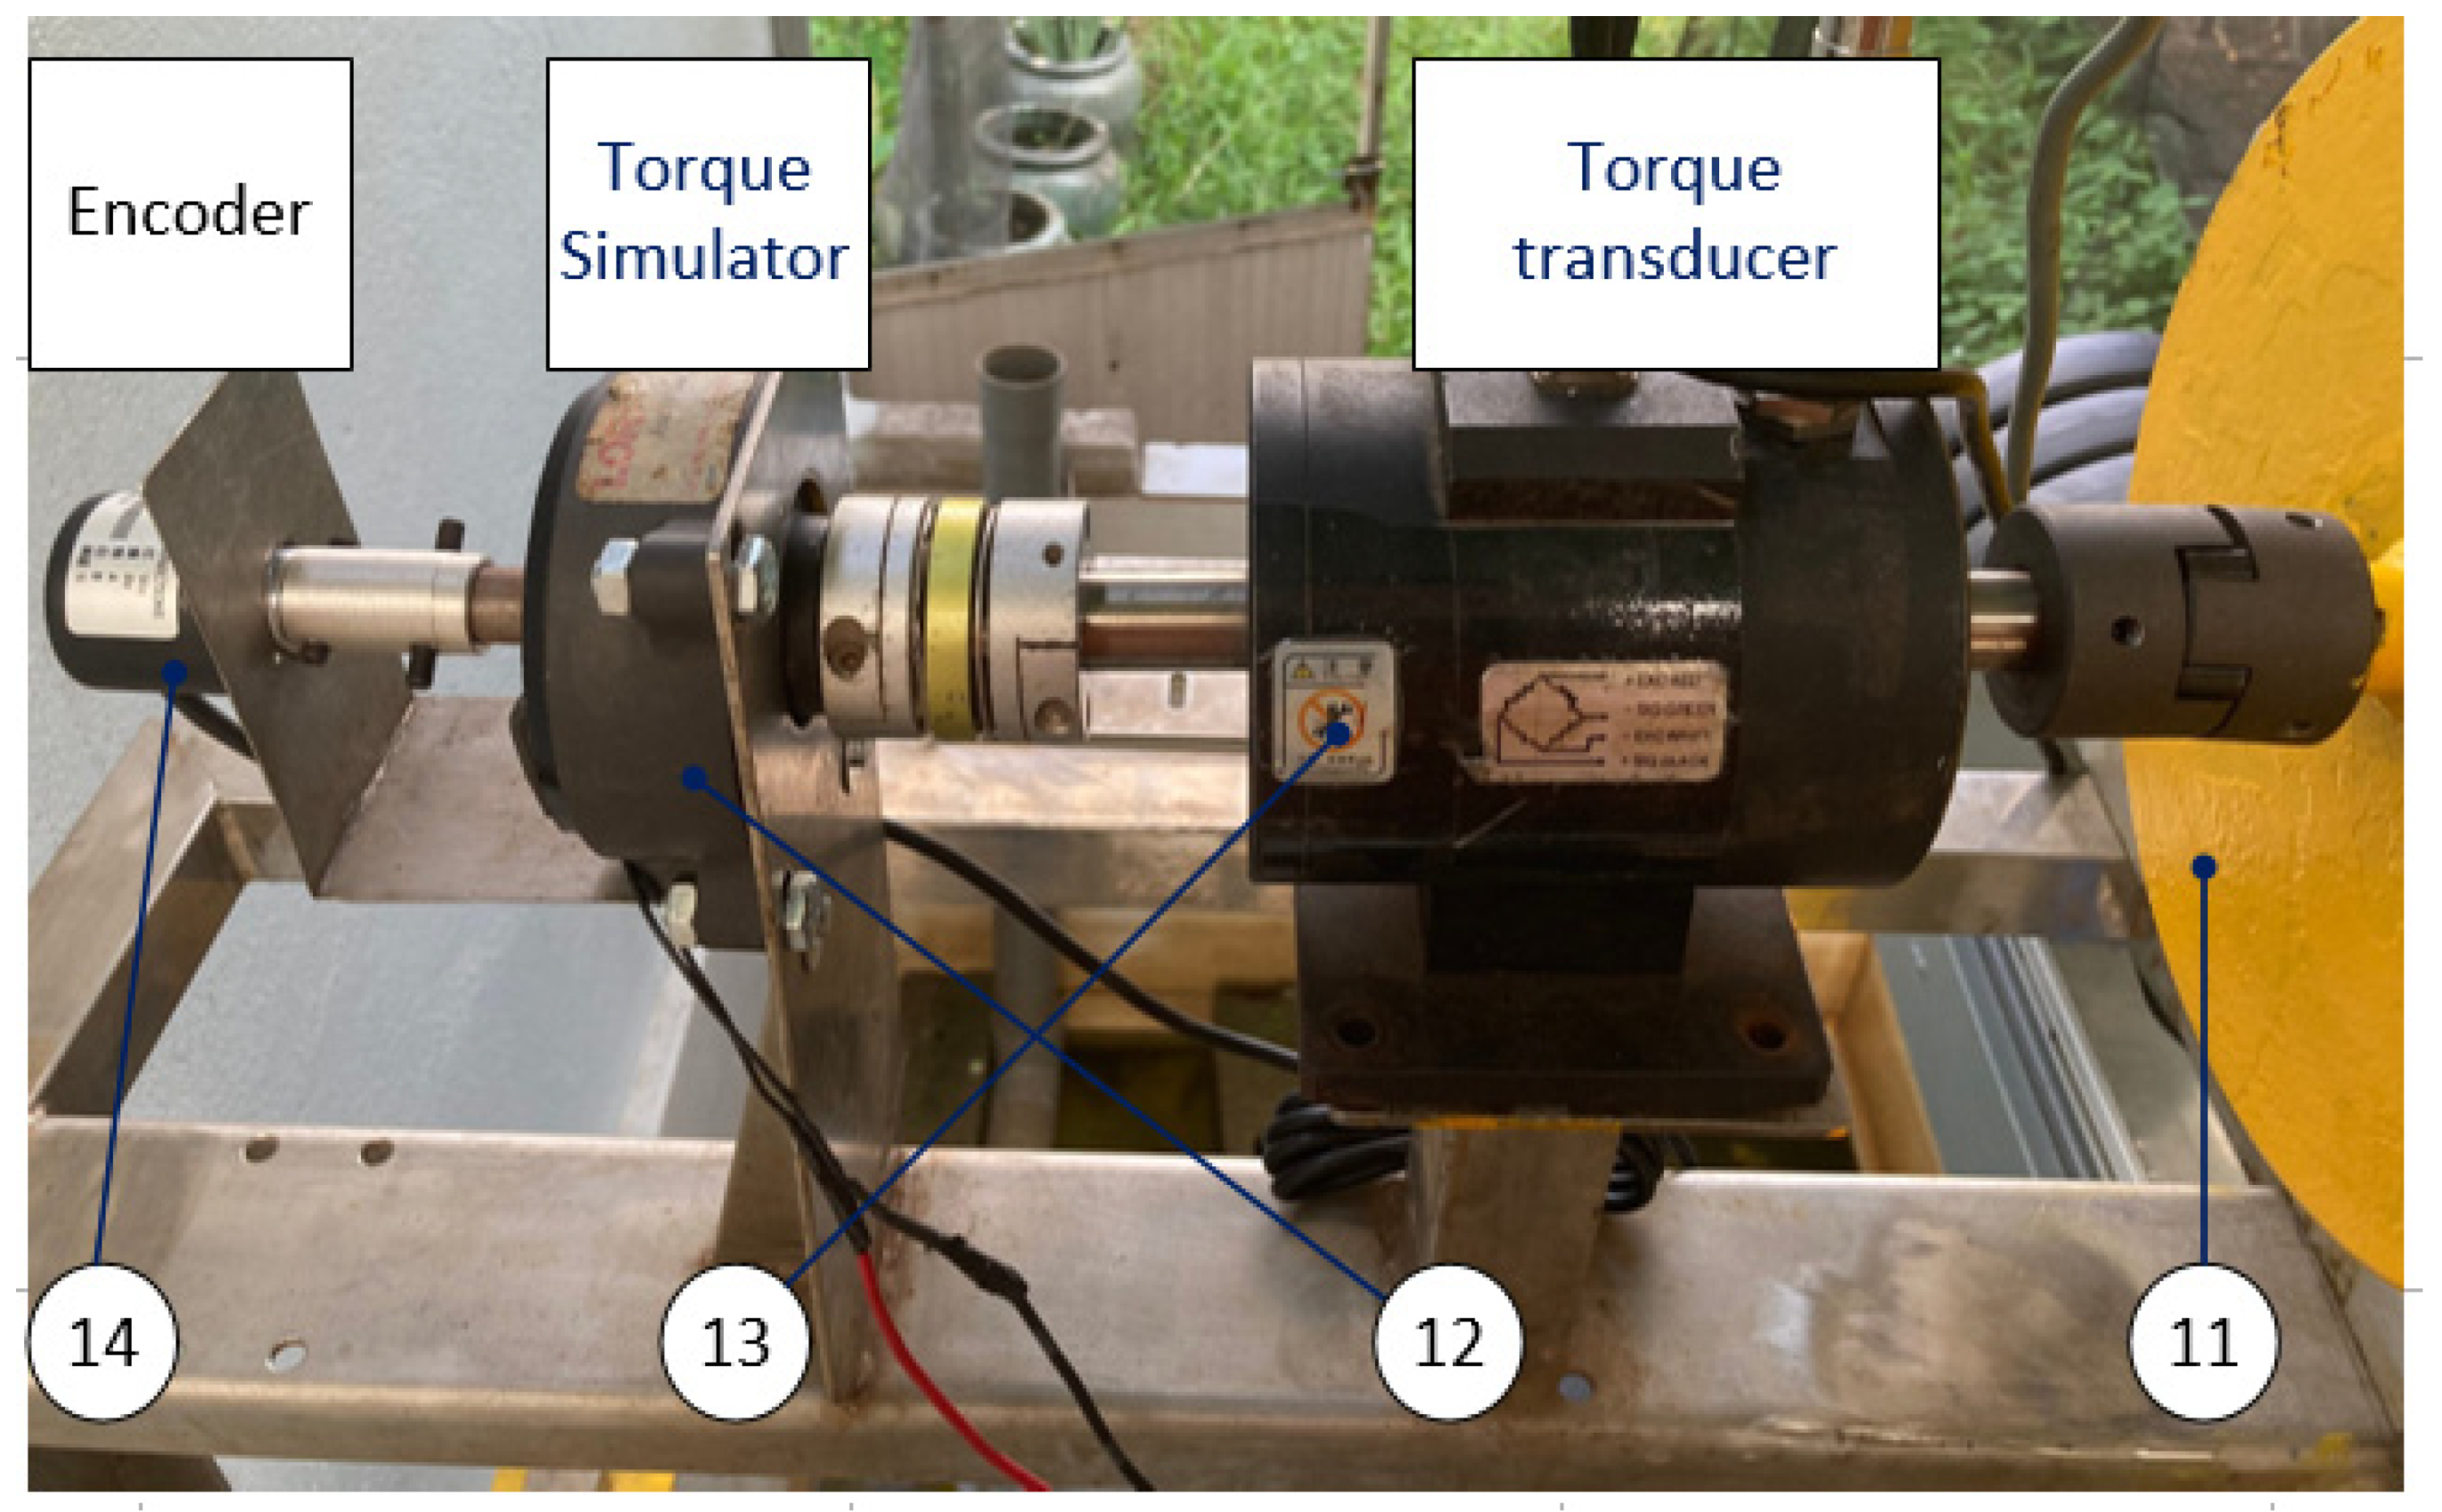
4. Test Rig in a Wave Tank

The structural design of the WEC is created by the Inventor software (version number 2024). The system configuration is shown in Figure 4. Here, the mechanical structure is assembled on the current support in the water tank.
Then, the test rig of the WEC, including a mechanical system and an electrical system, is conducted in the wave tank testing, as shown in Figure 5. To obtain test results, the measurement devices are set up and shown in Figure 6. A torque simulator is employed to generate the resistive torque from the generator. A speed encoder and torque transducer are applied to measure the speed and torque of the generator, respectively. The electrical system illustrated in Figure 7 collects measurement data and sends the control signal to the stepper motor.
Finally, a wave simulator system employed to generate wave motion is illustrated in Figure 8. The wave frequencies are controlled by using a VFD device and wave amplitudes are controlled by adjusting the radius of the slider and crank mechanism.

5. Set up Input Parameters

Before carrying out the tests, the PTO specification was obtained by direct measurement and is presented in Table 1. The tests are carried out under three regular wave conditions, as shown in Table 2. Moreover, the inertia of the PTO is adjusted to investigate the performance under different test cases. The added inertias are set up and shown in Table 3. These values were obtained by measuring the masses and distance to the center of the rotary.

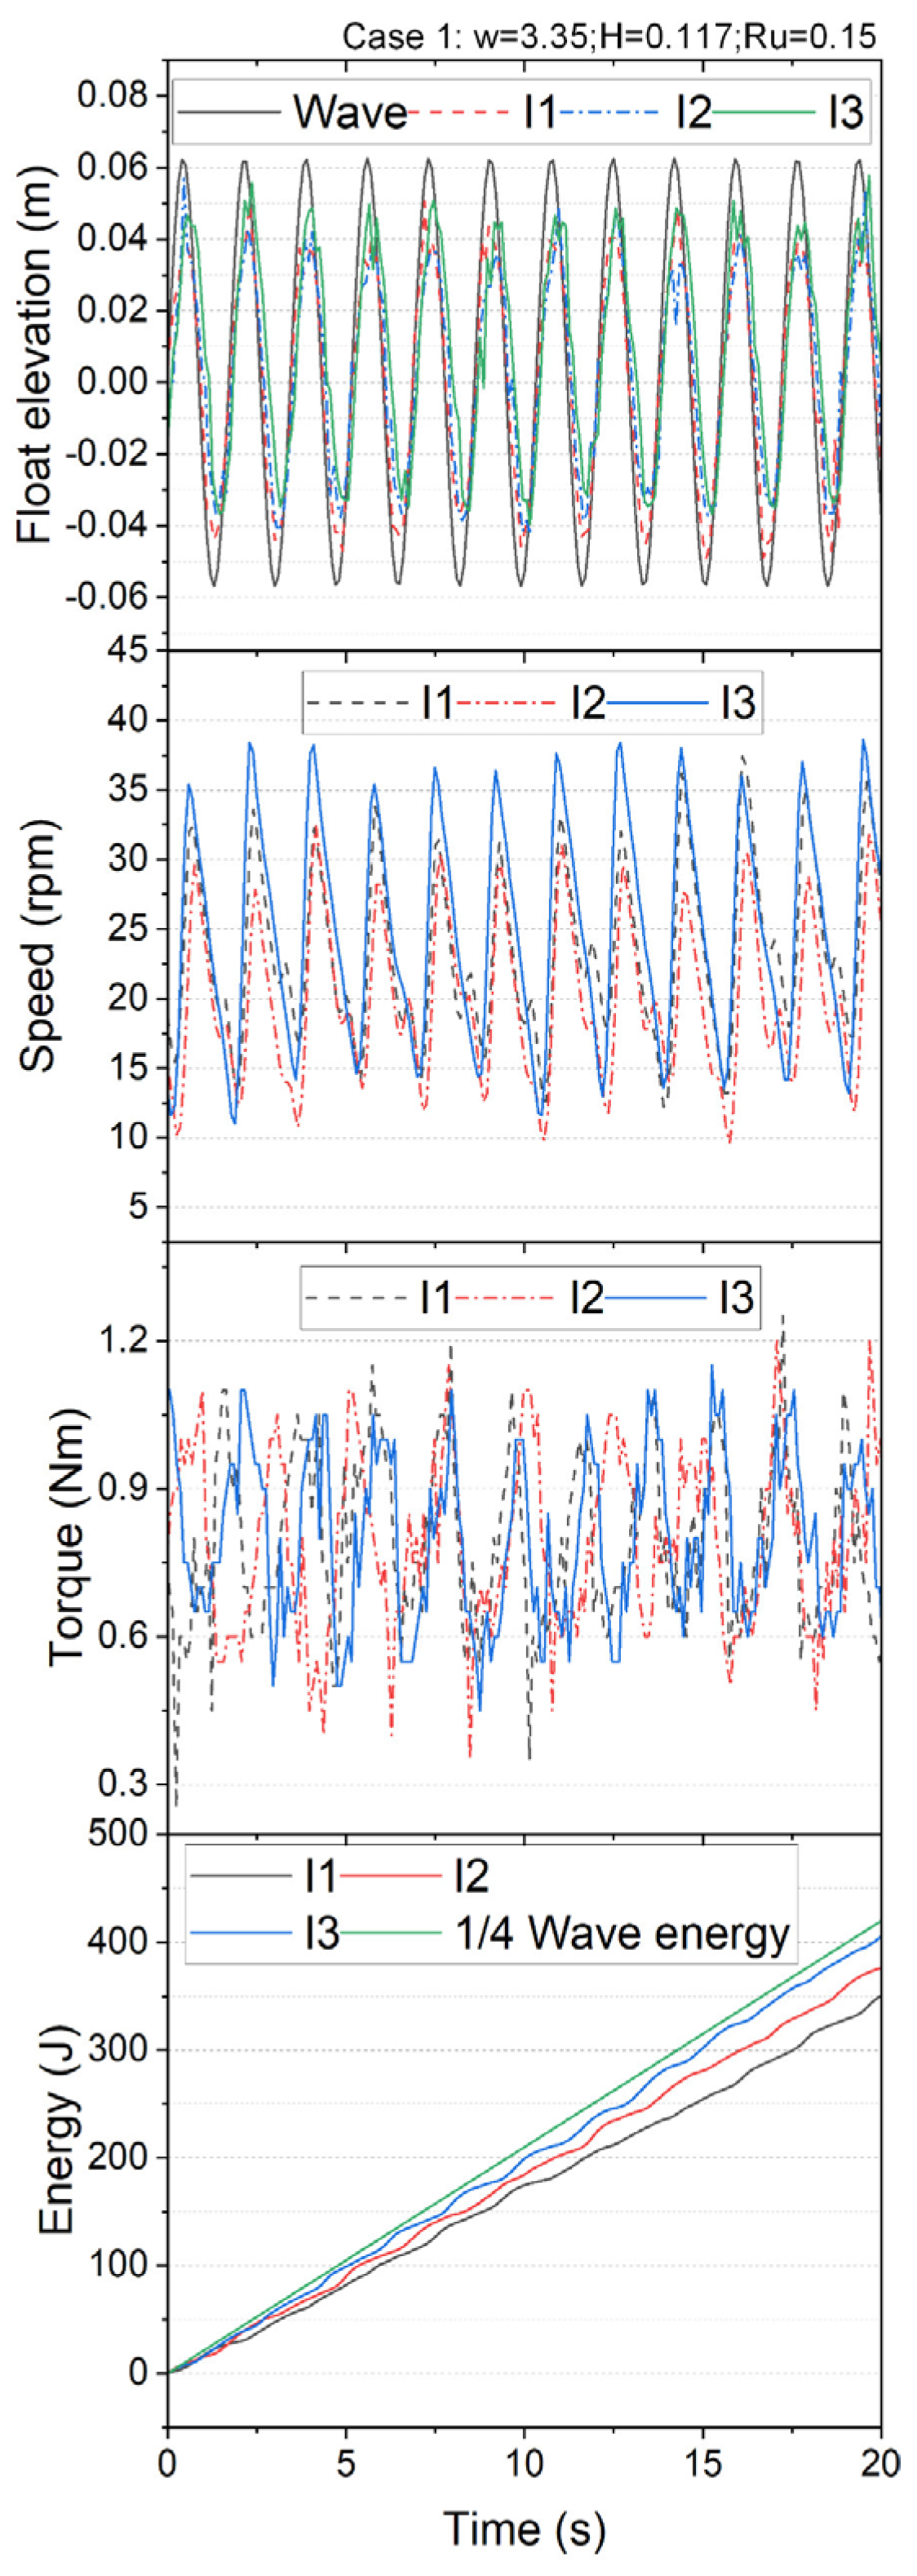
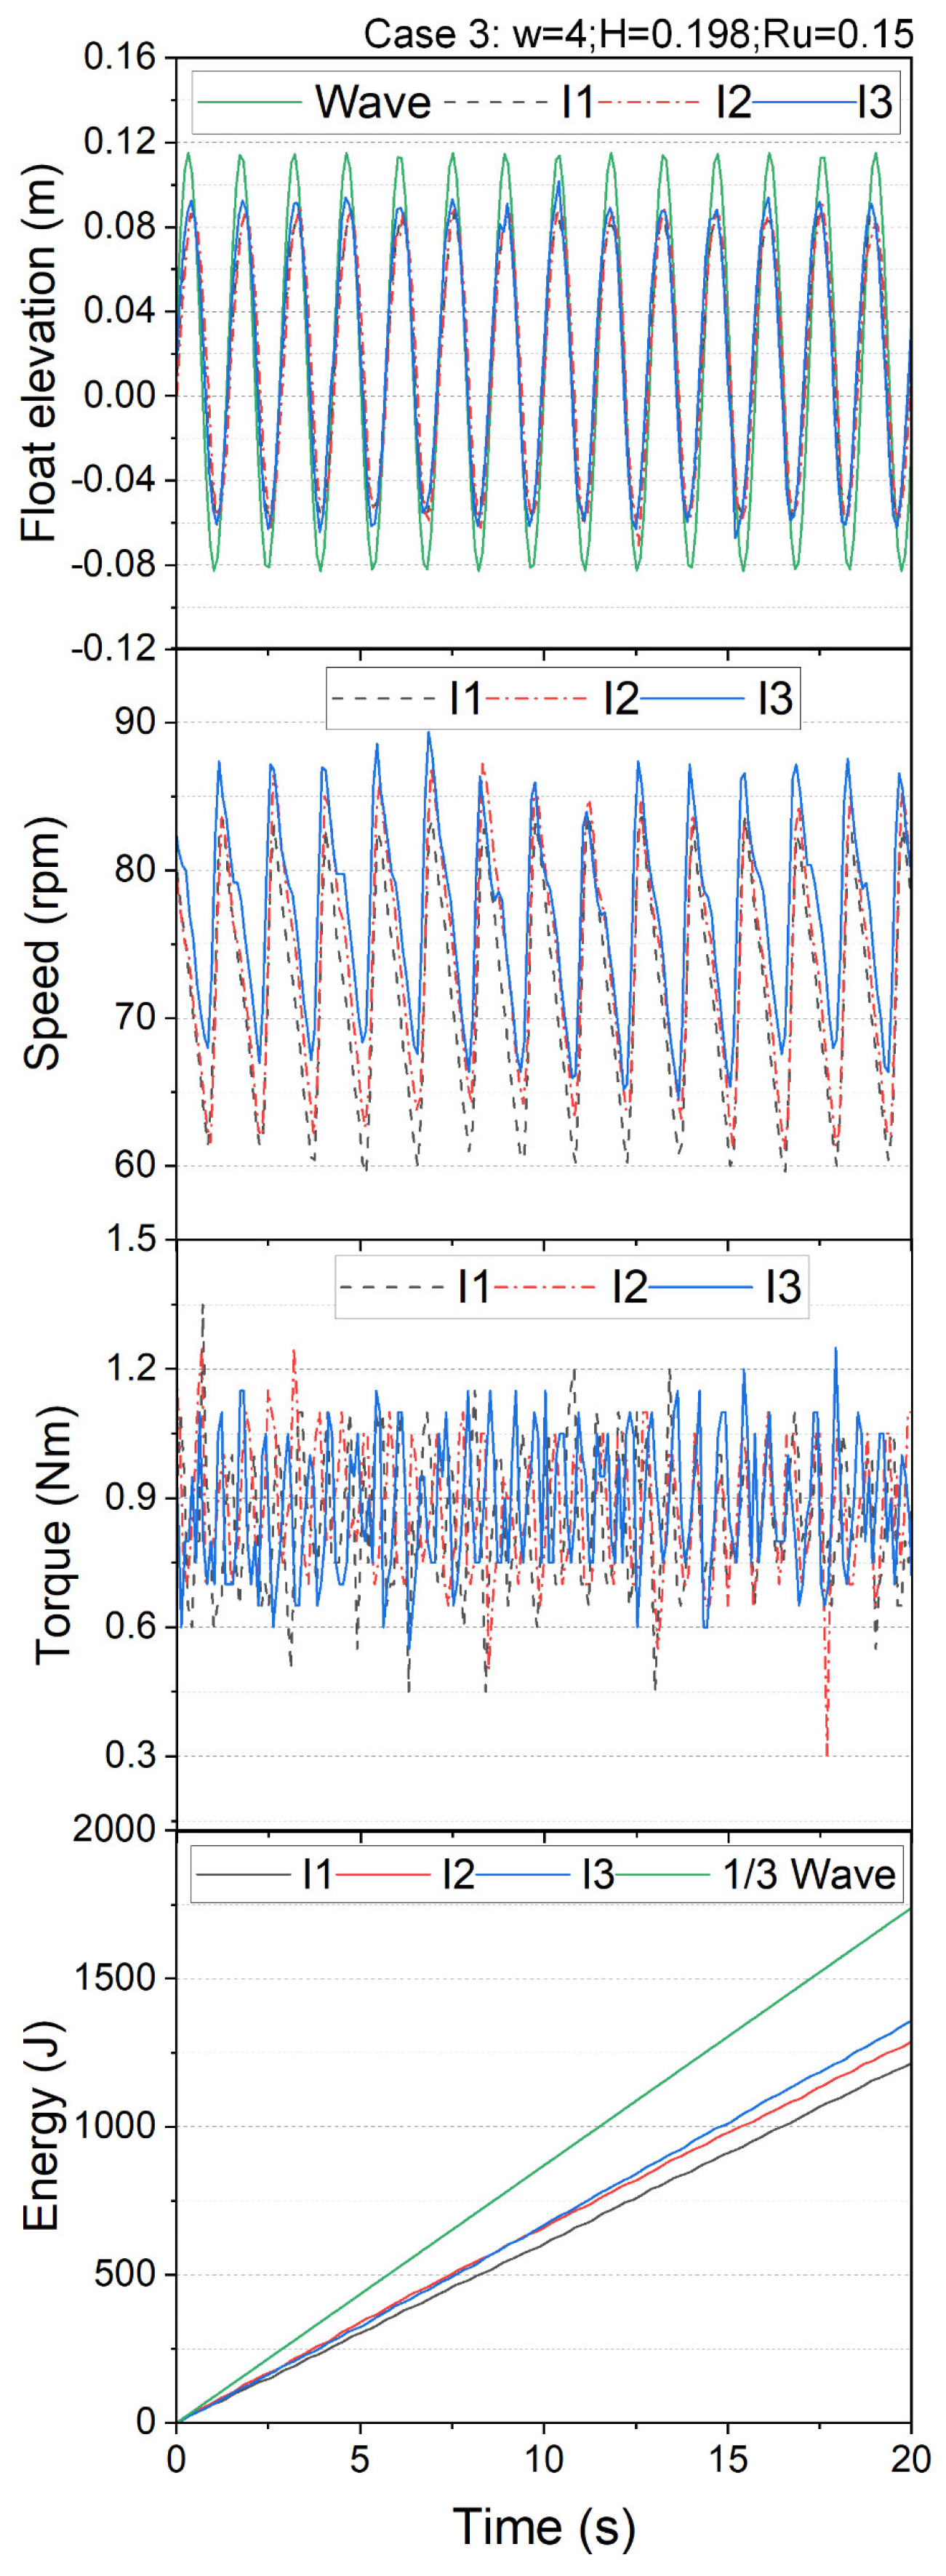
6. Test Results and Discussion

In the first test, the experimental setup was carried out under case 2 of the incident waveform. Tests were conducted in two cases of added inertia, I 0 and I 1 , as shown in Figure 9. The test results were obtained and plotted in Figure 10. As shown in Figure 10, the mathematical model was validated by a good agreement with the measured data. Here, the elevation of the floating buoy was measured by a cable sensor (Me. Floating ele) and compared with the simulation results from Equation (16) (Si. Float ele) on the top floor. Since the floating buoy elevations are the results of the hydrodynamic behavior, these values are different from the wave elevations. The generator speed and the resistive torque were also plotted and compared on the middle floor and bottom floor, respectively. As shown, on the middle floor, the corresponding speed of the generator is measured by an encoder device (Me. Speed). The simulation results (Si. Speed) are calculated by solving Equation (17) (Si. Speed). The Si. Speed is taken from solving differential Equation (16). Therefore, there is some disturbance in the initial state. However, the simulation results can reach a steady state in about 10 s. On the bottom floor, the resistive torque from the generator was measured by a torque transducer (Me. Torque) and compared with the simulation results obtained by solving Equation (19) (Si. Torque). While both test sets showed some discrepancies between the model predictions and the measured data, particularly at peak values, most measured values (buoy elevation, speed, and induced torque) exhibited good agreement with the model. These discrepancies might stem from limitations in the mechanical structure’s precision or nonlinearities in the actual wave-structure interaction. Notably, the measured torque exhibited some instability, possibly due to these nonlinearities, friction within the system, or imprecise mechanical parts. However, the average measured torque still aligned well with the model.
In the second test, the experiment setup is used to investigate the performance of the WEC under different cases of incident waves, as shown in Table 2. For each experimental case, three added inertias shown in Table 3 were adjusted by controlling the stepper motor. The test results are plotted in Figure 11, Figure 12 and Figure 13.
Figure 11 shows the floating buoy elevation, torque, speed, and energy driving the generator simulator in case 1 of the test. The tests were carried out under different cases of the inertia supplementary. First, the elevations of the floating buoy are measured and plotted in 20 s operating time. The rest results indicated that 20 s is enough time to reach a steady state. Then, the speeds of the generator simulator are presented under different added inertia levels. Next, the induced torques are shown in the figure. Finally, the generated energy is obtained by integrating the product of the generated torque and speed over the operating time. The mean wave power transmitting on the floating buoy is obtained by using linear wave theory. The experimental results indicate that the generated energy increases in cases with increased added inertia.
The same experiments were carried out in case 2 and case 3, and the test results are shown in Figure 12 and Figure 13, respectively. As shown in these figures, the added inertia has a significant influence on the performance of the WEC. According to linear wave theory, the added inertia brings the natural frequency of PTO close to the incident wave frequency (resonance behavior). Therefore, the floating elevation and speed are increased, and the generated energy is also increased. However, due to mechanical structure limitation, the added inertia is bounded in I 3 .
Table 4 shows the wave mean power, the achievable and the generated power used to drive the generator in three experimental cases under different added inertia I a . The overall efficiencies are obtained and shown in Table 5. Some achievable results of the overall efficiencies are recorded. First, the overall efficiencies increased in cases where the added inertia was increased; however, these are not the optimum cases. Second, the results in case 2 seem to be higher compared to those of case 1 and case 3. This indicates that the resistive load coefficient R g has a significant influence on overall efficiency. The resistive load applied in these experiments is approximately the optimum value in case 2. The largest overall efficiency achieved is about 39.22% in case 2.
These experimental results are compatible with Equation (28) and linear wave theory in [29]. The inertial supplementary brings the natural frequency of the PTO system close to the excited wave frequencies. Therefore, the PTO system reaches close to the resonance area. As a result of hydrodynamic behavior, the elevation of the floating buoy is increased. Then, the measured speed is also increased. By integrating the product of the generated torque and speed over the operating time, the generated energy is obtained and compared to different inertial supplements. Consequently, the generated energy in the case of I 3 achieved its maximum value.

7. Conclusions

This paper introduces a novel WEC equipped with an inertial adjusting mechanism to improve its performance. A conceptual design describing the WEC’s working principle is presented, along with specifications chosen to investigate the system’s operation. Hydrodynamic coefficients are pre-computed from ANSYS AQWA wave interaction software based on the chosen design parameters. A time-domain model of the WEC is built in MATLAB/Simulink, incorporating the pre-computed hydrodynamic parameters. Two sets of tests are carried out to validate the modeling under different added inertia and resistive load conditions, showing good agreement between simulations and experimental data.
Several tests investigate the influence of added inertia on the overall efficiency:
  • Increasing the added inertia caused higher buoy elevations, speeds, and induced torques.
  • Under different regular wave conditions, higher added inertia values led to greater generated power.
  • The inertial supplementary brought the natural frequency of the PTO system closer to the excited wave frequencies, nearing resonance.
  • The proposed WEC achieved a maximum overall efficiency of 39.22%.
Key findings on how added inertia affected performance:
  • Added inertia tuned the natural frequency of the PTO system towards the wave excitation frequencies.
  • This caused increased buoy motions and extracted more wave energy.
  • However, inertia was limited by mechanical structure constraints.
Future work will focus on optimizing the mechanical design to allow higher added inertia values and implementing optimal control strategies to maximize overall efficiency across real-world wave conditions.

Author Contributions

K.K.A. was the supervisor providing funding and he reviewed and edited the manuscript. C.B.P. carried out the experimental investigation and wrote the original manuscript. All authors have read and agreed to the published version of the manuscript.

Funding

The authors would like to thank HCMUTE for their support under project T2023-109. This work was supported by the “Regional Innovation Strategy (RIS)” through the National Research Foundation of Korea (NRF), funded by the Ministry of Education (MOE) (2021RIS-003).

Institutional Review Board Statement

Not applicable.

Informed Consent Statement

Not applicable.

Data Availability Statement

The original contributions presented in the study are included in the article, further inquiries can be directed to the corresponding author.

Conflicts of Interest

The authors declare no conflict of interest.

Nomenclature

a Buoy radius (m)
A Wave amplitude (m)
A 0 The water plane area of the buoy at rest (m2)
b The draft of initial position (m)
C d The drag coefficient
c F Force transition approximation coefficient (s/rad)
C g The group velocity (m/s)
D ( k h ) The depth functions
d The captured width (m)
E The mean wave energy density per unit horizontal area (J/m2)
E g The generated energy (J)
F b r The breakaway friction force (N)
F c The Coulomb friction force (N)
F e The excitation force (N)
F f Friction force from the PTO system (N)
F g The induced force by generator (N)
F h The hydrodynamic force (N)
F s The hydrostatic restoring force (N)
F sup The supplementary force (N)
F P T O The resistive force from the PTO system (N)
F r Radiation force (N)
F v Viscous force (N)
f 3 The excitation force coefficient
f v The viscous friction coefficient
g Gravitational acceleration (m/s2)
H Wave height (m)
h Water depth (m)
I 0 The initial inertia (kg·m2)
I a The added inertia (kg·m2)
I f l Equivalent inertia of the flywheel (kg·m2)
I s The supplementary inertia (kg·m2)
i G B The gear ratio
k The angular repetency (rad/m)
l 1 Center distance of the left mass (m)
l 2 Center distance of the right mass (m)
l a The arm length (m)
m a The added mass (kg)
m b The buoy mass (including support structure) (kg)
m 1 The added mass on the left side (kg)
m 2 The added mass on the right side (kg)
n The rotational speed of driving shaft (rad/s)
η Wave elevation (m)
η O The overall efficiency
R r The radiation damping coefficient
R g The torque coefficient from generator (Nms/rad)
P g The generated power (kW)
P m The mean wave power (kW/m)
P w The wave power interacted with the buoy (kW)
ρ Water density (kg/m3)
S b The buoyancy stiffness (N/m)
T d The driving torque of the generator’s shaft (Nm)
T f l The flywheel torque (Nm)
T g The induced torque of the generator (Nm)
φ The phase angle (rad)
ω Angular frequency of wave (rad/s)
ω n Natural frequency of the PTO (rad/s)
θ Angle of rotation of the output shaft (rad)
zBuoy position [m]

References

  1. Falcao, A.F.d.O. Wave energy utilization: A review of the technologies. Renew. Sustain. Energy Rev. 2010, 14, 899–918. [Google Scholar] [CrossRef]
  2. Zhang, Y.; Zhao, Y.; Sun, W.; Li, J. Ocean wave energy converters: Technical principle, device realization, and performance evaluation. Renew. Sustain. Energy Rev. 2021, 141, 110764. [Google Scholar] [CrossRef]
  3. Qin, J.; Zhang, Z.; Zhang, Y.; Huang, S.; Liu, Y.; Xue, G. Design and performance evaluation of novel magnetic tristable wave energy converter. Ocean Eng. 2023, 285, 115424. [Google Scholar] [CrossRef]
  4. Ahmad, M.M.; Kumar, A.; Alam, M.S. Harnessing of Wave Energy as Renewable Energy: An Overview. Int. J. Innov. Sci. Res. Technol. 2019, 4, 71–88. [Google Scholar]
  5. Kim, S.-J.; Koo, W.; Shin, M.-J. Numerical and experimental study on a hemispheric point-absorber-type wave energy converter with a hydraulic power take-off system. Renew. Energy 2018, 18, 31171–31176. [Google Scholar] [CrossRef]
  6. Amini, E.; Mehdipour, H.; Faraggiana, E.; Golbaz, D.; Mozafari, S.; Bracco, G.; Neshat, M. Optimization of hydraulic power take-off system settings for point absorber wave energy converter. Renew. Energy 2022, 194, 938–954. [Google Scholar] [CrossRef]
  7. Fan, Y.; Mu, A.; Ma, T. Design and control of a point absorber wave energy converter with an open loop hydraulic transmission. Energy Convers. Manag. 2016, 121, 13–21. [Google Scholar] [CrossRef]
  8. Sricharan, V.V.S.; Chandrasekaran, S. Time-domain analysis of a bean-shaped multi-body floating wave energy converter with a hydraulic power take-off using WEC-Sim. Energy 2021, 223, 119985. [Google Scholar] [CrossRef]
  9. Taniguchi, T.; Umeda, J.; Fujiwara, T.; Goto, H.; Inoue, S. Experimental and Numerical Study on Point Absorber Type Wave Energy Converter With Linear Generator. Ocean Renew. Energy 2017, 10, 61849. [Google Scholar]
  10. Umeda, J.; Goto, H.; Fujiwara, T.; Taniguchi, T.; Inoue, S. Experimental Study on Model Predictive Control for a Point Absorber Type Wave Energy Converter With a Linear Generator. Ocean Renew. Energy 2018, 10, 77724. [Google Scholar]
  11. Kim, J.; Kim, J.Y.; Park, J.B. Design and Optimization of a 8kW Linear Generator for a Direct-Drive Point Absorber. In Proceedings of the 2013 OCEANS-San Diego, San Diego, CA, USA, 23–27 September 2013. [Google Scholar]
  12. Wave Technology Inspired by the Human Heart. Available online: https://corpowerocean.com/wave-energy-technology/ (accessed on 9 October 2023).
  13. Liu, H.; Huang, L.; Li, Y.; Yang, J.; Zhang, J. Resonance control to eliminate reactive power of an improved dual-port direct-drive wave energy converter. Ocean Eng. 2023, 288, 116007. [Google Scholar] [CrossRef]
  14. Eco Wave Power: How It Works. Available online: https://www.ecowavepower.com/our-technology/how-it-works/ (accessed on 9 October 2023).
  15. Eco Wave Power: Why Onshore/Nearshore. Available online: https://www.ecowavepower.com/our-technology/why-onshore-nearshore/ (accessed on 9 October 2023).
  16. Binh, P.C.; Ahn, K.K. Performance Optimization of Dielectric Electro Active Polymers in Wave Energy Converter Application. Int. J. Precis. Eng. Manuf. 2016, 17, 1175–1185. [Google Scholar] [CrossRef]
  17. Dang, T.D.; Phan, C.B.; Ahn, K.K. Design and Investigation of a Novel Point Absorber on Performance Optimization Mechanism for Wave Energy Converter in Heave Mode. Int. J. Precis. Eng. Manuf.-Green Technol. 2019, 6, 477–488. [Google Scholar] [CrossRef]
  18. Dang, T.D.; Nguyen, M.T.; Phan, C.B.; Ahn, K.K. Development of a Wave Energy Converter with Mechanical Power Take-Off via Supplementary Inertia Control. Int. J. Precis. Eng. Manuf.-Green Technol. 2019, 6, 497–509. [Google Scholar] [CrossRef]
  19. Yoshimizu, K.; Sato, T.; Asai, T.; Watanabe, U.; Tsukamoto, S.; Nemoto, Y.; Taniyama, Y. An inerter-integrated wave energy converter for vibration mitigation of offshore floating buoys and its experimental validation. Ocean Eng. 2024, 303, 117789. [Google Scholar] [CrossRef]
  20. Bosma, B.; Zhang, Z.; Brekken, T.K.A.; Özkan-Haller, H.T.; McNatt, C.; Yim, S.C. Wave Energy Converter Modeling in the Frequency Domain: A Design Guide. In Proceedings of the IEEE Energy Conversion Congress and Exposition (ECCE), Raleigh, NC, USA, 15–20 September 2012; pp. 2009–2106. [Google Scholar]
  21. Pastor, J.; Liu, Y. Frequency and time domain modeling and power output for a heaving point absorber wave energy converter. Int. J. Energy Environ. Eng. 2014, 5, 101. [Google Scholar] [CrossRef]
  22. Gowrishankaran, R.; Mudunkotuwa, D.Y. Design an Ocean Wave Energy Converter for Srilanka. In Proceedings of the IESL Young Members’ Technical Conference, Online, 9 October 2021; pp. 98–105. [Google Scholar]
  23. Silvia, B.; Adrià, M.M.; Alessandro, A.; Giuseppe, P.; Renata, A. Modeling of a Point Absorber for Energy Conversion in Italian Seas. Energies 2013, 6, 3033–3051. [Google Scholar] [CrossRef]
  24. Adolfo, S.; Alex De, S. Modeling and Simulation of a Wave Energy Converter:Multibody System Coupled to Fluid-Film Lubrication Model and Thermal Analysis. Energies 2022, 15, 9358. [Google Scholar] [CrossRef]
  25. Mirko, P.; Anantha, K.; Jeff, S. A Comparative Study of Model Predictive Control and Optimal Causal Control for Heaving Point Absorbers. J. Mar. Sci. Eng. 2021, 9, 805. [Google Scholar] [CrossRef]
  26. José Carlos, U.P.; Christian, L.M.R.; Gustavo, O.G.A. Study of a New Wave Energy Converter with Perturb and Observe Maximum Power Point Tracking Method. Sustainability 2023, 15, 10447. [Google Scholar] [CrossRef]
  27. Doudou, L.; Ron, P. Model Predictive Energy-Maximising Tracking Control for a Wavestar-Prototype Wave Energy Converter. J. Mar. Sci. Eng. 2023, 11, 1289. [Google Scholar] [CrossRef]
  28. Binh, P.C.; Tri, N.M.; Dung, D.T.; Ahn, K.K.; Kim, S.-J.; Weoncheol Koo, W. Analysis, design and experiment investigation of a novel wave energy converter. IET Gener. Transm. Distrib. 2016, 10, 460–469. [Google Scholar] [CrossRef]
  29. Falnes, J. Ocean Waves and Oscillating Systems, Linear Interaction Including Wave-Energy Extraction; Cambridge University: Cambridge, UK, 2002. [Google Scholar]
Figure 1. Layout of the WEC: 1-float; 2-arm; 3-single heavy plate; 4-runway; 5-quarter-gear; 6-input gear; 7-converter gearbox; 8-support; 9-base; 10-stepper motor; 11-flywheel; 12-generator.
Applsci 14 05506 g001
Figure 2. Configurations of the floating buoy.
Applsci 14 05506 g002
Figure 3. Hydrodynamic parameters for the heave mode of the floating buoy radius a = 0.325 m; buoy draft b = 0.275 m in a water depth h = 1 m.
Applsci 14 05506 g003
Figure 4. The configuration of WEC built-in Inventor software (version number is 2024).
Applsci 14 05506 g004
Figure 5. Experimental setup for testing: 1-floating buoy; 2-arm; 3-added masses; 4-screw nut mechanism; 5-quarter-gear; 6-input gear; 7-converter gearbox; 8-support; 9-base; 10-stepper motor.
Applsci 14 05506 g005
Figure 6. Measurement devices for data collection: 11-flywheel; 12-torque simulator; 13-torque transducer; 14-encoder.
Applsci 14 05506 g006
Figure 7. Electrical system for signal collection.
Applsci 14 05506 g007
Figure 8. A wave simulator mounted in water-tested tank.
Applsci 14 05506 g008
Figure 9. Experiment set up under case I 0 = 0 and I 1 = 88.5 kg·m2.
Applsci 14 05506 g009
Figure 10. Model validation under two cases of tests: (a) comparison between simulation and measurement results for I 0 = 0; (b) comparison between simulation and measurement results for I 1 = 88.5 kg·m2.
Applsci 14 05506 g010
Figure 11. Results in case 1.
Applsci 14 05506 g011
Figure 12. Results in case 2.
Applsci 14 05506 g012
Figure 13. Results in case 3.
Applsci 14 05506 g013
Table 1. PTO system specifications.
SpecificationsParameters
Buoy diameter a = 0.325 m
Buoy draftB = 0.275 m
Buoy mass m b = 15 kg
Initial PTO inertia I 0 = 85 kg·m2
Flywheel Inertia I f = 0.25 kg·m2
Arm length l a = 1.5 m
Transmission Ratio i G B = 49
Table 2. Wave testing conditions.
CaseWave Frequency ω
(rad/s)
Wave Height H
(m)
Wave Number k
(rad/m)
13.350.1171.211
23.6280.1351.268
340.1981.321
Table 3. Added inertia in tests.
CaseAdded Inertia (kg·m2)
I 1 88.5
I 2 99.3
I 3 117.1
Table 4. Generated power.
SpecificationsCase 1Case 2Case 3
Incident mean wave power88.51 W108.67 W211.46 W
I 1 18.51 W30.44 W48.91 W
I 2 19.81 W33.7 W52.18 W
I 3 21.35 W42.62 W54.98 W
Table 5. Overall efficiency.
InertiaCase 1Case 2Case 3
I 1 20.85%28.02%23.13%
I 2 22.39%31.02%24.68%
I 3 24.13%39.22%26.01%
Disclaimer/Publisher’s Note: The statements, opinions and data contained in all publications are solely those of the individual author(s) and contributor(s) and not of MDPI and/or the editor(s). MDPI and/or the editor(s) disclaim responsibility for any injury to people or property resulting from any ideas, methods, instructions or products referred to in the content.

