Abstract
This study compares a standard monofocal intraocular lens (IOL) with two rotationally asymmetric refractive multifocal IOLs, analyzing power profiles and wavefront data across three nominal powers. Tested IOLs included monofocal Acunex AN6 and multifocal AN6V (addition +1.50 D) and AN6VM (addition +3.00 D) by Teleon Surgical, at powers +10.00 D, +20.00 D, and +30.00 D. Using NIMO TR1504, power profiles, spherical aberration, and coma were analyzed. Multifocal lenses displayed an asymmetrical design, with zones for far and near vision and a central notch for far power. The multifocal AN6V and AN6VM showed neutral spherical aberration in the center, increasing to positive values, and finally achieving negative values towards the periphery. The vertical coma coefficient [Z(3:−1)] remains almost stable for the monofocal IOLs. The lower-addition multifocal IOLs induce primary vertical coma of +0.11 microns at 3 mm away from the lens center compared to +0.21 microns obtained with the high-addition lens. We can conclude that the multifocal AN6V and AN6VM lenses display an asymmetrical design. The final addition provided by these lenses depends on its nominal power. The variation of SA with optic size is more pronounced for the monofocal model, and it is dependent on the nominal power.
1. Introduction
Multifocal intraocular lens (IOL) designs are continually evolving, along with increasing demand from patients seeking spectacle independence [1]. Therefore, manufacturers follow different strategies to reach a greater number of patients while minimizing the adverse effects intrinsic to some designs, such as halos or dysphotopsia.
In the final process of selecting the IOLs, it is the ophthalmologist who must decide which lens is most suitable for each patient. To do so, they must analyze both the clinical characteristics of the patient and their demands and expectations for the lens surgery. However, access to technical information on the IOLs is often limited due to patent protection, copyright issues, or manufacturer decisions. To make the most appropriate selection possible, the ophthalmologist must have access to all the relevant technical information.
Some laboratories manufacture IOLs with different optical design based on the same platform. As an example, the Acunex AN6, AN6V, and AN6VM intraocular lenses manufactured by Teleon Surgical (Spankeren, The Netherlands) are three IOLs based on the same platform, including a standard monofocal design (AN6) and two multifocal designs, one with low addition (AN6V, with +1.50 D addition) and one with high addition (AN6VM, with +3.00 D addition). These lenses were recently marketed and manufactured in hydrophobic material, with an optical design reminiscent of the Lentis Mplus lenses (Oculentis GmbH, Berlin, Germany) [2,3].
The Acunex hydrophobic multifocal lenses feature refractive optics with a sector-shaped near vision segment with different additions. However, the addition’s presentation in a sector shape causes the lens to have an asymmetric geometry that can affect aberrations. Therefore, the position of the lens, and the patient’s pupil size can significantly affect the final visual result [4,5,6].
The purpose of this study is to provide laboratory-independent technical information on the Acunex IOL family by comparing three different designs of IOLs with identical platform and material, using analysis on an optical bench. The radial profiles and high-order aberrations (HOA) will be analyzed, paying special attention to spherical aberration and coma. Additionally, it will be evaluated whether the nominal power of these IOLs affects the add power that can be obtained with these designs by assessing three different nominal powers (+10.00 D, +20.00 D, and +30.00 D).
2. Materials and Methods
This study was conducted at the laboratory facilities of the Optics and Optometry Faculty of the Universidad Complutense de Madrid, Spain, under stable conditions of temperature and humidity.
2.1. Intraocular Lenses
Acunex (Teleon Surgical, Spankeren, The Netherlands) is a family of one-piece posterior chamber IOLs based on a proven hybrid biomaterial platform that is hydrophobic and FDA-certified as glistening-free. The Acunex lenses have a step-vaulted C-loop design, an optical diameter of 6.0 mm, and an overall diameter of 12.5 mm. The UV-absorbing material, with a water content of 4%, has a high refractive index of 1.54, and a blue light filter is incorporated.
According to the manufacturer, the monofocal Acunex IOL (AN6) [7] has an aspherical posterior surface. The lens introduces a spherical aberration of −0.13 µm at an unspecified optical zone. The multifocal IOLs, the AN6V [8] and AN6VM [9] models, have a sector-shaped near vision segment on the anterior surface, with an aspherical posterior surface and neutral spherical aberration, also at an unspecified location. The AN6V model is described as an EDOF lens, providing an addition of +1.50 D, while the AN6VM model is described as a varifocal lens with an addition of +3.00 D.
2.2. Optical Bench
The optical bench used in this study was the NIMO TR1504 deflectometer, marketed by Lambda-X (Nivelles, Belgium). This device can be used to measure and analyze the refractive power and full wavefront aberrations of monofocal, toric, and multifocal IOLs. The deflectometer combines the Schlieren principle and traditional phase shifting to measure the ray deflection map of a lens, and then compute the wavefront at the lens exit and the corresponding power map [10]. Wavefront is expressed as a combination of the first 105 Zernike polynomials. The measurement light source exhibits a peak radiance at 546 nm.
The main quantity measured in this study were the radial power profiles expressed in diopters, the root mean square (RMS) of total high-order aberrations (HOAs) expressed in microns (from the third to thirteenth order), the spherical aberration and the coma, due to the design of these lenses, and the Zernike coefficient values related to the spherical aberration [from Z(4:0) to Z(8:0)] expressed in microns, for different optical diameters. Aberrations were studied for 3 mm and 4.5 mm, since those are currently used in the literature as they correspond to typical pupil sizes under photopic (3.00 mm) and mesopic (4.5 mm) lighting conditions.
The measurement protocol used followed the same procedure as described by Gomez-Pedrero et al. [11] for intraocular lenses. It involved conducting 10 measurements for each evaluation without the use of filters, considering the lenses as thin lenses.
To prevent surface deformation and dehydration during measurements, IOLs were immersed in a saline solution, with refractive index = 1.334, in a quartz cuvette devoid of aberrations.
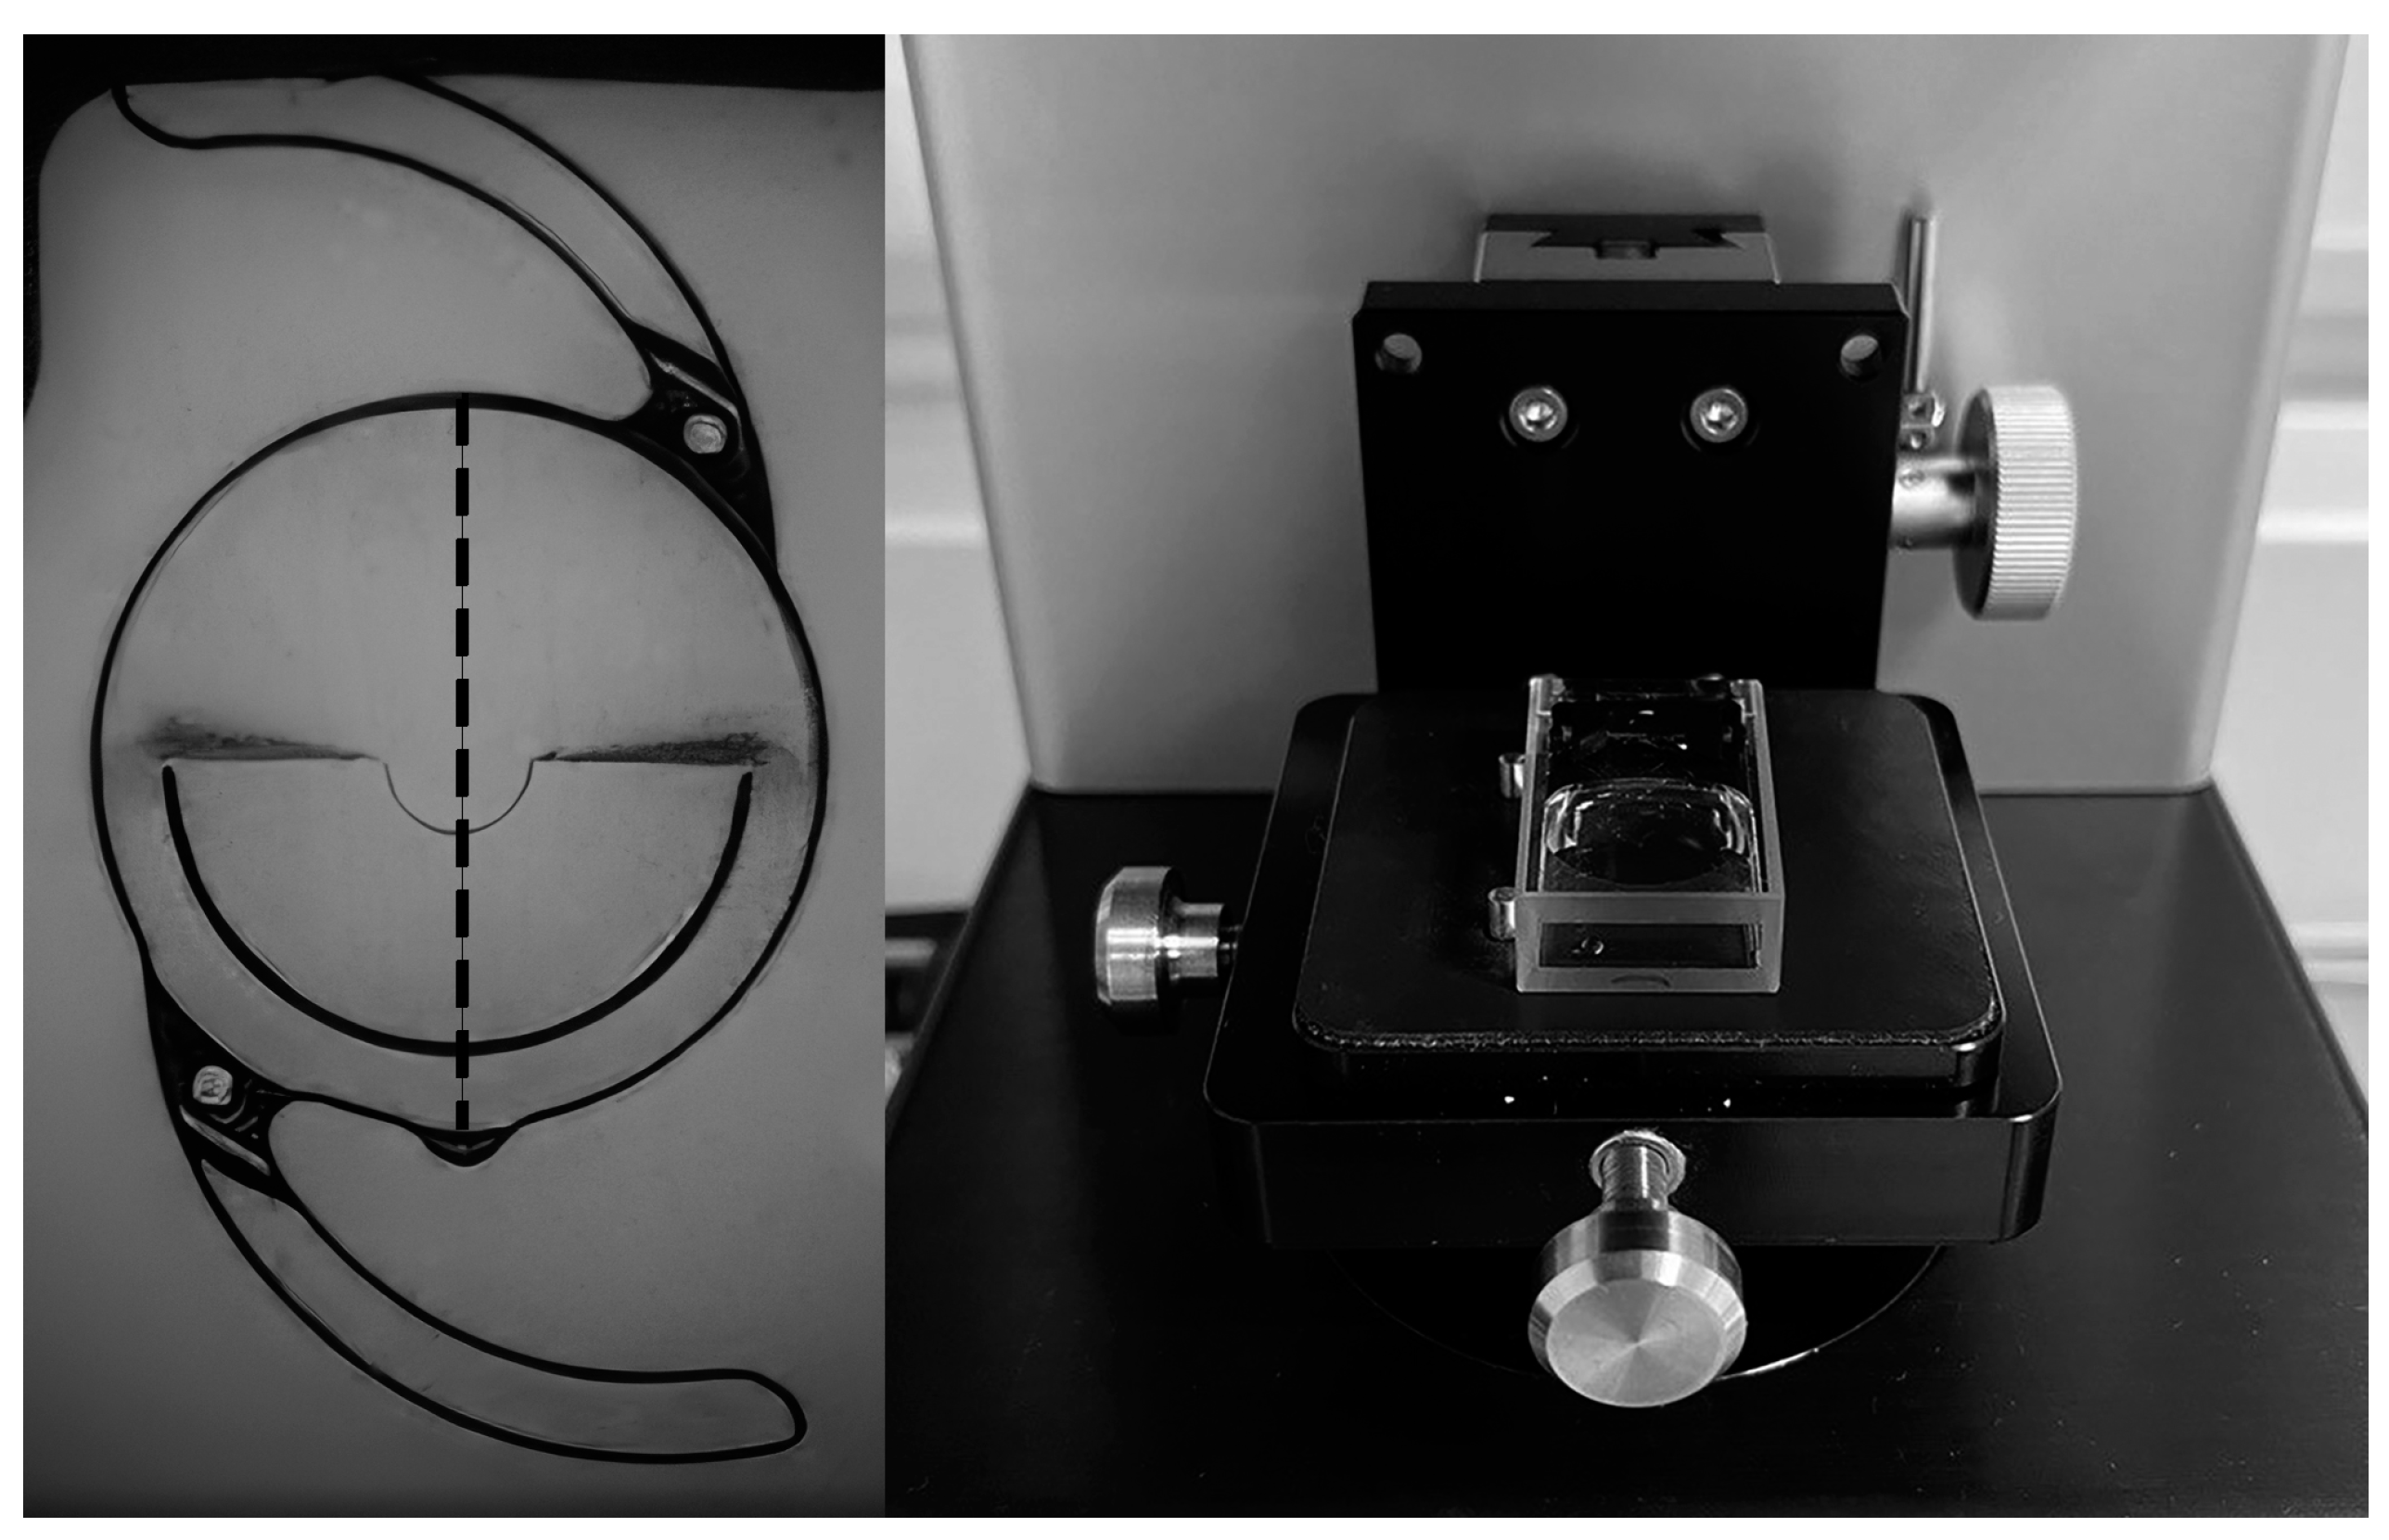
Figure 1 shows a picture of the +20.00 D AN6VM IOL as seen inside the NIMO cuvette (left side). A vertical dashed line has been added to the IOL image in Figure 1 to indicate the IOL axis of symmetry along which data was obtained to depict power profiles (left side). A picture of the cuvette containing the lens and positioned for measurement can be seen in the right side of Figure 1.
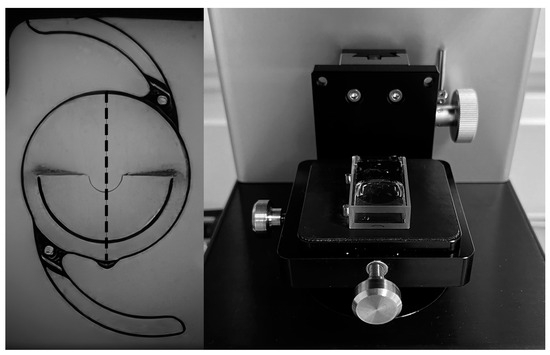
Figure 1.
Image of the Acunex multifocal lens measured on the optical bench (left side). The near power zone is located at the bottom, while the distance power zone is at the top and centered within the notch. The vertical dashed line symbolizes the axis of symmetry, along which data was collected to illustrate power profiles. The cuvette with the lens inside in measurement position (right).
3. Results
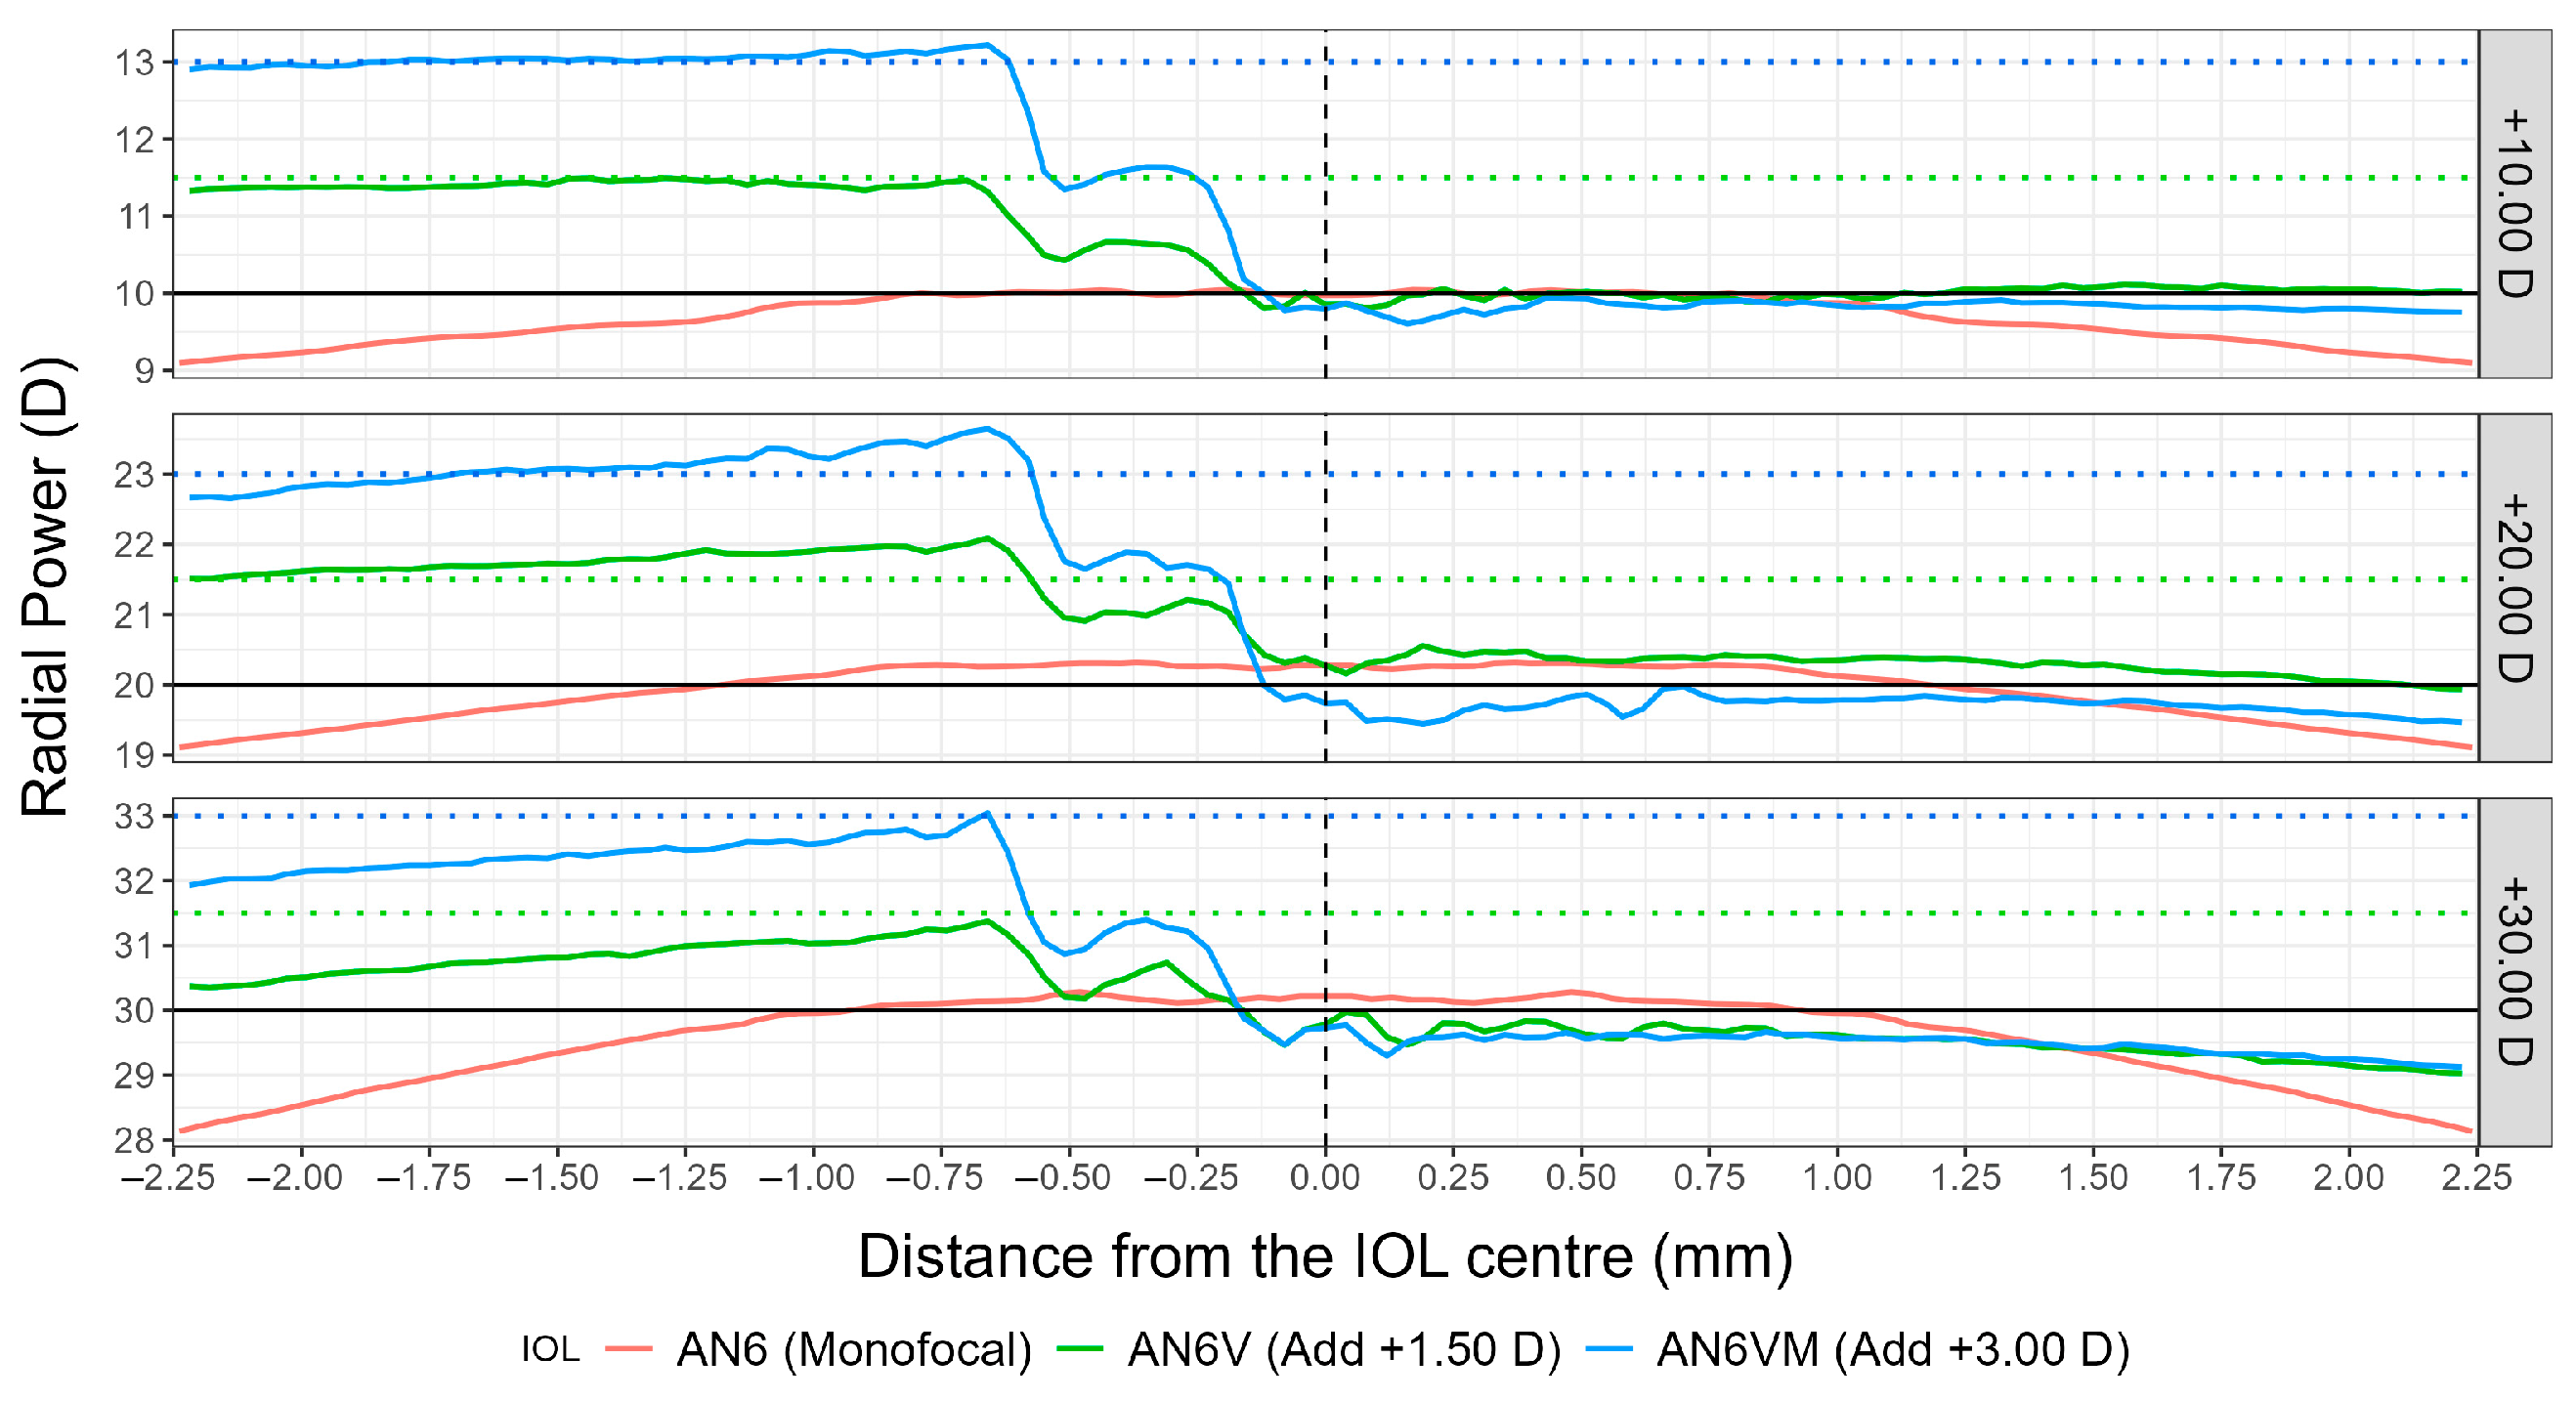
Figure 2 shows the mean radial profiles along the axis of symmetry of the lens (shown in Figure 1) obtained from 10 measures for each of the Acunex IOLs used in the study. The monofocal IOL (AN6) is represented by a solid red line, while the multifocal models are represented by solid green (AN6V) and blue (AN6VM) lines. The left part in Figure 2 corresponds to the lower half of the lens (containing the near power zone) when it is positioned for implantation (with the add at the bottom), while the right part corresponds to the upper half of the lens (containing the far power zone).
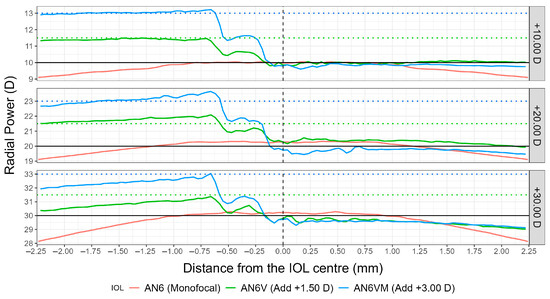
Figure 2.
Radial power profiles for the three IOL models (AN6, AN6V, AN6VM) and for the three measured nominal powers (+10.00 D up, +20.00 D middle, +30.00 D bottom). The left part corresponds to the near power zone while the right part corresponds to the far power zone. Horizontal black solid lines represent the nominal power for each of the IOLs. Horizontal green dashed lines represent +1.50 D addition from the nominal power. Horizontal blue dashed lines represent +3.00 D addition from the nominal power. Vertical black dashed lines represent the optic center of the IOLs.
As can be seen from Figure 2, the three IOLs have similar far power distribution (right side of the graphs), with slight differences towards the periphery of the optics. The monofocal model shows a radial power equal to the nominal power for around the central 2 millimeters of the IOL optic, with a posterior decrease in refractive power towards the IOL periphery, consistent with a negative spherical aberration. The multifocal models are more constant in the far power distribution (right side of the graphs in Figure 2), with almost the same radial power as the nominal power up to the periphery of the far portion of the optics.
In the case of multifocal models, it can be seen from Figure 2 that the far power of the lens does not exactly restrict to the right side of the graphs, but extents to around the first 0.12 mm of the left side, that is, the near zone begins 0.12 mm below de IOL center. This fact is in perfect concordance with the central notch in the near addition segment shown in Figure 1.
The left side of the graphs (near vision) shows significant differences between the monofocal and multifocal models. As mentioned above, for the AN6V and AN6VM, the increase in power for near vision occurs not exactly from the center of the lens (x = 0 mm), but approximately 0.12 mm below the optical center (x = −0.12 mm), with a “two-step behavior”: an initial increase of half the addition in power from approximately x = −0.12 mm to x = −0.50 mm, and a posterior increase from approximately x = −0.50 mm to x = −0.75 mm, until achieving the maximum addition. For the three measured nominal powers, the power profile corresponding to the near vision has a parallel behavior between low (AN6V) and high (AN6VM) addition multifocal models, being the distance between both lines of 1.50 D (exactly the difference in addition power between both models). It seems that the +10.00 D IOL maintains a constant addition value all over the near part of the optics (see the parallelism between the AN6V and AN6VM IOL power profiles and the +1.50 D addition and +3.00 D additions dashed lines in the left side of the plot), whereas the +30.00 D IOL shows a decrease in addition power towards the periphery of the near segment (see the difference of almost 1 D between addition at x = −0.63 mm and addition at x = −2.25 mm in the left side of the plot). The +20.00 D IOL shows a behavior between that of the +10.00 D and the +30.00 D IOLs.
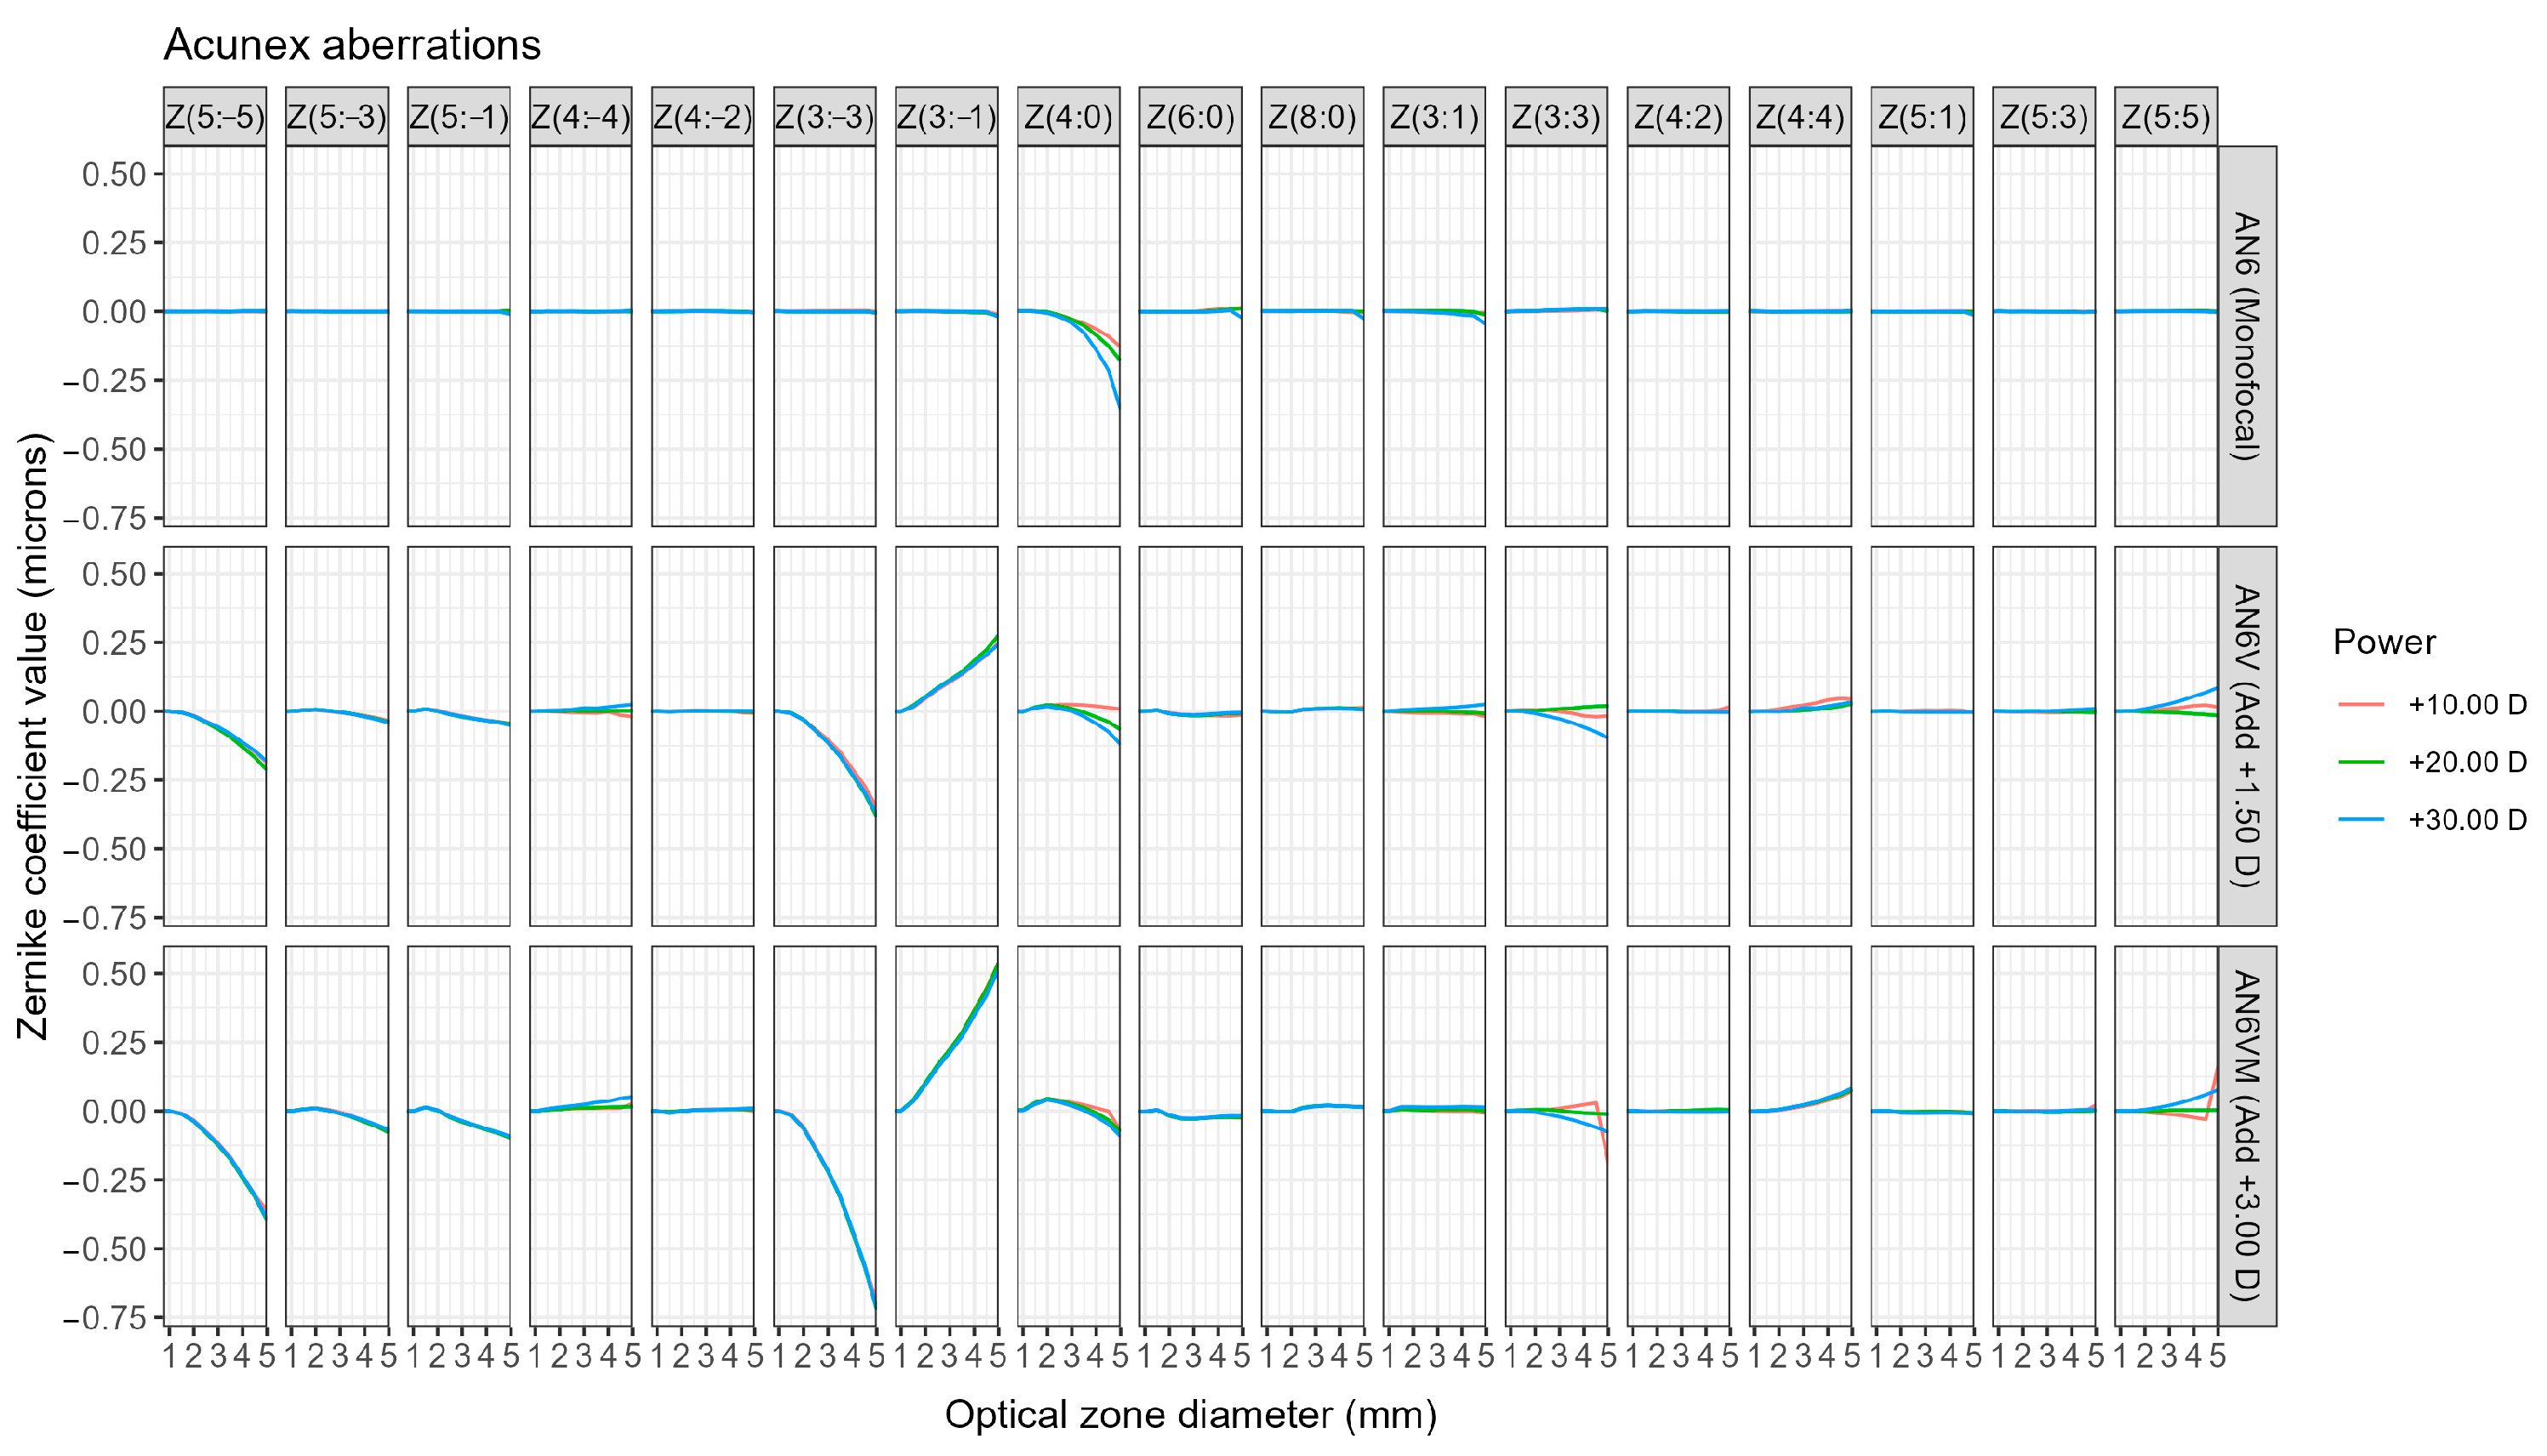
Regarding aberrometric profiles, Figure 3 shows primary spherical aberration variation with optical zone diameter, whereas vertical coma is depicted in Figure 4 (primary vertical coma and secondary vertical coma). The remaining Zernike polynomials have no significant effect since the RMS values computed considering all Zernike polynomials up to the 10th order for each of the IOLs are almost equal to the RMS values computed with just the aforementioned polynomials (with minor variations from the 3rd decimal position onwards), as can be seen in Figure 5.
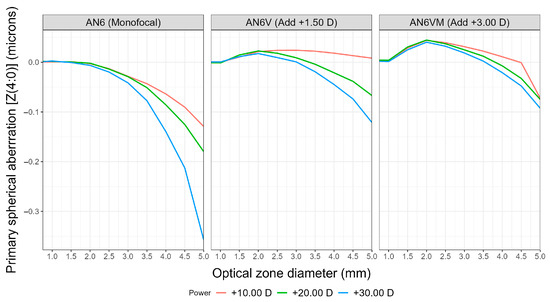
Figure 3.
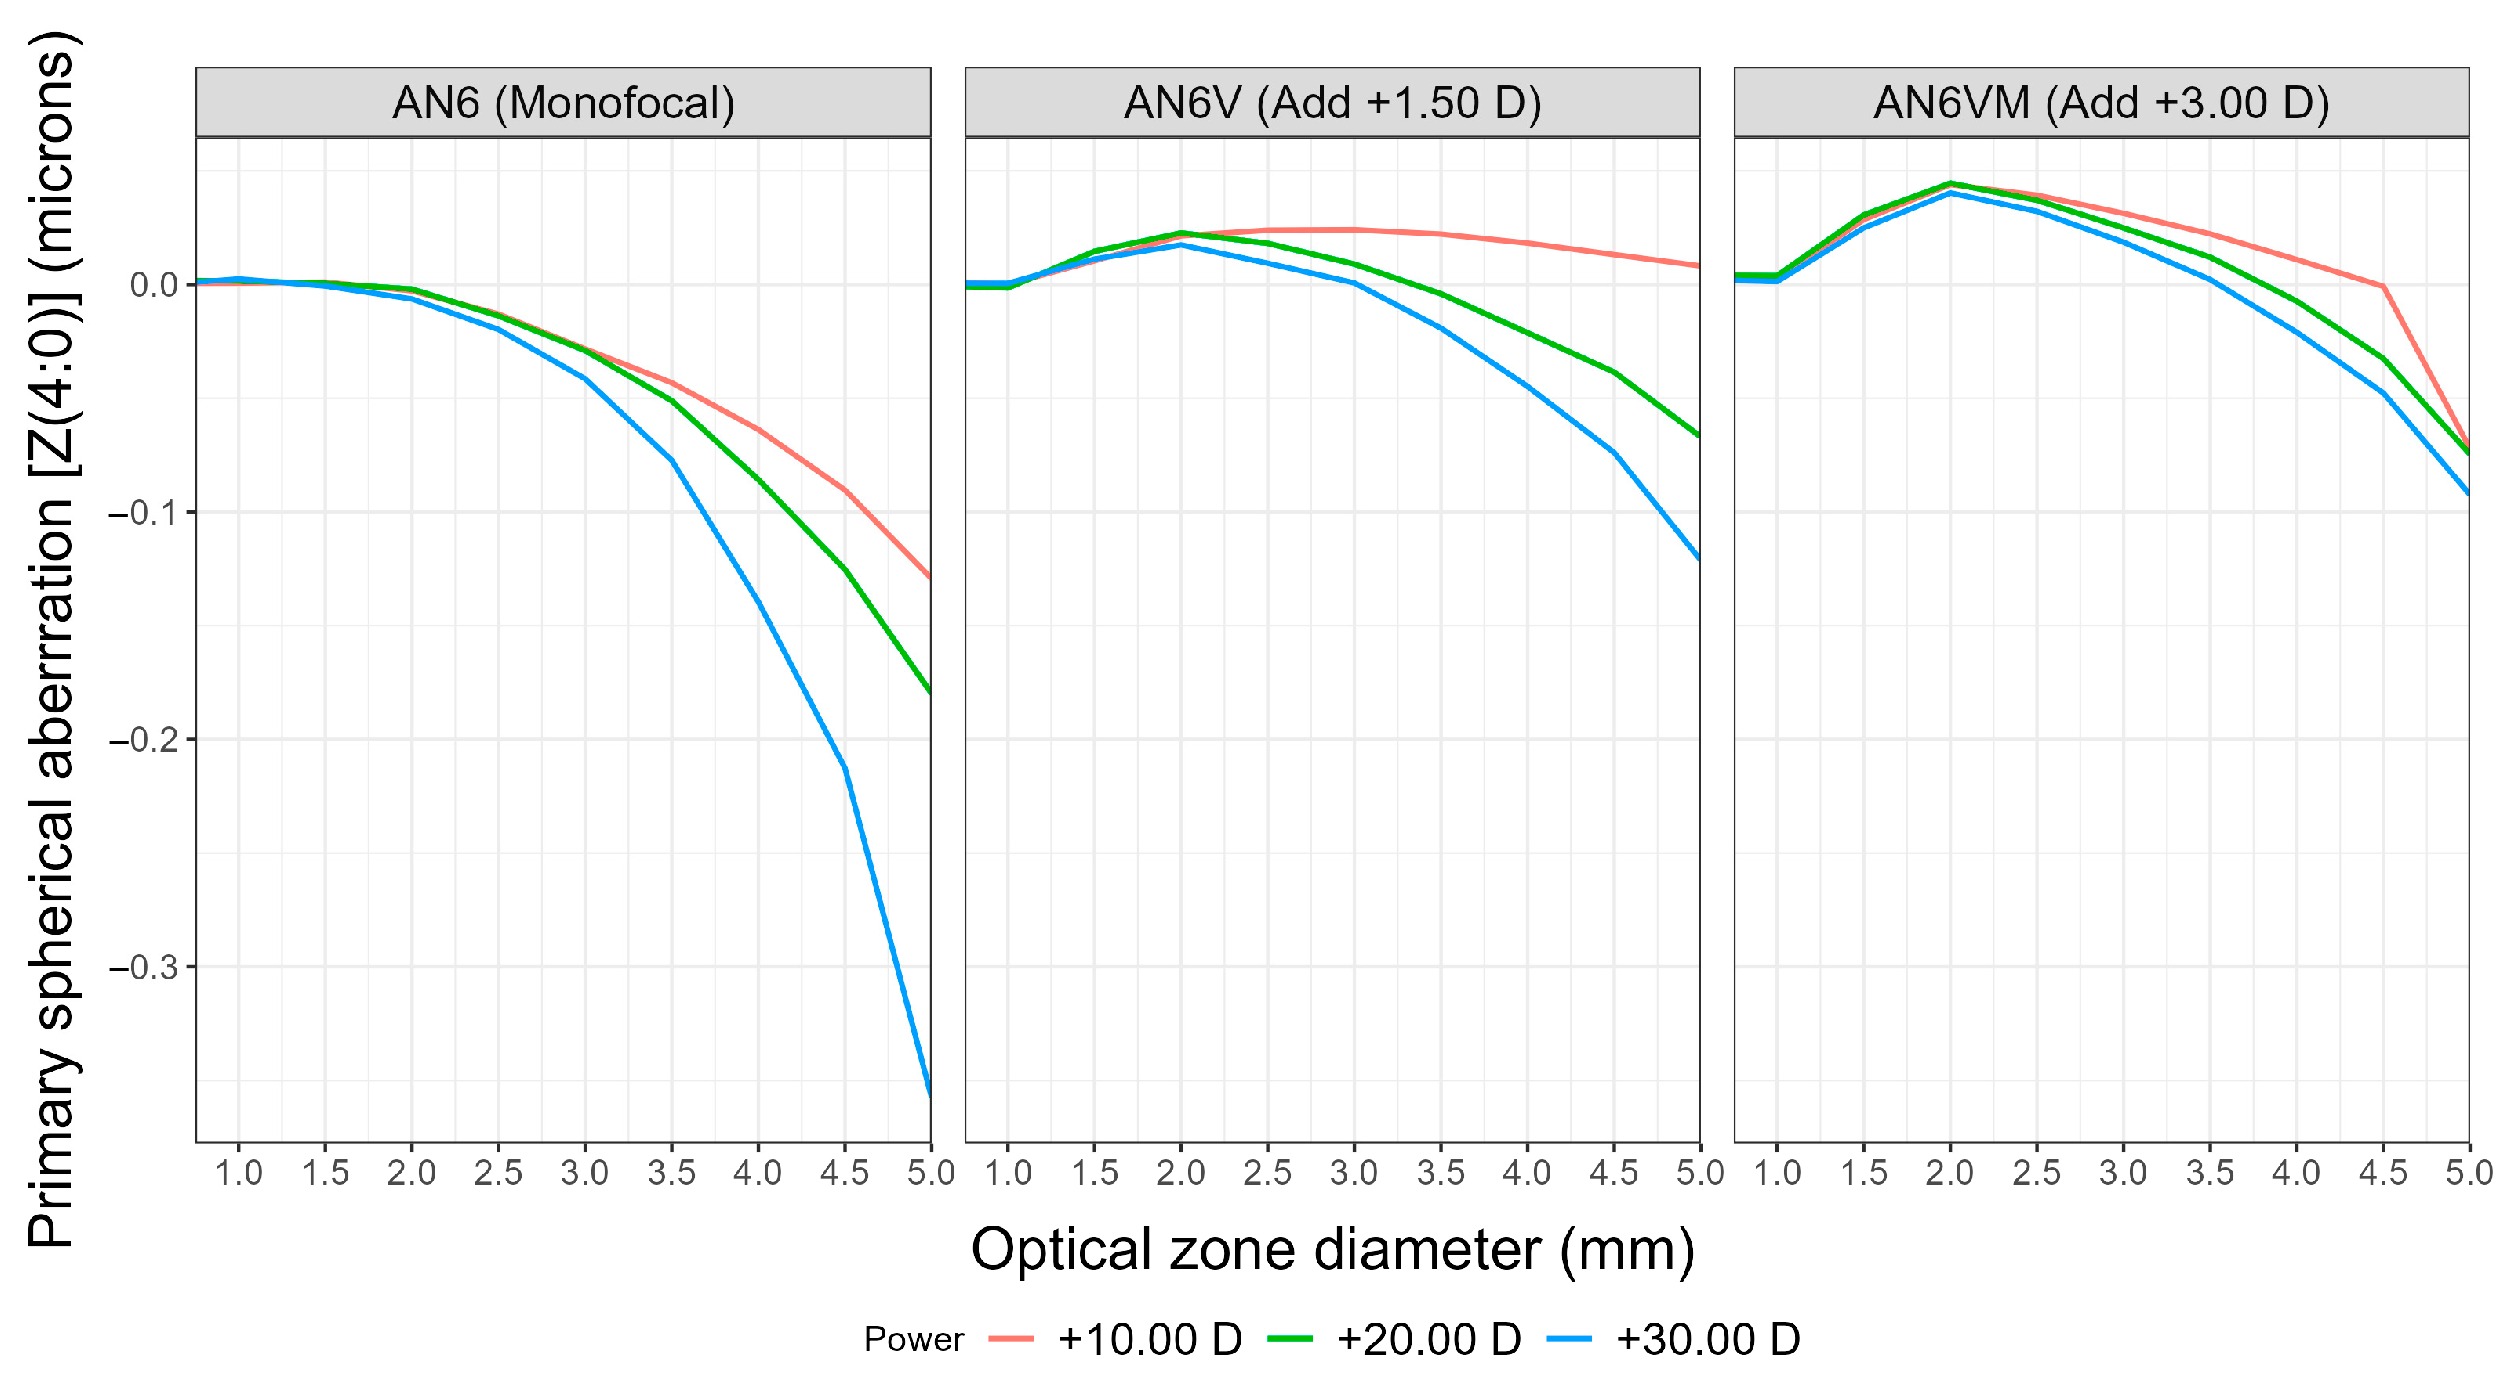
Primary spherical aberration Zernike coefficient [Z(4:0)] from a 0.75 mm-optical zone diameter up to a 5.00-mm optical zone diameter for the three IOL models (AN6, AN6V, AN6VM) and for the three measured nominal powers (+10.00 D, +20.00 D, +30.00 D).
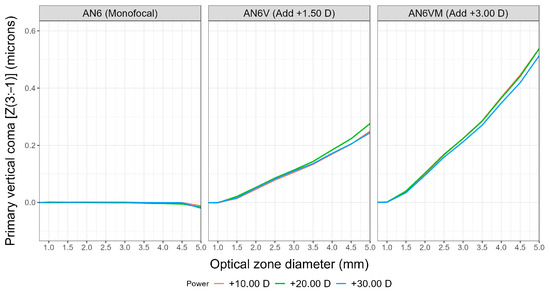
Figure 4.
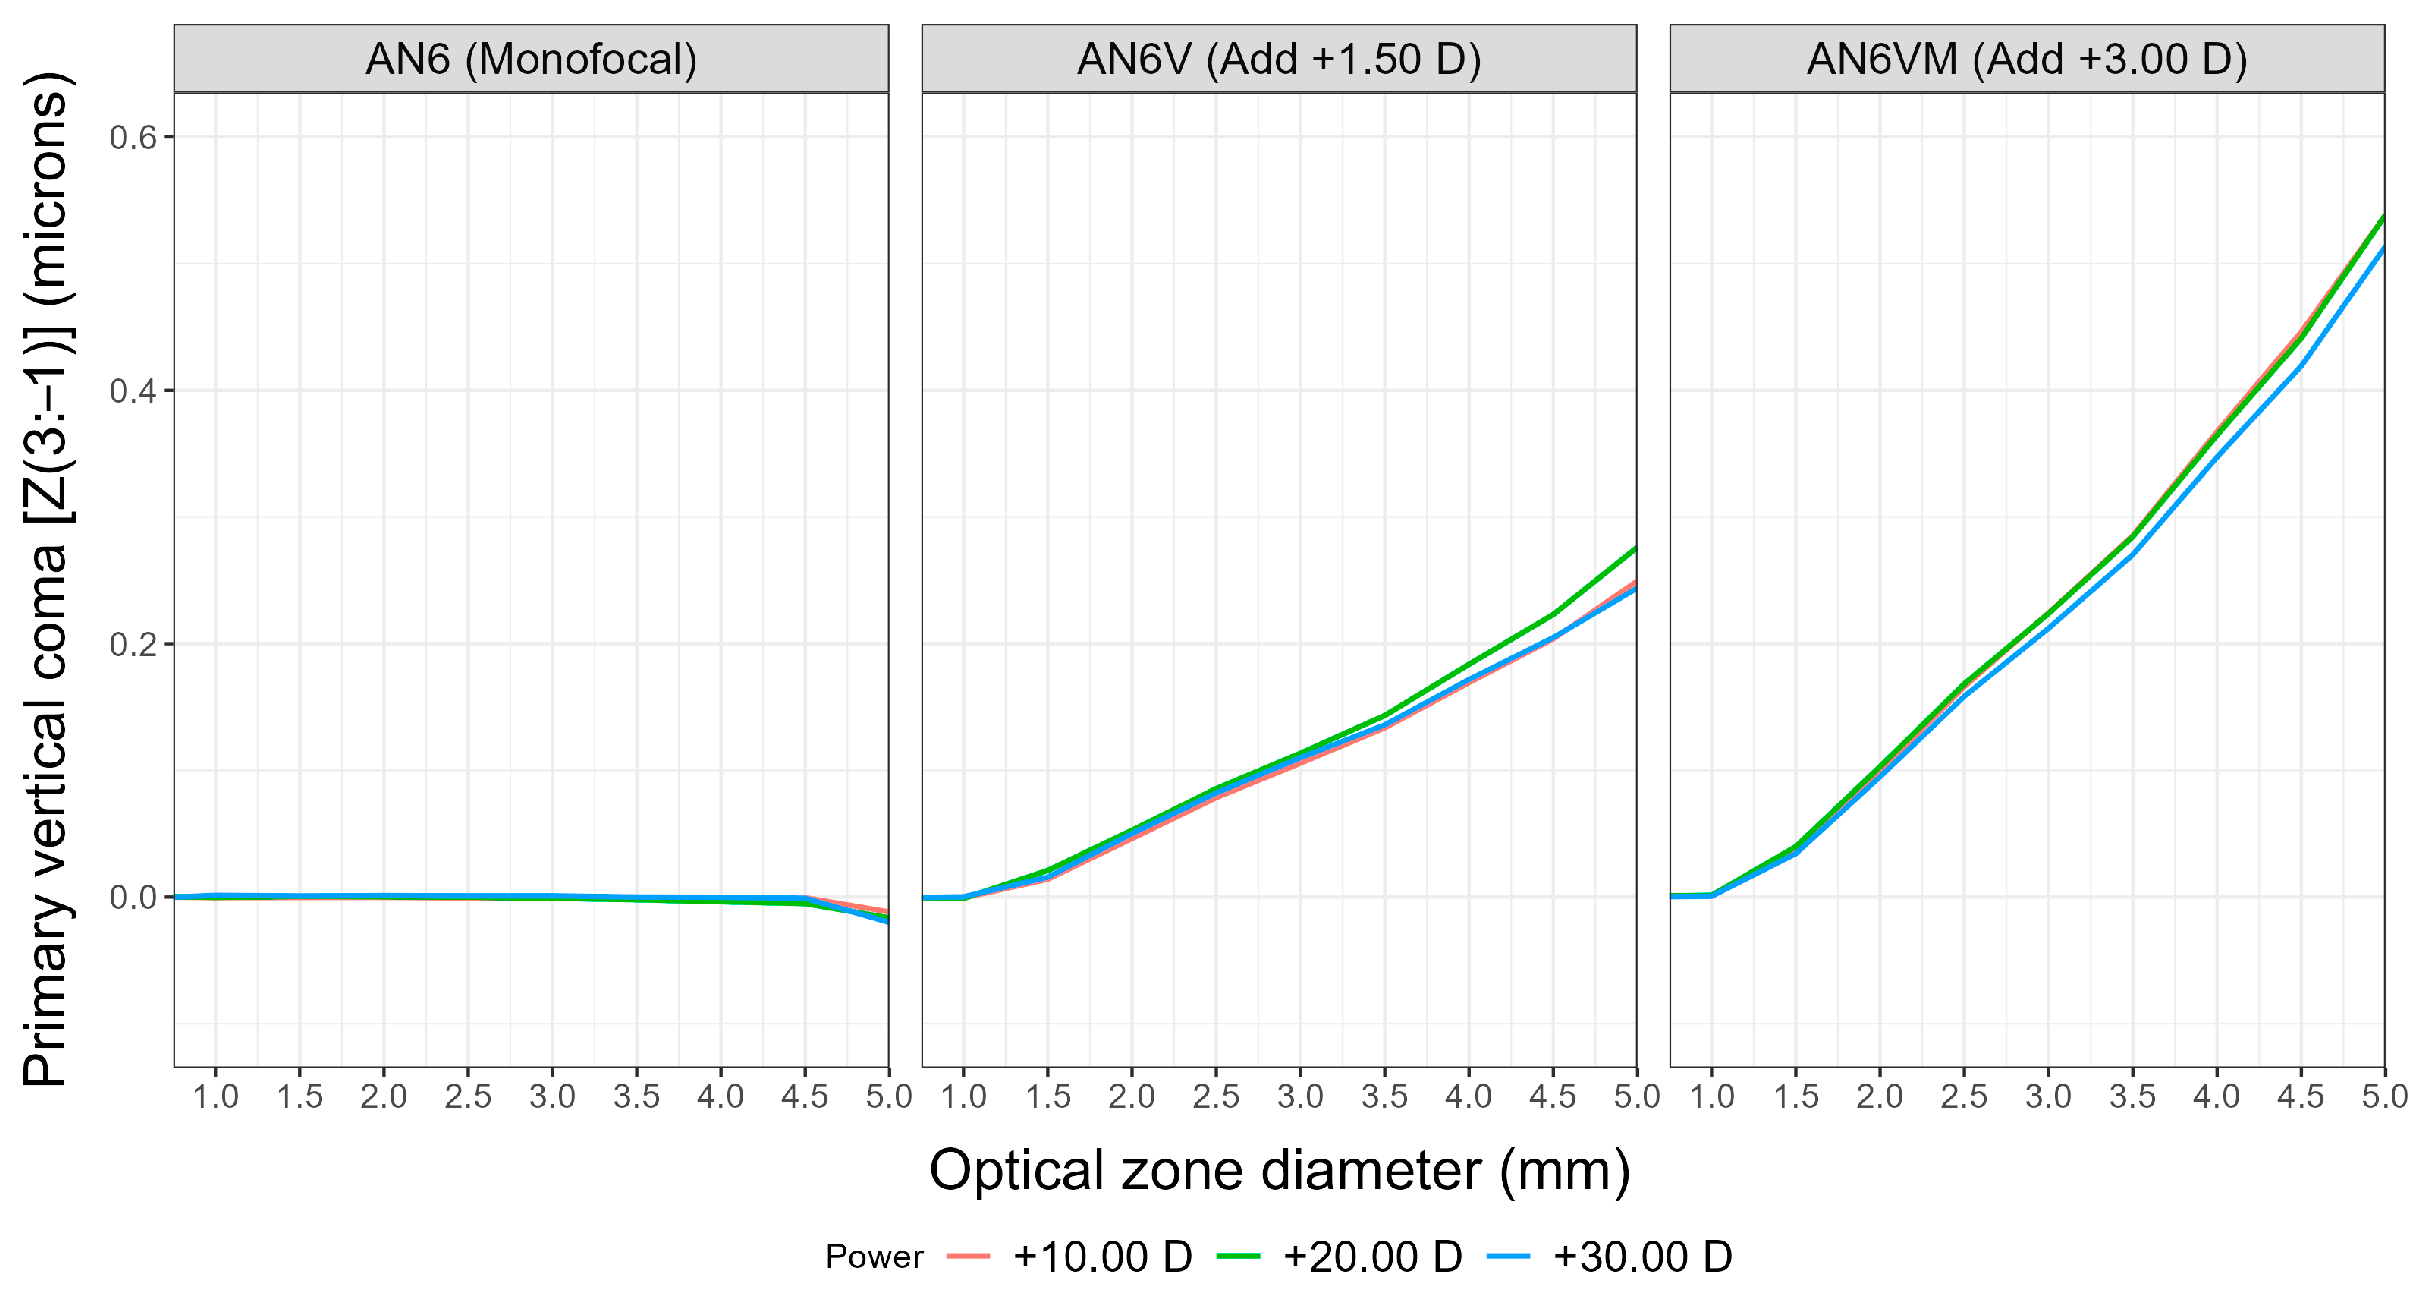
Primary vertical coma Zernike coefficient [Z(3:−1)] from a 0.75-mm optical zone diameter up to a 5.00-mm optical zone diameter for the three IOL models (AN6, AN6V, AN6VM) and for the three measured nominal powers (+10.00 D, +20.00 D, +30.00 D).
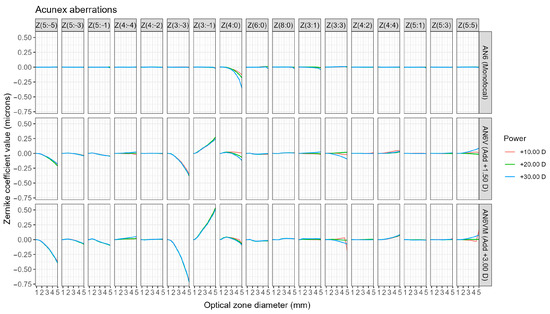
Figure 5.
Third- to fifth-order Zernike coefficients, including second- and eighth-order spherical aberrations, were measured from 0.75 mm from the center to an optical zone diameter of 5.00 mm for the three IOL models (AN6, AN6V, AN6VM) and for the three nominal powers (+10.00 D, +20.00 D, +30.00 D).
Primary spherical aberration values tend to be more negative from the center to the periphery of the monofocal model. For the multifocal models, there is an initial induction of positive spherical aberration values with a posterior change to negative spherical aberration values towards the periphery, more evident for IOLs with higher power. Thus, the +10.00 D AN6V model shows low positive values of SA up to the 5-mm optic zone, whereas the +20.00 D and +30.00 D IOLs show positive values of SA from the center to the 3.00-mm optic zone, and negative amounts of SA from a 3.0-mm zone up to the periphery (reaching −0.12 microns of SA for the +30.00 D IOL). As shown in Figure 3 and in the wavefront error variance contribution detailed in Table 1, the variation of SA with optical size is more pronounced in the monofocal model, reaching differences of almost 0.3 microns between the monofocal and multifocal lenses. This outcome aligns well with the information depicted in Figure 2, where the multifocal models exhibit a more stable radial profile throughout the far portion of the IOL. In contrast, the monofocal model displays a decrease in radial power from the center to the periphery (negative spherical aberration). For instance, in the case of the +30.00 D IOL, there is up to a 2-D difference between the radial central power and the radial power 2.5 mm away from the optical center, as illustrated in Figure 2.

Table 1.
Wavefront error variance and contribution for an optical zone diameter of 3.00 and 4.50 mm for the three IOL models (AN6, AN6V, AN6VM) for the nominal power of +20.00 D.
Figure 3 shows the dependency of SA with the power of the IOL under study, with higher amounts of negative SA for the +30.00 D IOL (independently on the IOL model), and higher inductions of negative SA for the monofocal model (independently on the IOL power). As an example, for the +30.00 D IOLs (blue lines in Figure 3), the monofocal model induces −0.36 microns of SA for a 5.00-mm optical zone, whereas this value is −0.12 microns for the multifocal IOL with +1.50 D addition, and −0.09 microns for the multifocal +3.00 D addition model. For a more central zone, 3.00 mm for instance, the monofocal +30.00 D IOL shows −0.04 microns of primary SA, the +1.50 D addition multifocal +30.00 D IOL induces no SA, and the +3.00 D addition multifocal +30.00 D IOL induces +0.02 microns.
Primary vertical coma (Figure 5) is the aberration showing the highest difference between monofocal and multifocal models, independently of the base power of the IOLs. The primary vertical coma coefficient [Z(3:−1)] remains almost stable for the monofocal IOLs, with values from 0.00 microns in the central zone to −0.02 microns for a 5-mm optical zone. The lower-addition multifocal IOLs induce primary vertical coma of +0.11 microns for a 3-mm optical zone and +0.24 microns for a 5-mm optical zone. The higher-addition multifocal IOLs induce primary vertical coma of +0.21 microns for a 3-mm optical zone and +0.51 microns for a 5-mm optical zone. Primary vertical coma induced by the multifocal models do not seem to depend on the base power of the IOL, but just on the near addition.
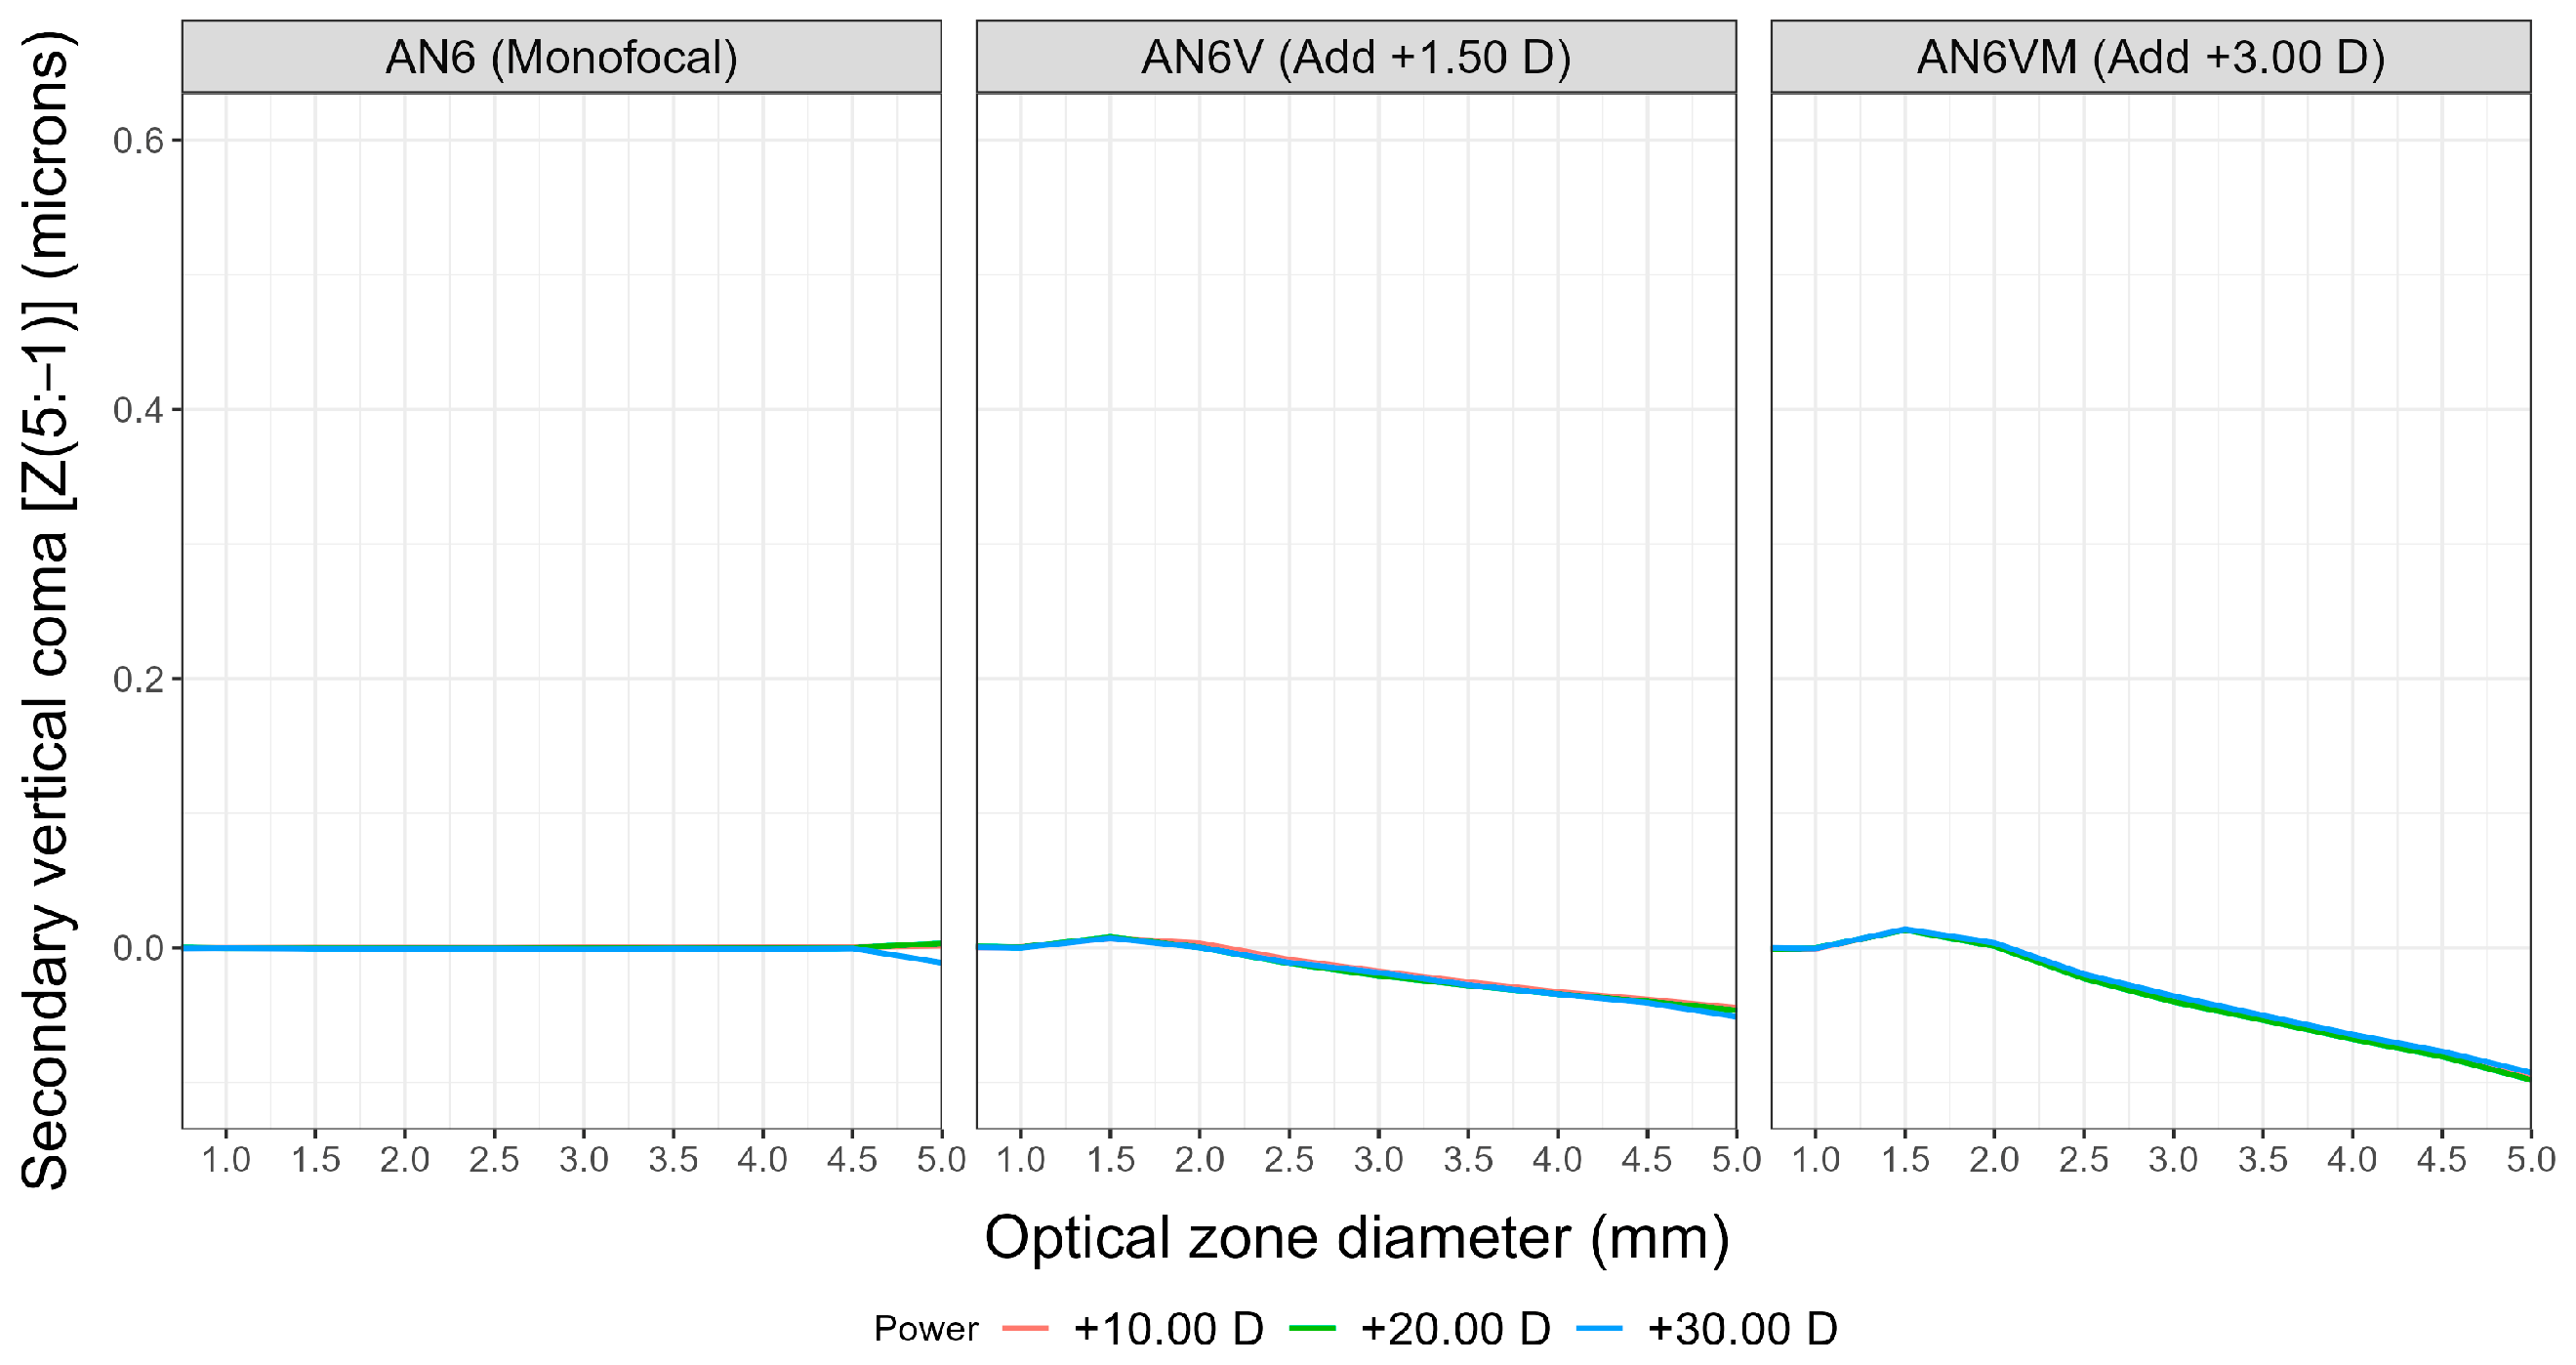
Secondary vertical coma (Figure 6) shows an opposite pattern as the primary vertical coma, with a similar different behavior between monofocal and multifocal models as the primary vertical coma. Figure 5 and Figure 6 have been depicted with the same axis scale to better appreciate the highest contribution of primary vertical coma.
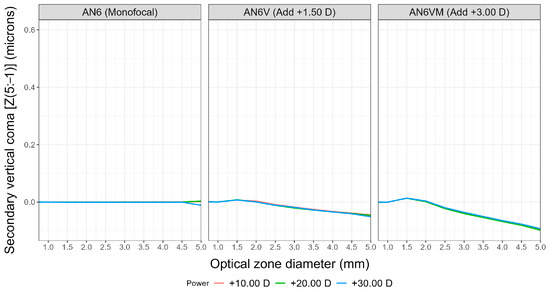
Figure 6.
Secondary vertical coma Zernike coefficient [Z(5:−1)] from a 0.75-mm optical zone diameter up to a 5.00-mm optical zone diameter for the three IOL models (AN6, AN6V, AN6VM) and for the three measured nominal powers (+10.00 D, +20.00 D, +30.00 D).
4. Discussion
Ophthalmological teams are confronted with significant decisions in refractive surgery, particularly regarding the selection of the specific model of IOL to be implanted in each patient to meet their expectations effectively. Without a deep knowledge of IOL designs, making the best decision for a particular patient’s IOL implantation can prove to be exceedingly challenging.
Access to the power profile of the IOLs before implantation would greatly assist in understanding the potential impact on the patient’s pupil size. With the information of power profiles herein presented, any ophthalmic surgeon can decide to implant a given IOL model with a given nominal addition depending on the patient’s pupil size and distance requirements. Additionally, having comprehensive aberrometric information for the IOLs is crucial, as relying solely on a single data point for induced spherical aberration, without considering pupil size, is common but inadequate. Higher-order aberrometric statements should include both aberration quantity and pupil size for meaningful interpretation. For this reason, if we consider the performance of the visual system under varying lighting conditions and subsequent changes in pupil diameter, it is essential for eye care practitioners to have aberration data for various pupil sizes or, at the very least, for the most common pupil diameters corresponding to different lighting conditions. On the other hand, providing complete information on the Zernike values for both 3-mm and 4.5-mm apertures could help other researchers to make image simulations of the optical behavior of those lenses implanted in a model eye before actual implantation. Without complete aberrometric information, those simulations are not possible.
This study presents objective and independent in vitro results that enable the characterization of the radial power profiles and HOA, including spherical aberration and vertical coma, for three types of intraocular lenses (monofocal, multifocal with low addition, and multifocal with high addition) that share the same platform. To our knowledge, this is the first paper to present this information for the lenses evaluated.
First, there is a rather formal aspect to consider, on whether it is appropriate to define a discontinuous wavefront as a combination of Zernike polynomials and, also, how to interpret the coefficients of these polynomials in term of aberrations. In general, it is possible to approximate a piecewise discontinuous function using a polynomial series, but we should have to assume some inaccuracies on the boundaries between the different regions. On the other hand, although the extension of concepts defined for continuous wavefront, such as Seidel aberrations, to discontinuous ones is not trivial, this does not mean that the information derived from the values of the coefficients of Zernike polynomials are useless to a clinician. Indeed, the opposite is the case, as it is always possible to compare the values of the Zernike polynomial expansion of the lens measured with the same expansion of the wavefront aberrations of the eye after the lens implementation.
The multifocal AN6V and AN6VM lenses have a central notch housing the far power, which extends approximately 0.12 mm below the lens’s center (Figure 1). Consequently, the central zone and the outer portion of the lens surrounding the near vision segment contribute to generating images of distant objects, while the near segment is responsible for near focus. In contrast, the monofocal AN6 lens has a symmetrical design covering 360°. Concerning the central notch in the multifocal models, there is a possibility that if an implanted AN6V or AN6VM lens becomes decentered inside the capsular bag, the notch might not align with the pupil center. This misalignment could result in an imbalance between the far and near zones within the pupil. In this line, Albarrán-Diego et al. [6] reported a case of a Lentis MPlus lens that was upwardly decentered in an eye with a 3.6-mm pupil, leading to a measured refraction of −2.75 D.
The measurement of the radial power revealed clear differences associated with the asymmetric and symmetric designs. The three IOLs exhibit a reduction in power at the periphery, with this effect being more pronounced in the monofocal AN6 compared to the distance multifocal AN6V and AN6VM, especially for higher powers. A possible explanation for this design can be associated with the control of the thickness of high-power IOLs to minimize the risks associated with IOLs implantation in hyperopic eyes [12].
Regarding the near zone of the multifocal AN6V and AN6VM lenses, it is interesting to consider how the power of the addition reached +1.50 D for AN6V and +3.00 D for AN6VM, exhibiting a “two-step behavior”. In the first step, half of the addition was attained at approximately 1.00-mm optical zone, and the full addition was achieved at 1.50-mm optical zone. This “two-step behavior” in achieving the total addition of power in multifocal lenses could be related to facilitating a more efficient adaptation in brighter lighting conditions or situations where greater depth of field may not be necessary. Additionally, this smoother transition between different focal distances could potentially reduce side effects such as glare or dysphotopsia. However, this design may lead to patients with small pupils being unable to fully benefit from the addition if their pupillary diameter does not cover the area of greatest addition [13].
Regarding the aberrometric profiles, we have described the SA, primary vertical coma, and secondary vertical coma to provide clarity on the most relevant aberrometric values for understanding the visual performance of these lenses. Understanding the SA profile of the IOLs across their various optical zones could prove crucial in evaluating the SA balance between a patient’s eye and the intraocular lens. Surgical decisions should consider the characteristics of both elements, along with other factors such as pupil size under photopic and mesopic conditions, as well as corneal regularity.
The current study demonstrates that the SA in the monofocal AN6 remained neutral from the center up to a 1.75/2.00-mm optical zone diameter. Beyond that position, the SA increased in negative values towards the periphery, with higher values observed for lenses with greater power. According to the manufacturer, the monofocal AN6 has an aspherical posterior surface with spherical aberration correction of −0.13 µm [7]. This SA value was reached in our work at 4.00 mm, 4.6 mm, and more than 5 mm for IOL powers +30.00 D, +20.00 D, and +10.00 D, respectively.
Borkenstein et al. [14] conducted an in vitro study where they measured SA and coma in monofocal AN6 +22.00 D using specific optical equipment. The measurements were taken for a 4.5-mm aperture using the WaveMaster IOL 2 (Trioptics, Wedel, Germany), on an optical bench, OptiSpheric IOL PRO 2, and adding eye model Cornea ISO2. In their in vitro conditions, combining the IOL with an in situ eye model, the researchers obtained a negative SA of −0.31 µm. However, our results at 4.5 mm in monofocal AN6V +20.00 D and AN6V +30.00 D showed values of −0.13 µm and −0.22 µm, respectively. This difference could be attributable to the variances in the in vitro conditions between the two studies.
Regarding multifocal AN6V and AN6VM, there are not available information about SA and the current results showed less dependency of SA with the IOL power than monofocal model, with the multifocal AN6VM being the IOL showing lesser dependency. The multifocal AN6V and AN6VM showed neutral SA in the center, increasing to positive values, and finally achieving negative values towards the periphery. However, this value depends on the near addition specification of the multifocal IOL and the optical zone diameter selected.
Coma aberration in any optical system is strongly linked to three factors: (i) decentration, (ii) the power of the optical system (higher coma for higher powers, particularly with decentration), and (iii) the optic zone (higher coma for larger optic zones, especially with decentration).
The primary vertical coma of the three analyzed IOLs (AN6, AN6V, and AN6VM) did not exhibit a dependency on the IOL power; instead, it showed a correlation with the optical zone diameter and addition value in the multifocal models. Notably, higher vertical coma values were observed at the periphery, with AN6VM values being twice as large as those of AN6V, irrespective of the lens’s base power. This observation, coupled with the fact that multifocal lenses with higher power (+30.00 D) display a decrease in power at the periphery of the near zone, may indicate a laboratory strategy to avoid excessive coma increase at high powers for mesopic pupils. Consequently, if a +30.00 D AN6VM IOL exhibits a primary vertical coma of 0.5 microns for a 5-mm optic diameter, it can be inferred that this coma might be higher without the decay in addition in the periphery of the near segment. Such an increase in coma aberration could result in a decrease in image quality for larger pupils. This could be especially important in hyperopic eyes with large pupil sizes, since those eyes require higher power IOLs and tend to have higher Kappa angles [15], so abnormally elevated coma values induced by the IOL could have a greater impact in their optical quality.
Coma is highly influenced by surface centration in any optical system. As demonstrated by Ashwin et al. [16], the human eye exhibits an inferior location of the corneal apex, which contributes to the presence of certain values of vertical coma. It is crucial to consider this information in both normal eyes with a limit value for vertical corneal coma and in keratoconic eyes. Failing to account for this could lead to the addition of corneal coma to the coma of an AN6VM IOL, resulting in an ocular coma value similar to that of a keratoconic eye, leading to a loss of visual quality—especially in hyperopic eyes requiring high plus IOLs. One possible approach to mitigate this issue is to reduce the effective addition in the periphery of the higher plus power AN6VM IOLs. This could help in controlling coma values to maintain visual quality and also reduce the IOL width at the periphery. By employing such measures, it may be possible to achieve better visual outcomes and minimize the potential negative impact on visual quality caused by excessive ocular coma.
We have not found any evidence regarding the value of vertical coma measured on an optical bench or in implanted eyes of multifocal AN6V and AN6VM lenses. Instead, there are studies based on the Mplus lens, which served as the precursor to AN6V and AN6VM, but it is made of hydrophilic material rather than hydrophobic. Unfortunately, the results from these studies are not directly comparable due to the dispersion effect that the hydrophilic material produces in the wavefront analysis [17].
Some authors have reported the presence of a large primary intraocular coma in patients implanted with the Mplus lens [18,19], which has been associated with asymmetric optical geometry. However, Akondi et al. [20] suggested that it is not appropriate to conclude that this IOL induces such large vertical coma values when performing aberrometry analysis in patients due to inadequate analysis of wavefront sensor measurements, concluding that the actual coma induced by those IOLs is overestimated by using Hartmann–Shack sensing or laser ray tracing.
The asymmetrical design of multifocal AN6V and AN6VM allows for the placement of the near segment in various rotational positions. While the manufacturer recommends placing the near segment inferiorly and slightly nasally displaced, they also assert that the near segment can be positioned in different orientations without any adverse effects. However, it cannot be overlooked that the asymmetrical design of the multifocal AN6V and AN6VM can produce changes on the aberrations due to the position of the IOL, while the position of a symmetrical IOL does not affect aberrations. In fact, significant differences were noted in total vertical coma aberration between the IOL placed vertically with the near add inferior and the near add superior. The differences varied in magnitude, and the inferonasal group showed negative values [4,5].
The position of the near segment in eyes with rotationally asymmetric multifocal IOLs has been evaluated. Song et al. [5] and de Wit et al. [4] demonstrated that the position had no significant effect on visual performance. This design has also prompted some authors to suggest that positioning the near segment differently could enhance visual outcomes in cases of irregular astigmatism. Bala and Meades [21] published a case in which rotating the Mplus lens resulted in a noticeable improvement in near vision for a patient with irregular astigmatism. In this regard, for a 4-mm optical zone, our results for primary vertical coma were 0.00 microns for the +30.00 D monofocal IOL, +0.17 microns for the +30.00 D AN6V IOL (with +1.50 D addition), and +0.35 microns for the +30.00 D AN6VM IOL (with +3.00 D addition). This could suggest that an eye implanted with a +30.00 D Acunex AN6VM with a cornea not inducing coma would have similar vertical coma values to an eye with a mild keratoconus. Our findings, coupled with those reported by other authors employing similar lens designs, demonstrate the capacity of asymmetric multifocal near segment lenses to function effectively in orientations beyond the vertical placement with the near segment positioned inferiorly. Additionally, they highlight the lens’s resilience against less-than-ideal corneal topography. Comparing the lens-induced coma with the patient’s corneal coma could assist ophthalmologists in determining the optimal near segment positioning.
The main limitation in our study is the impossibility of comparing results with other works, since this is the first article reporting power and aberrometric profiles for the AN6V and AN6VM IOLs. Another limitation relates to the fact that we have measured optical quality of the IOLs when isolated, and not inserted in an eye model, so our results for the AN6 are not directly comparable to other works, such as Borkenstein et al. [14], who describe a total SA of an eye model implanted with a +22.00 D AN6 IOL to be about −0.03 µm, which could provide a very good image contrast.
5. Conclusions
Based on the results of this study, we can clearly differentiate between the Acunex standard monofocal and multifocal lenses. The multifocal AN6V and AN6VM lenses display an asymmetrical design with two distinct zones intended for far and near vision, respectively. The increase in power for near vision in the multifocal models does not originate precisely from the center of the lens, and the amount of final addition obtained by each lens depends on its nominal power. This asymmetrical design of the Acunex multifocal IOLs could be a contraindication in patients with zonular stability issues, making the implantation of the monofocal model more advisable in those cases.
The design of these lenses also impacts aberrations, with the primary vertical coma aberration showing the highest difference between monofocal and multifocal models, irrespective of the base power of the IOLs. The variation of SA with optic size is more pronounced for the monofocal model, and the SA is dependent on the nominal power, with higher inductions of negative SA for the +30.00 D IOL, regardless of the IOL model, and higher inductions of negative SA for the monofocal model, regardless of the IOL power.
The asymmetrical design, which influences the radial power and coma aberrations exhibited by the multifocal lenses, suggests that the position and power of the near segment play crucial roles in determining the overall visual outcome for patients with multifocal lenses at different distances, especially if the lens is not well-centered after implantation.
Author Contributions
Conceptualization, M.G.-M., N.G., C.A.-D. and J.A.G.-P.; Data curation, M.G.-M. and N.G.; Formal analysis, C.A.-D.; Investigation, M.G.-M., C.A.-D., N.G. and J.A.G.-P.; Methodology, J.A.G.-P., C.A.-D., M.G.-M. and N.G.; Supervision, N.G.; Validation, M.G.-M., N.G., C.A.-D. and J.A.G.-P.; Visualization, M.G.-M., N.G., C.A.-D. and J.A.G.-P.; Writing—original draft, J.A.G.-P. and N.G.; Writing—review & editing, M.G.-M., N.G., C.A.-D. and J.A.G.-P. All authors have read and agreed to the published version of the manuscript.
Funding
Supported by project PID2021-122486OA-I00 from the Spanish State Research Agency.
Institutional Review Board Statement
Not applicable.
Informed Consent Statement
Not applicable.
Data Availability Statement
Data underlying the results presented in this paper are not publicly available at this time but may be obtained from the authors upon reasonable request.
Conflicts of Interest
The authors declare no conflicts of interest.
References
- Khandelwal, S.S.; Jun, J.J.; Mak, S.; Booth, M.S.; Shekelle, P.G. Effectiveness of multifocal and monofocal intraocular lenses for cataract surgery and lens replacement: A systematic review and meta-analysis. Graefe’s Arch. Clin. Exp. Ophthalmol. 2019, 257, 863–875. [Google Scholar] [CrossRef]
- Álvarez-García, M.T.; Rivera-Ruiz, E.; Alió, J.L.; Piñero, D.P. Long-term Prevalence of Opacification of a Hydrophylic Acrylic Rotationally Asymmetric Refractive Multifocal Intraocular Lens. J. Refract. Surg. 2024, 40, e98–e107. [Google Scholar] [CrossRef] [PubMed]
- Stewart, S.A.; McNeely, R.N.; Chan, W.C.; Moore, J.E. Visual and Refractive Outcomes Following Exchange of an Opacified Multifocal Intraocular Lens. Clin. Ophthalmol. 2022, 16, 1883–1891. [Google Scholar] [CrossRef] [PubMed]
- de Wit, D.W.; Diaz, J.; Moore, T.C.; Moutari, S.; Moore, J.E. Effect of position of near addition in an asymmetric refractive multifocal intraocular lens on quality of vision. J. Cataract Refract. Surg. 2015, 41, 945–955. [Google Scholar] [CrossRef] [PubMed]
- Song, I.S.; Yoon, S.Y.; Kim, J.Y.; Kim, M.J.; Tchah, H. Influence of Near-Segment Positioning in a Rotationally Asymmetric Multifocal Intraocular Lens. J. Refract. Surg. 2016, 32, 238–243. [Google Scholar] [CrossRef] [PubMed]
- Albarrán-Diego, C.; Muñoz, G.; Rohrweck, S.; García-Lázaro, S.; Albero, J.R. Validity of automated refraction after segmented refractive multifocal intraocular lens implantation. Int. J. Ophthalmol. 2017, 10, 1728–1733. [Google Scholar] [CrossRef] [PubMed]
- Acunex AN6 Information Brochure. Available online: https://www.teleon-surgical.com/media/salesfolder-acunex_en.pdf (accessed on 1 March 2024).
- Acunex AN6V Information Brochure. Available online: https://www.teleon-surgical.com/media/qf2186v3-6seiter-tech-acunex-vario-duo-dina4-202305-en-digital.pdf (accessed on 1 March 2024).
- Acunex AN6VM Information Brochure. Available online: https://www.teleon-surgical.com/media/salesfolder-acunex-variomax-en.pdf (accessed on 1 March 2024).
- Joannes, L.; Dubois, F.; Legros, J.C. Phase-shifting schlieren: High-resolution quantitative schlieren that uses the phase-shifting technique principle. Appl. Opt. 2003, 42, 5046–5053. [Google Scholar] [CrossRef]
- Gómez-Pedrero, J.A.; Albarrán-Diego, C.; García-Montero, M.; Garzón, N.; Gonzalez-Fernandez, V. Influence of Instrumental Factors in the Measurement of Power Profiles of Intraocular Lenses with a Commercial Deflectometer. Appl. Sci. 2023, 13, 9882. [Google Scholar] [CrossRef]
- Fernández-Vega-Cueto, L.; Vega, F.; Guerra-Velasco, R.; Millán, M.S.; Madrid-Costa, D.; Alfonso, J.F. Optical and Clinical Outcomes of an Enhanced Monofocal Intraocular Lens for High Hyperopia. J. Refract. Surg. 2022, 38, 572–579. [Google Scholar] [CrossRef]
- Pazo, E.E.; McNeely, R.N.; Richoz, O.; Nesbit, M.A.; Moore, T.C.B.; Moore, J.E. Pupil influence on the quality of vision in rotationally asymmetric multifocal IOLs with surface-embedded near segment. J. Cataract Refract. Surg. 2017, 43, 1420–1429. [Google Scholar] [CrossRef] [PubMed]
- Borkenstein, A.F.; Borkenstein, E.M.; Schmid, R. Analysis of a novel hydrophobic acrylic enhanced monofocal intraocular lens compared to its standard monofocal type on the optical bench. BMC Ophthalmol. 2022, 22, 356. [Google Scholar] [CrossRef]
- Wang, Q.; Stoakes, I.M.; Moshirfar, M.; Harvey, D.H.; Hoopes, P.C. Assessment of Pupil Size and Angle Kappa in Refractive Surgery: A Population-Based Epidemiological Study in Predominantly American Caucasians. Cureus 2023, 15, e43998. [Google Scholar] [CrossRef] [PubMed]
- Ashwin, P.T.; Shah, S.; Pushpoth, S.; Wehbeh, L.; Ilango, B. The relationship of Central Corneal Thickness (CCT) to Thinnest Central Cornea (TCC) in healthy adults. Cont. Lens Anterior Eye 2009, 32, 64–67. [Google Scholar] [CrossRef] [PubMed]
- Eppig, T.; Rawer, A.; Hoffmann, P.; Langenbucher, A.; Schröder, S. On the Chromatic Dispersion of Hydrophobic and Hydrophilic Intraocular Lenses. Optom. Vis. Sci. 2020, 97, 305–313. [Google Scholar] [CrossRef] [PubMed]
- Ramón, M.L.; Piñero, D.P.; Pérez-Cambrodí, R.J. Correlation of Visual Performance With Quality of Life and Intraocular Aberrometric Profile in Patients Implanted With Rotationally Asymmetric Multifocal IOLs. J. Refract. Surg. 2012, 28, 93–99. [Google Scholar] [CrossRef] [PubMed]
- Alió, J.L.; Piñero, D.P.; Plaza-Puche, A.B.; Chan, M.J. Visual outcomes and optical performance of a monofocal intraocular lens and a new-generation multifocal intraocular lens. J. Cataract Refract. Surg. 2011, 37, 241–250. [Google Scholar] [CrossRef] [PubMed]
- Akondi, V.; Pérez-Merino, P.; Martinez-Enriquez, E.; Dorronsoro, C.; Alejandre, N.; Jiménez-Alfaro, I.; Marcos, S. Evaluation of the True Wavefront Aberrations in Eyes Implanted With a Rotationally Asymmetric Multifocal Intraocular Lens. J. Refract. Surg. 2017, 33, 257–265. [Google Scholar] [CrossRef] [PubMed]
- Bala, C.; Meades, K. Improvement in vision with inverted placement of an asymmetric refractive multifocal intraocular lens. J. Cataract Refract. Surg. 2014, 40, 833–835. [Google Scholar] [CrossRef] [PubMed]
Disclaimer/Publisher’s Note: The statements, opinions and data contained in all publications are solely those of the individual author(s) and contributor(s) and not of MDPI and/or the editor(s). MDPI and/or the editor(s) disclaim responsibility for any injury to people or property resulting from any ideas, methods, instructions or products referred to in the content. |
© 2024 by the authors. Licensee MDPI, Basel, Switzerland. This article is an open access article distributed under the terms and conditions of the Creative Commons Attribution (CC BY) license (https://creativecommons.org/licenses/by/4.0/).

