Article

Validation of Frontal Crashworthiness Simulation for Low-Entry Type Bus Body According to UNECE R29 Requirements

1
Department of Tribology, Automobiles and Materials Science, Khmelnytsky National University, 29000 Khmelnytsky, Ukraine
2
Institute of Civil Engineering, Warsaw University of Life Sciences-SGGW, Nowoursynowska 159, 02 776 Warsaw, Poland
3
Department of Equipment Design and Operation, Institute of Mechanical Engineering and Transport, Lviv Polytechnic National University, 79000 Lviv, Ukraine
4
Faculty of Mechanical and Power Engineering, Lviv National University of Nature Management, 80381 Dublany, Ukraine
*
Authors to whom correspondence should be addressed.
Appl. Sci. 2024, 14(13), 5595; https://doi.org/10.3390/app14135595
Submission received: 27 May 2024 / Revised: 12 June 2024 / Accepted: 25 June 2024 / Published: 27 June 2024

Abstract

:
Frontal crash tests are an essential element in assessing vehicle safety. They simulate a collision that occurs when the front of the bus hits another vehicle or an obstacle. In recent years, much attention has been paid to the frontal crash testing of city buses, especially after a series of accidents resulting in deaths and injuries. Unlike car manufacturers, most bus bodybuilders do not include deformation zones in their designs. The next two regulations are widely used to assess whether a structure can withstand impact loading: UNECE Regulation No. 29—United Nations Economic Commission for Europe (UNECE R29) and the New Car Assessment Program (NCAP), which is more typical of car crash tests. The main goal of the research is to develop an applicable methodology for a frontal impact simulation on a city bus, considering UNECE R29 requirements for the passenger’s safety and distinctive features of the low-entry body layout. Among the contributions to current knowledge are such research results as: unlike suburban and intercity buses, city buses are characterized by lower stiffness in the event of a frontal collision, and therefore, when developing new models, it is necessary to lay deformation zones (currently absent from most city buses). Maximum deformation values in the bus front part are reached earlier for R29 (137 ms) than for most impacts tested by NCAP (170–230 ms) but have higher values: 577 mm vs. 150–250 mm for the sills tested. Such a short shock absorption time and high deformations indicate a significantly lighter front part of a low-entry and low-floor bus compared with classic layouts. Furthermore, it is unjustified to use the R29 boundary conditions of trucks to attach the bus with chains behind its frontal axe both in natural tests and appropriate finite element simulation—the scheme of fixing the city bus should be accordingly adapted and normatively revised.

1. Introduction

Before starting research on the behavior of a low-entry bus body under UNECE R29 conditions, it is advisable to familiarize yourself with the existing works devoted to this problem. The complexity of this task lies in the multitude of different standards for the certification of passenger transport, which differ in complexity depending on the type and class of the vehicle, the region in which this standard is in force, and testing methods (full-scale, finite element simulation, or hybrid). Initially, it is proposed to understand the scale of the problem thanks to static reports and analytics. Actually, to follow trends and developments in bus design, it is worth reading the work [1], in which the authors present a 30-year analysis of trends in the national characteristics of bus transit vehicles in the United States. Speaking of safety, it is worth mentioning the “Mass Transit Crashworthiness Statistical Data Analysis” [2], which used funds from the Federal Transit Administration (FTA). For example, according to the FTA in 2016, the New Flyer Xcelsior received a five-star safety rating after passing a series of rigorous tests. However, not all bus models performed equally well in frontal crash tests, with 50–100% of their frontal overlap, because they demonstrated different responses to the impact of regulatory frontal crash tests [3,4]. When it comes to head-on collisions, larger vehicles pass crash tests better than lighter ones because the driver’s cab is higher above the impact area. An additional reason is physics: vehicles with greater mass can absorb more impact energy. As a result, unlike car manufacturers, most truck manufacturers do not include deformation zones in their designs.
The specificity of each crash test depends on the conditions of the relevant regulatory standards, which are completely different for countries and vehicle classes. Below is an array of research materials on compliance with different regulations. In [4], an analysis of the collision of non-air-conditioned sleeper buses was carried out. Using the relevant automotive industry standards (052 and 119), the bus dimensions are taken into account when designing. The surface modeling technique is used to prepare computer-aided models. In [5], the tested vehicle should move towards a rigid wall at a speed of 56 km/h perpendicular to the wall surface, in accordance with the New Car Assessment Program (NCAP) frontal crash test of the National Highway Traffic Safety Administration (NHTSA). The most popular crash test regulations that are currently used in US and EU countries, the United Nations Economic Commission of Europe (UNECE) Regulation No. 29 [5] and the New Car Assessment Program (NCAP), are used to ascertain whether the structures possess sufficient strength to withstand the impact load. In paper [6], the actual car-to-barrier test specifications were agreed in 2016, with vehicle and barrier speeds approaching 50 km/h (MPDB), and the overlap was moderate at 50 percent of the total vehicle width. In addition to the overlapping percentage, parameters are used to assess accident severity in a head-on collision between two vehicles, including the change in velocity (delta-v) and energy equivalent speed (EES) [7]. A safety assessment and a parametric study of forward collision avoidance assist systems based on real-world crash simulations were presented in [8]. Advanced driver assistance systems (ADAS), including the autonomous emergency brake (AEB) and forward collision warning (FCW), were studied there. Finally, the overall effectiveness assessment of the AEB system showed a 57% reduction in rear-end collisions, a 52% reduction in injury severity (striking vehicle passengers), and a 47% reduction in damages for striking vehicles. The results also showed that the available AEB algorithms are more effective up to an average speed of 80 km/h [8]. Energy management in a frontal vehicle collision using an analytical model under multiple conditions was discovered in [9]. The following conclusions were obtained:
  • Comparing the experimental data of the MPDB test with the calculation results of the constructed analytical model, the errors of evaluation indexes (i.e., OLC, SD, and PM) are below 15%;
  • The greater the stiffness of the 25% area, the less deformation of the vehicle front structure and the intrusion into the passenger compartment.
The certification of a bus for compliance with the Regulations can be carried out in two main ways: through natural tests or finite element simulation, if the certification body undermines the reliability of the suggested methodology. It is obvious that due to the multiple cost differences between full-scale tests (the body, which is about 40–50% of the bus price, cannot be restored) and FEA simulations, the fierce market competition stimulates exactly the development of calculation methods equivalent to the natural crash tests. In this part or article, scientific works will be examined that are precisely devoted to various simulation methods. It should be noted that in most cases, they are the “know-how” of manufacturers, which gives them advantages over competitors, so not all “secrets” are described by the authors of the publications below. An interesting approach to the crashworthiness analysis and design of a sandwich composite of an electric bus in a full frontal impact was presented in [10]—the behavior of the bus during a full-frontal collision simulation was thoroughly investigated using LS-DYNA. Analyses of the dynamic responses and structural characteristics of the original and modified bus models in the event of frontal collision with a rigid wall at a speed of 50 km/h were carried out—the average decelerations of the original and modified microbus are 11.2 g and 14.8 g, respectively [10].
The finite element analysis of the frontal impact of a high-decker bus based on ECE Regulation No. 29 was investigated in [11]. The results revealed that the value of kinetic energy in the bus structure with an impact damper is lower than that without an impact damper, especially after 0.02 s. The average energy can be represented as approximately 18,000 J and 21,000 J for the impact damper cases, respectively. The results showed that the deformation amounts of the conventional model and the improved shock absorber models were 47.22 mm and 11.42 mm, respectively [11]. It is reasonable to use the results of bus frontal impact acceleration on the passengers’ seats according to Regulation 80 of the United Nations (R80) based on the work [12]—assessment of seat mounting in the frame of a road bus presented for frontal impact. The displayed deceleration should be from 6.5 to 8.5 g. The deformed mode for the numerical model of an impact on a rigid material wall with a speed of 8.89 m/s during 0.5 s. One of the seat screws achieved an impact velocity of 13.89 m/s, but it must be taken into account that this is an extreme condition, the speed that Regulation 80 recommends for dynamic impact tests. The LS-DYNA environment was used in the modeling research [12]. Following the topic of passenger load and acceleration, more details can be found in [13]—injury mechanisms for public bus passengers during frontal, side, and rear impact crash scenarios. Various types of manikin behavior events are observed—mechanisms of head injury (HIC) and neck injury (neck extension, flexion, and compression). The maximum accelerations found during tests were approximately 12 g [13]. The safety of body structure and occupant protection research for medium buses under three kinds of frontal impact forms was investigated in [14]. The authors built a thorough finite element model and used the large deformation finite element analysis method and LS-DYNA dynamic analysis software (Ansys 2023 R1) to simulate impact under the three conditions:
  • Frontal impact with 100% overlap;
  • Forty percent offset impact;
  • Thirty-degree angular impact;
  • And research on vehicle deformation, energy absorption characteristics of acceleration, and their changing regularity [14]. Considering that our topic is dedicated to the safety of the low-entry bus body, it is worth familiarizing yourself with a similar field of research—a paper [15] on the front impact simulation of city buses.
In a modern publication [16], the authors investigate approaches to effective management of the enormous energy released during high-impact situations. Currently, long-distance buses lack the necessary design strategies and technologies to adequately absorb and control the kinetic energy generated during collisions. Therefore, it is necessary to address this passive safety deficiency by undertaking research in structural optimization. This research aims to improve passive safety measures in the event of potential frontal collisions in coaches. To achieve this objective, innovative solutions are sought. Due to the lack of specific coach-related standards, the study adapted and used the ECE R29 regulations. Various techniques, such as digital image correlation (DIC), strain gauges, and accelerometers, have been used to monitor the structural integrity. The topic of crashworthiness analysis and design is discussed in [17] (ECE R29 research), [18] (pendulum impact test using LS-DYNA), and [19] (using a pseudo-dynamic PSD test).
The current research will be based on Ansys LS-DYNA and Ansys Explicit Dynamics modules, in which theoretical FEA approaches are given in [20,21], where the authors have presented the fundamental knowledge about the Newton-Raphson method, the Johnson–Cook equation, etc. Additionally, the expansion of the Riera approach to predict aircraft impact damage on steel and concrete buildings [22] was investigated as a possible alternative approach to bus body frame frontal collision modeling. Additional investigations relative to the topic of bus unit systems, safety, and body layouts are disclosed in publications [23,24,25,26,27,28].
Summing it up, it can be concluded that modern science is very actively filled with various methods of imitating natural frontal beauty tests, including ECE R29 and NCAP. This is the case when market competition acts as an effective stimulator and brings practical benefits. At the same time, such a diversity of standards requirements confirms the validity of the assumption that it is impossible to apply the universal boundary conditions of R29 to low-entry type buses due to the specificity of their load-bearing scheme. Actually, the solution to this problem is the subject of the research presented below.

2. Materials and Methods

This research will simulate the behavior of the body frame of a low-entry city bus (JSC “Ukrbusbusprom”—model 4289) in UNECE R29 frontal collision conditions (Figure 1a).
According to UNECE R29, the impactor should be made of steel, and its mass should be evenly distributed; its mass cannot be less than 1500 kg. Its striking surface, rectangular and flat, is 2500 mm wide and 800 mm high (h in Figure 1b). The impactor assembly shall be of rigid construction and freely suspended from two rigidly attached beams spaced not less than 1000 mm apart. The beams must not be less than 3500 mm long from the suspension axis to the geometric center of the impactor (La in Figure 1b).
The impactor must be in such a way that in its vertical position: its striking surface is in contact with the forward part of the vehicle; its center of gravity is c = 50 mm below the R point of the driver’s seat; and its center of gravity is in the median longitudinal plane of the vehicle (c in Figure 1b). The impactor shall hit the cab from the front towards the rear of the cab. The direction of impact must be horizontal and parallel to the median longitudinal plane of the vehicle. The impact energy should be 55 kJ for category N3 vehicles and category N2 vehicles with a total vehicle mass exceeding 7.5 t.
It is obvious that, as part of the task, it is appropriate to use the explicit dynamics module of the Ansys Workbench environment (whose basis is the explicit method). When the pendulum hits the surface of the bus frame, the Ansys program uses the shock wave theory, which involves the gradual transformation of kinetic energy into potential energy and the transfer of masses (inertia) by waves during the interaction of bodies. To ensure consistency of results in explicit calculations, the time step size is limited to prevent the stress wave from exceeding the minimum characteristic length of the finite element in a single step. This restriction is known as the Courant–Friedrichs–Lewy (CFL) condition [20].
t f · [ h c ] m i n ,
where
  • h—the finite element characteristic length, mm.
It is crucial to maintain a uniform element size in order to effectively control the time-step size, which is determined by the smallest element; c—the material’s sound speed, m/s; f—the safety factor, which is typically set to a value equal to or less than 1.
In situations where the sound speed wave of a material is unavailable, an approximation can be made using Young’s modulus and density:
  • Materials exhibit both transverse and longitudinal waves;
  • Transverse waves have a slower speed compared with longitudinal waves. As a result, the time-step size is governed by the speed of the longitudinal wave;
  • The speed of a longitudinal elastic wave can be determined using Young’s modulus and density:
c = E ρ ,
where
  • E—Young’s modulus, Pa;
  • ρ —density, kg/m3.
  • When Young’s modulus is larger or the density is smaller, the sound speed increases, and accordingly, a smaller time-step size should be employed.
Let us calculate the next example of how many time steps are necessary to solve a bus body element task with the next boundary conditions:
  • Young’s modulus E = 2 × 10 11 Pa;
  • Density ρ = 7850 kg/m3;
  • Characteristic size of the element h = 50 × 10 2   m;
  • Required task analysis time is T = 0.2   s.
c = E ρ = 2 × 10 11 7850 = 5048 m s ,
t = f · h c = 0.9 · 50 · 10 2 5048 = 8.91 × 10 6   s ,
n = T t = 0.2 8.91 × 10 6 = 2243 .
where
  • n—time step number required for this explicit analysis of the element with a characteristic size of 50 · 10 2   m .
Therefore, a time step scale factor (TSSF) of 0.9 was chosen in the Ansys Explicit Dynamics module to ensure that each step is smaller than the critical time step [20]. Equation (9) could also be presented in an extended formulation:
c = E ( 1 ν ) ρ ( 1 + ν ) ( 1 2 ν ) ,
where: ν—Poisson’s ratio.
To reduce the computational time required to perform extensive explicit analyses of the bus body model, mass scaling is a simulation technique used.
Before modeling, a series of tests are conducted on the material to determine the yield point in order to determine the accurate stress values at which plastic deformation begins. The strain gauge serves as a measuring device for determining elastic and plastic deformation along the measuring length. Under conditions of significant strain, a high strain rate, and possibly high temperatures, the Johnson–Cook model can represent the relationship between stress and strain in a metallic material. The stress flow can be expressed using the subsequent equation [20]:
σ y ( ε p ,   ε p ˙ , T ) = [ A + B ( ε p ) n ] [ 1 + C ln ( ε p ˙ * ) ] [ 1 ( T * ) m ] ,
where
  • εp—the equivalent plastic strain, mm/mm;
  • ε p ˙ —the normalized equivalent plastic strain rate (speed of deformation),
  • s−1; A, B, C—the constants of the material,
  • n—the exponential of the mechanical hardening;
  • m—the exponential of the thermal softening.
The homologous temperature T* and normalized strain rate could be defined as follows [20]:
ε p ˙ * =   ε p ˙ ε p 0 ˙ ;   T * = ( T T 0 ) ( T m T 0 ) ,
where:
  • 0—represents initial values (room temperature);
  • ε p ˙ * —effective total strain rate (is normalized by a quasi-static threshold rate)—non-dimensional by the reference strain rate;
  • ε p 0 ˙ * —reference strain rate;
  • Tm—fusion temperature, °C;
  • T—current specimen temperature, °C.
According to Johnson and Cook’s theory, fracture strain is typically influenced by the ratio of triaxial stress, strain rate, and temperature. The fracture model can be expressed in the following manner [21]:
ε f = [ D 1 + D 2 e x p ( D 3 ( σ m σ e q ) ) [ 1 + D 4 ln ( ε ˙ p * ) ] [ 1 + D 5 T * ] ,
where:
  • D 1 to D 5 are the constants of failure model;
  • σ m —mean stress;
  • σ e q —equivalent stress.
The material’s strength decreases during deformation due to the occurrence of damage, and the mathematical relationship representing this damage, also known as the “constitutive relationship,” can be expressed as follows:
σ D = σ e q ( 1 D ) ,
where
  • σ D —represents the stress in the damaged state, while stress triaxiality and equivalent stress can be derived from the material in the undamaged state.
The bus body model uses steel from the Ansys Granta EduPack with the following characteristics: Density—7850 kg/m3; Yield Strength—250 MPa; Young’s Modules—200 GPa; Poisson’s Ratio—0.3.
After familiarizing oneself with the Ansys Explicit Dynamics calculation parameters presented above, one can proceed to the next stage—frontal impact analysis in accordance with UNECE Regulation No. 29 (UNECE R29). In the first stage of testing the behavior of the low-entry city bus body, boundary conditions should be created that will meet the requirements of current safety regulations (UNECE R29). Some of these requirements are described above and shown in Figure 1. Let us start with supporting the bus body frame and analyze the official UNECE Regulation No. 29 (UNECE R29) requirements for frontal impact (Figure 2):
  • Each anchor chain or rope shall be made of steel and withstand a tensile load of at least 10 tons;
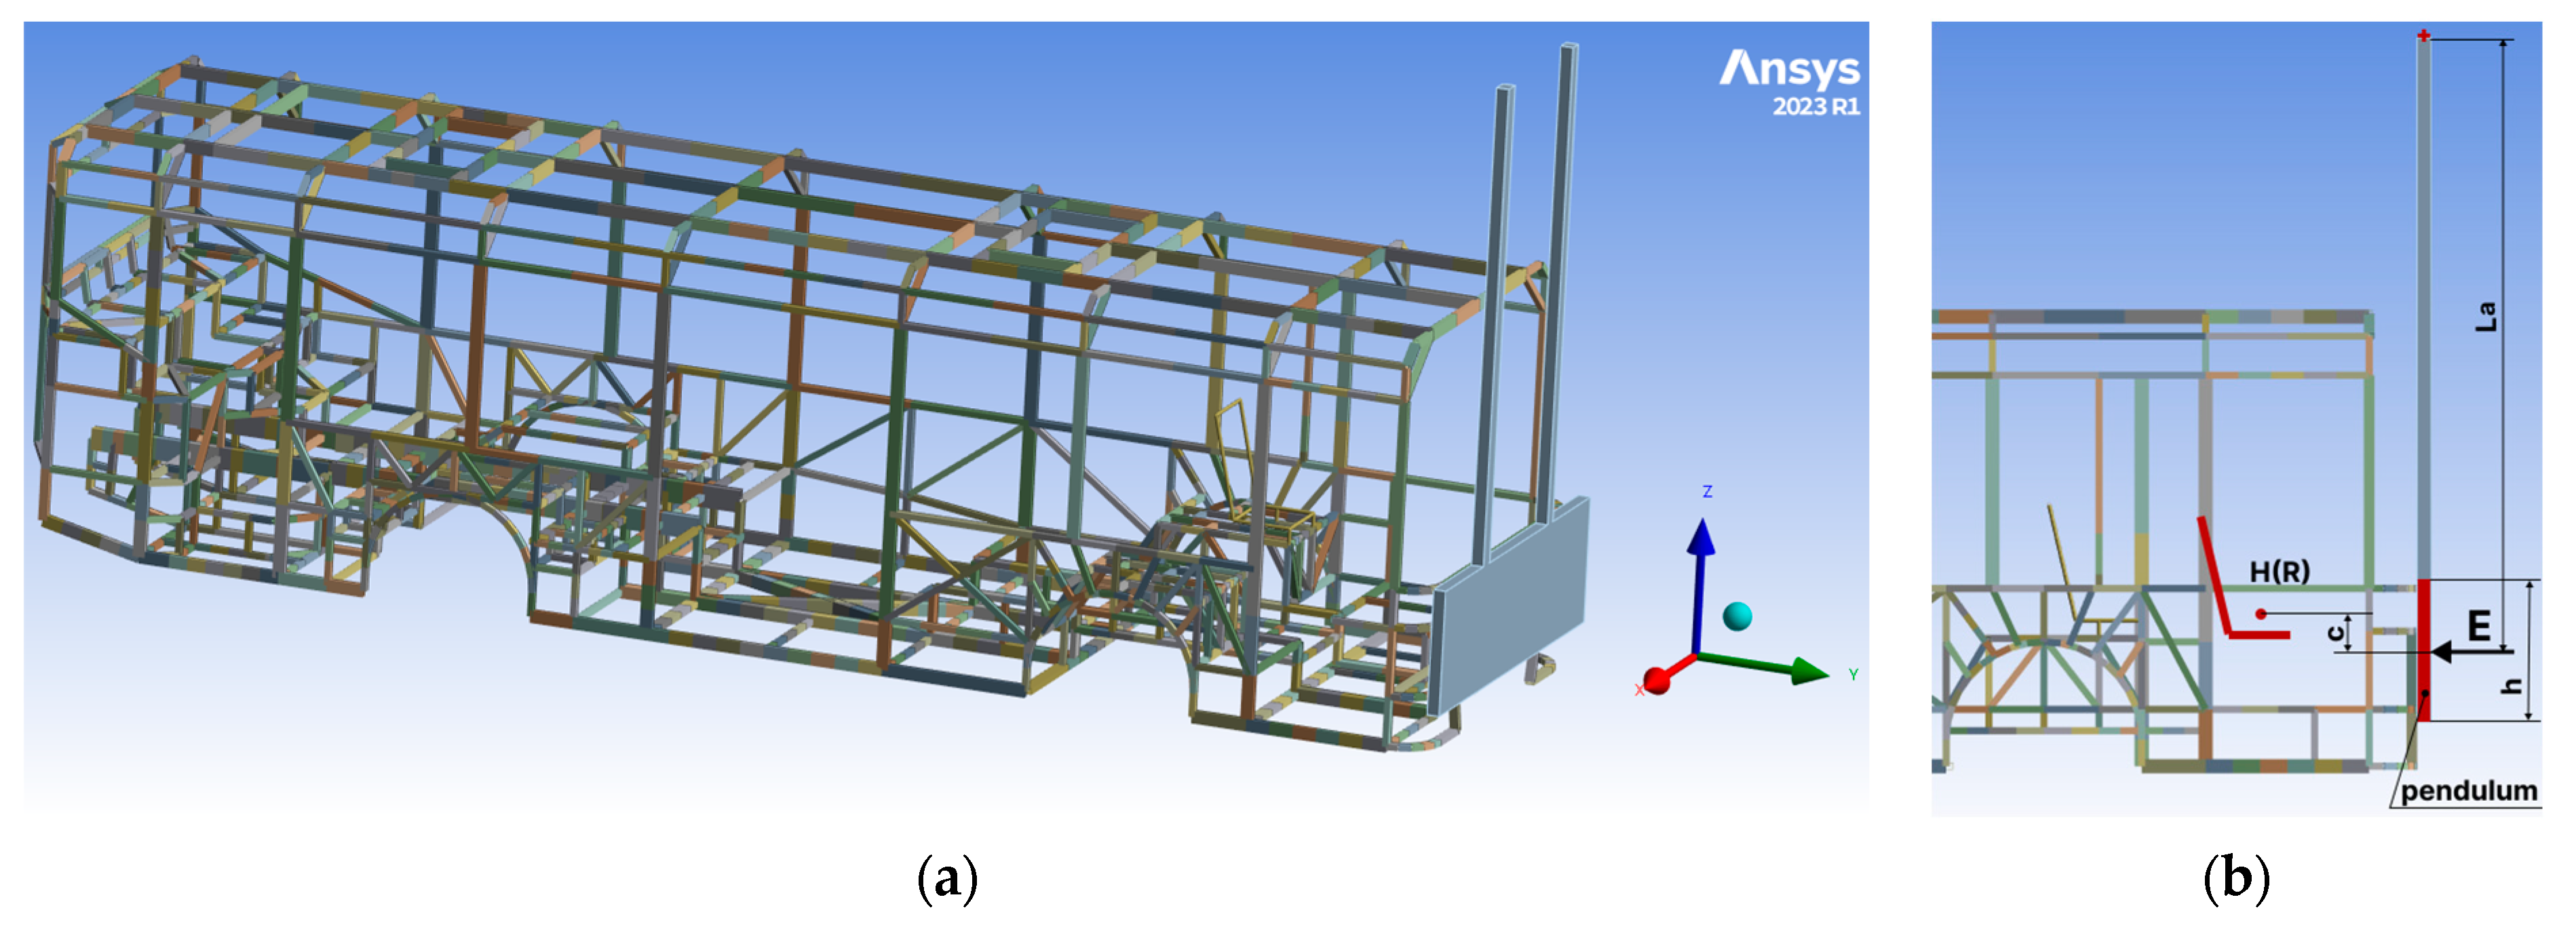
  • The chassis frame side members should be supported on wooden blocks over their entire width and length of not less than 150 mm (Figure 2a). The front edges of the blocks must not be forward of the rearmost point of the cab or behind the center of the wheelbase;
  • The rearward movement of the chassis frame should be limited by chains or A ropes attached to the front of the chassis frame symmetrically about its longitudinal axis, with the attachment points placed at a distance of not less than 600 mm. When tensioned, the chains or ropes should form an angle of no more than 25° with the horizontal, and their projection on the horizontal plane should form an angle of no more than 10° with the longitudinal axis of the vehicle (Figure 2b).
According to the authors, such a complicated mounting scheme (Figure 2) is unnecessary when simulating the bus crash test experiment in the Ansys program and has the following disadvantages: the bus has a spatial frame of the load-bearing body, unlike a truck flat frame in the floor, so the chains can only be attached at certain points and will not correspond to the real impact processes of the bus itself. Moreover, the bus has full-length seats, so it would be unfair to fix only the front part of the vehicle. Therefore, our Ansys model was fixed at the mounting points of the pneumatic cylinders of the rear wheel suspension—this scheme allows for plastic deformation in the area in front of the rear wheels, which allows for impact energy absorption (marker B—Figure 3a).
Another key point of the boundary conditions is to determine the angular velocity of rotation of the impact element to achieve the legally required energy of 55 kJ. Taking into account that the mass of our impactor is 1638 kg, the following value of its angular velocity was obtained:
E k = m v 2 2 = m ω 2 r 2 2 ;   ω = 2 E m r 2 = 2 · 55 × 10 3 1638 · 3.5 2 = 2.34 rad s .
So, the load conditions are rotational velocity ω = 2.34 rad/s was applied to the impactor (tag A in Figure 3a) and fixed support in the point of the pneumatic cylinders of the rear wheel suspension (tag B in Figure 3a).
Thanks to beam modeling, the FEA body frame consists of just 2281 linear elements of BEAM188 type and 4150 nodes (Figure 3b), which is very efficient compared with solid models consisting of a hundred thousand finite elements. This method proves to be highly effective during the initial phases of designing new bus models, prior to beginning the creation of drawings and technical documentation. The impactor is a rigid, solid body, so we have a combination of solid-linear bodies in the Ansys Explicit Dynamics environment. The maximum experiment duration was 200 ms.

3. Results and Discussion

The critical position of the impactor (Figure 4) is given below, when its angular velocity ω = 0 rad/s and the deformations reached the maximum value (577 mm) in 137 ms and 109,287 calculation cycles.
It is suggested to analyze the bus body frame front part behavior in combination with the driver’s position at different moments of impact:
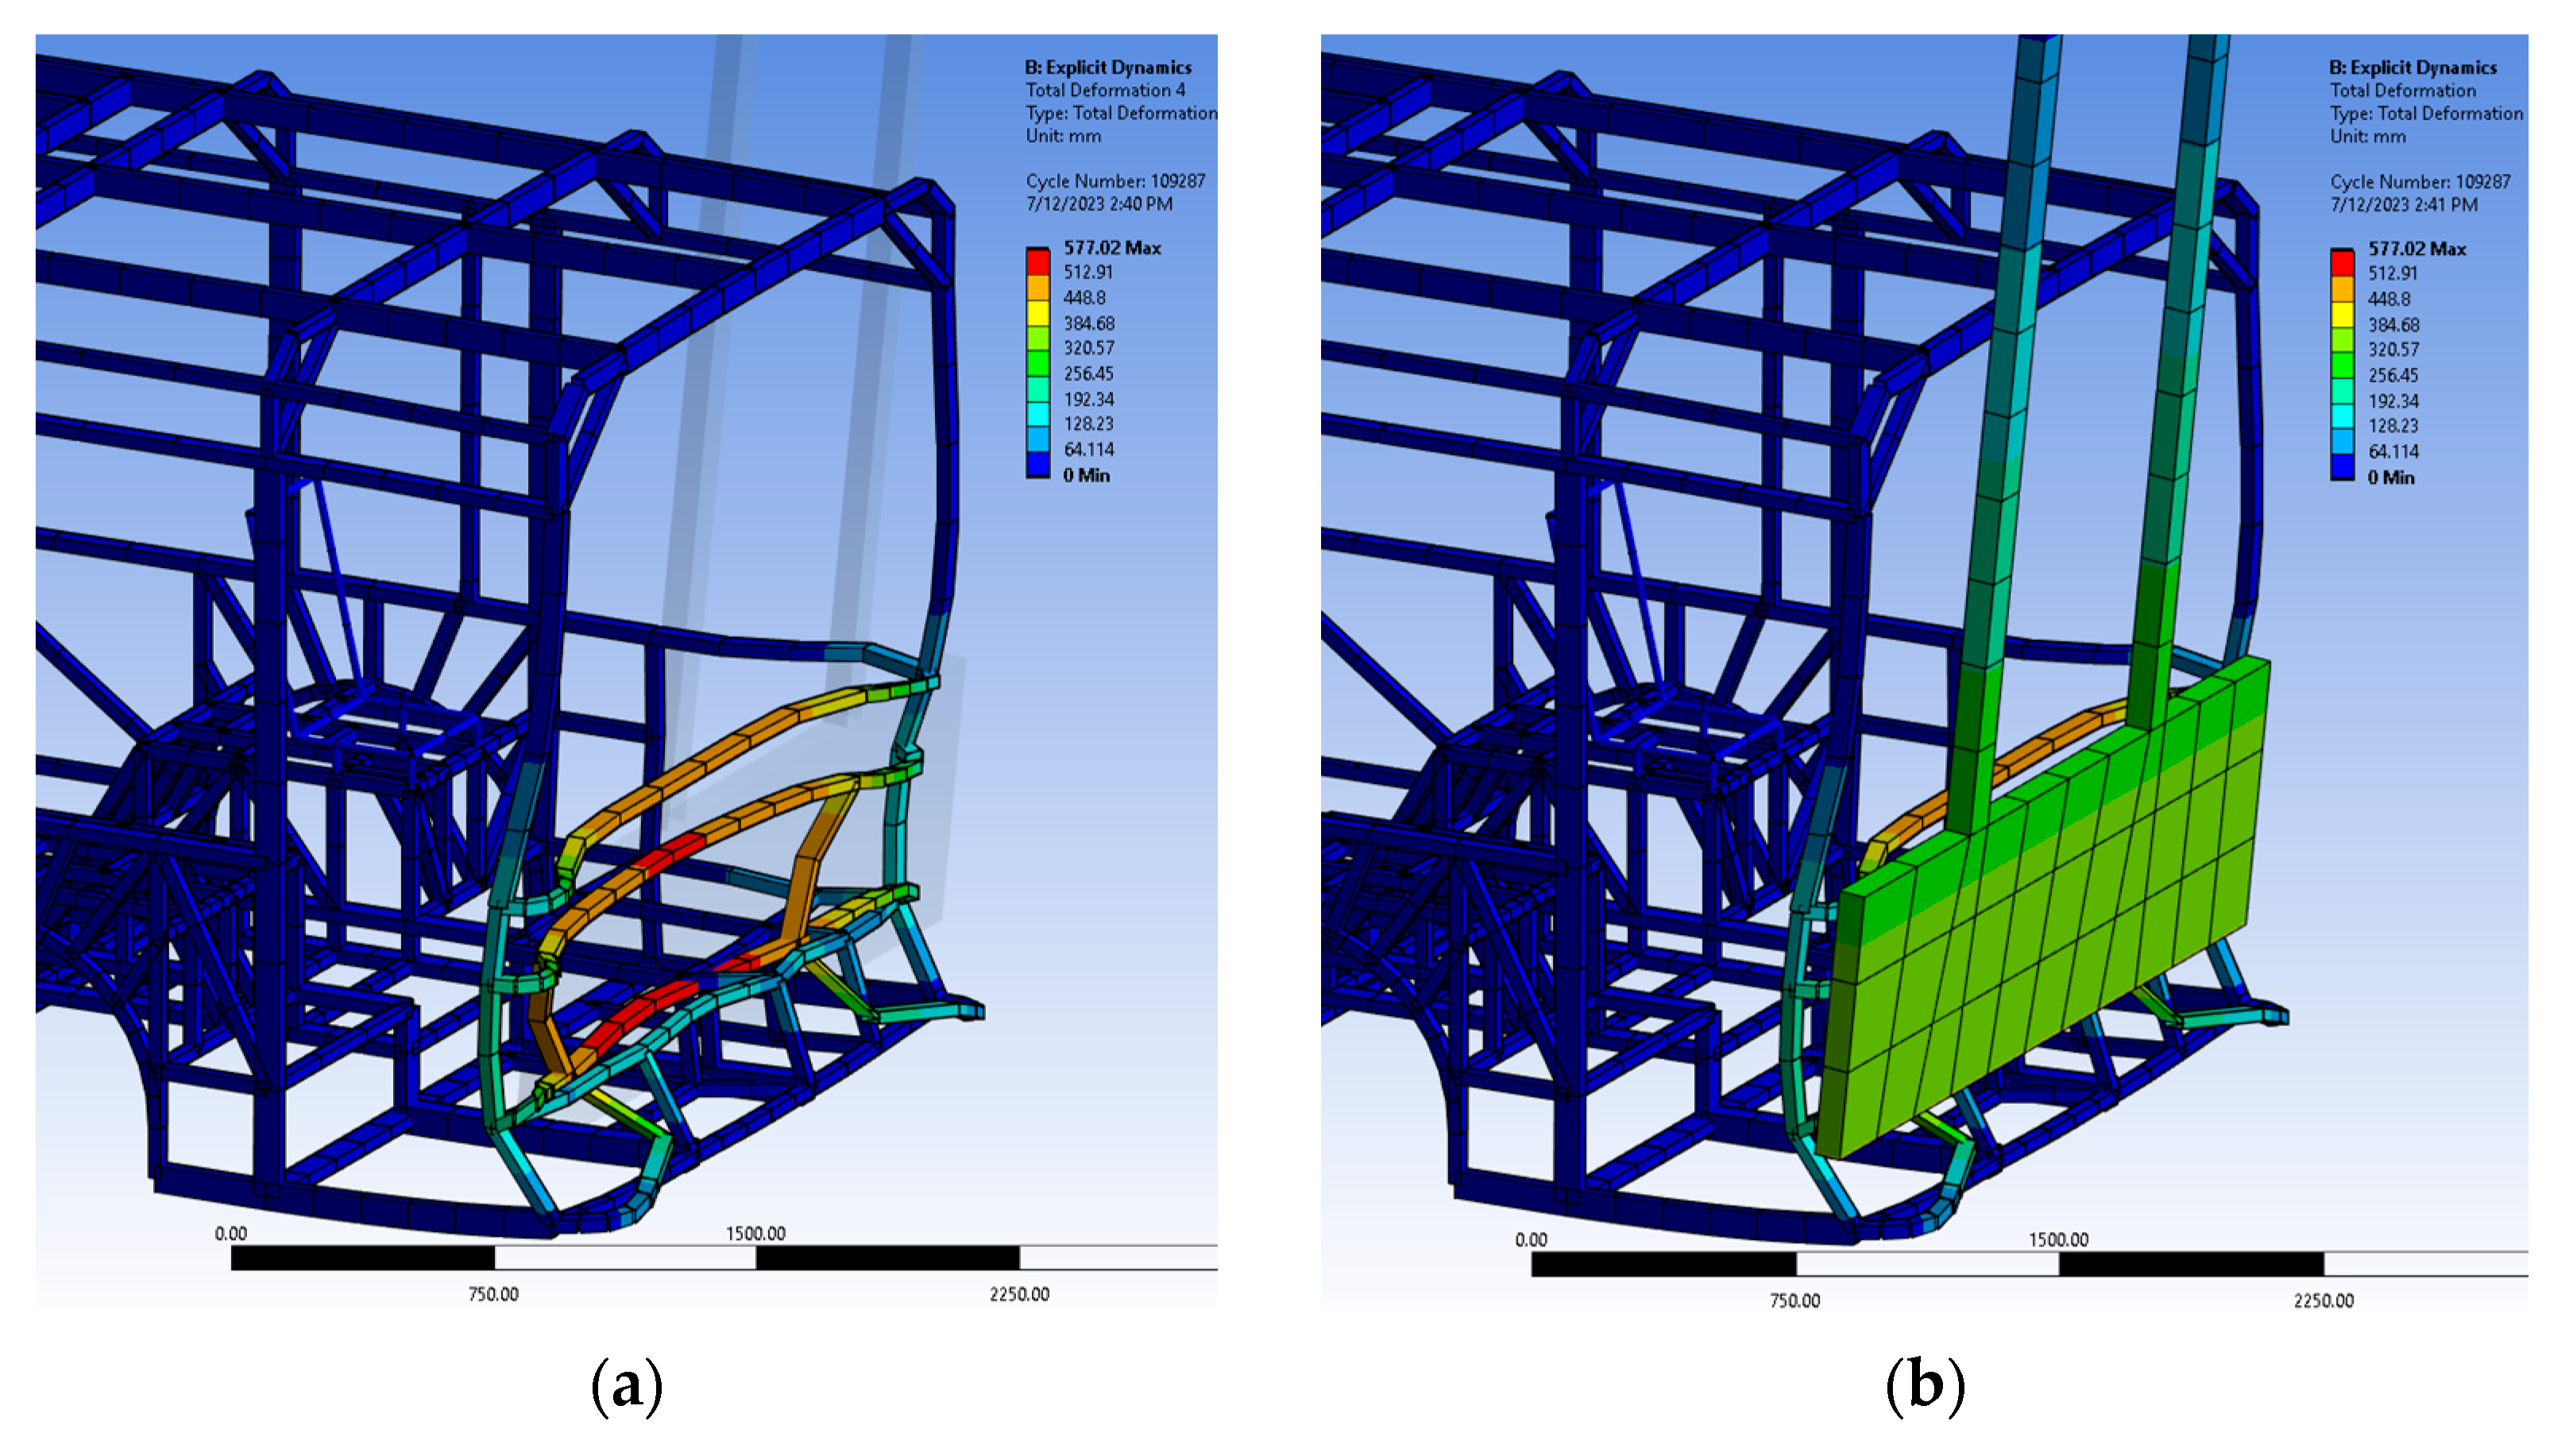
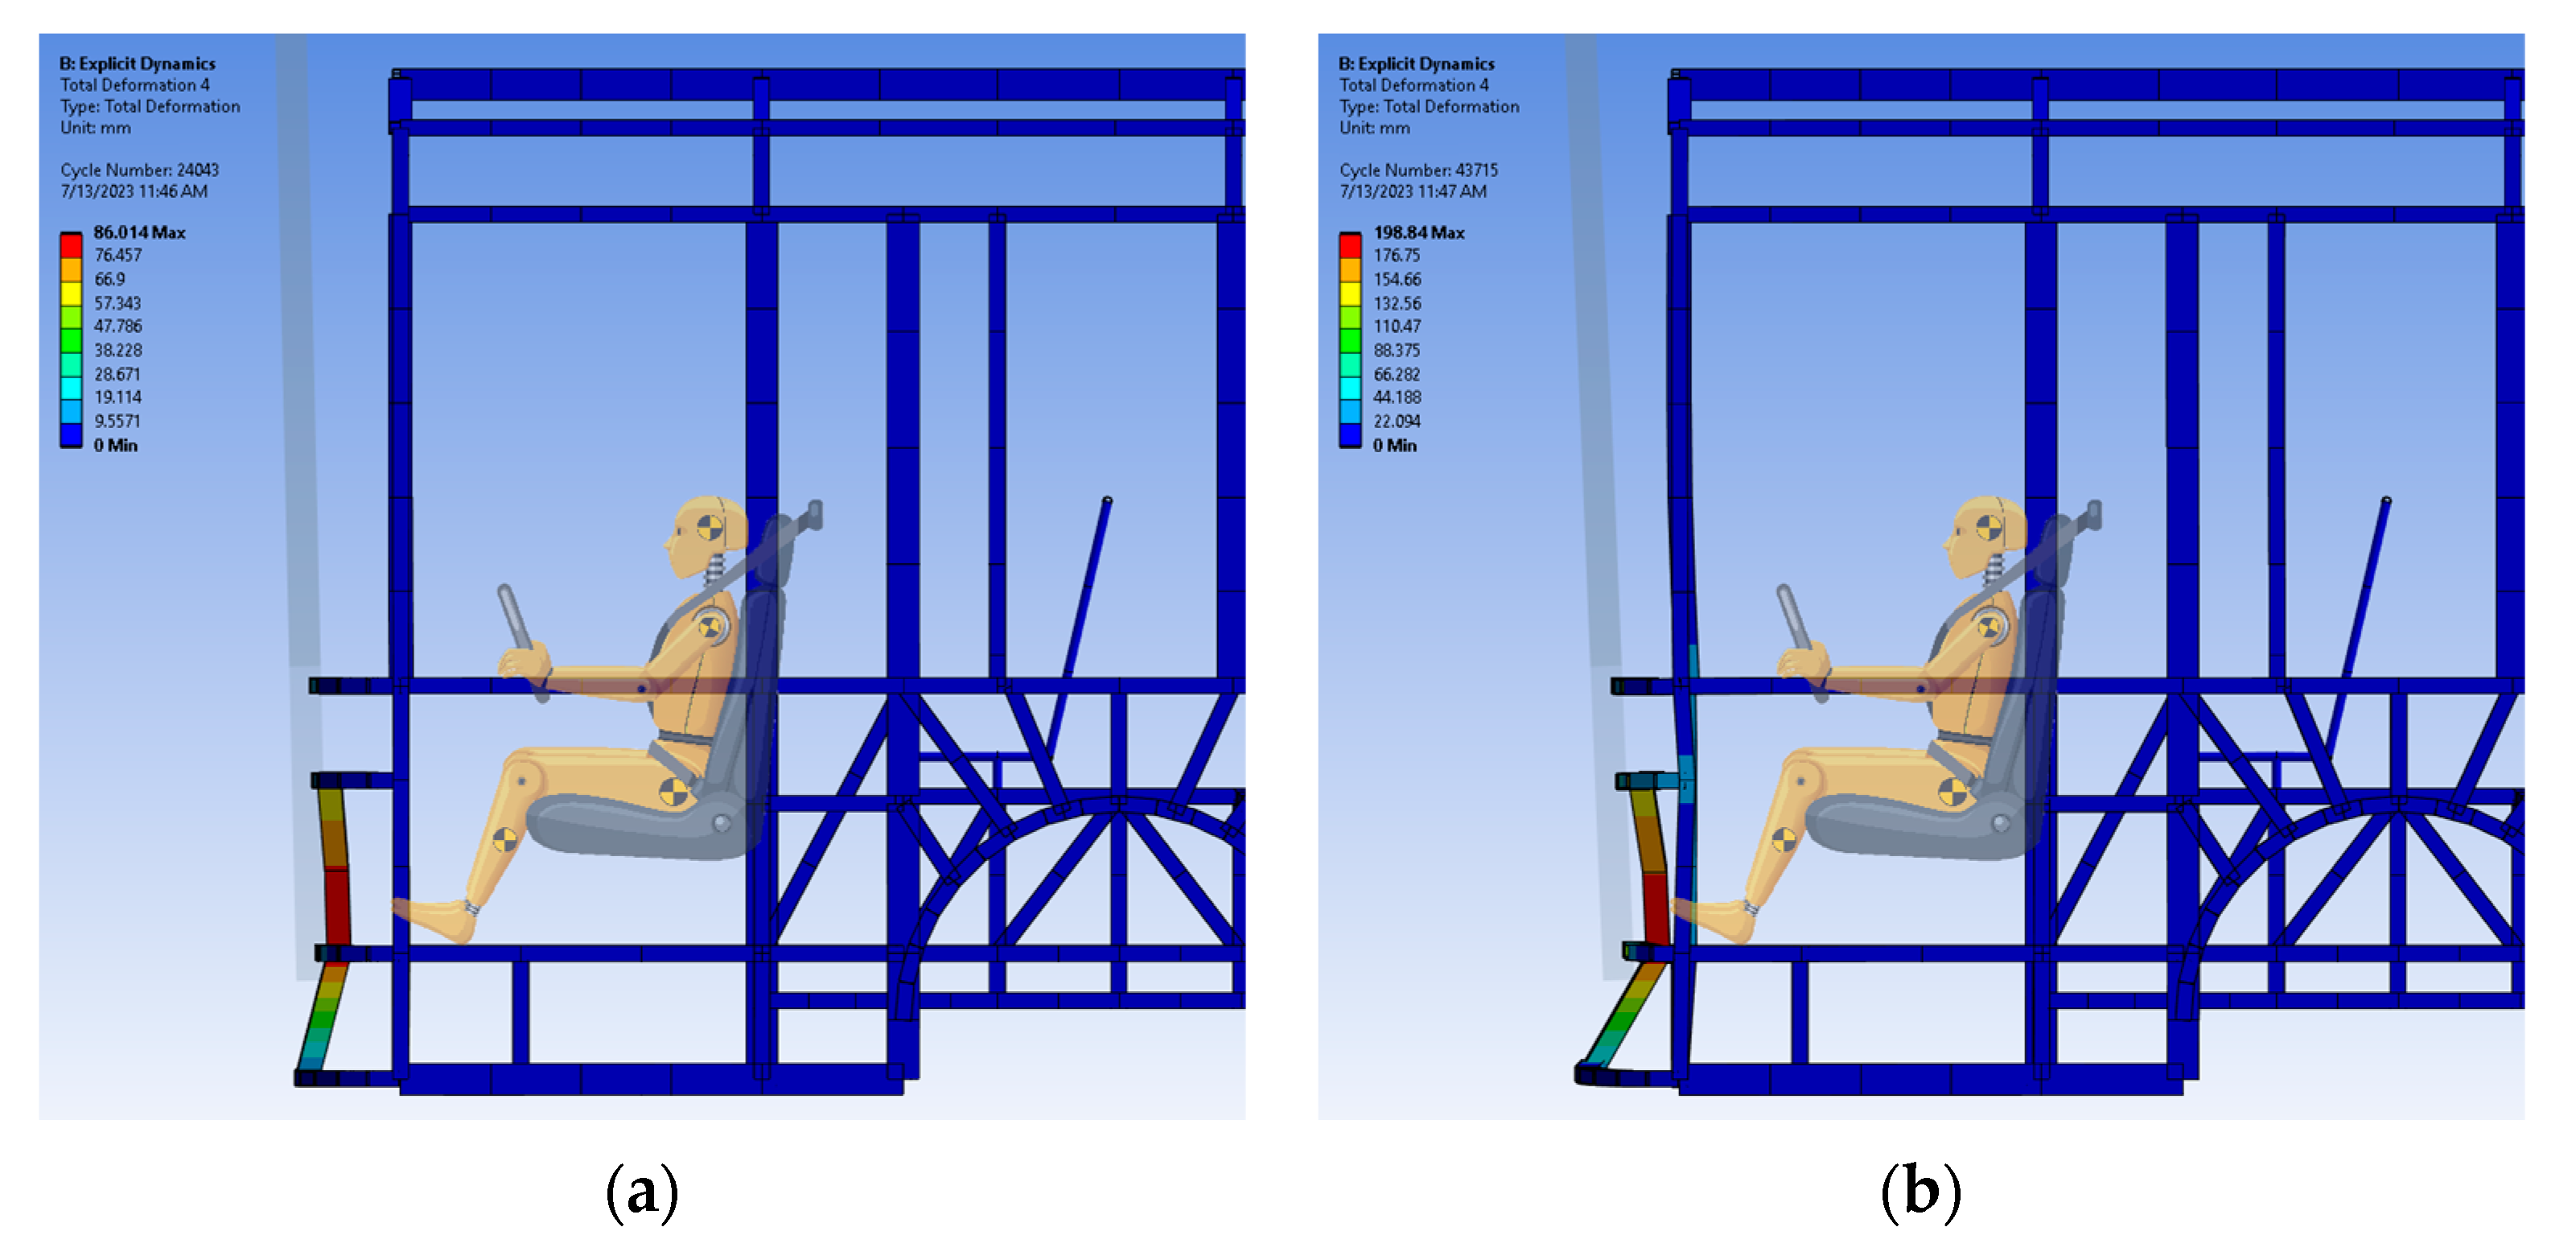
  • t = 35–65 ms (Figure 5a,b)—deformations are observed only in the window frame of the windshield and the structure of the front part (86 mm max). There is no risk to the driver’s legs;
  • t = 100 ms (Figure 5c)—the lower part of the driver’s legs is at risk—the pedal unit is clearly deformed, which carries the risk of injury. The maximum observed model displacement is 390 mm at that moment;
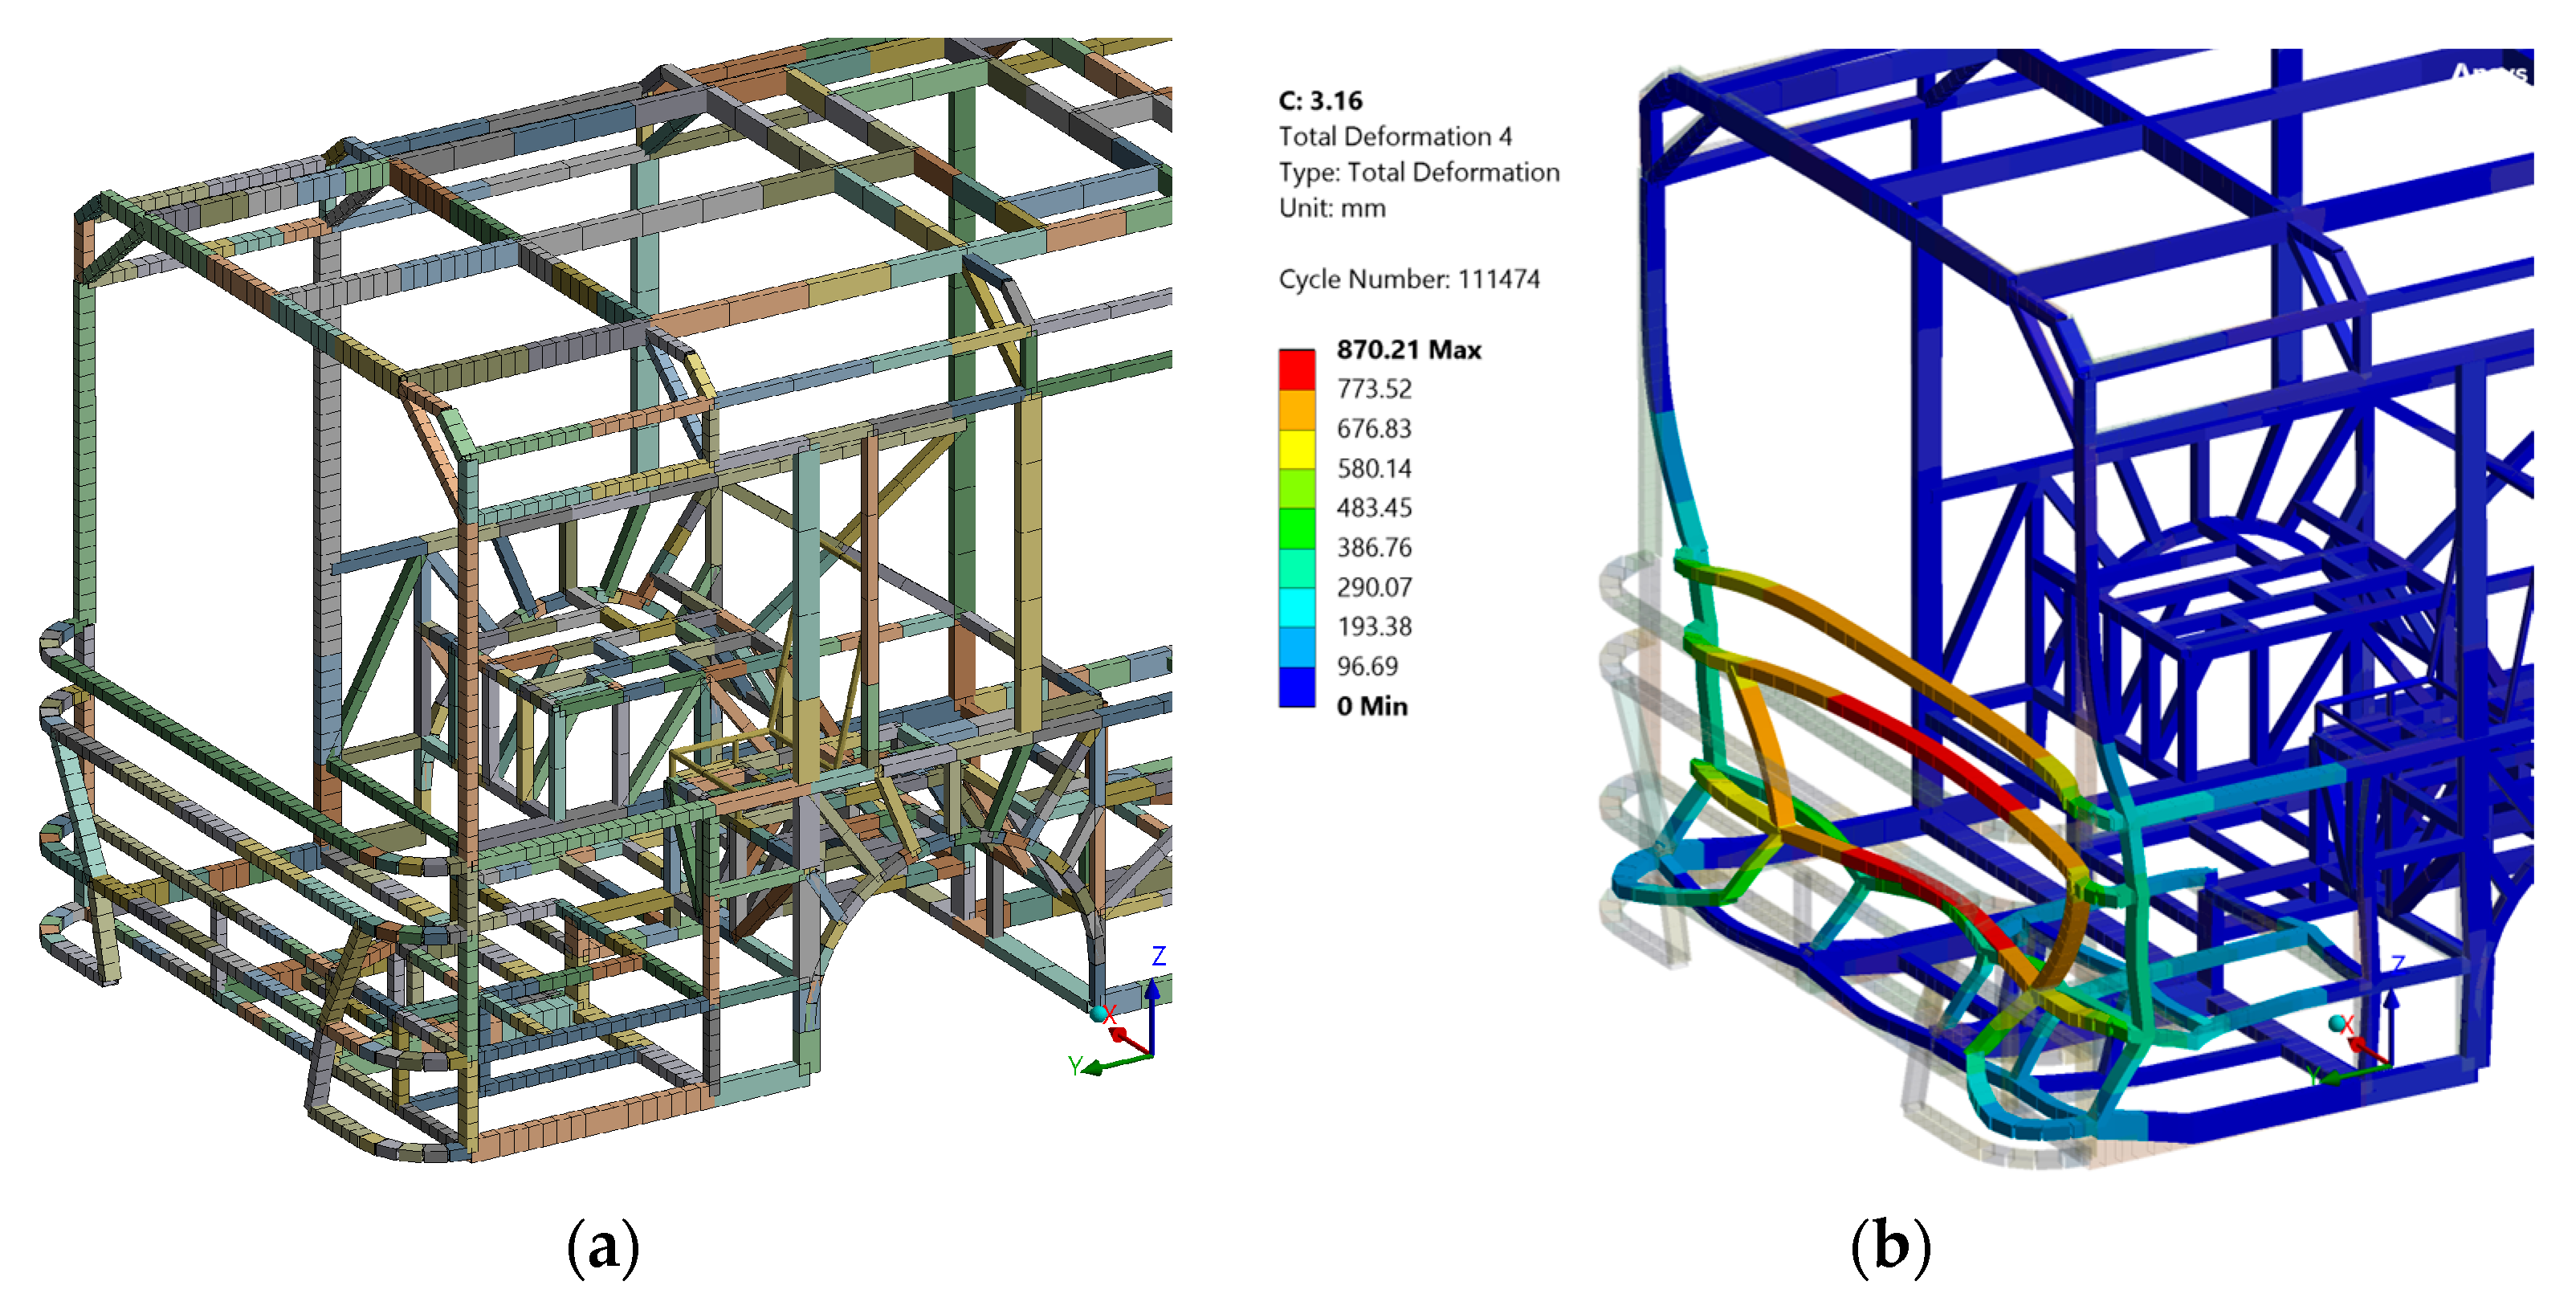
  • t = 137 ms (Figure 5d)—under the influence of the impactor, maximum deformations of the front part were achieved (577 mm of the lower window sill at the level of the driver’s knees). The deformation of the structure indicates a possible injury risk to the lower limbs, pelvis, and hands of the driver (the steering column will definitely enter the residential space zone).
To determine the level of damage to the driver, it is suggested to build a matrix of Y-deformations (Y is the longitudinal axis of the bus corresponding to the impact vector) at the control points #1–9 of the front body part relative to the driver’s seat mounting points A and B (Figure 6). The maximum Y-deformation of the mounting points during the crash test is A = 1.1 mm and B = 37.8 mm. In fact, the Ansys “Solution > Deformation” tool means a change in the coordinate of the point position relative to the initial state (its displacement), but for the applicability of the presented methodology, it was decided to leave the original Ansys terms. Thus, to calculate the relative deformation of any of the nine selected points, it is necessary to subtract 1.1 mm (relative to point A) or 37.8 mm (relative to point B) from the value measured in Ansys for each of points #1–9. Example: If the Y-deformation value of point #1 is 384.0 mm, then the relative to point A deformation will be: 384.0 − 1.1 = 382.9 mm, and relative to point B: 384.0 − 37.8 = 346.2 mm. All values for other points are calculated in the same way and are presented in Table 1. The reason for the subtraction of the values is explained by the mutual change of the point positions during the impact.
As is widely known, all UNECE safety rules are based on the analysis of accident statistics involving road vehicles, in particular buses, which is the subject of our research (low-entry and low-floor buses). Scientists analyze the conditions of live accidents and transfer them in the form of boundary conditions to the appropriate regulations, e.g., NCAP or R29 regarding the speed and energy of the collision, etc. As a result, there is a difference in the way the frontal impact test was performed: the bus hit the wall at high speed (NCAP) or the pendulum hit the front part of the fixed bus (R29). The difference between them lies in the perception of impact energy: in NCAP conditions, it is mainly the entire bus that deforms as opposed to the front part in the case of R29, but its deformation is much stronger—this results in more danger for the driver.
Another characteristic feature is the time to reach the maximum deformations in the front part of the bus: in tests for compliance with the R29 regulations, this moment is reached earlier than according to NCAP (137 ms vs. 170–230 ms, which were established during a separate investigation of the same JSC “Ukrbusbusprom”—model 4289). In the case of frontal collisions of heavily loaded intercity buses at a speed of 32 km/h, this moment is reached even later—approximately 750–900 ms. This means much longer FEA calculations compared with the low-entry bus model studied here and significantly more computational resources. The number of finite elements in the intercity bus model is expected to be greater, also due to its more complex structure. The next configuration (two physical Intel Xeon 24-core processors, RAM of 48 GB, and NVIDIA GeForce 4 GB video) took 7 h and 48 min for the R29 (Explicit Dynamics) rules. When it comes to frequent iterations (changes to the body or selection of alternative materials), the beam modeling approach is preferred over the solid one, although to obtain higher accuracy results, it is advisable to reduce the size of the finite elements for final verification calculations (if the hardware is sufficiently capable). By reducing the element size, we increase the number of segments into which the beam is divided, since in the cross section, the beam is always modeled by one beam element. One of the goals of current research is to present an applicable methodology for the UNECE R29 simulation.
Despite the regulatory-determined energy value of 55 kJ according to R29, the question of the influence of energy growth on the front part deformations is relevant. For this purpose, an additional FEA calculation with an energy value of 100 kJ was performed, which caused an increase in angular velocity to 3.16 rad/s according to Equation (11).
Since larger deformations were expected, the mesh density of the front overhang (Figure 7a) was increased (the size of the FE was reduced to 50 mm) in order to obtain more accurate results. Thus, the beam model has increased the number of finite elements from 2281 to 3069 and the number of nodes from 4150 to 5726 accordingly. The maximum deformations (Figure 7b) were 870.2 mm (+50.8%), and the mounting points (Figure 6) received significant changes: A and B obtained 2.8 and 146.8 mm, respectively. The relative A and B deformations of some other points were higher by more than 30% compared with Table 1: #1—581.4 mm and 437.4 mm; #4—650.2 mm and 506.2 mm; #7—662.1 mm and 518.1 mm.
Overall, the authors’ opinions are as follows:
  • R29 deforms the front part well, but without affecting the rest of the bus sections (passengers do not feel the acceleration impact enough), and NCAP is more focused on assessing accelerations at control points, as in the case of R80 (passengers feel the impact enough on the seats), but the front parts are far from deformations seen with R29.
  • The model case of the frontal collision simulation is to be performed both in the R29 and NCAP tests—their combination allows us to determine bus body complex safety. In addition, it is worth taking into account separate rules for the city buses, in which the maximum permissible speed should be limited to 50 km/h and the obstacle with a rigid wall with the height reduced to only 1 m.
  • In fact, it is worth conducting both experiments to comprehensively evaluate the safety of the bus. This especially applies to city buses, which have an unusual speed limit of 50 km/h. One of the ideas for testing the frontal collision of city buses is to use a 1m high NCAP rigid wall (this will be consistent with the impactor parameters according to R29) and limit the speed to 50 km/h. This will definitely be a topic for future research.

4. Conclusions

The following points have been stated based on extensive discussions:
  • Unlike suburban and intercity buses, city buses are characterized by lower stiffness in the event of a frontal collision, which can be explained by at least two reasons:
    • The load-bearing part of low-floor and low-entry buses is partially transferred from the floor to the roof, i.e., in the event of a frontal impact, the stiffness of the floor is decisive;
    • The driver’s position in a city bus is lower than in an intercity bus (this is the rule, especially in the case of the R29 regulation).
  • Maximum deformation values in the bus front part are reached earlier for R29 (137 ms) than for most impacts tested by NCAP (170–230 ms) but have higher values: 577 mm vs. 150–250 mm for the sills tested.
  • According to the R29 results, the driver’s legs were seriously affected, judging by the deformation value for the lower window sill (maximum deformation of 577 mm) and other elements of the front part in the appropriate control points. The matrix with the results of relative deformations showed the greatest danger at the level of the driver’s knees (up to 511 mm of penetration relative to the seat mounting point A) and feet (up to 557 mm). The displacement of the pedal unit has reached almost 108 mm.
  • It is unjustified to use the boundary conditions of trucks to attach the bus with chains behind its frontal axe. There are at least two reasons for this approach:
    • The bus has a spatial frame for the bearing body, unlike the flat frame of the truck on the floor, so attaching chains only at specified points will not correspond to the actual impact processes of the bus itself.
    • The bus has seats along its entire length, so it would be unwise to attach only the front part of the vehicle. Therefore, it is proposed to install attachment points for the pneumatic cylinders of the rear wheel suspension; such a scheme allows for plastic deformation in the area of the front of the rear wheels, which allows for absorption of impact energy.

Author Contributions

Conceptualization, K.H. and E.K.; methodology, K.H.; software, K.H., M.Ż. and T.W.; validation, K.H., M.Ż. and T.W.; formal analysis, O.B., V.R., R.H. and S.B.; investigation, O.B., V.R., R.H. and S.B.; resources, O.D.; writing—original draft preparation, K.H. and O.D.; writing—review and editing, K.H., A.M. and T.W.; visualization, I.K. and Y.R.; supervision, K.H., I.K., E.K., M.Ż. and A.M.; project administration, O.H. All authors have read and agreed to the published version of the manuscript.

Funding

This research received no external funding.

Data Availability Statement

The data presented in this study are available on request from the corresponding author.

Conflicts of Interest

The authors declare no conflicts of interest.

References

  1. Tang, L.; Gan, A.; Cevallos, F.; Alluri, P. Characteristics of Bus Transit Vehicles in the United States: A 30-Year National Trend Analysis. Transp. Res. Rec. 2018, 2672, 41–51. [Google Scholar] [CrossRef]
  2. Hermann, T. Mass Transit Crashworthiness Statistical Data Analysis. Report No. FTA-0002. National Institute for Aviation Research. 2005. Available online: https://www.transit.dot.gov/sites/fta.dot.gov/files/docs/Crashworthiness_Report.pdf (accessed on 26 December 2005).
  3. Hoffenson, S.; Reed, M.; Kaewbaidhoon, Y.; Papalambros, P. On the impact of the regulatory frontal crash test speed on optimal vehicle design and road traffic injuries. Int. J. Veh. Des. 2013, 63, 39–60. [Google Scholar] [CrossRef]
  4. Deulgaonkar, V.; Kulkarni, M.S.; Khedkar, S.S.; Kharosekar, S.; Sadavarte, V.U. Crash Analysis of Bus Body Structure using Finite Element Analysis. Int. J. Veh. Struct. Syst. 2020, 12, 312–316. [Google Scholar] [CrossRef]
  5. Afripin, A.; Zainudin, A.; Sahar, M.; Yusof, M. Frontal impact on bus superstructure as per UNECE R29 and NCAP. IOP Conf. Ser. Mater. Sci. Eng. 2019, 670, 012014. [Google Scholar] [CrossRef]
  6. Sandner, V.; Ellway, J.; van Ratingen, M. Euro NCAP—New Frontal Impact Test with Mobile Progressive Deformable Barrier (MPDB). 2019. Available online: https://www.researchgate.net/publication/337224180_Euro_NCAP_-New_Frontal_Impact_Test_with_Mobile_Progressive_Deformable_Barrier_MPDB (accessed on 12 June 2024).
  7. Dima, D.; Covaciu, D. Vehicles Frontal Impact Analysis Using Computer Simulation and Crash Test. Int. J. Automot. Technol. 2019, 20, 655–661. [Google Scholar] [CrossRef]
  8. Seyedi, M.; Koloushani, M.; Jung, S.; Vanli, O. Safety Assessment and a Parametric Study of Forward Collision-Avoidance Assist Based on Real-World Crash Simulations. J. Adv. Transp. 2021, 2021, 1–24. [Google Scholar] [CrossRef]
  9. Wang, D.; Zhang, J.; Wang, S.; Hu, L. Frontal Vehicular Crash Energy Management Using Analytical Model in Multiple Conditions. Sustainability 2022, 14, 16913. [Google Scholar] [CrossRef]
  10. Jongpradist, P.; Saingam, N.; Tangthamsathit, P.; Chanpaibool, P.; Sirichantra, J.; Aimmanee, S. Crashworthiness analysis and design of a sandwich composite electric bus structure under full frontal impact. Heliyon 2022, 8, e11999. [Google Scholar] [CrossRef]
  11. Rooppakhun, S.; Bua-Ngam, S. Finite Element Analysis of High-Decker Bus Frontal Impact Based on ECE-Regulation No.29. Adv. Mater. Res. 2013, 658, 464–470. [Google Scholar] [CrossRef]
  12. Walber, M.; Jr, A.; Goedel, F.; Alcalá, E.; Izquierdo, F.; Iturrioz, I. Evaluation of the seat fastening in the frame of a road bus submitted to frontal impact. Lat. Am. J. Solids Struct. 2014, 11, 1463–1489. [Google Scholar] [CrossRef]
  13. Olivares, G.; Yadav, V. Injury Mechanisms to Mass Transit Bus Passengers During Frontal, Side and Rear Impact Crash Scenarios. NIAR, Wichita State University United States Paper Number 09-0427. 2009. Available online: https://www-esv.nhtsa.dot.gov/Proceedings/21/09-0427.pdf (accessed on 12 June 2024).
  14. Xiao, Y.; Zhu, W.; Zhao, H. The Safety of Body Structure and Occupant Protection Research of Medium Bus Under Three Kinds of Frontal Impact Forms. Lect. Notes Electr. Eng. 2013, 197, 279–292. [Google Scholar] [CrossRef]
  15. Rivera-Hernández, M.; Ramírez-Juárez, O.; Cuautle Estrada, A.; Cantor-Mexquititla, V.; Torres-SanMiguel, C. Front Impact Simulation of Urban Bus. In Engineering Design Applications IV. Advanced Structured Materials; Öchsner, A., Altenbach, H., Eds.; Springer: Cham, Switzerland, 2022; Volume 172, pp. 15–25. [Google Scholar] [CrossRef]
  16. Lopes, R.; Viriato, N.; Cunha, R.; Maia, R.; Rodrigues, R.; Parente, M.P.L.; Moreira, P. Coach crashworthiness and failure analysis during a frontal impact. Eng. Fail. Anal. 2023, 151, 107369. [Google Scholar] [CrossRef]
  17. Lopes, R.; Viriato, N.; Cunha, R.; Maia, R.; Rodrigues, R.; Parente, M.; Moreira, P. Passive Safety Solutions on Coach according ECE R29: Experimental and Numerical analyses. Procedia Struct. Integr. 2023, 42, 1159–1168. [Google Scholar] [CrossRef]
  18. Lashkari, A.; Aslamjaved, K.; Manjunath, V.S.; Ahuja, P. Finite Element Analysis of School Bus frame structure as per AIS029 Pendulum Impact Test using LSDYNA. Int. J. Recent Eng. Sci. 2022, 9, 1–4. [Google Scholar] [CrossRef]
  19. Lopes, R.; Barros, F.; Melo, F.; Viriato, N.; Moreira, P.; Cunha, R.; Maia, R.; Rodrigues, R. Simulation of a frontal impact on a coach door sub-system using a pseudo-dynamic (PSD) test. Procedia Struct. Integr. 2022, 37, 115–122. [Google Scholar] [CrossRef]
  20. Holenko, K.; Koda, E.; Kernytskyy, I.; Babak, O.; Horbay, O.; Popovych, V.; Chalecki, M.; Leśniewska, A.; Berezovetskyi, S.; Humeniuk, R. Evaluation of Accelerator Pedal Strength under Critical Loads Using the Finite Element Method. Appl. Sci. 2023, 13, 6684. [Google Scholar] [CrossRef]
  21. Murugesan, M.; Lee, S.; Kim, D.; Kang, Y.H.; Kim, N.A. Comparative Study of Ductile Damage Models Approaches for Joint Strength Prediction in Hot Shear Joining Process. Procedia Eng. 2017, 207, 1689–1694. [Google Scholar] [CrossRef]
  22. Bocchieri, R.T.; Kirkpatrick, S.W.; Kitzinger, D. Expansion of the Riera Approach for Predicting Aircraft Impact Damage to Steel and Concrete Buildings. In Proceedings of the 20th International Conference on Structural Mechanics in Reactor Technology (SMiRT 20), Espoo, Finland, 9–14 August 2009. [Google Scholar]
  23. Kernytskyy, I.; Volchenko, A.; Szlachetka, O.; Horbay, O.; Skrypnyk, V.; Zhuravlev, D.; Bolonnyi, V.; Yankiv, V.; Humenuyk, R.; Polyansky, P.; et al. Complex Heat Exchange in Friction Steam of Brakes. Energies 2022, 15, 7412. [Google Scholar] [CrossRef]
  24. Fornalchyk, Y.; Koda, E.; Kernytskyy, I.; Hrytsun, O.; Royko, Y.; Bura, R.; Osiński, P.; Barabash, R.; Humenuyk, R.; Polyansky, P. The impact of vehicle traffic volume on pedestrian behavior at unsignalized crosswalks. Roads Bridges—Drogi I Mosty 2023, 22, 201–219. [Google Scholar] [CrossRef]
  25. Kernytskyy, I.; Yakovenko, Y.; Horbay, O.; Ryviuk, M.; Humenyuk, R.; Sholudko, Y.; Voichyshyn, Y.; Mazur, Ł.; Osiński, P.; Rusakov, K.; et al. Development of Comfort and Safety Performance of Passenger Seats in Large City Buses. Energies 2021, 14, 7471. [Google Scholar] [CrossRef]
  26. Thamsuwan, O.; Blood, R.P.; Ching, R.P.; Boyle, L.; Johnson, P.W. Whole body vibration exposures in bus drivers: A comparison between a high-floor coach and a low-floor city bus. Int. J. Ind. Ergon. 2013, 43, 9–17. [Google Scholar] [CrossRef]
  27. Sudirja, S.; Hapid, A.; Amin, A.; Kaleg, S.; Budiman, A.C. Stress analysis simulations of welded and bolted joints method for full steel and composite-steel chassis structure of electric low floor medium bus. Eureka Phys. Eng. 2020, 6, 61–70. [Google Scholar] [CrossRef]
  28. Sahraei Esfahani, E.; Darvish, K.; Parnianpour, M.; Bateni, A. Reducing Occupant Injury in Frontal Crashes for a Low-Floor City Bus. In Proceedings of the ASME 2005 International Mechanical Engineering Congress and Exposition, Orlando, FL, USA, 5–11 November 2005; pp. 113–120. [Google Scholar] [CrossRef]
Figure 1. UNECE Regulation No. 29 (UNECE R29) frontal impact safety standards schemes: (a) whole bus body frame model; (b) scheme of the front part.
Applsci 14 05595 g001
Figure 2. UNECE Regulation No. 29 (UNECE R29)—fixation of the vehicle: (a) side view of the model; (b) top view.
Applsci 14 05595 g002
Figure 3. UNECE R29 model of the bus body frame: (a) boundary conditions; (b) FEA mesh.
Applsci 14 05595 g003
Figure 4. Front impact according to UNECE R29: (a) hidden impactor; (b) shown impactor.
Applsci 14 05595 g004
Figure 5. The behavior of the bus body frame front part together with the driver’s position at various moments of impact ((a,b)—35–65 ms, (c)—100 ms, (d)—137 ms).
Applsci 14 05595 g005aApplsci 14 05595 g005b
Figure 6. Control points of the front part of the body for building a matrix of displacements.
Applsci 14 05595 g006
Figure 7. R29 frontal impact at 100 kJ impactor energy: (a) detailed mesh; (b) deformations.
Applsci 14 05595 g007
Table 1. The effect of a frontal impact on the change of the residual space of the driver at different levels.
Relative Deformation between Control and Mounting Points Along Y-Axis, mm
LevelHandsKneesFeet
Points12345678 *9
A382.9154.5511.4412.2154.5557.1481.1107.5159.8
B346.2117.8474.7375.5117.8520.4444.470.8123.1
* point #8 corresponds to the location of the pedal unit.
Disclaimer/Publisher’s Note: The statements, opinions and data contained in all publications are solely those of the individual author(s) and contributor(s) and not of MDPI and/or the editor(s). MDPI and/or the editor(s) disclaim responsibility for any injury to people or property resulting from any ideas, methods, instructions or products referred to in the content.

