Article

First Approach for Defining an Analytical Protocol for the Determination of Microplastics in Cheese Using Pyrolysis–Gas Chromatography–Mass Spectrometry

1
Department of Agricultural, Environmental and Food Sciences (DiAAA), University of Molise, Via de Sanctis, 86100 Campobasso, Italy
2
Department of Engineering and Agrifood Transformations, Consiglio per la Ricerca in Agricoltura e l’Analisi dell’Economia Agraria, Via della Pascolare 16, Monterotondo, 00015 Rome, Italy
3
Institute of Atmospheric Pollution Research, Division of Rome, c/o Ministry of Environment and Energy Security, 00147 Rome, Italy
*
Authors to whom correspondence should be addressed.
Appl. Sci. 2024, 14(13), 5621; https://doi.org/10.3390/app14135621
Submission received: 27 May 2024 / Revised: 26 June 2024 / Accepted: 26 June 2024 / Published: 27 June 2024

Abstract

:
The exposure of humans to microplastics through food is a topic of great interest. Foods of marine origin, such as fish and salt, have been the most extensively studied in this regard. Conversely, foods considered less likely to be contaminated (such as dairy products) have been investigated to a lesser extent. This is the first study addressing the occurrence of microplastics in cheese. In this paper, we report the first analytical approach for cheese preparation, before a chemical analysis of microplastics in cheese was performed. Therefore, the most suitable digestion methods were investigated. Alkaline digestion (i.e., KOH 5 M, 50 °C, 48 h) achieved a digestion efficiency of 97.5 ± 0.8%. To assess the feasibility of the preparative method proposed, a recovery rate of spiked polystyrene microbeads (~10 µm) of 98.5 ± 0.4% was determined. Further, the effects of the digestion agent on the microbeads were also investigated. To confirm whether the preparative method allows for the confirmation of the plastic-nature of microparticles, a qualification of spiked microplastics (polystyrene, 150 µm, and polyethylene terephthalate, 300 µm) was performed using pyrolysis–gas chromatography–mass spectrometry.

1. Introduction

The extensive use of plastics in the food industry, particularly as one of the most commonly utilized food packaging materials, has led to growing concerns regarding food safety [1]. Public health agencies worldwide have emphasized the importance of addressing human exposure to microplastics through food. This issue has been incorporated into the objectives of the 2030 Agenda (SDG 6), particularly concerning the safety and sanitary quality of food (i.e., drinking water and canned food) [2]. Therefore, food is an important route for the transmission of microplastics for humans [3]. Among the various food matrices investigated as sources of microplastics, milk is the most extensively studied product in the dairy sector. For instance, studies have detected significant amounts of microplastics in prepared formula milk, estimating that infants may consume approximately 1.6 million microplastics per day, influenced by water temperature and sterilization processes. Common plastics used in packaging, such as polyethylene (PE), polyethylene terephthalate (PET), and nylon-6, release microplastics that infants may ingest [4]. Research by Kutralam-Muniasamy et al. (2020) [5] found microplastics in both whole and lactose-free milk, and a study on milk powders revealed that boxed milk powder contained significantly higher levels of microplastics than canned milk powder. Microplastics from feed bottles were also notably higher than those from milk powders. Raw milk and powdered cow’s milk products showed microplastics ranging from 204 to 1004 MPs 100 mL−1, with PE being the most frequently found polymer. Microplastics were also detected in breastmilk and skimmed milk samples from Ecuador, suggesting contamination from milk processing methods [5]. A study conducted by Rbaibi Zipak et al. (2024) [3] suggested that 89.28% of raw milk samples were contaminated with microplastics (<5 mm). Specifically, the analyzed cow milk samples showed a contamination rate of approximately 90% with microplastics < 5 mm. The most frequently observed size of microplastics in cow milk ranged between 20 and 150 µm (32.03%), followed by those between 150 and 500 µm (23.88%), in the form of fibers, fragments, spheres, and films. All microplastics were chemically confirmed using Fourier-transform infrared spectroscopy (FT-IR) [3]. So far, research has focused on the contamination of milk, while the potential translocation of microplastics into dairy products has received less attention.
A search on Scopus databases using the keywords “microplastics” and “dairy products” yielded nine (n = 9) studies. Among the various contamination pathways, the tubes and membranes used for milking (i.e., food processing) represent a route of exposure of milk to microplastics. It was found that fibers made of polyethersulfone and polysulfone, likely derived from membranes commonly used in dairy processes, at an average concentration of 6.5 ± 2.3 microplastics L−1 were present in milk [5], confirming that processed foods are more likely contaminated by microplastics [6]. Contamination during production is supported by the presence of microplastics in indoor air; the microplastics found in indoor environments are typically between 50 and 250 µm, with a predominance of fibers [7]. Through deposition, microplastics could contaminate food during its production. Furthermore, foods can interact with the inner side of the packaging, as their properties such as acidity (i.e., pH), water content, and viscosity are affected by temperature and UV radiation [8]. Although there is not yet sufficient scientific evidence confirming the release of microplastics from packaging, the interaction between plastic packaging and food could be considered based on the behavior of plastic takeaway containers. Fadare et al. (2020) [9] have suggested the release of plastic particles, of mostly less than 50 nm, from plastic packaging materials [9]. Further, commonly used takeaway food containers released flakes after a contact with MilliQ water both at 100 °C for 30 min and at room temperature. Some of the microplastics that were isolated shared compositions with container materials, indicating that peeling occurred [10]. Therefore, based on the current scientific knowledge, contamination by microplastics from the (i) external environment during production or (ii) through release from the packaging of cheese is conceivable. Indeed, cheese packaging is primarily made of polyethylene terephthalate (PET), polyamide (PA), polypropylene (PP), as well as polyethylene (PE) and polystyrene (PS). To assess whether humans are exposed to microplastics through cheese, a sample preparation methodology should be set up. Cheese is, in fact, frequently consumed, especially in Italy; the Italian National Statistical Office (ISTAT) reported that 21.1%, 19.3%, 18.3%, 18.0%, 16.6%, 17.6%, and 19.2% of Italian citizens aged 20–24, 25–34, 35–44, 45–54, 55–59, 60–65, and 65–74, respectively, consumed cheese at least once per day.
As of today, a preparative method for the investigation of microplastics in cheese is missing in the scientific literature. Microplastics’ investigation is still hampered by the absence of a standardized and harmonized analytical approach. Current analytical approaches still exhibit significant discrepancies, particularly in sample pre-treatment methods such as digestion [11]. In the case of preparing milk for the qualitative and quantitative analysis of microplastics (given the absence of pre-treatments on cheese, milk is taken as an example), different approaches have emerged. For instance, cow milk was only heated to 40 °C to determine the separation of the fat component from the aqueous one [12]; it was treated using multi-enzymatic digestion [3] and was subjected to alkaline digestion with potassium hydroxide for 48–72 h after enzyme application (i.e., multi-step digestion) [13].
What emerged is the lack, in the literature, of an in-depth investigation of experimental conditions detailed, such as type of agent, effects on microplastics, digestion time, and temperature, for isolating microplastics from cheese. To address this, two types of polymers with different structural characteristics were selected. Specifically, an amorphous linear atactic polymer (i.e., polystyrene, PS) and a semi-crystalline structured polymer (polyethylene terephthalate, PET) were chosen. In order to assess the modifications that may occur to the polymer during the digestion phase, spherical-shaped microplastics with standard diameters were selected. The spherical shape makes dimensional variations post digestive treatment more evident (given that the only parameter that can vary is the diameter). Additionally, PS was selected for tolerance testing to digestive treatments since it is structurally the least resistant polymer. Finally, pyrolysis–gas chromatography–mass spectrometry (Py–GC–MS) was employed to confirm that the digestive treatment had completely removed the organic matter, the main interferent in Py–GC–MS analysis.
To the best out knowledge, this is the first paper which deals with the development of a preparative method for the analysis of microplastics in cheese. Therefore, the digestion protocol has been set up by investigating the type of reagent and its effects, time, and temperature. The suitability of the proposed preparative methods was confirmed by evaluating the percentage recovery rate and by assessing the organic matter removal using Py–GC–MS.

2. Materials and Methods

2.1. Samples Collection

Cheese samples were obtained from an Italian supermarket. Each sample was cut into 1.0 g pieces using a knife that had been cleaned with soap and rinsed with MilliQ water beforehand. The samples were then stored in aluminum foil and were kept frozen until further analysis. All sample preparation steps were performed under a fume hood to minimize airborne contamination. Avoiding external contamination was necessary during the chemical analysis to confirm the optimal identification, through pyrolysis, of the added microplastics, thus validating the proposed preparative technique. Workers wore blue nitrile gloves and cotton lab coats during the experiments. Reagents, including potassium hydroxide (KOH) aqueous solutions of 1 M and 5 M, hydrogen peroxide (H2O2) at 5.4 M, iron (II) solution, and nitric acid (HNO3) at 65%, as well as solvents such as ethanol (purity > 98%), were filtered using Whatman qualitative filter paper (Grade 1, diameter 10 mm, 1 µm, Merck, Darmstadt, Germany) before use. To evaluate the effects of digestion agents on microplastics, polystyrene fluorescent microbeads (PS-MPs) with a standard diameter of 10 µm (Thermo Fisher Scientific, Waltham, MA, USA) were utilized. Additionally, Py–GC–MS analysis (Agilent 7890A, Santa Clara, CA, USA) was employed to assess whether the digestion process was able to successfully remove organic matter to, therefore, allow the chemical identification of microplastics, with the least possible interference. To assess whether the selected digestion approach enabled the identification of microplastics in cheese, standard polyethylene terephthalate and polystyrene microparticles (PET, maximum size 300 µm; PS, maximum size 150 µm, GoodFellow, Cambridge, UK) were utilized.

2.2. Sample Digestion

To determine the optimal digestion protocol, cheese samples underwent various chemical treatments, as outlined in Section 2.3. In summary, cheese samples weighing 1.0 g were treated with different digestion agents, including HNO3 (65%), H2O2 (5.4 M), KOH (1 and 5 M), and Fenton’s reagent. Experiments involving KOH and H2O2 were carried out at both room temperature (RT) and 50 °C. Digestion experiments were carried out using a stirring plate, with temperatures monitored using a thermometer. To conduct the experiments, samples were placed into pre-cleaned 100 mL glass bottles. Digestion agents were then allowed to act for 24–72 h, depending on the time required to break down visible organic matter particles.
Afterwards, solutions were filtered using glass fiber filters (Whatman, pore size 1.6 µm, diameter 47 mm) with a vacuum system, with the filters also being cleaned prior to filtration. In the case of alkaline digestions, 20 mL of ethanol was added before filtration to aid in the dissolution of fatty components. To calculate the percentage digestion efficiencies, the weights of the filters before filtration were recorded and were subsequently stored in Petri dishes. After filtration, the filters were allowed to dry using a dryer, and the weights were recorded again.

2.3. Experimental Design

The types of digestion agents and their respective concentrations were adapted from the digestive parameters found in the scientific literature, although they have not been applied to dairy matrices. Briefly, laboratory experiments were conducted following this protocol. The digestion agents tested included KOH at concentrations of 1 M [14] and 5 M, and H2O2 at 5.4 M, both at room temperature [15] and at 50 °C [16], for durations of 48 and 72 h, respectively. The digestion time was determined based on microscopic observations. In summary, given the lack of evidence and previous tests, the duration of digestion was determined in an initial experimental phase by observing filtrates at different digestion times (48 and 72 h) under a microscope to assess differences in the presence of residues or organic material microparticles. The goal was to identify the optimal contact time between the digestive agent and the sample to minimize the microplastics’ exposure to the digestive agent. Percentage digestive efficiencies (abbreviation: % DE) were assessed for each digestion reaction. HNO3 at 65% concentration was tested at room temperature [17], while Fenton’s reagent was carefully utilized under temperature control due to the exothermic nature of the reaction (maintained below 50 °C for 30 min) [18]. All experiments were conducted in triplicate. The effect of digestive agents on PS-MPs was also assessed. Consequently, only PS-MPs were subjected to the digestive agents for the required digestion duration. Solutions were filtered through glass fiber filters (Whatman, pore size 1.6 µm, diameter 47 mm) using a vacuum system. PS-MPs were then examined through microscopic observations to evaluate any changes induced by the digestive agents. Changes in size were analyzed using Capture 2.4 software, enabling the real-time measurement of particle diameter.

2.4. Microplastic Recovery Rate

Digestion agents that exhibited a favorable % DE (>95%) for cheese were further examined in terms of the percentage recovery rate (%RR) of microplastics. A 250 µL solution of PS-MPs, diluted (1/1000), was spiked onto cheese samples and was counted three times using an optical microscope. Subsequently, the samples underwent digestion using the selected protocols. The resulting solutions were filtered through glass fiber filters (Whatman, pore size 1.6 µm, diameter 47 mm) using a vacuum system.

2.5. Digestion Effects on Microplastics

PS-MPs were exposed to all digestion reagents investigated in this study. The duration of exposure for each agent matched the time required for organic matter digestion, as has previously been evaluated. Subsequently, PS-MPs were filtered and their sizes were analyzed through optical observations. The modifications in PS-MPs’ size were assessed for this purpose. To achieve this, the standard diameters of untreated and treated PS-MPs were confirmed using Capture 2.4 software. Specifically, the software’s measurement tool was calibrated prior to measuring the treated PS-MPs, using the untreated ones as a reference. Calibration involved using untreated PS-MPs to determine the microbeads’ diameter (Figure 1). A total of one hundred and sixteen (n = 116) microbeads were measured, and the measurements, along with the results, were automatically recorded in real-time on an Excel version 16.86 spreadsheet using the software.
An identical procedure was implemented for PS-MPs exposed to digestion reagents. One hundred and sixteen (n = 116) PS-MPs were measured for each digestion reagent. An Excel spreadsheet was automatically generated for each agent, containing the respective results of each measurement. Additionally, the color of microbeads was visually analyzed to evaluate the impact of digestion reagents by comparing them with untreated ones.

2.6. Py–GC–MS Conditions and Analyses

The goodness-of-fit and feasibility of the digestion protocol were confirmed through qualitative chemical analysis using Py–GC–MS. To evaluate whether the selected digestion approach (KOH 5 M at 50 °C for 48 h) enabled the identification of the chemical composition of microplastics, 0.1 µg g−1 of PET and PS standards were added to 1.0 g of cheese. In brief, polymer standard solutions were prepared by dissolving PET particles in 1,1,1,3,3,3-hexafluoro-2-propanol. Specifically, for the PET stock solution (1000 µg g−1), 5.0 mg of PET particles were weighed and mixed with 5 mL of 1,1,1,3,3,3-hexafluoro-2-propanol. PET standard solutions at concentrations of 10 and 1.0 µg g−1 were prepared by diluting the stock solution. Then, 50 µL of the 1000 µg g−1 solution were spiked into the sample. A stock solution of PS (1000 µg g−1) was prepared by dissolving 5.0 mg of PS particles in 5 mL of a mixture of dichloromethane and toluene (1:1 v/v). PS standard solutions at concentrations of 10 and 1.0 µg g−1 were prepared by diluting the stock solution. Subsequently, 50 µL of the 1000 µg g−1 solution were spiked into the sample. The sample was digested using KOH 5 M at 50 °C for 48 h, following the previously described method. The experiments were conducted in triplicate. Subsequently, the solutions were filtered using glass fiber filters (GF/F, Whatman, pore size 1.6 µm, diameter 47 mm) with a vacuum system, concentrating the filtrate only in the central part (thickness 1 mm, length 3 mm) of the GF/F filters. The filters were then analyzed using Py–GC–MS.
For the qualitative analysis of spiked PET, a pyrolyzer (CIS 6 Gerstel) was utilized. The temperature program for the CIS pyrolyzer was as follows: it was held at 70 °C for 0.1 min, then increased by 12 °C/s until reaching 600 °C, and the temperature was held for 4 min. The CIS pyrolyzer also allowed on-column injection. GC separation was performed using a Rxi-17Sil capillary column (30 m × 250 μm × 0.25 μm, Restek, Bellefonte, PA, USA). The GC temperature program was as follows: it was held at 90 °C for 1 min, then increased by 30 °C min−1 up to 250 °C, followed by an increase of 4 °C min−1 up to 330 °C, and was then held for 0 and 5 min, respectively. Helium was used as the gas carrier at a flow rate of 1.2 mL min−1. The liner was replaced at the end of each chromatographic analysis. The mass spectrometer was operated in EI-positive mode with an energy of 70 eV, scanning the m/z range from 29 to 400 at a rate of 7 scans s−1. The GC/MS transfer line, ion source, and quadrupole mass analyzer temperatures were set at 300 °C, 230 °C, and 150 °C, respectively.

2.7. Quality Control/Quality Assurance and Procedural Blanks

Reagents and solvents utilized in the experiments were filtered using 1 µm pore size filter paper from Whatman (Grade 1, qualitative filter, diameter 10 mm, Merck) to prevent external contamination. Glassware was rinsed three times with MilliQ ultrapure water (Water Purification System, 0.2 µm Capsule filter HMC-DPL-S, Sigma-Aldrich, St. Louis, MI, USA) prior to use and was covered with aluminum foil. All experimental procedures were performed inside a laminar flow hood, which was cleaned with ethanol before and after each use.

3. Results

3.1. Digestion Efficiency

% DE are summarized in Table 1.
The highest percentage of digestion efficiency (% DE) for cheese was achieved using KOH 5 M at 50 °C for 48 h (i.e., 97.5 ± 0.78%). Oxidation reactions, such as H2O2 and Fenton’s reagent, exhibited differing abilities in cheese digestion. Fenton’s reagent reduced organic matter by 87.3 ± 3.4%, while digestion with H2O2, both at room temperature and 50 °C, removed organic matter by 64.1 ± 3.8% and 67.3 ± 5.3%, respectively. Digestion with HNO3 at room temperature for 72 h removed 82.3 ± 1.2% of the organic matter. Regarding the digestion time, 48 h was sufficient for all tests except for HNO3 (65%).

3.2. Recovery Rate of Spiked PS-MPs

% RR was assessed for digestion procedures with a % DE higher than 95% (i.e., KOH 5 M at RT and 50 °C) (Figure 2).
% RR with KOH 5 M at RT for 48 h was 92.1 ± 2.5%, whilst KOH 5 M at 50 °C for 48 h was 98.5 ± 0.4%.

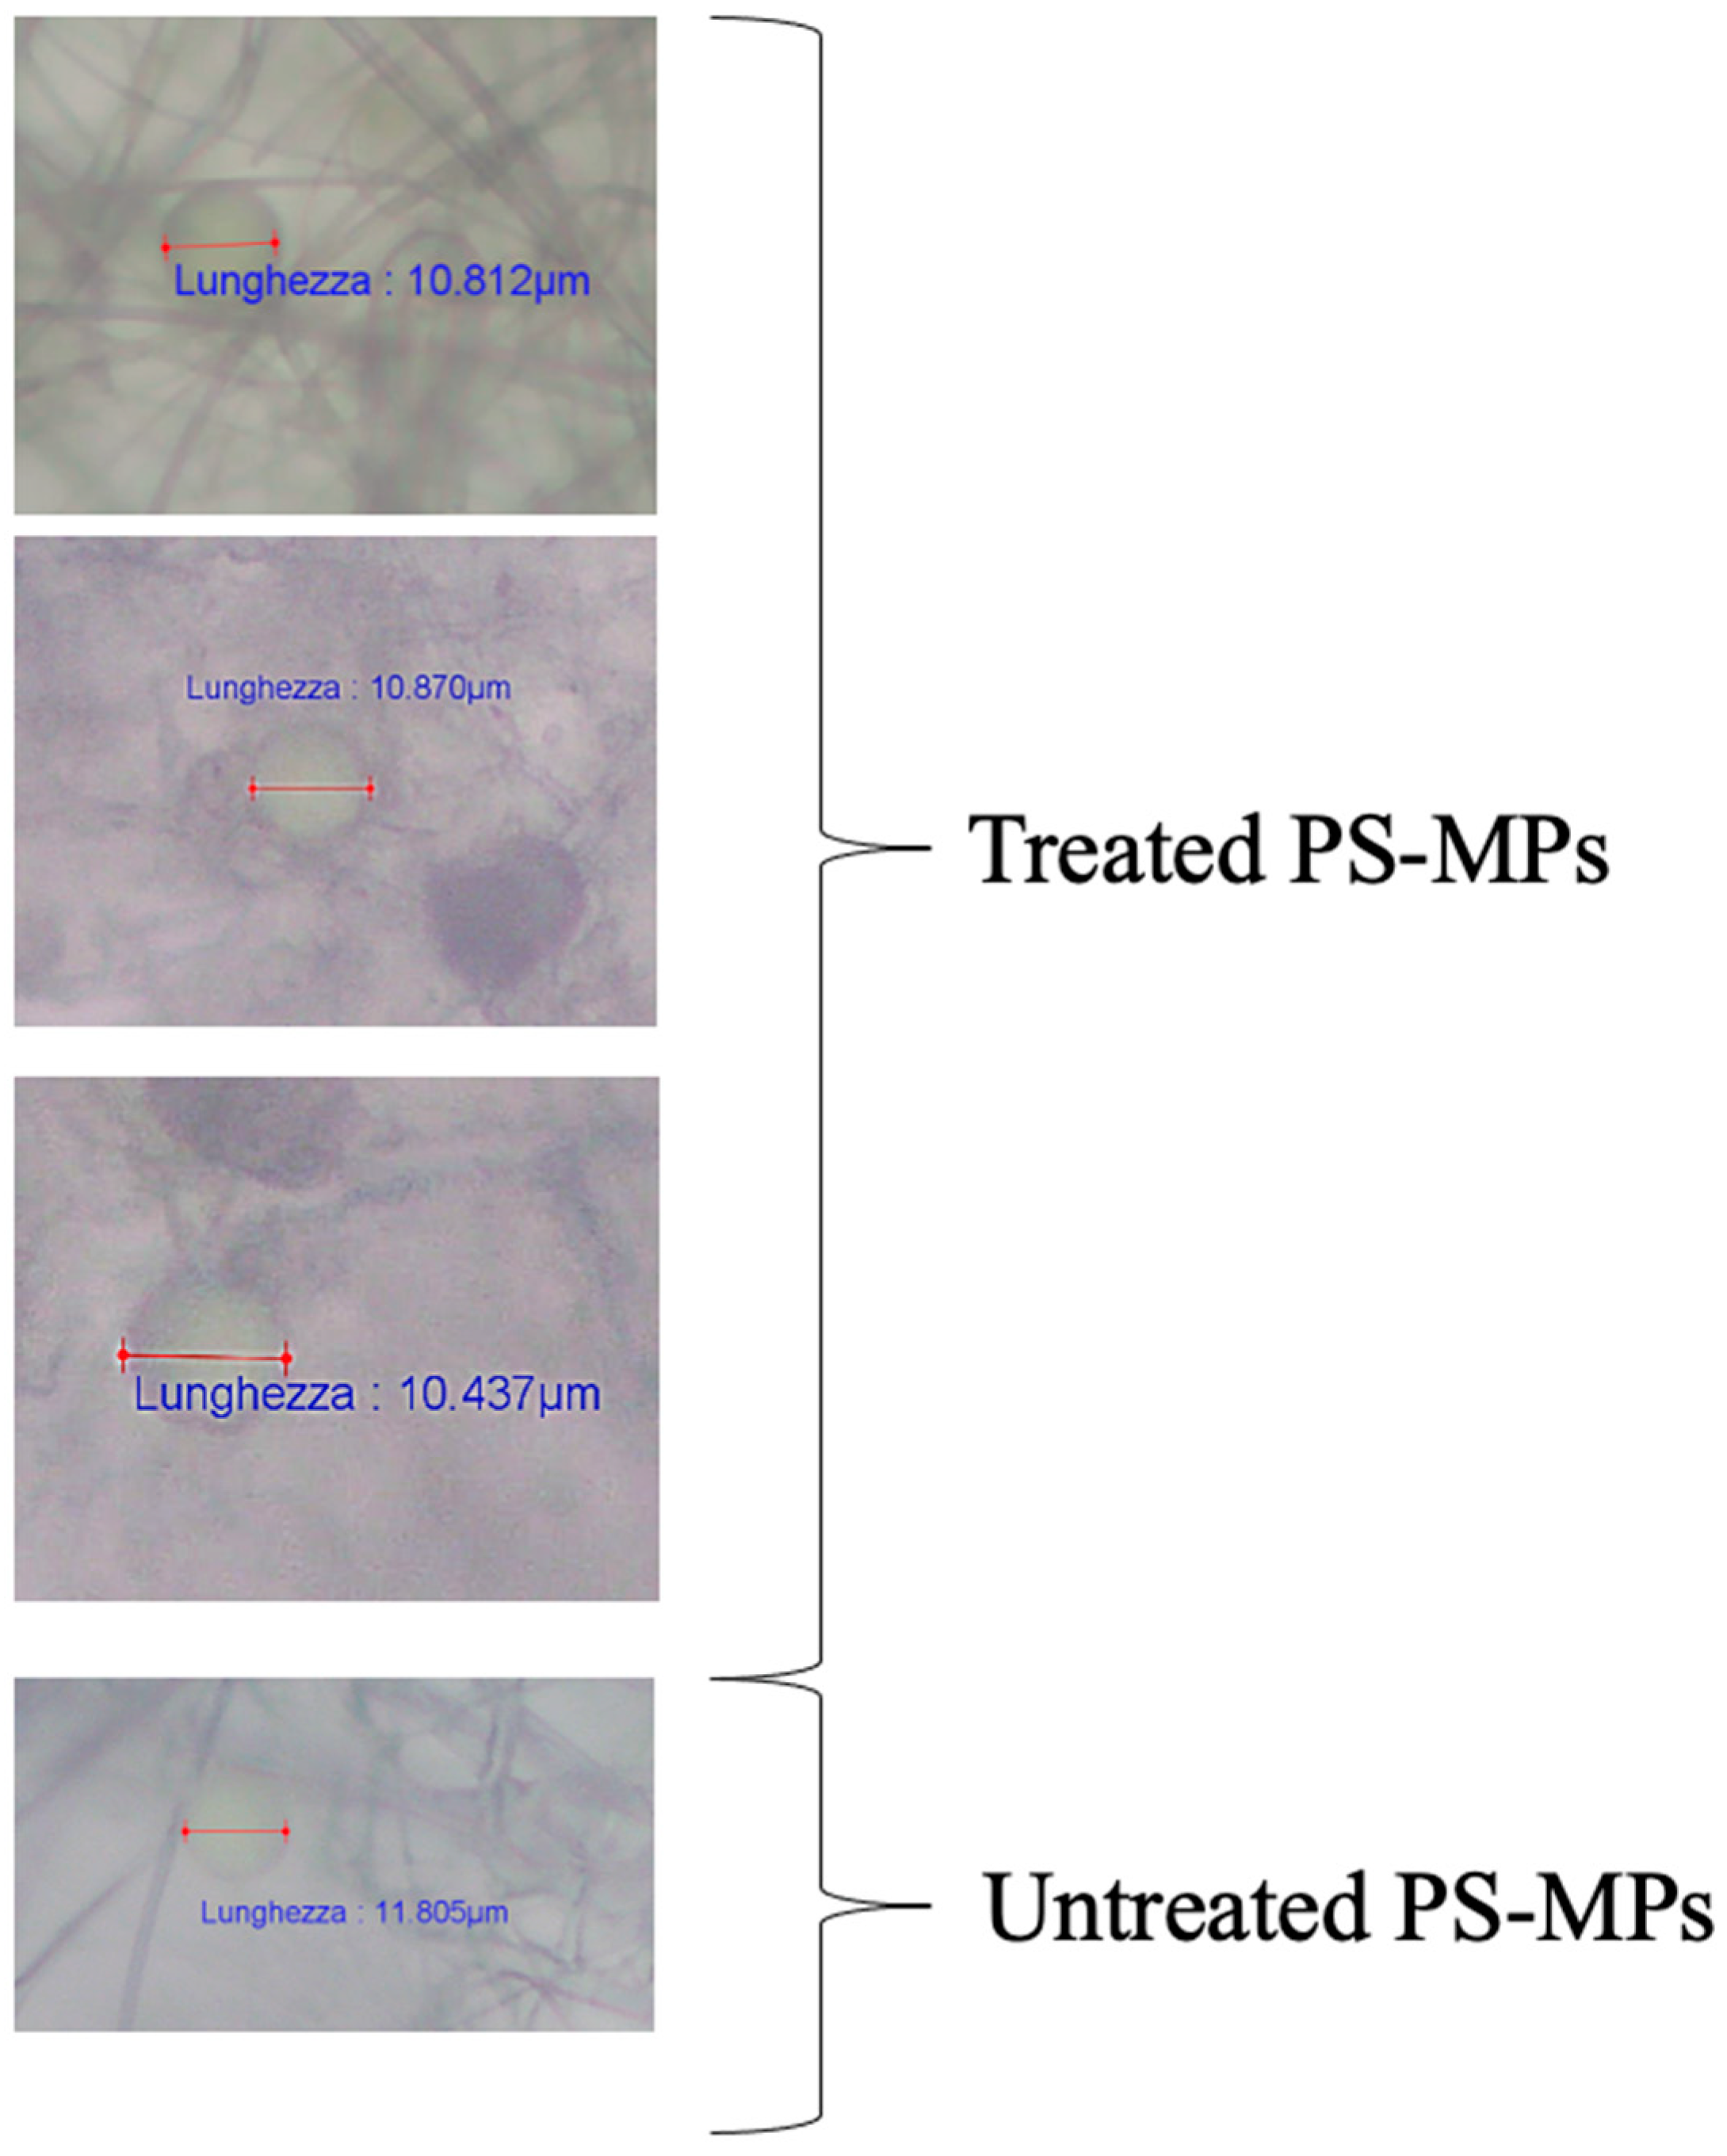
3.3. Effects of Digestion Agents on PS-MPs: Student’s t-Test

The effects of the selected digestion agents (i.e., KOH 5 M at room temperature and 50 °C for 48 h) were investigated. Untreated PS-MPs (n = 116) exhibited an average diameter of 11.9 ± 1.1 µm. PS-MPs treated with KOH 5 M at room temperature and 50 °C showed average diameters of 11.3 ± 0.2 µm and 11.1 ± 0.7 µm, respectively. A Student’s t-test was conducted to determine if the size reduction was statistically significant. Student’s t-test confirmed a statistically significant difference between treated and untreated PS-MPs (Table 2).
In both cases, the calculated t-values (5.5 and 4.7 for KOH 5 M at 50 °C and room temperature (RT), respectively) exceed the critical two-tailed t-values (1.98 and 1.97 for KOH 5 M at 50 °C and RT, respectively), indicating a slight statistical difference between the tested PS-MPs. Furthermore, the p-values for both cases are lower than the predetermined significance level (α) of 0.05. This suggests that the null hypothesis (i.e., no statistical difference) should be rejected.

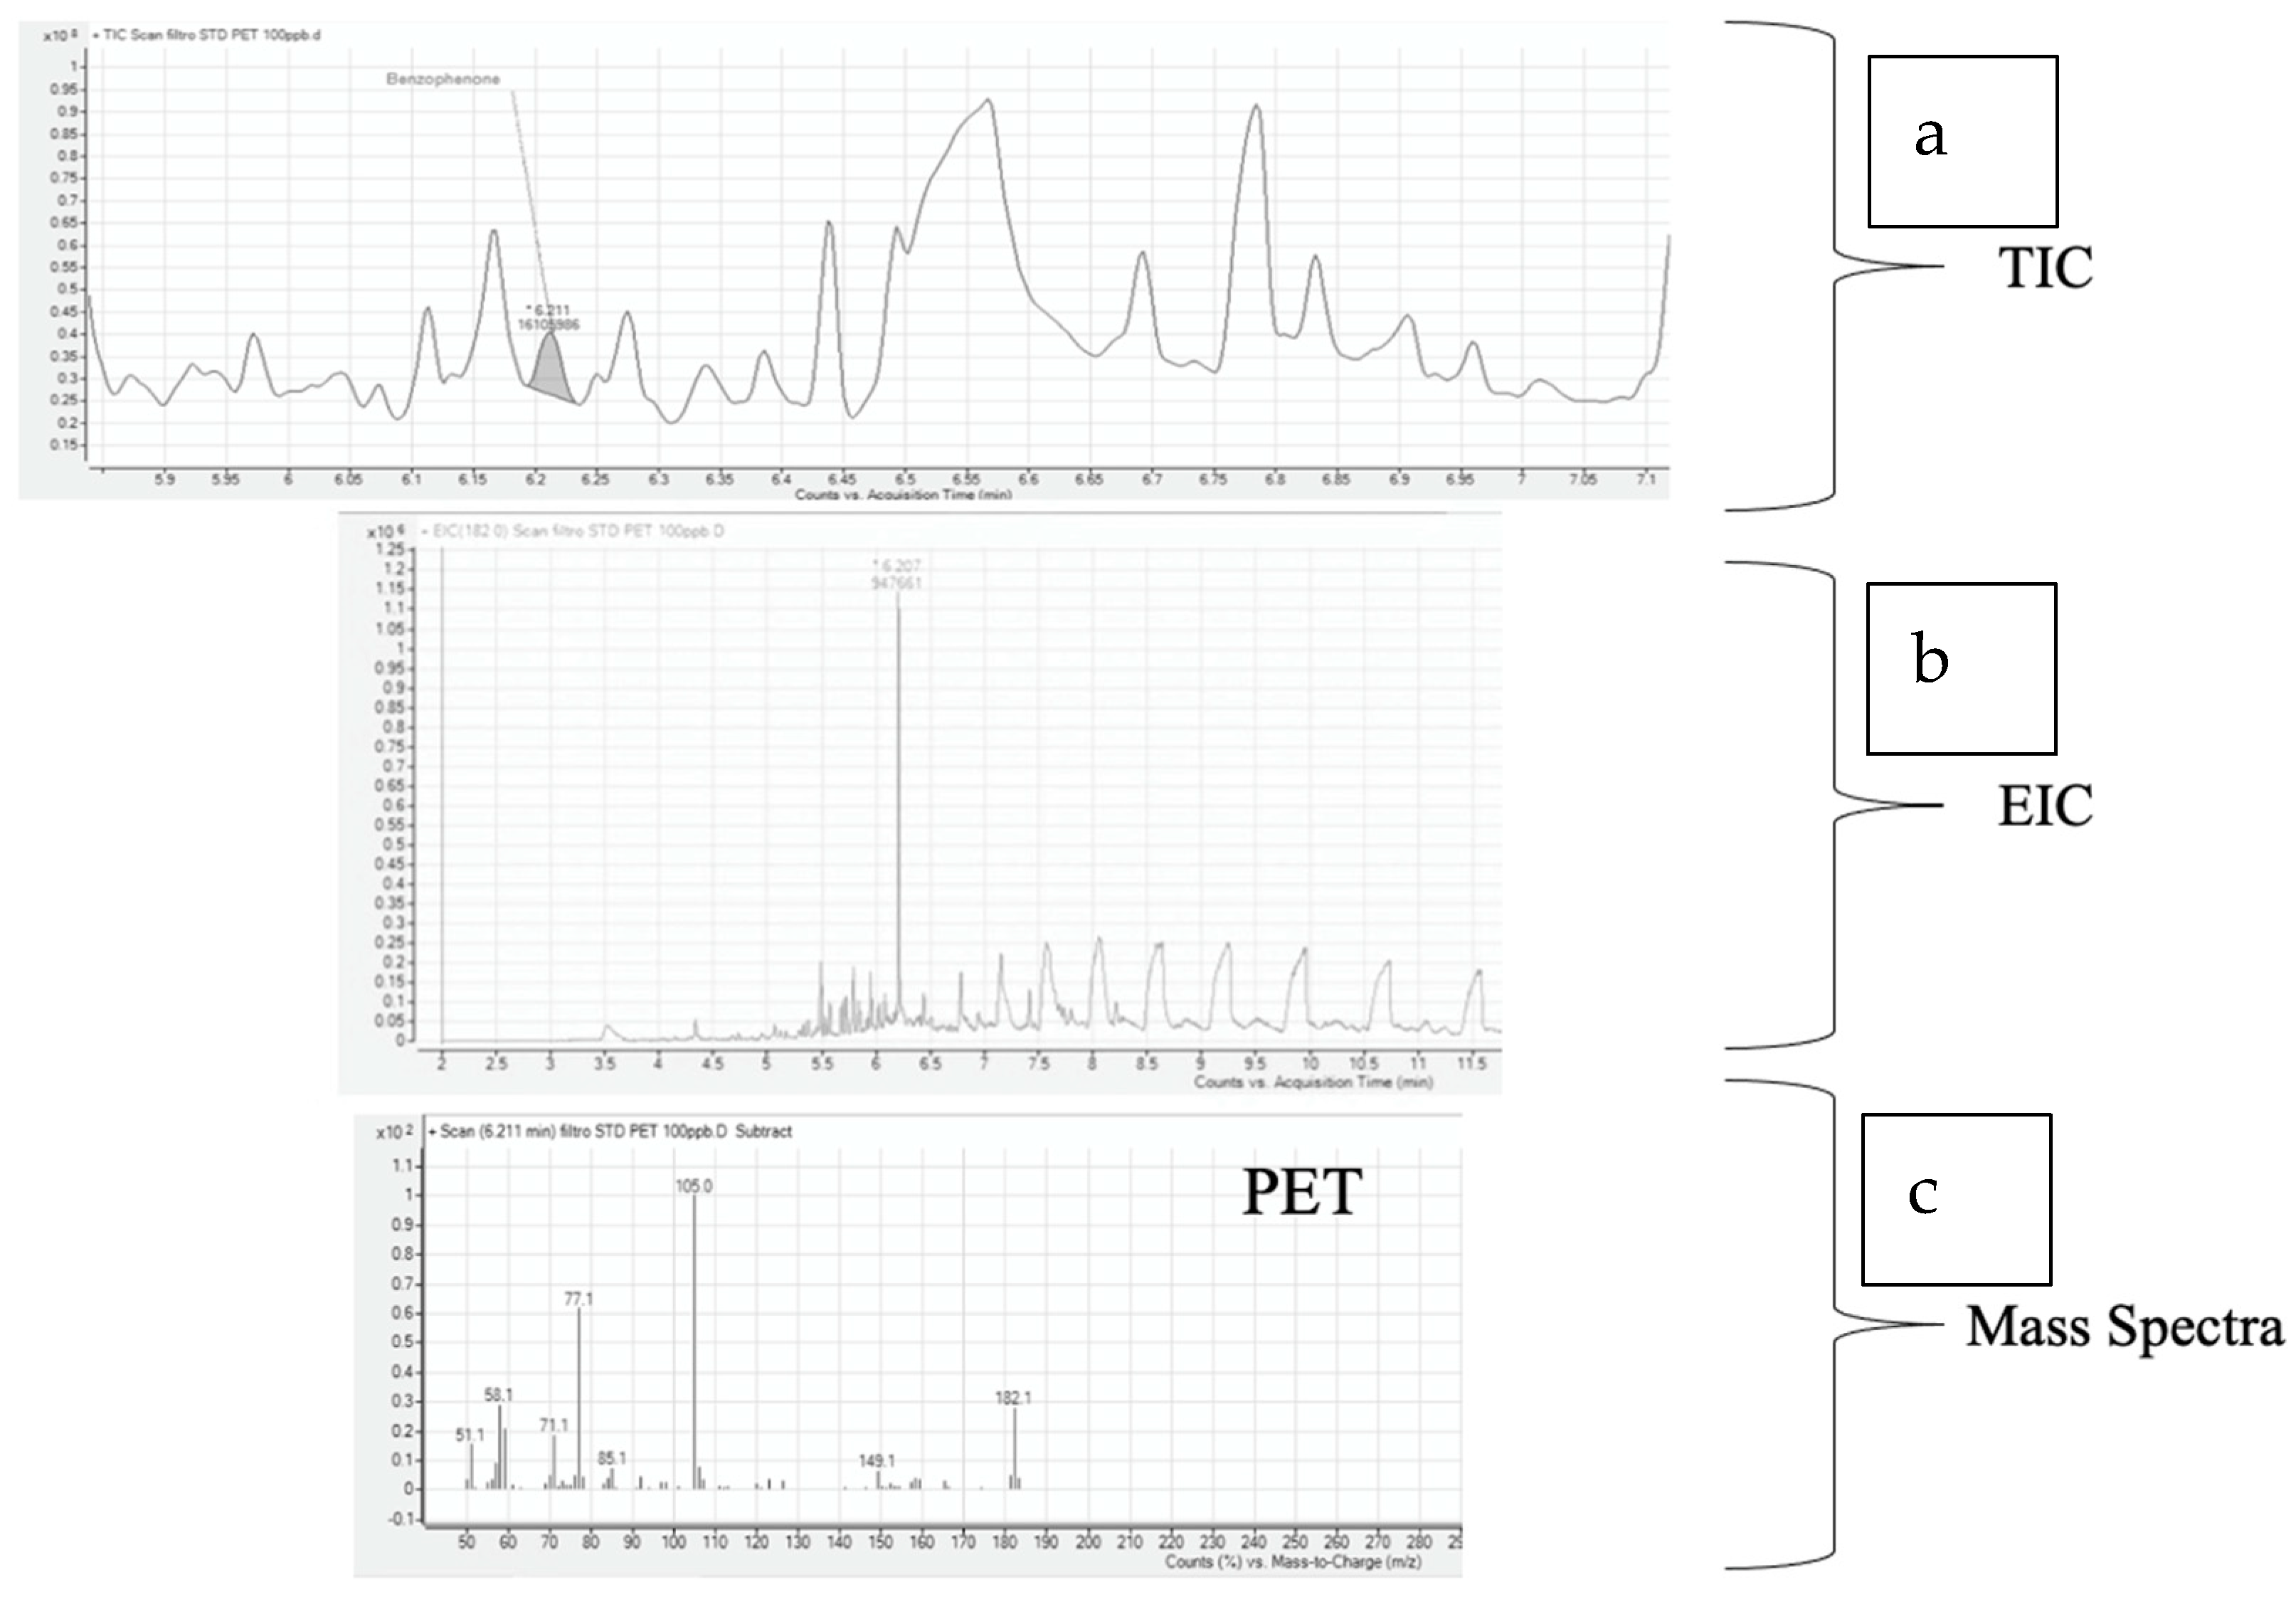
3.4. Qualification Using Py–GC–MS

For PET, benzophenone (m/z 182) was chosen as the characteristic pyrolysis product (Figure 3).
The pyrogram spectrum of the spiked cheese sample was primarily characterized by the peak corresponding to benzophenone, observed at approximately 6.2 min of retention time. The benzophenone spectrum obtained exhibited a matching rate of 70% with the spectrum from the NIST MS/MS Spectral Library. Regarding PS, the selected characteristic pyrolysis product was 2,4,6-triphenyl-1-hexene (m/z 91). However, this compound was not detected in Py–GC–MS analysis.

4. Discussion

Digestion processes are essential for isolating microplastics from food samples, but this methodology still requires optimization. Given the variability in food composition, it is necessary to determine the most suitable protocol for each type [19,20]. Notably, the digestion of cheese matrices has not yet been thoroughly investigated. A search using the keywords “MICROPLASTICS” and “CHEESE” on both Scopus and Google Scholar databases revealed only one study (n = 1), which focused on milk. In this study, da Costa Filho et al. (2021) [13] conducted the isolation of microplastics from milk using a two-step protocol involving multi-enzymatic and alkaline digestion. It was noted that foods with complex chemical compositions, such as milk and dairy products, may require the use of multiple reagents for organic matter removal [21]. However, an effective digestion protocol should ensure the highest percentage of digestion efficiency (% DE), using as few steps as possible. Further, a suitable digestion agent should ensure high efficiency in removing organic matter, while minimally impacting polymer integrity. In addition to this, a digestion can be considered efficient when no debris or organic matter is present, preventing interference with chemical analyses and allowing for the identification of pyrolysis products [22]. The multi-step digestion determines a higher risk of exposure to external contamination during sample preparation. Moreover, multi-step techniques, particularly those involving enzymes, are associated with high costs [23]. % DE can be affected by the chemical composition of the matrix. Therefore, the selection of digestion agents should be based on this consideration. Oxidizing digestion methods (such as H2O2 and Fenton’s reagent) are suitable for various chemical substrates, making them more versatile. Alkaline digestion techniques (e.g., KOH and sodium hydroxide) operate via saponification reactions and are therefore more effective on matrices with high levels of fats and proteins [24]. Our findings confirm that alkaline digestion is the most suitable method for removing organic matter from matrices rich in fats and proteins, such as cheese, compared to oxidizing approaches. It is important to specify that KOH was selected instead of sodium hydroxide because it has been shown to affect microplastics like PET and PS [22].
Furthermore, due to the fatty composition of cheese, ethanol (20 mL) was added to the digestate. This enhanced lipid dissolution, thereby facilitating filtration [25]. Sample preparation varies depending on the analytical approach used for the chemical identification of microplastics [26]. The constituents of organic matter influence the quantification of microplastics through visual observations and the detection of pyrolysis products. The quality of the Py–GC–MS spectrum depends on the percentage of organic matter removed. Indeed, it has been reported that Py–GC–MS analysis requires the complete isolation of microplastics from the organic matrix to minimize matrix effects and to pre-concentrate the microplastics [27,28].
In our study, digestion using an aqueous solution of 5 M KOH at 50 °C enabled the identification of PET through the detection of benzophenone (m/z 182). A comparison of the mass spectrum obtained with the reference spectrum from the NIST MS/MS Spectral Library indicated a compatibility of 70%. However, PS was not detected. The characteristic pyrolysis product of PS (i.e., 2,4,6-triphenyl-1-hexene, m/z 91) was not identified in the mass spectrum. It was observed that the peak intensity of styrene trimers (such as 2,4,6-triphenyl-1-hexene) could be affected by the pyrolysis process [29]. Specifically, styrene trimers are formed via secondary reactions of pyrolysis. Therefore, sub-optimal experimental conditions may hinder the formation of styrene trimers [30].
As previously reported, digestive methods should minimally impact microplastics, which is important for assessing their original sizes [22]. It is strongly recommended to balance plastic stability with organic removal, while considering safety and ease of use [23]. The experimental conditions used in preparative digestion techniques, particularly the choice of reagent and temperature, could lead to losses, damage, and degradation of microplastics [31]. Changes in the size of microplastics due to digestion should be carefully assessed, especially when investigating their adverse effects on the human body. Experimental evidence suggests that the transport of microplastics into human body systems largely depends on their size [32,33,34]. Studies on marine model organisms have indicated that the size of microplastics plays a crucial role in their impact on biological organisms. Smaller particles are more likely to exhibit toxic effects on organisms [35]. Therefore, the stability and resistance of microplastics to digestive treatments are crucial for accurately assessing their adverse effects on the human body. Regarding the negative effects of digestion solutions on microplastics, acidic approaches, particularly the use of high-concentration nitric acid (i.e., 65%, 69%), are not suitable for microplastic analysis. The scientific literature has reported aggressive effects of high-concentration nitric acid on polymers [36]. Experimental evidence has shown that polystyrene microplastics can fuse when treated with HNO3 (65%). Furthermore, small microplastics (i.e., 10–30 µm) may melt together [37], a finding confirmed by our research. Alkaline digestion performed with KOH 5 M at 50 °C for 48 h showed a slight reduction in the diameter of PS-MPs. No discoloration was recorded (Figure 4).
Among alkaline solutions, sodium hydroxide (NaOH) has been found to impact microplastics such as nylon, polyvinylchloride (PVC), polyethylene (PE), and PS. It has been suggested that both KOH and NaOH could affect the shape and size of polymers such as cellulose acetate (CA) and polyethylene terephthalate (PET) [38]. However, experimental evidence has shown that a 10% KOH aqueous solution at 60 °C did not alter the size of PET microfibers [39]. Regarding PS, the current understanding of it is conflicting. A study by Junhao et al. suggested that KOH concentrations higher than 10% (2 M) changed the color of PS microplastics [38], while Park et al. (2021) [40] found no such impacts [40]. Additionally, a study by Zou et al. [10] reported that KOH treatment (60 °C for 24 h) had a minor effect on PS fluorescent microbeads, resulting in a slight reduction in fluorescence. However, no investigation into size modifications was conducted [10].

5. Conclusions

The present study aims to propose a preparative approach for the identification of microplastics in cheese. The need to investigate and develop a method for cheese sample preparation prior to chemical analysis is crucial, given that the standardization of analytical methodologies for microplastic analysis is still lacking. The proposed preparative method is based on the optimization of cheese organic matter removal. Our findings suggest that KOH 5 M at 50 °C for 48 h is the most suitable approach for removing organic matter. Firstly, the effects of digestion conditions on PS microplastics have been tested; the results indicated a slight effect of KOH (5 M at 50 °C for 48 h) on PS microplastics. The % DE achieved was 97.5 ± 0.78%. The suitability of the proposed preparative method was then confirmed both by visually assessing the % RR (98.5 ± 0.4%) and by confirming the plastic nature of particles using Py–GC–MS. The spectra obtained confirmed the chemical identification of spiked microplastics. Finally, the preparative single-step method proposed appears to be fast, does not alter the shape and size of plastic microparticles and allows for their visual quantification and qualification using Py–GC–MS. The proposed preparative method could be used for the analyses of cheese by applying quantification using Py–GC–MS to reach a standardization of the results.

Author Contributions

Conceptualization, P.A. and C.D.F.; methodology, C.D.F., F.C. and A.I.; software, F.C.; validation, E.P., A.I. and F.G.; formal analysis, E.P. and F.G.; investigation, C.D.F.; resources, A.I.; data curation, F.C.; writing—original draft preparation, C.D.F.; writing—review and editing, P.A.; visualization, P.A.; supervision, P.A. All authors have read and agreed to the published version of the manuscript.

Funding

This research received no external funding.

Institutional Review Board Statement

Not applicable.

Informed Consent Statement

Not applicable.

Data Availability Statement

The data presented in this study are available on request from the corresponding author.

Acknowledgments

We would like to thank Monica Maio for her kind support in this work.

Conflicts of Interest

The authors declare no conflicts of interest.

References

  1. Wang, H.-P.; Huang, X.-H.; Chen, J.-N.; Dong, M.; Zhang, Y.-Y.; Qin, L. Pouring Hot Water through Drip Bags Releases Thousands of Microplastics into Coffee. Food Chem. 2023, 415, 135717. [Google Scholar] [CrossRef]
  2. Muhib, M.I.; Uddin, M.K.; Rahman, M.M.; Malafaia, G. Occurrence of Microplastics in Tap and Bottled Water, and Food Packaging: A Narrative Review on Current Knowledge. Sci. Total Environ. 2023, 865, 161274. [Google Scholar] [CrossRef] [PubMed]
  3. Rbaibi Zipak, S.; Muratoglu, K.; Buyukunal, S.K. Microplastics in Raw Milk Samples from the Marmara Region in Turkey. J. Consum. Prot. Food Saf. 2024, 19, 175–186. [Google Scholar] [CrossRef]
  4. Kaseke, T.; Lujic, T.; Cirkovic Velickovic, T. Nano- and Microplastics Migration from Plastic Food Packaging into Dairy Products: Impact on Nutrient Digestion, Absorption, and Metabolism. Foods 2023, 12, 3043. [Google Scholar] [CrossRef]
  5. Kutralam-Muniasamy, G.; Pérez-Guevara, F.; Elizalde-Martínez, I.; Shruti, V.C. Branded Milks—Are They Immune from Microplastics Contamination? Sci. Total Environ. 2020, 714, 136823. [Google Scholar] [CrossRef] [PubMed]
  6. Lin, Q.; Zhao, S.; Pang, L.; Sun, C.; Chen, L.; Li, F. Potential Risk of Microplastics in Processed Foods: Preliminary Risk Assessment Concerning Polymer Types, Abundance, and Human Exposure of Microplastics. Ecotoxicol. Environ. Saf. 2022, 247, 114260. [Google Scholar] [CrossRef]
  7. Sridharan, S.; Kumar, M.; Singh, L.; Bolan, N.S.; Saha, M. Microplastics as an Emerging Source of Particulate Air Pollution: A Critical Review. J. Hazard. Mat. 2021, 418, 126245. [Google Scholar] [CrossRef]
  8. He, Y.-J.; Qin, Y.; Zhang, T.-L.; Zhu, Y.-Y.; Wang, Z.-J.; Zhou, Z.-S.; Xie, T.-Z.; Luo, X.-D. Migration of (Non-) Intentionally Added Substances and Microplastics from Microwavable Plastic Food Containers. J. Hazard. Mat. 2021, 417, 126074. [Google Scholar] [CrossRef]
  9. Fadare, O.O.; Wan, B.; Guo, L.-H.; Zhao, L. Microplastics from Consumer Plastic Food Containers: Are We Consuming It? Chemosphere 2020, 253, 126787. [Google Scholar] [CrossRef]
  10. Zhou, Y.; Liu, X.; Wang, J. Characterization of Microplastics and the Association of Heavy Metals with Microplastics in Suburban Soil of Central China. Sci. Total Environ. 2019, 694, 133798. [Google Scholar] [CrossRef]
  11. Di Fiore, C.; Carriera, F.; Russo, M.V.; Avino, P. Are Microplastics a Macro Issue? A Review on the Sources of Contamination, Analytical Challenges and Impact on Human Health of Microplastics in Food. Foods 2023, 12, 3915. [Google Scholar] [CrossRef] [PubMed]
  12. Basaran, B.; Özçifçi, Z.; Akcay, H.T.; Aytan, Ü. Microplastics in Branded Milk: Dietary Exposure and Risk Assessment. J. Food Compos. Anal. 2023, 123, 105611. [Google Scholar] [CrossRef]
  13. Da Costa Filho, P.A.; Andrey, D.; Eriksen, B.; Peixoto, R.P.; Carreres, B.M.; Ambühl, M.E.; Descarrega, J.B.; Dubascoux, S.; Zbinden, P.; Panchaud, A.; et al. Detection and Characterization of Small-Sized Microplastics (≥ 5 Μm) in Milk Products. Sci. Rep. 2021, 11, 24046. [Google Scholar] [CrossRef] [PubMed]
  14. Alak, G.; Köktürk, M.; Atamanalp, M. Evaluation of Different Packaging Methods and Storage Temperature on MPs Abundance and Fillet Quality of Rainbow Trout. J. Hazard. Mat. 2021, 420, 126573. [Google Scholar] [CrossRef]
  15. Akoueson, F.; Sheldon, L.M.; Danopoulos, E.; Morris, S.; Hotten, J.; Chapman, E.; Li, J.; Rotchell, J.M. A Preliminary Analysis of Microplastics in Edible versus Non-Edible Tissues from Seafood Samples. Environ. Pollut. 2020, 263, 114452. [Google Scholar] [CrossRef] [PubMed]
  16. Zhang, D.; Fraser, M.A.; Huang, W.; Ge, C.; Wang, Y.; Zhang, C.; Guo, P. Microplastic Pollution in Water, Sediment, and Specific Tissues of Crayfish (Procambarus clarkii) within Two Different Breeding Modes in Jianli, Hubei Province, China. Environ. Pollut. 2021, 272, 115939. [Google Scholar] [CrossRef] [PubMed]
  17. Van Cauwenberghe, L.; Claessens, M.; Vandegehuchte, M.B.; Janssen, C.R. Microplastics Are Taken up by Mussels (Mytilus edulis) and Lugworms (Arenicola marina) Living in Natural Habitats. Environ. Pollut. 2015, 199, 10–17. [Google Scholar] [CrossRef]
  18. Sembiring, E.; Fareza, A.A.; Suendo, V.; Reza, M. The Presence of Microplastics in Water, Sediment, and Milkfish (Chanos chanos) at the Downstream Area of Citarum River, Indonesia. Water Air Soil Pollut. 2020, 231, 355. [Google Scholar] [CrossRef]
  19. Prata, J.C.; Da Costa, J.P.; Duarte, A.C.; Rocha-Santos, T. Methods for Sampling and Detection of Microplastics in Water and Sediment: A Critical Review. Trends Anal. Chem. 2019, 110, 150–159. [Google Scholar] [CrossRef]
  20. Duman, S.; Doyen, P.; Merveillie, P.; Andersson, N.; Bayeuil, R.; Grard, T.; Dehaut, A.; Duflos, G. Optimization of a Method Designed to Extract and Characterize Microplastics in Different Packaged Fish Products. Food Control 2023, 154, 110029. [Google Scholar] [CrossRef]
  21. Löder, M.G.J.; Imhof, H.K.; Ladehoff, M.; Löschel, L.A.; Lorenz, C.; Mintenig, S.; Piehl, S.; Primpke, S.; Schrank, I.; Laforsch, C.; et al. Enzymatic Purification of Microplastics in Environmental Samples. Environ. Sci. Technol. 2017, 51, 14283–14292. [Google Scholar] [CrossRef] [PubMed]
  22. Di Fiore, C.; Ishikawa, Y.; Wright, S.L. A Review on Methods for Extracting and Quantifying Microplastic in Biological Tissues. J. Hazard. Mat. 2024, 464, 132991. [Google Scholar] [CrossRef] [PubMed]
  23. Tuttle, E.; Stubbins, A. An Optimized Acidic Digestion for the Isolation of Microplastics from Biota-Rich Samples and Cellulose Acetate Matrices. Environ. Pollut. 2023, 322, 121198. [Google Scholar] [CrossRef] [PubMed]
  24. Bianchi, J.; Valente, T.; Scacco, U.; Cimmaruta, R.; Sbrana, A.; Silvestri, C.; Matiddi, M. Food Preference Determines the Best Suitable Digestion Protocol for Analysing Microplastic Ingestion by Fish. Mar. Pollut. Bull. 2020, 154, 111050. [Google Scholar] [CrossRef] [PubMed]
  25. Fraissinet, S.; Pennetta, A.; Rossi, S.; De Benedetto, G.E.; Malitesta, C. Optimization of a New Multi-Reagent Procedure for Quantitative Mussel Digestion in Microplastic Analysis. Mar. Pollut. Bull. 2021, 173, 112931. [Google Scholar] [CrossRef] [PubMed]
  26. Lee, S.-Y.; An, J.; Kwon, J.-H. Sequential Quantification of Number and Mass of Microplastics in Municipal Wastewater Using Fourier-Transform Infrared Spectroscopy and Pyrolysis Gas Chromatography-Mass Spectrometry. Environ. Pollut. 2023, 336, 122452. [Google Scholar] [CrossRef]
  27. Lauschke, T.; Dierkes, G.; Ternes, T.A. Challenges in the Quantification of Poly(Ethylene Terephthalate) Microplastics via Thermoanalytical Methods Posed by Inorganic Matrix Components. J. Anal. Appl. Pyrolysis 2023, 174, 106108. [Google Scholar] [CrossRef]
  28. La Nasa, J.; Biale, G.; Fabbri, D.; Modugno, F. A Review on Challenges and Developments of Analytical Pyrolysis and Other Thermoanalytical Techniques for the Quali-Quantitative Determination of Microplastics. J. Anal. Appl. Pyrolysis 2020, 149, 104841. [Google Scholar] [CrossRef]
  29. Ishimura, T.; Iwai, I.; Matsui, K.; Mattonai, M.; Watanabe, A.; Robberson, W.; Cook, A.-M.; Allen, H.L.; Pipkin, W.; Teramae, N.; et al. Qualitative and Quantitative Analysis of Mixtures of Microplastics in the Presence of Calcium Carbonate by Pyrolysis-GC/MS. J. Anal. Appl. Pyrolysis 2021, 157, 105188. [Google Scholar] [CrossRef]
  30. Fabbri, D.; Rombolà, A.G.; Vassura, I.; Torri, C.; Franzellitti, S.; Capolupo, M.; Fabbri, E. Off-Line Analytical Pyrolysis GC–MS to Study the Accumulation of Polystyrene Microparticles in Exposed Mussels. J. Anal. Appl. Pyrolysis 2020, 149, 104836. [Google Scholar] [CrossRef]
  31. Munno, K.; Helm, P.A.; Jackson, D.A.; Rochman, C.; Sims, A. Impacts of Temperature and Selected Chemical Digestion Methods on Microplastic Particles. Environ. Toxicol. Chem. 2018, 37, 91–98. [Google Scholar] [CrossRef] [PubMed]
  32. Makhdoumi, P.; Pirsaheb, M.; Amin, A.A.; Kianpour, S.; Hossini, H. Microplastic Pollution in Table Salt and Sugar: Occurrence, Qualification and Quantification and Risk Assessment. J. Food Compos. Anal. 2023, 119, 105261. [Google Scholar] [CrossRef]
  33. Barboza, L.G.A.; Dick Vethaak, A.; Lavorante, B.R.B.O.; Lundebye, A.-K.; Guilhermino, L. Marine Microplastic Debris: An Emerging Issue for Food Security, Food Safety and Human Health. Mar. Pollut. Bull. 2018, 133, 336–348. [Google Scholar] [CrossRef] [PubMed]
  34. Smith, M.; Love, D.C.; Rochman, C.M.; Neff, R.A. Microplastics in Seafood and the Implications for Human Health. Curr. Environ. Health Rep. 2018, 5, 375–386. [Google Scholar] [CrossRef]
  35. Mattsson, K.; Johnson, E.V.; Malmendal, A.; Linse, S.; Hansson, L.-A.; Cedervall, T. Brain Damage and Behavioural Disorders in Fish Induced by Plastic Nanoparticles Delivered through the Food Chain. Sci. Rep. 2017, 7, 11452. [Google Scholar] [CrossRef]
  36. Monteiro, S.S.; Pinto Da Costa, J. Methods for the Extraction of Microplastics in Complex Solid, Water and Biota Samples. Trends Environ. Anal. Chem. 2022, 33, e00151. [Google Scholar] [CrossRef]
  37. Dehaut, A.; Cassone, A.-L.; Frère, L.; Hermabessiere, L.; Himber, C.; Rinnert, E.; Rivière, G.; Lambert, C.; Soudant, P.; Huvet, A.; et al. Microplastics in Seafood: Benchmark Protocol for Their Extraction and Characterization. Environ. Pollut. 2016, 215, 223–233. [Google Scholar] [CrossRef]
  38. Junhao, C.; Xining, Z.; Xiaodong, G.; Li, Z.; Qi, H.; Siddique, K.H.M. Extraction and Identification Methods of Microplastics and Nanoplastics in Agricultural Soil: A Review. J. Environ. Manag. 2021, 294, 112997. [Google Scholar] [CrossRef]
  39. Thiele, C.J.; Hudson, M.D.; Russell, A.E. Evaluation of Existing Methods to Extract Microplastics from Bivalve Tissue: Adapted KOH Digestion Protocol Improves Filtration at Single-Digit Pore Size. Mar. Pollut. Bull. 2019, 142, 384–393. [Google Scholar] [CrossRef]
  40. Park, H.; Park, B. Review of Microplastic Distribution, Toxicity, Analysis Methods, and Removal Technologies. Water 2021, 13, 2736. [Google Scholar] [CrossRef]
Figure 1. Measurement of untreated fluorescent microbeads using Capture 2.4 software.
Applsci 14 05621 g001
Figure 2. % RR and standard deviation (SD) of PS-MPs spiked on cheese digested with KOH 5 M RT and KOH 5 M at 50 °C.
Applsci 14 05621 g002
Figure 3. (a) Pyrograms of cheese samples with the peak of benzophenone labeled; (b) EIC mass spectrum of benzophenone; (c) the mass spectrum of benzophenone (m/z 182) detected in spiked cheese samples was chosen as the characteristic pyrolysis product.
Applsci 14 05621 g003
Figure 4. PS-MPs treated with KOH 5 M at 50 °C for 48 h and standard ones. Images were obtained using Capture 2.0 software.
Applsci 14 05621 g004
Table 1. % DE of agents tested. Results of % DE are obtained from three experimental trials.
Digestion ReagentTemperature/TimeConcentrationDigestion Efficiency
KOH50 °C for 48 h5 M97.5 ± 0.8%
KOHRT for 48 h5 M96.7 ± 2.6%
KOH50 °C for 48 h1 M91.6 ± 1.5%
KOHRT for 48 h1 M89.7 ± 2.1%
Fenton’s Reagent<50 °C for 20–30 min-87.3 ± 3.4%
HNO3RT for 72 h65%82.3 ± 1.2%
H2O250° C for 48 h30%67.3 ± 5.3%
H2O2RT for 48 h30%64.1 ± 3.8%
Table 2. Student’s t-test results of PS-MPs treated and untreated with KOH 5 M at RT and 50 °C for 24 h in both experiments.
Untreated PS-MPsKOH 5 M 50 °C 24 hKOH 5 M RT 24 h
Mean11.9 ± 1.1 µm11.1 ± 0.7 µm11.3 ± 0.2 µm
Observations116116116
Stat t 5.54.7
Two-tailed P 2.30 × 10−74.22 × 10−6
Critical two-tailed t 1.981.97
Disclaimer/Publisher’s Note: The statements, opinions and data contained in all publications are solely those of the individual author(s) and contributor(s) and not of MDPI and/or the editor(s). MDPI and/or the editor(s) disclaim responsibility for any injury to people or property resulting from any ideas, methods, instructions or products referred to in the content.

