Abstract
Water quality assessment stands as a fundamental step in water resource management. In addition to substances and organisms present in the water, land use and land cover are two factors also affecting water quality. This study analyzed the correlation and influence between water quality and land use and land cover in the Miranda River Basin (MRB) and the natural wetlands in the Pantanal Biome. Using a watershed-wide approach, results suggested that water quality management policies can be considered in terms of sub-basins (smaller planning units). The Water Quality Index (WQI) was considered GOOD or EXCELLENT throughout the MRB. It was observed that the natural wetlands have the capacity to contribute to improving the WQI, with reductions in thermotolerant coliforms and turbidity; however, high values were found for thermotolerant coliforms, a temporal increasing trend of biochemical oxygen demand (BOD), and a reduction in dissolved oxygen and total phosphorus. Conversely, in these flooded areas, trends of a decrease in dissolved oxygen and an increase in BOD levels were found. Natural wetlands play important hydrological and ecological roles in water quality, storing, removing, and cycling nutrients. They are highly relevant areas for defining watershed management and conservation strategies, environmental protection, and providing ecosystem services.
1. Introduction
The demand for water, both in quantitative and qualitative terms, is increasingly significant, taking into consideration population growth and economic development. Therefore, it is essential to manage water resources and other natural resources to guarantee access to water under suitable usage conditions [1]. Given this importance, the United Nations (UN) within the framework of Agenda 2030 prioritizes drinking water and sanitation as one of the 17 Sustainable Development Goals (SDGs) for a global sustainable development agenda by 2030. SDG 6 aims to ensure the availability and sustainable management of water and sanitation for all. Its main objectives involve improving water quality, integrated water resource management, universal access to basic sanitation, water use efficiency, and the protection and restoration of aquatic ecosystems such as forests, rivers, lakes, aquifers, and wetlands [2]. The assessment of water quality and mitigation of major sources of pollution are two of the pillars adopted by Brazil to fulfill SDG 6. This assessment is one of the steps in water resources management and is carried out through monitoring physical, chemical, and microbiological parameters via measurements of dissolved substance concentrations, physical properties, and analysis of pathogenic microorganisms [3].
The spatial distribution of land use is a key factor that affects water quality, where industrial, urban, and agricultural land uses generally pose relatively high pollution risks compared to other types of land use such as forests and wetlands [4]. In addition to land use, water quality can also be influenced by quantity, as it directly depends on the amount of water available to dissolve, dilute, and transport substances, whether beneficial or harmful to living organisms [5]. Hence, water quality may be perceived as the outcome of both natural processes and human activities within the watershed, with land use and cover therein acting as determining factors. Understanding its relationship with land use and cover can be useful for identifying potential risks to water quality and coordinating water resource management with other uses of environmental resources [3].
The conceptual model for analyzing the relationship between land use and water quality involves selecting a study area, selecting monitoring points, obtaining land use and water quality data, organizing a database, defining the scale of analysis, selecting appropriate mathematical models, running models, and analyzing results and reference parameters [6,7]. Understanding the relationship between land use and water quality is most easily achieved through statistical techniques [8,9]. The most common statistical techniques used are Correlation Coefficients, Least Squares Method, Weighted Geographic Regression, Bayesian Hierarchical Linear Regression, Multiple Linear Regression, Stepwise Multiple Regression, Mixed Effect Linear Model, Partial Least Squares Regression, Principal Component Analysis, and Redundancy Analysis [8,9,10].
The impacts of land use and land cover on water quality are mainly assessed at three different spatial scales: sub-basin (catchment areas), riparian zone or parallel marginal zone (buffers), and point (concentric circles). According to Mello et al. [10], most studies adopt only one of these scales, but recently studies have been conducted using a multiscale approach, adopting more than one scale at the same time, showing that human activities at different scales lead to different impacts on water quality [6,10]. The optimal spatial scale, from a statistical perspective of correlation between land use and water quality, still varies from case to case, due to the peculiar characteristics of each river basin, the intensity of human interference, and the accuracy of the data. Thus, more research is needed to quantify the effect of different scales of land use on water quality to improve water resource management [4,6,9,10].
Understanding the relationship between land use and water quality would help assess water quality in unmonitored basins, as monitoring is often costly and time-consuming. Additionally, this knowledge would provide guidelines for watershed managers and policymakers to prioritize future land use development [8]. Thus, conducting an analysis of the relation between water quality and different types of land use and cover is an important step in the management of natural resources, developing conversion strategies, and guiding the sustainable use of these resources. In this regard, studies have analyzed the influence of land use and cover on water quality through multiple approaches; utilizing correlation coefficients between quality and land use [11], comparative analysis between input and output [12], through the use of regression equations [7], and multivariate analysis [6]. Although many approaches are being evaluated to analyze the influence of land use on water quality, most studies rely on limited time series data, often from only a single year or a single monitoring point, or few parameters. The MRW has a monitoring network with 28 stations distributed across the main rivers of the basin, as well as a quality and consistent historical data series available to the general public. However, few studies are reported with an emphasis on this specific area. Overall, there are still few studies on the capacity of removal/retention of substances in natural wetland areas of tropical and subtropical regions, especially in South America [13]. The fact is that the number of parameters and the monitoring frequency have been continuously expanded, generating water quality data from an important transition region between the Pantanal and Cerrado Biomes, as it is also located in the transition region from the Plateau to the Pantanal Plain. Therefore, analyzing the relationship between land use and water quality by jointly considering the temporal dimension with the spatial dimension is essential to understand the dynamics of water quality and land use in the region’s natural wetlands.
The objective of this study was to analyze the correlation between land use and land cover and the quality of surface waters in a natural wetland area in the MRW, in Mato Grosso do Sul, Brazil. For that purpose, the most relevant quality parameters were identified (key factors), along with the dynamics of substance concentrations along the main watercourses of the basin. Additionally, the study aimed to analyze the influence of natural wetland areas on water quality, considering how these areas are capable of improving water quality.
2. Materials and Methods
2.1. Study Area
The study area is the MRW and its natural wetland area. The watershed covers nearly 43,000 km2 with its headwaters in the Plateau area (Cerrado Biome) and its mouth in a portion of flooded area in the Pantanal Biome (Figure 1). In the MRW, there are a total of 28 monitoring points distributed along the main streams and rivers of the basin.
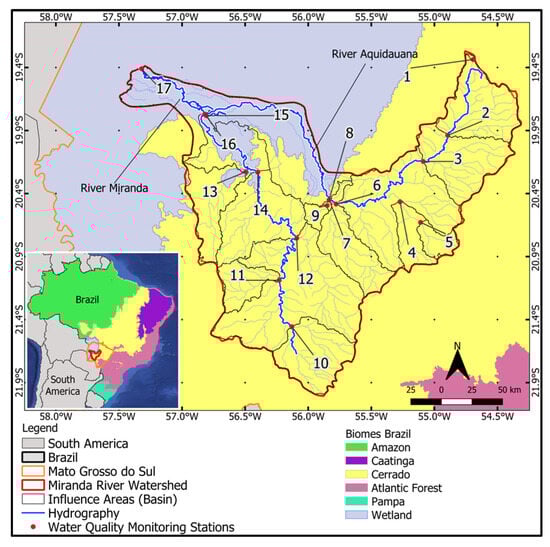
Figure 1.
Miranda River Watershed with selected Water Quality Monitoring Stations (Sub-basins: 1–17) and the natural wetland area.
The Miranda River Watershed (MRW) is one of the main hydrographic regions within the Pantanal Biome, located in the state of Mato Grosso do Sul, Brazil, and entirely falls within the Upper Paraguay Basin (UPB). It is formed by the Miranda River as its main course and the Aquidauana River and is situated in the transition zone between the Cerrado and Pantanal biomes, as well as the transition from the Plateau to the Pantanal Plain. Natural wetland areas are environments with high biodiversity associated with permanently or seasonally flooded areas. They are responsible for groundwater recharge due to their slow flow and long water retention time above ground, serving as “buffer zones” upstream and downstream of their territory, slowing down water flow and nourishing other ecosystems during dry periods. These areas retain large amounts of sediment and chemicals, improving water quality and the entire biological dynamics downstream. A considerable amount of pollutants that enter wetland areas are captured by vegetation and microorganisms or adhere to suspended particles. Consequently, sedimentation in wetlands contributes positively to water quality [14].
2.2. Delimitation of Influence Areas
For the analysis of land use and cover and water quality, the MRW was subdivided into 17 sub-basins. For that, the 28 monitoring stations existing in the MRW were rearranged into these 17 Influence Areas (IA), where monitoring stations very close to each other along the same watercourse were grouped into the same IA. They were thus considered IA in relation to the location of water quality monitoring stations along the main watercourses of the basin. The spatial scale used in this study is the “sub-basin” scale. This scale was employed for analyzing variations in water quality parameters and their relationship with land use and cover (correlation coefficient). These IA or sub-basins were delineated considering the “theoretical outlet” as the 17 main water quality monitoring stations, indicating the upstream influence area of that point.
2.3. Land Use and Land Cover in the Miranda River Watershed
For the assessment of land use and land cover in the MRW, multitemporal data from the Collection 6.0 of Land Cover and Use from MapBiomas from the years 2005 to 2018 were used [15] for the entire watershed and for the 17 IA. The data was provided by MapBiomas and accessed through the Google Earth Engine platform in raster structure (TIFF format), with a spatial resolution of 30 m where each pixel has an integer numerical value corresponding to a specific type of land use and land cover. MapBiomas utilizes a total of 25 thematic classes related to land use and land cover for the entire national territory. In the study area, the original classes used by MapBiomas were adapted to seven thematic classes of land use and land cover in order to simplify and reduce the number of variables in the study: Native Vegetation, Wetlands, Agriculture (temporary or perennial), Pasture, Urban Area, Non-Vegetated Area, and Water Bodies.
The MapBiomas classes labeled “Forest Formation”, “Savanna Formation”, and “Grassland Formation” were grouped into the class “Native Vegetation.” Classes with anthropic crops (perennial or temporary) such as “Planted Forests”, “Soybeans”, “Sugarcane, and “Other Temporary Crops” were adapted to the “Agriculture” class. The “Pasture” class from MapBiomas remained with the denomination “Pasture,” similarly to the classes of “Wetlands”, “Other Non-Vegetated Areas”, “Urban Infrastructure”, and “Rivers and Lakes” adopted by MapBiomas were renamed to “Wetlands”, “Non-Vegetated”, “Urbanized Area”, and “Water Bodies”, respectively (Table 1).

Table 1.
Land use classes adapted from MapBiomas [15] and the respective MapBiomas numerical codes.
2.4. Water Quality Data Collection
The historical series of water quality data was obtained through consultation of the “Monitoring Reports of Surface Water Quality in Mato Grosso do Sul” available on the IMASUL database [16]. The study period comprised data from the year 2005 to the year 2018. This time frame was chosen due to the consistency of the data, as from the year 2005, the main parameters began to be systematically and continuously analyzed, with quarterly and/or semiannual collections until the year 2018, when the data from the historical series were already fully processed. For the analysis of temporal and spatial variation of water quality in the MRW, the annual average and standard deviation of each water quality parameter were calculated in the 17 proposed Influence Areas in the study.
Eight water quality parameters and Water Quality Index (WQI) [17] (Equation (1)) with consistent data from 2005–2018 were analyzed. The parameters were also analyzed considering the reference values for the classification of water bodies for Class 2 (Table 2).
Table 2.
Quality parameters and reference values for Class 2 classification Deliberation CECA N°. 36/2012 [18].
The CETESB WQI [17] is calculated by the weighted product of the water qualities corresponding to the variables that make up the index. The following formula is used (Equation (1)):
WQI is Water Quality Index, a number between 0 and 100; qi: quality of the i-th parameter, a number between 0 and 100, obtained from the respective “average quality variation curve”, based on its concentration or measurement; and wi: weight corresponding to the i-th parameter, a number between 0 and 1, assigned based on its importance for the overall quality conformation [17]. The sum of wi is equal to 1, based on Equation (2).
2.5. Correlation between Land Use and Land Cover and Water Quality
Correlations were calculated between land use classes and water quality parameters. Initially, the Overall Correlation was calculated considering the entire MRW, and subsequently, individual correlations were calculated considering each of the 17 Influence Areas. For each IA, the total area (ha) value of the respective land use, for each period (month–year), was compared with the water quality values. The monitoring stations have the respective IA, according to the water quality data and the land use. To determine the correlations between water quality variables and land use and land cover classes, the Shapiro–Wilk normality test was applied to the water quality dataset. A significance level of p-value < 0.05 was adopted for the hypothesis that the dataset follows a normal distribution. Upon analyzing the dataset using the Shapiro–Wilk method, it was found that the parameters did not exhibit a normal distribution around their means. Thus, the Spearman’s Rank Correlation Coefficient (⍴) was adopted to measure the degree of correlation between the multitemporal land use and land cover data and the water quality data (Equation (3)).
where d is the difference between the positions of corresponding values of X and Y; n is the number of pairs of data values.
The Spearman’s Rank Correlation Coefficient measures the degree of linear correlation between two non-parametric variables. The value of ⍴ ranges from −1 to +1, where values closer to +1 indicate a perfect positive correlation between two variables, meaning that the units of the variables increase together; values closer to −1 indicate a perfect negative correlation, as one variable increases, the other decreases; and values closer to 0 indicate that both variables are not linearly dependent on each other.
2.6. Influence of Wetlands on Water Quality in the Miranda River Watershed
The analysis of the influence of wetlands on water quality was carried out based on monitoring stations located within the delineation of the Pantanal Biome according to IBGE [22]. In this region, the main land use and land cover class corresponds to wetlands formed by characteristic flooded fields of the Pantanal biome. Monitoring stations located on the Aquidauana River and Miranda River, in the Pantanal area and its vicinity, were considered (Table 3). These stations were subdivided into START stations, positioned at the entrance of the Pantanal (upstream); INTERMEDIATE, those stations in the middle part of the watercourses present in the Pantanal of the MRW; and at the MOUTH of the Miranda River with the Paraguay River (Figure 2).
Table 3.
Existing water quality monitoring stations in the natural wetland, in the Pantanal Biome of the Miranda River watershed.
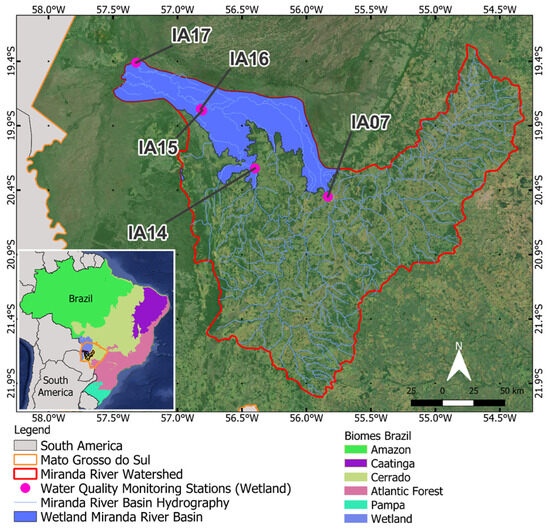
Figure 2.
Monitoring stations in the natural wetland area of the Miranda River watershed, in the Pantanal Biome (IA: Influence Areas).
The influence of wetlands was analyzed by comparing the annual mean values and trends of each water quality parameter at START (entrance), INTERMEDIATE (midstream), and MOUTH (exit) points, considering the dry season (April to October) and rainy season (November to March).
3. Results and Discussion
3.1. Changes in Land Use and Land Cover in the Miranda River Watershed
Over the analyzed period, the areas of Native Vegetation decreased from 1,695,580.20 hectares to 1,558,072.61 hectares, representing a decrease of approximately 8.11% over 14 years (Figure 3). This trend of reduction in native vegetation has been observed over time, as noted by Ferraz [23] when analyzing changes within the Miranda River Watershed regarding deforestation rates between 1973 and 2006. According to the author, in 2006, areas with natural coverage occupied 35.8% of the basin area, while in 1973, this percentage represented 72%.
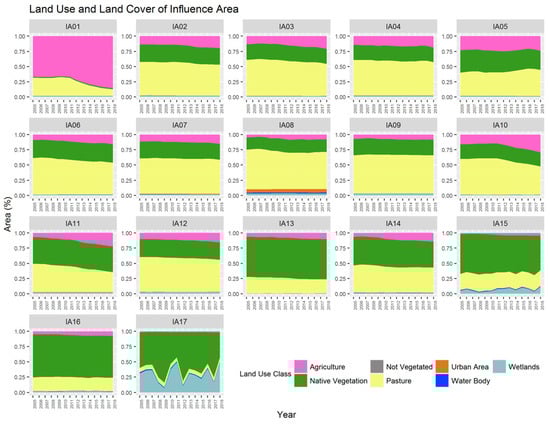
Figure 3.
Land use and land cover data in the Miranda River watershed ranging from 2005 to 2018 (IA: Influence Area).
According to Padovani [24], these changes in natural coverage in the Pantanal basin can be explained by the issuance of State Decree N°. 14,273/2015, which regulated ecologically sustainable exploitation and alternative land use in the Restricted Use Areas of the Pantanal floodplain in Mato Grosso do Sul. The author explains that the issuance of the decree may have stimulated the conversion of native vegetation for anthropogenic use. Additionally, population growth, followed by increases in economic indicators, may be factors that led to this reduction in natural vegetation. The areas under agriculture increased from 373,430.33 hectares to 620,952.67 hectares between 2005 and 2018, representing an increase of 66.28%. There is also a reduction in pasture areas, from 1,950,383.39 hectares to 1,760,624.88 hectares, a decrease of 9.73% over the period. The reduction in pastures and the increase in agricultural areas is a trend observed in the national scenario as surveyed by Landau et al. [25]. The authors explain that the intensification of Brazilian livestock production, coupled with the ease of converting pastures to agricultural crops, explains the reduction in the total pasture area. According to Lamas [26], many degraded pasture areas have been converted to agricultural cultivation. There is also an increase in urbanized areas and non-vegetated areas in the basin. Variability in wetland areas and water bodies was also observed, common in the Pantanal region, with periods of drought and rainfall causing fluctuations throughout the year, associated with the mechanisms of droughts and floods.
3.2. Water Quality in the Miranda River Watershed
A multitemporal and spatial analysis of water quality was conducted in the 17 Areas of Influence for the parameters DO, pH, BOD, thermotolerant coliform, TN, TP, TS, Tu, and WQI. The quality parameters were analyzed following the classification metrics for Class 2 (Figure 4), according to CONAMA Resolution No. 375/05 [27] and IMASUL’s CECA-MS Deliberation N°. 36/12 [18].
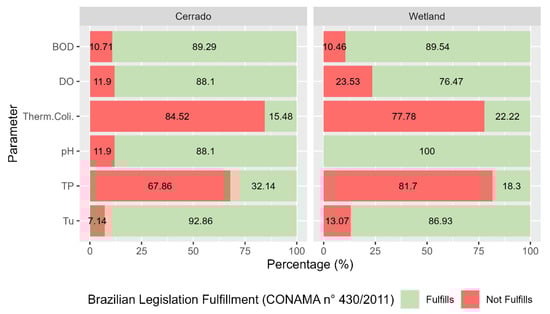
Figure 4.
Percentage of compliance with water quality parameters according to Brazilian legislation in the Miranda Basin from 2005 to 2018.
The results showed that compliance with water quality parameters according to Brazilian legislation in the Miranda Basin in the period ranging from 2005 to 2018 is similar, both for wetland areas and for the Cerrado. It is observed that most samples collected for thermotolerant coliforms and TP do not comply with the legislation, both for wetland areas and for the Cerrado, with a compliance rate below 32.14% for TP. However, an improvement is observed for thermotolerant coliforms compliance with the legislation when wetland areas are compared to the Cerrado. On the other hand, it is observed that pH has the best compliance rate, reaching 100% in wetland areas.
For DO, a reduction in compliance with the legislation is observed; in the Cerrado, 88.1% of samples were within the allowed limit, while in wetland areas, there was a reduction to 76.47%. The reduction in DO in Pantanal wetland areas is related to the natural phenomenon known as “dequada” or “decoada”, where floodwaters promote the decomposition of submerged organic matter, reducing the availability of DO in the water column [28]. Wetland areas have large amounts of stored organic matter, about 50% of which is carbon. Carbon associated with other nutrients such as phosphorus and nitrogen can reduce the amount of DO due to its demand in biochemical reactions involving these elements and also by decomposition of the stored organic matter [29].
3.3. Water Quality Index
The WQI was analyzed temporally and spatially, where it was found that in the 17 Areas of Interest, the WQI was considered GOOD or EXCELLENT (Figure 5). In the analysis conducted by [30] in the Rio Vermelho basin, in the Upper Paraguay Basin in Mato Grosso, the author also obtained similar WQI values, between 51 and 70, considered as “AVERAGE” quality, equivalent to the “GOOD” range of the IQACETESB [17]. In the Diamantino Basin in Mato Grosso, Lima [31] found similar WQI values ranging from 58 to 91.
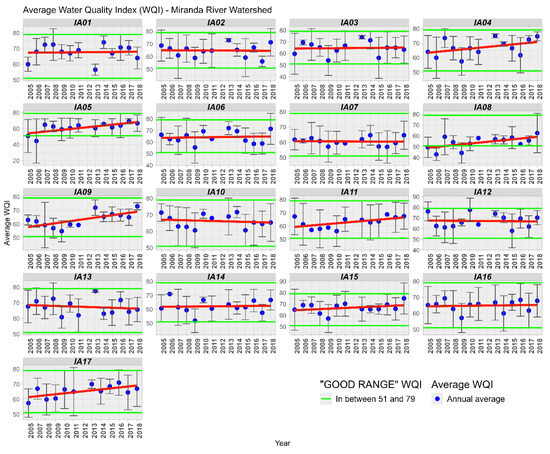
Figure 5.
Variation of the Average of the Water Quality Index (WQI) in the Miranda River Watershed subdivided into 17 Influence Areas. Linear trendline in red.
3.4. Correlation between Land Use and Land Cover and Water Quality
Through the general correlation analysis across the MRW (Figure 6), it is observed that the highest positive correlation values occurred between the class “Native Vegetation” and “Total Nitrogen” (corr = +0.8) and “Native Vegetation” with “Total Solids” (corr = +0.75), considered a high correlation. Meanwhile, the highest negative correlation occurred between “Wetlands” and “Total Nitrogen” (corr = −0.80) and “Native Vegetation” with “WQI” (corr = −0.75). The strong negative correlation between WQI and Native Vegetation can be explained by two factors: The first factor is a phenomenon of reduced oxygen levels in more preserved natural regions, called “decoada”. Considering that oxygen has a very large weight within the WQI, there is therefore a tendency for this index to decrease in specific periods of the year, impacting the final results [32]. Furthermore, the effects of spatial autocorrelation in this type of analysis should be considered whenever possible [33], since areas with a specific type of coverage often tend to be concentrated in more specific regions of a basin. The correlation between “Total Nitrogen” and “Urban Area” (corr = −0.49) is considered moderately negative; however, other authors [33,34] observed positive correlations of the order of +0.65 to +0.73, respectively, for Total Nitrogen and urbanized areas. The negative correlation obtained for this study may be associated with the low population density of the basin, considering that the correlations are general for the entire contributing area. It is important to highlight that urban land cannot be used as the sole estimator of water quality conditions [33].
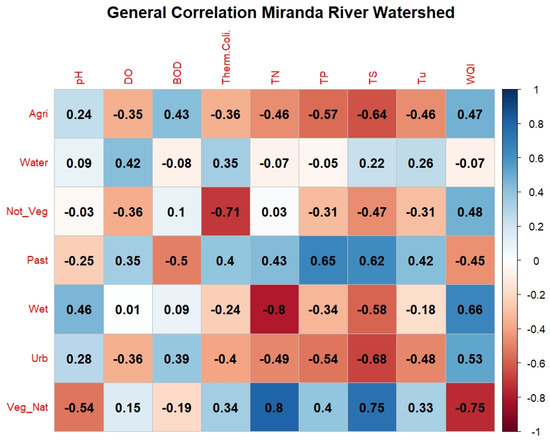
Figure 6.
Correlogram of land use and land cover with water quality in the Miranda River watershed. Note: Class: Agri = Agriculture, Water = Water Body, Not_Veg = Non-Vegetated, Past = Pasture, Wet = Wetland Areas, Urb = Urban Area, Veg_Nat = Native Vegetation. Water quality parameters: DO = dissolved oxygen, BOD = biochemical oxygen demand, Therm. Coli. = thermotolerant coliforms, TN = total nitrogen, TP = total phosphorus, TS = total solids, Tu = turbidity, WQI = water quality index.
In light of these observations, it is important to highlight that the arrangement of native vegetation, location, shape, and the presence of riparian forests influence the water quality in adjacent watercourses. Therefore, the presence of native vegetation in strategic points can positively affect water quality, especially when located in the riparian zone of watercourses [6,35]. In the study by Menezes et al. [11] in the Ribeirão Vermelho Basin in Lavras, Minas Gerais, where the springs and main tributaries are located in the urban region of Lavras, it was found that natural vegetation correlated negatively with nitrogen (corr = −0.43). Additionally, they did not identify a correlation between “Native Vegetation” and “Total Solids” (corr = 0.06).
The correlation values found in this study suggest that each study region has its own peculiarities, as shown in Figure 7, since the expected correlations may not repeat from one study area to another.
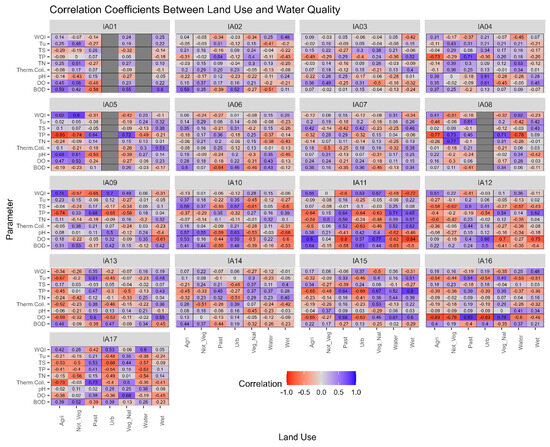
Figure 7.
Correlogram of land with water quality by influence area in the Miranda River watershed. Note: IA: Influence Areas. Water quality parameters: DO = dissolved oxygen, BOD = biochemical oxygen demand, Therm. Coli. = thermotolerant coliforms, TN = total nitrogen, TP =total phosphorus, TS = total solids, Tu = turbidity, WQI = water quality index.
In the study conducted by Chen et al. [36], the authors analyzed the correlation between land use and land cover and water quality parameters. The authors found that there is some spatial heterogeneity among the sub-basins studied, so the relationship between land use and water quality is not the same among them, as observed in the delineated Areas of Influence for the MRW in this study. The literature suggests that other relationships should be investigated for a better understanding of the relationship between land use and water quality, such as the type of scale adopted, region topography, and hydrological regime [7,9].
According to the multi-temporal analysis of land use and land cover, IA17 has the highest proportion of wetland areas due to its spatial location close to the mouth of the Miranda River with the Paraguay River. It is observed that over time in IA17, there is a variation in the quantity of “Wetland Areas” from year to year. This variation can be explained by the effect of multi-year flood and drought cycles, where periods of consecutive years of floods alternate with years of drought. With the increase in water covering the soil, there is a reduction in the quantity of other land use classes [37].
When analyzing the correlations between the land use “Wetland Areas” and water quality parameters in IA17, low correlations were observed, lower than corr = ±0.5, except for the parameter “Total Nitrogen,” which showed a high coefficient (corr = −0.82). Yu et al. [38] evaluated 40 small wetland areas in the Blue Ridge ecoregion, South Carolina, United States, where they found that total dissolved nitrogen depends on both the hydrological connection between wetland areas and the surrounding land use (Figure 8).
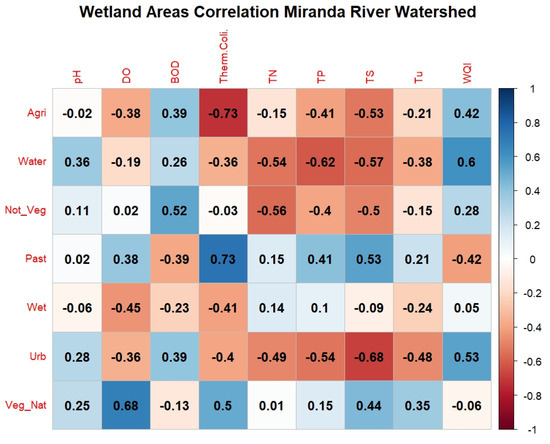
Figure 8.
Correlogram of wetland areas with water quality by influence area in the Miranda River watershed. Note: Class: Agri = Agriculture, Water = Water Body, Not_Veg = Non-Vegetated, Past = Pasture, Umide = Wetland Areas, Urb = Urban Area, Veg_Nat = Native Vegetation. Water quality parameters: DO = dissolved oxygen, BOD = biochemical oxygen demand, Therm. Coli. = thermotolerant coliforms, TN = total nitrogen, TP = total phosphorus, TS = total solids, Tu = turbidity, WQI = water quality index.
These low correlations can be explained by the non-linear variation in the quantity of Wetland Areas over the study period, resulting from the seasonality of interannual periods of drought and flood in the Pantanal. The dynamics of land use and land cover in this region do not behave linearly over the study period, showing higher variance compared to other Influence Areas in the MRW. Because of this, the relationship between land use and land cover and water quality may not be well explained by linear correlations, suggesting that non-linear correlations should be investigated in future studies.
3.5. Influence of Wetlands on Water Quality
3.5.1. Thermotolerant Coliforms
When comparing Thermotolerant Coliforms at the inlet and outlet of the Pantanal region, a pronounced downward trend is observed in most of the years studied. Additionally, it is also noted that the values for Thermotolerant Coliforms were above the permissible limit for Class 2 at the inlet stations, so that at the mouth of the Miranda River with the Paraguay River, the values remained below the limit of 200 MPN/100 mL (Figure 9).
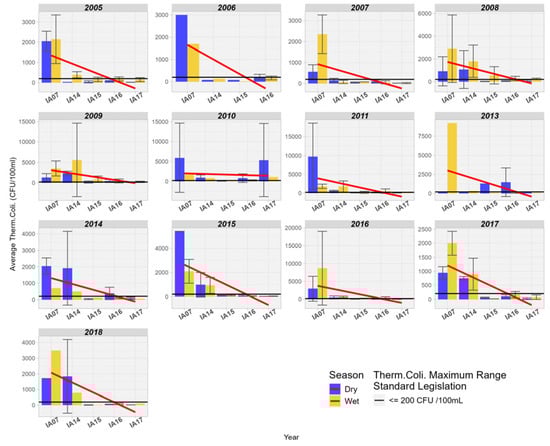
Figure 9.
Spatial variation of the average Thermotolerant Coliforms (MPN/1000 mL) at the monitoring stations in the Pantanal (IA07, IA14, IA15, IA16, IA17).
The results corroborate those found by [39], who analyzed the effectiveness of natural wetlands in retaining nutrients, sediments, and microbial pollutants in two wetland areas, one natural and the other channelized (anthropized), located in a region of intense agropastoral use. The authors found that the natural wetland area reduced about 68% of E. coli between the inlet and outlet of the natural wetland area, while the channelized wetland area retained 25% of the coliforms between the inlet and outlet. Wilcock et al. [40] found an average reduction of 79% in the years ranging from 2007 to 2010 at the outlet of the wetlands in the Toenepi basin, a region predominantly characterized by dairy farming in the North of New Zealand.
The retention and reduction in coliforms and other types of microorganisms in wetlands may be associated with sedimentation along with suspended particulate matter and also with adsorption to aquatic vegetation. The infiltration of contaminated floodwaters into firm soil is another factor that reduces the quantity of these microorganisms in surface waters. Exposure of organisms to ultraviolet solar radiation present in the water column significantly reduces the quantity of these organisms, especially in shallow waters [39,40].
3.5.2. Dissolved Oxygen and Biochemical Oxygen Demand Assessment
When comparing DO at the inlet and outlet of the Pantanal region, a downward trend is observed in most of the years studied. In the majority of the years studied, the DO values were above 5.0 mg/L, the minimum limit for Class 2 (Figure 10). It was also observed that DO values are higher during the driest times of the year.
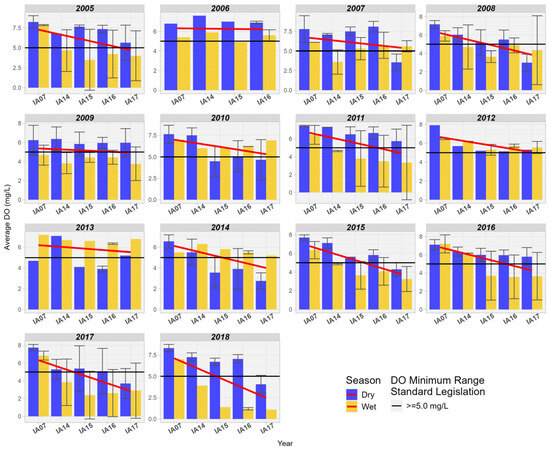
Figure 10.
Spatial variation of the average dissolved oxygen (mg/L) at the monitoring stations in the Pantanal (IA07, IA14, IA15, IA16, IA17).
The BOD concentration showed an increase in relation to the inlet and outlet of the MRW wetland for 6 years and a decrease for 4 years. These values correlate with DO, where a decrease in concentration was observed in the Pantanal wetland. Due to the low population density in the Pantanal region, the influence of sewage discharge is not relevant; however, other types of anthropogenic interference cannot be excluded (Figure 11).
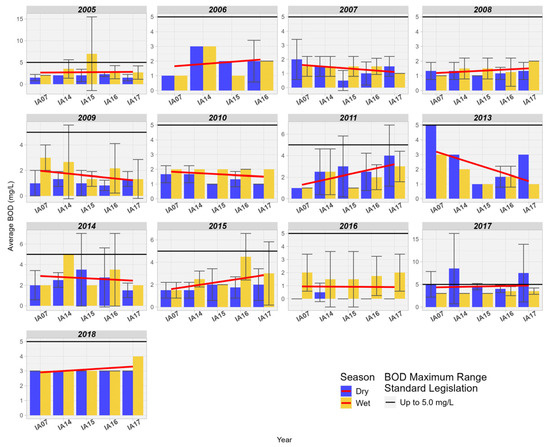
Figure 11.
Spatial variation of the measurement of biochemical oxygen demand BOD (mg/L) at the monitoring stations in the Pantanal (IA07, IA14, IA15, IA16, IA17).
The reduction in DO and the increase in BOD in the wetlands of the Pantanal may be related to the natural phenomenon known as “dequada” or “decoada”, as mentioned before [32]. Dise [29] highlights that wetlands have large amounts of stored organic matter, about 50% of which is carbon. Carbon associated with other nutrients such as phosphorus and mainly nitrogen can reduce the amount of dissolved oxygen due to its demand in biochemical reactions involving these elements.
In a study conducted by Jeng and Hong [41] in the wetlands existing in the urban area of St. Bernard County, Louisiana, United States, the authors found low DO values, ranging from 3.0 mg/L to 1.8 mg/L. Silva et al. [42] also observed levels considered low of DO, from 1.37 to 5.37 mg/L in two bays of the Paraguay River in Cáceres (MT). During the “dequada” in the Paraguay River in Cáceres/MT, [43] found that the average dissolved oxygen declined from 6.37 mg/L (October 2018) to about 3.0 mg/L (April 2019), returning to normal in the following months.
Oliveira et al. [44] conducted an analysis of “dequada” events along the Paraguay River and its tributaries. The authors found that in the region from the confluence of the Miranda and Aquidauana rivers to the mouth with the Paraguay River (the area studied in this work), there is a reduction in DO and an increase in the concentration of carbon dioxide released during the decomposition of organic matter causing “dequada” events, considered of medium to high magnitude. Thus, it is relatively common to find low values of DO in wetlands due to the low speed of the water, which reduces natural aeration in these areas. Especially in tropical areas with an abundance of herbaceous vegetation, DO levels can drop to 2.0 mg/L during the decomposition of organic matter, as floodwaters advance in the floodplain area [41,44].
The higher concentrations of BOD and the reduction in DO in the studied area may be associated with the decomposition of dead natural organic matter, resulting from seasonal flooding cycles. Oliveira et al. [44] further add that the magnitude of these events (intensity and duration) varies from year to year, occurring from December to May in the tributaries, and from February to June in the main channel of the Paraguay River.
3.5.3. Total Nitrogen Assessment
An increase in TN values was observed over 7 years between the input and output in the wetland area of the Pantanal. In the years 2005, 2007, and 2015, there was stability in the trend; however, for the years 2007, 2009, 2013, and 2014, there was a reduction in concentrations. Thus, it is observed that there is no clearly defined pattern of behavior for nitrogen in the studied Pantanal wetland areas. It is also noted that, in general, the highest concentration values occur during the rainy seasons (Figure 12).
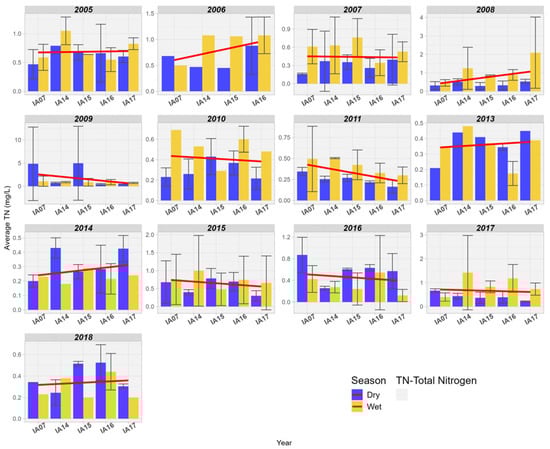
Figure 12.
Spatial variation of the mean Total Nitrogen (mg/L) at the monitoring stations of the Pantanal (IA07, IA14, IA15, IA16, IA17).
Uuemaa et al. [45] estimated the performance in the input and output of a wetland area in removing nitrogen loads originating from upland pastures in the watershed in Waikato, New Zealand. The authors found that the concentrations of TN were consistently lower at the outlet of the wetland area, regardless of flow conditions or seasonality. This is due to water infiltration through saturated layers of anoxic organic sedimentary material and plant debris with high denitrification potential, so that high denitrification rates are common in wetlands and riparian zones rich in organic matter [45]. Dias & Baptista [12] also observed the reduction in TN in the wetland area of Riacho Fundo, Brasília, Brazil. The authors found an average retention of 36.7% for TN between the inlet and outlet of the wetland area.
In the literature review conducted by Fisher and Acreman [13] on the nitrogen retention capacity in wetlands around the world, the authors confirm that most wetlands retain nitrogen; however, about 13% of the wetlands studied showed an increase in Nitrogen in the aquatic environment. Nitrogen can also be deposited in wetlands through atmospheric processes of molecular nitrogen (N2) fixation, carried out by fixing bacteria. Additionally, the decomposition of dead organic matter can also release nitrogenous forms into the water mass. Most wetlands can function as effective reservoirs of nitrogen in tropical zones, accounting for two-thirds of all globally fixed atmospheric nitrogen [46]. White and Reddy [46] highlighted that some factors affect nitrogen fixation in wetlands such as low N:P ratios in sediment, inputs of wastewater, reducing conditions (redox potential), photosynthetic activity, availability of molybdenum, iron, and dissolved organic matter. On the other hand, nitrification reactions, denitrification, ammonia volatilization, and plant absorption help to keep nitrogen levels low in the water column. The contribution of each of these reactions will depend on a series of environmental factors, which can effectively optimize or minimize the relative rates of each reaction in soil and wetland areas [46].
The capacity of wetlands to remove nutrients from water varies with climatic seasonality, increased nutrient loads, and different types of vegetation. Vegetation production and seasonality influence the amounts of organic matter and carbon in wetland sediments and the oxygen concentration in sediment [47]. Therefore, the variability of nitrogen concentrations in the studied area can be explained by the regime of wetland areas during dry and flood periods and by the nitrogen cycle that occurs fully in wetlands, thanks to the presence of air, water, sediment, land, and live biomass. Additionally, the nitrogen cycle occurs jointly with the other biogeochemical cycles of carbon, phosphorus, and oxygen [47].
3.5.4. Total Phosphorus Assessment
The spatial behavior of TP concentrations varied from year to year in the studied area. Four years of decrease in upstream/downstream concentrations are observed (2006, 2010, 2015, 2017), and seven years of increase in upstream/downstream concentrations (2005, 2007, 2009, 2013, 2014, 2018). It is also noted that TP values were higher during rainy seasons compared to the drier period (Figure 13).
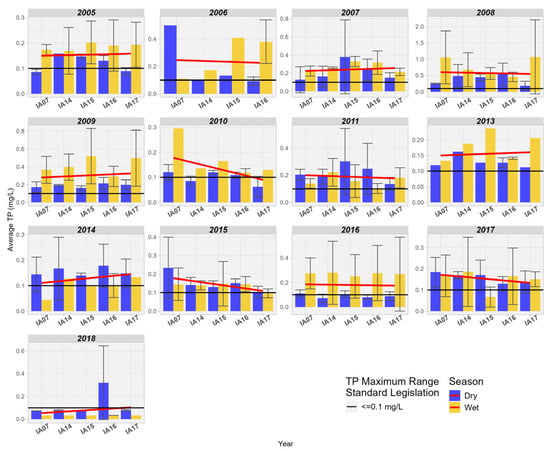
Figure 13.
Spatial variation of the mean Total Phosphorus (mg/L) at the monitoring stations of the Pantanal (IA07, IA14, IA15, IA16, IA17).
The spatial behavior of Total Phosphorus concentrations varied year to year in the study area. There are six years of decline in upstream/downstream concentrations (2006, 2008, 2010, 2011, 2015, 2017) and seven years of increase in upstream/downstream concentrations (2005, 2007, 2009, 2013, 2014, 2018). It is also noted that Total Phosphorus values were higher in rainy seasons compared to the drier period (Figure 13).
In the study conducted by Dias & Baptista [12] in the wetland area of Riacho Fundo, Brasília, Brazil, an average retention of 34% for TP between the inlet and outlet points analyzed by the authors was observed. After an extensive literature review on nutrient removal in wetlands, Fisher and Acreman [13] identified that 84% of the studied wetlands showed phosphorus retention, 10% indicated an increase in phosphorus, and in 6% of the studied areas, there was no difference between the input and output of wetlands. Studies in the literature associate wetlands with phosphorus retention mechanisms [48,49]. These mechanisms combine biological, physical, and chemical factors such as absorption and release by vegetation, periphyton, and microorganisms; sorption and exchange reactions with soils and sediments; chemical precipitation in the water column; and sedimentation and transport [50,51].
In wetlands, phosphorus is removed from surface waters and transferred to sediments and plants. Phosphorus removal can be limited by the concentration of iron, aluminum, or calcium in sediments [47]. The variability in phosphorus concentrations found in the studied area may be associated with the processes of assimilation and release of P in aquatic plants in the Pantanal. According to Neves and Santos [52], the Pantanal is one of the Brazilian regions with the highest diversity of aquatic macrophytes due to the diversity of habitats in the Pantanal plain, with annual variations in water levels, temperature, and air humidity. Most of these species, for example, die in the dry season, releasing biomass rich in nutrients. Aquatic vegetation in wetlands plays a significant role in phosphorus assimilation, as it absorbs P directly from the water column. Due to rapid turnover, P storage is short-term in short-cycle emergent plants, such as macrophytes, and much of the P is released back into the water column after vegetative decomposition, providing short-term storage. Unlike macrophytes, woody tree formations in wetlands provide long-term storage, with absorption rates ranging from 1 to 15 kg.ha−1.year−1 [50]. Periphyton may play an important role in regulating P concentrations in the water column, as it assimilates organic and inorganic forms of P and can induce marked changes in pH and oxygen concentration in the water column and in the soil–water interface of flooding. These alterations can potentially influence P solubility by precipitating phosphorus along with CaCO3 [50,53]. Thus, quantifying P cycling in wetlands proves to be a major challenge in terms of measuring the many physicochemical forms of phosphorus, as well as the vast array of biological and chemical processes that control the absorption, storage, and release of this element in wetlands [54].
3.5.5. Total Solids Assessment
For TS, there was a trend of increasing values from upstream to downstream in the Pantanal area between the years 2005 and 2014. However, it is observed that from the year 2015 onwards, there has been a progressive reduction in the concentration of TS in the Pantanal wetland area (Figure 14).
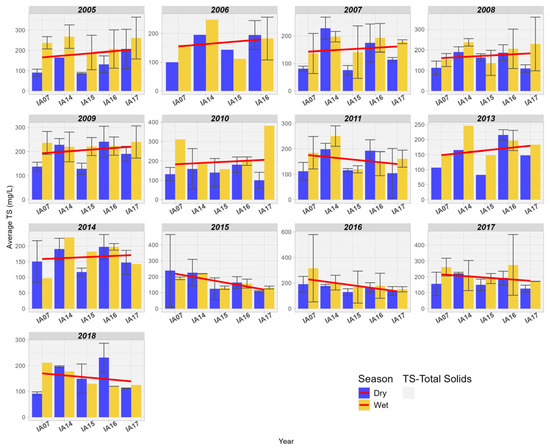
Figure 14.
Spatial variation of Total Solids (mg/L) at the monitoring stations of the Pantanal (IA07, IA14, IA15, IA16, IA17).
Chang et al. [55] found that the restoration of natural wetland areas in the urban basin of the Tualatin River, Oregon, United States, was effective in reducing TS concentrations between the years 2001 and 2016. On the other hand, in the study conducted in the wetlands of the Duck Creek basin, Alaska, United States, no significant difference was found for TS at the inlet and outlet of the wetlands [56]. Plain wetlands, like those in this study, slow down the speed of water and retain it for longer in the floodplain, resulting in downstream solids reduction through sedimentation [55]. TS still play an important role in the cycle and transport of aquatic nutrients. Free phosphorus is generally associated with suspended sediments in the water column, bottom sediments, or aquatic microbiota in organic form, so that water flows along with TS favor the transport of phosphorus in the aquatic environment [56]. Understanding the influence of fluctuations in solid transport in Pantanal wetlands is highly relevant, as transported sediments can be a limiting factor to primary biological productivity downstream, reducing the fertility of wetland areas and affecting their support capacity. The loss of flood pulse fertilization services has been documented in several natural systems worldwide, mainly associated with dam constructions that regulate the natural flow of sediments downstream [57].
3.5.6. Turbidity Assessment
Turbidity in the wetlands of the Pantanal of the MRW met the maximum limit of 100 NTU for Class 2 in all years studied. There is also a reduction in Turbidity values at the inlet and outlet of the Pantanal, where values during the dry season are lower than during the rainy season (Figure 15).
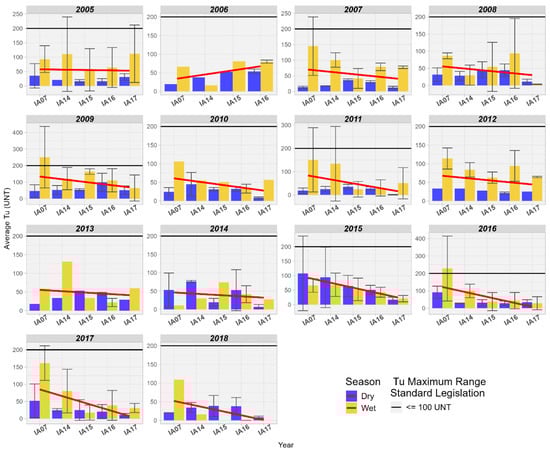
Figure 15.
Spatial variation of the average Turbidity (NTU) at the monitoring stations of the Pantanal (IA07, IA14, IA15, IA16, IA17).
In a study conducted by the local government in the wetlands of the Duck Creek basin, Alaska, United States, a reduction in Turbidity from upstream to downstream was also observed, not exceeding more than 30 NTU for that location [54]. Wetlands are known to be responsible for numerous ecosystem functions, among which the retention and deposition of sediments stand out. This process improves water quality by reducing turbidity while retaining nutrients and pollutants [58].
Turbidity in wetlands affects the distribution of aquatic plants, such as submerged macrophytes, as they depend on light penetrating the water column for photosynthesis. When turbidity is high, the presence of macrophytes is limited due to the low availability of light in the water column [59]. In the aquatic environment, turbidity increases with higher solids load, reducing the depth at which sunlight penetrates the water. The higher the turbidity, the greater this effect. The depth at which light penetrates is the photic depth of the water body. Below this depth, there is not enough light for plants to photosynthesize. The depth of the photic zone is small in highly turbid wetlands, with primary production limited to floating or emergent plants and benthic, planktonic, or submerged plants only within the shallow photic zone. Primary production is then limited to the upper layers of water, and in the lower layers, the composition of the microbiota is altered [59]. The results found for Turbidity in this study suggest that the composition of aquatic biota may be relatively different between the inlet and outlet in the wetland area of the Miranda River due to the availability of light along the water column.
3.5.7. pH Assessment
Regarding pH, it was observed that, in general, there is an increasing trend between the inlet and outlet of the Pantanal, but it remains close to neutrality, ranging between 7.0 and 7.5 (Figure 16).
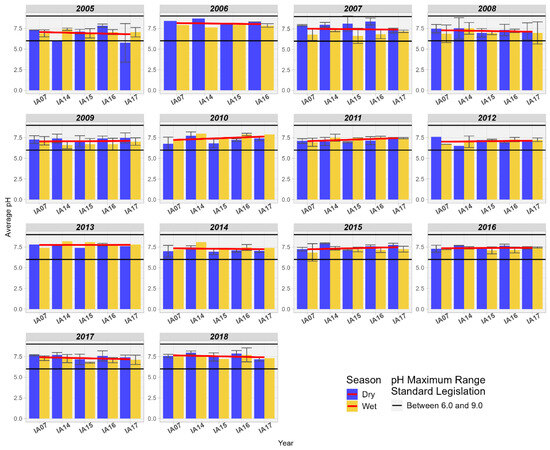
Figure 16.
Spatial variation of the average pH at the monitoring stations of the Pantanal (IA07, IA14, IA15, IA16, IA17).
This trend towards alkalinity was observed by Reid and Mosley [60] when comparing the contributions of geochemistry, microbial metabolism, and aquatic photosynthesis to the alkalinity of pH in ephemeral wetlands in southeastern Australia. In the study, the authors highlight that in that locality, the abundant growth of aquatic plants modifies the chemical composition of the water through the absorption of nutrients, such as calcium and magnesium, as well as the sequestration of CO2 by the process of photosynthesis in the water column, increasing the carbonate alkalinity in the water. These nutrients absorbed by the plants are not available in the water column, so they do not form solid calcium and magnesium carbonates like calcite, which normally buffer the pH within a certain fixed range [60]. In the study conducted by Gitau [61] in the wetlands of Limuru, Kenya, the author identified low variation in pH at the inlet and outlet, also noting a slight trend of increasing alkalinity.
The pH influences the mobility of phosphorus in the aquatic environment when in the presence of Al, Fe, Ca, and Mg ions, promoting its adsorption on soil particles, sediments, and the water column. Thus, the pH of the system and the concentration of these elements determine which ion will be most active in P sequestration. In acidic soils, P in the inorganic form can be adsorbed on hydrated oxides of Fe and Al; in addition, P can precipitate as insoluble Fe phosphates. [54]. Oliveira et al. [44] highlight that in the Pantanal, during the “decoada” period, the DO concentration varies between 5.0 and 2.0 mg/L due to the decomposition of dead organic matter; as a consequence of this, soluble CO2 is released (favoring acidification). During the study period, pH values outside the range of 6 to 9, allowed for Class 2, were not identified. Although a pattern of reduction in DO was identified in the wetlands of the Miranda River, it was observed that the average DO values were above 5.0 mg/L.
3.5.8. Water Quality Index (WQI)
When analyzing the WQI in the wetlands of the Pantanal, an increase in WQI values is observed. Additionally, it is noted that the index is better during drier periods compared to rainy periods. The influence of coliform removal may explain the significant improvement in WQI between the inlet and outlet of the wetlands in the Miranda basin (Figure 17). According to Oliveira et al. [44], understanding the phenomenon of “decoada” is important for interpreting the WQI, as the reduction in dissolved oxygen levels can negatively influence the index. Thus, the authors recommend caution in using DO as an indicator of quality in the Pantanal, considering that “decoada” phenomena are natural and promote significant changes in the dynamics of the entire ecosystem.
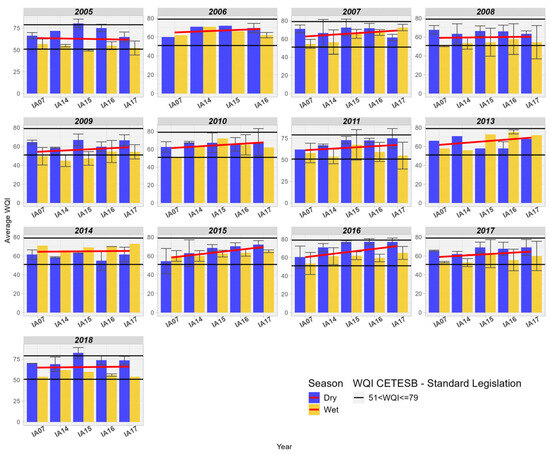
Figure 17.
Spatial variation of the Water Quality Index (WQI) at the monitoring stations of the Pantanal (IA07, IA14, IA15, IA16, IA17).
4. Conclusions
The study demonstrated changes in land use and land cover patterns and water quality standards in the MRW from 2005 to 2018. It is possible to observe changes in land cover such as the reduction in native vegetation, as well as a decrease in livestock and an increase in agricultural plantations. Additionally, there was variability in the quantity of wetland areas in the MRW, characterizing multi-year cycles of drought and flood. Water quality parameters such as BOD, DO, pH, and Turbidity as well as the WQI, remained within the permissible reference limit for classification in Class 2, except for Thermotolerant Coliforms and Total Phosphorus, which showed values above the allowed range. The study also revealed a trend of increasing BOD values, indicating a higher input of organic matter into the water bodies of the basin, although, in all the studied Influence Areas, the WQI was considered “GOOD” or “EXCELLENT”. This indicates, overall, satisfactory levels of water quality for the basin. On the other hand, although Total Phosphorus exceeded the allowed limit, there was a gradual decreasing trend over the study period.
When analyzing correlations in the MRW, it was observed that when using a general approach for the entire basin, the indices showed low correlation. However, when correlations were analyzed by Influence Area (sub-basins), the correlation values increased, both for positive and negative correlations, indicating that policies for water quality management can be developed in terms of sub-basins, smaller planning units.
Comparing the behavior of water quality parameters concerning the wetland areas of the MRW, there is a significant improvement in WQI, and for Thermotolerant Coliforms and Turbidity. However, there is a downward trend in DO values in wetland areas and an increase in BOD. For pH, it is observed that values tend to increase, making the water more alkaline, rarely exceeding the range of 7.5. Regarding TP, TN, and TS, it was found that the values showed variability over the years, with periods of increase or decrease. Considering the climatic seasonality in the wetland areas of the MRW, it was observed that DO, Turbidity, and WQI values are higher in the driest times of the year, and COD, TN, and TP presented higher concentrations in the rainy season.
Wetland areas play important hydrological and ecological functions for flora and fauna, and especially for the water quality of the region. They are effective in the removal, storage, and cycling of nutrients, such as nitrogen and phosphorus, as well as improving and controlling quality parameters downstream. Therefore, they are highly relevant areas for defining strategies for watershed management and conservation, environmental protection, and the provision of ecosystem services.
Author Contributions
Conceptualization, F.J.C.M.F. and W.d.S.C.; methodology, F.J.C.M.F. and W.d.S.C.; formal analysis, C.S.C.C.; investigation, F.J.C.M.F. and W.d.S.C.; resources, F.J.C.M.F.; data curation, W.d.S.C.; writing—original draft preparation, L.R.R. and C.S.C.C.; writing—review and editing, L.R.R. and C.S.C.C.; visualization, F.J.C.M.F.; supervision, F.J.C.M.F.; project administration, F.J.C.M.F.; funding acquisition, F.J.C.M.F. All authors have read and agreed to the published version of the manuscript.
Funding
This research was funded by Ministério Público Estadual Do Mato Grosso do Sul (MPMS) “State Public Ministry of Mato Grosso do Sul”, through the project Centro Integrado de Proteção e Pesquisa Ambiental (CEIPPAM) “Integrated Center for Environmental Protection and Research”.
Institutional Review Board Statement
Not applicable.
Informed Consent Statement
Not applicable.
Data Availability Statement
Data are contained within the article.
Acknowledgments
Fernando J.C.M.F. is thankful to Brazilian National Council for the Improvement of Higher Education (CAPES), the Brazilian National Council of Scientific and Technological Development (CNPq), National Institute of Science and Technology in Nature-based Solutions—INCT “NbS” (CAPES/CNPq/Research Support Foundation of the State of Rio Grande do Sul—FAPERGS); and Calheiros S.C.C. is thankful to Fundação para a Ciência e Tecnologia (FCT) within the scope of UIDB/04423/2020, UIDP/04423/2020 and LA/P/0101/2020.
Conflicts of Interest
The authors declare no conflicts of interest.
References
- Arenas-Sánchez, A.; Rico, A.; Vighi, M. Effects of Water Scarcity and Chemical Pollution in Aquatic Ecosystems: State of the Art. Sci. Total Environ. 2016, 572, 390–403. [Google Scholar] [CrossRef] [PubMed]
- IPEA Ipea—Objetivos Do Desenvolvimento Sustentável. Available online: https://www.ipea.gov.br/ods/index.html (accessed on 24 November 2022).
- von Sperling, M.; de Lemos Chernicharo, C.A. Biological Wastewater Treatment in Warm Climate Regions, Vol. 1; Reprinted; IWA: London, UK, 2006; ISBN 978-1-84339-002-2. [Google Scholar]
- Song, Y.; Song, X.; Shao, G.; Hu, T. Effects of Land Use on Stream Water Quality in the Rapidly Urbanized Areas: A Multiscale Analysis. Water 2020, 12, 1123. [Google Scholar] [CrossRef]
- Braga, B.; Hespanhol, I.; Conejo, J.L.; Mierzwa, J.C.; de Barros, M.T.; Spencer, M.; Porto, M.; Nucci, N.; Juliano, N.; Eiger, S.; et al. Introdução à Engenharia Ambiental; 3a Edição; de Fraga, S., Ed.; Bookman: Porto Alegre, Brazil, 2021; ISBN 978-85-8260-556-1. [Google Scholar]
- Shi, P.; Zhang, Y.; Li, Z.; Li, P.; Xu, G. Influence of Land Use and Land Cover Patterns On Seasonal Water Quality At Multi-Spatial Scales. CATENA 2017, 151, 182–190. [Google Scholar] [CrossRef]
- de Mello, K.; Valente, R.A.; Randhir, T.O.; dos Santos, A.C.A.; Vettorazzi, C.A. Effects of Land Use and Land Cover On Water Quality Of Low-Order Streams In Southeastern Brazil: Watershed Versus Riparian Zone. CATENA 2018, 167, 130–138. [Google Scholar] [CrossRef]
- Giri, S.; Qiu, Z. Understanding the Relationship of Land Uses and Water Quality in Twenty First Century: A review. J. Environ. Manag. 2016, 173, 41–48. [Google Scholar] [CrossRef] [PubMed]
- Ullah, K.A.; Jiang, J.; Wang, P. Land Use Impacts on Surface Water Quality by Statistical Approaches. Glob. J. Environ. Sci. Manag. 2018, 4, 231–250. [Google Scholar] [CrossRef]
- de Mello, K.; Taniwaki, R.H.; de Paula, F.R.; Valente, R.A.; Randhir, T.O.; Macedo, D.R.; Leal, C.G.; Rodrigues, C.B.; Hughes, R.M. Multiscale Land Use Impacts on Water Quality: Assessment, Planning, And Future Perspectives in Brazil. J. Environ. Manag. 2020, 270, 110879. [Google Scholar] [CrossRef] [PubMed]
- Menezes, J.P.C.; Bittencourt, R.P.; Farias, M.d.S.; Bello, I.P.; Fia, R.; de Oliveira, L.F.C. Relação Entre Padrões De Uso E Ocupação Do Solo E Qualidade Da Água Em Uma Bacia Hidrográfica Urbana. Eng. Sanit. Ambient. 2016, 21, 519–534. [Google Scholar] [CrossRef]
- Dias, R.Z.; Baptista, G.M.d.M. Wetland Nutrient Retention and Multitemporal Growth—Case Study of Riacho Fundo’s Wetland. Acta Limnol. Bras. 2015, 27, 254–264. [Google Scholar] [CrossRef]
- Fisher, J.; Acreman, M.C. Wetland nutrient removal: A review of the evidence. Hydrol. Earth Syst. Sci. 2004, 8, 673–685. [Google Scholar] [CrossRef]
- Silva, J.; Abdon, M.; Pott, A.; Mauro, R. Fragile Ecosystem: The Brazilian Pantanal Wetland. In Encyclopedia of Life Support Systems; Sanchez, L.E., Ed.; Eolss Publishers Co. Ltd.: Oxford, UK, 2009; pp. 302–339. [Google Scholar]
- Projeto MapBiomas—Coleção 6 Da Série Anual de Mapas de Cobertura e Uso Da Terra Do Brasil. Available online: http://brasil.mapbiomas.org/ (accessed on 28 March 2024).
- IMASUL IMASUL. Relatórios de Monitoramento Da Qualidade Das Águas Superficiais de Mato Grosso Do Sul, 2020. Available online: http://www.imasul.ms.gov.br/Relatorios-de-Monitoramento-Da-Qualidade-Das-Aguas-Superficiais/ (accessed on 28 March 2024).
- CETESB, E.S.T.C.; CETESB. Environmental Sanitation Technology Company Relatório de Qualidade Das Águas Interiores Do Estado de São Paulo. São Paulo, Brazil. 2008. Available online: http://cetesb.sp.gov.br/Aguas-Interiores/Wpcontent/Uploads/Sites/12/2013/11/Relatorio_2008.Zip (accessed on 28 March 2024).
- MATO GROSSO DO SUL. Deliberation CECA/MS N° 36, de 27 de Junho de 2012. In Provides for the Classification of Surface Water Bodies and Establishes Environmental Guidelines for Their Classification, as Well as Establishing the Guidelines, Conditions and Standards for the Release of Effluents within the State of Mato Grosso Do Sul, and Provides Other Measures; Instituto de Meio Ambiente de Mato Grosso Do Sul: Campo Grande, Brazil, 2012. [Google Scholar]
- American Public Health Association (APHA); American Water Works Association; Water Environment Federation. Standard Methods for the Examination of Water and Wastewater, 24th ed.; Lipps, W.C., Braun-Howland, E.B., Baxter, T.E., Eds.; APHA Press: Washington, DC, USA, 2023. [Google Scholar]
- ASTM D888-12e1; Standard Test Methods for Dissolved Oxygen in Water. ASTM International: West Conshohocken, PA, USA, 2018.
- ABNT NBR 13796:1997-04-30; Água-Determinação de Nitrogênio Orgãnico, Kjeldahl e Total—Métodos Macro e Semimicro Kjeldahl. ABNT, Associação Brasileira de Normas Técnicas: Rio de Janeiro, Brazil, 1997.
- IBGE, Instituto Brasileiro de Geografia e Estatística. Biomas e Sistema Costeiro-Marinho Do Brasil-PGI. Available online: https://www.ibge.gov.br/Apps/Biomas/#/Home (accessed on 28 March 2024).
- Ferraz, R.G.B. Antropização Da Bacia Hidrográfica Do Rio Miranda: Alterações Climáticas, Recursos Naturais e Desenvolvimento. Master’s Thesis, UCDB, Campo Grande, MS, Brazil, 2006. [Google Scholar]
- Padovani, C.R. Conversão Da Vegetação Natural Do Pantanal Para Uso Antrópico de 1976 Até 2017 e Projeção Para 2050. Comun. Técnico 2017, 109, 1–6. [Google Scholar]
- Landau, E.C.; Resende, R.M.S.; Matos Neto, F.D.C. Evolução Da Área Ocupada Por Pastagens. In Dinâmica da Produção Agropecuária e Da Paisagem Natural No Brasil Nas Últimas Décadas: Produtos de Origem Animal e Da Silvicultura; Landau, E.C., De Silva, G.A., Moura, L., Hirsch, A., Guimarães, D.P., Eds.; Embrapa: Brasília, DF, Brazil, 2020; Volume 3, pp. 1555–1578, Chapter 46. [Google Scholar]
- Lamas, F.M.; Artigo-A Dinâmica Da Agricultura Em Mato Grosso Do Sul. EMBRAPA 2021. Available online: https://www.Embrapa.br/Busca-de-Noticias/-/Noticia/65083174/Artigo---a-Dinamica-Da-Agricultura-Em-Mato-Grosso-Do-Sul (accessed on 28 March 2024).
- MMA Ministério Do Meio Ambiente. Brasil Resolução CONAMA N° 357 de 18 de Março de 2005. Dispõe Sobre a Classificação Dos Corpos de Água e Diretrizes Ambientais Para o Seu Enquadramento, Bem Como Estabelece as Condições e Padrões de Lançamento de Efluentes, e Dá Outras Providências; MMA Ministério Do Meio Ambiente: Brasília, Brazil, 2005; pp. 58–63. [Google Scholar]
- Bergier, I.; Assine, M.L. (Eds.) Dynamics of the Pantanal Wetland in South America; Springer International Publishing: Berlin/Heidelberg, Germany, 2016; Volume 37. [Google Scholar] [CrossRef]
- Dise, N.B. Biogeochemical Dynamics III: The Critical Role of Carbon in Wetlands. In The Wetlands Handbook; Maltby, E.E., Barker, T., Eds.; Wiley-Blackwell: Oxford, UK, 2009; pp. 249–265. [Google Scholar] [CrossRef]
- Souza, A.V.V. Avaliação Da Influência Dos Usos e Ocupação Do Solo Na Qualidade Da Água Do Rio Vermelho No Sudeste de Mato Grosso. Master’s Thesis, Programa de Pós-Graduação Em Geografia, Universidade Federal de Mato Grosso, Rondonópolis, MT, Brazil, 2015; p. 82. [Google Scholar]
- Lima, A.F. Dinâmica Da Qualidade Da Água Na Bacia Paraguai/Diamantino—Mato Grosso. Master’s Thesis, Universidade Estadual Do Mato Grosso, Tangará Da Serra, MT, Brazil, 2017; p. 51. [Google Scholar]
- Calheiros, D.F.; Ferreira, C.J.A. Alterações Limnológicas No Rio Paraguai (“dequada”) e o Fenômeno Natural de Mortandade de Peixes No Pantanal Mato-Grossense; EMBRAPA-CPAPMS: Corumbá, MS, Brazil, 1996; 51p. [Google Scholar]
- Zampella, R.A.; Procopio, N.A.; Lathrop, R.G.; Dow, C.L. Relationship of Land-Use/Land-Cover Patterns and Surface-Water Quality in The Mullica River Basin1. JAWRA J. Am. Water Resour. Assoc. 2007, 43, 594–604. [Google Scholar] [CrossRef]
- Kibena, J.; Nhapi, I.; Gumindoga, W. Assessing the Relationship Between Water Quality Parameters and Changes in Landuse Patterns in The Upper Manyame River, Zimbabwe. Phys. Chem. Earth, Parts A/B/C 2014, 67–69, 153–163. [Google Scholar] [CrossRef]
- Dos Santos, J.P. Influências Da Composição e Estrutura Da Paisagem Sobre a Qualidade Da Água Em Múltiplas Extensões Espaciais Na Unidade Hidrológica Do Rio Doce Em Minas Gerais. Master’s Thesis, Universidade Federal de Minas Gerais, Belo Horizonte, MG, Brazil, 2020. Available online: http://hdl.handle.net/1843/36487 (accessed on 28 March 2024).
- Chen, D.; Elhadj, A.; Xu, H.; Xu, X.; Qiao, Z. A Study on the Relationship between Land Use Change and Water Quality of the Mitidja Watershed in Algeria Based on GIS and RS. Sustainability 2020, 12, 3510. [Google Scholar] [CrossRef]
- Padovani, C.R. Dinâmica Espaço-Temporal Das Inundações Do Pantanal. Ph.D. Thesis, Ecologia de Agroecossistemas, Universidade de São Paulo, Piracicaba, Brazil, 2010. [Google Scholar] [CrossRef]
- Yu, X.; Hawley-Howard, J.; Pitt, A.L.; Wang, J.-J.; Baldwin, R.F.; Chow, A.T. Water Quality of Small Seasonal Wetlands in the Piedmont Ecoregion, South Carolina, USA: Effects of Land Use and Hydrological Connectivity. Water Res. 2015, 73, 98–108. [Google Scholar] [CrossRef]
- Knox, A.K.; Dahlgren, R.A.; Tate, K.W.; Atwill, E.R. Efficacy of Natural Wetlands to Retain Nutrient, Sediment and Microbial Pollutants. J. Environ. Qual. 2008, 37, 1837–1846. [Google Scholar] [CrossRef] [PubMed]
- Wilcock, R.J.; Müller, K.; van Assema, G.B.; Bellingham, M.A.; Ovenden, R. Attenuation of Nitrogen, Phosphorus and E. coli Inputs from Pasture Runoff to Surface Waters by a Farm Wetland: The Importance of Wetland Shape and Residence Time. Water Air Soil Pollut. 2012, 223, 499–509. [Google Scholar] [CrossRef]
- Jeng, H.; Hong, Y.-J. Assessment of a Natural Wetland for Use in Wastewater Remediation. Environ. Monit. Assess. 2005, 111, 113–131. [Google Scholar] [CrossRef]
- Muniz, C.C. Composição da comunidade íctica em área limnética, relacionada ao ciclo hidrológico nas baías da Salobra e Negra, no Pantanal de Cáceres-MT. Master’s thesis, 2005, Programa De Pós-Graduação Em Ciências Biológicas. Universidade Federal de Mato Grosso, Cuiabá-MT. 71p. Available online: https://ufmt.br/curso/ppgecb/pagina/publicacoes/11175 (accessed on 20 June 2024).
- Menezes Junior, M.Q.d.M.; Junior, E.S.O.; de Souza, C.A. The “Decoada” Phenomenon Effect on the Paraguay River Water Quality, Northern Pantanal. Rev. Ibero-Am. Ciências Ambient. 2020, 11, 612–623. [Google Scholar] [CrossRef]
- de Oliveira, M.D.; Calheiros, D.F.; Padovani, C.R. Mapeamento e Descrição Das Áreas de Ocorrência Dos Eventos de Decoada No Pantanal; Boletim de Pesquisa e Desenvolvimento; Embrapa Pantanal: Corumbá, Brazil, 2013; Volume 121, Available online: https://ainfo.cnptia.embrapa.br/digital/bitstream/item/83348/1/BP121.pdf (accessed on 28 March 2024).
- Uuemaa, E.; Palliser, C.C.; Hughes, A.O.; Tanner, C.C. Effectiveness of a Natural Headwater Wetland for Reducing Agricultural Nitrogen Loads. Water 2018, 10, 287. [Google Scholar] [CrossRef]
- White, J.R.; Reddy, K.R. Biogeochemical Dynamics I: Nitrogen Cycling in Wetlands. In The Wetlands Handbook; Maltby, E.E., Barker, T., Eds.; Wiley-Blackwell: Oxford, UK, 2009; pp. 213–227. [Google Scholar] [CrossRef]
- Fisher, J.; Stratford, C.; Buckton, S. Variation in Nutrient Removal in Three Wetland Blocks in Relation To Vegetation Composition, Inflow Nutrient Concentration And Hydraulic Loading. Ecol. Eng. 2009, 35, 1387–1394. [Google Scholar] [CrossRef]
- Walton, C.R.; Zak, D.; Audet, J.; Petersen, R.J.; Lange, J.; Oehmke, C.; Wichtmann, W.; Kreyling, J.; Grygoruk, M.; Jabłońska, E.; et al. Wetland Buffer Zones for Nitrogen and Phosphorus Retention: Impacts of Soil Type, Hydrology and Vegetation. Sci. Total Environ. 2020, 727, 138709. [Google Scholar] [CrossRef]
- Gericke, A.; Nguyen, H.H.; Fischer, P.; Kail, J.; Venohr, M. Deriving a Bayesian Network to Assess the Retention Efficacy of Riparian Buffer Zones. Water 2020, 12, 617. [Google Scholar] [CrossRef]
- Reddy, K.R.; Kadlec, R.H.; Flaig, E.; Gale, P.M. Phosphorus Retention in Streams and Wetlands: A Review. Crit. Rev. Environ. Sci. Technol. 1999, 29, 83–146. [Google Scholar] [CrossRef]
- Marois, D.E.; Mitsch, W.J.; Song, K.; Miao, S.; Zhang, L.; Nguyen, C.T. Estimating the Importance of Aquatic Primary Productivity for Phosphorus Retention in Florida Everglades Mesocosms. Wetlands 2015, 35, 357–368. [Google Scholar] [CrossRef]
- Neves, A.; Santos, F. Nem Tudo São Flores No Pantanal. Ciência Hoje 2008, 245, 71–73. [Google Scholar]
- Dodds, W.K. The Role of Periphyton in Phosphorus Retention in Shallow Freshwater Aquatic Systems. J. Phycol. 2003, 39, 840–849. [Google Scholar] [CrossRef]
- Richardson, C.J.; Vaithiyanathan, P. Biogeochemical Dynamics II: Cycling and Storage of Phosphorus in Wetlands. In The Wetlands Handbook; Maltby, E., Barker, T., Eds.; Wiley-Blackwell: Oxford, UK, 2009; pp. 228–248. ISBN 978-1-4443-1581-3. [Google Scholar]
- Chang, H.; Makido, Y.; Foster, E. Effects of land use change, wetland fragmentation, and best management practices on total suspended solids concentrations in an urbanizing Oregon watershed, USA. J. Environ. Manag. 2021, 282, 111962. [Google Scholar] [CrossRef]
- Juneau Watershed Partnership. Final Report Duck Creek Nancy Street Wetland Water Quality Assessment. 2018. Available online: https://dec.alaska.gov/media/17879/2018-duck-creek-nancy-st-wetland-assessment.pdf (accessed on 20 June 2024).
- Schmutz, S.; Moog, O. Dams: Ecological Impacts and Management. In Riverine Ecosystem Management: Science for Governing Towards a Sustainable Future; Schmutz, S., Sendzimir, J., Eds.; Aquatic Ecology Series; Springer International Publishing: Cham, Switzerland, 2018; pp. 111–127. ISBN 978-3-319-73250-3. [Google Scholar]
- Sánchez-Carrillo, S.; Álvarez-Cobelas, M.; Angeler, D.G. Sedimentation in the Semi-Arid Freshwater Wetland Las Tablas de Daimiel (Spain). Wetlands 2001, 21, 112–124. [Google Scholar] [CrossRef]
- Crossetti, L.O.; Cardoso, L.d.S.; Callegaro, V.L.M.; da Silva, S.M.A.; Werner, V.R.; Rosa, Z.M.; Marques, D.M.L.d.M. Influence of the Hydrological Changes on the Phytoplantkton Structure and Dynamics in a Subtropical Wetland-Lake System. Acta Limnol. Bras. 2007, 19, 315–329. [Google Scholar]
- Reid, R.; Mosley, L. Comparative Contributions of Solution Geochemistry, Microbial Metabolism and Aquatic Photosynthesis to the Development of High pH in Ephemeral Wetlands in South East Australia. Sci. Total Environ. 2016, 542, 334–343. [Google Scholar] [CrossRef] [PubMed]
- Gitau, J.K. Effectiveness of Natural Wetland in Waste Water Treatment: A Case Study of Tibia Wetland, Limuru Municipality, Kenya. Master’s Thesis, Kenyatta University, Nairobi, Kenya, 2014. [Google Scholar]


Disclaimer/Publisher’s Note: The statements, opinions and data contained in all publications are solely those of the individual author(s) and contributor(s) and not of MDPI and/or the editor(s). MDPI and/or the editor(s) disclaim responsibility for any injury to people or property resulting from any ideas, methods, instructions or products referred to in the content. |
© 2024 by the authors. Licensee MDPI, Basel, Switzerland. This article is an open access article distributed under the terms and conditions of the Creative Commons Attribution (CC BY) license (https://creativecommons.org/licenses/by/4.0/).