Article

pH-Dependent Morphology of Copper (II) Oxide in Hydrothermal Process and Their Photoelectrochemical Application for Non-Enzymatic Glucose Biosensor

by
Trung Tin Tran
1,2,
Anh Hao Huynh Vo
1,2,
Thien Trang Nguyen
1,2,
Anh Duong Nguyen
1,2,
My Hoa Huynh Tran
3,
Viet Cuong Tran
3,* and
Trung Nghia Tran
1,2,*
1
Laboratory of Laser Technology, Faculty of Applied Science, Ho Chi Minh City University of Technology (HCMUT), 268 Ly Thuong Kiet Street, District 10, Ho Chi Minh City 72409, Vietnam
2
Vietnam National University Ho Chi Minh City (VNUHCM), Linh Trung Ward, Thu Duc, Ho Chi Minh City 71308, Vietnam
3
VKTECH Research Center, NTT Hi-Tech Institute, Nguyen Tat Thanh University, 298-300A Nguyen Tat Thanh Street, Ward 13, District 4, Ho Chi Minh City 72820, Vietnam
*
Authors to whom correspondence should be addressed.
Appl. Sci. 2024, 14(13), 5688; https://doi.org/10.3390/app14135688
Submission received: 7 June 2024 / Revised: 26 June 2024 / Accepted: 28 June 2024 / Published: 29 June 2024

Abstract

:
In this study, we investigated the influence of pH on the hydrothermal synthesis of copper (II) oxide CuO nanostructures with the aim of tuning their morphology. By varying the pH of the reaction medium, we successfully produced CuO nanostructures with three distinct morphologies including nanoparticles, nanorods, and nanosheets according to the pH levels of 4, 7, and 12, respectively. The observed variations in surface morphology are attributed to fluctuations in growth rates across different crystal facets, which are influenced by the presence of intermediate species within the reaction. This report also compared the structural and optical properties of the synthesized CuO nanostructures and explored their potential for photoelectrochemical glucose sensing. Notably, CuO nanoparticles and nanorods displayed exceptional performance with calculated limits of detection of 0.69 nM and 0.61 nM, respectively. Both of these morphologies exhibited a linear response to glucose within their corresponding concentration ranges (3–20 nM and 20–150 nM). As a result, CuO nanorods appear to be a more favorable photoelectrochemical sensing method because of the large surface area as well as the lowest solution resistance in electroimpedance analysis compared to CuO nanoparticles and nanosheets forms. These findings strongly suggest the promising application of hydrothermal-synthesized CuO nanostructures for ultrasensitive photoelectrochemical glucose biosensors.

1. Introduction

Glucose monitoring occupies a vital role in biosensor research due to its well-established role as a key energy element and diagnostic indicator for diabetes mellitus. Since the first enzyme electrode was described in 1962, the field of glucose biosensing research has experienced amazing growth and progress. While both enzyme and non-enzyme recognition elements have been used in numerous sophisticated glucose detection techniques, the most popular ones are electrochemical and optical techniques [1,2]. By reacting with glucose, modified electrodes are used in electrochemical procedures to produce an electrical signal that is proportionate to the amount of glucose present in the sample [3,4,5]. In addition, optical approaches often rely on the color or fluorescence changes of indicators in response to glucose, which makes it possible to determine glucose levels precisely using optical measurement techniques [2,6]. Both of the mentioned methods can use enzymatic or non-enzymatic recognition agents [1,7]; however, with the significant development of nanotechnology, the photoelectrochemical (PEC) analysis method has garnered substantial attention because of its high sensitivity, selectivity, low detection threshold, and cost-effectiveness [8,9,10,11]. They combine photoelectric conversion and electrochemical processing [12], inheriting the advantages of conventional sensors while minimizing excitation source noise through signal separation [8,13]. These things lead to improvements in the sensitivity and detection limits of the sensing target. Upon light-induced excitation of the nanomaterials acting as photoactive materials, photogenerated electrons participate in redox reactions with target analytes adsorbed on the sensor surface. The resulting change in signal intensity, which is proportional to the adsorbed analyte amount, enables quantitative analysis of its concentration.
Recent advances in materials technology have promoted the progress of PEC biosensors as a prominent research area [14,15,16]. Within the field of glucose biosensors, researchers have actively developed various PEC configurations using various nanomaterials and their structures [17,18,19,20]. In particular, research is moving toward non-enzymatic materials (free enzyme/mimic enzyme/nanoenzymes) [21,22,23,24] due to limitations in the thermal and chemical stability of glucose oxidase G O x , which is an enzyme that is commonly used in a glucose biosensor. Cao et al. used gold nanoparticles A u NPs that acted as a G O x mimic enzyme in fluorine-doped tin oxide ( F T O ) modified with P b S quantum dots and S i O 2 nanospheres for the application of photoelectrochemical glucose detection [25].
Enzyme-free glucose PEC sensors have attracted significant attention using metal oxides [26,27,28,29,30,31]. Several metal oxides with semiconducting properties, such as C u O , titanium dioxide ( T i O 2 ), zinc oxide ( Z n O ), and nickel (II) oxide ( N i O ), were used for surface modification [30,32,33,34,35,36,37,38,39,40,41,42]. Among them, the p-type C u O , with a narrow bandgap of 1.2–2 eV [43], stands out for its robust catalytic activity under alkaline conditions, making it a promising candidate for glucose oxidation. Cory et al. successfully electrodeposited a C u O film onto a conductive glass substrate, achieving a broad glucose detection range of up to 29 mM with a detection limit of 59.5 μ M at a bias of 0.6 V [35]. A biosensor must discriminate between electroactive interfering species. In a typical physiological sample, interfering species such as ascorbic acid (AA), dopamine (DA), and uric acid (UA) coexist with glucose. C u O nanomaterials have been shown to have a very high specificity for reactions with glucose in the presence of interfering substances [44,45]. Many strategies for developing C u O materials have been reported regarding their synthesis method and morphology for the detection of PEC glucose [27,35,36,45,46]. However, the hydrothermal synthesis method for C u O has not yet been widely reported, especially in the process of controlling the morphology of this material.
This study focused on the impact of pH-controlled hydrothermal synthesis on the morphologies of nanostructured C u O and their influence on the performance of photoelectrochemical glucose.

2. Materials and Methods

2.1. Chemicals

For the hydrothermal synthesis of C u O nanostructures, the following analytical grade chemicals were used: copper (II) nitrate trihydrate ( C u ( N O 3 ) 2 · 3 H 2 O ) (≥99% purity, Merck KGaA, Darmstadt, Germany), sodium hydroxide N a O H (≥99% purity, Merck KGaA, Darmstadt, Germany), and nitric acid ( H N O 3 ) (Merck KGaA, Darmstadt, Germany). Phosphate-buffered saline solution (PBS, pH 7.4) and D-glucose were used for the photoelectrochemical (PEC) experiment. The indium tin oxide ( I T O )-coated glass (Redoxme AB, Norrköping City, Sweden) was used as a working electrode (WE). Chemicals for sample filtration and surface treatment of I T O electrodes include distilled water, ethanol, acetone, and hydrochloric acid ( H C l ) (Merck KGaA, Darmstadt, Germany) in which H C l was only used in the surface treatment of I T O electrodes.

2.2. Apparatus

The samples underwent characterization using various techniques to analyze their morphology, crystal structure, and optical properties. The morphologies of the samples were examined using a high-resolution scanning electron microscope (SEM), specifically a Hitachi S-4800 model (Hitachi High-Tech Corporation, Tokyo, Japan). Crystal structures analyses were performed using a D8 Advance Eco X-ray diffractometer (Bruker Corporation, Karlsruhe, Germany, Germany) employing the Cu K α with the wavelength of 0.154 nm, the potential radiation of 40 kV, and the amperage of 25 mA. An Agilent Cary 60 UV-VIS Spectrophotometer (Agilent Technologies, Santa Clara, CA, USA) was used to investigate the optical characteristics of the sample through UV-VIS absorption spectroscopy. The pH of the solutions was precisely adjusted using a Hi98115 Hanna pH meter (Hanna Instrument, Smithfield, Rhode Island, USA) for the synthesis process.
All PEC experiments were performed on a DY2100 mini potentiostat (Digi-Ivy, Inc., Austin, TX, USA) with a rhodium-plated counter-electrode (CE, model 7–metal foam, Redoxme AB, Norrköping City, Sweden) and ( A g / A g C l reference electrode (RE) (Redoxme AB, Norrköping City, Sweden). A light-emitting diode (LED) with a light intensity of 20 mW·cm−2 was used as an irradiation source with a wavelength of 395 nm. Electrochemical impedance spectra (EIS) were recorded using a PGSTAT101 electrochemical workstation (Metrohm Autolab, Utrecht, The Netherlands) in the frequency range spanning from 0.01 Hz to 100 kHz.

2.3. Synthesis of the C u O Nanostructures and Working Electrode Preparation

Figure 1 shows the hydrothermal procedure for synthesizing the C u O nanostructure including nanoparticles (NPs), nanorods (NRs), and nanosheets (NSs). Firstly, 1.21 g of C u ( N O 3 ) 2 · 3 H 2 O was added to 50 mL of distilled water acting as a solvent in these experiments, which was gradually followed by slowly adding 0.8 g N a O H while stirring the prepared C u ( N O 3 ) 2 solution. The mixture was then stirred at 450 rpm for 30 min using a magnetic stirrer. After the magnetic stirring process, the mixture was pH adjusted at 4, 7, and 12, respectively, using H N O 3 solution. These steps were continued at room temperature. These samples were then hydrothermally treated at 180 °C for 18 h. The mixtures obtained after the hydrothermal process were rinsed three times with a centrifuge at 3500 rpm with distilled water, alcohol, and acetone, respectively, to remove the remaining impurities. Finally, the C u O samples were dried at 100 °C for 1 h to remove the rinse solution.
For WE preparation, I T O -coated glass substrates (15 mm × 4 mm) were first surface-treated by dipping in a solution H C l to remove oxide impurities before ultrasonication for 15 min in a sequence of water, ethanol, and acetone, respectively, to remove surface contaminants. Then, each synthesized sample of C u O was prepared as an 8 mg/50 mL distilled water suspension using ultrasonication at 5 °C for 40 min. This low-temperature ultrasonication facilitated a more homogeneous dispersion of the C u O nanostructures. The prepared C u O suspensions were then spray-coated onto the I T O electrodes, which was followed by annealing at 300 °C for 1 h to evaporate all remaining water while increasing the crystallinity of the coated C u O on the I T O electrode.

2.4. Photoelectrochemical Glucose Detection

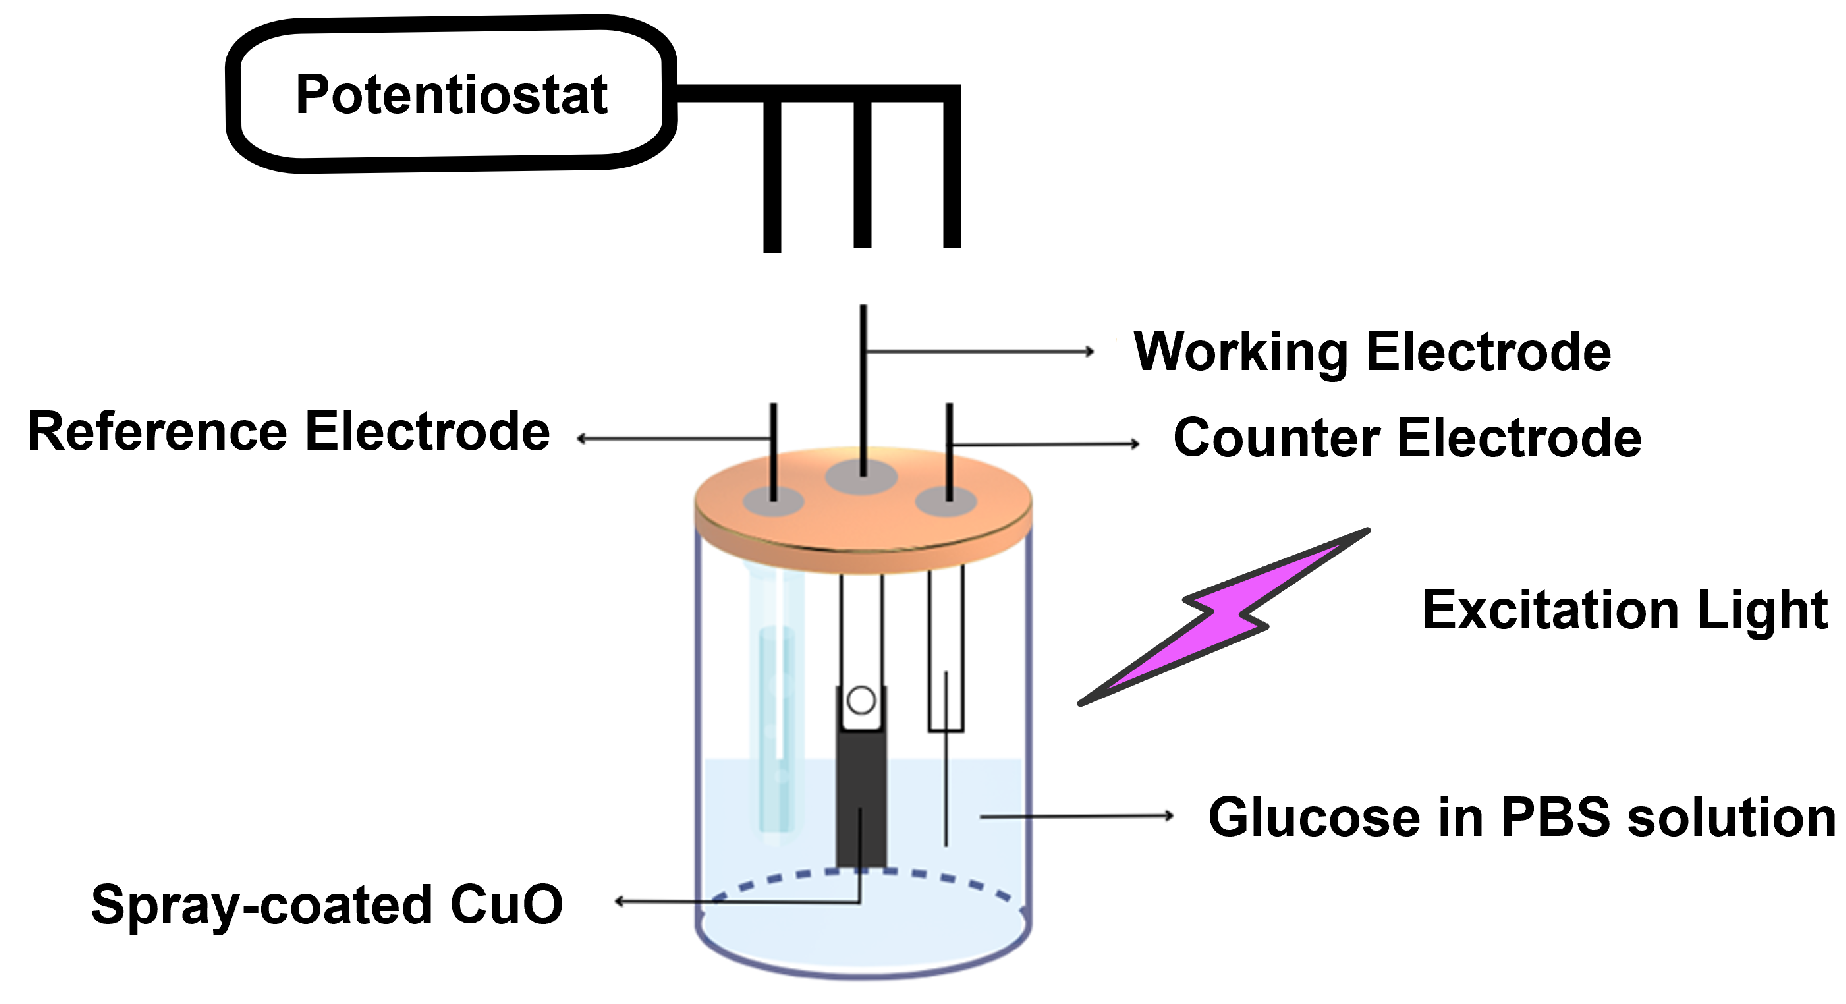
The PEC experimental system employed in this work is illustrated in Figure 2. The system utilizes photoamperometric measurement, with 395 nm LEDs providing the excitation light source. Measurements were carried out over 440 s, and the glucose concentrations dissolved in the phosphate-buffered saline (PBS, pH = 7.4) gradually increased from 0 to 150 nM. The light source was turned on and off every 20 s after a 200 s settling time to allow the system to stabilize before measurements.

3. Results and Discussions

3.1. Characterization of Synthesized C u O Nanostructures

The crystal structures of power samples obtained after the synthesizing process were analyzed with the results showing on the XRD patterns (Figure 3). Three pH-controlled samples at values of 4, 7, and 12 showed characteristic diffraction peaks of monoclinic C u O based on JCPDS card File No. 48-1548 including the peaks corresponding to the Bragg angles of 32.6° (110), 35.7° (002), 38.8° (111), 49° (112), 53.6° (020), 58.3° (202), 61.8° (113), 66.2° (310), 68.4° (220), 72.8° (311), and 75.4° (004). The XRD analysis revealed no detectable impurities in the samples. The peaks correspond exactly with the reference C u O pattern obtained under pH-controlled conditions of 4 and 12. Interestingly, in the case of the pH-controlled condition of 7, the sample lacked the characteristic peaks at the (020) and (011) faces, but other signature peaks of C u O were still present.
As shown in Figure 4, SEM images show C u O synthesized under controlled pH conditions. The pairs (a, b), (c, d), and (e, f) of Figure 4 correspond to pH-controlled values of 4, 7, and 12, respectively. The analysis reveals a clear influence of the controlled pH value before the hydrothermal process on the morphology of the C u O samples. C u O exhibits NPs morphology at pH 4, transitioning to NRs morphology at pH 7, and finally forming nanosheet NSs morphology at pH 12.
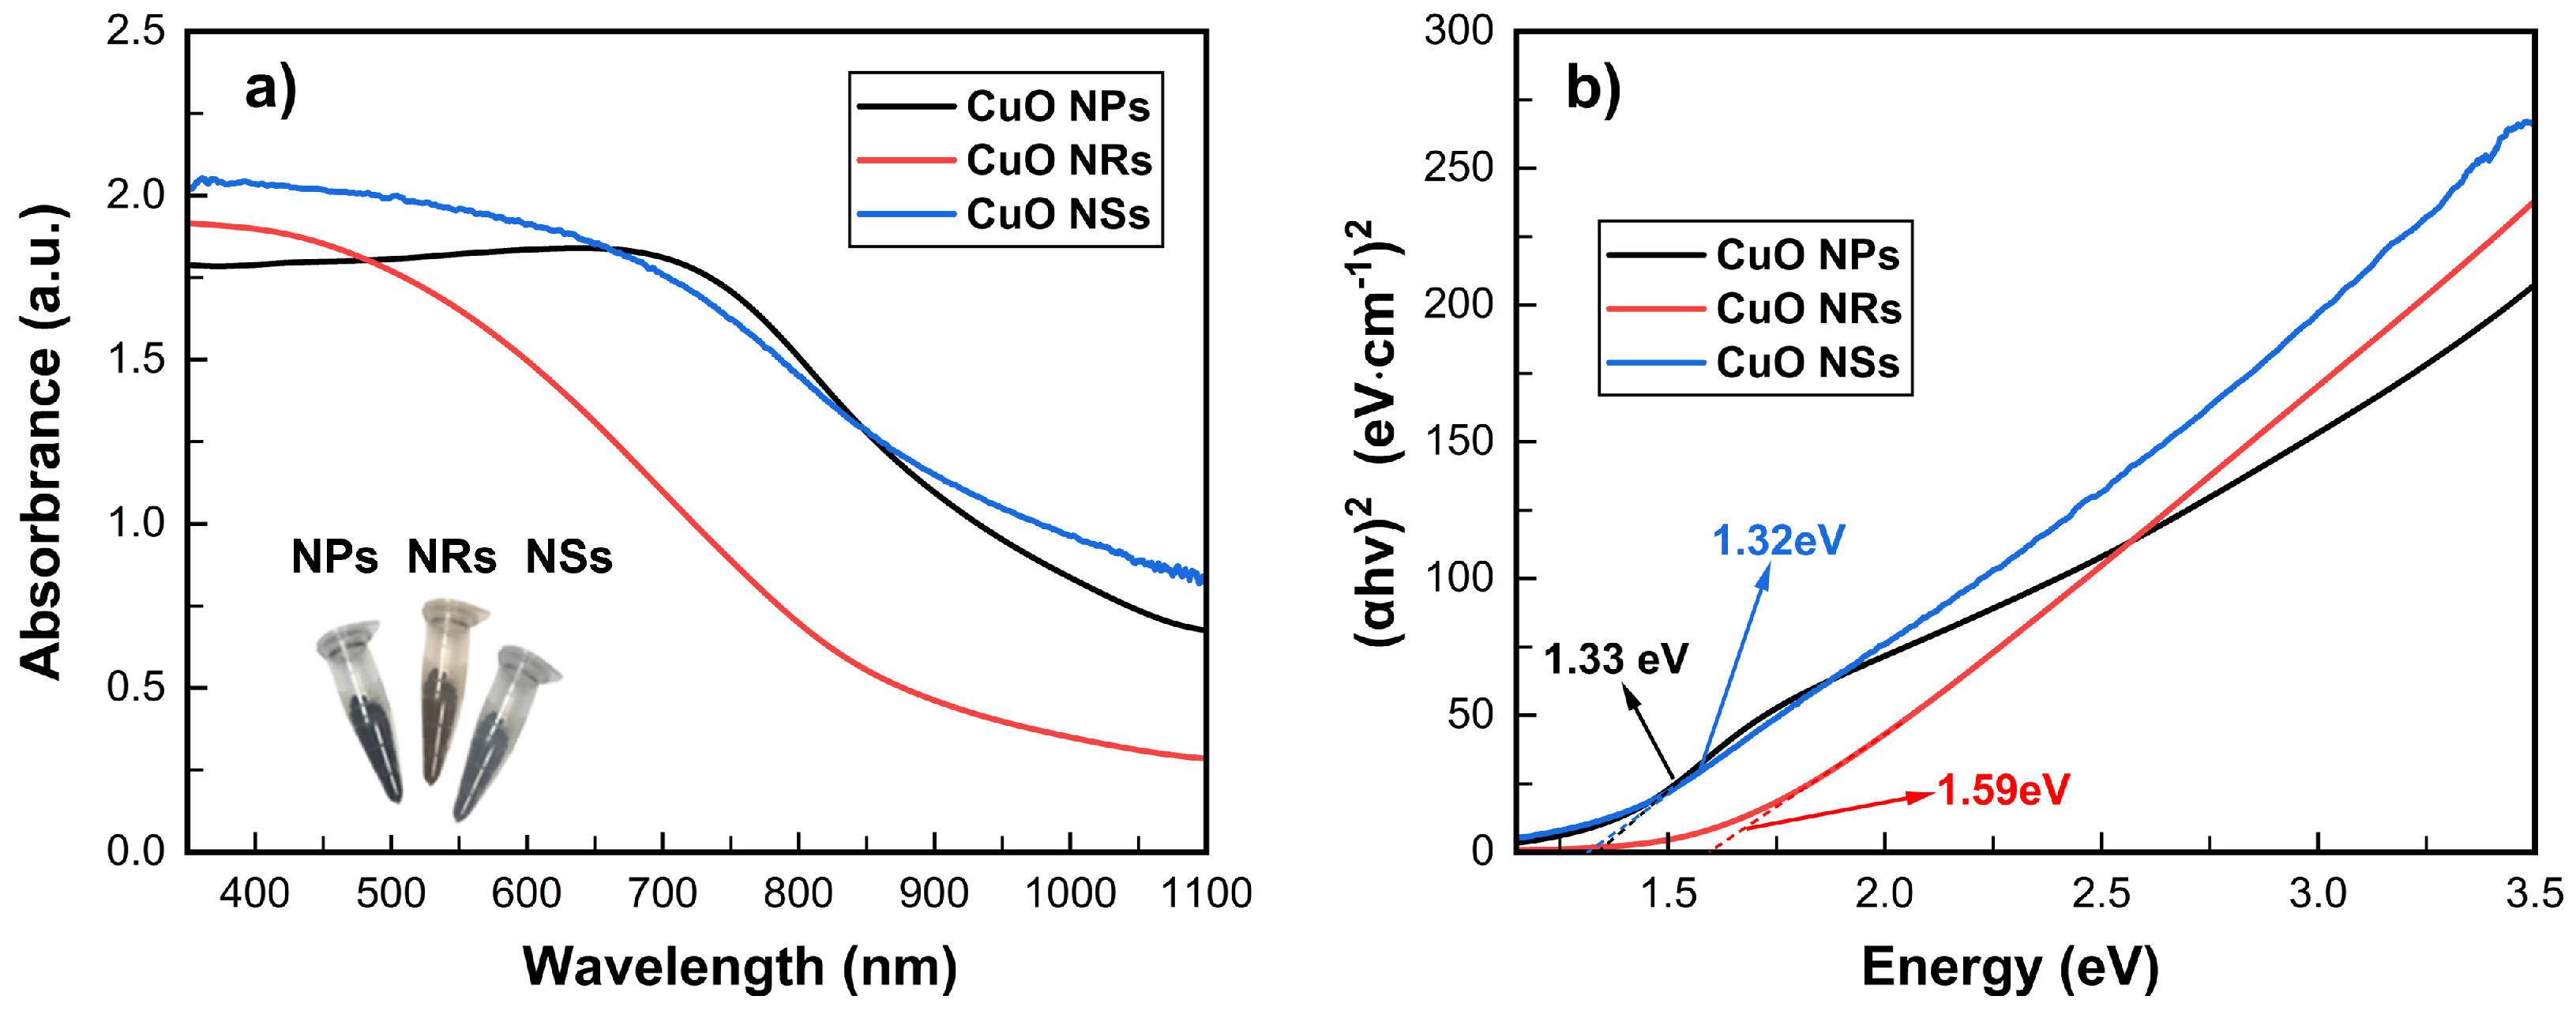
Figure 5a presents the UV-VIS absorption spectra of C u O nanostructures with different morphologies (NPs, NRs, and NSs). All three materials exhibit light absorption in the ultraviolet and visible regions. The C u O NPs and NSs demonstrate a broad absorption band that varies from approximately 350 to 750 nm. Notably, the NPs exhibit a peak absorption around 700 nm, while the NSs show higher absorption below 650 nm. In contrast, the C u O NRs display a narrower absorption region, primarily below 500 nm, compared to the other morphologies. As shown in Figure 5b, the bandgap values calculated using the Tauc plot for C u O NPs, NRs, and NSs were 1.33 eV, 1.59 eV, and 1.32 eV, respectively. These values are consistent with previous studies reporting a range of bandgap values (1.2 to 2.0 eV) for C u O with different morphologies [43].

3.2. Hypothesis on the Formation of C u O in Different Forms

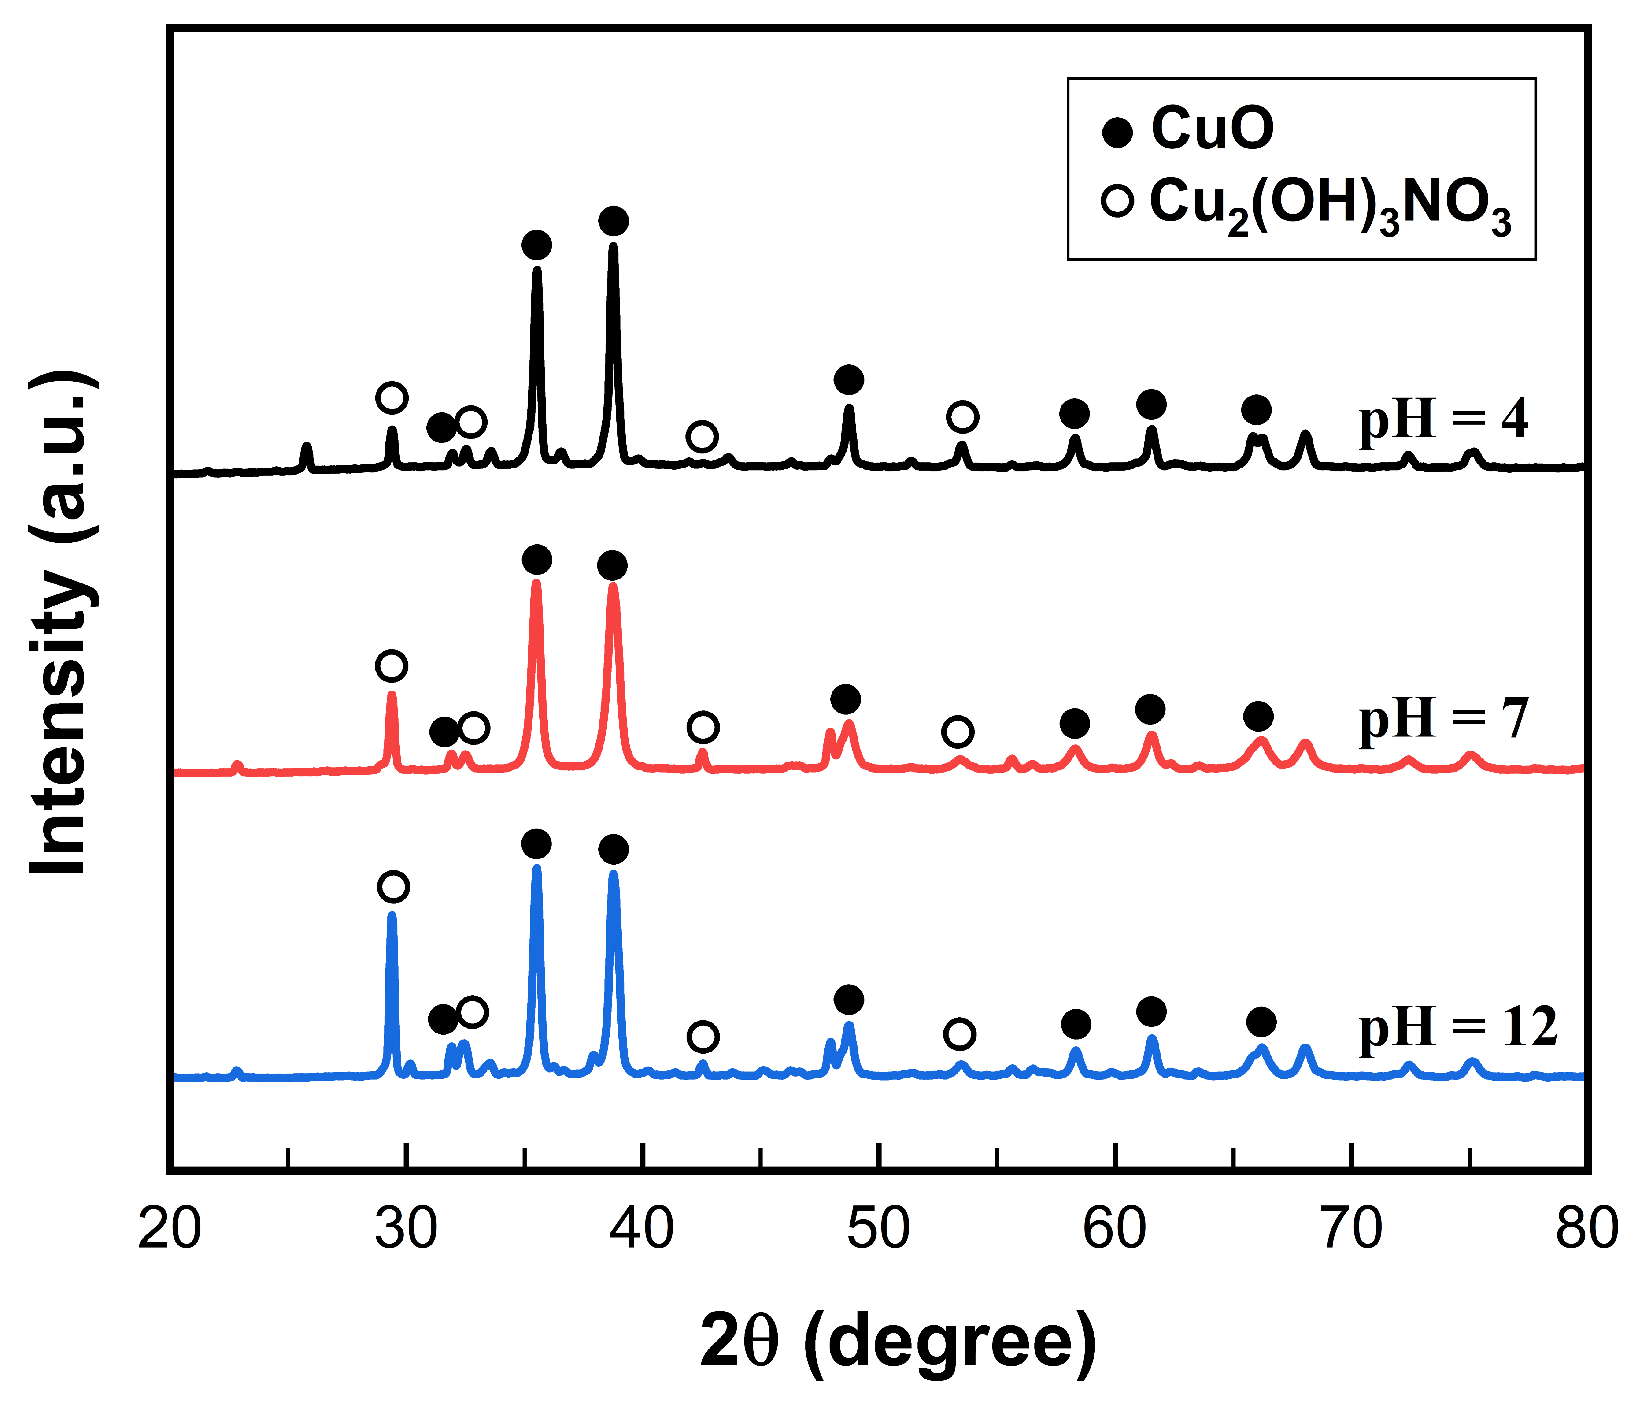
The hydrothermal synthesis of C u O nanostructures with diverse morphologies (NPs, NRs, and NSs) is a complex process. The presence of precipitated copper hydroxynitrate ( C u 2 ( O H ) 3 N O 3 ), a basic copper salt [47], significantly influences the process. Figure 6 shows the XRD pattern of a sample after 15 h of hydrothermal anealing stage, which is a point where the process was not completed. This pattern reveals the presence of C u 2 ( O H ) 3 N O 3 alongside C u O at various controlled pH levels. The C u 2 ( O H ) 3 N O 3 diffraction peaks are observed at 29.55°, 31.94°, 42.12°, and 54.1°, which are corressponding with the JCPDS card File No. 77-0148.
The intensity of the C u 2 ( O H ) 3 N O 3 peak at 29.55° in the XRD pattern (Figure 6) appears to be proportional to the initial precursor solution’s pH level. This suggests that the amount of C u 2 ( O H ) 3 N O 3 produced during the incomplete hydrothermal process depends on the pH. Furthermore, C u 2 ( O H ) 3 N O 3 can thermally decompose into C u O (Equation (1)) [48]. These indications show the significant influence of this basic salt on the morphology of C u O in which the produced C u 2 ( O H ) 3 N O 3 quantity directly affects the morphology of the final C u O sample.
C u 2 ( O H ) 3 N O 3 ( s ) C u O ( s ) + H N O 3 ( g ) + H 2 O ( g )

3.3. Electrochemical Impedance Spectroscopy of I T O / C u O Electrodes

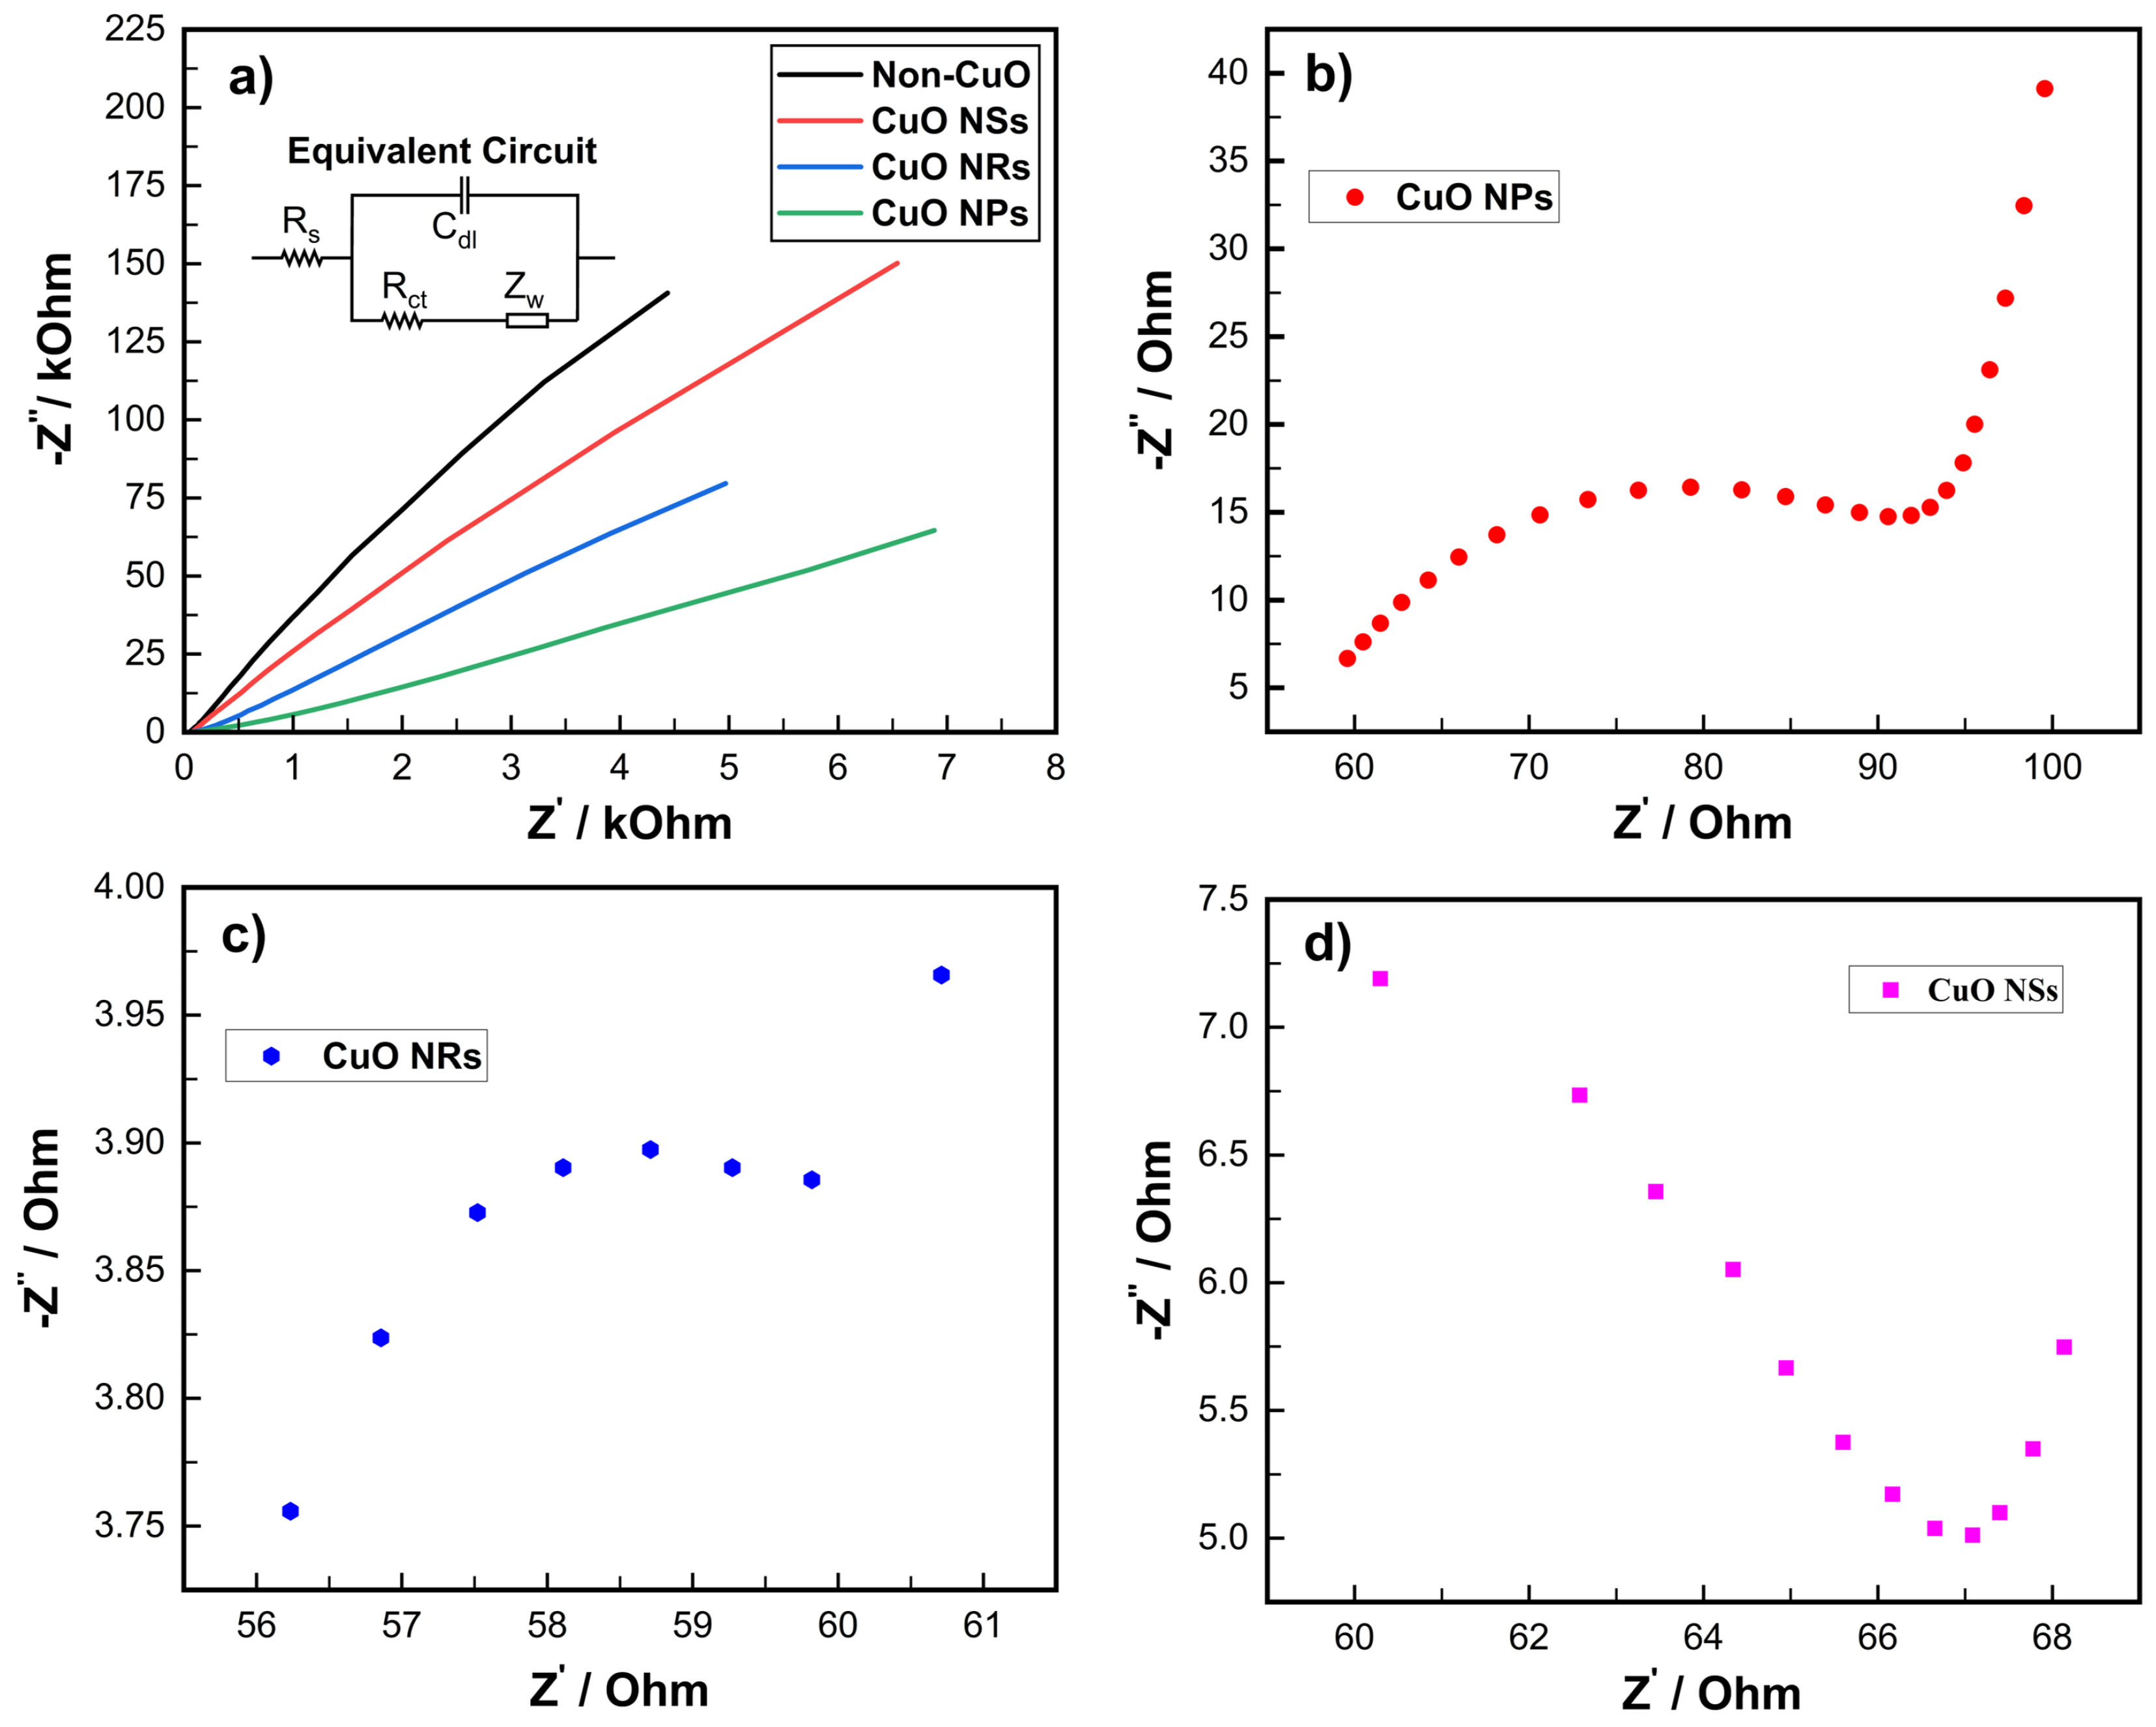
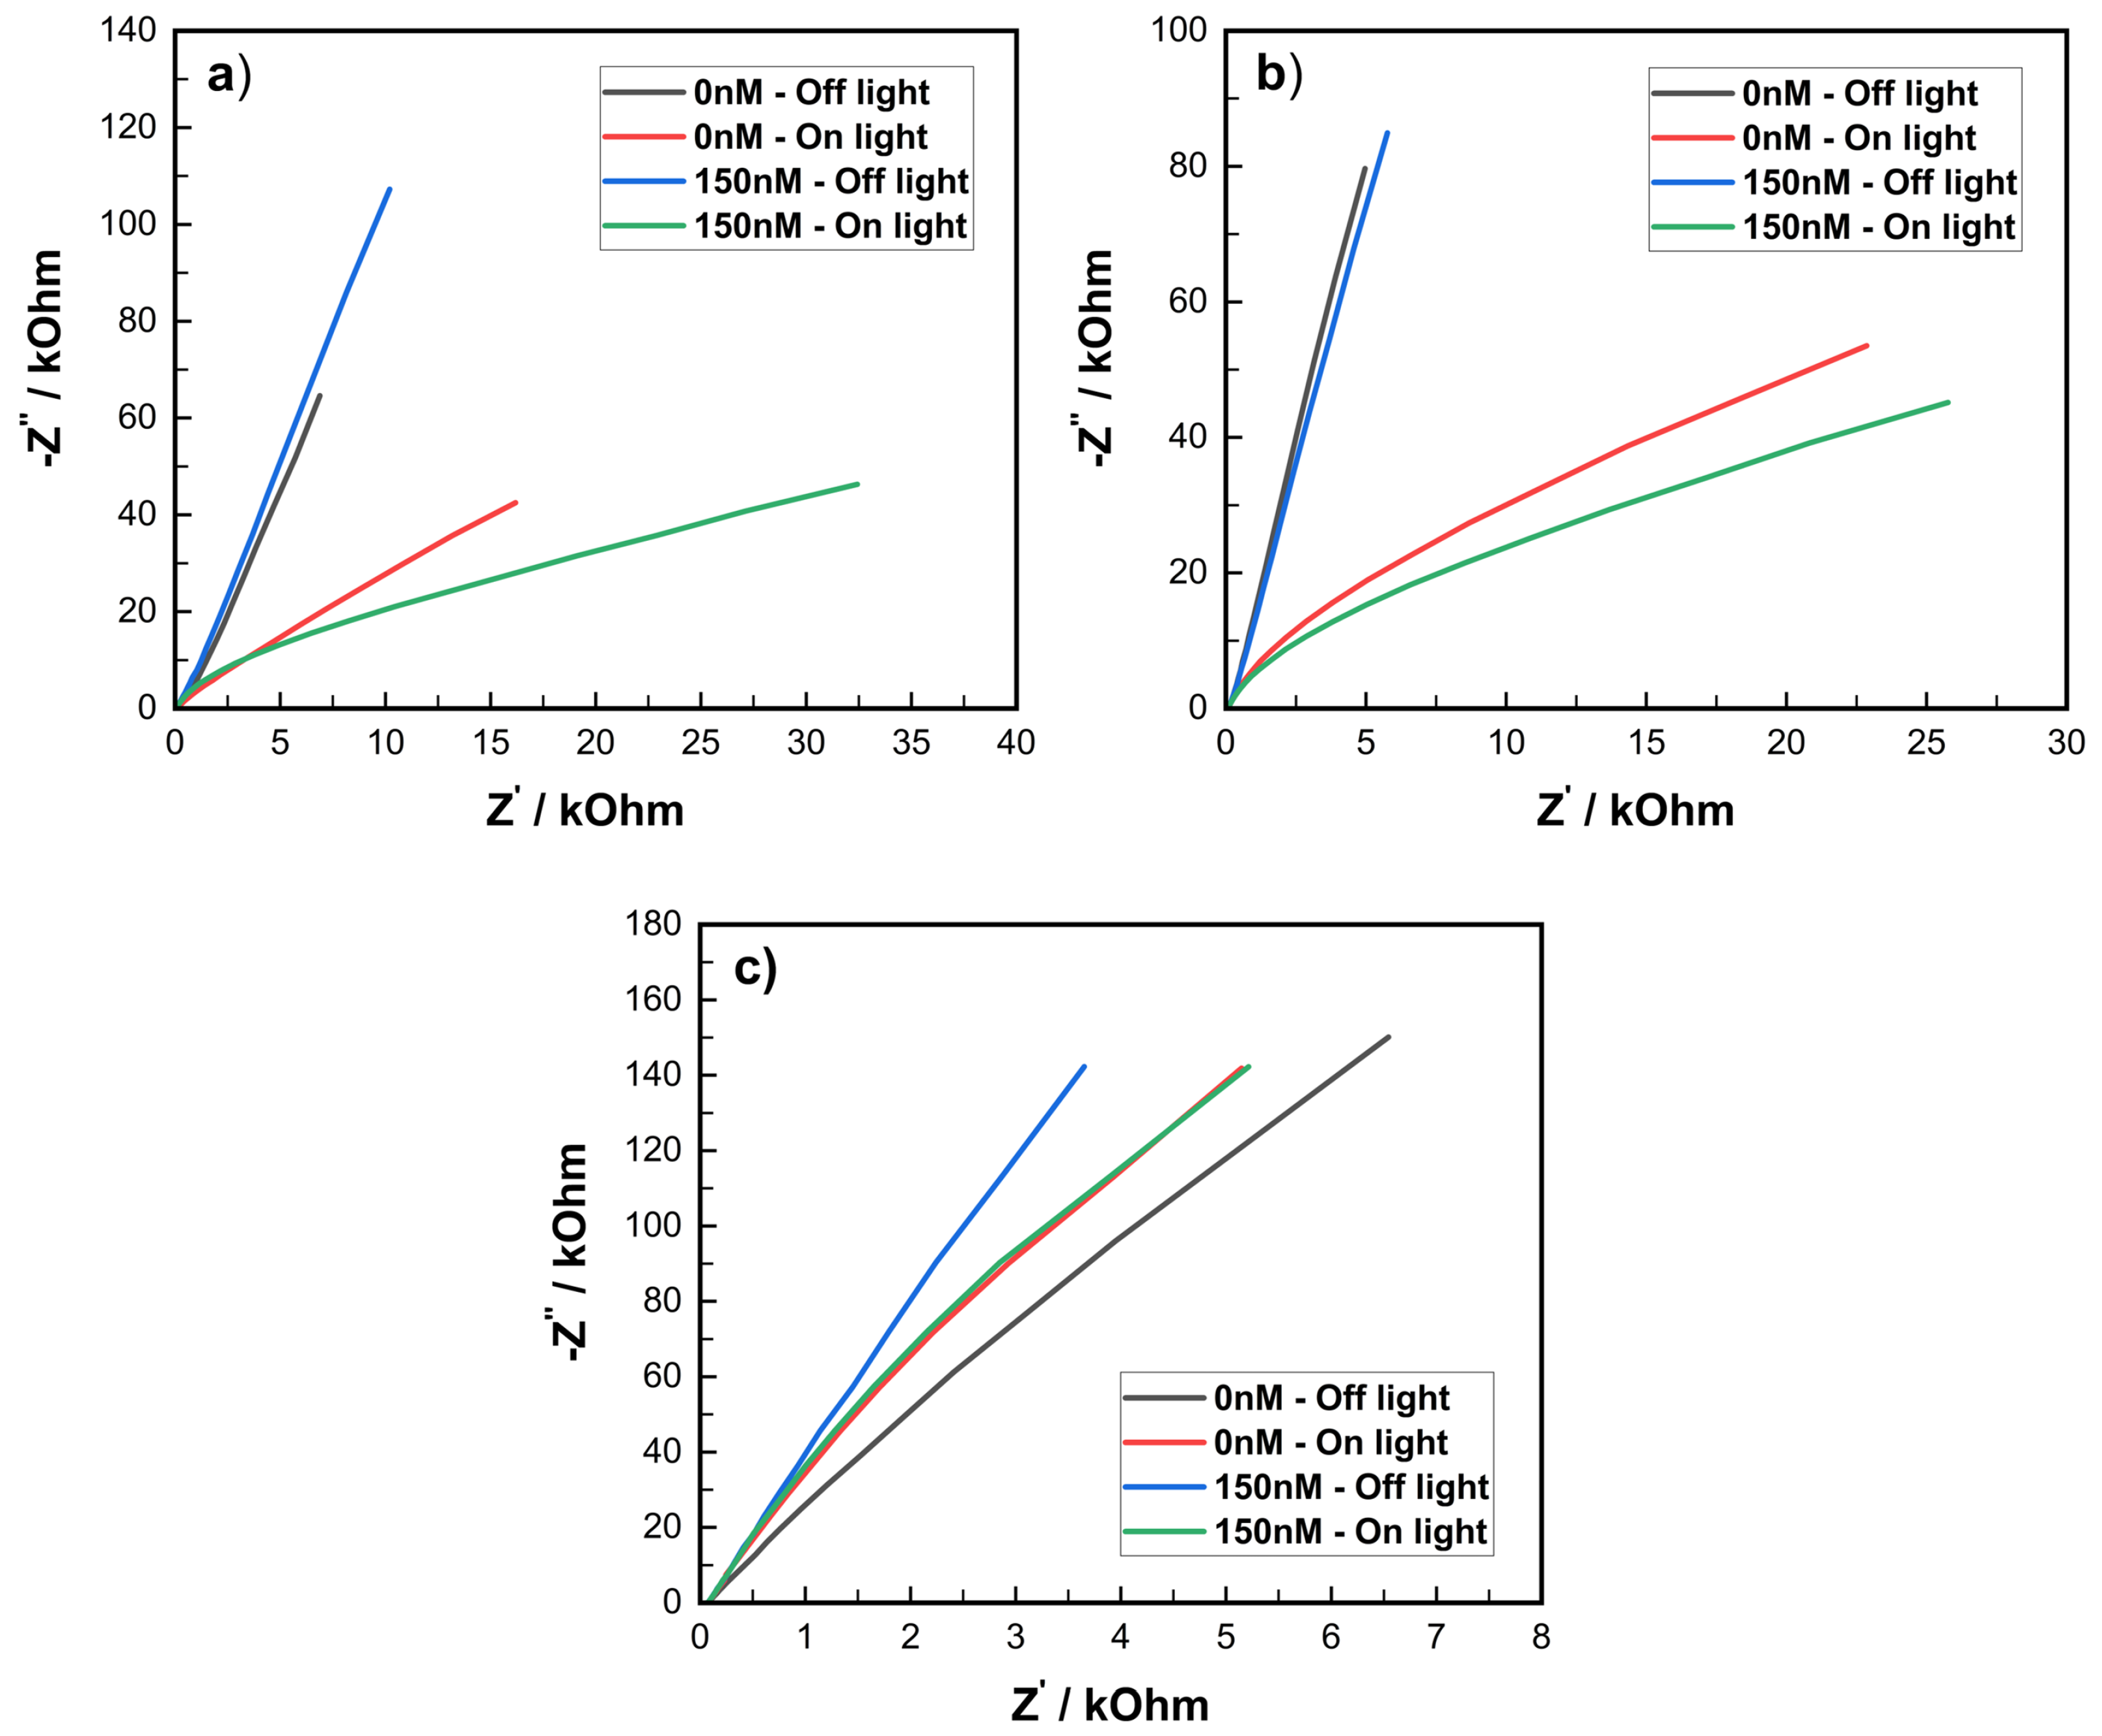
Electrochemical impedance spectroscopy (EIS) was employed at the open-circuit potential to obtain information on electron transfer between the electrolyte and the electrode surface. The Nyquist plots of the three synthesized C u O electrode types (NPs, NRs, and NSs) tested with the PBS solution without glucose (see Figure 7) were measured in the frequency range of 0.1 Hz to 100 kHz, revealing distinct features. The low-frequency region (Figure 7a) displays a linear region with an inset showing the equivalent circuit (Rs: solution resistance, Rct: charge-transfer resistance, Cd: double-layer capacitance; Zw: Warburg impedance) [49,50]. The straight lines in the low-frequency region correspond to Zw, indicating electrolyte diffusion within the C u O structures. In particular, the C u O NPs exhibit the lowest slope, which implies the fastest diffusion rate in three morphologies. The high-frequency regions of the Nyquist plots for C u O NPs, NRs, and NSs (Figure 7b–d) exhibit approximate semicircles, with corresponding equivalent series resistance (ESR) values of 60 Ω , 56 Ω , and 60 Ω , respectively. These ESR values are reflected by the the intercept on the real axis at high frequency, encompassing the electrolyte resistance, intrinsic electrical resistance of the spray-coated C u O , and the contact resistances between spray-coated C u O and I T O electrodes [49]. The analysis of Rct estimated from the diameters of the semicircles on the real axis reveals the highest Rct value for C u O NPs. This indicates that I T O / C u O NRs and I T O / C u O NSs exhibit significantly higher electrochemical activity compared to I T O / C u O NPs. Although the surface-area-to-volume ratio of C u O NPs is the largest, their particle-like structure leads to a diminished ability to transport charge from the C u O nanomaterials’ interface with the electrolyte to the I T O electrode. In contrast, this transport capability is much more efficient in the C u O NRs and C u O NR forms.
For the photoelectrochemical response, the EIS characterizes three morphological types of I T O / C u O electrodes with a 150 nM glucose in PBS solution under the illuminated and non-illuminated conditions of the 395 nm light source (Figure 8). The results reveal significant changes in the slope line at low frequencies in the response of C u O NPs and C u O NRs materials (Figure 8a,b) to light stimulation, while C u O NSs demonstrated relatively minor variations (Figure 8c). This could be attributed to the relatively large size of the C u O NSs, which limited the possibility of generating electron–hole pairs. Consequently, the recombination of these electron–hole pairs is substantial, resulting in the reduced production of electrons that participate in the reaction with glucose. All of the above impedance results explain the best photoelectrochemical performance of the C u O NRs electrode for glucose sensing.

3.4. Photoamperometric Response with Glucose

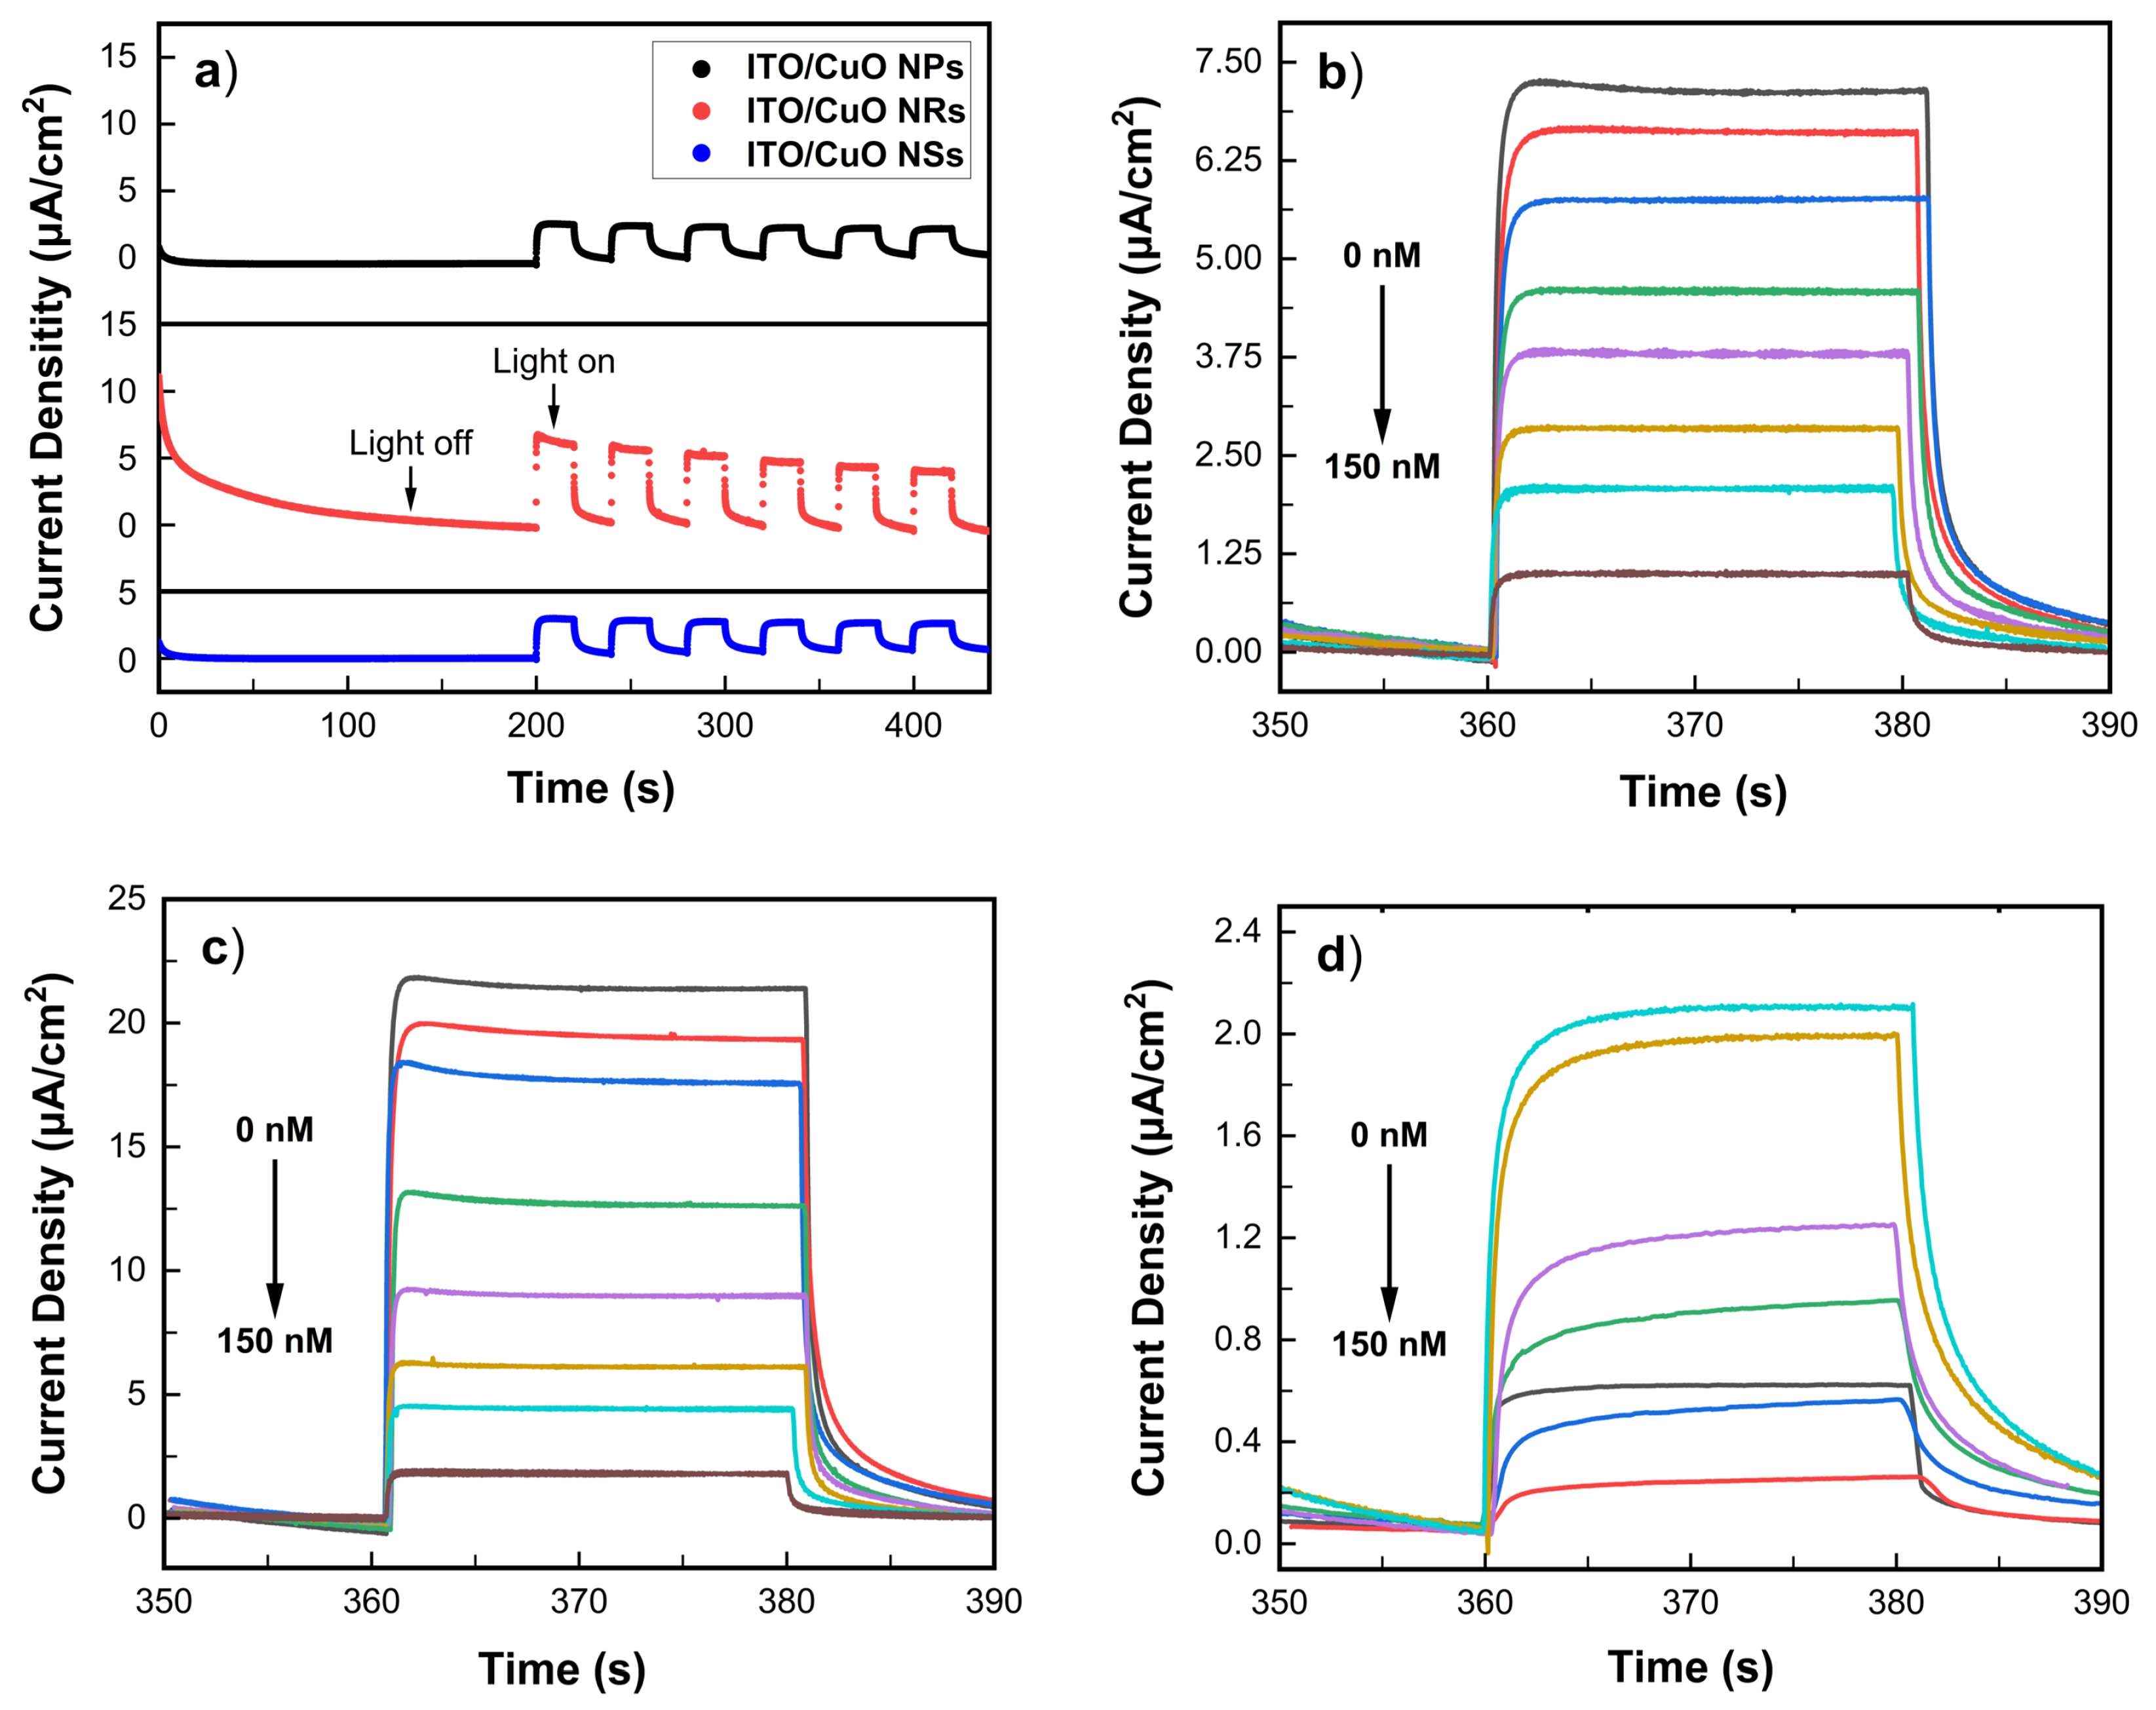
Figure 9a depicts the photocurrent response of the I T O / C u O (NPs, NRs, and NPs) electrodes in 100 nM glucose dissolved in PBS solution under 395 nm LED light irradiation at an applied potential of 0.2 V. Under illumination, the I T O / C u O NRs electrode exhibits the highest photocurrent (5.5 μ A), while other electrode types show lower values (around 2 μ A). Figure 9b–d reveal the photocurrent response of the I T O / C u O electrodes to different glucose concentrations (0–150 nM). In particular, I T O / C u O NRs and I T O / C u O NPs exhibit a linear decrease in photocurrent with increasing glucose concentration, indicating a sensitive response. However, the I T O / C u O NSs electrode does not show this linear behavior.
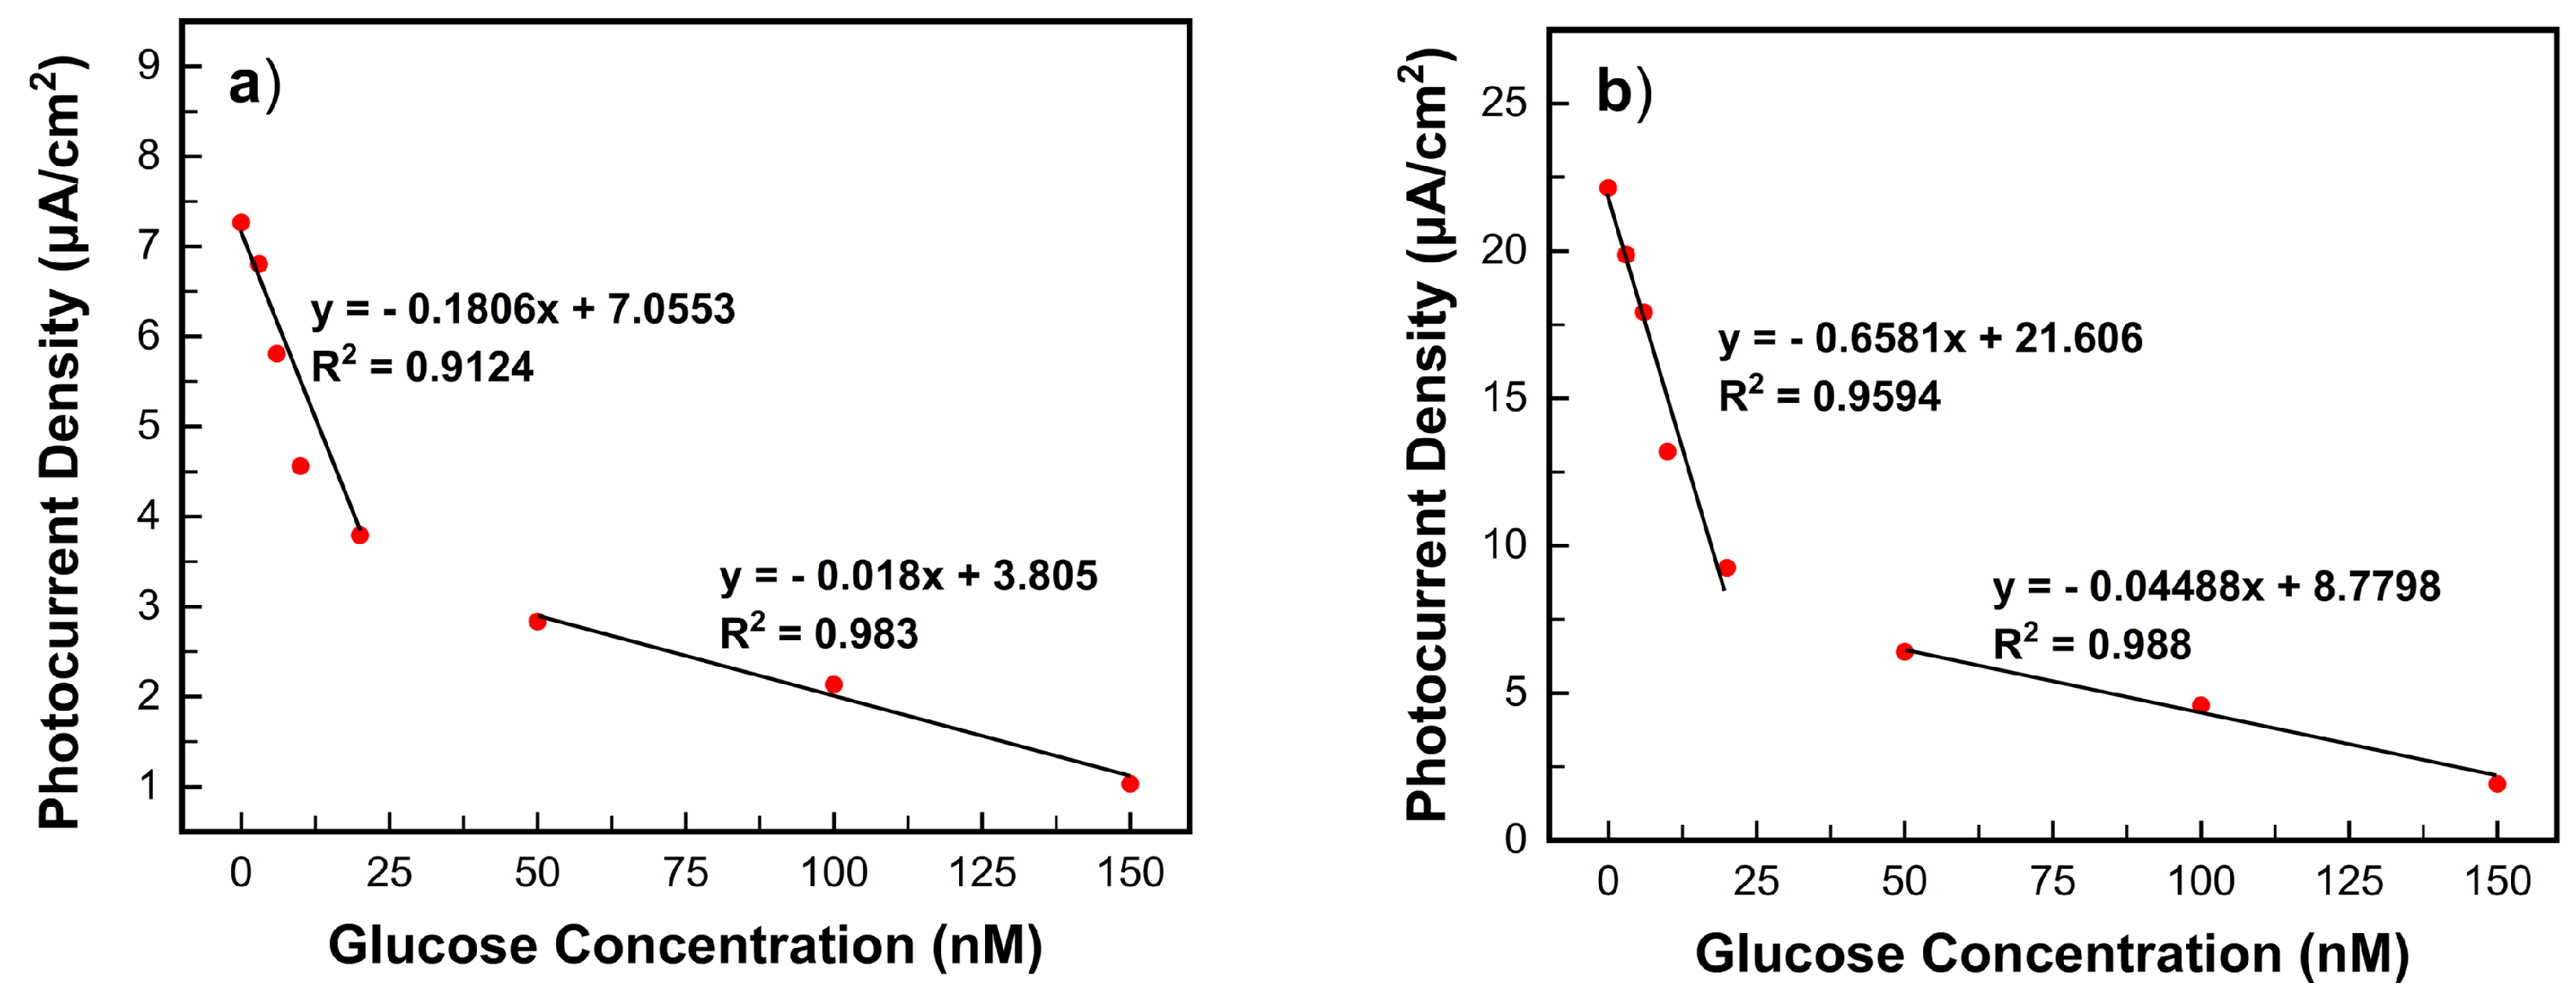
Following the response of photocurrent to the glucose concentrations, it is obvious that the photocurrent density decreased steadily, which is proportional to the increasing glucose concentration. However, the photocurrent signal of the I T O / C u O NSs was neither stable nor linearly increasing, as shown in Figure 9d. Therefore, the results focused on the linearity of I T O / C u O NPs and I T O / C u O NRs. Figure 10 illustrates the respone of the photocurrent to the glucose concentration of I T O / C u O NPs (Figure 10a) and I T O / C u O NRs (Figure 10b), which include two linear regions. For the I T O / C u O NPs, the results has the following these lines: J ( μ A·cm−2) = −0.180 · C (nM) + 7.0553 and J ( μ A · cm−2) = 0.018 · C (nM) + 3.805, while the linear line fitting of I T O / C u O NRs are J ( μ A · cm−2) = −0.6581 · C (nM) + 21.606 and J ( μ A · cm−2) = −0.04488 · C (nM) + 8.7798; in which J is the density of photocurrent, C is the glucose concentration, and the correlation coefficient (R2) is higher than 0.9. The relative standard deviations (RSDs) of eight I T O / C u O NPs samples were 0.38% and 0.84%, respectively. The limit of detection (LOD) was calculated by the formula LOD = 3 σ /s ( σ is the standard deviation of the blank signal and s is sensitivity) [50]. The calculated LODs of I T O / C u O NPs and I T O / C u O NRs are 0.69 nM and 0.61 nM glucose, respectively. Additionally, the photoelectrochemical performance of the C u O nanostructures’ electrodes was compared with the other photoelectrochemical glucose sensing reports, as summarized in Table 1. Our I T O / C u O nanostructures, including the NPs and NRs, exhibited competitive performance, high sensitivity (3–150 nM), and a low detection limit.
The C u O nanostructures exhibit the sensitivity to glucose at the nanomolar level, which is attributed to the nanosized structure of the material deposited onto the I T O electrode, and the essential role of the PEC method in detecting extremely low-level signals is due to its ability to eliminate background noise. These C u O NPs and C u O NRs exhibited two linear ranges. This linearity arises from the generation of electrons for the oxidation of glucose, which continues until signal saturation. The subsequent linear range may have resulted from the enhanced adsorption of glucose molecules on the effective surface of the C u O nanomaterials as the glucose concentration increased. However, the linear range observed in this experiment is relatively short, which is approximately 150 nM for both C u O NPs and NRs. This observation can be attributed to the relatively low quantum efficiency, which generates electron–hole pairs and their recombination. Another significant factor is the limited amount of practical C u O nanomaterials that act as catalysts for glucose oxidation on the electrode surface.
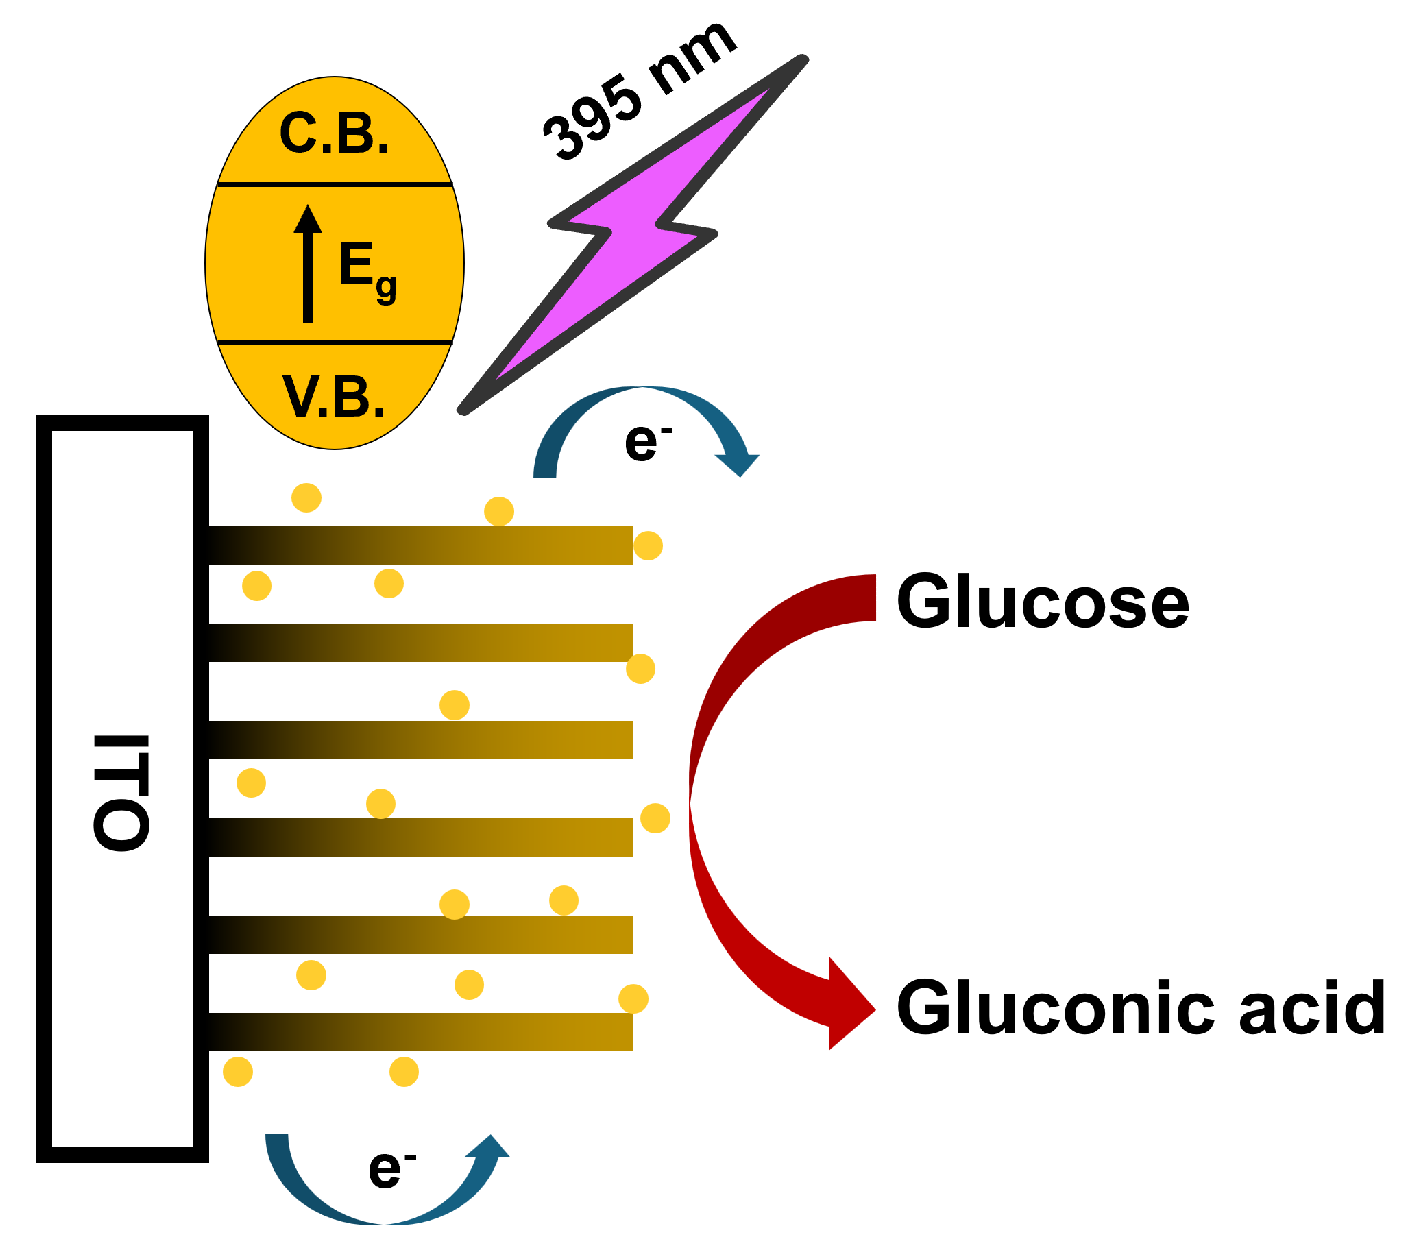
The decrease in photocurrent is attributed to the interaction between the C u O nanomaterials’ surface and glucose in the buffer solution. The reaction mechanisms of non-enzymatic glucose detection using C u O nanostructures are shown in Figure 11. Due to the semiconductive characterictics of C u O , when the matched light source stimulates, the electrons were stimulated from the valence band (VB) to the conduction band (CB). The transmission of the photoelectron current speed into the solution and the interaction on the surface electrode are faster than the pairing up of the holds on the electrode, which creates the cathode photocurrent. An increase in C u O promoted the oxidation of glucose to enhance gluconolactone formation. Finally, gluconic acid is formed from glucose. The opposition of photocurrent and glucose concentration is the competition between the cathode photocurrent and the reaction of glucose and C u O ; the result of enhanced gluconolactone is the moderation of the transfer and the decrease in the cathode photocurrent.
The photocurrent density of I T O / C u O NRs ranged from 2 to 24 μ A · cm−2, which was three times higher than that of I T O / C u O NPs (Figure 9). This superior performance of C u O NRs is based on several key factors. Firstly, they exhibit strong light absorption across a broad wavelength range (350–800 nm), as shown by the absorbance curve in Figure 5. This enhanced absorption, particularly under concentrated light conditions, leads to better compatibility with the utilized light source. C u O NRs with a bandgap of 1.59 eV effectively prevent the recombination of electron–hole pairs. On the other hand, C u O NPs and C u O NSs have lower bandgaps of 1.33 eV and 1.32 eV in Tauc plots. This value effectively mitigated material recombination during the reaction process. Furthermore, C u O NRs and C u O NPs have a very high surface-area-to-volume ratio, resulting in an exceptional capacity for glucose molecule absorption, as confirmed by SEM as shown in Figure 4. This large surface area enables the fast oxidation of glucose and materials C u O and the efficient creation and transfer of electron currents. The disparity in the absorption bands of the C u O nanomaterials plays a crucial role in their glucose detection capability. However, the EIS reveals a significantly higher Rct for I T O / C u O NPs compared to I T O / C u O NRs. This lower Rct in NRs translates to a higher current density generated during the reaction, making them more favorable than NPs.

4. Conclusions

Hydrothermal synthesis was used to produce C u O nanomaterials with different morphologies by varying the pH level. This approach controls the amount of intermediate C u 2 ( O H ) 3 N O 3 , which influences the final C u O structure, including NPs, NRs, and NSs obtained at pH values of 4, 7, and 12, respectively. These C u O nanomaterials exhibit distinct characteristics like shape, electrical/electronic transport properties, light absorption capacity, and photocurrent response, all of which are crucial for their ability to detect glucose. For glucose testing applications, I T O / C u O electrodes were fabricated using synthesized C u O nanomaterials. Various characterization techniques (XRD, SEM, UV-VIS, and EIS) confirmed the improved sensor performance due to the nanomaterial properties. The photoelectrochemical (PEC) approach revealed the highest efficiency for glucose sensing with C u O NRs. C u O NPs also showed some sensing ability, while C u O NSs were the least efficient. The research successfully responded to glucose signals for detection ranging from 0 to 150 nM with two linear regions in which the detection limit was 0.61 nM for C u O NRs and 0.69 nM for C u O NPs. Additionally, the lowest solution resistance in the EIS analyzer also shows favorable C u O NRs in photoelectrochemical sensing techniques when compared to C u O NPs and NSs forms. Due to the combination of semiconducting nanomaterials with the PEC technique, this achievement demonstrates the capability of the PEC sensor using C u O nanomaterials to detect glucose down to the nanomolar level, as supported by the EIS and PEC measurements. These results are promising for broader applications in scientific research and life sciences.

Author Contributions

Conceptualization, T.T.T., M.H.H.T. and V.C.T.; methodology, V.C.T., T.T.N. and A.D.N.; validation, M.H.H.T., V.C.T. and T.T.N.; formal analysis, T.T.T. and A.H.H.V.; investigation, T.T.N. and A.D.N.; resources, T.T.T., V.C.T. and T.T.N.; data curation, V.C.T. and T.T.N.; writing—original draft preparation, T.T.T., T.T.N. and A.H.H.V.; writing—review and editing, V.C.T. and T.T.T.; visualization, T.T.T., T.N.T. and A.D.N.; supervision, V.C.T. and T.N.T.; project administration, T.N.T.; funding acquisition, T.N.T. All authors have read and agreed to the published version of the manuscript.

Funding

This research was funded by Vietnam National University Ho Chi Minh City (VNU-HCM) grant number B2022-20-01/HĐ-KHCN.

Institutional Review Board Statement

Not applicable.

Informed Consent Statement

Not applicable.

Data Availability Statement

The data presented in this study are available upon request from the corresponding author.

Acknowledgments

We acknowledge Ho Chi Minh City University of Technology (HCMUT), and VNU-HCM for supporting this study.

Conflicts of Interest

The authors declare no conflicts of interest.

References

  1. Galant, A.L.; Kaufman, R.C.; Wilson, J.D. Glucose: Detection and analysis. Food Chem. 2015, 188, 149. [Google Scholar] [CrossRef]
  2. Steiner, M.-S.; Duerkop, A.; Wolfbeis, O.S. Optical methods for sensing glucose. Chem. Soc. Rev. 2011, 40, 4805. [Google Scholar] [CrossRef] [PubMed]
  3. Mohammadpour-Haratbar, A.; Mohammadpour-Haratbar, S.; Zare, Y.; Rhee, K.Y.; Park, S.-J. A Review on Non-Enzymatic Electrochemical Biosensors of Glucose Using Carbon Nanofiber Nanocomposites. Biosensors 2022, 12, 1004. [Google Scholar] [CrossRef] [PubMed]
  4. Pohanka, M. Glucose electrochemical biosensors: The past and current trends. Int. J. Electrochem. Sci. 2021, 16, 210719. [Google Scholar] [CrossRef]
  5. Juska, V.B.; Pemble, M.E. A Critical Review of Electrochemical Glucose Sensing: Evolution of Biosensor Platforms Based on Advanced Nanosystems. Sensors 2020, 20, 6013. [Google Scholar] [CrossRef] [PubMed]
  6. Elsayed, H.A.; Mehaney, A. A new method for glucose detection using the one dimensional defective photonic crystals. Matter. Res. Express 2019, 6, 036201. [Google Scholar] [CrossRef]
  7. Sabu, C.; Henna, T.K.; Raphey, V.R.; Nivitha, K.P.; Pramod, K. Advanced biosensors for glucose and insulin. Biosens. Bioelectron. 2019, 141, 111201. [Google Scholar] [CrossRef]
  8. Wu, D.; Tang, D. Recent advances on portable photoelectrochemical biosensors for diagnostics. Electroanalysis 2023, 35, e202300265. [Google Scholar] [CrossRef]
  9. del Barrio, M.; Luna-López, G.; Pita, M. Enhancement of Biosensors by Implementing Photoelectrochemical Processes. Sensors 2020, 20, 3281. [Google Scholar] [CrossRef]
  10. Ge, L.; Liu, Q.; Hao, N.; Kun, W. Recent developments of photoelectrochemical biosensors for food analysis. J. Mater. Chem. B 2019, 7, 7283. [Google Scholar] [CrossRef]
  11. Devadoss, A.; Sudhagar, P.; Terashima, C.; Nakata, K.; Fujishima, A. Photoelectrochemical biosensors: New insights into promising photoelectrodes and signal amplification strategies. J. Photochem. Photobiol. C 2015, 24, 43. [Google Scholar] [CrossRef]
  12. Gopalan, A.I.; Muthuchamy, N.; Lee, K.P. A novel bismuth oxychloride-graphene hybrid nanosheets based non-enzymatic photoelectrochemical glucose sensing platform for high performances. Biosens. Bioelectron. 2017, 89, 352. [Google Scholar] [CrossRef] [PubMed]
  13. Wu, J.; Liu, H.; Chen, W.; Ma, B.; Ju, H. Device integration of electrochemical biosensors. Nat. Rev. Bioeng. 2023, 1, 346. [Google Scholar] [CrossRef] [PubMed]
  14. Cao, S.; Xie, Z.; Xiao, G.; Sun, X.; Diao, H.; Zhou, X.; Yue, Z. Photoelectrochemical sensors based on heterogeneous nanostructures for in vitro diagnostics. Biosens. Bioelectron. X 2022, 11, 100200. [Google Scholar] [CrossRef]
  15. Li, Z.; Lu, J.; Wei, W.; Tao, M.; Wang, Z.; Dai, Z. Recent advances in electron manipulation of nanomaterials for photoelectrochemical biosensors. Chem. Commun. 2022, 58, 12418. [Google Scholar] [CrossRef]
  16. Devi, L.; Dalal, K.; Manchala, S.; Behera, K.; Sharma, K.N.; Das, A. 11—Nanostructured photoelectrochemical biosensors: Materials and applications. In Fundamentals of Sensor Technology; Barhoum, A., Altintas, Z., Eds.; Woodhead Publishing: Cambridge, UK, 2023; p. 265. [Google Scholar] [CrossRef]
  17. Cash, K.J.; Clark, H.A. Nanosensors and nanomaterials for monitoring glucose in diabetes. Trends Mol. Med. 2010, 16, 584. [Google Scholar] [CrossRef] [PubMed]
  18. Malik, S.; Singh, J.; Goyat, R.; Saharan, Y.; Chaudhry, V.; Umar, A.; Ibrahim, A.A.; Akbar, S.; Ameen, S.; Baskoutas, S. Nanomaterials-based biosensor and their applications: A review. Heliyon 2023, 9, e19929. [Google Scholar] [CrossRef] [PubMed]
  19. Gupta, S.; Tai, N.-H. Carbon nanomaterials and their composites for electrochemical glucose biosensors: A review on fabrication and sensing properties. J. Taiwan Inst. Chem. E 2024, 154, 104957. [Google Scholar] [CrossRef]
  20. Ismail, W.; Ibrahim, G.; Atta, H.; Sun, B.; El-Shaer, A.; Abdelfatah, M. Improvement physical and photoelectrochemical properties of TiO2 nanorods toward biosensor and optoelectronic applications. Ceram. Int. 2024, 50, 17968. [Google Scholar] [CrossRef]
  21. Radhakrishnan, S.; Lakshmy, S.; Santhosh, S.; Kalarikkal, N.; Chakraborty, B.; Rout, C.S. Recent Developments and Future Perspective on Electrochemical Glucose Sensors Based on 2D Materials. Biosensors 2022, 12, 467. [Google Scholar] [CrossRef]
  22. Shengchen, K.; Ruoxi, Z.; Weijian, Z.; Wenxiang, L.; Lu, M.; Linling, Q.; Shaolong, W. Enzyme-free photoelectrochemical sensing of glucose based on the TiO2/CuO heterojunction. Proc. SPIE 2023, 12711, 127110R. [Google Scholar] [CrossRef]
  23. Chen, G.; Qin, Y.; Jiao, L.; Huang, J.; Wu, Y.; Hu, L.; Gu, W.; Xu, D.; Zhu, C. Nanozyme-Activated Synergistic Amplification for Ultrasensitive Photoelectrochemical Immunoassay. Anal. Chem. 2021, 93, 6881. [Google Scholar] [CrossRef] [PubMed]
  24. Qian, Y.; Du, Y.; Feng, J.; Xu, R.; Ren, X.; Fan, D.; Wei, Q.; Ju, H. A duple nanozyme stimulating tandem catalysis assisted multiple signal inhibition strategy for photoelectrochemical bioanalysis. Sens. Actuators B Chem. 2021, 334, 129608. [Google Scholar] [CrossRef]
  25. Cao, L.; Wang, P.; Chen, L.; Wu, Y.; Di, J. A photoelectrochemical glucose sensor based on gold nanoparticles as a mimic enzyme of glucose oxidase. RCS Adv. 2019, 9, 15307. [Google Scholar] [CrossRef] [PubMed]
  26. Devadoss, A.; Sudhagar, P.; Das, S.; Lee, S.Y.; Terashima, C.; Nakata, K.; Fujishima, A.; Choi, W.; Kang, Y.S.; Paik, U. Synergistic Metal–Metal Oxide Nanoparticles Supported Electrocatalytic Graphene for Improved Photoelectrochemical Glucose Oxidation. ACS Appl. Mater. Interfaces 2014, 6, 4864. [Google Scholar] [CrossRef] [PubMed]
  27. Zhang, R.; Ke, S.; Lu, W.; Zhu, W.; Ma, L.; Qin, L.; Wu, S.; Li, X. Constructing a Si-CuO core-shell nanowire heterojunction photoanode for enzyme-free and highly-sensitive glucose sensing. App. Surf. Sci. 2023, 632, 157593. [Google Scholar] [CrossRef]
  28. Liu, F.; Wang, P.; Zhang, Q.; Wang, Z.; Liu, Y.; Zheng, Z.; Qin, X.; Zhang, X.; Dai, Y.; Huang, B. α-Fe2O3 Film with Highly Photoactivity for Non-enzymatic Photoelectrochemical Detection of Glucose. Electroanalysis 2019, 31, 1809. [Google Scholar] [CrossRef]
  29. Chen, L.; Miao, L.; Chen, Y.; Gao, Y.; Di, J. An enzyme-free photoelectrochemical glucose sensor based on coupling BiVO4 with gold nanoparticles. Mater. Sci. Semicond. Process. 2021, 125, 105632. [Google Scholar] [CrossRef]
  30. Ke, S.; Qin, L.; Zhang, R.; Zhu, W.; Lu, W.; Ma, L.; Wu, S.; Li, X. Towards self-driven and enzyme-free sweat glucose photoelectrochemical sensing via decorating CuO nanoparticles on TiO2 hierarchical nanotubes. Surf. Interfaces 2023, 40, 103102. [Google Scholar] [CrossRef]
  31. Sehit, E.; Altintas, Z. Significance of nanomaterials in electrochemical glucose sensors: An updated review (2016–2020). Biosens. Bioelectron. 2020, 159, 112165. [Google Scholar] [CrossRef]
  32. Syrek, K.; Skolarczyk, M.; Zych, M.; Sołtys-Mróz, M.; Sulka, G.D. A Photoelectrochemical Sensor Based on Anodic TiO2 for Glucose Determination. Sensors 2019, 19, 4981. [Google Scholar] [CrossRef] [PubMed]
  33. Yang, Z.; Xu, W.; Yan, B.; Wu, B.; Ma, J.; Wang, X.; Qiao, B.; Tu, J.; Pei, H.; Chen, D.; et al. Gold and Platinum Nanoparticle-Functionalized TiO2 Nanotubes for Photoelectrochemical Glucose Sensing. ACS Omega 2022, 7, 2474. [Google Scholar] [CrossRef] [PubMed]
  34. Tang, J.; Wang, Y.; Li, J.; Da, P.; Geng, J.; Zheng, G. Sensitive enzymatic glucose detection by TiO2 nanowire photoelectrochemical biosensors. J. Mater. Chem. A 2014, 2, 6153. [Google Scholar] [CrossRef]
  35. Cory, N.J.; Visser, E.; Chamier, J.; Sackey, J.; Cummings, F.; Chowdhury, M. Electrodeposited CuO thin film for wide linear range photoelectrochemical glucose sensing. Appl. Surf. Sci. 2022, 576, 151822. [Google Scholar] [CrossRef]
  36. Yang, R.-F.; Zhang, S.-S.; Shi, D.-J.; Dong, J.-X.; Li, Y.-L.; Li, J.-X.; Guo, C.; Yue, Z.; Li, G.; Huang, W.-P.; et al. Glucose detection via photoelectrochemical sensitivity of 3D CuO-TiO2 heterojunction nanotubes/Ti combined with chemometric tools. Microchem. J. 2024, 199, 110017. [Google Scholar] [CrossRef]
  37. Lee, C.-T.; Chiu, Y.-S.; Ho, S.-C.; Lee, Y.-J. Investigation of a Photoelectrochemical Passivated ZnO-Based Glucose Biosensor. Sensors 2011, 11, 4648. [Google Scholar] [CrossRef] [PubMed]
  38. Yang, B.; Han, N.; Hu, S.; Zhang, L.; Yi, S.; Zhang, Z.; Wang, Y.; Chen, D.; Gao, Y. Cu/ZnO Nano-Thorn with Modifiable Morphology for Photoelectrochemical Detection of Glucose. J. Electrochem. Soc. 2021, 168, 027516. [Google Scholar] [CrossRef]
  39. Liu, W.; Zhan, W.; Jia, X.; Liu, Q.; Chen, R.; Li, D.; Huang, Y.; Zhang, G.; Ni, H. Rapid synthesis of vertically-aligned zinc oxide nanorods on stainless steel for non-enzymatic glucose and H2O2 photoelectrochemical sensor. Appl. Surf. Sci. 2019, 480, 341. [Google Scholar] [CrossRef]
  40. Chen, D.; Zou, X.; Dong, F.; Zhen, C.; Xiao, D.; Wang, X.; Wu, Q.; Cao, Y.; Tu, J. Donor–Acceptor Compensated ZnO Semiconductor for Photoelectrochemical Biosensors. ACS Appl. Mater. Interfaces 2021, 13, 33006. [Google Scholar] [CrossRef]
  41. Han, Q.; Wang, H.; Wu, D.; Wei, Q. Preparation of PbSNPs/RGO/NiO nanosheet arrays heterostructure: Function-switchable self-powered photoelectrochemical biosensor for H2O2 and glucose monitoring. Biosens. Bioelectron. 2021, 173, 112803. [Google Scholar] [CrossRef]
  42. Jana, S.; Mondal, A.; Ghosh, A. Fabrication of stable NiO/Fe2O3 heterostructure: A versatile hybrid material for electrochemical sensing of glucose, methanol and enhanced photodecomposition and/photoreduction of water contaminants. Appl. Catal. B Environ. Energy 2018, 232, 26. [Google Scholar] [CrossRef]
  43. Khan, M.A.; Nayan, N.; Shadiullah; Ahmad, M.K.; Soon, C.F. Surface Study of CuO Nanopetals by Advanced Nanocharacterization Techniques with Enhanced Optical and Catalytic Properties. Nanomaterials 2020, 10, 1298. [Google Scholar] [CrossRef] [PubMed]
  44. Mahmoud, A.; Echabaane, M.; Omri, K.; El Mir, L.; Ben Chaabane, R. Development of an impedimetric non enzymatic sensor based on ZnO and Cu doped ZnO nanoparticles for the detection of glucose. J. Alloys Compd. 2019, 786, 960. [Google Scholar] [CrossRef]
  45. Li, H.; Li, J.; Chen, D.; Qiu, Y.; Wang, W. Dual-functional cubic cuprous oxide for non-enzymatic and oxygen-sensitive photoelectrochemical sensing of glucose. Sens. Actuators B Chem. 2015, 220, 441. [Google Scholar] [CrossRef]
  46. Singh, J.; Manna, A.K.; Soni, R.K. Sunlight driven photocatalysis and non-enzymatic glucose sensing performance of cubic structured CuO thin films. Appl. Surf. Sci. 2020, 530, 147258. [Google Scholar] [CrossRef]
  47. Santos, X.; Rodríguez, J.; Guillén, F.; Pozuelo, J.; Molina-Guijarro, J.M.; Videira-Quintela, D.; Martín, O. Capability of Copper Hydroxy Nitrate (Cu2(OH)3NO3) as an Additive to Develop Antibacterial Polymer Contact Surfaces: Potential for Food Packaging Applications. Polymers 2023, 15, 1661. [Google Scholar] [CrossRef] [PubMed]
  48. Morozov, I.V.; Znamenkov, K.O.; Korenev, Y.M.; Shlyakhtin, O.A. Thermal decomposition of Cu(NO3)2·3H2O at reduced pressures. Thermochim. Acta 2003, 403, 173. [Google Scholar] [CrossRef]
  49. Lazanas, A.C.; Prodromidis, M.I. Electrochemical Impedance Spectroscopy—A Tutorial. ACS Meas. Sci. 2023, 3, 162. [Google Scholar] [CrossRef] [PubMed]
  50. Magar, H.S.; Hassan, R.Y.A.; Mulchandani, A. Electrochemical Impedance Spectroscopy (EIS): Principles, Construction, and Biosensing Applications. Sensors 2021, 21, 6578. [Google Scholar] [CrossRef]
  51. Atchudan, R.; Muthuchamy, N.; Edison, T.N.J.I.; Perumal, S.; Vinodh, R.; Park, K.H.; Lee, Y.R. An ultrasensitive photoelectrochemical biosensor for glucose based on bio-derived nitrogen-doped carbon sheets wrapped titanium dioxide nanoparticles. Biosens. Bioelectron. 2019, 126, 160. [Google Scholar] [CrossRef]
  52. Liu, Y.; Zhong, L.; Zhang, S.; Wang, J.; Liu, Z. An ultrasensitive and wearable photoelectrochemical sensor for unbiased and accurate monitoring of sweat glucose. Sens. Actuators B Chem. 2022, 354, 131204. [Google Scholar] [CrossRef]
  53. Wu, Z.; Zhao, J.; Yin, Z.; Wang, X.; Li, Z.; Wang, X. Highly sensitive photoelectrochemical detection of glucose based on BiOBr/TiO2 nanotube array p-n heterojunction nanocomposites. Sens. Actuators B Chem. 2020, 312, 127978. [Google Scholar] [CrossRef]
  54. Mishra, A.K.; Mukherjee, B.; Kumar, A.; Jarwal, D.K.; Ratan, S.; Kumar, C.; Jit, S. Superficial fabrication of gold nanoparticles modified CuO nanowires electrode for non-enzymatic glucose detection. RSC Adv. 2019, 9, 1772. [Google Scholar] [CrossRef] [PubMed]
  55. Li, H.; Guo, C.; Liu, C.; Ge, L.; Li, F. Laser-induced graphene hybrid photoelectrode for enhanced photoelectrochemical detection of glucose. Analyst 2020, 145, 4041. [Google Scholar] [CrossRef] [PubMed]
  56. Yang, W.; Wang, X.; Hao, W.; Wu, Q.; Peng, J.; Tu, J.; Cao, Y. 3D hollow-out TiO2 nanowire cluster/GOx as an ultrasensitive photoelectrochemical glucose biosensor. J. Mater. Chem. B 2020, 8, 2363. [Google Scholar] [CrossRef] [PubMed]
  57. Yuan, R.; Yan, B.; Lai, C.; Wang, X.; Cao, Y.; Tu, J.; Li, Y.; Wu, Q. Carbon Dot-Modified Branched TiO2 Photoelectrochemical Glucose Sensors with Visible Light Response. ACS Omega 2023, 8, 22099. [Google Scholar] [CrossRef] [PubMed]
  58. Wang, Y.; Yin, L.; Wu, J.; Li, N.; He, N.; Zhao, H.; Wu, Q.; Li, X. Perovskite-SrTiO3/TiO2/PDA as photoelectrochemical glucose biosensor. Ceram. Int. 2021, 47, 29807. [Google Scholar] [CrossRef]
  59. Li, F.; Zhang, B.; Yan, B.; Chen, Q.; Wang, X.; Zhang, K.; Pei, H.; Wu, Q.; Chen, D.; Tu, J. Graphene-assisted titanium dioxide Z-mechanism photoelectrode as enzymatic glucose biosensor. AIP Adv. 2022, 12, 065208. [Google Scholar] [CrossRef]
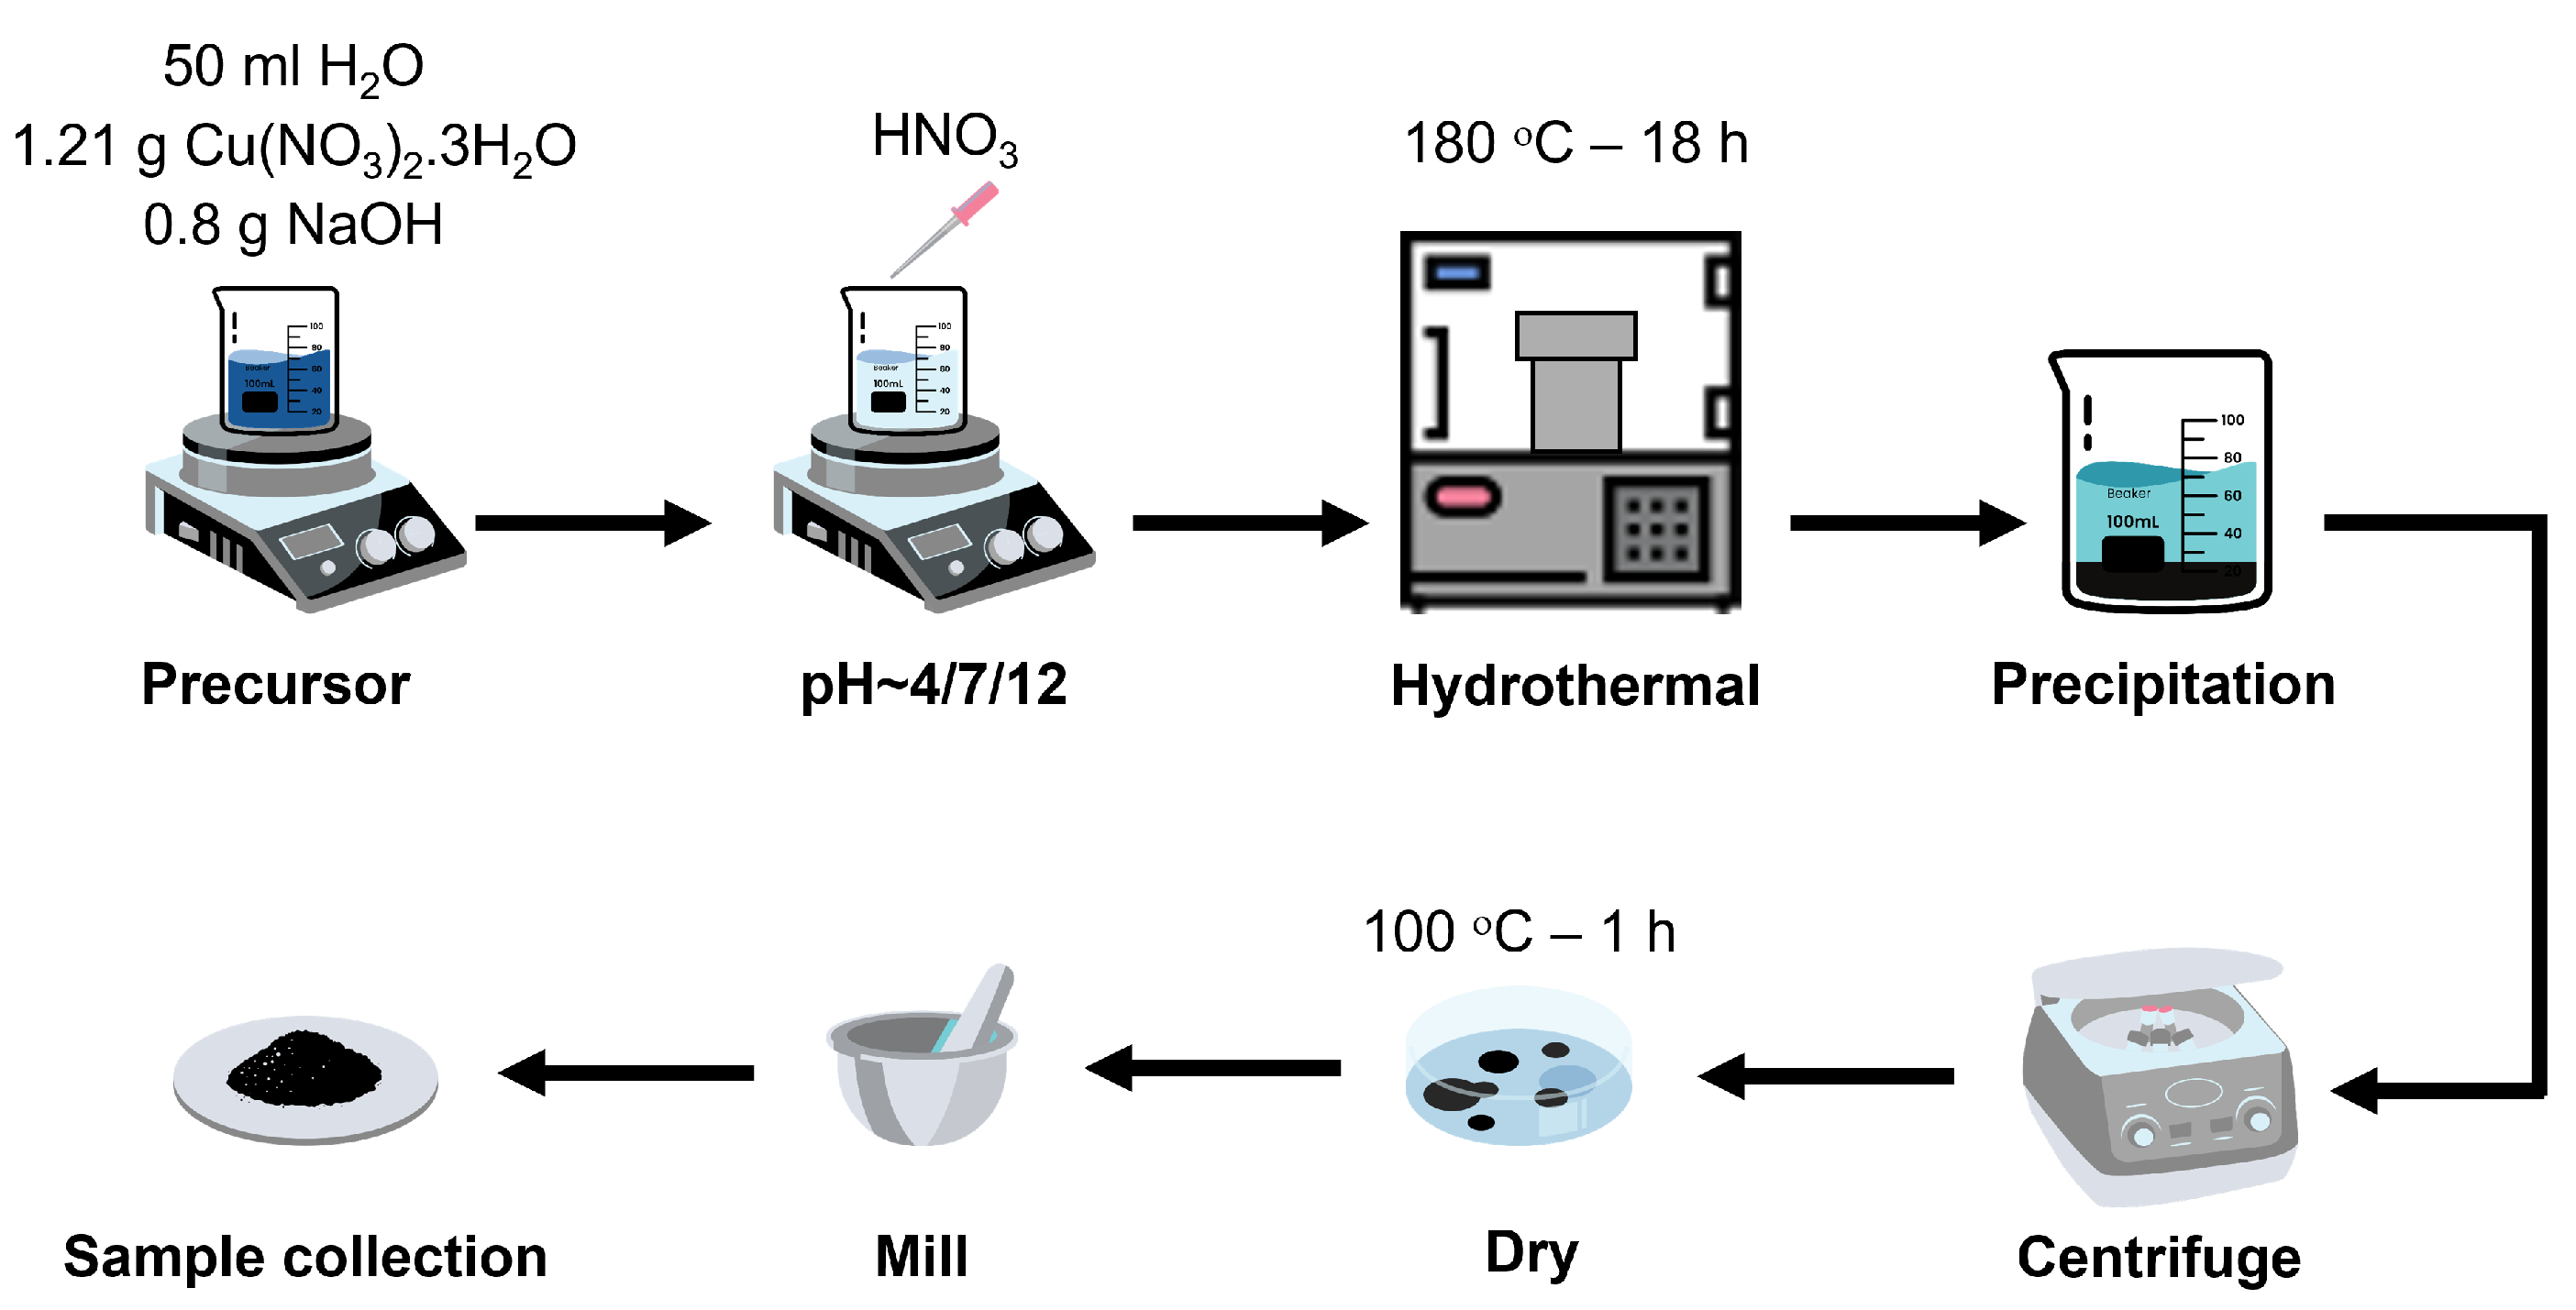
Figure 1. The process synthesis of different morphologies of ( C u O ) materials.
Applsci 14 05688 g001
Figure 2. The PEC sensor system for glucose detection.
Applsci 14 05688 g002
Figure 3. XRD patterns of the synthesized C u O materials.
Applsci 14 05688 g003
Figure 4. SEM images of C u O synthesized at pH values of 4, 7, and 12 corresponding to (a,b) particles, (c,d) rods, and (e,f) sheets morphologies.
Applsci 14 05688 g004
Figure 5. (a) UV−VIS absorbance spectra and appearance of C u O NPs, C u O NRs, and C u O NSs. (b) Tauc plots of C u O NPs, C u O NRs, and C u O NSs.
Applsci 14 05688 g005
Figure 6. XRD pattern of the uncompleted samples after 15 h of hydrothermal process.
Applsci 14 05688 g006
Figure 7. (a) Electrochemical impedance spectroscopy of bare I T O and three morphologies I T O / C u O nanomaterials without glucose with the inserted equivalent circuit in the low-frequency region. Semicircular shapes in high-frequency Nyquist plots of (b) I T O / C u O NPs, (c) I T O / C u O NRs, and (d) I T O / C u O NSs electrodes.
Applsci 14 05688 g007
Figure 8. Electrochemical impedance spectroscopy of (a) C u O NPs, (b) C u O NRs, and (c) C u O NSs sprayed on I T O electrodes with and without light irradiation.
Applsci 14 05688 g008
Figure 9. (a) Comparison of photocurrent responses of three types of I T O / C u O nanostructures to 100 nM glucose at an applied potential of 0.2 V (vs. A g / A g C l ) under 395 nm LED irradiation. Photocurrent responses of (b) I T O / C u O NPs, (c) I T O / C u O NRs, and (d) I T O / C u O NSs electrodes at different glucose concentrations from 0 to 150 nM.
Applsci 14 05688 g009
Figure 10. Corresponding calibration curve of (a) I T O / C u O NPs electrode and (b) I T O / C u O NRs electrode.
Applsci 14 05688 g010
Figure 11. Mechanism of non−enzymatic glucose sensing on the I T O / C u O electrode.
Applsci 14 05688 g011
Table 1. Comparison of linear range, density of photocurrent, and limit of detection of various PEC sensors for glucose testing.
MaterialsLimit of DetectionLinearity RangeDensity of PhotocurrentReferences
C u O NPs0.69 nM3–150 nM1–6 μ A · cm−2This work
C u O NRs0.61 nM3–150 nM2–24 μ A · cm−2This work
P b s / S i O 2 / A u NPs0.46 μ M1–1000 μ M−1.4–−0.7 μ A · cm−2[25]
Cubic structured C u O 0.068 μ M0.001–1.8 mM0–2300 μ A · cm−2[46]
G O D x / N D C - T i O 2 NPs/ I T O 13 nM0.005–10 μ M0.5–3 μ A · cm−2[51]
B i V O 4 -MWNT22.2 pM0.1 nM–1 mM1.3–3.5 μ A · cm−2[52]
B i O B r / T i O 2 nanotube arrays10 nM5 × 102–3 × 107  μ M270–1500 μ A · cm−2[53]
A u modified C u O NWs0.5 μ M0.5 μ M–5.9 mM0–7 mA · cm−2[54]
L I N i E C C d s G 0.5 μ M1 μ M–1 mM20–90 μ A · cm−2[55]
3D hollow-out T i O 2  NWc/ G O x 8.7 μ M0–2 mM264.5–382.3 μ A · cm−2[56]
C D s / B T i O 2 / G O x 43 μ M0–9 mM19.8–34.63 μ A · cm−2[57]
T i O 2 / S r T i O 3 / P D A / G O x 25.68 μ M0–32 mM601.9–773.74 μ A · cm−2[58]
T i O 2 / r G O / P D A / G O x 0.034 μ M0–3 mM85.7–127.16 μ A · cm−2[59]
Disclaimer/Publisher’s Note: The statements, opinions and data contained in all publications are solely those of the individual author(s) and contributor(s) and not of MDPI and/or the editor(s). MDPI and/or the editor(s) disclaim responsibility for any injury to people or property resulting from any ideas, methods, instructions or products referred to in the content.