Article

The Influence of the Strain-Hardening Model in the Axial Force Prediction of Single Point Incremental Forming

by
Rogelio Perez-Santiago
1,
Nicolas J. Hendrichs
2,
Gustavo Capilla-González
3,
Elisa Vázquez-Lepe
4 and
Enrique Cuan-Urquizo
1,5,*
1
School of Engineering and Sciences, Tecnologico de Monterrey, Epigmenio González 500 Fracc, San Pablo, Querétaro 76130, Mexico
2
School of Mathematics, Science and Engineering, University of the Incarnate Word, 4301 Broadway, San Antonio, TX 78209, USA
3
Mechanical Engineering Department, University of Guanajuato, Carretera Salamanca-Valle de Santiago km. 3.5, Salamanca 36885, Mexico
4
School of Engineering and Sciences, Tecnologico de Monterrey, Av. Eugenio Garza Sada 2501, Monterrey 64849, Mexico
5
Institute of Advanced Materials for Sustainable Manufacturing, Tecnologico de Monterrey, Av. Eugenio Garza Sada 2501, Monterrey 64849, Mexico
*
Author to whom correspondence should be addressed.
Appl. Sci. 2024, 14(13), 5705; https://doi.org/10.3390/app14135705
Submission received: 27 May 2024 / Revised: 19 June 2024 / Accepted: 24 June 2024 / Published: 29 June 2024
(This article belongs to the Section Mechanical Engineering)

Abstract

:
Estimation of the loading conditions during incremental sheet forming is important for designing dedicated equipment, safely utilizing adapted machinery, and developing online process control strategies or trajectory compensation for robot compliance. In this study, we investigate the forming force of pyramidal components of uniform wall angles through analytical, experimental, and numerical approaches. After reviewing the existing research, the accuracy of the estimations from two analytical models and finite element simulations was assessed. Experimental results revealed that the maximum force occurs at 45° and 60° for AA1050-H24 and AISI-SAE 304 materials, respectively. FEA simulations leveraging tensile test data and refined isotropic hardening laws provided conservative estimations for the two materials. In the case of the AA1050-H24, numerical models accurately reproduce the experimental trend of components formed with Single Point Incremental Forming (SPIF) at different wall angles. On the other hand, alternative hardening models may be required to improve the force predictions for the AISI-SAE 304 material.

1. Introduction

Incremental Sheet Forming (ISF) is a novel, helpful technology to manufacture full- or scale-size prototypes and small-batch or one-of-a-kind sheet metal products. Among the different ISF variants, Single Point Incremental Forming (SPIF) stands out as a feasible option for manufacturing facilities equipped with CNC machinery and CAD/CAM software [1]. Due to its low cost and ease of implementation, SPIF can be effectively utilized during the early stages of product development for rapid prototyping of thin metal and plastic parts, ensuring they meet the fit and form requirements of the final product.

1.1. Background

Even if forces generated during SPIF are significantly lower than those of a conventional sheet metal forming process [2], it is essential to avoid exceeding the limits of the machines utilized for the process. Consequently, estimating the force required to form a particular part on existing CNC machines or robots becomes vital [3,4]. The same principle applies to designing new ISF equipment, including forming tools and sheet clamping devices [5,6].
In view of its importance, numerous studies have investigated the influence of technological parameters, including blank material properties, initial thickness, tool diameter, vertical forming step, and forming angle, on the forming process force [7,8,9]. Kumar et al. [10] conducted a comprehensive review of the previous and related aspects. However, their study only briefly addressed existing analytical alternatives for estimating forming forces. These are reviewed next.

1.2. Analytical Forming Force Prediction Models

Iseki’s Model: Iseki proposed the first analytical ISF force model [11], assuming plane–strain conditions, uniform sheet deformation, and neglecting friction for its derivation. Indeed, its origin can be traced back to the basic relation between tensile force, stress, and cross-section area, T = σA as,
T = 2 3 n + 1 K ε x n d t t 0 exp ε x ,
where T is the tensile force aligned with the wall direction, K is the strength coefficient, and n is the strain-hardening exponent of the power law utilized to model the material work hardening, dt is the tool diameter (as shown in Figure 1), and t0 is the initial blank thickness. εx is the strain in the wall direction and can be estimated using the alternative form of the conventional sine law,
ε x = ln ( 1 cos α )
where α is the forming angle.
Finally, the force in the direction of the tool axis, Fz, can be computed from the tensile force, T, as
F z = T sin α .
Aerens’ Model: Aerens et al. [12] proposed an equation to predict the axial forming force of truncated Uniform Wall Angle (UWA) cones.
F Z s = 0.0716   R m   t 0 1.57   d t 0.41   Δ h 0.09   α   cos α
Such equation is a correlation originating from the results of an experimental campaign conducted on five different metallic alloys, where Rm is the tensile strength of the formed material and Δh, the scallop height, is computed from the distance between two forming layers. Notice that the experimentally observed dependence of the axial force on the wall angle was approximated as αcosα in Equation (4).
Axial force parallel to the tool axis and the predominant SPIF force component of UWA geometries may be estimated with the previous analytical models. However, other promising analytical resources for estimating radial, tangential, and axial forces have been recently introduced [13,14,15]. Furthermore, machine learning algorithms are improving the accuracy of predictions for maximum forming force across various conditions [16].
The previous resources provide valuable insights for designing and safely utilizing SPIF equipment. However, several applications need computing force evolution during the entire forming process. This critical information can only be obtained through simulation. With accurate transient force predictions, simulations become valuable tools for applications such as (a) the compliance compensation of industrial robots [17,18], (b) the development of failure control strategies [19], or (c) the identification and prevention of other imperfections, such as the pillow effect [20].

1.3. Numerical Forming Force Prediction

In the case of ISF simulations, the incremental forming toolpath adds further complications to the typical sources of nonlinear behavior encountered in conventional forming processes, such as plasticity, large strain effects, and contact. Therefore, even for the simulation of straightforward parts, solution times of days or weeks have been reported [21].
Different approaches have been proposed to alleviate the lengthy numerical solution process. Researchers using implicit solvers implemented numerical strategies like substructuring [22], submodeling [23], adaptive remeshing [24], or simplified contact algorithms [25]. Others relied on explicit time integration solvers with an increase in the minimum time step by using either mass scaling, tool velocity scaling, or a combination of the two [26].
The predictive capability of Finite Element Method (FEM) simulations depends on several parameters, including the type of results being analyzed. For example, Pepelnjak et al. [27] achieved a precise geometric description of their part fabricated with low-carbon steel DC04. Conversely, force estimations for aluminum alloys have been reported to deviate by up to 30% from experimental results [28,29]. The axial force overestimation has been primarily linked to the choice of the element types and material constitutive models.
Regarding spatial discretization, researchers have employed both continuum and shell elements [23,30]. Partial models based on continuum elements allowed the discovery of the through-thickness shear in SPIF, later confirmed by experimental results [31]. Nevertheless, simulating full-scale parts using continuum elements remains a computationally challenging task, leading to the prevalent use of shell elements in global models.
The constitutive material model for sheet metal forming simulations comprises a flow rule, a yield criterion, and a hardening law [32]. Metallic elastoplastic material models available in most commercial FEM codes are based on the associated flow rule. It has been demonstrated that anisotropic yield models have a minimal impact on the computation of strain for SPIF simulations [30,33,34]. Anisotropy parameters are typically determined from uniaxial tensile tests, generally limited to low plastic strain levels. However, during the SPIF process, the material undergoes substantial plastic deformation, often exceeding 50%. In such cases, it may be necessary to incorporate anisotropic yield surfaces that evolve with plastic strain increments. Suzuki et al. [35] demonstrated this by employing a sixth-order polynomial yield surface, considering the evolution of the sheet anisotropy during an oval hole expansion test. Notably, the yield surface parameter determined under large strain conditions successfully predicted the direction of fracture onset in the material. For the moment, the implementation of the von Mises yield model is the common practice in the simulation of ISF.
As for the hardening law, most works have relied on isotropic hardening models. Specifically, an exponential law with either two, Hollomon
σ = K ε n
or three parameters, Swift
σ = K ( ε 0 + ε P ) n
has been used. Additionally, the Voce law has been applied to describe the stress saturation shown by some aluminum alloys as
σ = A B e C ε P .
In Equations (5)–(7), ε 0 is the strain at yield, ε p is the plastic strain, and K, n, A, B, and C are parameters identified from tensile test data.
Henrard et al. [34] studied several numerical parameters when comparing the force predictions from different simulation setups to experimental results of conical frusta formed with AA3003-0. The authors concluded that the best estimations were achieved with a combination of continuum elements, a refined mesh sub-model, and a mixed isotropic–kinematic hardening model adjusted with an inverse simulation of the linear indentation test. Bouffioux et al. [36] achieved accurate numerical force results for an AA5028 H116 aerospace alloy based on magnesium and scandium (AlMgSc), 40° conical frustum, using shell elements and a mixed hardening law based on the isotropic Voce’s and the kinematic Ziegler’s laws, whose parameters were adjusted with the linear SPIF test. Esmaeilpour et al. [37] showed that in the SPIF simulation of 7075-O aluminum alloy, a combined Chaboche hardening model, with parameters adjusted from uniaxial tension-compression cyclic tests, decreased the axial force by more than 10% compared to an isotropic Voce hardening model.
While previous studies have emphasized the positive impact of sophisticated characterization and modeling tools, other researchers have achieved accurate predictions using simpler approaches, such as shell elements and isotropic tensile test data [38,39]. Consequently, the literature review underscores the significance of assessing force prediction capabilities in models based on straightforward numerical choices. Following this idea, the feasibility of replicating the experimental force evolution of FEM models utilizing isotropic hardening was evaluated on two materials with dissimilar hardening behavior.
Accordingly, Section 2 of this paper presents the details of the experimental and numerical methodology used in this study. In addition to one aluminum alloy, the most utilized material family in the literature, experiments, and simulations were also conducted on stainless steel parts. This approach provides the possibility to understand the capabilities of FEM simulations across materials with different work-hardening behaviors. Section 3 compares the numerical and experimental results and introduces the improvement methodologies. In Section 4, the analysis of the most important findings of this work is presented and discussed in the context of other results available in the literature. Finally, Section 5 summarizes the principal outcomes from the current research and the observations that will be the base for forthcoming work.

2. Materials and Methods

2.1. Materials

The experimental and numerical studies were conducted with strain-hardened and partially annealed AA1050-H24 aluminum alloy, 0.8 mm thick, and a fully annealed AISI-SAE 304 austenitic stainless steel, 0.5 mm thick. The objective of material selection for this project was to use two materials with different hardening behaviors that also had a wide range of applications and were easy to acquire. The mechanical material properties are summarized in Table 1.

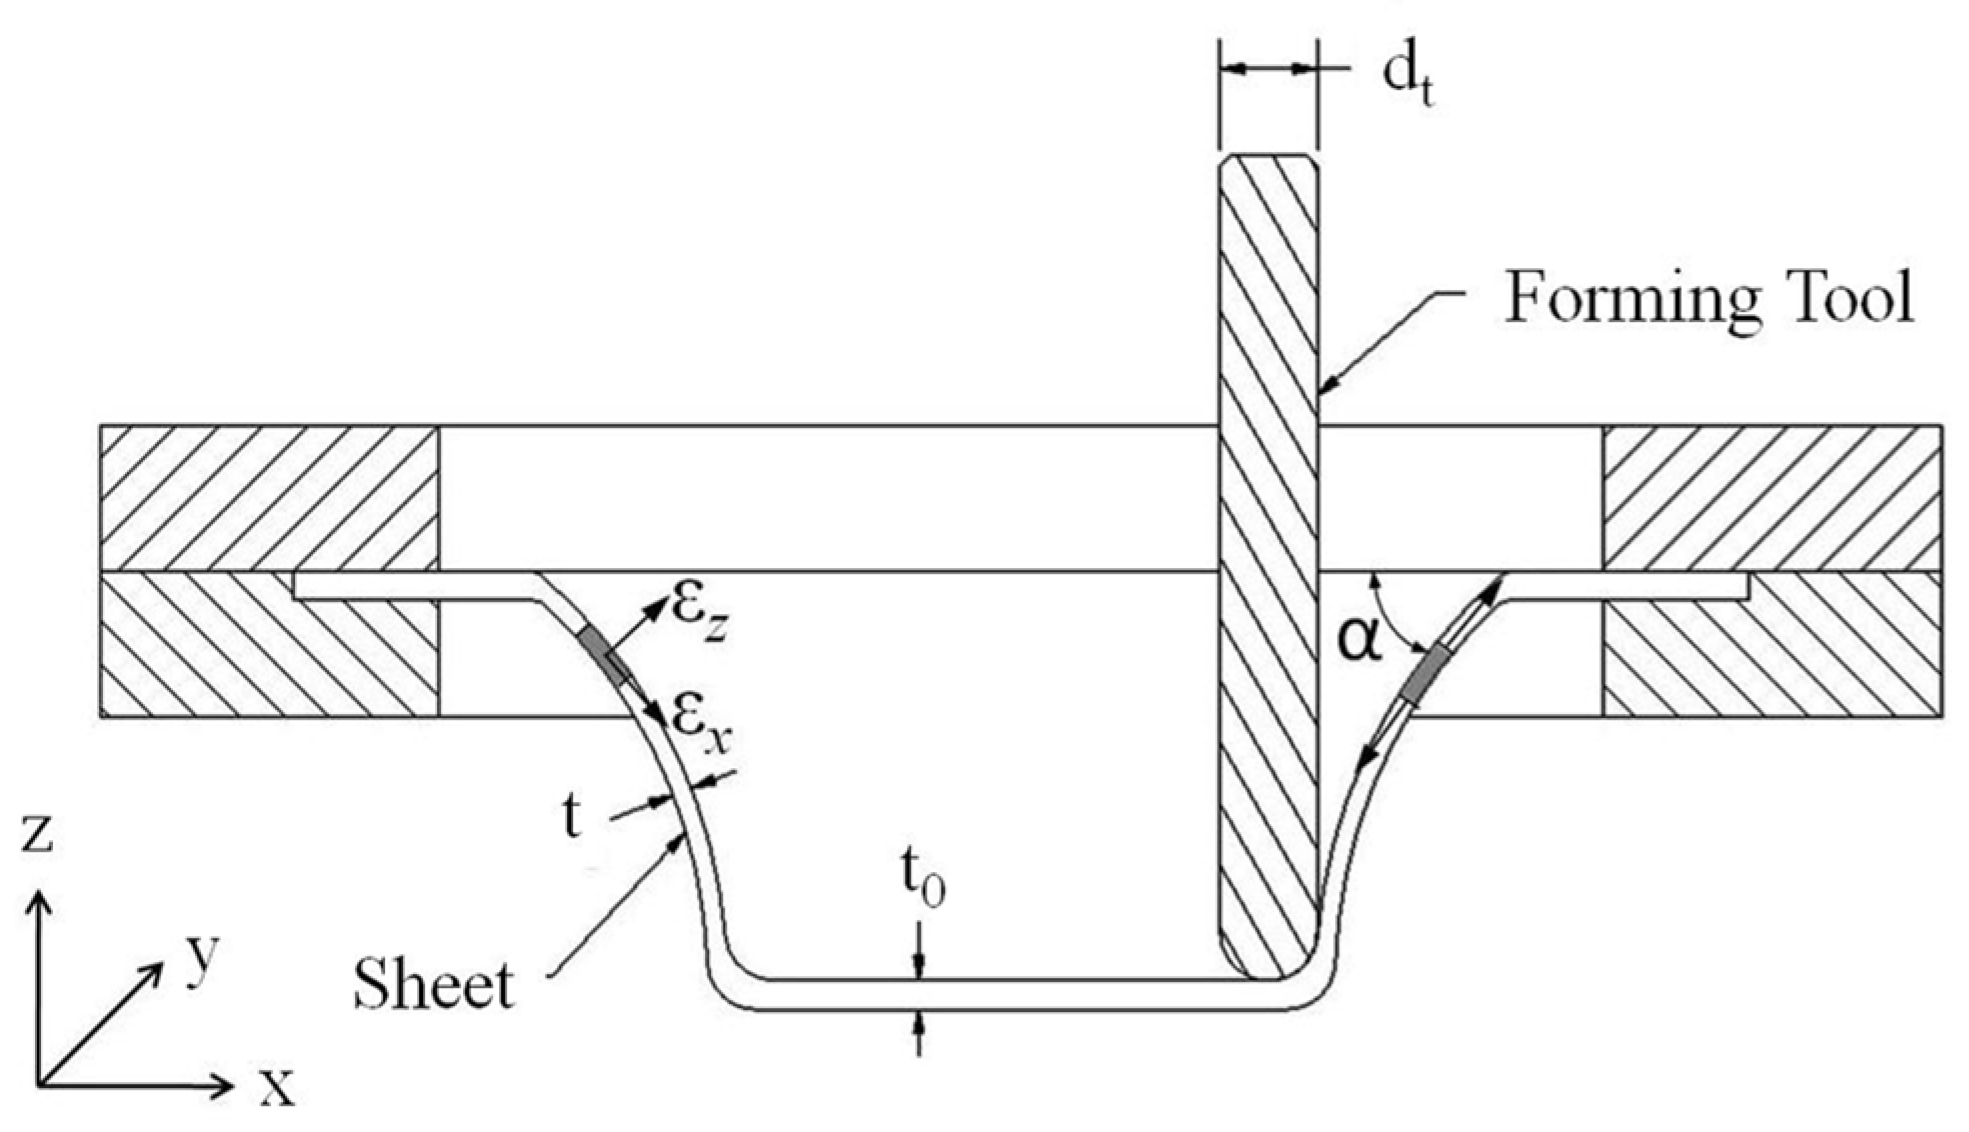
2.2. Geometry of the Studied Parts

All formed components were pyramidal frusta measuring 105 mm at each base (Figure 2a). Compared to a conical frustum, the pyramidal shape reduces the blank regions prone to bending without the need for a backing plate (Figure 2b). Additionally, pyramids decrease the computational time to a fraction of a comparable conical frustum. The corners of the pyramidal parts were rounded to minimize the force spikes caused by the biaxial deformation state. It was determined that a radius (“r” in Figure 2a) of 10 mm approximated the force magnitudes to those of a conical part of similar parameters (Figure 2c). The maximum depth was set at 15 mm because, at this level, the force curve had already reached a steady state or shown its definitive trend.
The AA1050-H24 parts were formed with blank thickness (t0) of 0.8 mm and draw angle (α) set to 45°, 60°, and 70°. The 70° case was selected to study one part approaching failure. In addition to the aluminum components, two truncated pyramids were manufactured with AISI-SAE 304 steel. They had blank thickness, t0 = 0.5 mm, and draw angles (α) set to 45° and 60°.

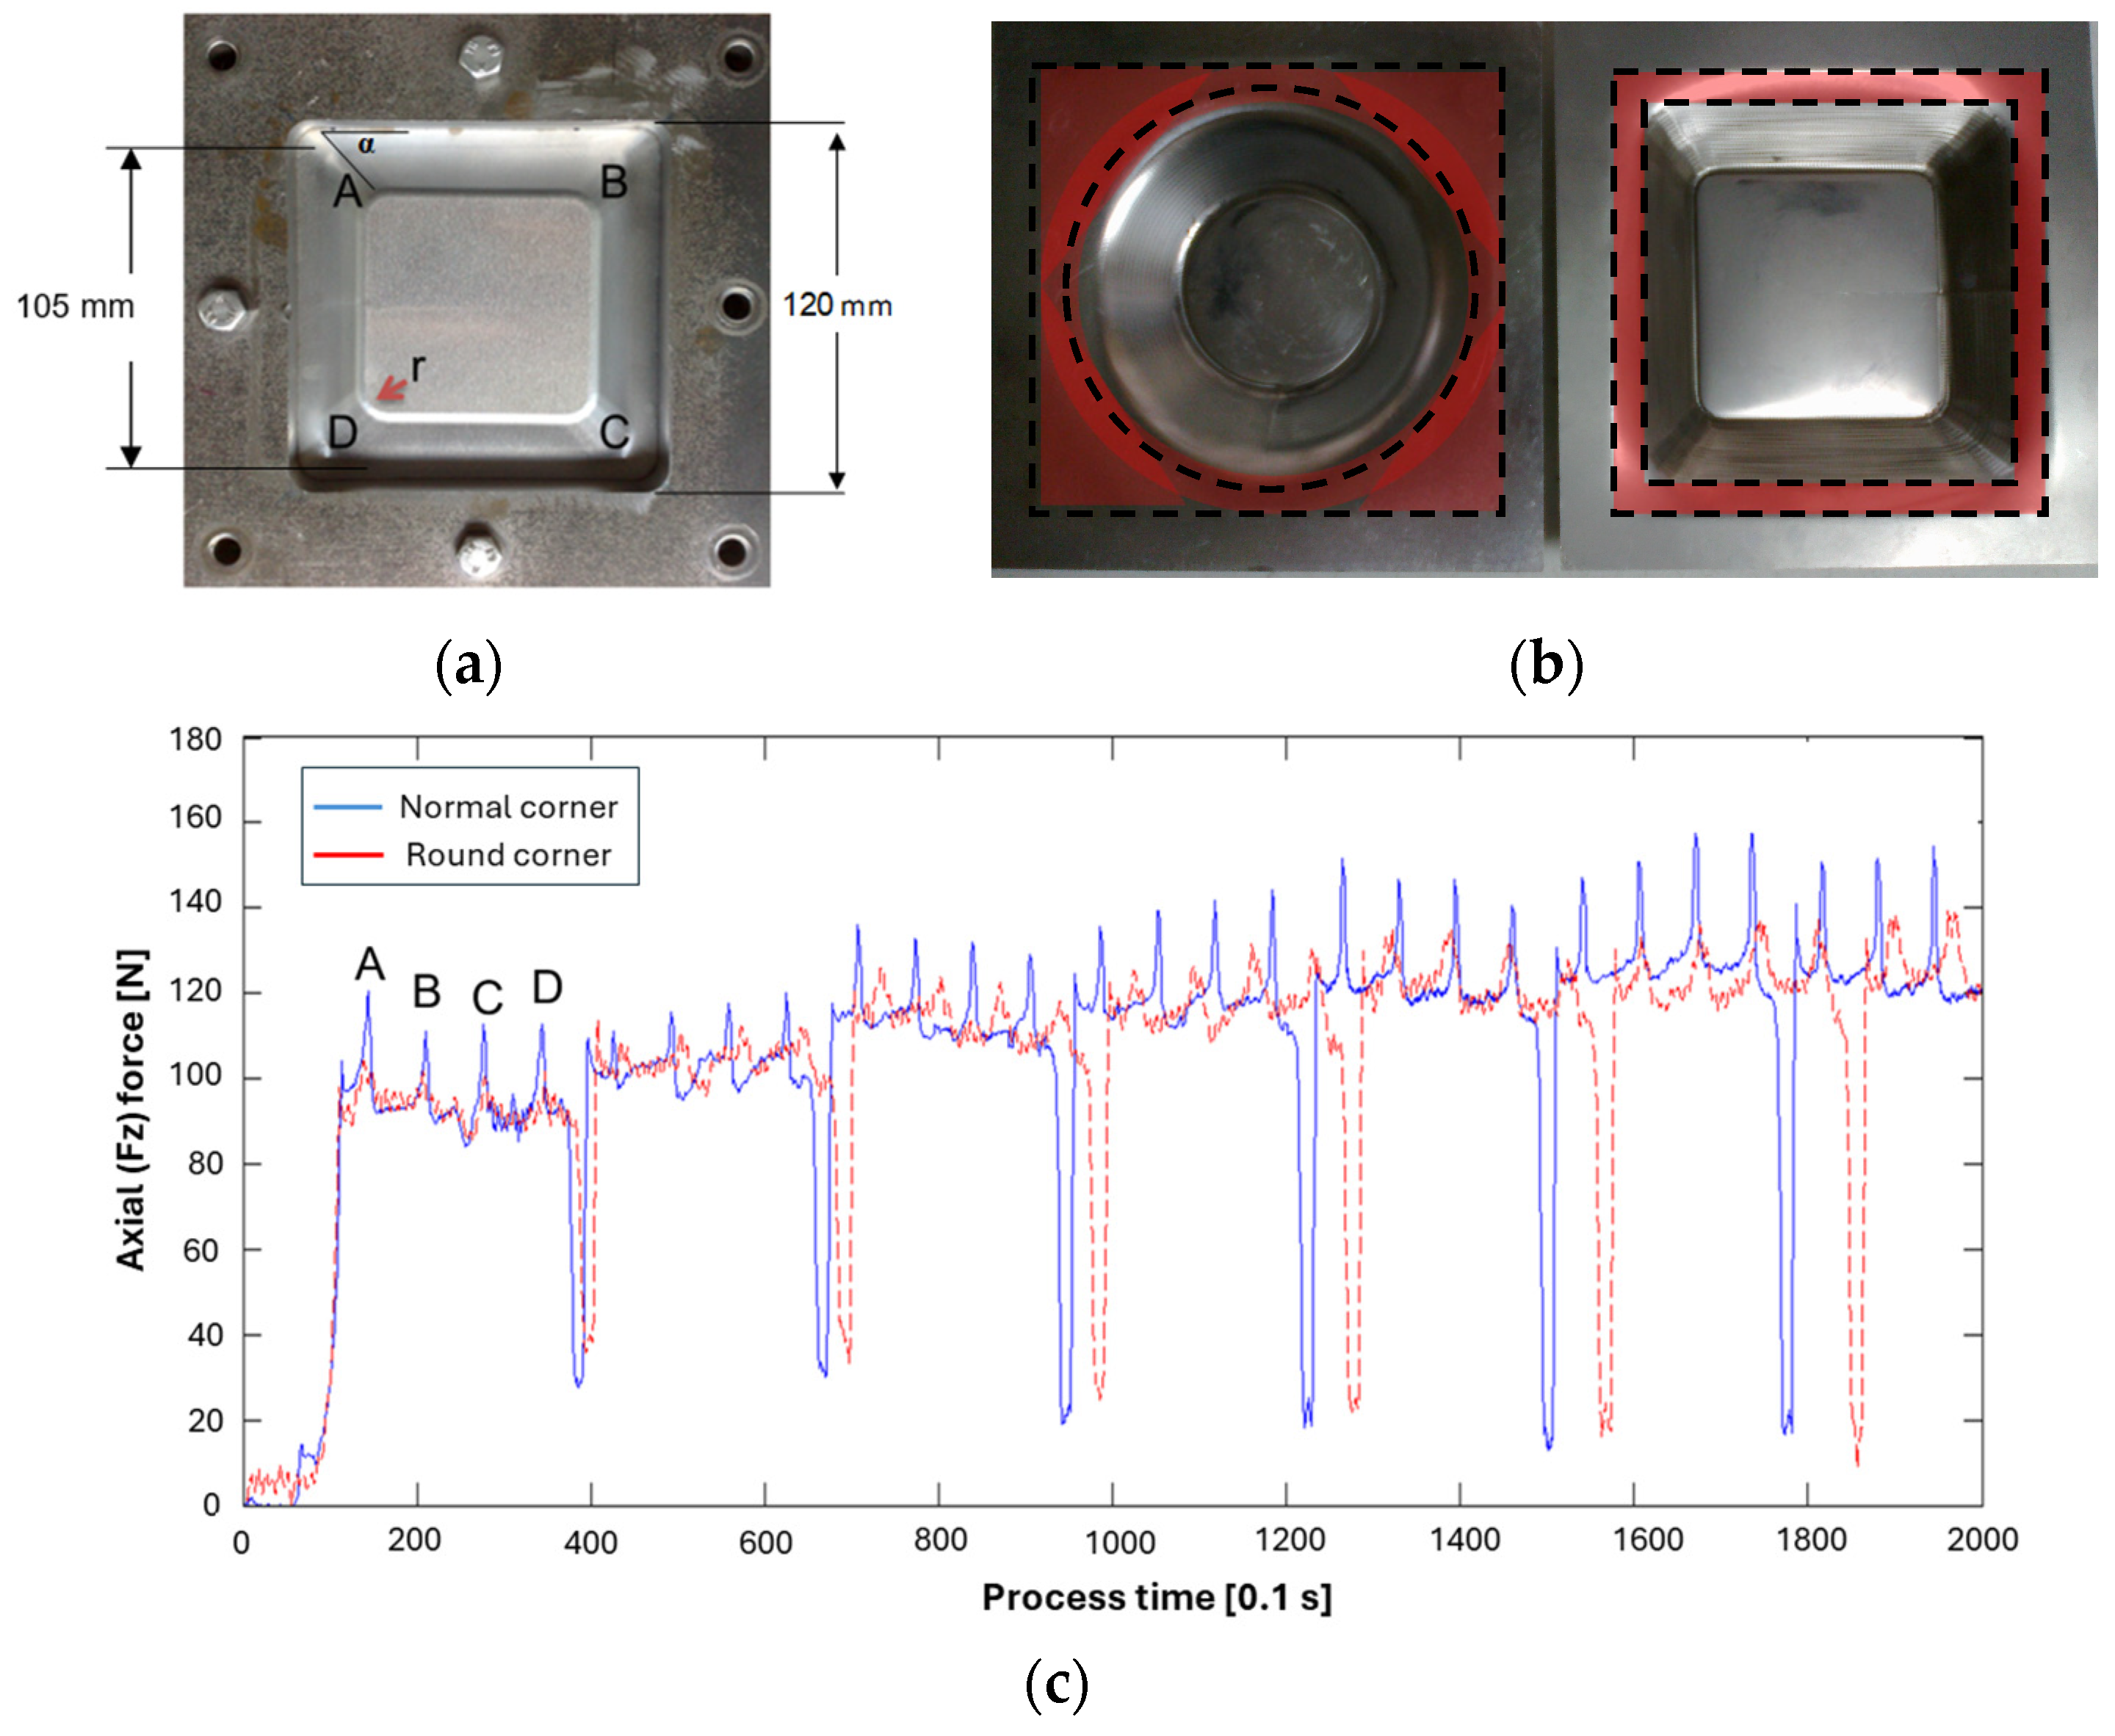
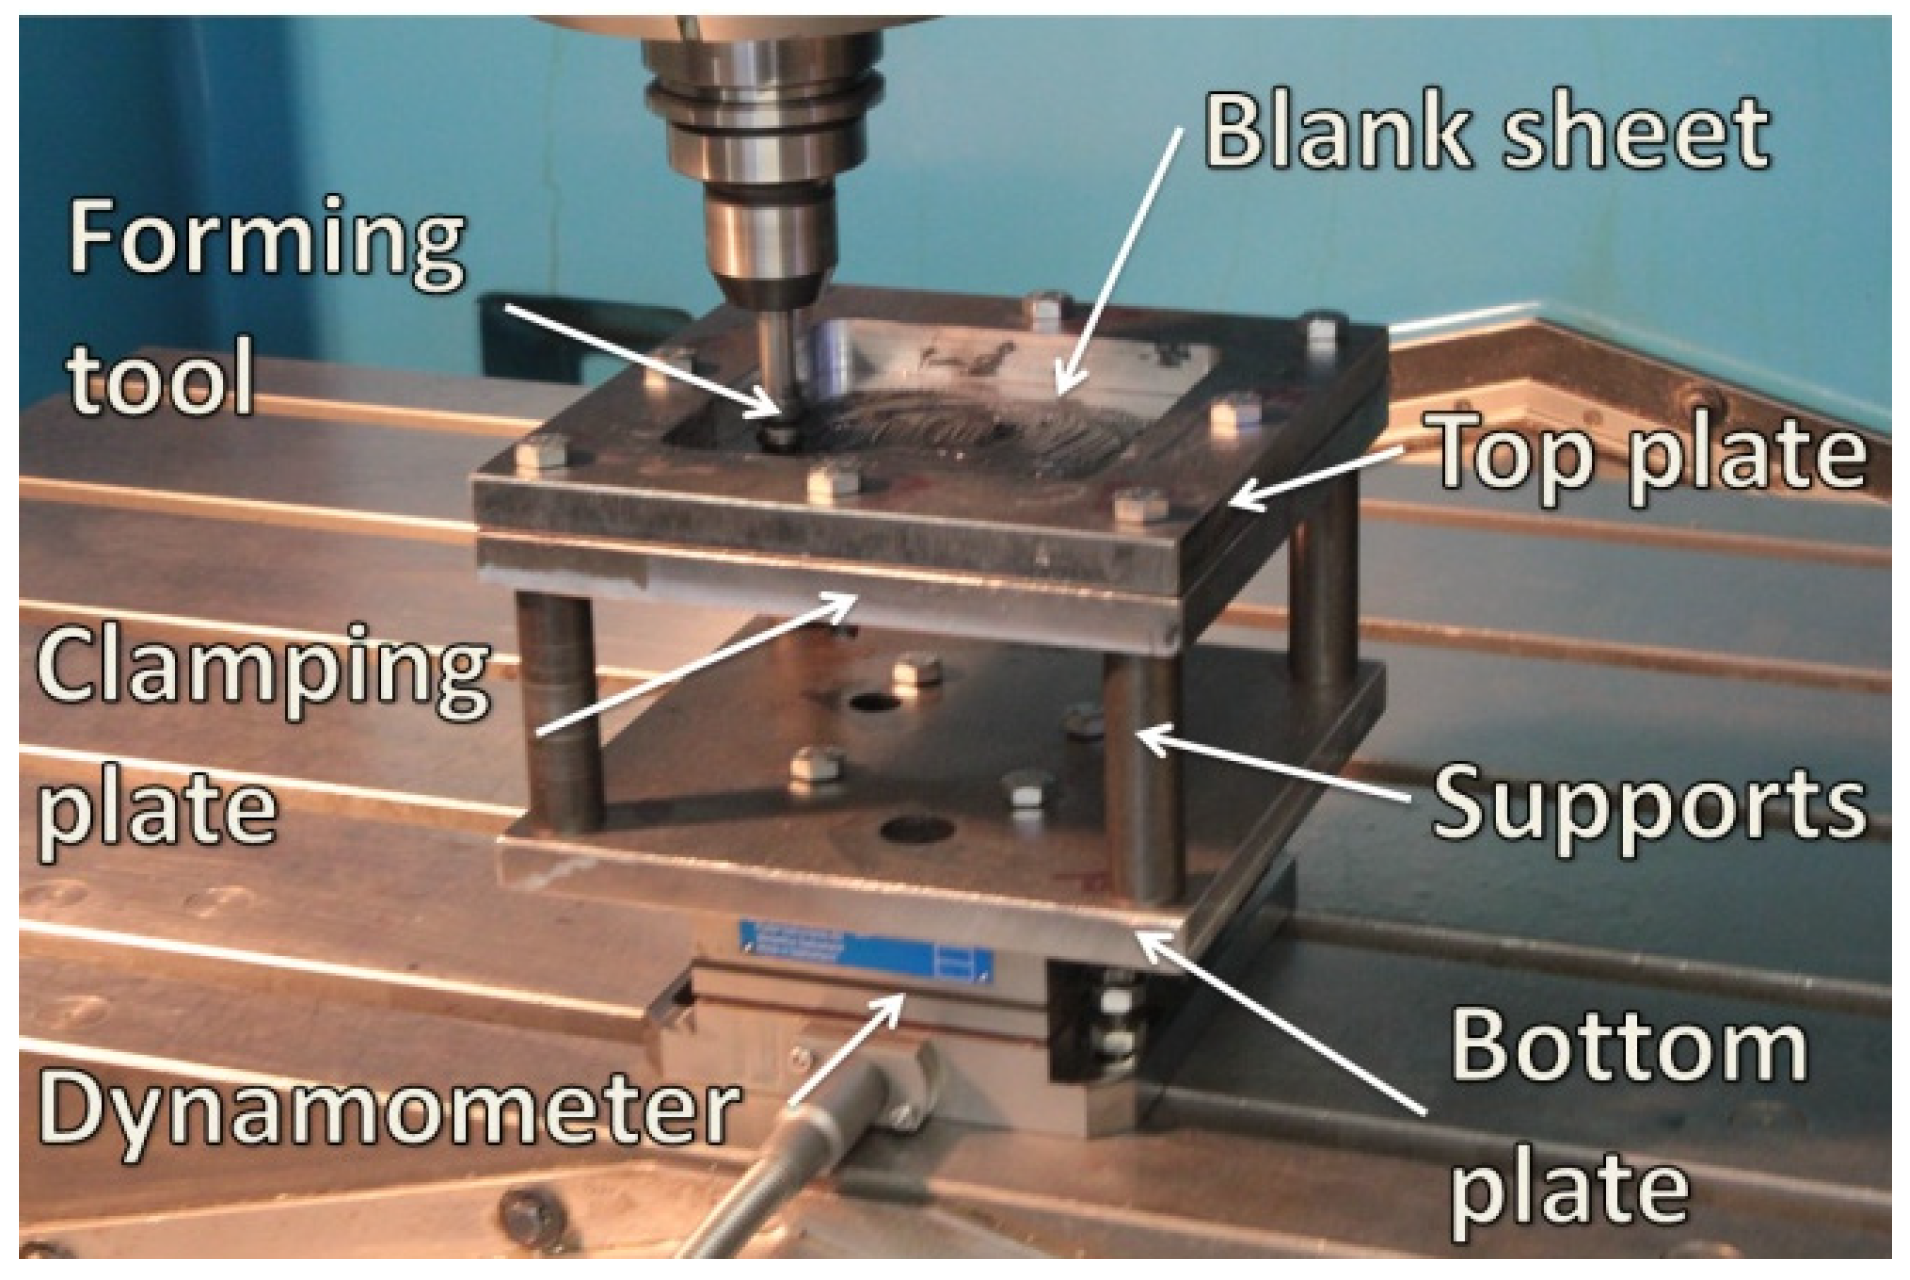
2.3. Experimental Procedure

The experimental work was carried out on a HS1000 3-axis machining center (Kondia, Elgoibar, Spain). The 9257B table-type dynamometer (Kistler, Winterthur, Switzerland) was utilized to measure the process forming forces. The force data was acquired at a frequency of 10 Hz using a DaqBoard 505 data acquisition card and the DaqView® 9.0.0 software (Iotech, Cleveland, OH, USA). Table 2 summarizes the process parameters kept constant for all the experiments.
A fixture system, assembled with the components shown in Figure 3, was securely bolted over the force transducer. The 150 × 150 mm blank was placed between the clamping and the top plates without any backing plate. The effective working area was 120 × 120 mm. To reduce friction, multi-purpose grease was brushed on the upper surface of the aluminum blanks while cold-forming oil-based lubricant was poured over the AISI-SAE 304 samples.

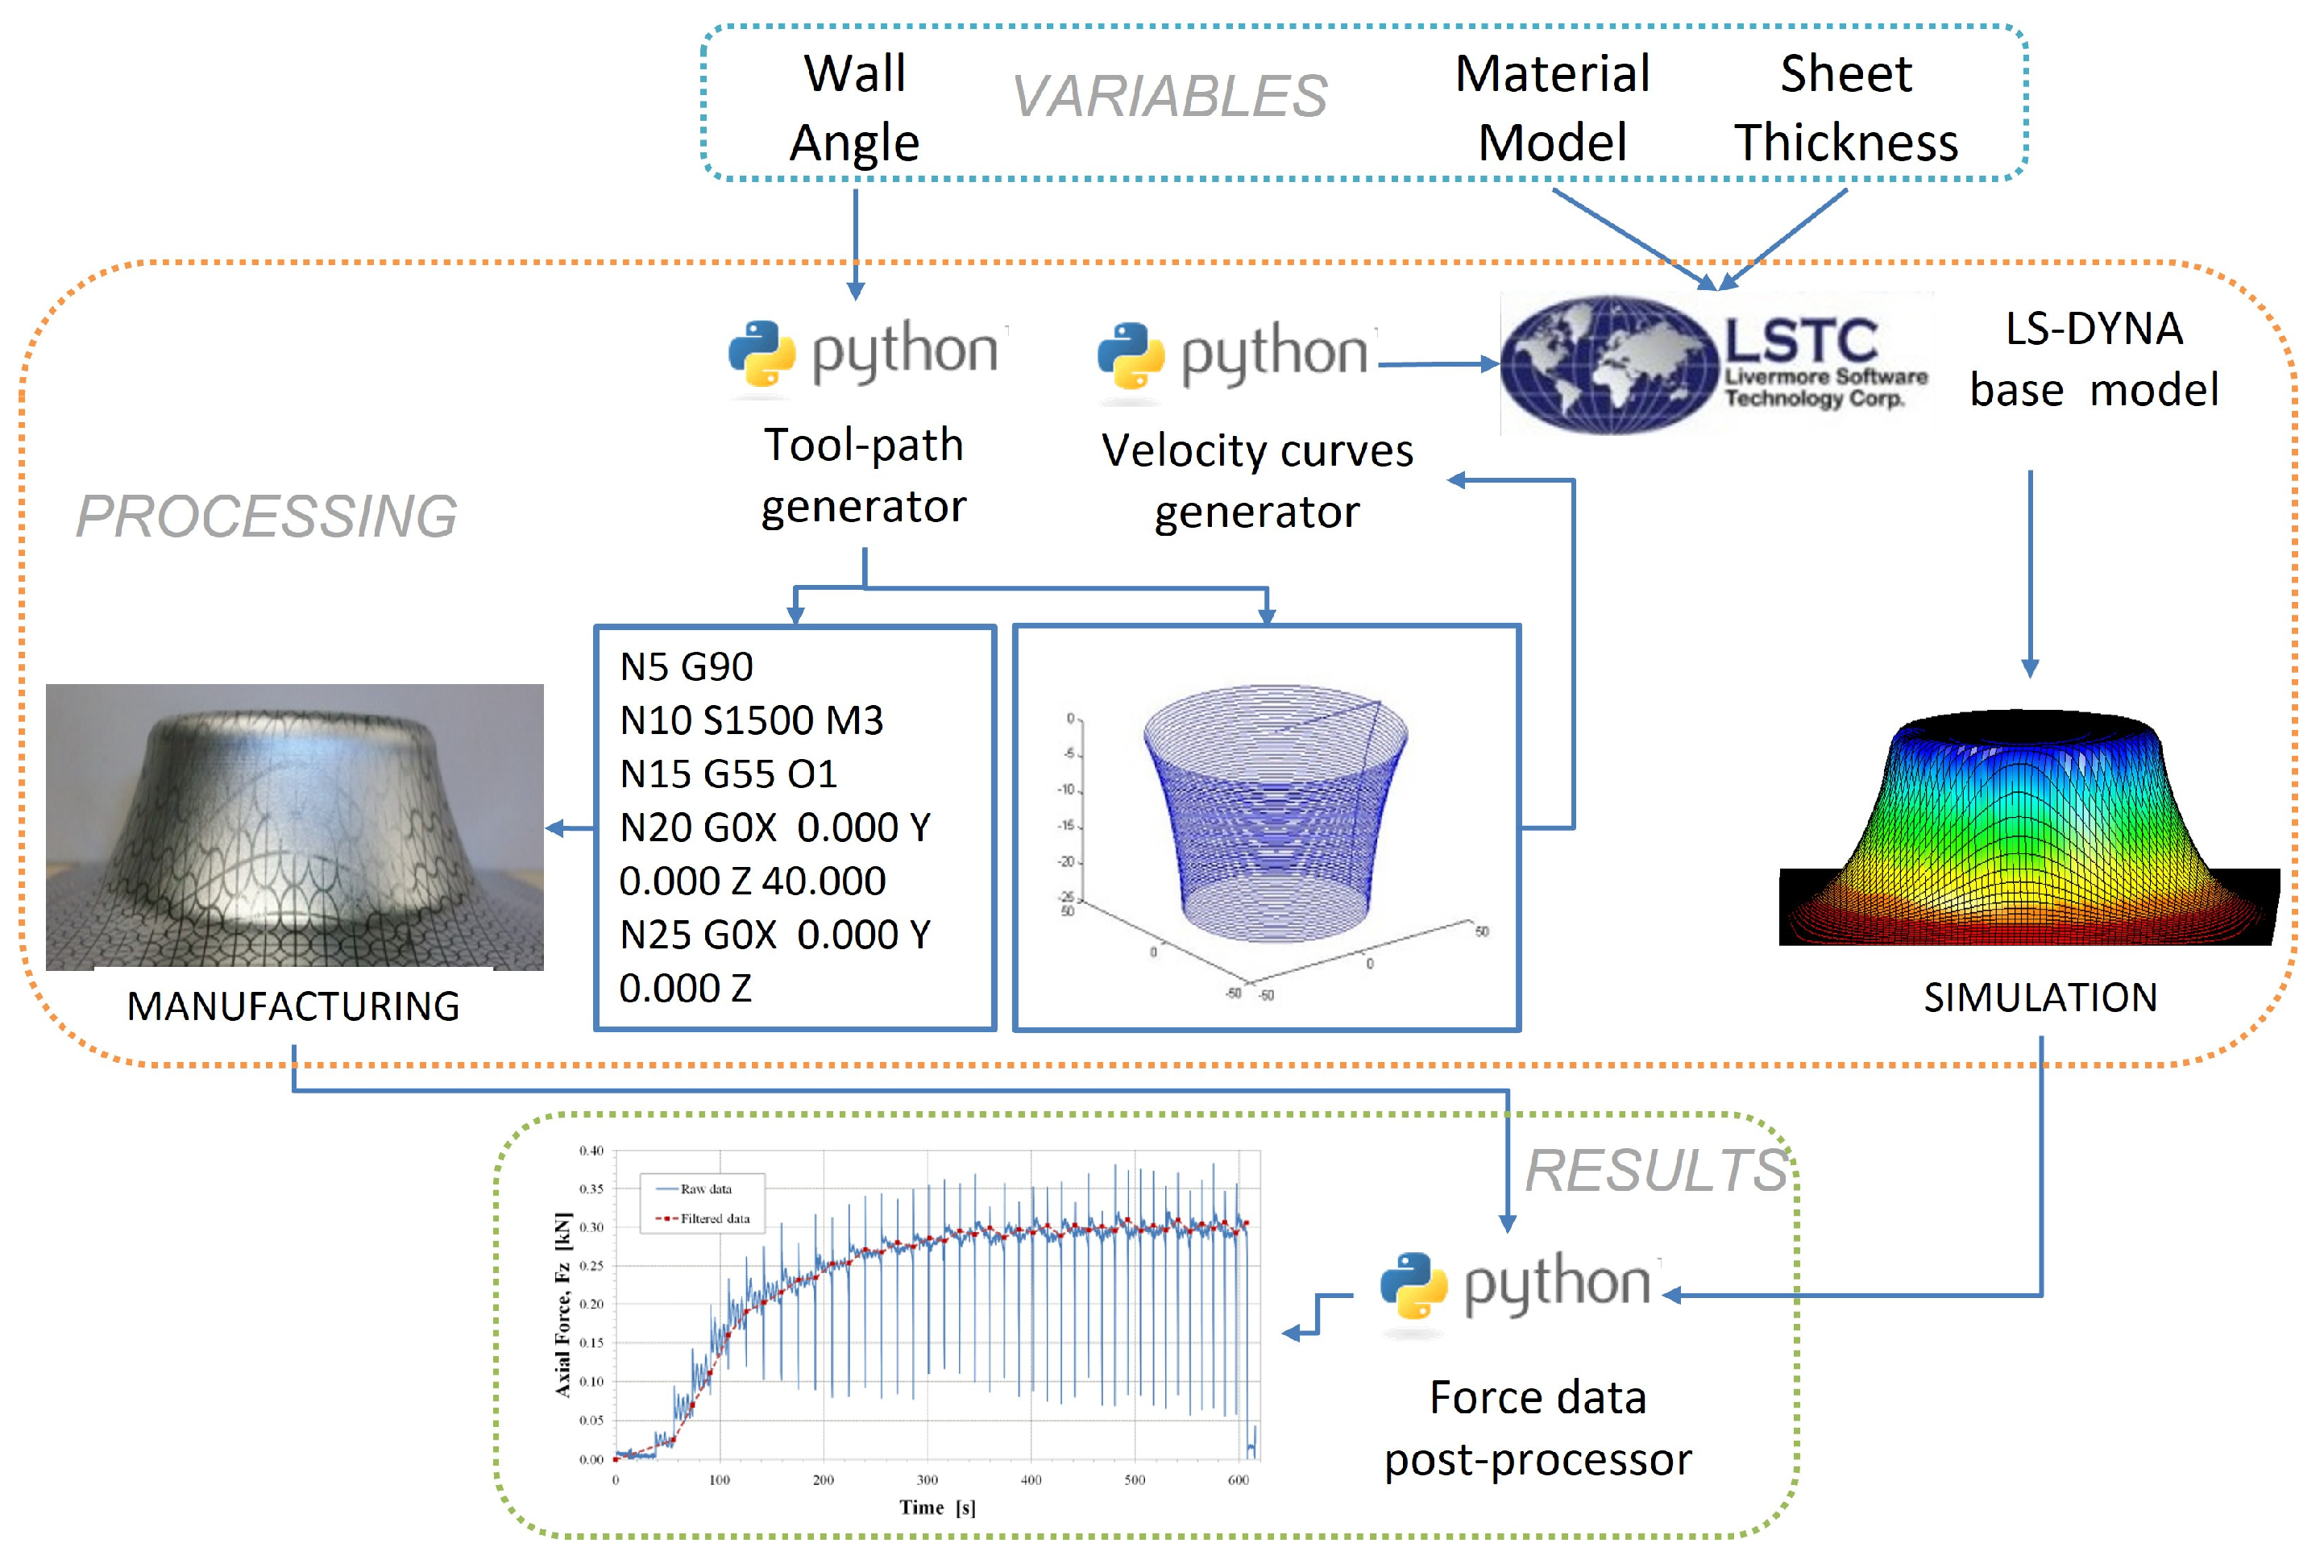
2.4. Numerical Procedure

The numerical results reported in this study were generated with the explicit solver of LS-DYNA®, release 971, running on a quad-core Windows® PC. The mid surface of the blank was described by a regular mesh of fully integrated linear quadrilateral shell elements using 5 integration points thickness-wise. Based on the results of a convergence study, square elements of size 1.5 mm × 1.5 mm were utilized. The external surfaces of the forming tool were modeled using shell elements associated with a rigid material defined by generic steel properties. The elastic response of the blank was specified with nominal values of Poisson’s ratio and Young’s modulus for each material. Plasticity was initially modeled with the isotropic von Mises yield criteria and Hollomon’s hardening rule. Frictional contact, with a coefficient of friction µ = 0.10, was defined between the tool and the blank. All degrees of freedom of the nodes defining the perimeter of the blank were fixed, and the tool rotation was disregarded for the simulation. Adaptive remeshing was not utilized. Feed rate and mass density scaling were employed to decrease the computation time.
Once a base model was configured, the toolpath became the sole requirement for simulating the studied parts. Figure 4 introduces the semi-automatic procedure employed to generate the physical and numerical tool paths.
As depicted by Figure 4, a Python®, release 2.7, subroutine generated the bidirectional contouring toolpath for each component. Then, the tool coordinates were converted into G-code instructions for the physical forming process. A second program translated the data into velocity curves for the virtual process.
A third script was developed to eliminate the experimental force spikes generated at each vertical step. The same post-processing procedure was used for the simulation results, making it possible to compare the filtered experimental and numerical load data sets.

3. Results

3.1. Experimental Results and Estimation from Analytical Models

The main process parameters, experimental force magnitude (Fz = axial force), and analytical model estimations computed with the formulae introduced in Section 1.2. are presented in Table 3 for each case.
In the next section, the capability of FEM models to provide both conservative and realistic estimations will be evaluated.

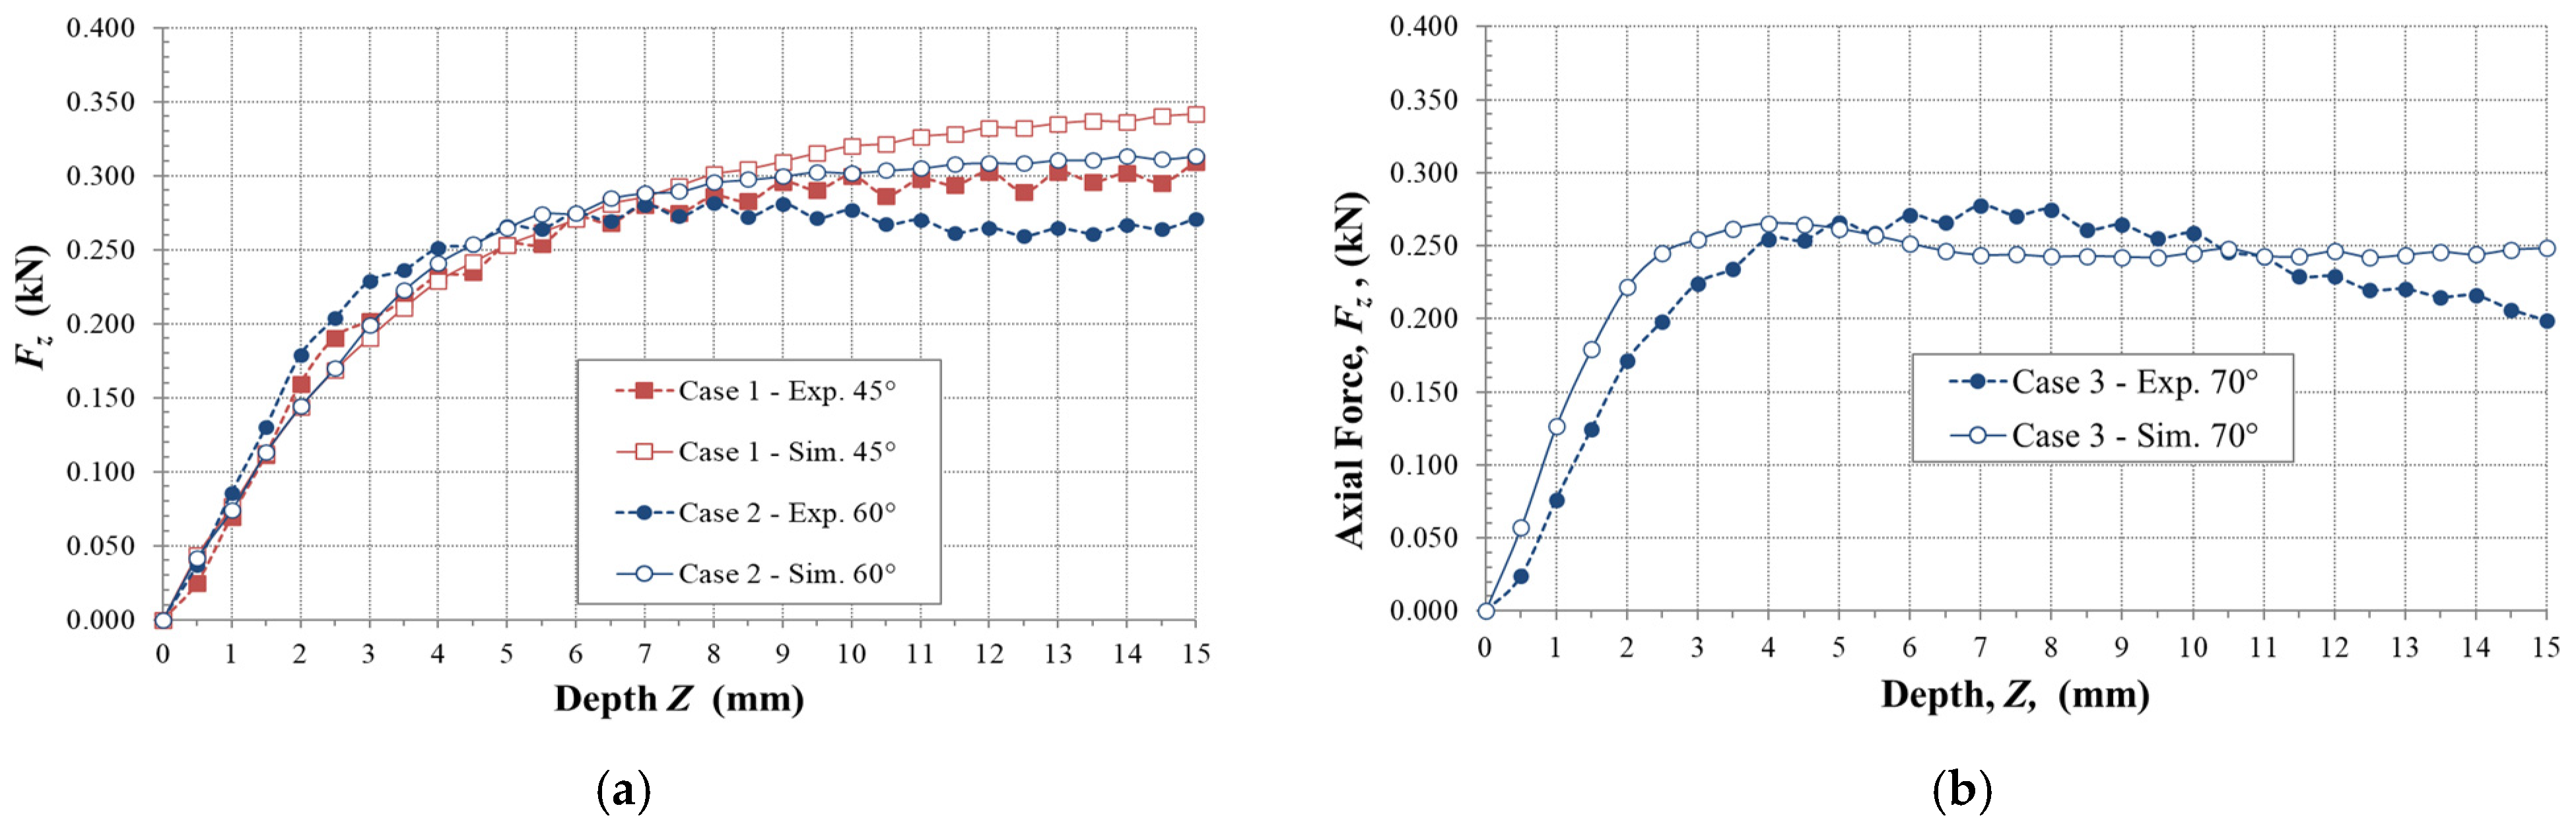
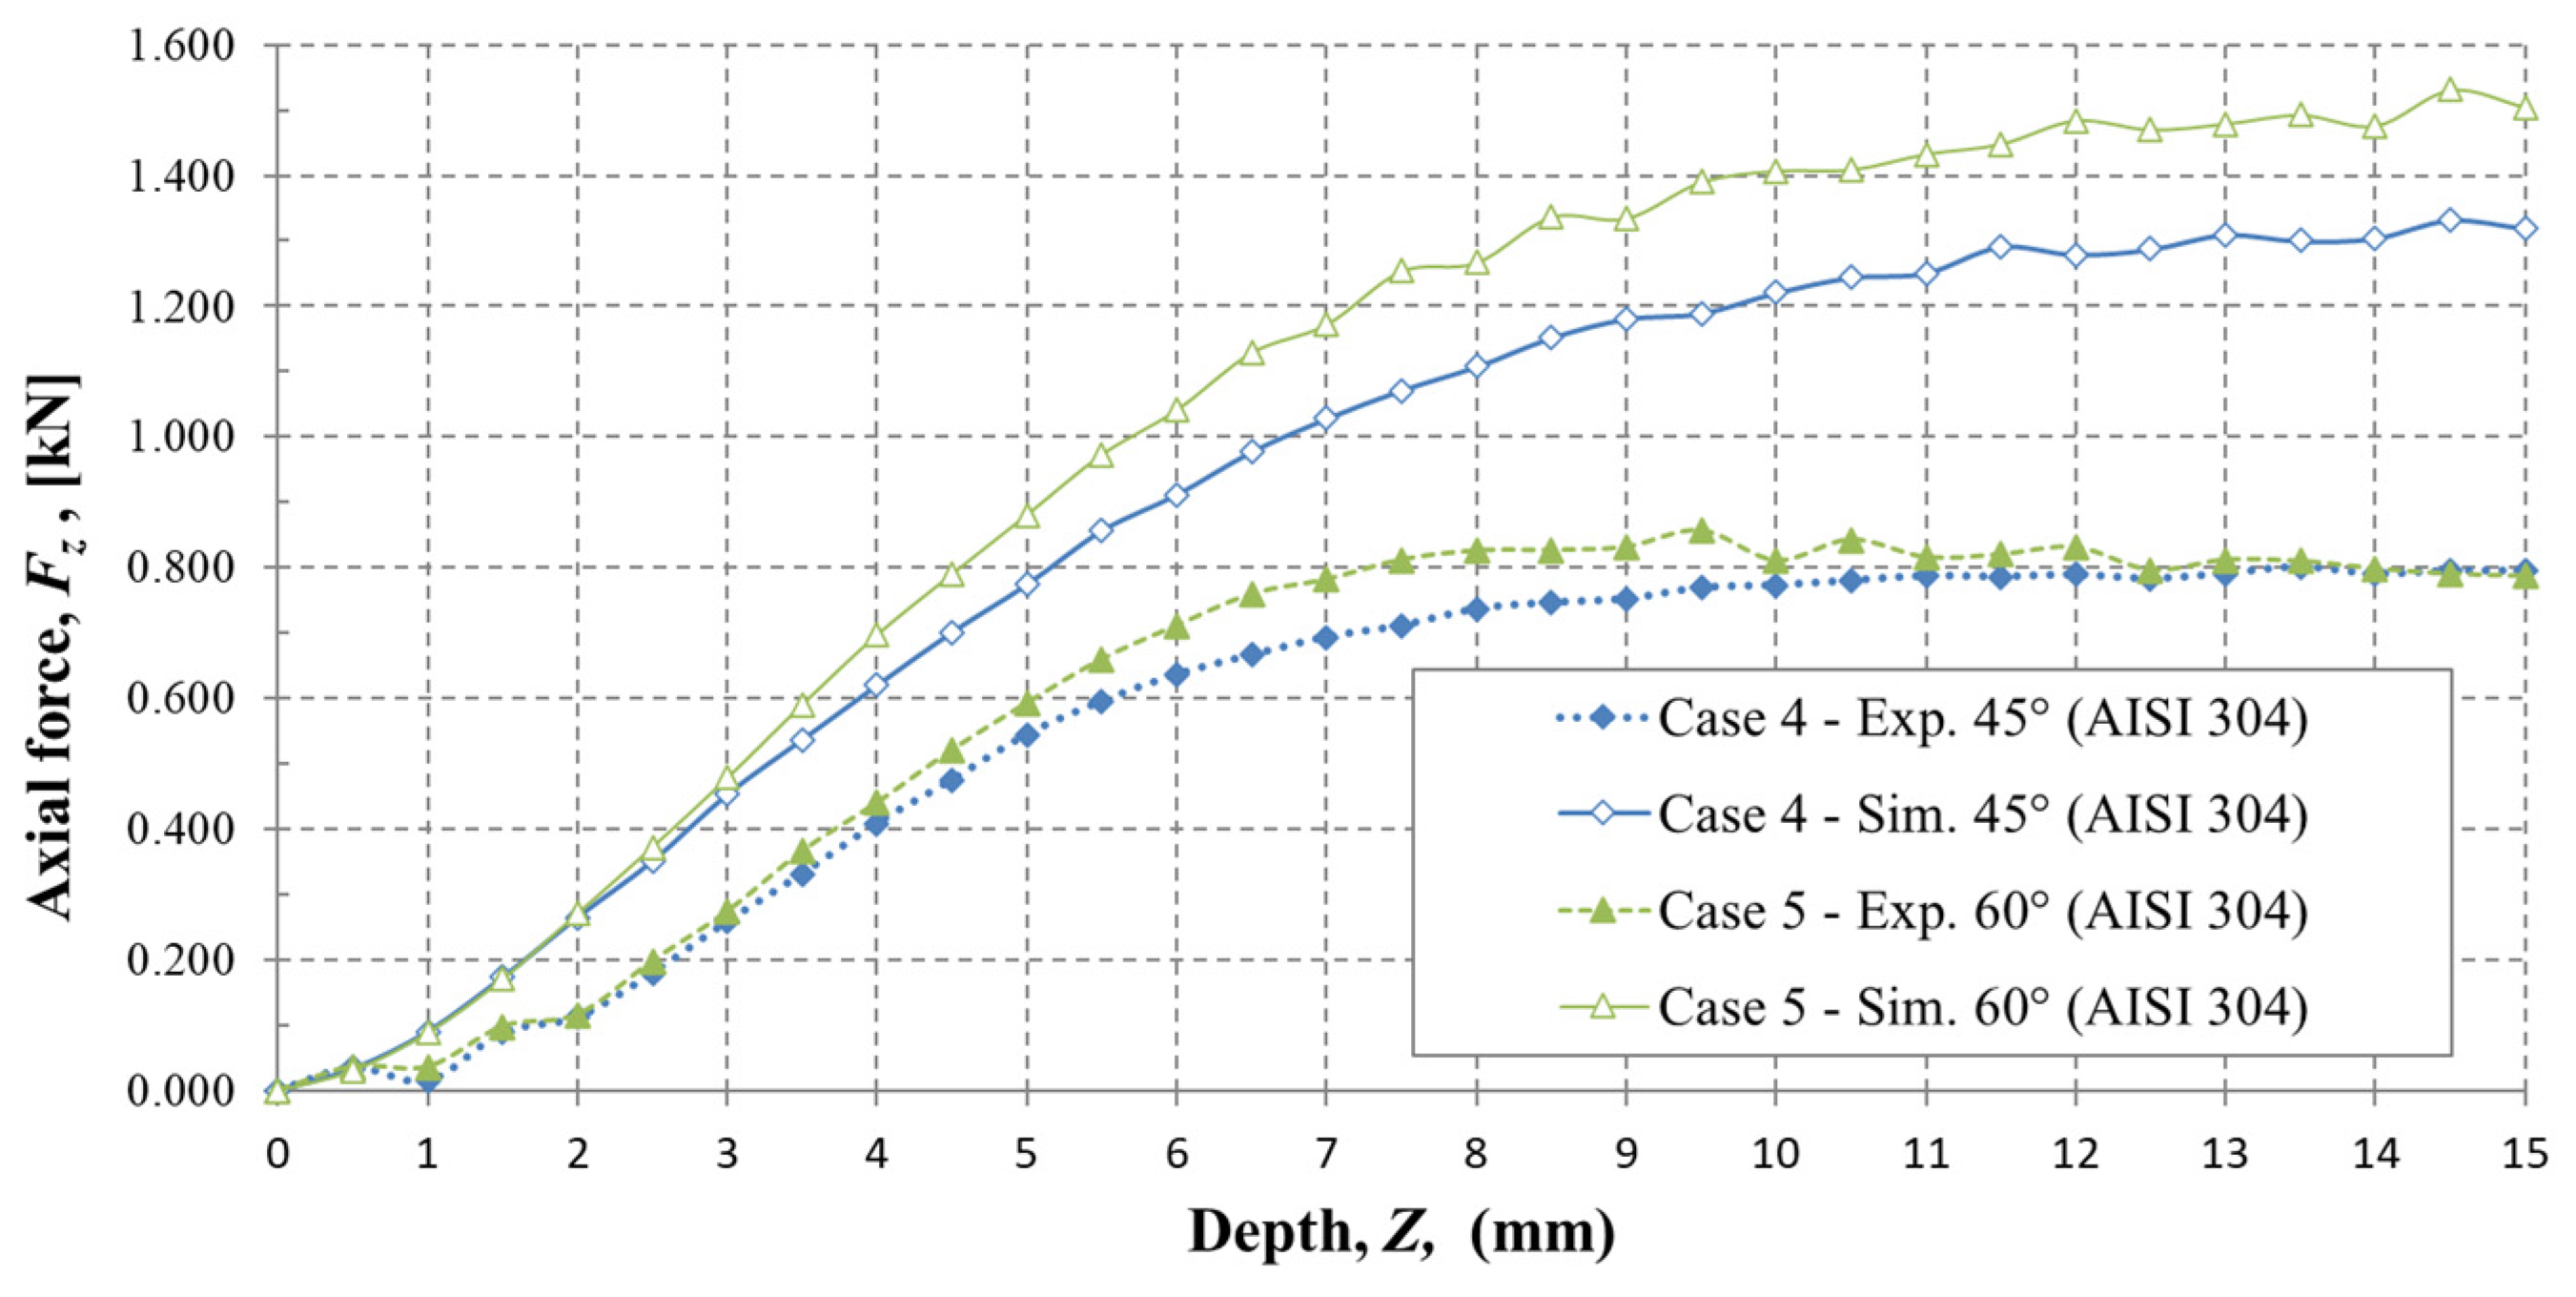
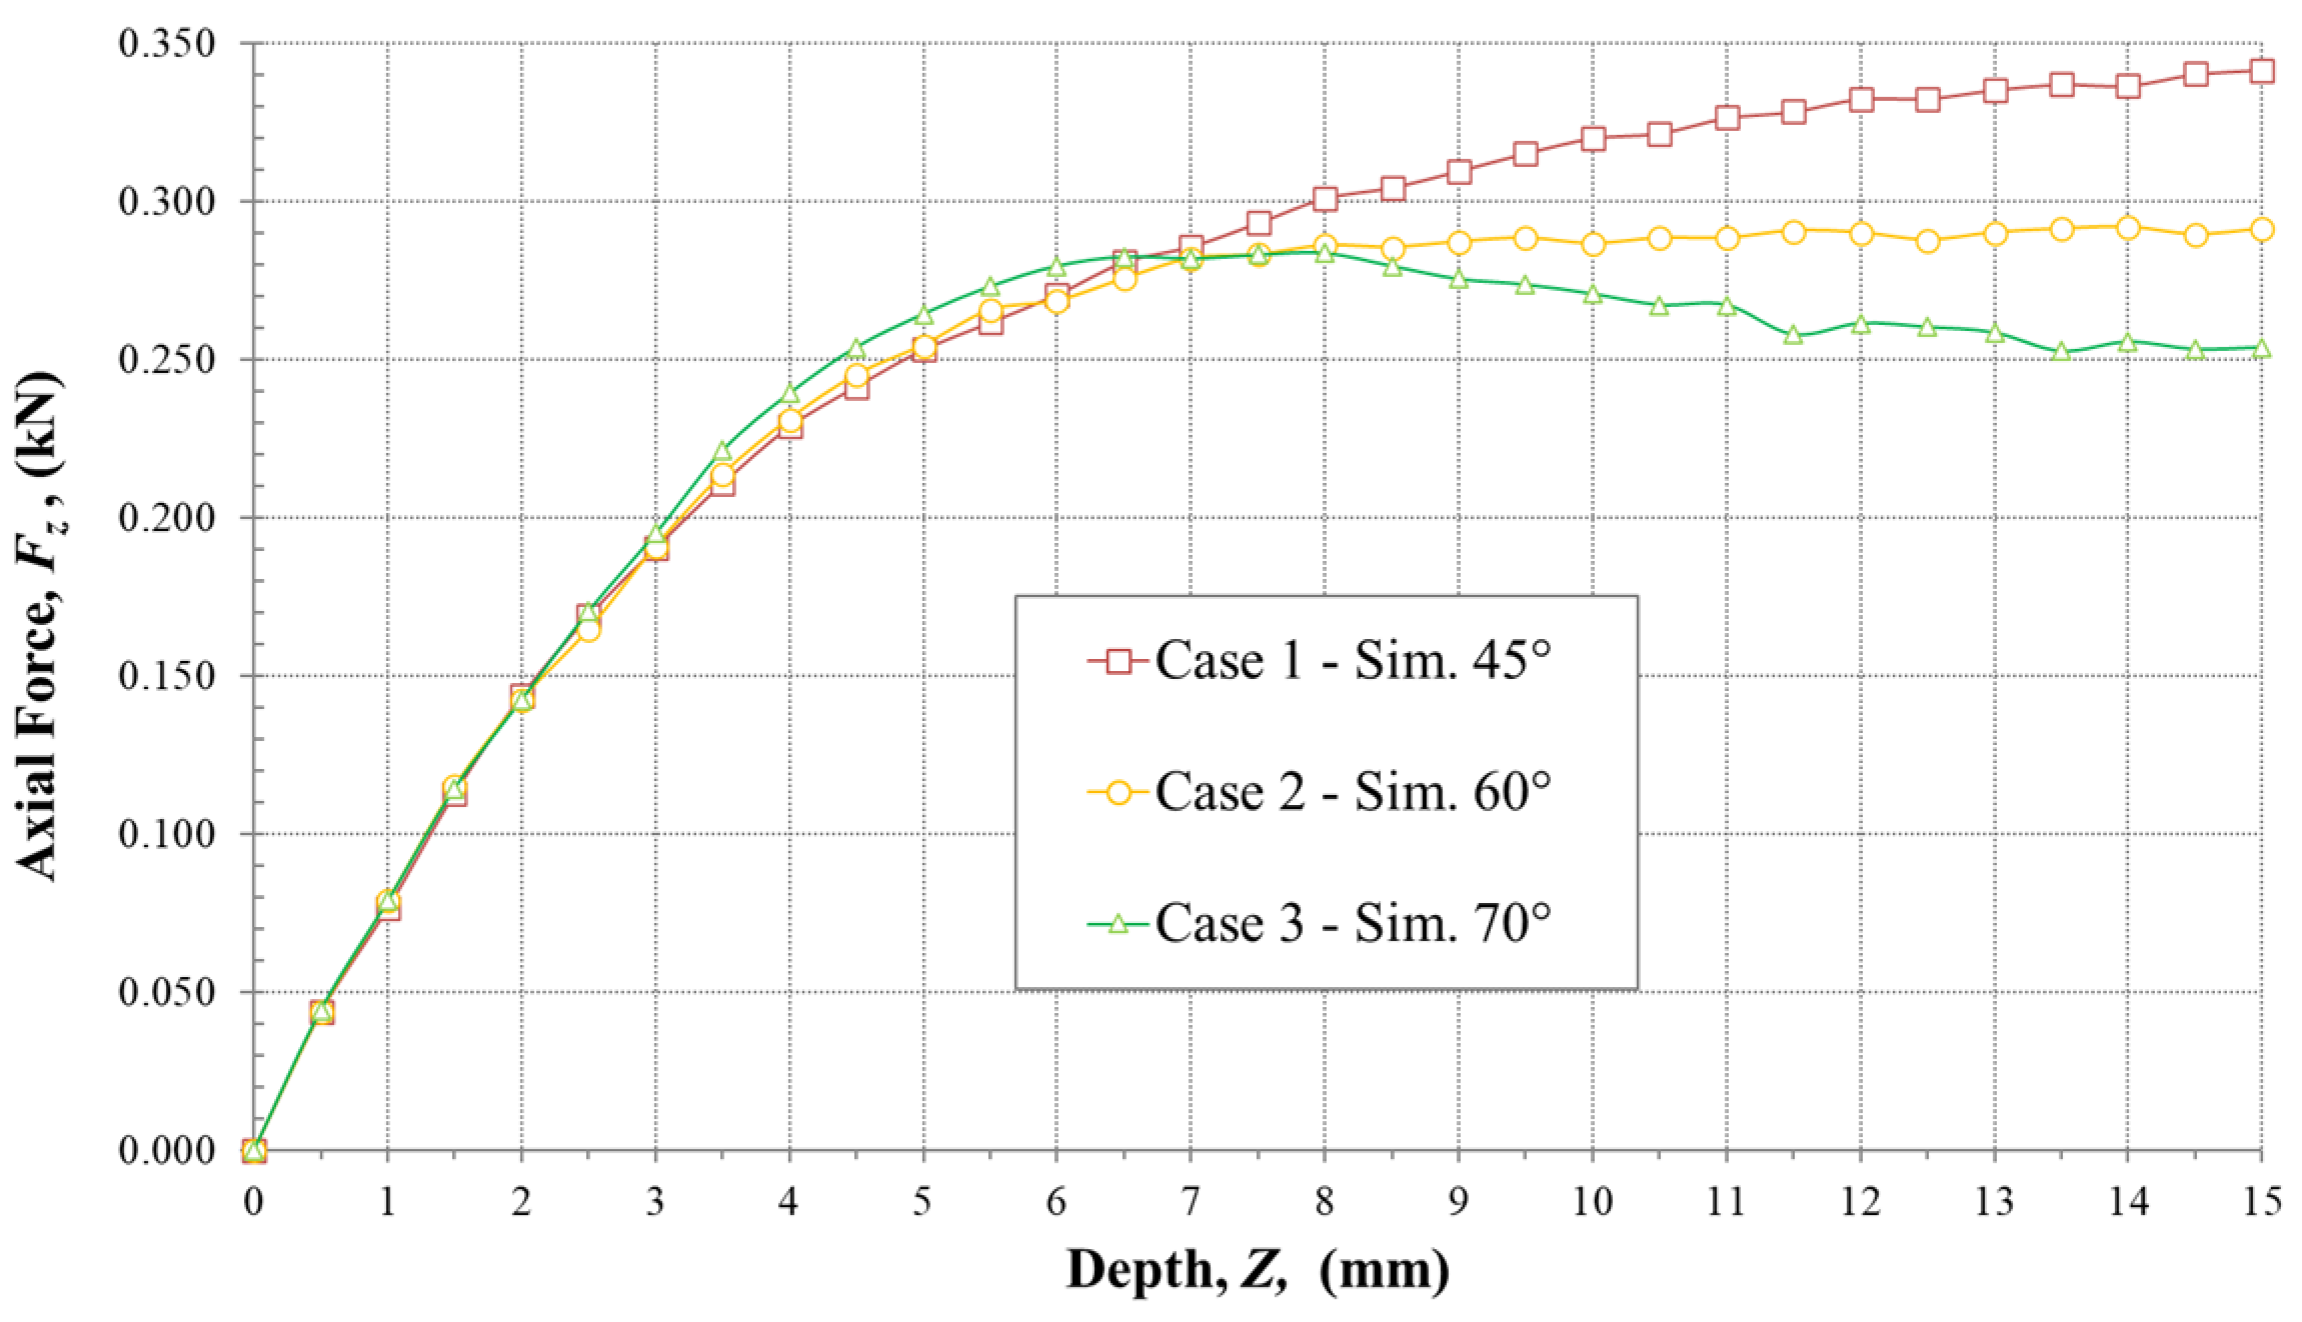
3.2. Force Estimation from FEM Models

Based on the methodology and hardening parameters introduced in Section 2, the force curves predicted by the models were compared to the experimental data obtained for the three AA1050-H24 pyramids in Figure 5. For the AISI304, Figure 6 compares the numerical and experimental force evolution of Cases 4 and 5. The maximum force estimations from the numerical models, along with their errors, compared to the experimental measurements, are presented in Table 4.
According to Table 4, the maximum absolute error for the aluminum cases is 11.3%, with one instance below the experimental peak result. Beyond the maximum values, Figure 5 reveals that for Cases 2 and 3, the numerical force monotonically increases throughout the process, whereas the experimental curves exhibit a peak between 7 and 9 mm depth. For the stainless-steel cases, the results are both qualitatively and quantitatively poor.
Based on the previous findings, enhancements focused on the hardening behavior of the models were implemented. The procedure and results are reported in the next sub-section.

3.3. Refinement of FEM Models: Hardening Rule

Previous results suggested that the Hollomon extrapolation may be inappropriate to describe the ISF processing loads of the studied aluminum components. Thus, the Voce hardening law was implemented as a straightforward alternative to improve the AA1050-H24 force estimations. The Voce’s parameters identified from the tensile experiments of this material are incorporated as
σ = 146.78 24.34 exp ( 7.67 ε p )
Such an enhanced hardening model was applied in Cases 2 and 3. Figure 7 compares the experimental and numerical force evolution for the two cases. The physical (AA1050-H24) α = 60° part presented a slight descending phase, starting around 9 mm depth, before ramping up for a second time after 13 mm depth. The force curve of the pyramid with a wall angle of α = 70° (Case 3) reveals the onset of fracture, identified by the characteristic drop after the peak, occurring at a depth of 7 mm. Indeed, a slow propagating crack appeared in the part, indicating the forming limit for this material under the employed experimental conditions.
The numerical force curves also describe the characteristic response for each case. Specifically, for the 60° wall angle component, the values stabilize during the falling phase of the experimental curve. Moreover, the 70° wall angle curve exhibits a force drop after the peak, at a depth of 8 mm, although with a lower gradient than its physical counterpart. Additionally, the improved FEM peak estimations were less than 4% above the experimental maximum force.
For the stainless steel, Hollomon’s hardening law parameters were adjusted by a curve-fitting approach comprising actual SPIF experiments as the data source. Figure 8a depicts the identification process employed. The error minimization problem was solved using the Lavenberg–Marquardt method implemented in Matlab® release 2010a [40]. Despite the affordable computational time of our models, the large number of iterations required by the optimization algorithm compelled us to fix limits on the procedure. Specifically, the force values of the 45° experiment (Case 4 in Table 3), obtained up to 6 mm depth, were assumed as the adjusted work hardening region. After 25 iterations (3.1 h per iteration), important progress in the curve fitting was observed, and the process was stopped. The values adjusted at this point, K = 0.861 GPa and n = 0.287, were considered optimal. The stress–strain curve of both hardening models is shown in Figure 8b, compared to the experimental engineering and true stress–strain curves.
Since the model fitted Case 4, its verification was carried out with Case 5. As shown in Figure 9, the peak force overestimation for the 60° pyramid was reduced from 79% to 22%.

4. Discussion

4.1. Examination of the Analytical Models

Table 3 shows that Iseki’s model yields conservative results, which may be useful for the design of ISF equipment. On the other hand, the estimations from Aerens’ model, derived from the statistical analysis of an experimental program, are closer to the experimental results.
Aerens’ equation does not explicitly include a work-hardening term, expressed through the n exponent in Iseki’s Model. Therefore, it may underpredict the load for the higher wall angles (i.e., Cases 3 and 5). Perez-Santiago et al. [41] demonstrated the influence of n on the angle at which the peak force occurs. This explains the maximum force value occurring at 45° for the AA1050-H24 material (Case 1) and at 60° for the AISI304 (Case 5).
In the next section, the capability of FEM models to provide both safe and accurate estimations will be evaluated.

4.2. Assessment of the Numerical Models

This section explores four criteria to evaluate the studied numerical models, namely safety for the ISF equipment, the complexity of FEM models, the solution time required by the numerical simulations, and their accuracy in predicting both the peak and the evolution of the force.
Safety: This criterion reflects the capability to provide conservative estimations regardless of accuracy. A certain overestimation is expected since the actual loads are higher than the filtered–studied data; still, they should not become a limitation for utilizing the equipment. On the other hand, minor underestimations could pose a risk for the machinery and tools.
Table 5 indicates that safe results were obtained in all cases where the FEM hardening model was refined.
Complexity: The complexity of FEM models necessitates specialized software, hardware, inputs, and knowledge. While the initial geometry of the SPIF system is straightforward, the subsequent modeling steps involve selecting from a long list of numerical alternatives to achieve accurate results. The process can be automated for simple geometries, such as the frusta studied in this work. Nevertheless, the hardening variability of different materials requires exploring diverse modeling approaches, like the ones shown in this study.
Solution time: Unlike the instantaneous response provided by analytical models, numerical simulations of SPIF are time-consuming, ranging from hours to even days, depending on part complexity. All cases simulated in this study required a computational time below five hours. However, fitting the hardening model of the AISI-SAE 304 material took approximately 70 h, making it difficult to justify the use of simulations only for peak force estimation.
Accuracy: In addition to accurately predicting peak force values, numerical models should also replicate the transient development of the force response for each case, especially when used for applications like failure prediction and stiffness compensation. Figure 9 highlights that the AISI-SAE 304 model requires additional refinement to accurately represent both the qualitative and quantitative aspects of the physical force data. Although the results obtained from the introduced regression model are promising, they also indicate the necessity of incorporating alternative isotropic or combined isotropic–kinematic hardening models. These additional models may provide a more comprehensive description of the loads induced by the SPIF process on this material. However, advanced characterization tests such as the uniaxial tension–compression cyclic tests are necessary for their parameter identification. Combined with the hardening model, the heating effect caused by the contact between the tool and the blank may be another reason for the numerical results discrepancy. Bagudanch et al. [9] found a difference of around 13% in the axial forces of variable wall angle cones formed with AISI-SAE 304 when the spindle speed was varied from 1000 rpm to free spindle rotation.
On the other hand, the Voce hardening law, with parameters identified from uniaxial tensile tests, accurately represents the experimental load response of the AA1050-H24 material. The achieved numerical force curves, gathered in Figure 10, reproduce the experimental trend of components formed with SPIF at different wall angles [7,8]. In this case, simulations could be helpful for discerning, before forming the first component, between successful parts and those at risk of failure.

5. Conclusions

This study assesses the capability of two analytical models to obtain valuable estimations of the SPIF process load. Iseki’s model yields conservative results, which may be useful for the design of ISF equipment. While Aerens’ model predictions are closer to the experiments, it does not incorporate a strain-hardening exponent in its correlation. Therefore, the maximum force computed by this equation occurs at a wall angle of 47°. An underestimated force is possible if the component walls are above this angle.
Additionally, the influence of the work-hardening model on the accuracy of the FEM simulations is explored. Advanced characterization and parameter identification techniques may be required to accurately predict the experimental force evolution of materials with a high degree of strain-hardening, as is the case of the AISI-SAE 304 stainless steel. For the studied AA1050-H24 aluminum alloy, the numerical results indicate that both accurate and conservative predictions can be obtained with a simpler numerical approach and the correct utilization of tensile test data. In addition to the peak force, refined FEM models can approximate the characteristic force curve observed under different forming conditions. For example, the falling trend originated from the imbalance between the material hardening and the sheet thinning occurring in the AA1050-H24, 70°, component. However, without a damage model, it is impossible to describe the sudden drop in the part stiffness caused by material cracking.
In future studies, the analytical and numerical models should be systematically tested on more complex topologies and a wider range of materials. Also, simulations based on alternative isotropic or combined isotropic–kinematic hardening models should be validated. Additionally, thermal effects and their influence on the material properties should be considered. Only then can conclusive guidelines regarding their accuracy be established.

Author Contributions

Conceptualization, R.P.-S., N.J.H. and E.C.-U.; methodology, R.P.-S. and N.J.H.; software, R.P.-S.; validation, R.P.-S.; formal analysis, R.P.-S. and N.J.H.; investigation, R.P.-S., G.C.-G. and E.V.-L.; resources, E.C.-U.; data curation, R.P.-S.; writing—original draft preparation, R.P.-S.; writing—review and editing, N.J.H., G.C.-G., E.V.-L. and E.C.-U.; visualization, R.P.-S. All authors have read and agreed to the published version of the manuscript.

Funding

This research received no external funding.

Institutional Review Board Statement

Not applicable.

Informed Consent Statement

Not applicable.

Data Availability Statement

The raw data supporting the conclusions of this article will be made available by the authors upon request.

Acknowledgments

The first author acknowledges the support from the Grup de Recerca en Enginyeria de Procés, Producte i Producció, from the Universitat de Girona, and the Metamaterials and Lightweight Structures Lab at Tec de Monterrey.

Conflicts of Interest

The authors declare no conflicts of interest.

References

  1. Jeswiet, J.; Micari, F.; Hirt, G.; Bramley, A.; Duflou, J.; Allwood, J. Asymmetric single point incremental forming of sheet metal. CIRP Ann. Manuf. Technol. 2005, 54, 88–114. [Google Scholar] [CrossRef]
  2. Oleksik, V.; Bologa, O.; Breaz, R.; Racz, G. Comparison between the numerical simulations of incremental sheet forming and conventional stretch forming process. Int. J. Mater. Form. 2008, 1, 1187–1190. [Google Scholar] [CrossRef]
  3. Bârsan, A.; Racz, S.G.; Breaz, R.; Crenganiș, M. Dynamic analysis of a robot-based incremental sheet forming using Matlab-Simulink SimscapeTM environment. Mater. Today Proc. 2022, 62, 2538–2542. [Google Scholar] [CrossRef]
  4. Ceretti, E.; Giardini, C.; Attanasio, A. Experimental and simulative results in sheet incremental forming on CNC machines. J. Mater. Process Technol. 2004, 152, 176–184. [Google Scholar] [CrossRef]
  5. Allwood, J.M.; Houghton, N.E.; Jackson, K.P. The Design of an Incremental Sheet Forming Machine. Adv. Mater. Res. 2005, 6–8, 471–478. [Google Scholar] [CrossRef]
  6. De Sousa, R.J.A.; Ferreira, J.A.F.; De Farias, J.B.S.; Torrão, J.N.D.; Afonso, D.G.; Martins, M.A.B.E. SPIF-A: On the development of a new concept of incremental forming machine. Struct. Eng. Mech. 2014, 49, 645–660. [Google Scholar] [CrossRef]
  7. Jeswiet, J.; Duflou, J.R.; Szekeres, A. Forces in Single Point and Two Point Incremental Forming. Adv. Mater. Res. 2005, 6–8, 449–456. [Google Scholar] [CrossRef]
  8. Duflou, J.R.; Szekeres, A.; Vanherck, P. Force Measurements for Single Point Incremental Forming: An Experimental Study. Adv. Mater. Res. 2005, 6–8, 441–448. [Google Scholar] [CrossRef]
  9. Bagudanch, I.; Centeno, G.; Vallellano, C.; Garcia-Romeu, M.L. Forming force in Single Point Incremental Forming under different bending conditions. Procedia Eng. 2013, 63, 354–360. [Google Scholar] [CrossRef]
  10. Kumar, A.; Gulati, V.; Kumar, P.; Singh, H. Forming force in incremental sheet forming: A comparative analysis of the state of the art. J. Braz. Soc. Mech. Sci. Eng. 2019, 41, 251. [Google Scholar] [CrossRef]
  11. Iseki, H. An approximate deformation analysis and FEM analysis for the incremental bulging of sheet metal using a spherical roller. J. Am. Acad. Dermatol. 2001, 111, 150–154. [Google Scholar] [CrossRef]
  12. Aerens, R.; Eyckens, P.; Van Bael, A.; Duflou, J.R. Force prediction for single point incremental forming deduced from experimental and FEM observations. Int. J. Adv. Manuf. Technol. 2009, 46, 969–982. [Google Scholar] [CrossRef]
  13. Li, Y.; Daniel, W.J.T.; Liu, Z.; Lu, H.; Meehan, P.A. Deformation mechanics and efficient force prediction in single point incremental forming. J. Mater. Process Technol. 2015, 221, 100–111. [Google Scholar] [CrossRef]
  14. Bansal, A.; Lingam, R.; Yadav, S.K.; Reddy, N.V. Prediction of forming forces in single point incremental forming. J. Manuf. Process. 2017, 28, 486–493. [Google Scholar] [CrossRef]
  15. Chang, Z.; Li, M.; Chen, J. Analytical modeling and experimental validation of the forming force in several typical incremental sheet forming processes. Int. J. Mach. Tools Manuf. 2019, 140, 62–76. [Google Scholar] [CrossRef]
  16. Liu, Z.; Li, Y. Small data-driven modeling of forming force in single point incremental forming using neural networks. Eng. Comput. 2020, 36, 1589–1597. [Google Scholar] [CrossRef]
  17. Verbert, J.; Aerens, R.; Vanhove, H.; Aertbeliën, E.; Duflou, J.R. Obtainable accuracies and compensation strategies for robot supported SPIF. Key Eng. Mater. 2009, 410–411, 679–687. [Google Scholar] [CrossRef]
  18. Meier, H.; Buff, B.; Laurischkat, R.; Smukala, V. Increasing the part accuracy in dieless robot-based incremental sheet metal forming. CIRP Ann. Manuf. Technol. 2009, 58, 233–238. [Google Scholar] [CrossRef]
  19. Ambrogio, G.; Filice, L.; Micari, F. A force measuring based strategy for failure prevention in incremental forming. J. Mater. Process. Technol. 2006, 177, 413–416. [Google Scholar] [CrossRef]
  20. Al-Ghamdi, K.A.; Hussain, G.; Butt, S.I. Force variations with defects and a force-based strategy to control defects in SPIF. Mater. Manuf. Process. 2014, 29, 1197–1204. [Google Scholar] [CrossRef]
  21. Araghi, B.T.; Manco, G.L.; Bambach, M.; Hirt, G. Investigation into a new hybrid forming process: Incremental sheet forming combined with stretch forming. CIRP Ann. Manuf. Technol. 2009, 58, 225–228. [Google Scholar] [CrossRef]
  22. Hadoush, A.; van den Boogaard, A.H. Substructuring in the implicit simulation of single point incremental sheet forming. Int. J. Mater. Form. 2009, 2, 181–189. [Google Scholar] [CrossRef]
  23. Eyckens, P.; Van Bael, A.; Aerens, R.; Duflou, J.; Van Houtte, P. Small-scale finite element modelling of the plastic deformation zone in the incremental forming process. Int. J. Mater. Form. 2008, 1, 1159–1162. [Google Scholar] [CrossRef]
  24. Lequesne, C.; Henrard, C.; Bouffioux, C. Adaptive remeshing for incremental forming simulation. Numer. Simul. 2008, 32, 399–403. [Google Scholar]
  25. Robert, C.; Ayed, L.B.; Delamézière, A.; Santo, P.D.; Batoz, J.L. Development of a simplified approach of contact for incremental sheet forming. Int. J. Mater. Form. 2010, 3, 987–990. [Google Scholar] [CrossRef]
  26. Bambach, M.; Hirt, G. Error analysis in explicit finite element analysis of incremental sheet forming. AIP Conf. Proc. 2007, 908, 859–864. [Google Scholar] [CrossRef]
  27. Pepelnjak, T.; Sevšek, L.; Lužanin, O.; Milutinović, M. Finite Element Simplifications and Simulation Reliability in Single Point Incremental Forming. Materials 2022, 15, 3707. [Google Scholar] [CrossRef] [PubMed]
  28. He, S.; Van Bael, A.; van Houtte, P.; Duflou, J.R.; Szekeres, A.; Henrard, C.; Habraken, A.M. Finite Element Modeling of Incremental Forming of Aluminum Sheets. Adv. Mater. Res. 2005, 6-8, 525–532. [Google Scholar] [CrossRef]
  29. Hirt, G.; Ames, J.; Bambach, M. Validation of FEA for asymmetric incremental sheet forming by on-line measurements of deformation and tool forces. Prod. Eng. 2006, 13, 39–44. [Google Scholar]
  30. Bambach, M.; Hirt, G.; Junk, S. Modelling and experimental evaluation of the incremental CNC sheet metal forming process. Proc. VII-Th Int. Conf. Comput. Plast. 2003, 23, 2630–2642. [Google Scholar]
  31. Jackson, K.; Allwood, J. The mechanics of incremental sheet forming. J. Mater. Process Technol. 2008, 209, 1158–1174. [Google Scholar] [CrossRef]
  32. Barlat, F. Material Modeling for Sheet Metal Forming Simulations. Numisheet 2008, 2008, 27–36. [Google Scholar]
  33. Perez-Santiago, R.; Fiorentino, A.; Marzi, R.; Rodriguez, C.A. Advances in simulation of two point incremental forming. AIP Conf. Proc. 2011, 1353, 183–188. [Google Scholar] [CrossRef]
  34. Henrard, C.; Bouffioux, C.; Eyckens, P.; Sol, H.; Duflou, J.R.; Van Houtte, P.; Van Bael, A.; Duchêne, L.; Habraken, A.M. Forming forces in single point incremental forming: Prediction by finite element simulations, validation and sensitivity. Comput. Mech. 2010, 47, 573–590. [Google Scholar] [CrossRef]
  35. Suzuki, T.; Okamura, K.; Capilla, G.; Hamasaki, H.; Yoshida, F. Effect of anisotropy evolution on circular and oval hole expansion behavior of high-strength steel sheets. Int. J. Mech. Sci. 2018, 146–147, 556–570. [Google Scholar] [CrossRef]
  36. Bouffioux, C.; Pouteau, P.; Duchêne, L.; Vanhove, H.; Duflou, J.R.; Habraken, A.M. Material data identification to model the single point incremental forming process. Int. J. Mater. Form. 2010, 3, 979–982. [Google Scholar] [CrossRef]
  37. Esmaeilpour, R.; Kim, H.; Park, T.; Pourboghrat, F.; Agha, A.; Abu-Farha, F. Effect of hardening law and process parameters on finite element simulation of single point incremental forming (SPIF) of 7075 aluminum alloy sheet. Mech. Ind. 2020, 21, 302. [Google Scholar] [CrossRef]
  38. Pérez-Santiago, R.; Bagudanch, I.; García-Romeu, M.L. Force modelling in single point incremental forming of variable wall angle components. Key Eng. Mater. 2011, 473, 833–840. [Google Scholar] [CrossRef]
  39. Wang, J.; Nair, M.; Zhang, Y. An efficient force prediction strategy for single point incremental sheet forming. Int. J. Adv. Manuf. Technol. 2017, 92, 3931–3939. [Google Scholar] [CrossRef]
  40. MathWorks, T. MATLAB (R2022a); The MathWorks Inc.: The Natick Mall, MA, USA, 2022. [Google Scholar]
  41. Pérez-Santiago, R.; Bagudanch, I.; García-Romeu, M.L.; Hendrichs, N. Effect of strain hardening exponent in the incremental sheet forming force. In Proceedings of the Metal Forming International Conference, Kraków, Poland, 16–19 September 2012; pp. 439–442. [Google Scholar]
Figure 1. Schematic representation of the SPIF process.
Applsci 14 05705 g001
Figure 2. (a) Top view of a typical UWA pyramid, mounted in the clamping plates, utilized for the model assessment; (b) Circular vs. square frusta. The zones limited by dashed lines indicate the areas prone to initial bending; (c) Comparison of force curves for round and unround (normal) corner parts.
Applsci 14 05705 g002
Figure 3. Experimental setup used on a 3-axis CNC milling machine.
Applsci 14 05705 g003
Figure 4. The semi-automatic workflow employed to generate G-code tool paths, simulation velocity-based trajectories, and filtered force curves.
Applsci 14 05705 g004
Figure 5. Experimental and numerical axial force evolution for parts formed with the AA1050-H24 sheet: (a) Cases 1, 2; (b) Case 3.
Applsci 14 05705 g005
Figure 6. Experimental and numerical axial force evolution for Cases 4 and 5; formed with the AISI-SAE 304 sheet.
Applsci 14 05705 g006
Figure 7. Comparison of the numerical force evolution of two aluminum parts, based on Voce’s hardening law, against the experimental results.
Applsci 14 05705 g007
Figure 8. (a) Flow chart of Hollomon’s hardening rule adjustment process; (b) The two Hollomon’s hardening curves compared to the engineering and true stress–strain curves.
Applsci 14 05705 g008
Figure 9. Improved axial force prediction based on “optimal” parameters for the AISI304 material.
Applsci 14 05705 g009
Figure 10. Force curves predicted for the three aluminum parts simulated in this study.
Applsci 14 05705 g010
Table 1. Mechanical properties of the tested materials.
MaterialE
(MPa)
γ
(-)
Y
(MPa)
TS
(MPa)
K
(MPa)
n
(-)
AA1050-H2470,0000.361241271570.040
AISI304207,0000.3026966913320.395
Notes: E: Young’s modulus; γ: Poisson’s ratio; Y: yield strength; TS: tensile strength; K: flow stress constant; n: hardening exponent.
Table 2. Reference experimental process parameters.
ToolpathToolReplicas
Bidirectional contouring; ∆z = 0.5 mmFeed rate: 1000 mm/min
Rotation: 1000 rpm
Diameter: 10 mm
Material: Vanadis 23®
3
Table 3. Experimental cases used to validate the simulation results.
Case IDMaterialVertical Step
Δz (mm)
Tool Diameter
dt (mm)
Wall Angle
α (deg)
Thickness
t0 (mm)
Experimental
Fz (kN)
Aerens’
Fzs (kN)
Iseki’s
Fz (kN)
1AA1050-H240.510450.80.3090.3550.700
2AA1050-H240.510600.80.2820.3220.624
3AA1050-H240.510700.80.2770.2530.471
4AISI3040.510450.50.8010.8912.679
5AISI3040.510600.50.8570.8103.051
Table 4. Experimental UWA cases used to evaluate the maximum FEM force predictions.
Case IDMaterialShapeWall Angle
α (deg)
Experimental
Fz (kN)
FEM
Fz (kN)
Error
(%)
1AA1050-H24Pyramid450.3090.34110.4
2AA1050-H24Pyramid600.2820.31411.3
3AA1050-H24Pyramid700.2770.265−4.3
4AISI304Pyramid450.8011.33166.2
5AISI304Pyramid600.8571.53178.6
Table 5. Results of the improved FEM force predictions.
Case IDMaterialShapeWall Angle
α [deg]
Experiment
Fz [kN]
Imp. FEM
Fz [kN]
Error
(%)
2AA1050-H24Pyramid600.2820.2923.5
3AA1050-H24Pyramid700.2770.2842.5
5AISI304Pyramid600.8571.04822.3
Disclaimer/Publisher’s Note: The statements, opinions and data contained in all publications are solely those of the individual author(s) and contributor(s) and not of MDPI and/or the editor(s). MDPI and/or the editor(s) disclaim responsibility for any injury to people or property resulting from any ideas, methods, instructions or products referred to in the content.

