

Formulation and Stability Assessment of Bakery Snacks Enriched with Encapsulated Phenolic Compounds from Lemnian Tomatoes and Pumpkin (Cucurbita moschata)


Abstract
1. Introduction
2. Materials and Methods
2.1. Chemicals and Reagents
2.2. Sample Preparation
2.3. Extraction of Samples Assisted by Ultrasounds
2.4. Evaluation of Antioxidant Activity in Extracted Samples
2.5. Determination of Total Phenolics
2.6. Statistical Analysis
2.7. The Design of Experimentation
2.8. Verification of the Statistical Model
2.9. Encapsulation of the Optimized Extracts
Encapsulation Yield and Efficiency
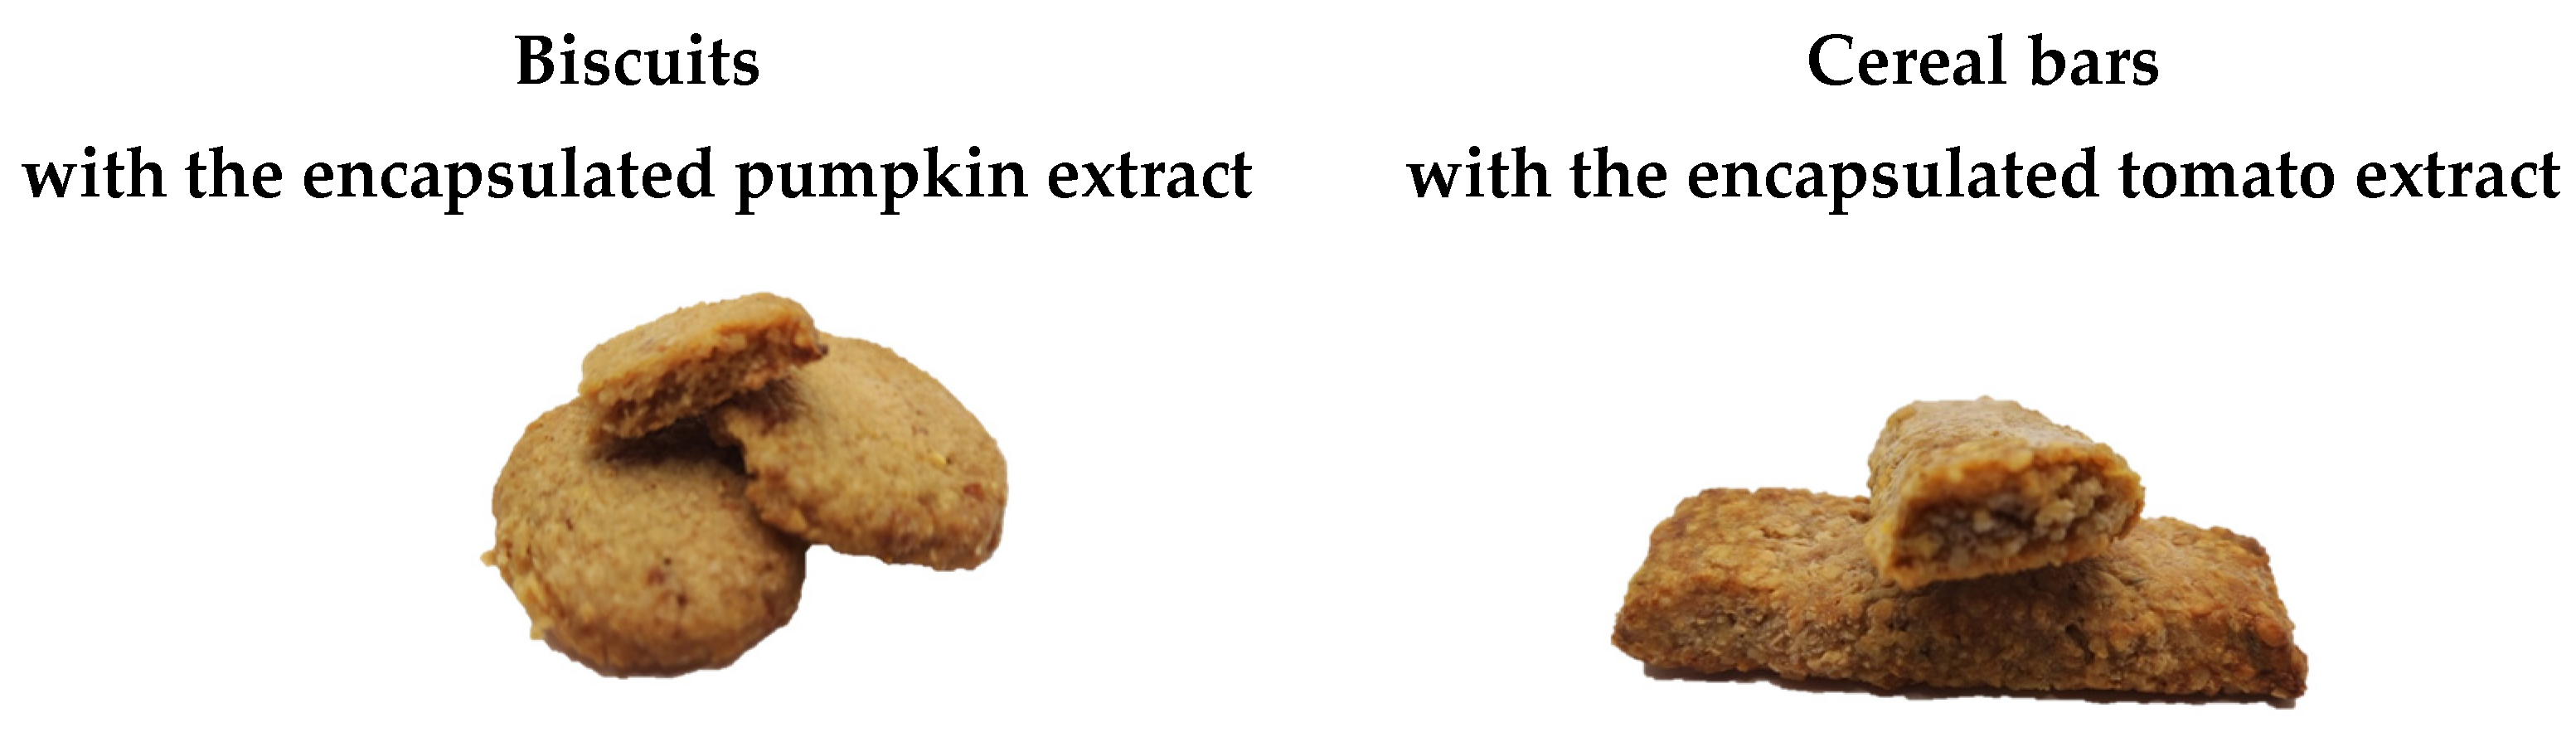
2.10. Preparation of the Enriched Bakery Product
2.11. Stability Evaluation
3. Results
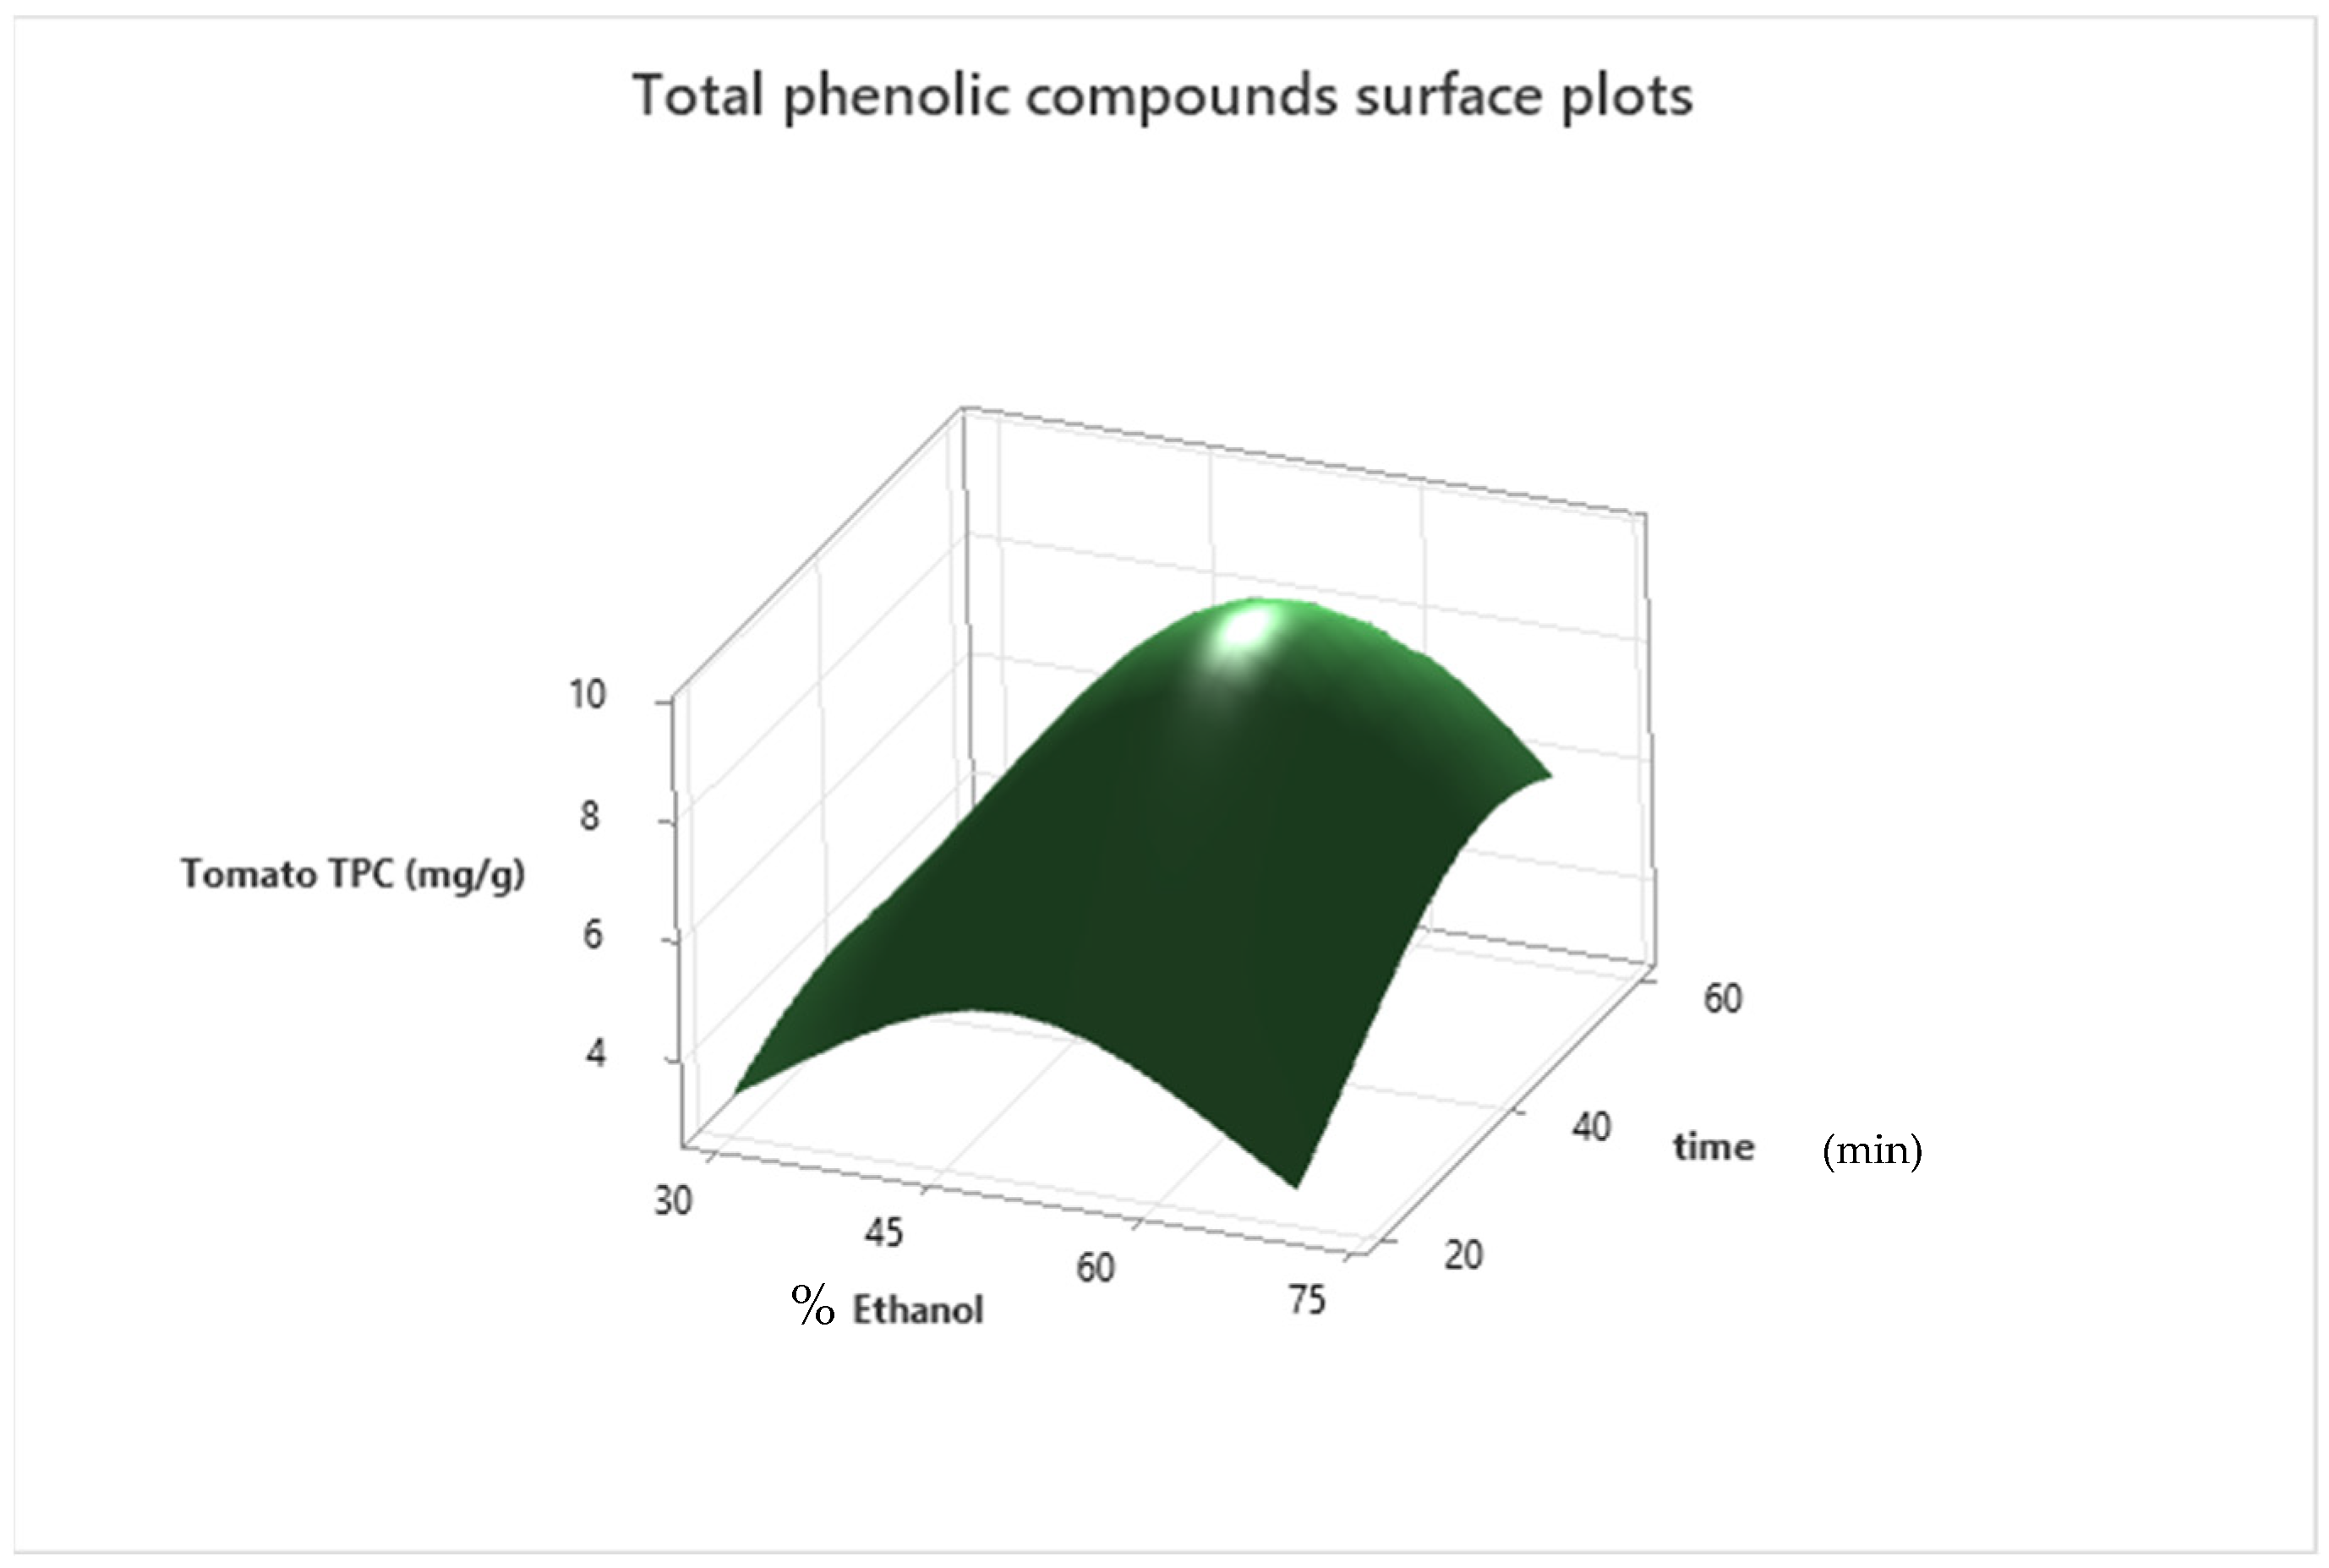
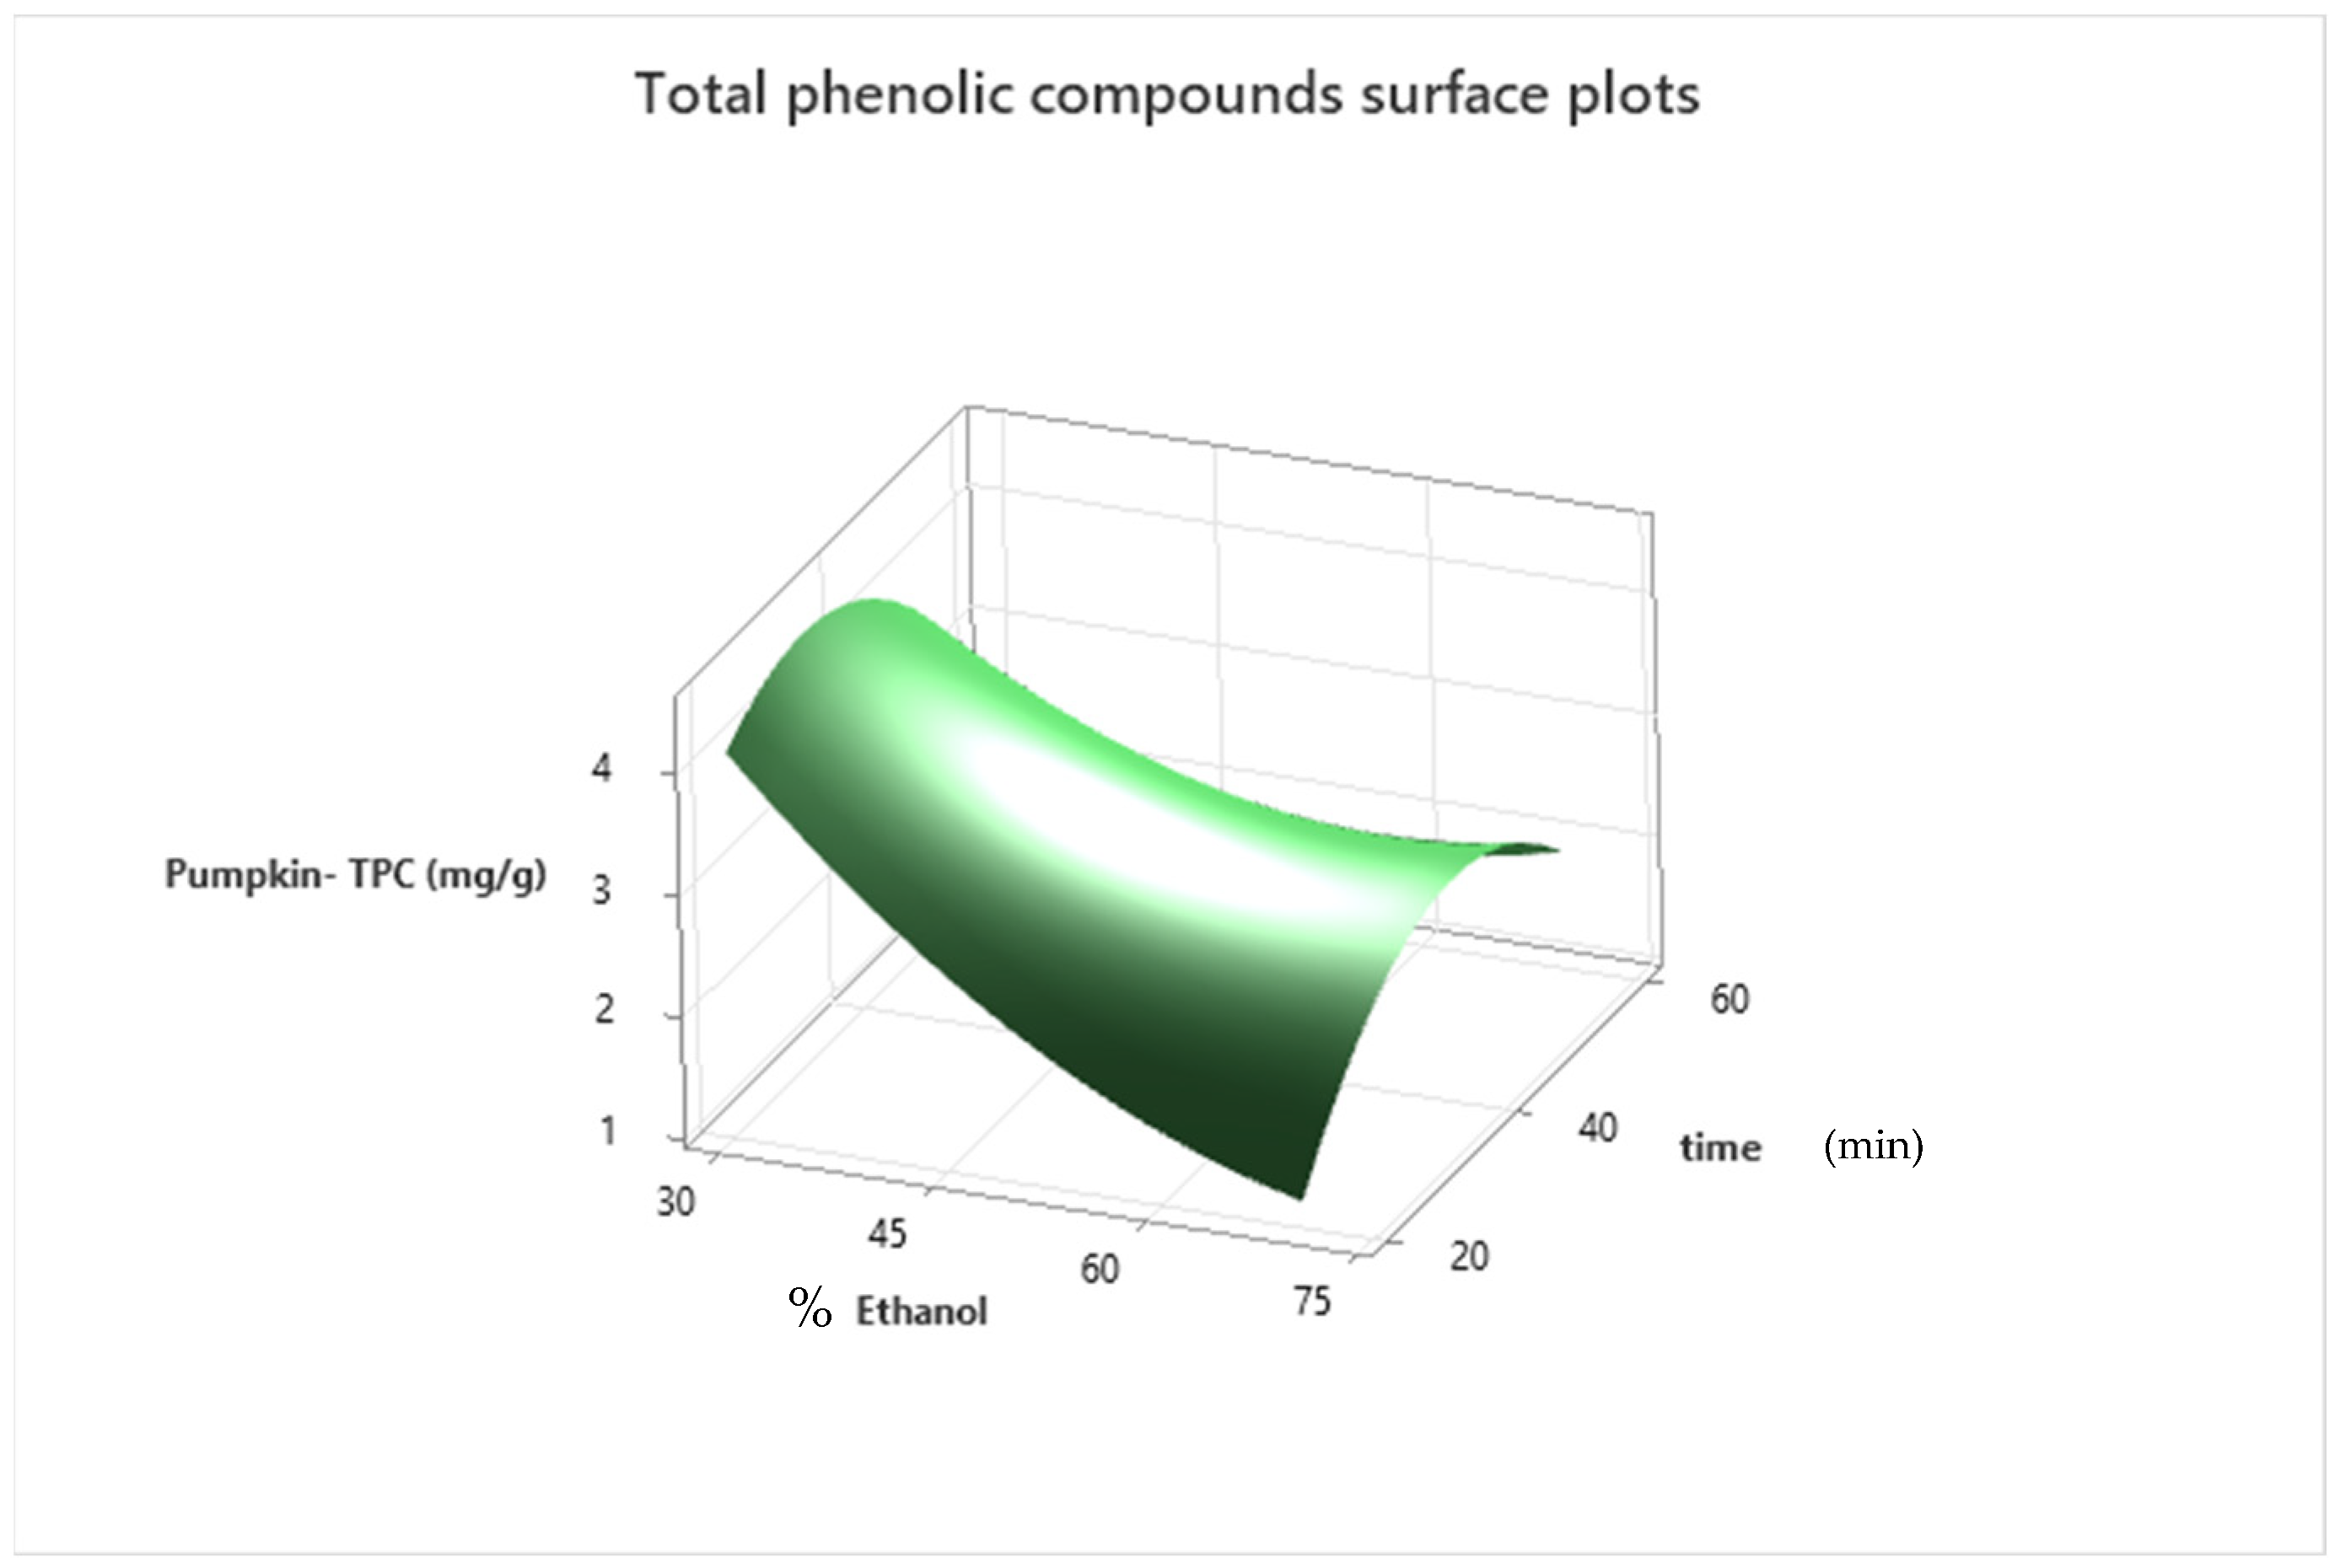
3.1. Model Fitting
3.2. Extraction Optimization and Model Validation
3.3. Determination of Antioxidant Capacity and Total Phenolics
3.4. Encapsulation Efficiency and Yield Evaluation
3.5. Stability Evaluation for the Extracts
3.6. Enriched Products Evaluation
4. Discussion
5. Conclusions
Author Contributions
Funding
Institutional Review Board Statement
Informed Consent Statement
Data Availability Statement
Conflicts of Interest
References
- Ali, M.Y.; Sina, A.A.I.; Khandker, S.S.; Neesa, L.; Tanvir, E.M.; Kabir, A.; Khalil, M.I.; Gan, S.H. Nutritional Composition and Bioactive Compounds in Tomatoes and Their Impact on Human Health and Disease: A Review. Foods 2021, 10, 45. [Google Scholar] [CrossRef] [PubMed]
- Kulczyński, B.; Sidor, A.; Gramza-Michałowska, A. Antioxidant Potential of Phytochemicals in Pumpkin Varieties Belonging to Cucurbita moschata and Cucurbita pepo Species. CYTA—J. Food 2020, 18, 472–484. [Google Scholar] [CrossRef]
- Mikulec, A.; Kowalski, S.; Makarewicz, M.; Skoczylas, Ł.; Tabaszewska, M. Cistus Extract as a Valuable Component for Enriching Wheat Bread. LWT 2020, 118, 108713. [Google Scholar] [CrossRef]
- Kalpoutzakis, E.; Chatzimitakos, T.; Athanasiadis, V.; Mitakou, S.; Aligiannis, N.; Bozinou, E.; Gortzi, O.; Skaltsounis, L.A.; Lalas, S.I. Determination of the Total Phenolics Content and Antioxidant Activity of Extracts from Parts of Plants from the Greek Island of Crete. Plants 2023, 12, 1092. [Google Scholar] [CrossRef] [PubMed]
- Aguilera, Y.; Martin-Cabrejas, M.A.; González de Mejia, E. Phenolic Compounds in Fruits and Beverages Consumed as Part of the Mediterranean Diet: Their Role in Prevention of Chronic Diseases. Phytochem. Rev. 2016, 15, 405–423. [Google Scholar] [CrossRef]
- Tanambell, H.; Bishop, K.S.; Quek, S.Y. Tangerine Tomatoes: Origin, Biochemistry, Potential Health Benefits and Future Prospects. Crit. Rev. Food Sci. Nutr. 2021, 61, 2237–2248. [Google Scholar] [CrossRef] [PubMed]
- Men, X.; Choi, S.I.; Han, X.; Kwon, H.Y.; Jang, G.W.; Choi, Y.E.; Park, S.M.; Lee, O.H. Physicochemical, Nutritional and Functional Properties of Cucurbita moschata. Food Sci. Biotechnol. 2021, 30, 171–183. [Google Scholar] [CrossRef] [PubMed]
- Ranveer, R.C.; Gatade, A.A.; Kamble, H.A.; Sahoo, A.K. Microencapsulation and Storage Stability of Lycopene Extracted from Tomato Processing Waste. Braz. Arch. Biol. Technol. 2015, 58, 953–960. [Google Scholar] [CrossRef]
- Fang, Z.; Bhandari, B. Encapsulation of Polyphenols—A Review. Trends Food Sci. Technol. 2010, 21, 510–523. [Google Scholar] [CrossRef]
- Andres, A.I.; Petron, M.J.; Lopez, A.M.; Timon, M.L. Optimization of Extraction Conditions to Improve Phenolic Content and In Vitro Antioxidant Activity in Craft Brewers’ Spent Grain Using Response Surface Methodology (Rsm). Foods 2020, 9, 1398. [Google Scholar] [CrossRef]
- Naczk, M.; Shahidi, F. Extraction and Analysis of Phenolics in Food. J. Chromatogr. A 2004, 1054, 95–111. [Google Scholar] [CrossRef] [PubMed]
- Pashazadeh, H.; Zannou, O.; Ghellam, M.; Koca, I.; Galanakis, C.M.; Aldawoud, T.M.S. Optimization and Encapsulation of Phenolic Compounds Extracted from Maize Waste by Freeze-Drying, Spray-Drying, and Microwave-Drying Using Maltodextrin. Foods 2021, 10, 1396. [Google Scholar] [CrossRef]
- Ballesteros, L.F.; Ramirez, M.J.; Orrego, C.E.; Teixeira, J.A.; Mussatto, S.I. Encapsulation of Antioxidant Phenolic Compounds Extracted from Spent Coffee Grounds by Freeze-Drying and Spray-Drying Using Different Coating Materials. Food Chem. 2017, 237, 623–631. [Google Scholar] [CrossRef] [PubMed]
- Moreno, T.; Cocero, M.J.; Rodríguez-Rojo, S. Storage Stability and Simulated Gastrointestinal Release of Spray Dried Grape Marc Phenolics. Food Bioprod. Process. 2018, 112, 96–107. [Google Scholar] [CrossRef]
- Laureanti, E.J.G.; Paiva, T.S.; Jorge, L.M.M.; Jorge, R.M.M. Microencapsulation of bioactive compound extracts using maltodextrin and gum arabic by spray and freeze-drying techniques. Int. J. Biol. Macromol. 2023, 253, 126969. [Google Scholar] [CrossRef] [PubMed]
- Izadiyan, P.; Hemmateenejad, B. Multi-Response Optimization of Factors Affecting Ultrasonic Assisted Extraction from Iranian Basil Using Central Composite Design. Food Chem. 2016, 190, 864–870. [Google Scholar] [CrossRef] [PubMed]
- Viacava, G.E.; Roura, S.I.; Agüero, M.V. Optimization of Critical Parameters during Antioxidants Extraction from Butterhead Lettuce to Simultaneously Enhance Polyphenols and Antioxidant Activity. Chemom. Intell. Lab. Syst. 2015, 146, 47–54. [Google Scholar] [CrossRef]
- Miller, N.J.; Rice-Evans, C.; Davies, M.J.; Gopinathan, V.; Milner, A. A Novel Method for Measuring Antioxidant Capacity and Its Application to Monitoring the Antioxidant Status in Premature Neonates. Clin. Sci. 1993, 84, 407–412. [Google Scholar] [CrossRef] [PubMed]
- Brand-Williams, W.; Cuvelier, M.E.; Berset, C. Use of a Free Radical Method to Evaluate Antioxidant Activity. LWT—Food Sci. Technol. 1995, 28, 25–30. [Google Scholar] [CrossRef]
- Benzie, I.F.F.; Strain, J.J. The Ferric Reducing Ability of Plasma (FRAP) as a Measure of “Antioxidant Power”: The FRAP Assay. Anal. Biochem. 1996, 239, 70–76. [Google Scholar] [CrossRef]
- Özyürek, M.; Güçlü, K.; Apak, R. The Main and Modified CUPRAC Methods of Antioxidant Measurement. TrAC—Trends Anal. Chem. 2011, 30, 652–664. [Google Scholar] [CrossRef]
- Singleton, V.L.; Orthofer, R.; Lamuela-Raventos, R.M. Analysis of Total Phenols and Other Oxidation Substrates and Antioxidants by Means of Folin-Ciocalteu Reagent. In Methods in Enzymology; Academic press: Cambridge, MA, USA, 1999; Volume 299, pp. 152–178. [Google Scholar] [CrossRef]
- Palamutoğlu, R.; Kasnak, C.; Özen, B. Encapsulation of Black Cumin Seed (Nigella sativa) Oil by Using Inverse Gelation Method. Food Hydrocoll. Health 2022, 2, 100089. [Google Scholar] [CrossRef]
- Mahindrakar, K.V.; Rathod, V.K. Ultrasonic Assisted Aqueous Extraction of Catechin and Gallic Acid from Syzygium Cumini Seed Kernel and Evaluation of Total Phenolic, Flavonoid Contents and Antioxidant Activity. Chem. Eng. Process.-Process Intensif. 2020, 149, 107841. [Google Scholar] [CrossRef]
- Gharsallaoui, A.; Roudaut, G.; Chambin, O.; Voilley, A.; Saurel, R. Applications of Spray-Drying in Microencapsulation of Food Ingredients: An Overview. Food Res. Int. 2007, 40, 1107–1121. [Google Scholar] [CrossRef]
- Çam, M.; Içyer, N.C.; Erdoǧan, F. Pomegranate Peel Phenolics: Microencapsulation, Storage Stability and Potential Ingredient for Functional Food Development. LWT 2014, 55, 117–123. [Google Scholar] [CrossRef]
- Negrão-Murakami, A.N.; Nunes, G.L.; Pinto, S.S.; Murakami, F.S.; Amante, E.R.; Petrus, J.C.C.; Prudêncio, E.S.; Amboni, R.D.M.C. Influence of DE-Value of Maltodextrin on the Physicochemical Properties, Antioxidant Activity, and Storage Stability of Spray Dried Concentrated Mate (Ilex paraguariensis A. St. Hil.). LWT 2017, 79, 561–567. [Google Scholar] [CrossRef]
- Laine, P.; Kylli, P.; Heinonen, M.; Jouppila, K. Storage Stability of Microencapsulated Cloudberry (Rubus chamaemorus) Phenolics. J. Agric. Food Chem. 2008, 56, 11251–11261. [Google Scholar] [CrossRef] [PubMed]
- Tsali, A.; Goula, A.M. Valorization of Grape Pomace: Encapsulation and Storage Stability of Its Phenolic Extract. Powder Technol. 2018, 340, 194–207. [Google Scholar] [CrossRef]
- Zorić, Z.; Pelaić, Z.; Pedisić, S.; Elez Garofulić, I.; Bursać Kovačević, D.; Dragović–Uzelac, V. Effect of Storage Conditions on Phenolic Content and Antioxidant Capacity of Spray Dried Sour Cherry Powder. LWT 2017, 79, 251–259. [Google Scholar] [CrossRef]
- Ruan, J.-H.; Li, J.; Adili, G.; Sun, G.-Y.; Abuduaini, M.; Abdulla, R.; Maiwulanjiang, M.; Akber Aisa, H. Phenolic Compounds and Bioactivities from Pomegranate (Punica granatum L.) Peels. J. Agric. Food Chem. 2022, 70, 3678–3686. [Google Scholar] [CrossRef]
- Rocchetti, G.; Gregorio, R.P.; Lorenzo, J.M.; Barba, F.J.; Oliveira, P.G.; Prieto, M.A.; Simal-Gandara, J.; Mosele, J.I.; Motilva, M.J.; Tomas, M.; et al. Functional Implications of Bound Phenolic Compounds and Phenolics–Food Interaction: A Review. Compr. Rev. Food Sci. Food Saf. 2022, 21, 811–842. [Google Scholar] [CrossRef] [PubMed]
- Kim, D.-O.; Lee, K.W.; Lee, H.J.; Lee, C.Y. Vitamin C Equivalent Antioxidant Capacity (VCEAC) of Phenolic Phytochemicals. J. Agric. Food Chem. 2002, 50, 3713–3717. [Google Scholar] [CrossRef] [PubMed]
- Nour, V.; Ionica, M.E. Antioxidant Compounds, Mineral Content and Antioxidant Activity of Several Tomato Cultivars Grown in Southwestern Romania. Not. Bot. Horti Agrobot. 2013, 41, 136–142. [Google Scholar] [CrossRef]
- Toor, R.K.; Savage, G.P. Antioxidant Activity in Different Fractions of Tomatoes. Food Res. Int. 2005, 38, 487–494. [Google Scholar] [CrossRef]
- Priori, D.; Valduga, E.; Villela, J.C.B.; Mistura, C.C.; Vizzotto, M.; Valgas, R.A.; Barbieri, R.L. Characterization of Bioactive Compounds, Antioxidant Activity and Minerals in Landraces of Pumpkin (Cucurbita moschata) Cultivated in Southern Brazil. Food Sci. Technol. 2017, 37, 33–40. [Google Scholar] [CrossRef]
- Mokhtar, M.; Bouamar, S.; Di Lorenzo, A.; Temporini, C.; Daglia, M.; Riazi, A. The Influence of Ripeness on the Phenolic Content, Antioxidant and Antimicrobial Activities of Pumpkins (Cucurbita moschata Duchesne). Molecules 2021, 26, 3623. [Google Scholar] [CrossRef] [PubMed]
- Lau, K.Q.; Sabran, M.R.; Shafie, S.R. Utilization of Vegetable and Fruit By-Products as Functional Ingredient and Food. Front. Nutr. 2021, 8, 661693. [Google Scholar] [CrossRef]
- Fernandes, A.S.; Ferreira-Pêgo, C.; Costa, J.G. Functional Foods for Health: The Antioxidant and Anti-Inflammatory Role of Fruits, Vegetables and Culinary Herbs. Foods 2023, 12, 2742. [Google Scholar] [CrossRef]


| Factor Levels and Range | ||||
|---|---|---|---|---|
| Factors | Codes | −1 | 0 | 1 |
| Time (min) | X2 | 20 | 40 | 60 |
| Ethanol (%, v/v) | X1 | 30 | 50 | 70 |
| Ingredients | Quantity in Grams |
|---|---|
| Bread flour | 112.0 |
| Sugar | 2.00 |
| Olive oil | 5.40 |
| Fast action yeast | 0.60 |
| Sea salt | 1.70 |
| Water | 50.0 |
| Ingredients | Quantity in Grams |
|---|---|
| Oat flakes | 82.0 |
| Sugar | 0.50 |
| Olive oil | 10.8 |
| Fast action yeast | 0.60 |
| Sea salt | 1.70 |
| Water | 36.6 |
| Run | Independent Factors | Response TPC (mg/g) 1 | ||
|---|---|---|---|---|
| X1 Ethanol (% v/v) | X2 Time (min) | Tomato Extract | Pumpkin Extract | |
| 1 | 50 (0) | 40 (0) | 9.91 | 2.79 |
| 2 | 30 (−1) | 20 (−1) | 3.12 | 3.98 |
| 3 | 50 (0) | 20 (−1) | 5.56 | 2.45 |
| 4 | 50 (0) | 40 (0) | 8.91 | 3.15 |
| 5 | 30 (−1) | 40 (0) | 4.21 | 4.35 |
| 6 | 50 (0) | 40 (0) | 9.25 | 3.04 |
| 7 | 70 (+1) | 20 (−1) | 3.24 | 0.98 |
| 8 | 70 (+1) | 40 (0) | 5.12 | 2.69 |
| 9 | 50 (0) | 60 (+1) | 6.76 | 1.68 |
| 10 | 70 (+1) | 60 (+1) | 6.25 | 1.89 |
| 11 | 50 (0) | 40 (0) | 8.56 | 2.56 |
| 12 | 30 (−1) | 60 (+1) | 2.95 | 2.55 |
| 13 | 50 (0) | 40 (0) | 8.94 | 2.88 |
| Tomato | Pumpkin | ||||
|---|---|---|---|---|---|
| Source | DF | F-Value | p-Value | F-Value | p-Value |
| 1 Model | 5 | 92.71 | 0.000 | 32.61 | 0.000 |
| Linear | 2 | 151.38 | 0.000 | 45.62 | 0.000 |
| Ethanol | 1 | 251.73 | 0.000 | 34.14 | 0.001 |
| time | 1 | 25.61 | 0.001 | 67.90 | 0.000 |
| Square | 2 | 185.50 | 0.000 | 24.44 | 0.001 |
| Ethanol × Ethanol | 1 | 187.21 | 0.000 | 10.78 | 0.013 |
| time × time | 1 | 53.62 | 0.000 | 48.41 | 0.000 |
| 2-Way Interaction | 1 | 30.98 | 0.001 | 24.56 | 0.002 |
| Ethanol × time | 1 | 30.98 | 0.001 | 24.56 | 0.002 |
| Error | 7 | ||||
| Lack-of-Fit | 3 | 5.48 | 0.067 | 1.16 | 0.429 |
| Pure Error | 4 | ||||
| Total | 12 | ||||
| TPC | 1 Predictive Equations | R2 | R2 Adjusted | |
|---|---|---|---|---|
| Tomato | −Y−0.5 = −1.3419 + 0.02943 ethanol + 0.00969 time − 0.000317 ethanol × ethanol − 0.000170 time × time + 0.000107 ethanol × time | (4) | 98.51% | 97.45% |
| Pumpkin | Y = 7.47 − 0.2195 ethanol + 0.1138 time + 0.001166 ethanol × ethanol − 0.002471 time × time + 0.001463 ethanol × time | (5) | 95.88% | 92.94% |
| Independent Factor 1 TPC (mg/g DM) | Predicted Values 1 | Experimental Values | Desirability |
|---|---|---|---|
| Tomato | 9.46 | 9.47 ± 0.08 a | 0.9300 |
| Pumpkin | 4.44 | 4.52 ± 0.05 a | 1.0000 |
| 1 Parameters | Tomato Optimized Extract | Pumpkin Optimized Extract |
|---|---|---|
| DPPH (μmol TE/g) | 7.65 ± 0.08 a | 5.78± 0.05 b |
| ABTS (μmol TE/g) | 9.27 ± 0.02 a | 3.95 ± 0.04 b |
| FRAP (μmol TE/g) | 5.25 ± 0.09 a | 2.99 ± 0.03 b |
| CUPRAC (μmol TE/g) | 2.3 ± 0.04 a | 1.25 ± 0.05 b |
| TPC (mg GAE/g) | 9.47 ± 0.08 a | 4.52 ± 0.05 b |
| Core–Coating Ratio (w/w) | Tomato Encapsulated Extract % Yield of Total Phenolics |
|---|---|
| 1:10 | 72.5 ± 1.0 a |
| 1:15 | 63.5 ± 0.3 b |
| 1:20 | 62.2 ± 0.4 c |
| 1:25 | 67.9 ± 0.7 d |
| 1:30 | 89.2 ± 0.7 e |
| Days | Extract Stability Testing at 25 °C (%Content)/±SD | Stability Testing at 65 °C (%Content)/±SD | ||
|---|---|---|---|---|
| Crude | Encapsulated | Crude | Encapsulated | |
| 0 | 100.0 ± 0.4 a | 100.0 ± 1.1 a | 100.0 ± 0.4 a | 100.0 ± 1.1 a |
| 3 | 90.2 ± 1.1 b | 97.1 ± 0.5 c | 77.9 ± 0.5 d | 98.1 ± 1.2 c |
| 6 | 77.2 ± 1.0 e | 96.2 ± 0.4 c | 65.9 ± 0.9 f | 92.8 ± 1.5 g |
| 9 | 59.2 ± 0.7 h | 93.1 ± 1.2 i | 52.8 ± 0.8 j | 89.1 ± 1.5 k |
| 12 | 49.2 ± 0.9 l | 89.8 ± 0.8 m | 39.9 ± 1.1 n | 77.4 ± 0.5 o |
| Days | Extract Stability Testing at 25 °C (%Content)/±SD | Stability Testing at 65 °C (%Content)/±SD | ||
|---|---|---|---|---|
| Crude | Encapsulated | Crude | Encapsulated | |
| 0 | 100.0 ± 0.8 a | 100.0 ± 0.9 a | 100.0 ± 0.8 a | 100.0 ± 0.9 a |
| 3 | 82.2 ± 0.7 b | 99.1 ± 1.2 a | 79.5 ± 1.1 b | 95.4 ± 0.4 a |
| 6 | 78.7 ± 0.6 c | 92.3 ± 1.7 b | 61.1 ± 1.7 c | 87.8 ± 1.5 b |
| 9 | 61.1 ± 0.9 d | 88.4 ± 1.1 b | 45.2 ± 1.3 d | 81.7 ± 1.0 c |
| 12 | 49.4 ± 0.8 e | 79.9 ± 0.8 c | 38.1 ± 0.5 e | 71.8 ± 1.4 d |
| Test | Tomato Cereal Bars | Pumpkin Biscuits | ||||
|---|---|---|---|---|---|---|
| Enriched | Control | %Increase | Enriched | Control | %Increase | |
| Total phenolic content | 1.51 ± 0.03 a | 1.20 ± 0.01 b | 25.8 | 1.72 ± 0.02 a | 1.67 ± 0.03 a | 3.0 |
| DPPH | 3.67 ± 0.04 a | 2.65 ± 0.03 b | 38.5 | 3.37 ± 0.02 a | 2.28 ± 0.04 b | 47.8 |
| ABTS | 11.63 ± 0.04 a | 9.68 ± 0.02 b | 20.2 | 9.55 ± 0.05 a | 8.70 ± 0.03 b | 9.7 |
| FRAP | 17.59 ± 0.05 a | 13.92 ± 0.06 b | 26.4 | 9.81 ± 0.06 a | 7.38 ± 0.04 b | 32.9 |
| CUPRAC | 19.35 ± 0.04 a | 13.79 ± 0.02 b | 40.3 | 11.75 ± 0.02 a | 11.32 ± 0.03 a | 3.8 |
Disclaimer/Publisher’s Note: The statements, opinions and data contained in all publications are solely those of the individual author(s) and contributor(s) and not of MDPI and/or the editor(s). MDPI and/or the editor(s) disclaim responsibility for any injury to people or property resulting from any ideas, methods, instructions or products referred to in the content. |
© 2024 by the authors. Licensee MDPI, Basel, Switzerland. This article is an open access article distributed under the terms and conditions of the Creative Commons Attribution (CC BY) license (https://creativecommons.org/licenses/by/4.0/).
Share and Cite
Michalaki, A.; Karantonis, H.C. Formulation and Stability Assessment of Bakery Snacks Enriched with Encapsulated Phenolic Compounds from Lemnian Tomatoes and Pumpkin (Cucurbita moschata). Appl. Sci. 2024, 14, 5724. https://doi.org/10.3390/app14135724
Michalaki A, Karantonis HC. Formulation and Stability Assessment of Bakery Snacks Enriched with Encapsulated Phenolic Compounds from Lemnian Tomatoes and Pumpkin (Cucurbita moschata). Applied Sciences. 2024; 14(13):5724. https://doi.org/10.3390/app14135724
Chicago/Turabian StyleMichalaki, Afroditi, and Haralabos C. Karantonis. 2024. "Formulation and Stability Assessment of Bakery Snacks Enriched with Encapsulated Phenolic Compounds from Lemnian Tomatoes and Pumpkin (Cucurbita moschata)" Applied Sciences 14, no. 13: 5724. https://doi.org/10.3390/app14135724
APA StyleMichalaki, A., & Karantonis, H. C. (2024). Formulation and Stability Assessment of Bakery Snacks Enriched with Encapsulated Phenolic Compounds from Lemnian Tomatoes and Pumpkin (Cucurbita moschata). Applied Sciences, 14(13), 5724. https://doi.org/10.3390/app14135724