
Study on the Tensile Failure Characteristics and Energy Calculation Model of Coal Seam Hard Roof Considering the Mining Speed


Abstract
:1. Introduction
2. Methods
2.1. Experimental Purpose
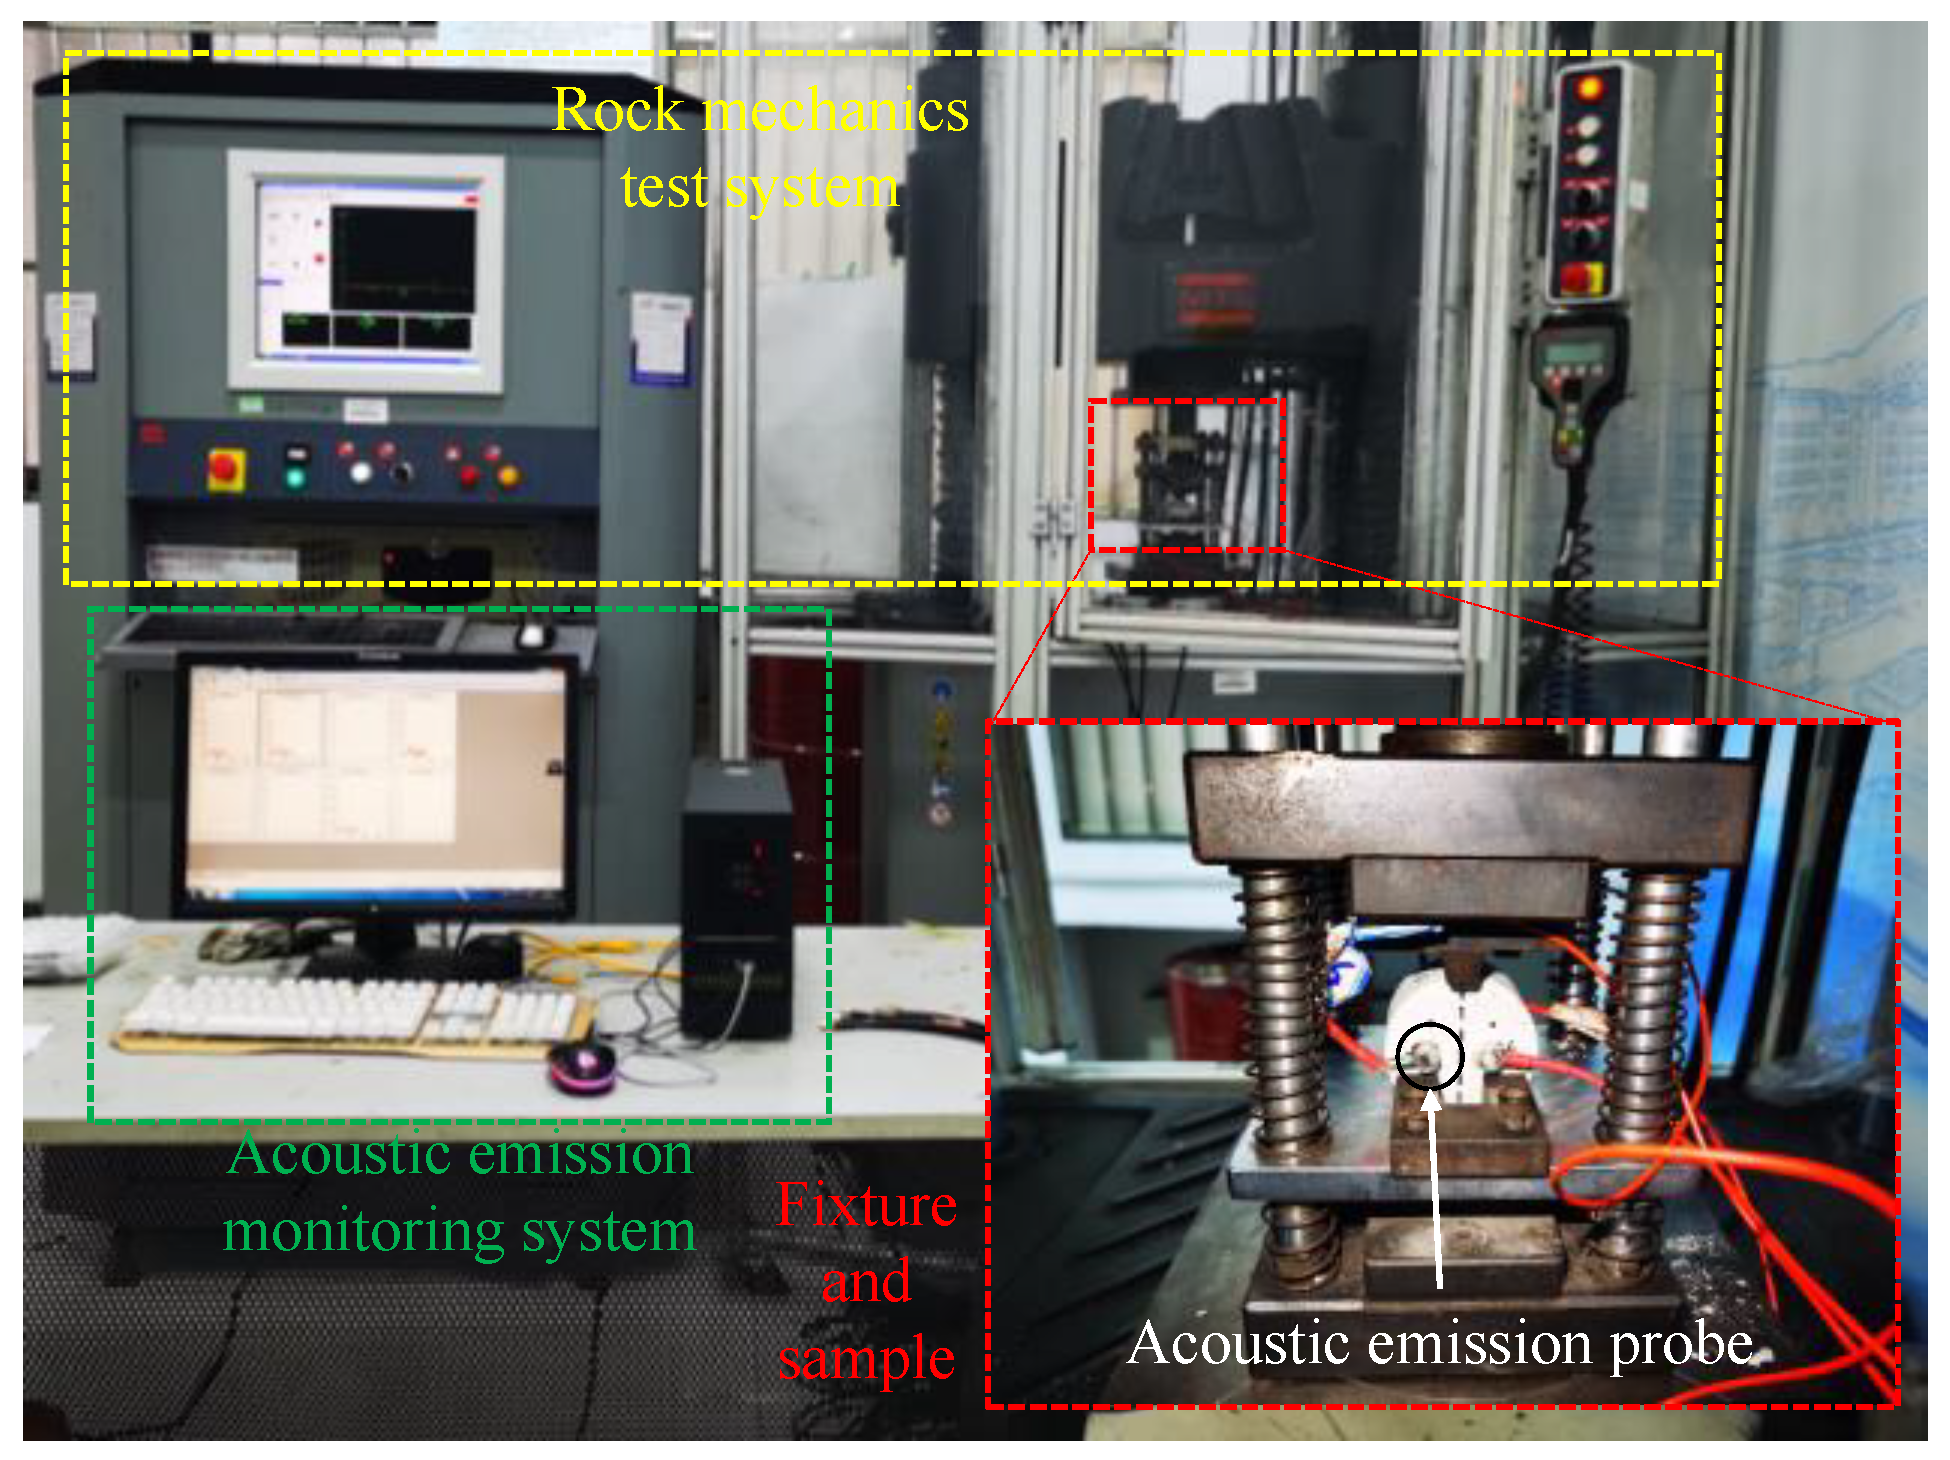
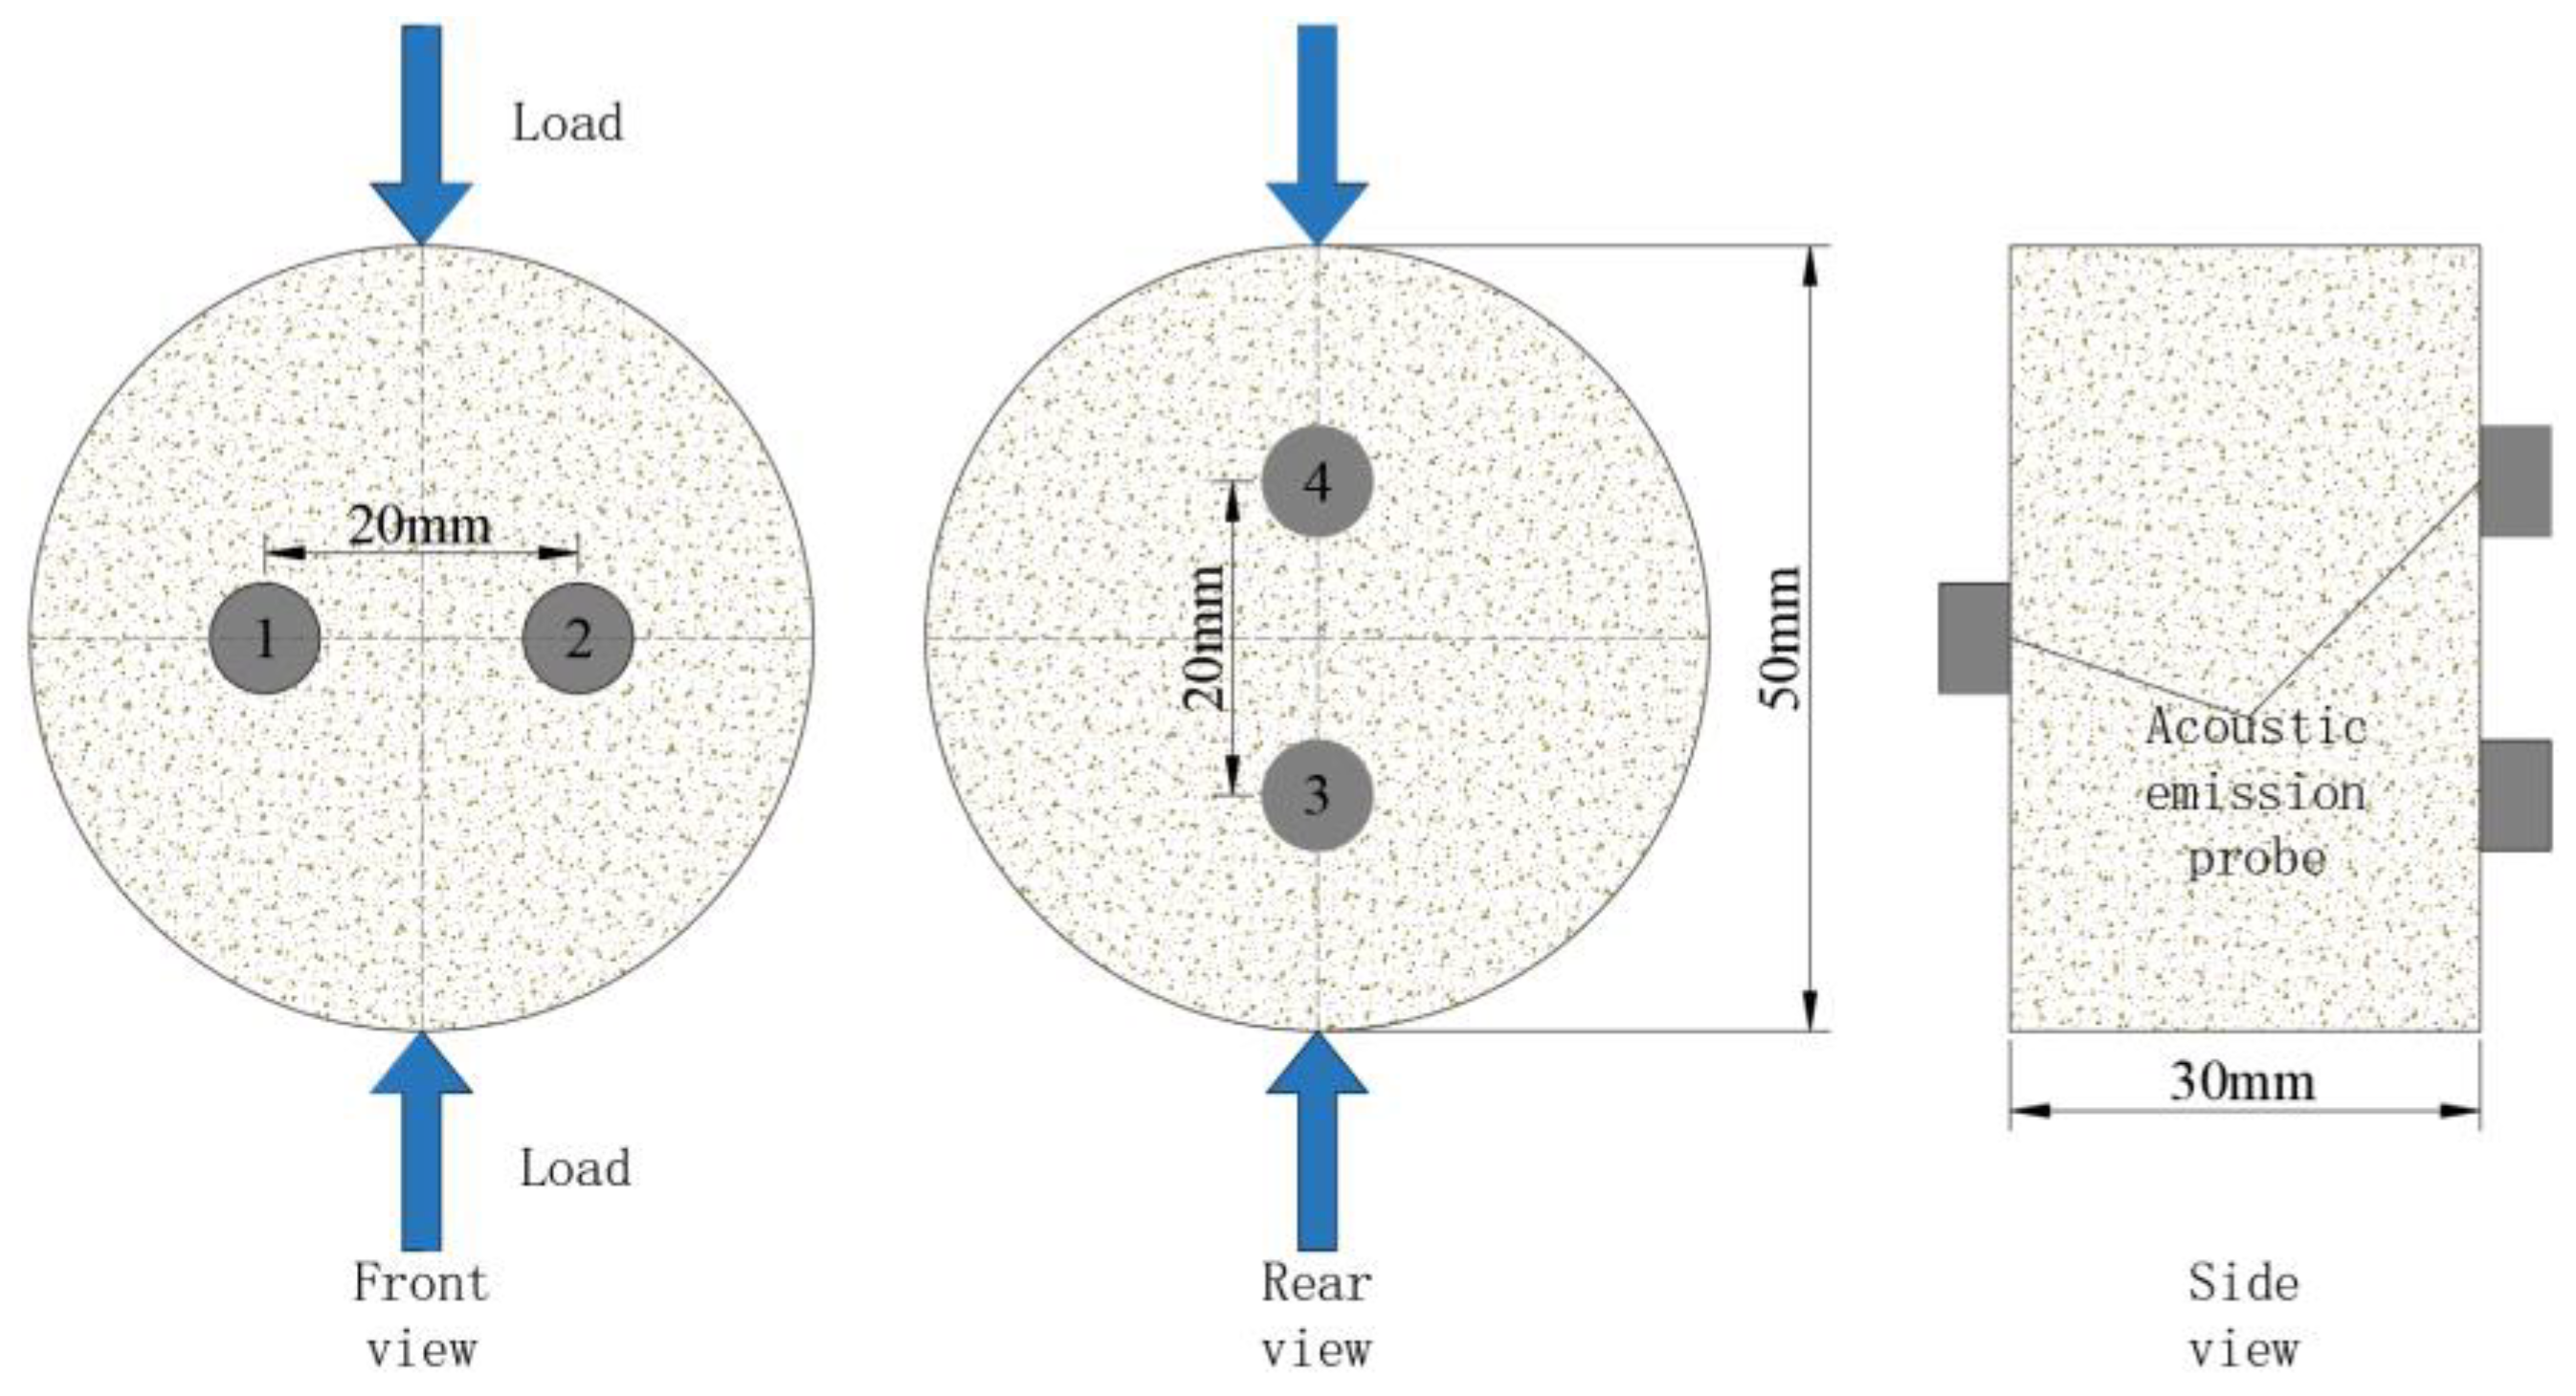
2.2. Experimental Design and Scheme
- (1)
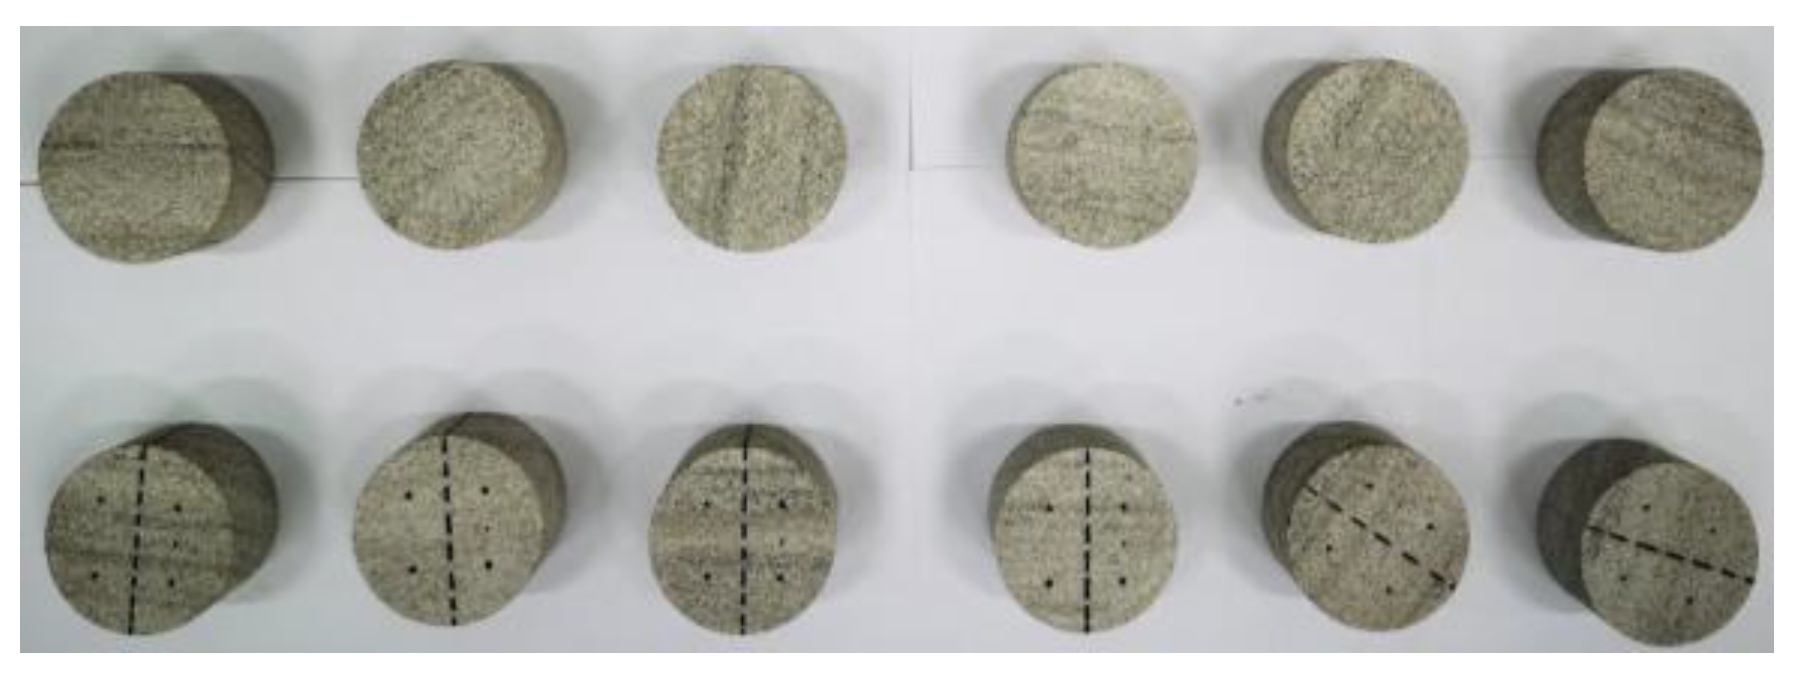
- Sample Acquisition
- (2)
- Experimental Scheme Design
3. Results
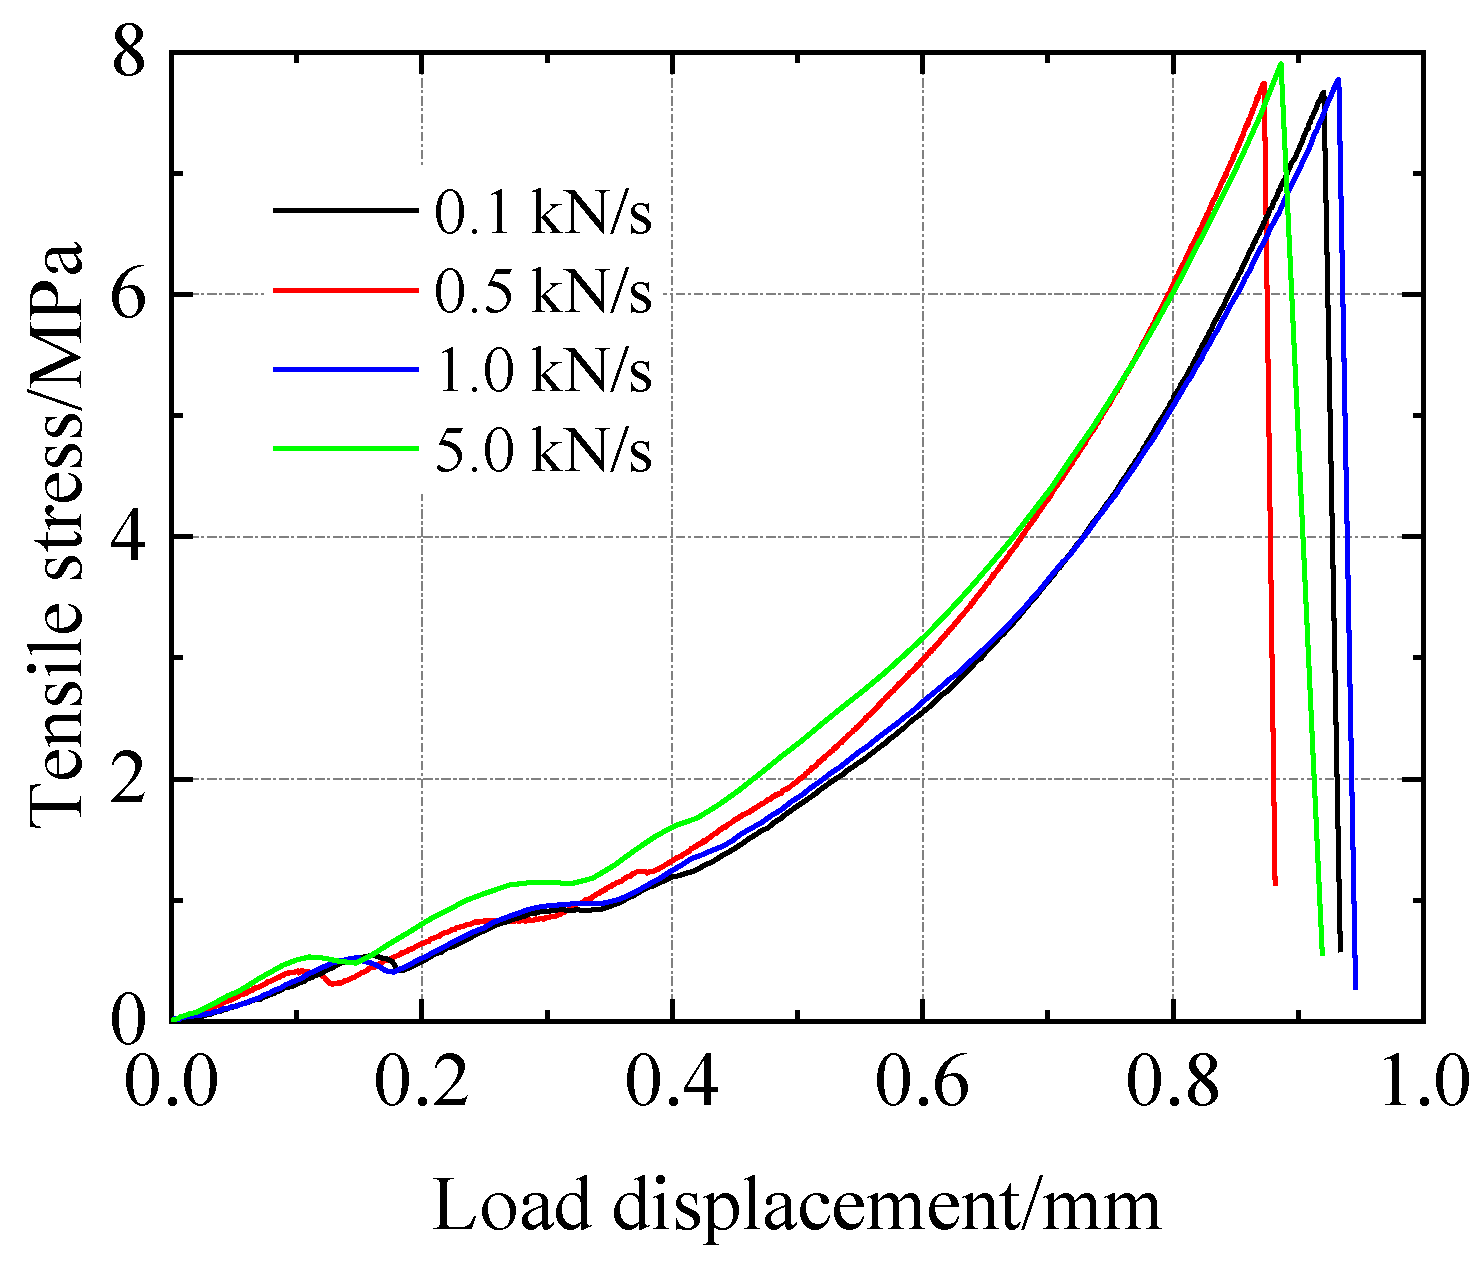
3.1. Mechanical Response Characteristics
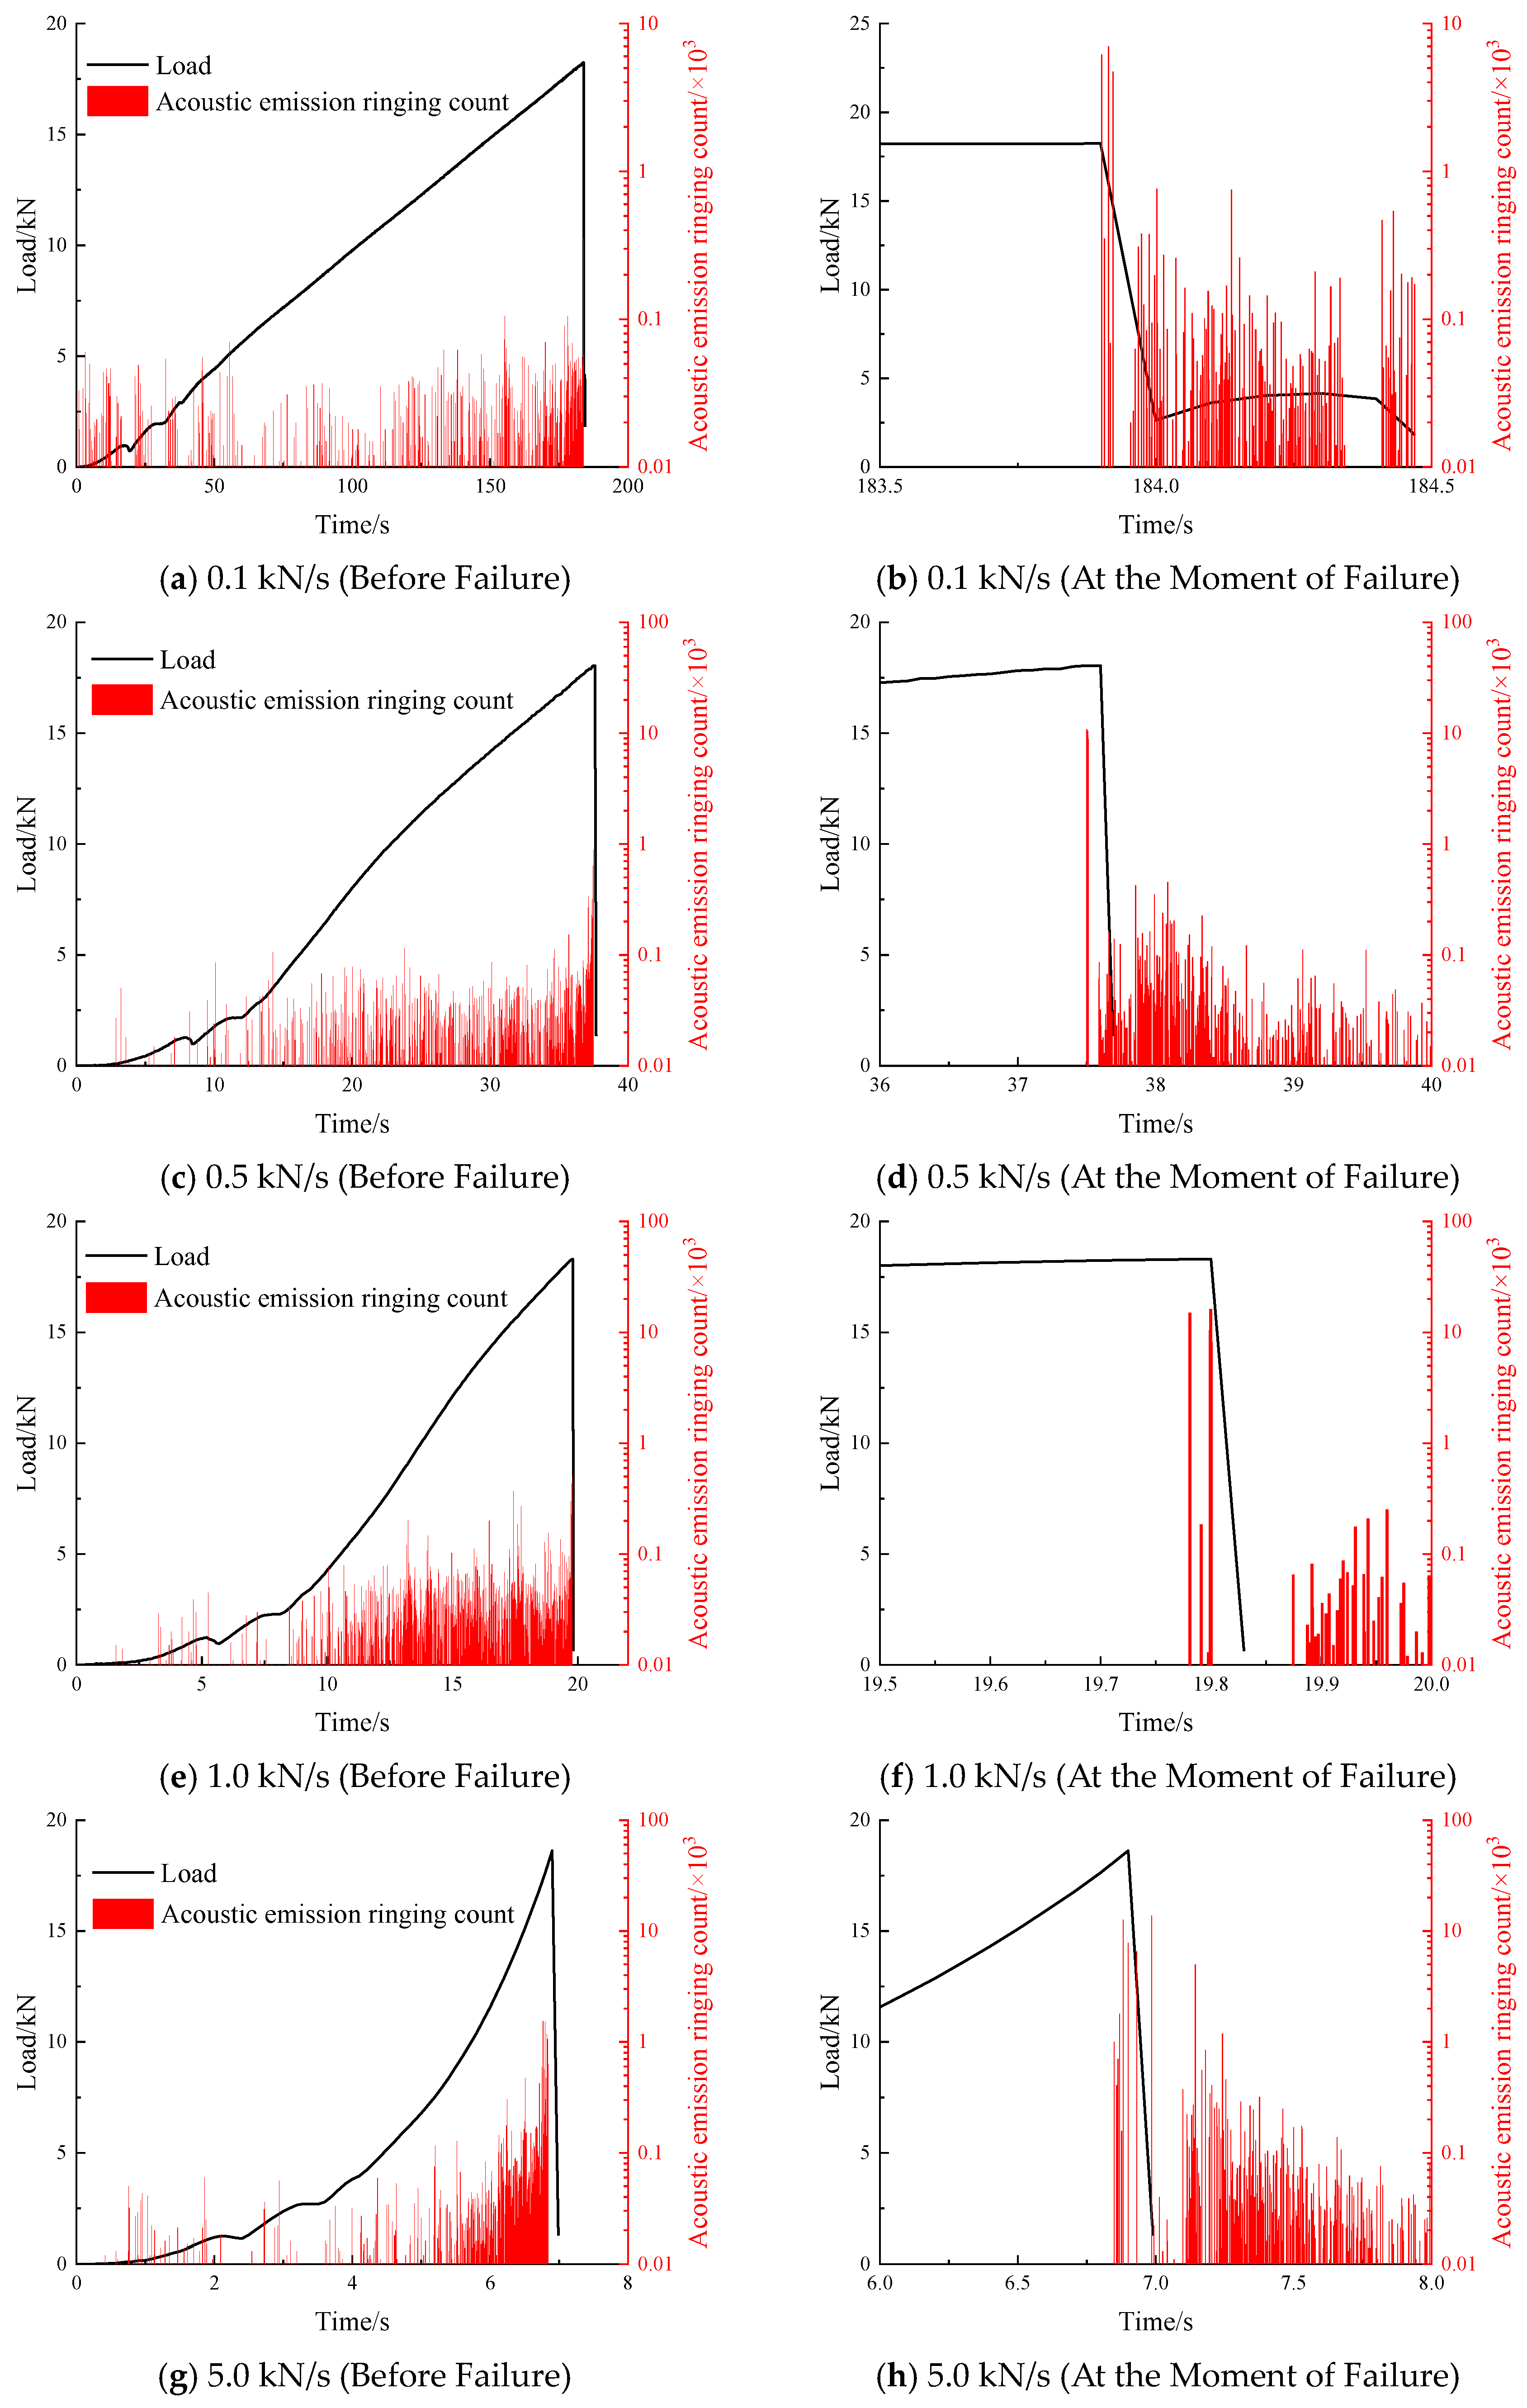
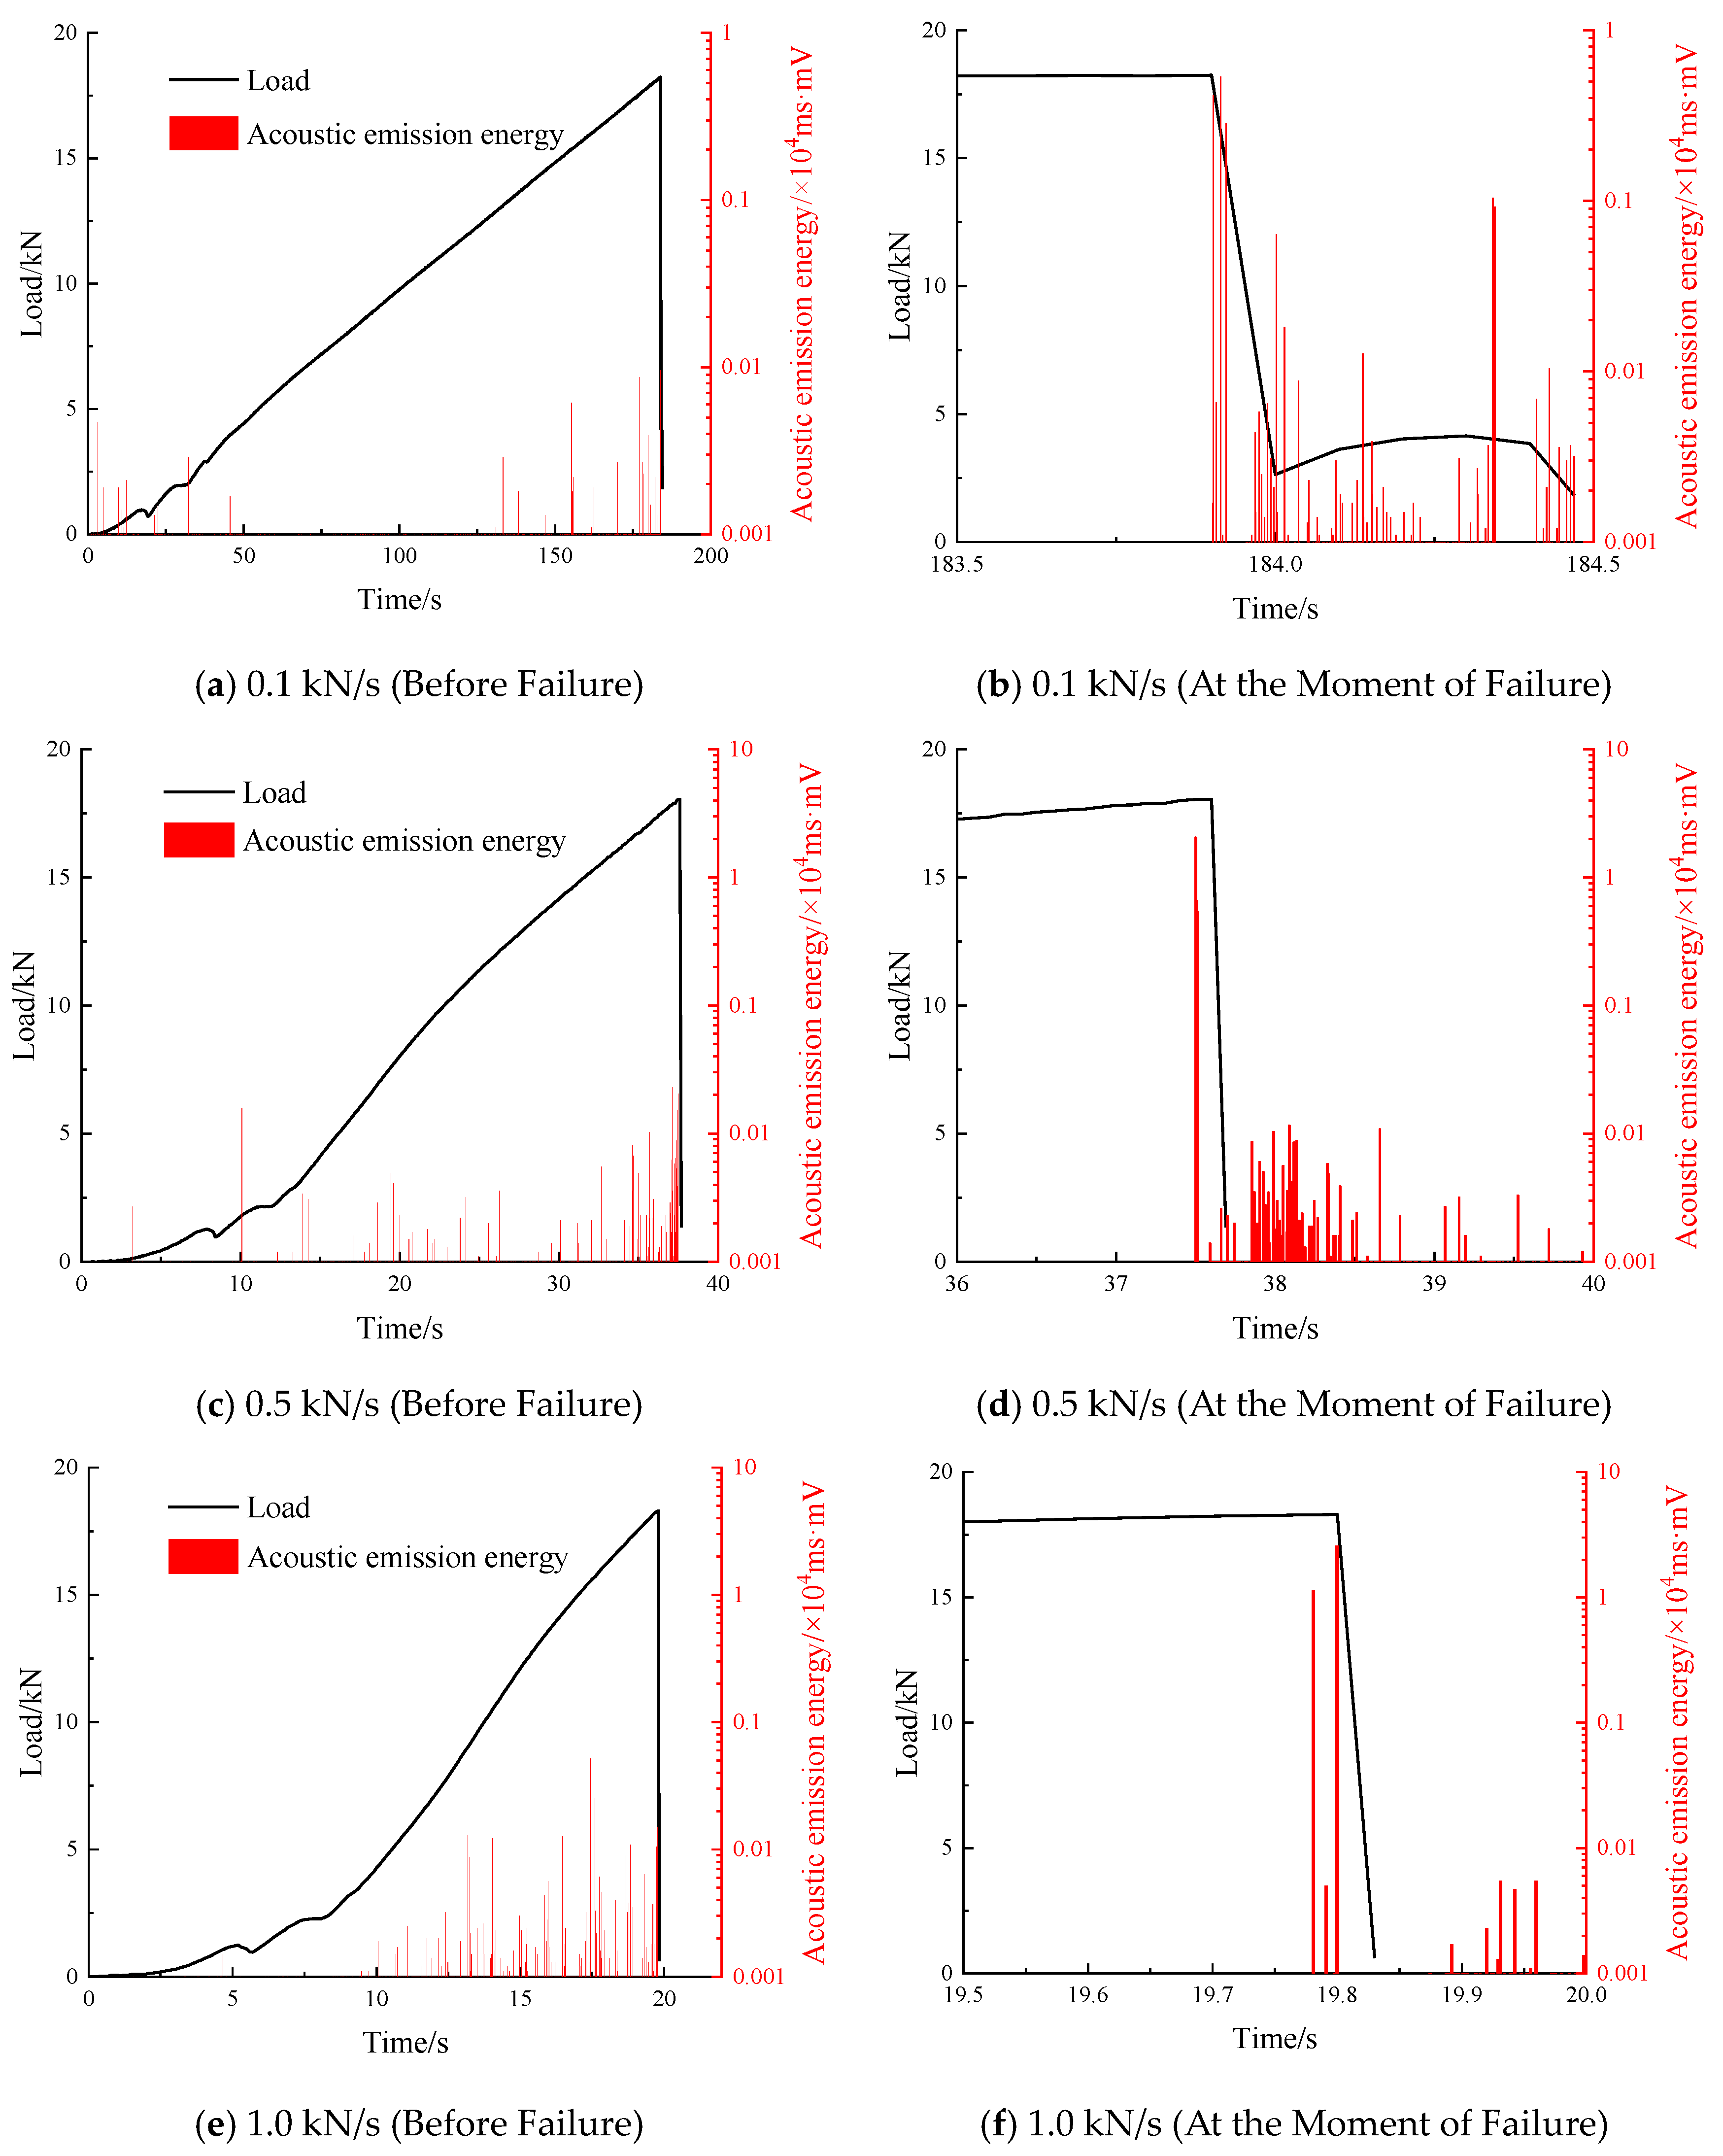
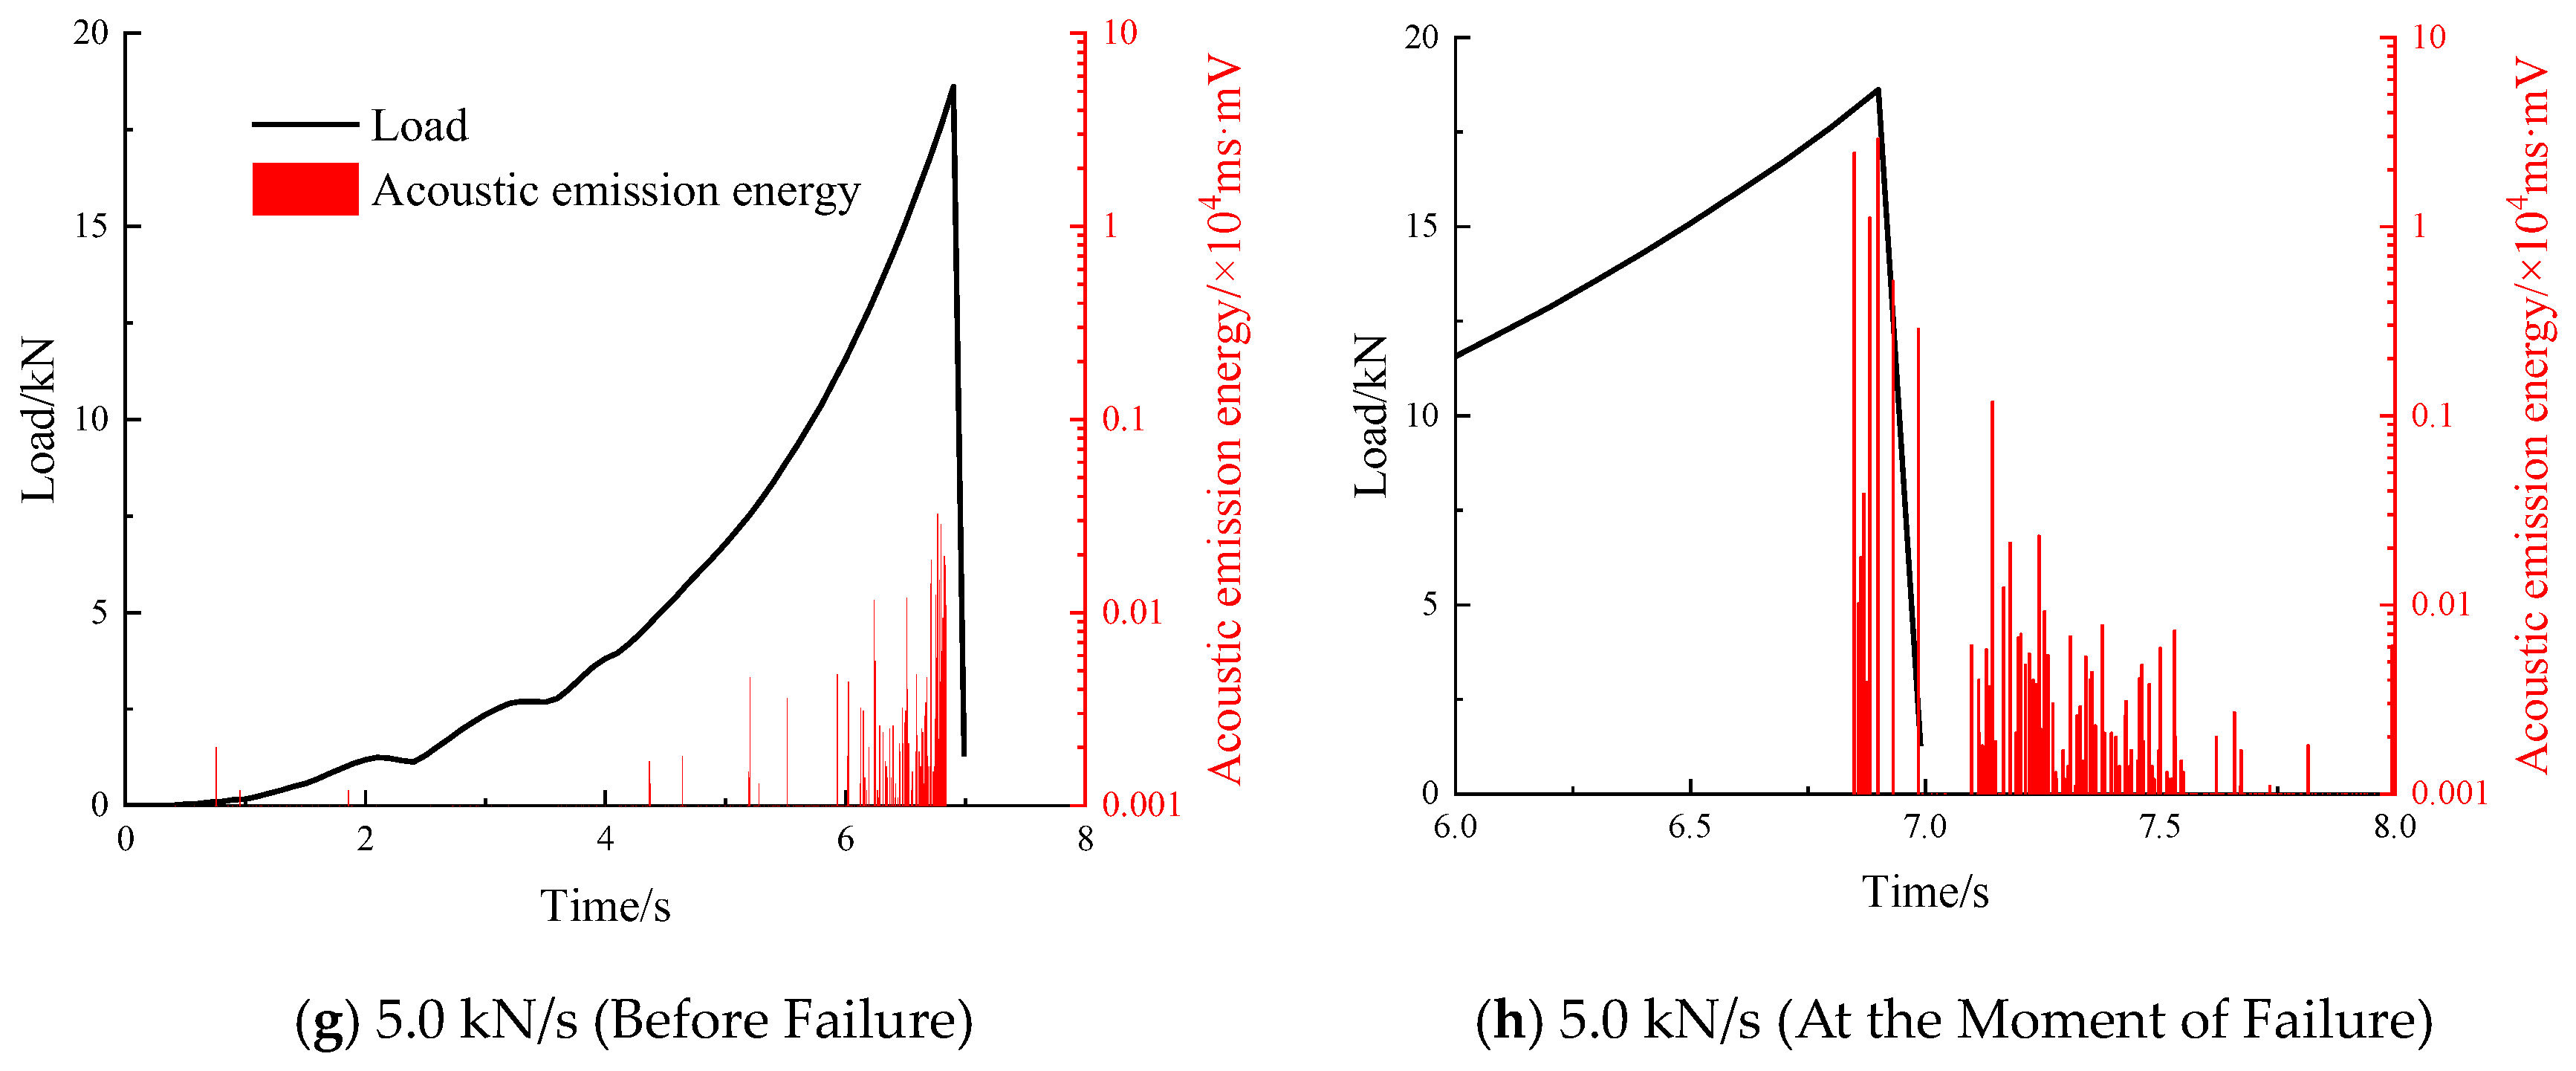
3.2. Spatiotemporal Evolution Characteristics of Acoustic Emission Parameters
4. Discussion
4.1. Energy Calculation Model for Hard Roof Considering Mining Speed and Analysis of Influencing Factors
- (1)
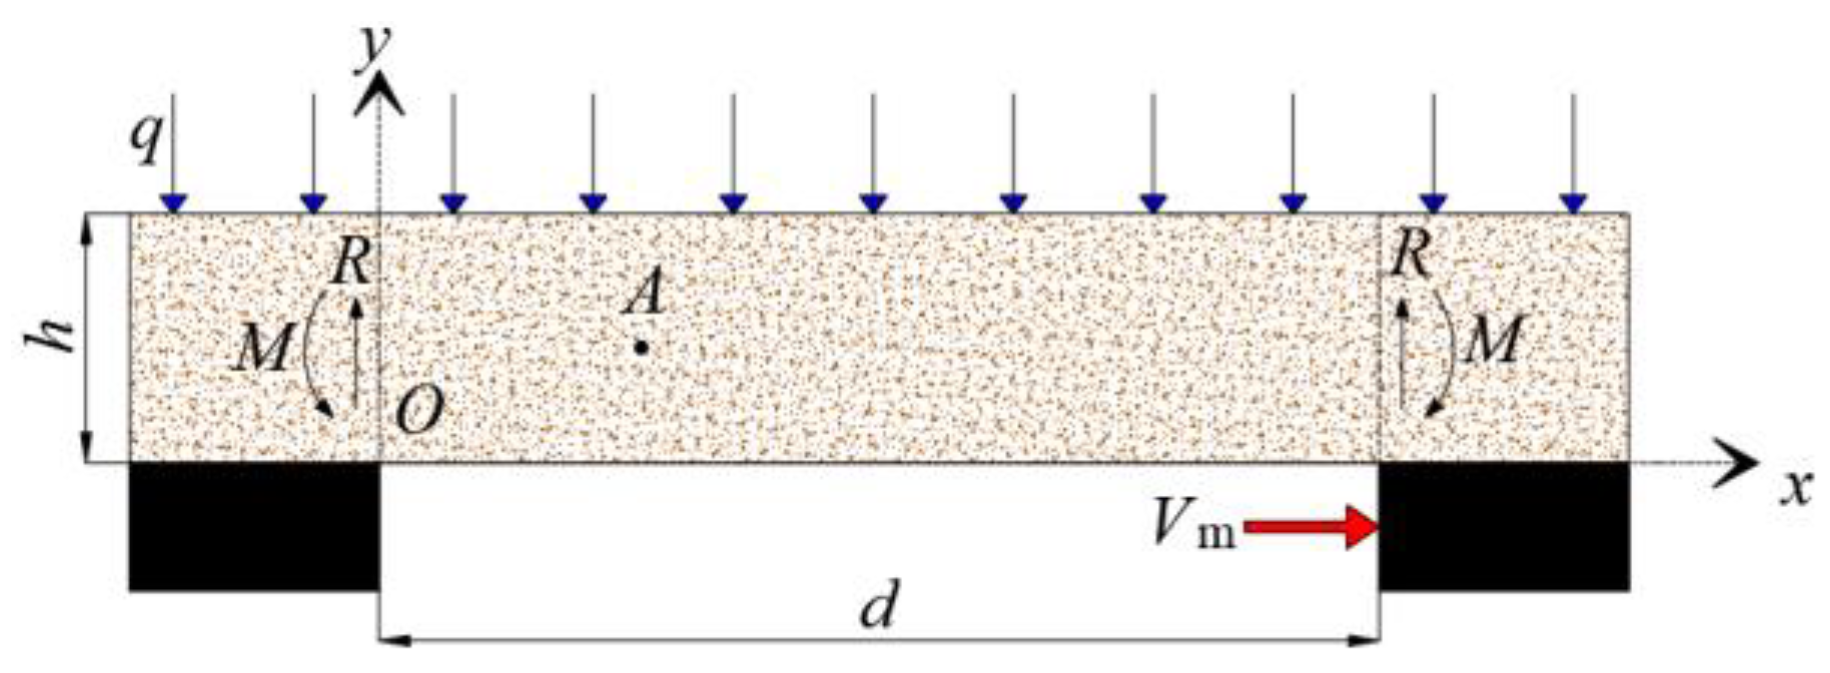
- During the Initial Fracture Period
- (2)
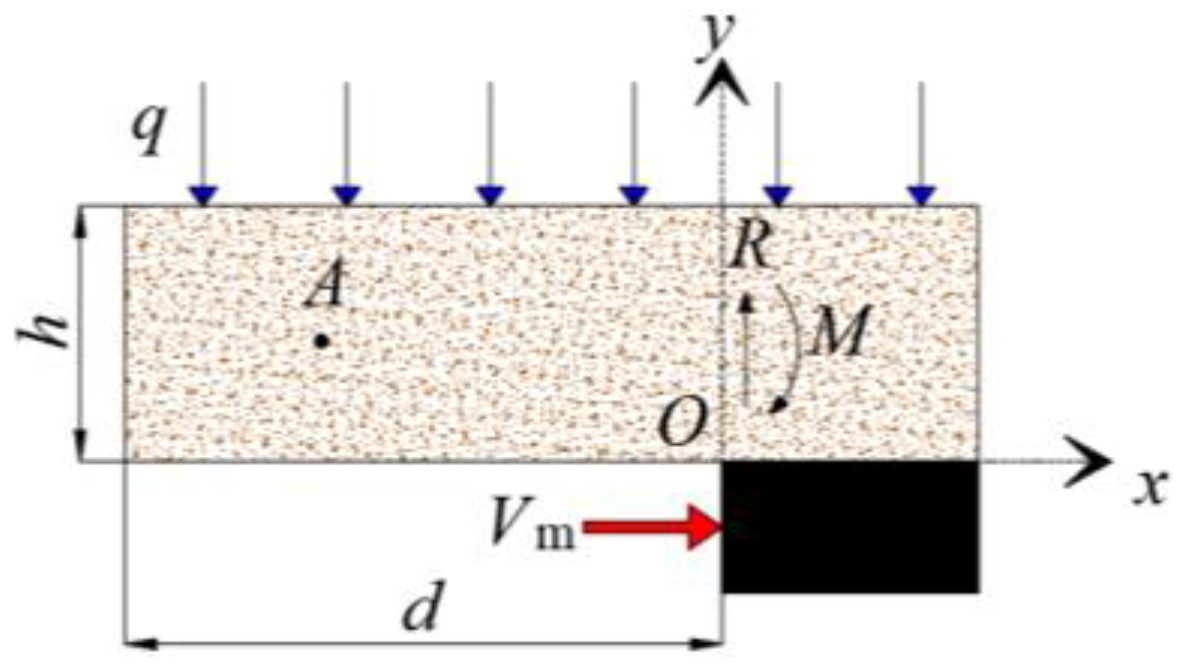
- During Cyclic Fracture
- (3)
- Analysis of Influencing Factors
4.2. Future Works
5. Conclusions
- (1)
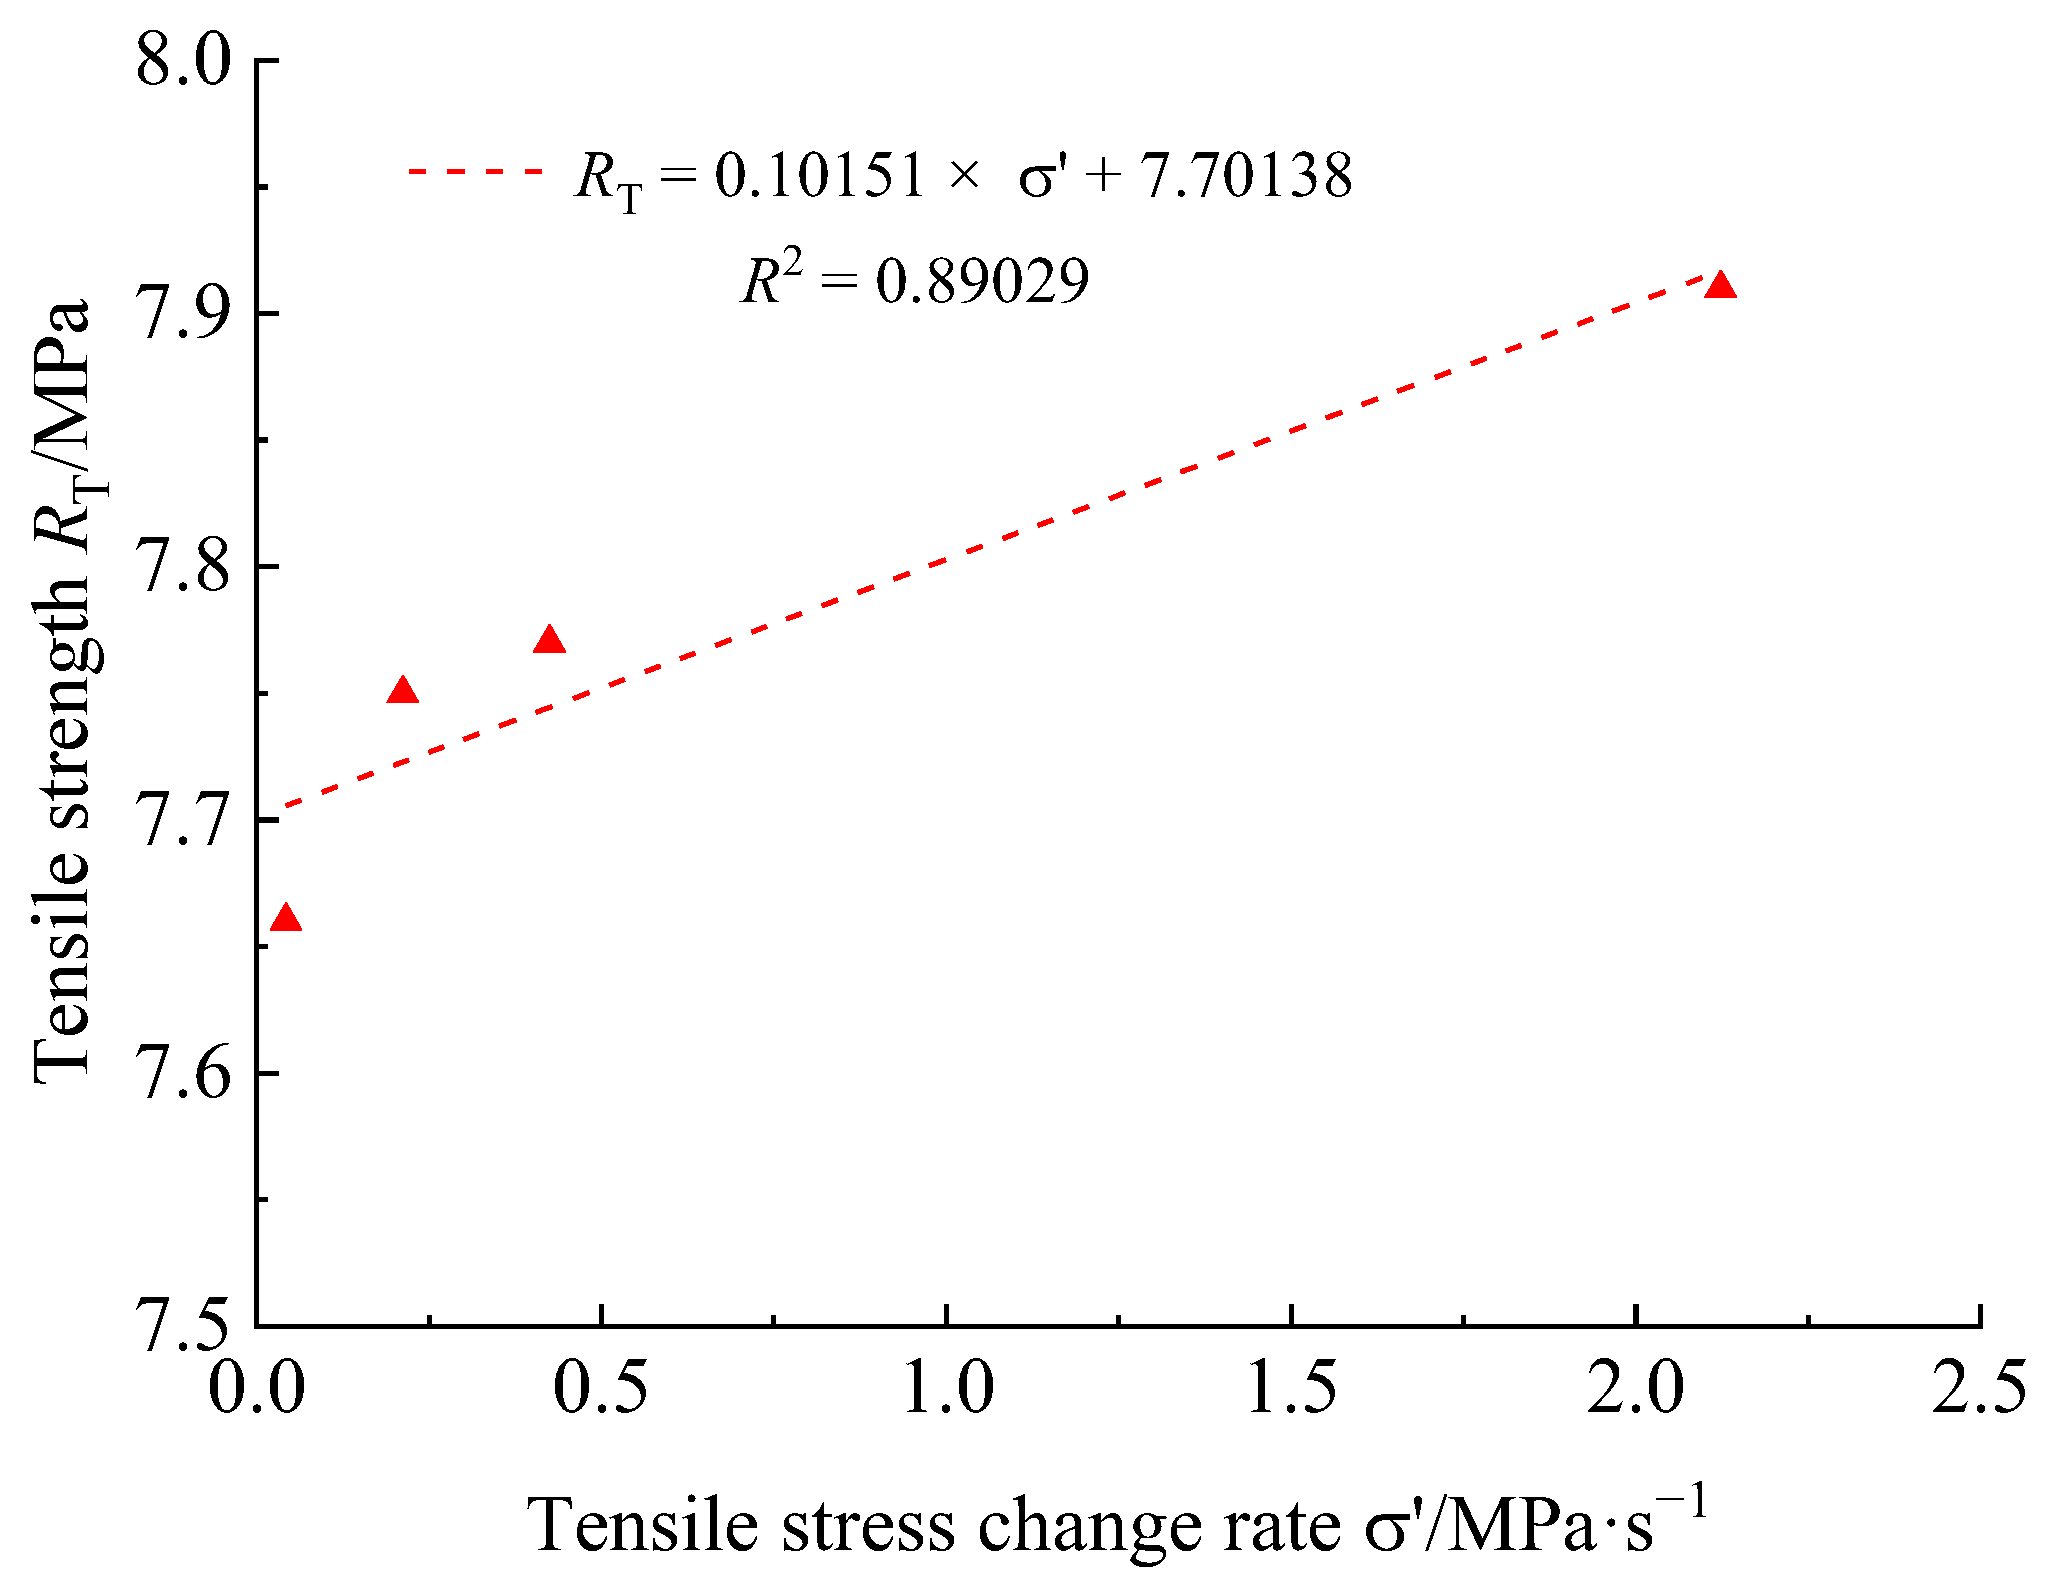
- The tensile strength and pre-peak energy accumulation of sandstone Brazilian split test samples gradually increase with the increase in loading rate. The coefficients a and b in the linear relationship between tensile strength and the change rate of tensile stress are 0.10151 and 7.70138, respectively. As mining speed increases, internal micro-cracks in the hard roof have less time to develop and expand before fracturing. This results in a macroscopic increase in tensile strength and a higher amount of energy released upon fracture.
- (2)
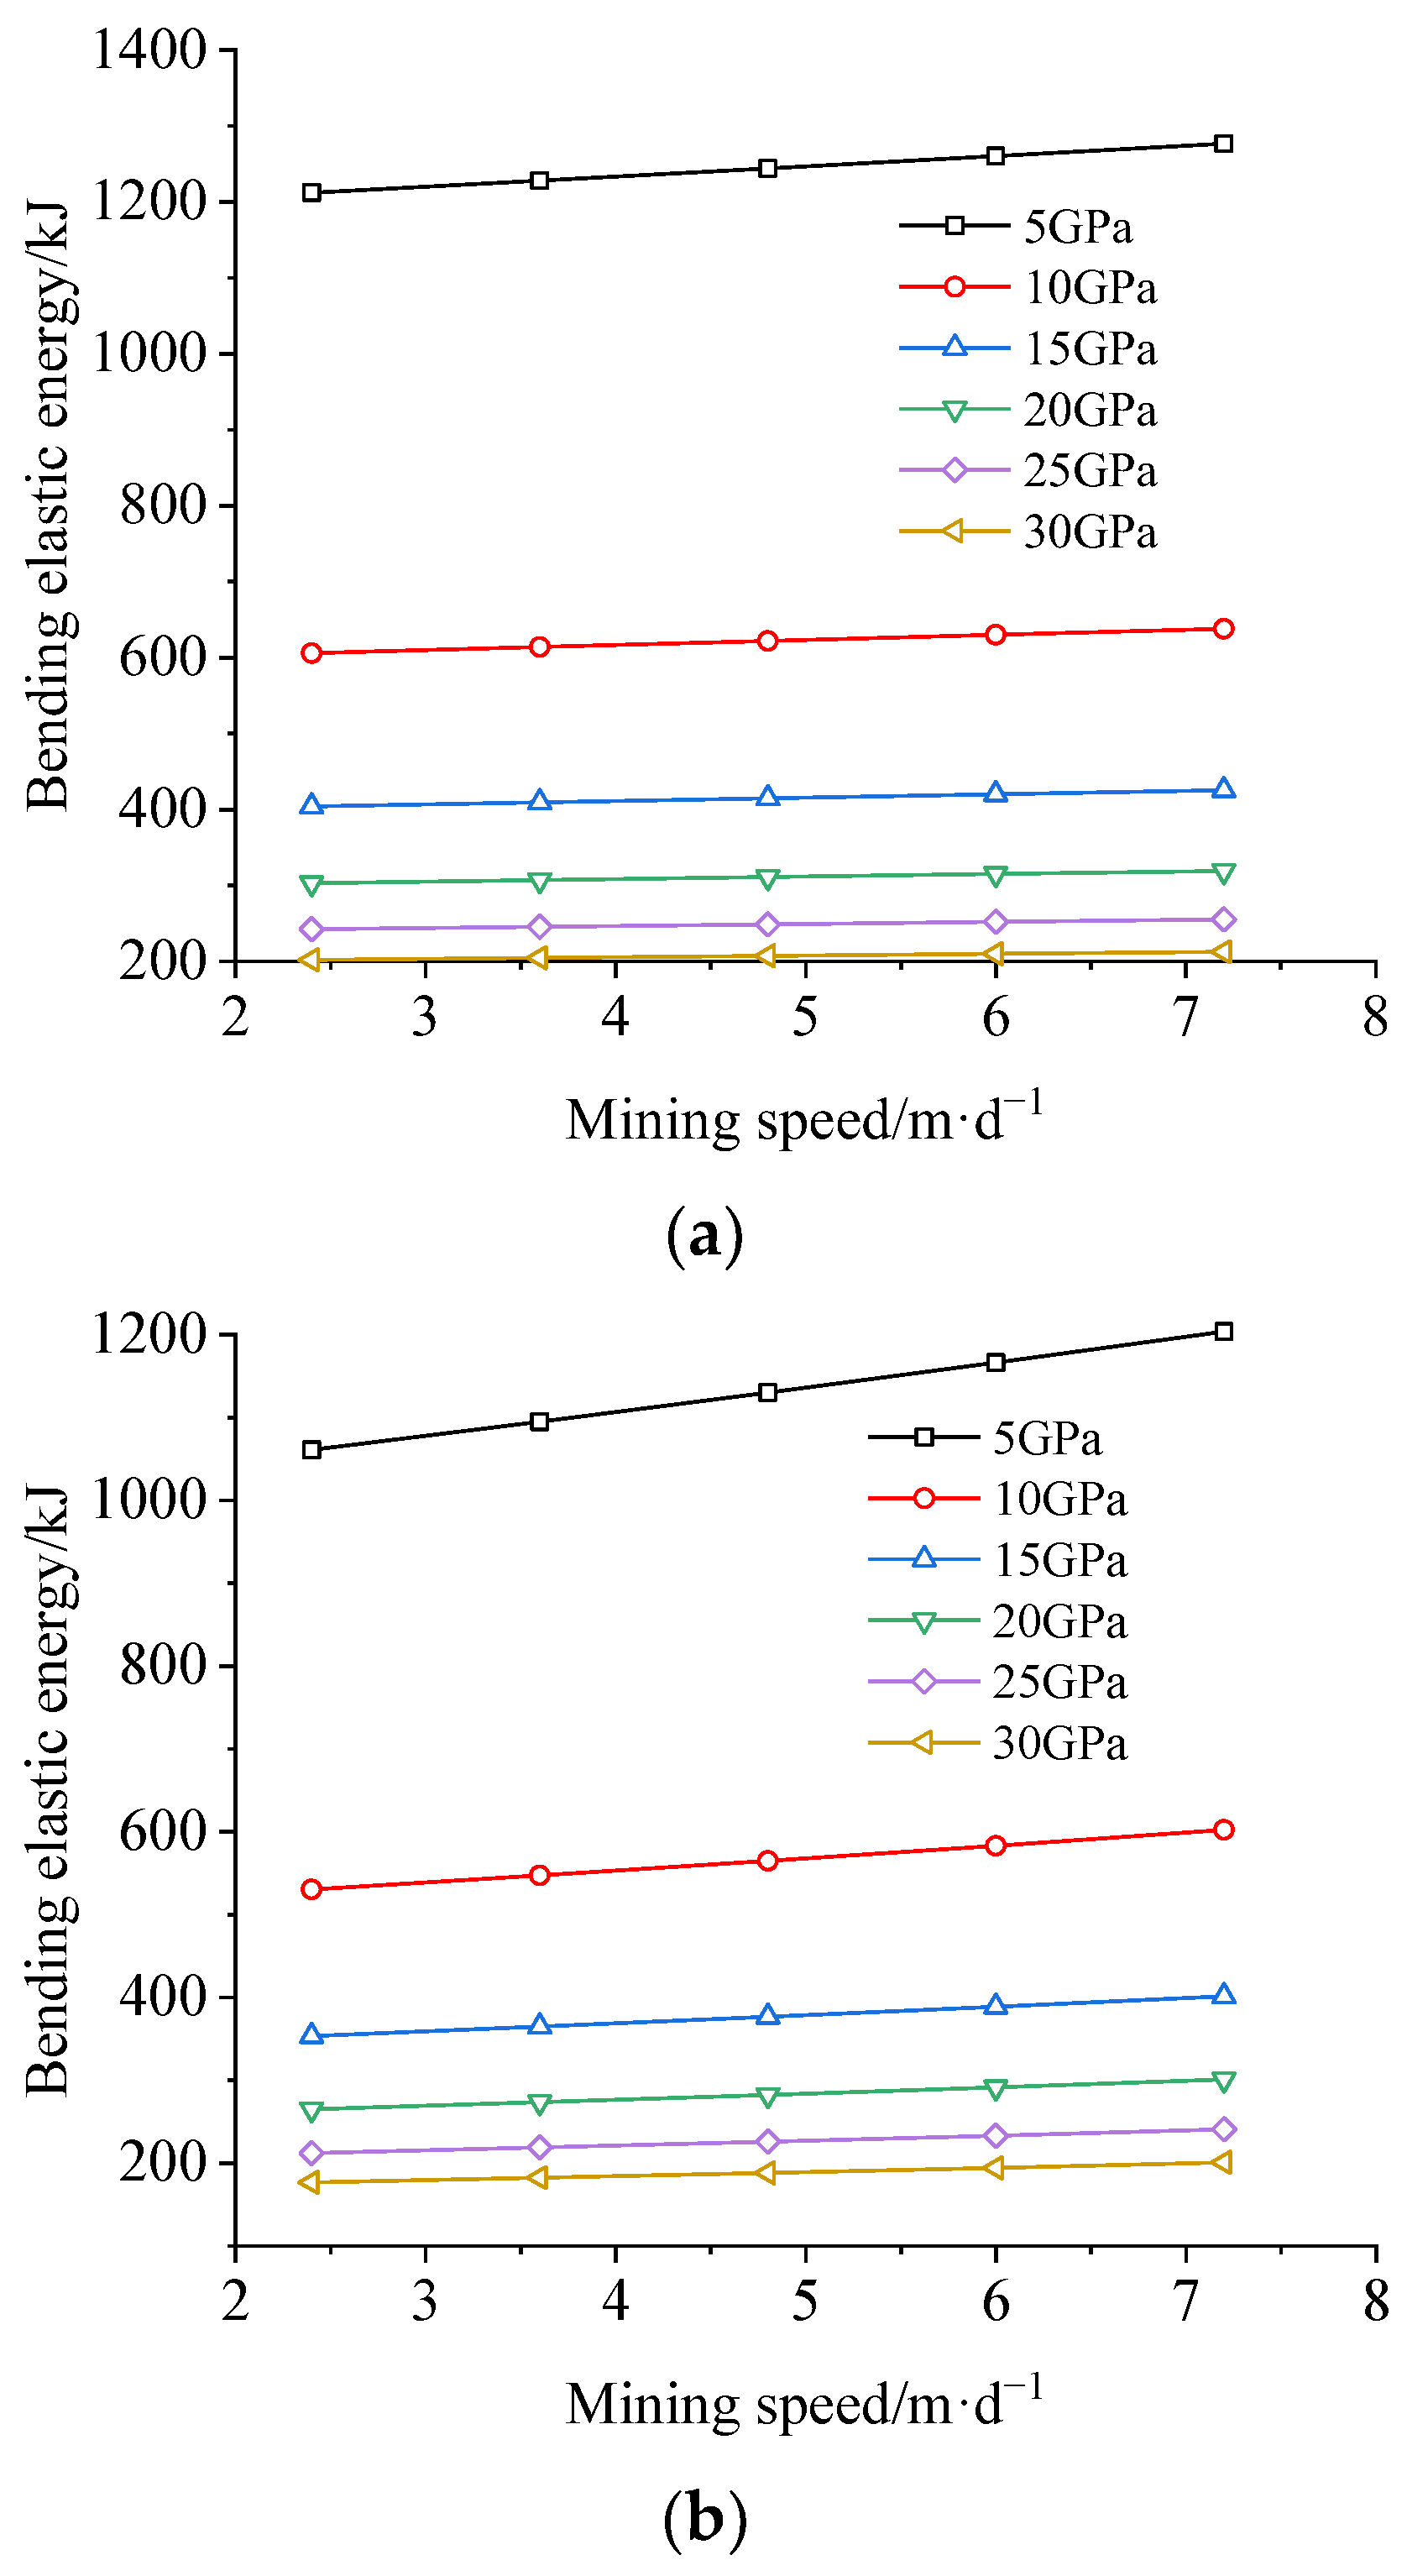
- The maximum rate of change of tensile stress in the hard roof during initial and cyclic fractures shows a linear positive correlation with the mining speed. The bending elastic energy approximately exhibits linear growth with the increase in mining speed. Under the same conditions of mining speed, elastic modulus, and thickness, the bending elastic energy during the initial fracture of the hard roof is higher than that during cyclic fractures.
- (3)
- Through theoretical deduction, the relationship between the mining speed and the change rate of tensile stress within the hard roof was obtained. A computational model for the bending elastic energy of the hard roof during initial and cyclic fracture periods, considering the mining speed, was established, and an analysis of the main influencing factors was conducted.
- (4)
- The thicker the hard roof, the higher the sensitivity of the bending elastic energy to changes in mining speed, and this characteristic is more pronounced during cyclic fractures. Therefore, when mining workfaces with thick and hard roofs, the optimization of mining speed should be emphasized to effectively prevent roof fracture-type rockburst.
Author Contributions
Funding
Institutional Review Board Statement
Informed Consent Statement
Data Availability Statement
Conflicts of Interest
References
- Qi, Q.X.; Pan, Y.S.; Li, H.T.; Jiang, D.Y.; Shu, L.Y.; Zhao, S.K.; Zhang, Y.; Pan, J.; Li, H.; Pan, P. Theoretical basis and key technology of prevention and control of coal-rock dynamic disasters in deep coal mining. J. China Coal Soc. 2020, 45, 18. [Google Scholar]
- Yang, S.L.; Wang, Z.H.; Jiang, W.; Yang, J.H. Advancing rate effect on rock and coal failure format in highintensity mining face. J. China Coal Soc. 2016, 41, 586–594. [Google Scholar]
- Wu, M. The effect of loading rate on the compressive and tensile strength of rocks. Chin. J. Geotech. Eng. 1982, 4, 97–106. [Google Scholar]
- Li, H.; Li, J.; Liu, B.; Li, J.; Li, S.; Xia, X. Direct tension test for rock material under different strain rates at quasi-static loads. Rock Mech. Rock Eng. 2013, 46, 1247–1254. [Google Scholar] [CrossRef]
- Zhou, H.; Yang, Y.S.; Xiao, H.B.; Zhang, C.Q.; Fu, Y.P. Research on loading rate effect of tensile strength property of hard brittle marble—Test characteristics and mechanism. Chin. J. Rock Mech. Eng. 2013, 32, 1868–1875. [Google Scholar]
- Gong, F.Q.; Zhao, G.F. Dynamic indirect tensile strength of sandstone under different loading rates. Rock Mech. Rock Eng. 2014, 47, 2271–2278. [Google Scholar] [CrossRef]
- Yang, J.H.; Yu, X. Mechanical explanation of loading rate impact on tensile strength and its numerical simulation analysis. J. China Coal Soc. 2017, 42, 51–59. [Google Scholar]
- Deng, H.; Wang, C.; Li, J.; Zhang, Y.; Wang, W.; Zhang, H. Influence mechanism of loading rate on tensile strength of sandstone. Rock Soil Mech. 2018, 39, 79–88. [Google Scholar]
- Cui, Z.; Qian, S.; Zhang, G.; Maochu, Z. An experimental investigation of the influence of loading rate on rock tensile strength and split fracture surface morphology. Rock Mech. Rock Eng. 2021, 54, 1969–1983. [Google Scholar] [CrossRef]
- Liu, Y.; Huang, D.; Cen, D.; Zhong, Z.; Gong, F.; Wu, Z.; Yang, Y. Tensile strength and fracture surface morphology of granite under confined direct tension test. Rock Mech. Rock Eng. 2021, 54, 4755–4769. [Google Scholar] [CrossRef]
- Liu, B.; Zhao, Y.; Wang, H.; Gao, Y.; Sun, Z. Tensile properties and multiparameter response characteristics of coal under different loading rates. Nat. Resour. Res. 2022, 31, 2787–2803. [Google Scholar] [CrossRef]
- Vasyliev, L.; Malich, M.G.; Vasyliev, D.; Katan, V.; Rizo, Z. Improving a technique to calculate strength of cylindrical rock samples in terms of uniaxial compression. Min. Miner. Depos. 2023, 17, 43–50. [Google Scholar] [CrossRef]
- Winkler, M.B.; Frühwirt, T.; Marcher, T. Elastic Behavior of Transversely Isotropic Cylindrical Rock Samples under Uniaxial Compression Considering Ideal and Frictional Boundary Conditions. Appl. Sci. 2023, 14, 17. [Google Scholar] [CrossRef]
- Piscopo, V. Ultimate Strength of Platings Under Uniaxial Compression with Edges Elastically Restrained Against Torsion: A New Comprehensive Approach. J. Mar. Sci. Appl. 2024, 23, 443–459. [Google Scholar] [CrossRef]
- Choo, J.; Sun, Y.; Fei, F. Size effects on the strength and cracking behavior of flawed rocks under uniaxial compression: From laboratory scale to field scale. Acta Geotech. 2023, 18, 3451–3468. [Google Scholar] [CrossRef]
- Tomporowski, D.; Nitka, M.; Tejchman, J. Application of the 3D DEM in the modelling of fractures in pre-flawed marble specimens during uniaxial compression. Eng. Fract. Mech. 2023, 277, 108978. [Google Scholar] [CrossRef]
- Feng, L.F.; Dou, L.M.; Wang, X.D.; Jin, D.W.; Cai, W.; Xu, G.G.; Jiao, B. Mechanism of mining advance speed on energy release from hard roof movement. J. China Coal Soc. 2019, 44, 3329–3339. [Google Scholar]
- Zhao, T.; Guo, W.; Han, F.; Gu, S. Analysis on energy accumulation and release of roof under influence of mining speed. Coal Sci. Technol. 2018, 46, 37–44. [Google Scholar]
- Peng, S.J.; Chen, C.C.; Xu, J.; Zhang, H.L.; Tang, Y.; Nie, W.; Zhao, K. Loading rate dependency of rock stress-strain curve based on Brazil splitting test. Chin. J. Rock Mech. Eng. 2018, 37, 3247–3252. [Google Scholar]
- Su, H.; Jing, H.; Du, M.; Wang, C. Experimental investigation on tensile strength and its loading rate effect of sandstone after high temperature treatment. Arab. J. Geosci. 2016, 9, 616. [Google Scholar] [CrossRef]
- Yu, M.; Wei, C.; Niu, L. The Coupled Effect of Loading Rate and Grain Size on Tensile Strength of Sandstones under Dynamic Disturbance. Shock. Vib. 2017, 2017, 6989043. [Google Scholar] [CrossRef]
- Liu, J.; Jiang, G.; Liu, T.; Liang, Q. The Influence of Loading Rate on Direct and Indirect Tensile Strengths: Laboratory and Numerical Methods. Shock. Vib. 2021, 2021, 3797243. [Google Scholar] [CrossRef]
- Zhang, M.C.; Sheng, Q.; Cui, Z.; Ma, Y.L.N.; Zhou, G.X. Effect of loading rate on tensile strength of rock materials and morphology of fracture joint surface. Rock Soil Mech. 2020, 41, 1169–1178. [Google Scholar]
- GB/T 23561.10-2010; Methods for Determining the Physical and Mechanical Properties of Coal and Rock Part 10: Methods for Determining the Tensile Strength of Coal and Rock. General Administration of Quality Supervision, Inspection and Quarantine of the People’s Republic of China: Beijing, China, 2010.
- Li, H.T.; Song, L.; Zhou, H.W.; Jiang, Y.D.; Wang, H.W. Evaluation method and application of coal burst performance under the effect of loading rate. J. China Coal Soc. 2015, 40, 2763–2771. [Google Scholar]
- Qian, M.; Shi, P.; Xu, J. Ground Pressure and Strata Control; China University of Mining and Technology Press: Xuzhou, China, 2010. [Google Scholar]
- Mao, R. Study on Tensile Properties and Damage Evolution Mechanism of Coal Measures Sandstone under High Strain Rate. Ph.D. Thesis, China University of Mining and Technology, Xuzhou, China, 2018. [Google Scholar]
- Li, H.T.; Jiang, C.X.; Jiang, Y.D.; Wang, H.W.; Liu, H.B. Mechanical behavior and mechanism analysis of coal samples based on loading rate effect. J. China Univ. Min. Technol. 2015, 44, 430–436. [Google Scholar]
- Li, H.T.; Song, L.; Zhou, H.W.; Song, F. Experimental study of nonlinear evolution mechanism of coal strength under multi-loading rates and its application. Chin. J. Rock Mech. Eng. 2016, 35, 2978–2989. [Google Scholar]
- Li, H.; Zhou, H.; Jiang, Y.; Wang, H. An Evaluation Method for the Bursting Characteristics of Coal Under the Effect of Loading Rate. Rock Mech. Rock Eng. 2016, 49, 3281–3291. [Google Scholar]
- Gao, M.; Xie, J.; Gao, Y.; Wang, W.; Li, C.; Yang, B.; Liu, J.; Xie, H. Mechanical behavior of coal under different mining rates: A case study from laboratory experiments to field testing. Int. J. Min. Sci. Technol. 2021, 31, 825–841. [Google Scholar] [CrossRef]
- Li, H.; Qi, Q.; Du, W.; Li, X. A criterion of rockburst in coal mines considering the influence of working face mining velocity. Geomech. Geophys. Geo-Energy Geo-Resour. 2022, 8, 37. [Google Scholar] [CrossRef]


| Sample Number | Loading Rate/kN·s−1 | Rate of Change of Tensile Stress/MPa·s−1 | Failure Load/kN | Tensile Strength/MPa | Median Tensile Strength/MPa |
|---|---|---|---|---|---|
| 1-1 | 0.1 | 0.04 | 16.04 | 6.81 | 7.66 |
| 1-2 | 18.05 | 7.66 | |||
| 1-3 | 18.84 | 8.00 | |||
| 2-1 | 0.5 | 0.21 | 18.24 | 7.75 | 7.75 |
| 2-2 | 19.17 | 8.14 | |||
| 2-3 | 16.25 | 6.90 | |||
| 3-1 | 1.0 | 0.42 | 16.31 | 6.93 | 7.77 |
| 3-2 | 19.42 | 8.25 | |||
| 3-3 | 18.31 | 7.77 | |||
| 4-1 | 5.0 | 2.12 | 19.23 | 8.17 | 7.91 |
| 4-2 | 16.22 | 6.89 | |||
| 4-3 | 18.62 | 7.91 |
| Loading Displacement/mm | 0~0.4 (Phase I) | 0.4~0.7 (Phase II) | >0.7 (Phase III) | Failure State |
|---|---|---|---|---|
| Loading rate 0.1 kN/s |  | 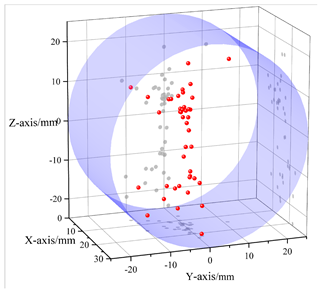 | 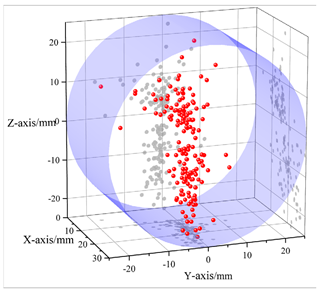 |  |
| Loading rate 0.5 kN/s | 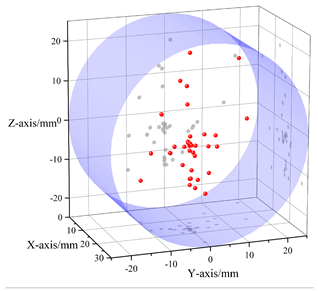 | 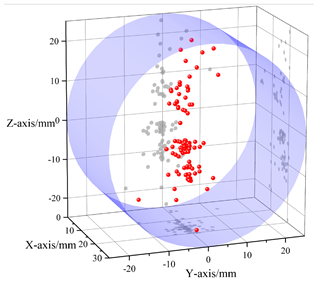 | 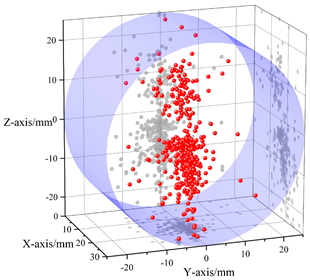 | 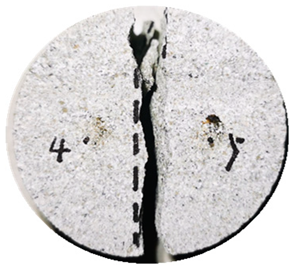 |
| Loading rate 1.0 kN/s | 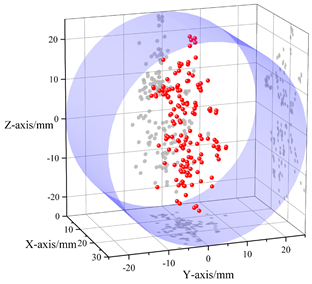 | 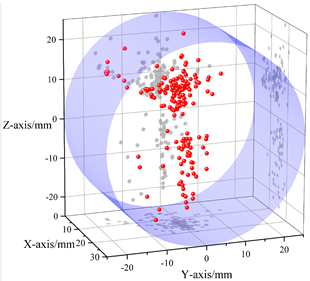 |  |  |
| Loading rate 5.0 kN/s | 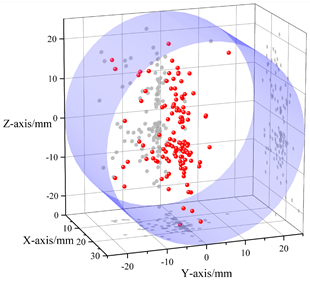 | 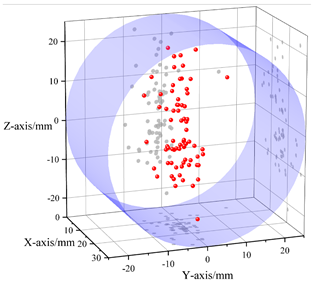 |  |  |
Disclaimer/Publisher’s Note: The statements, opinions and data contained in all publications are solely those of the individual author(s) and contributor(s) and not of MDPI and/or the editor(s). MDPI and/or the editor(s) disclaim responsibility for any injury to people or property resulting from any ideas, methods, instructions or products referred to in the content. |
© 2024 by the authors. Licensee MDPI, Basel, Switzerland. This article is an open access article distributed under the terms and conditions of the Creative Commons Attribution (CC BY) license (https://creativecommons.org/licenses/by/4.0/).
Share and Cite
Li, W.; Tu, S.; Zhao, T. Study on the Tensile Failure Characteristics and Energy Calculation Model of Coal Seam Hard Roof Considering the Mining Speed. Appl. Sci. 2024, 14, 5734. https://doi.org/10.3390/app14135734
Li W, Tu S, Zhao T. Study on the Tensile Failure Characteristics and Energy Calculation Model of Coal Seam Hard Roof Considering the Mining Speed. Applied Sciences. 2024; 14(13):5734. https://doi.org/10.3390/app14135734
Chicago/Turabian StyleLi, Wenlong, Shihao Tu, and Tongbin Zhao. 2024. "Study on the Tensile Failure Characteristics and Energy Calculation Model of Coal Seam Hard Roof Considering the Mining Speed" Applied Sciences 14, no. 13: 5734. https://doi.org/10.3390/app14135734