Article

Modeling and Experimental Validation on Current Uniformity Characteristics of Parallel Spiral Structure Surge Arrester in ±550 kV DC GIS

1
State Key Laboratory of Electrical Insulation and Power Equipment, Xi’an Jiaotong University, Xi’an 710049, China
2
Northwest Branch of State Grid Corporation of China, Xi’an 710000, China
*
Author to whom correspondence should be addressed.
Appl. Sci. 2024, 14(13), 5744; https://doi.org/10.3390/app14135744
Submission received: 8 May 2024 / Revised: 24 June 2024 / Accepted: 28 June 2024 / Published: 1 July 2024
(This article belongs to the Section Electrical, Electronics and Communications Engineering)

Abstract

:

Featured Application

The proposed surge arrester is applied to a DC GIS in an offshore wind farm converter platform, significantly reducing the space the equipments take up by up to 95%, which performs well especially in the new power system.

Abstract

The employment of a multi-column parallel connection is intended to enhance the energy absorption capability and reliability of surge arresters. However, the disparity in reference voltage between each varistor column and the uneven current distribution may result in a reduction in performance or even failure of the surge arrester. The objective of this study is to investigate the spiral structure of a ±550 kV DC gas-insulated switchgear (GIS) parallel arrester and its influence on the current distribution characteristics. This research develops a model of a ±550 kV DC GIS arrester and performs an in-depth theoretical analysis using multi-physics field simulations. Subsequently, a ±66 kV miniature prototype is constructed, and the accuracy of the theoretical analysis and simulation results is validated by experiments, validating the effectiveness of the proposed method. This study calculates the self-generated inductance in the spiral structure of ZnO varistors using simulations. The influence of the self-generated inductance on the current distribution of the multi-column arrester when absorbing energy is further investigated. The results indicate that the self-generated inductance of the spiral structure can reduce the current deviation factor by 28–65%. This research provides a novel approach to improving current equalization in the parallel surge arresters of DC GISs for offshore wind power converter platforms.

1. Introduction

Offshore wind power offers multiple advantages, including abundant resources, consistent wind energy, and a smaller land footprint, contributing to its environmentally friendly profile [1,2,3]. A gas-insulated switchgear (GIS) on an offshore wind farm converter platform can significantly reduce the equipment footprint by up to 95% compared to an air-insulated switchgear, effectively reducing the cost of offshore converter platforms [4,5,6,7,8]. In harsh offshore environments, the enclosed design of the GIS prevents external factors such as humidity, salt spray, and pollution from eroding the equipment, further enhancing the stability of the system. Offshore wind farms often need to handle high-voltage and large-capacity power transmissions. DC GISs can effectively cope with these demands and provide a stable power transmission solution. Its high insulation performance and powerful current handling capability ensure efficient power transmission and meet the high-energy efficiency requirements of offshore wind farms [9,10,11,12].
In a flexible DC transmission system, a DC GIS is the key switching equipment that ensures stable transmission of power from the wind turbine to the grid. Its high reliability and fast response capability can effectively deal with all kinds of power fluctuations and fault conditions and guarantee stable operation of the whole offshore wind power system. The reliability of the GIS is crucial to safety of the platforms, and surge arresters are essential equipment for protecting the GIS from overvoltage. Surge arresters in DC systems are subjected to continuous DC voltage. Overvoltage in DC systems can be long-lasting, so surge arresters must have a greater energy absorption capacity and need to be able to effectively absorb and dissipate the large amounts of energy generated in the event of a DC fault or lightning strike, avoiding arrester failure due to heat accumulation. Due to the high voltage of DC systems, a single arrester is often unable to withstand the full voltage and current load alone. Multiple columns in parallel design can increase the energy absorption and dispersion capacity but need to pay special attention to the uniformity of the current distribution to avoid overloading some columns due to uneven current distribution between parallel columns. In high-voltage systems, surge arresters are connected in parallel to improve the energy absorption capacity and reliability. Nonetheless, the difference in reference voltage of each column varistor leads to uneven current distribution, resulting in uneven energy absorption across the parallel columns. The conductivity of ZnO varistors in surge arresters in a specific voltage and current range shows a negative correlation with temperature [13,14]. Hence, high-temperature arrester column resistivity decreases, resulting in more current flow into this arrester column. The formation of positive feedback increases the high-temperature arrester column temperature, which leads to part of the varistor aging faster, and it even causes an explosion in the arrester column [15]. It affects the overall performance and lifetime of the arrester. Therefore, studying the uniform current characteristics of multi-column parallel arresters in a DC GIS is significant for optimizing arrester design and improving offshore power system reliability.
Most of the studies on the current distribution characteristics of multi-column parallel arresters are based on the reference voltage of the ZnO varistor, and most of the research has been conducted on the application of alternating current and cannot be directly applied to DC. The relative deviation in the reference voltage of the ZnO varistor of each column of the arrester is small. The current distribution between the columns tends to be uniform.
Meng [16] optimized the excellent electrical properties of ZnO varistors by adjusting the sintering process. The optimized varistor has a higher voltage gradient, which reduces arrester length and residual voltage. Tarfulea [17] described a new material and fabrication technique for metal oxide varistors based on a novel oxide mixture, obtaining a new zinc oxide varistor with higher nonlinear electrical characteristics. These two researchers optimized the performance of the arrester by improving the material of the zinc oxide varistor. This material-level study applies to the voltage equalization aspect. However, this approach contributes less to current equalization in a multi-column parallel arrester.
Hu proposed a method to control the V-I characteristics of each column through the arrangement method and the inversion method to make the V-I characteristic curve of each column ZnO varistor as consistent as possible [18,19]. However, this only applies to fixed impulse current waveforms and amplitude conditions. Liu proposed a matching method based on equalizing the absorbed energy of each ZnO varistor in the arrester group and improved the current uniformity between columns through the iterative calculation of ZnO varistor position replacement [20]. This method equalizes the energy absorption of the ZnO varistors but does not consider the impact of temperature on the ZnO varistors. Haddad used ballast ZnO varistors to minimize the arrester mismatch effect and increase the energy absorption rating [21]. Lu proposed that β is related to the V-I characteristics of the ZnO varistors and the temperature of the ZnO varistors [22]. These studies are directed towards the equalization of currents in multi-column parallel arresters. However, these methods of current equalization for surge arresters before assembly have limitations. It is more difficult to implement under various conditions. Once an arrester has been in operation for a longer period and is damaged, the arrester can only be replaced.
Tuczek proposed that when a specific column of the arrester is damaged, it can be replaced with a new ZnO varistor column [23]. However, this scheme of replacing the arrester column is cumbersome and inconvenient. Matching the new varistor column and the other varistor columns is difficult, and long-term use is more likely to result in damage. Replacing arresters is also more difficult for offshore wind farm converter platforms. Thus, the current methods cannot solve the problem of dynamic current equalization of a multi-column parallel arrester. All of them are dedicated to the assembly of the varistors before the arrester is assembled. In different scenarios, the nonlinear characteristics of the varistors is not the same, which gives these methods certain limitations. This paper therefore proposes a method for improving dynamic current uniformity using the self-generated inductance of a surge arrester core spiral structure. Unlike current methods in terms of material and matching aspects, the research in this paper is dedicated to the structural optimization of the traditional linear structure into a spiral structure. This approach results in a more compact surge arrester as well as the realization of dynamic current equalization.
The spiral structure core of the arrester designed in this paper presents a novel way to achieve the current uniformity scheme of parallel arresters. The self-generated inductor of a unidirectional spiral structure can carry out dynamic current uniformity when the arrester is working. It further reduces the unevenness of the current distribution between columns based on arrester matching. In Section 2, the core structure of the ±550 kV DC gas-insulated switchgear arrester (GISA) is optimized. Optimizing the core structure to a spiral structure makes the arrester more compact. Then, a multi-physics field simulation analysis is performed. Section 3 establishes a miniature prototype of the ±66 kV DC GISA for the simulation analysis and experimental verification. In Section 4, the current uniformity effect of the spiral stacked self-generated inductor structure of the ±550 kV DC GISA is validated, and the feasibility and effectiveness of spiral inductor current uniformity are demonstrated.

2. Electrothermal Model of Spiral Structure GISA

The surge arresters of the ±550 kV DC GIS applied in the offshore converter platform are subjected to high DC voltages. This imposes higher demands on the design aspects of the surge arresters. Moreover, offshore platforms are expensive and require a compact design of surge arresters. It is difficult to replace equipment on the platform, so the requirements for arrester reliability are extremely high in this context. The optimization of the surge arrester core structure has become the key to improving the performance of surge arresters. Optimization of the core structure can improve the lightning protection capability of the arrester and its stability and reliability. Therefore, in recent years, scholars have conducted a lot of research on the optimization of surge arrester core structures. They mainly focus on the material selection and preparation process optimization of nonlinear varistors to improve its nonlinear performance and stability [16,17,18,19,20,21,22]. The core body is the core component of the arrester, mainly composed of varistors and spacers. Nonlinear varistors is the key component of the arrester for achieving voltage limitation and energy absorption.

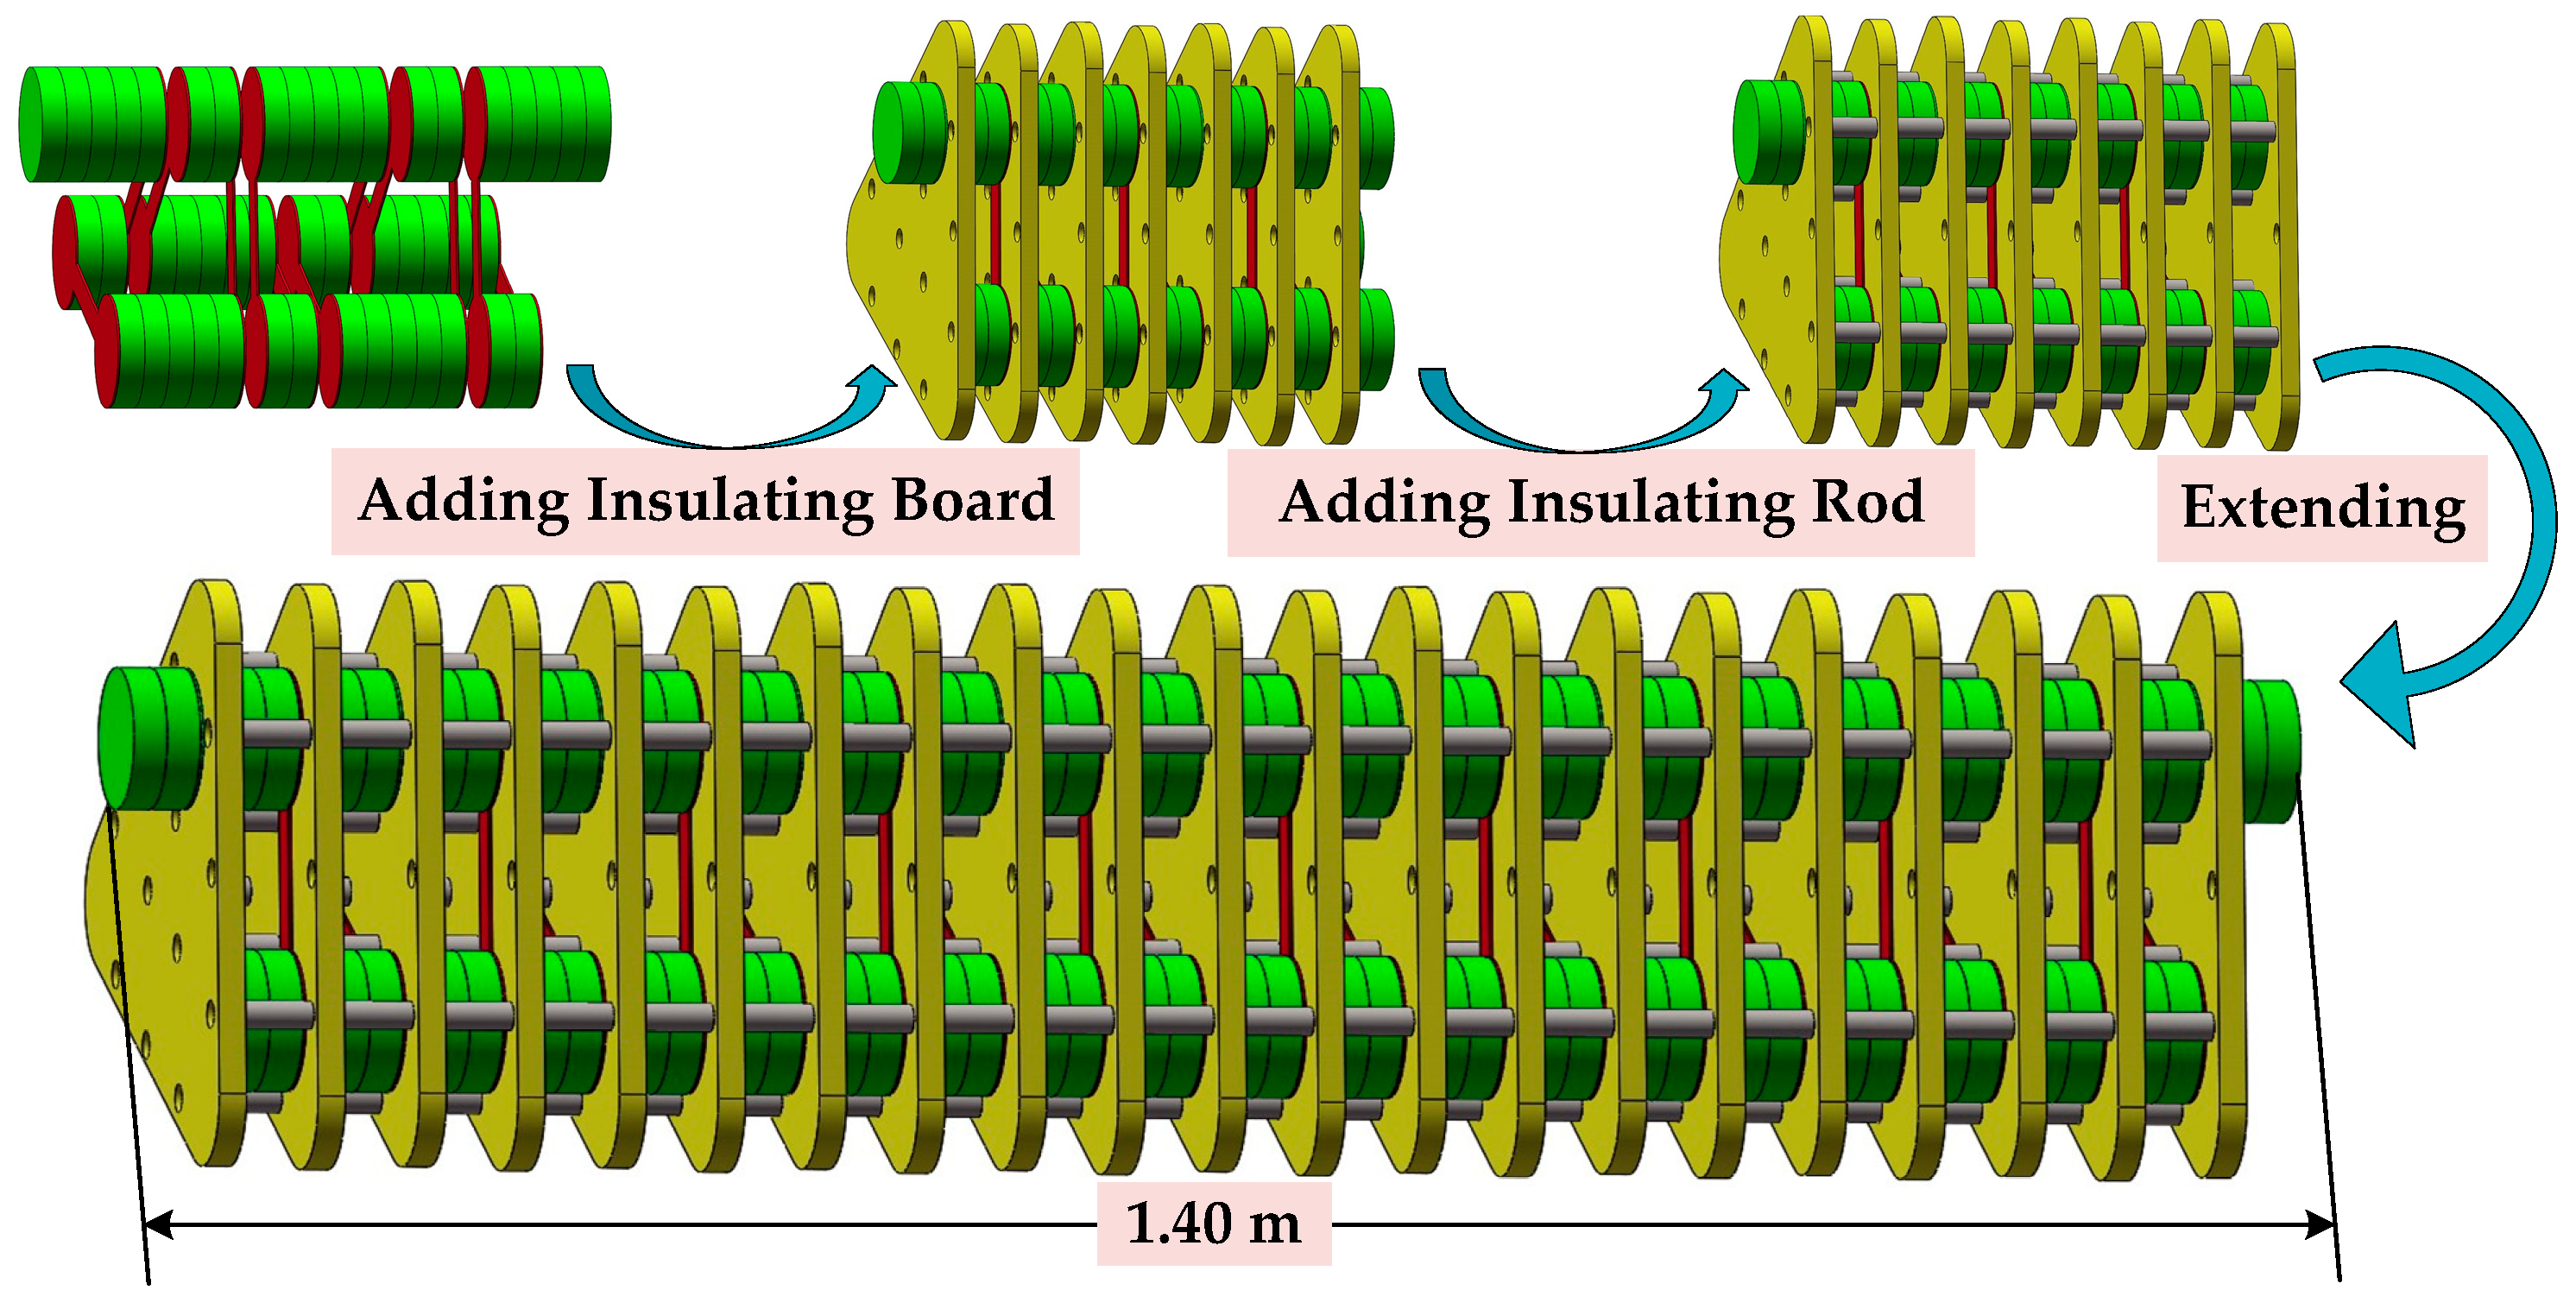
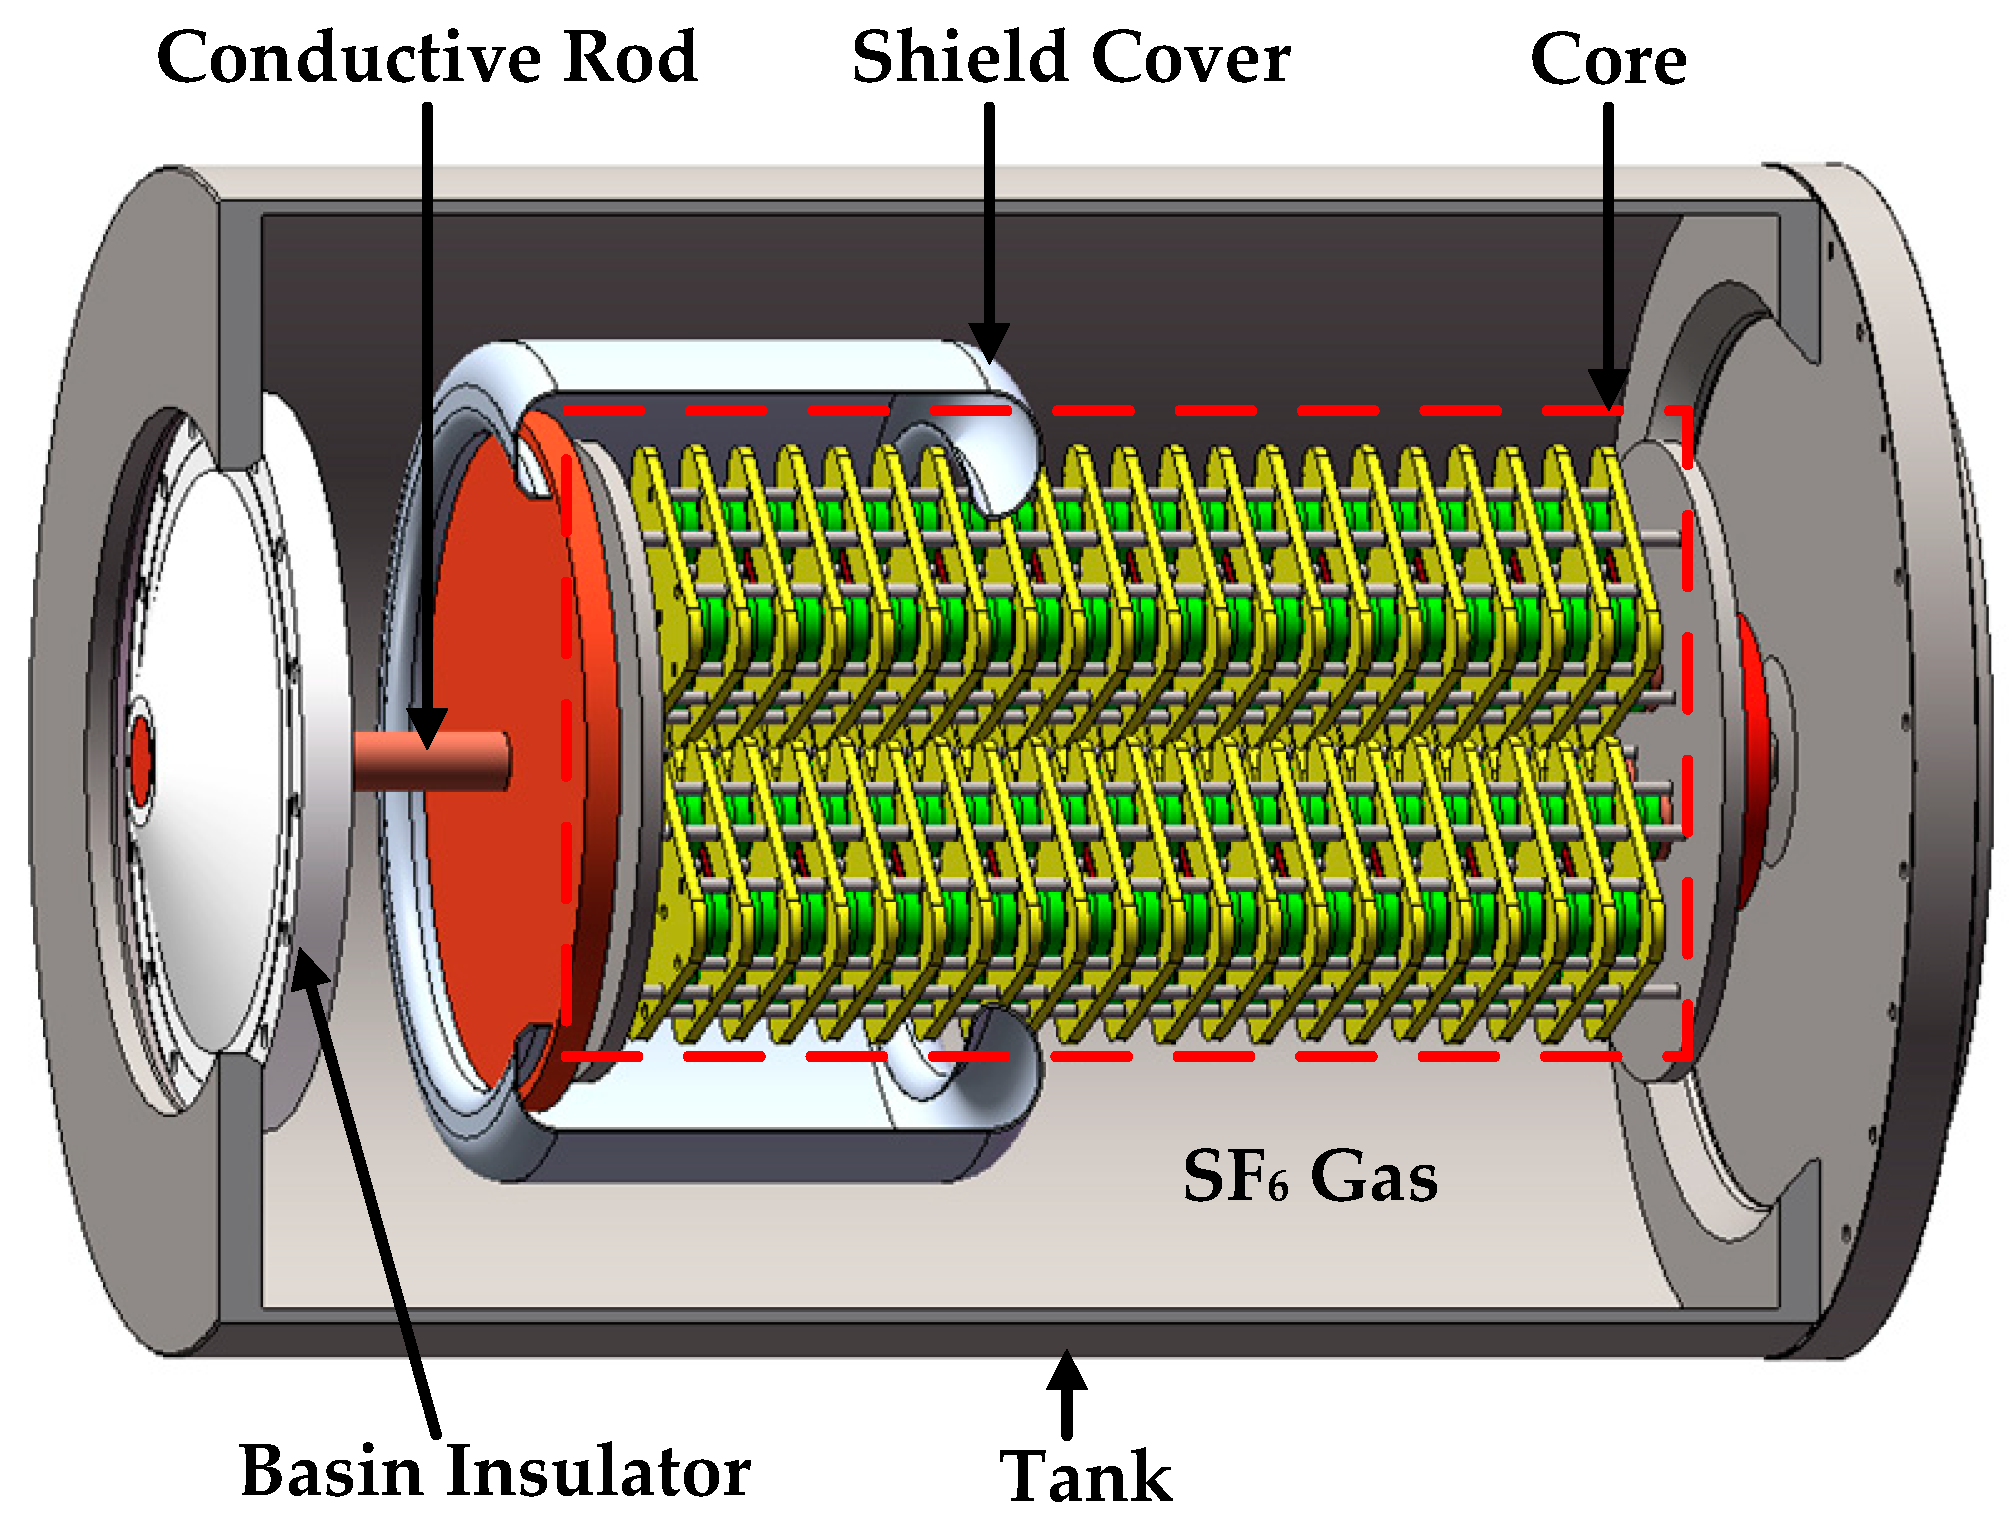
2.1. Parameters of ±550 kV DC GISA

The structural design of the ±550 kV DC GISA and ZnO varistors requires reference parameters. The calculation method of the varistors is related to these parameters [19]. Table 1 describes the main reference parameters. The arrester’s DC reference voltage and continuous operating voltage determine the number of single-column ZnO varistors. The total number is related to the rated absorbed energy of the arrester and ZnO varistor. The number of ZnO varistors is obtained in Equations (1)–(3). The number of ZnO varistors for a single column can be calculated in Equation (1); the number of ZnO varistors for the whole ±550 kV DC GISA can be calculated in Equation (2); and the number of columns of the ±550 kV DC GISA can be calculated in Equation (3).
N 0 = k × U M O A U R
N = S × W M O A W R
M = N N 0 × β
where N0 is the number of single-column ZnO varistors, k and S are the safety margin factors, UMOA is the reference voltage of the arrester, WMOA is the rated absorbed energy of the arrester, UR is the reference voltage of the ZnO varistor, WR is the rated absorbed energy of the ZnO varistor, M is the column number, and β is the current distribution coefficient.
The ±550 kV DC GISA is applied to the offshore wind power converter platform. The environmental conditions of the offshore platform are harsh, and the space layout is limited. The operating conditions of the equipment are more complex, and the surge arrester needs to withstand more severe conditions [24]. Under harsh conditions, vibration poses a more significant threat to the ZnO varistor stacking of surge arresters [25]. The spiral structure reduces the overall length of the ZnO varistors, making them more compact and miniaturized.
As shown in Figure 1 and Figure 2, the spiral structure looks like a solenoid, and the length of the ZnO varistors is reduced by screwing the ZnO varistors to the spacers. This structure relies on spacers to connect the ZnO varistors. The varying current flows through the ZnO varistors and spacers, creating a magnetic field. Due to the superposition and cancellation of the magnetic induction lines, the magnetic field strength is most significant in the triangular region encased by the spacers. This structure acts as an inductor and resists changes in current. If the arrester is used in an AC scenario, the rate of current change is considerable. The self-generated inductors can generate undesirable overvoltage that affects the transmission of electrical energy to the circuit.
In Figure 1, the structure can superpose the self-generated inductor. In Figure 2, the structure can offset the self-generated inductor. The DC GISA of the offshore wind power flexible DC converter system is used in a DC environment, and the multi-column arresters are in parallel. By utilizing the characteristics of the self-generated inductor to resist current changes, this unique structure of Figure 1 can make the current distribution among ZnO varistor columns more uniform.
In Figure 3, insulating rods and insulating boards are arranged around the ZnO varistors, which can not only support but also endure vibration. The length is reduced by 56.25% from a 3.2 m linear structure to a 1.40 m spiral structure. Connecting three single columns, as in Figure 3, in parallel, the core of the ±550 kV DC GIS arrester can be obtained. The ±550 kV DC GIS arrester is a tank arrester mainly composed of a basin insulator, a conductive rod, a tank, a shield cover, and a core as Figure 4. The basin insulator is fixed on the top of the tank, with a conductive rod connected underneath the basin insulator, and the conductive rod is connected to the ZnO varistor core through the shield cover, and the tank is filled with SF6 gas. The accumulation of higher voltages can induce tip discharges. However, the shield cover can efficiently disseminate electric distribution, diminishing charge density and consequently preventing the tip discharges. The core has three columns in parallel. Each column consists of high-potential-gradient, low-residual-voltage ZnO varistors in a spiral stacking structure. The spiral stacking structure reduces the overall size of the arrester, resulting in a more compact structure, which can effectively reduce the area occupied by the equipment. The total length of the ±550 kV DC GIS arrester is 2.40 m, and the tank diameter is 1.36 m.

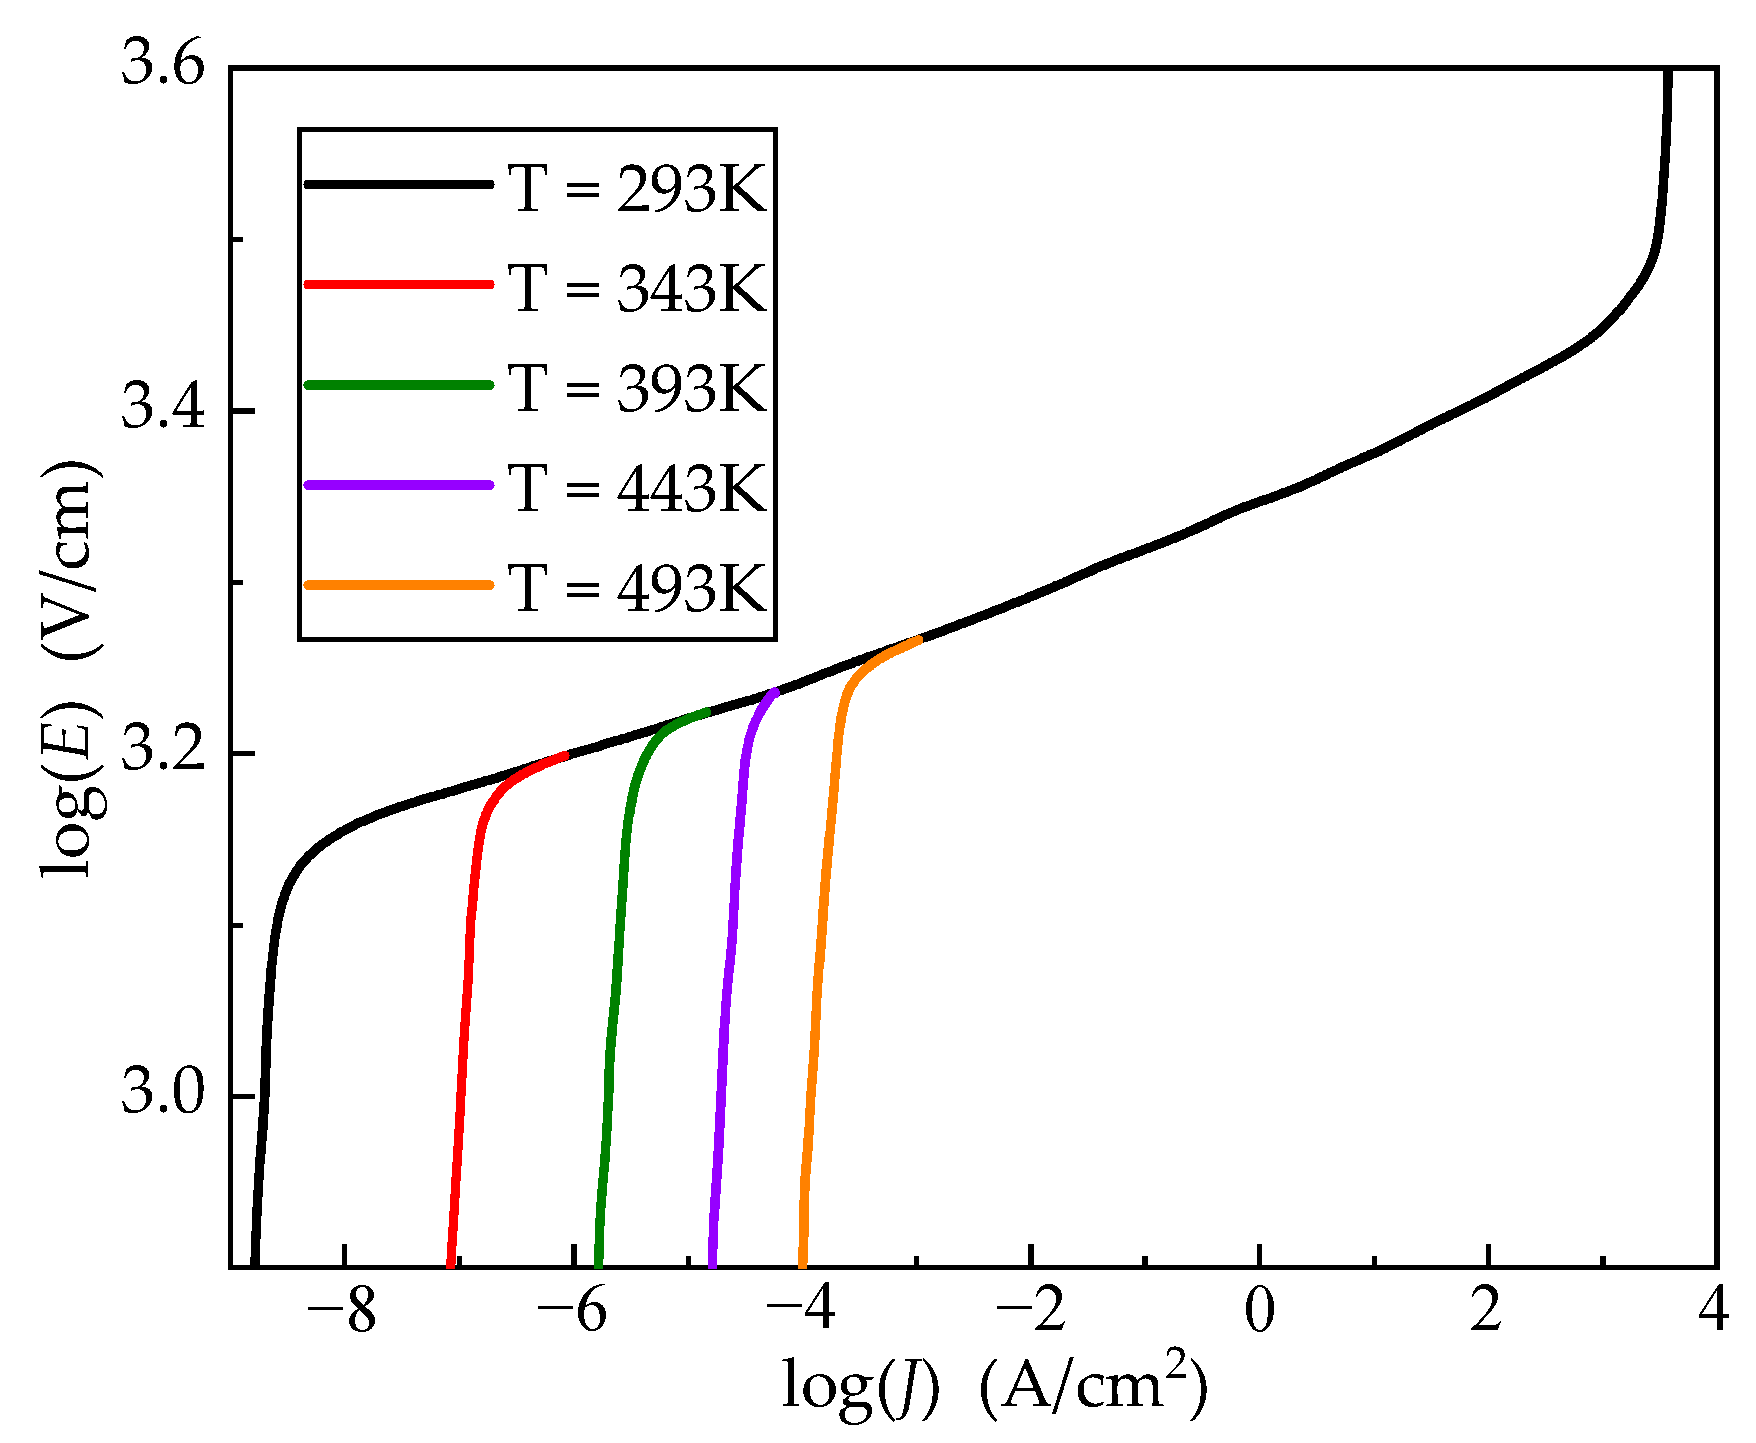
2.2. Electric Field Equation

The ±550 kV DC GIS arrester is subjected to DC voltage, so there is no inductive eddy current loss in the metal parts, and the heat source only considers the Joule heat loss of the core. The ZnO varistor has nonlinear characteristics [26]. Due to the nonlinear nature of the ZnO varistor, most of the energy is absorbed by the ZnO varistor. For DC surge arresters, the conduction current dominates the internal current. Therefore, the distribution of its potential among the media satisfies the condition of a constant electric field and is inversely proportional to the conductivity. The potential distribution inside the arrester satisfies the following equation:
J = Q j , v
J = ( σ + ε 0 ε r t ) E + J e
E = V
where σ is the conductivity of materials; ε0 and εr are the vacuum dielectric constant and relative dielectric constant of the materials; J is the current density; Je is the external injected current density; Qj,v is the current or voltage source; E is the electric field strength; and V is the potential.

2.3. Temperature and Flow Field Equation

The energy absorption process of the arrester is transient, and the heat transfer process includes heat conduction, heat convection, and heat radiation [27,28]. The heat conduction equation satisfies the following formula:
1 r r ( k r T r ) + 1 r 2 φ ( k T φ ) + z ( k T z ) + Q V = ρ C p T t
where r is the radial distance of the calculation point from the center of the varistor; k is the thermal conductivity of materials; T is the absolute temperature; QV is the input energy; Cp is the specific heat capacity; and t is time.
As there is a temperature difference between the ZnO varistor of the arrester, SF6 gas, tank, and ambient air, the heat is transmitted between solids and gas by convection. The internal gas flow and convection heat transfer process need to meet the mass conservation equation, momentum conservation equation, and energy conservation equation [29]:
( ρ V ) = 0
ρ ( v ) v = [ p I + μ ( v + ( v ) T ) 2 3 v ( v ) I ) ] + g Δ ρ
ρ C p v T = ( k T ) + Q
where v is the velocity of SF6 gas; k is the material thermal conductivity; p is the SF6 gas pressure; μ is the dynamic viscosity of the fluid; Q is the heating power per unit volume; T is the temperature of the materials; g is the gravitational acceleration; and ▽ρ is the difference in density due to the heating of the gas.
The internal gas is considered an ideal gas and satisfies the ideal gas law:
ρ = M p R T
where M is the molar mass and R is the universal gas constant.
The convective heat transfer satisfies the following equation [29]:
q 0 = h ( T 1 T e x t )
where q0 is convective heat flux, T1 is the surface temperature, Text is the external temperature, and h is the heat transfer coefficient. h is related to the specific shape of the object, and it is generally calculated using the following formula [30]:
h = k L C ( G r P r ) n
where Gr is the Grashof number, Pr is the Prandtl number, C and n are related to the object’s shape and the surface’s condition, and L is the characteristic length.
The thermal radiation satisfies the Stefan–Boltzmann law [31]:
Q r = ε σ A ( T 1 4 T e x t 4 )
where Qr is radiant heat flux, ε is the emissivity, σ is the Stefan–Boltzmann constant, and A is the radiant surface area.

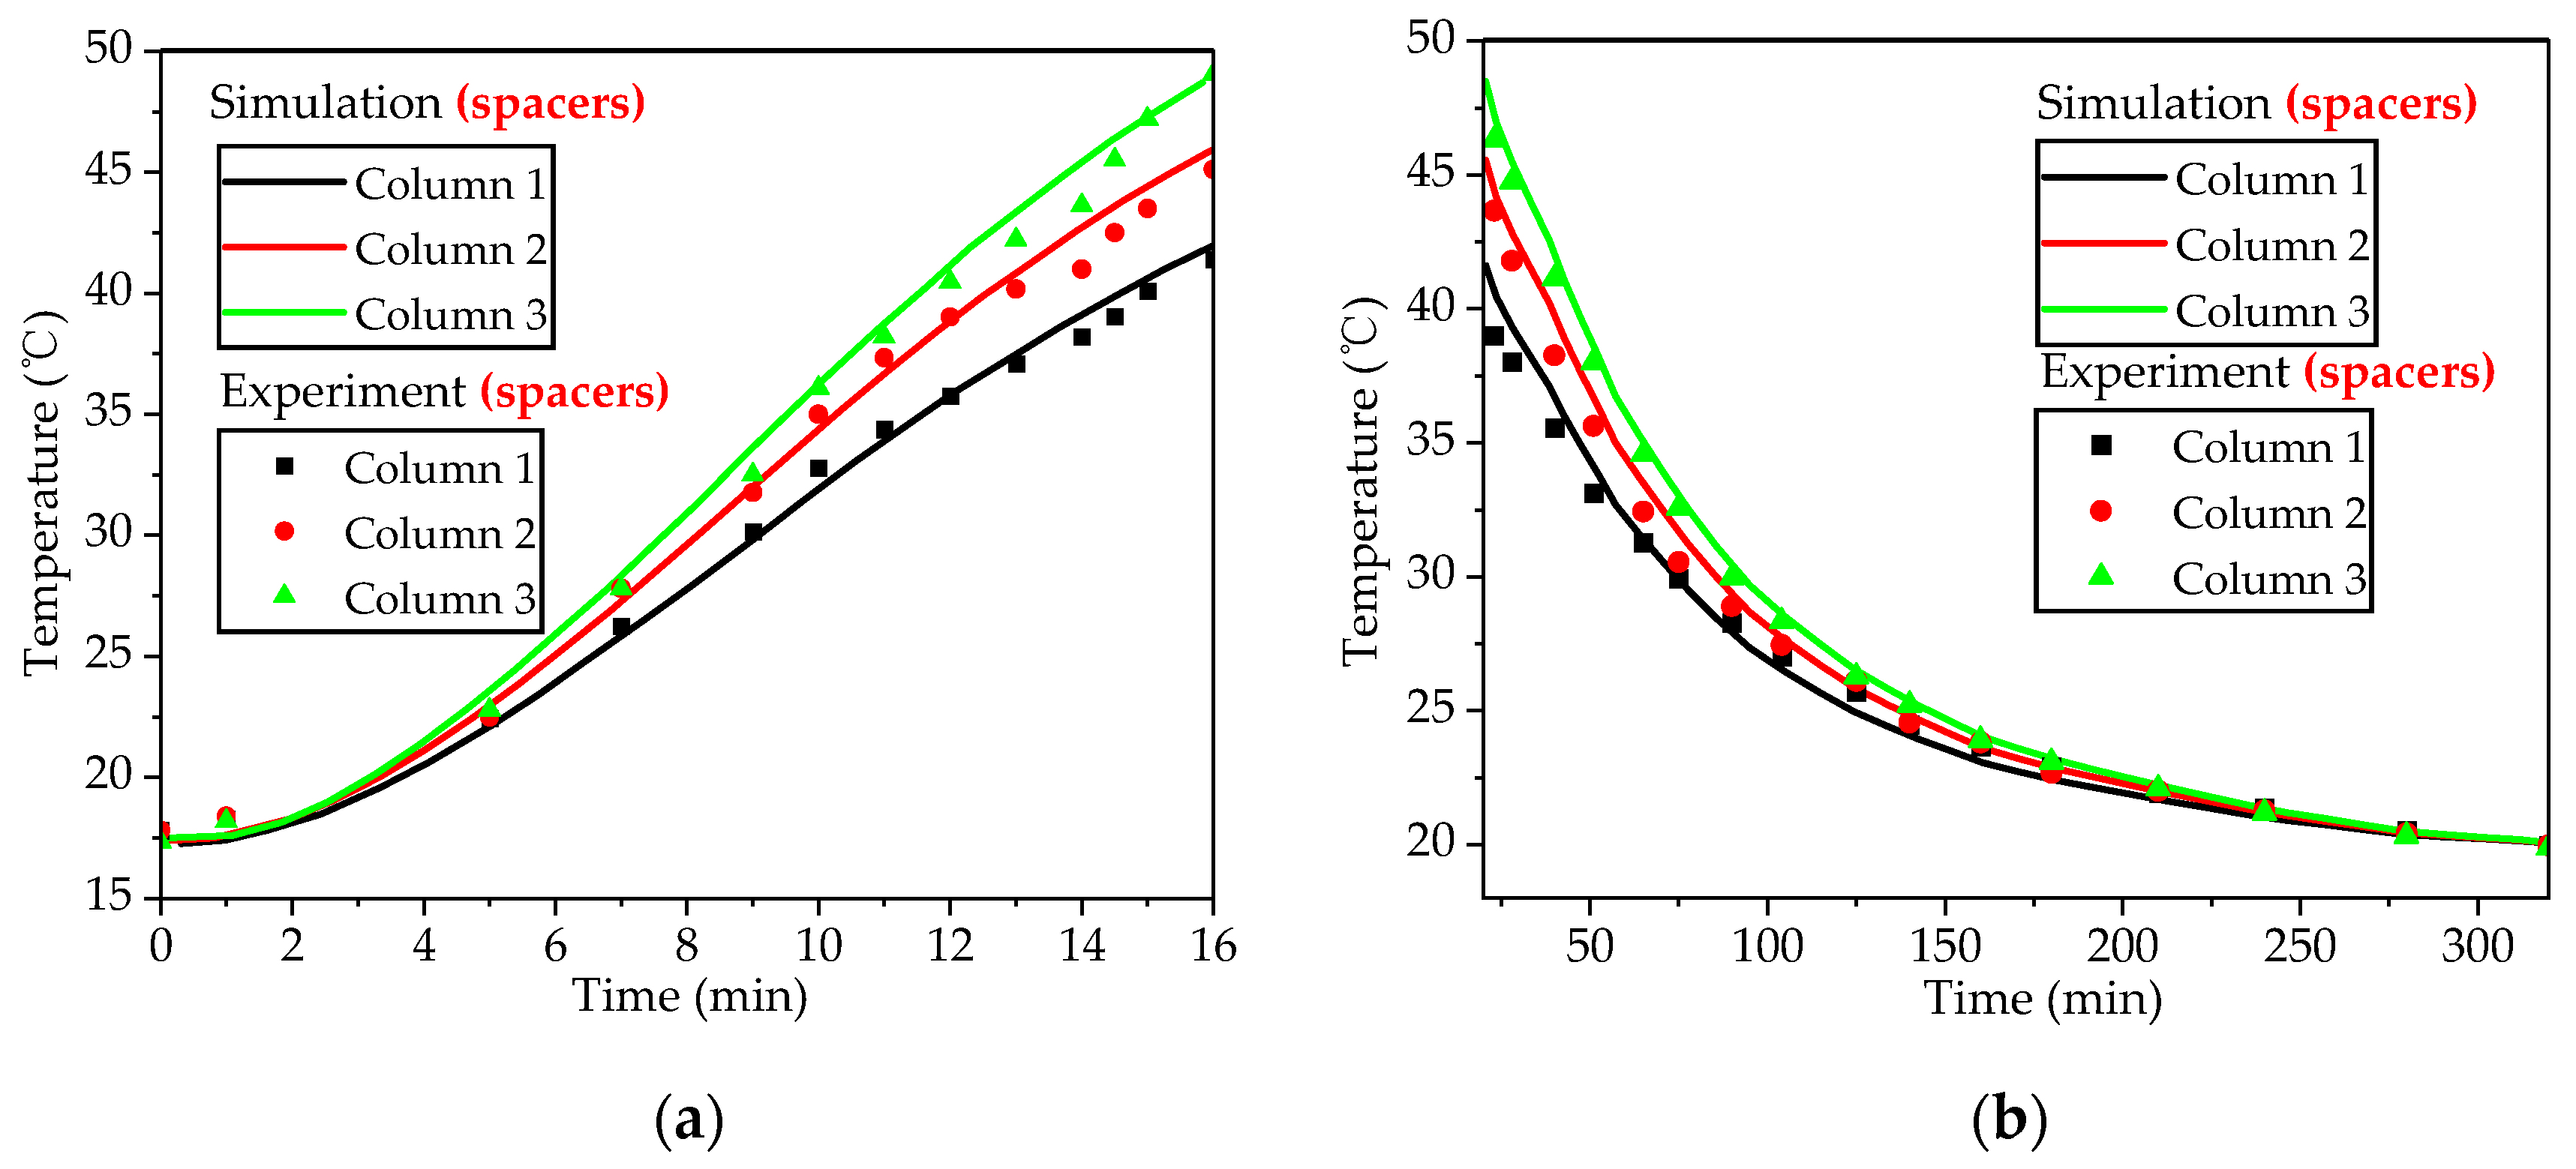
3. Simulation Results and Experimental Validation

3.1. Simulation Parameters

Miniature prototype experiments can simplify complex research objects and physical problems. It can achieve the same goal with less effort and gain experience applying the original prototype. For the miniature prototype to be equivalent to the original prototype, the miniature prototype must be strictly proportional to the original prototype. Miniature prototype experiments can verify the accuracy of the prototype and simulation research methods. Then, the same process is used to research higher-voltage arresters.
Figure 5 presents the model of the ±66 kV DC GIS arrester. It is a miniature model of a ±550 kV DC GIS arrester. The ±66 kV DC GIS arrester core is a three-column parallel spiral stacked structure. Each column is equipped with 13 ZnO varistors in spiral stacking. The miniature prototype structure is like the ±550 kV DC GIS arrester model.
Under the premise of not affecting the calculation accuracy, the structure of the arrester is simplified. The excitation applied by the simulation is a standard 8/20 us lightning impulse current waveform [32,33]. The current density of a single column is 42 A·cm−2. The material settings for each part of the arrester during simulation are shown in the Table 2.
The operating voltage of the ZnO varistor is the 1 mA DC reference voltage [34]. When the voltage is higher than the operating voltage, the resistance of the ZnO varistor drops rapidly, and the corresponding current through the arrester rises rapidly. For the HVDC GISA, the application area is the lower side of the breakdown zone and the high current zone, where tiny voltage changes across the ZnO varistor can result in significant changes in the current through the ZnO varistor [34].
The current density through the ZnO varistor element is determined by [29]
J ( E ) = { A 1 ρ gb exp ( E g β E k b T ) + A 2 ( E E B ) α , J ( E ) < J U D ( T , J ) A 3 ρ g ( E E U ) + J U , J ( E ) > J U
where J is the current density; E is the voltage gradient; A1, A2, and A3 are constant; ρgb is the pre-breakdown resistivity; Eg is the height of double Schottky barriers; ρg is the breakdown resistivity; β is a constant related to the electrical properties and geometrical structure of the ZnO varistors; and D(T,J) is a function of temperature and current density, which can be found in Figure 6.
Due to the dispersive nature of the V-I characteristics of the ZnO varistor, the multi-column arrester has different currents between columns. It also makes the energy absorbed imbalanced between columns. The conductivity of the ZnO varistor is related to the input current and the temperature [35]. As the temperature increases, the conductivity of the ZnO varistor of the high-temperature column increases, resulting in greater current flow into the high-temperature column, which leads to a more significant temperature rise. The positive feedback makes the temperature distribution across the columns increasingly uneven. The mass density ρ, heat capacity Cp, and thermal conductivity k of the materials are set in Table 3. The density and heat capacity of epoxy resin are very little affected by temperature, which is set as constants for simplicity of simulation.

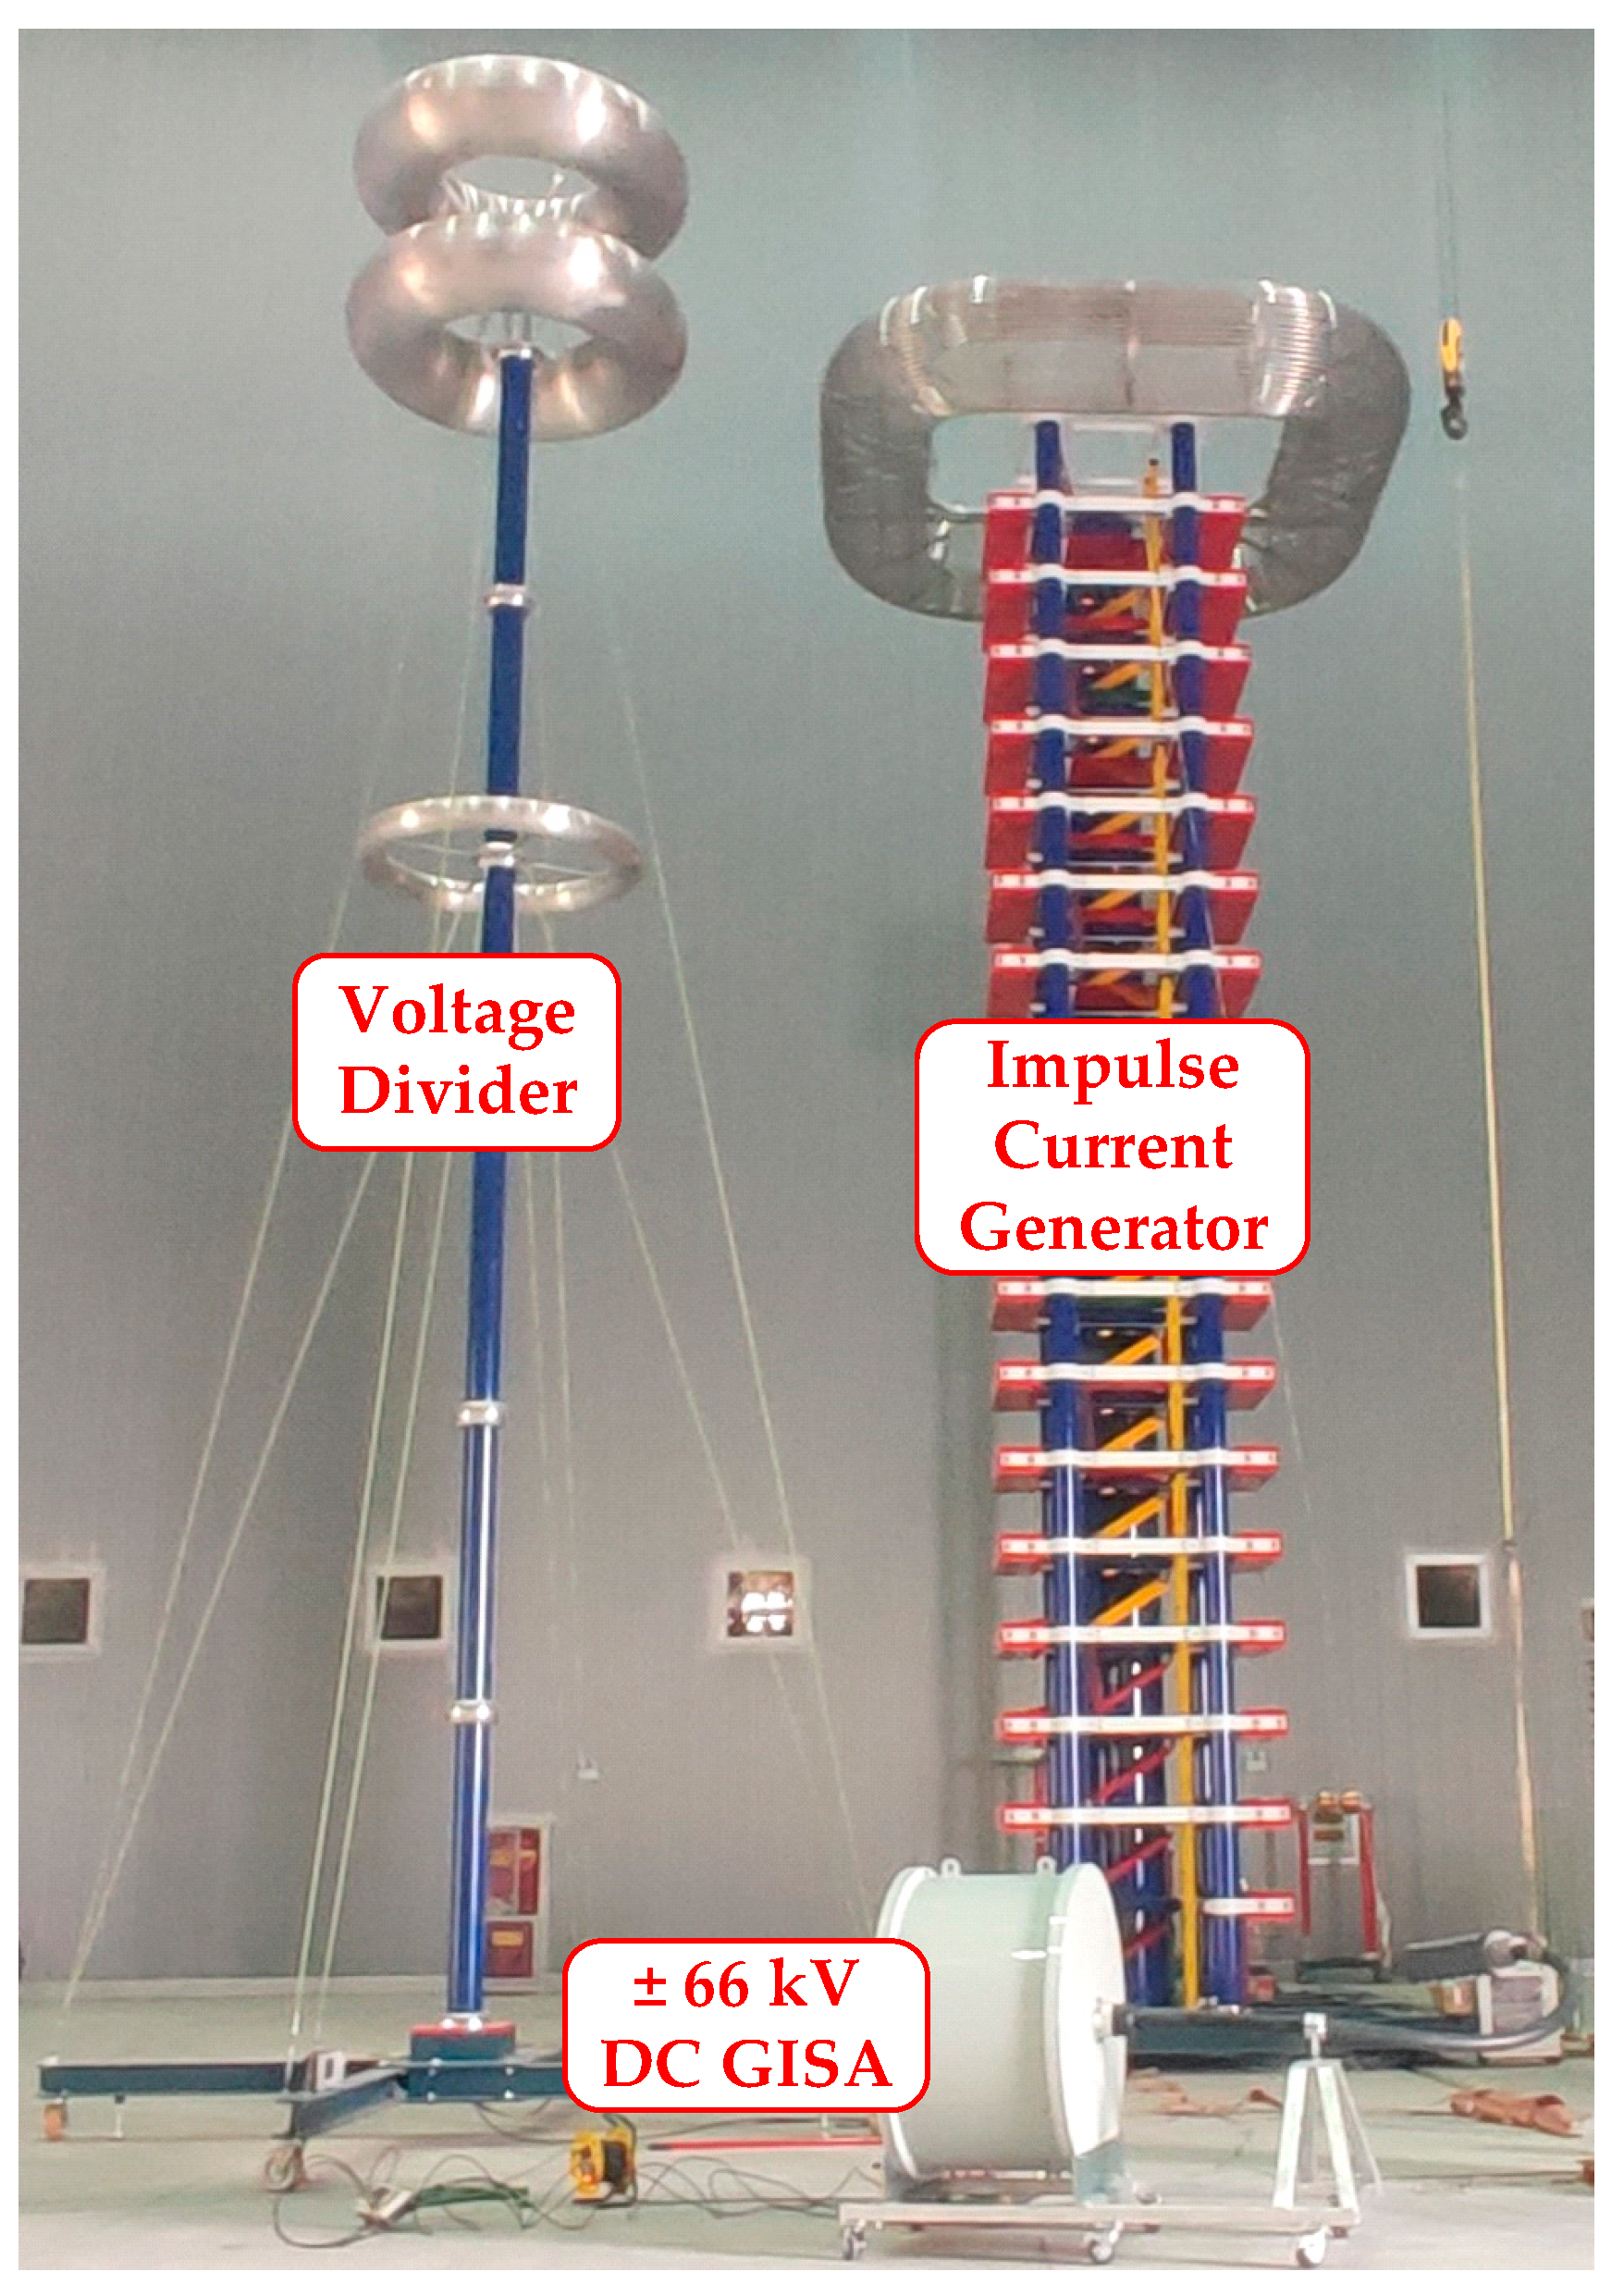
3.2. Experiment Setup

The experiments are conducted according to IEC60099-4 [32]. The experiments are the current distribution experiment and temperature distribution experiment. The current distribution experiment measures the current’s distribution inside the ±66 kV DC GISA at 8/20 us lightning impulse current. The current distribution experiment aims to obtain the arrester prototype’s current distribution and the current amplitude’s influence on the uneven coefficient of current distribution. The temperature distribution experiment measures the arrester’s temperature distribution in a power frequency voltage of 57 kV (RMS). The temperature distribution experiment can obtain the temperature difference of different column ZnO varistors and spacers inside the arrester prototype and then analyze the energy absorption difference.
IEC60099-4 defines the uneven coefficient β of the current distribution of lightning arresters [32]:
β = n × I max / I a r r
where Iarr is the peak value of the total arrester current; Imax is the maximum peak current through any column of ZnO varistors or arrester elements; and n is the number of parallel columns.
The current distribution experimental program includes the following:
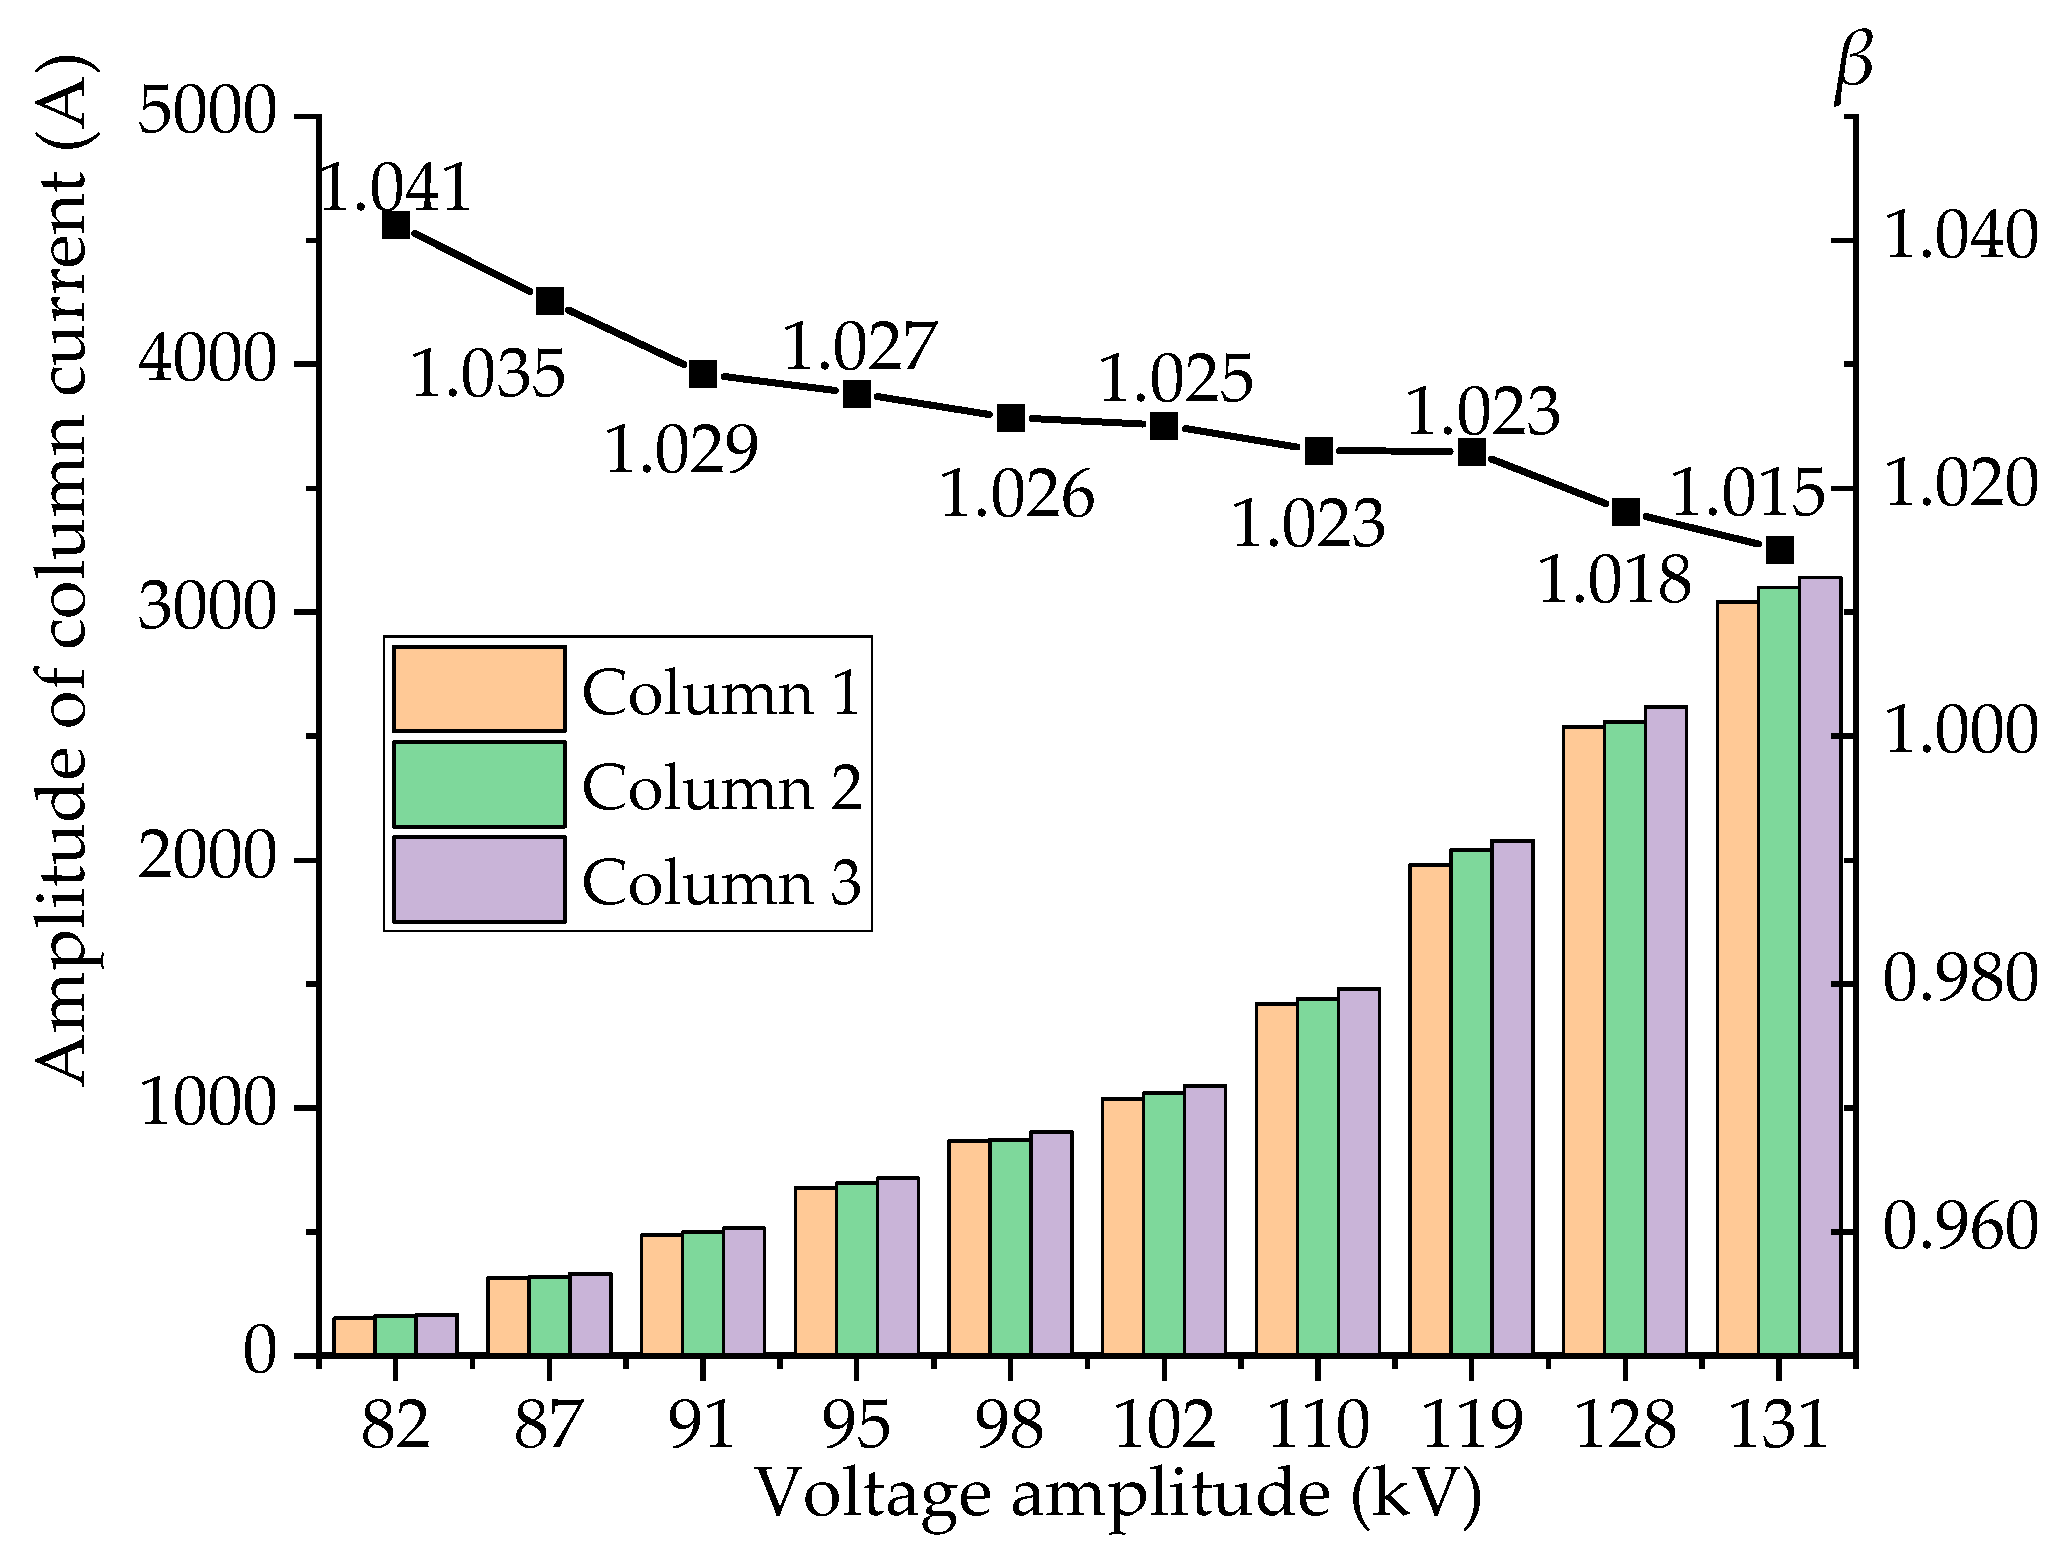
  • The current distribution factor β of the three-column parallel core is measured under the single-column 1000–3000 A amplitude lightning impulse current, and it should be ensured that β is not greater than 1.10;
  • The effect of current magnitude on the homogenization characteristics is determined. The current distribution non-uniformity coefficients under 8/20 us lightning strikes in the range of 1000–3000 A currents in a single-column core are measured separately.
The experimental equipment includes an 8/20 us lightning surge current generator, a ±66 kV DC GISA prototype, a current measuring device, and an oscilloscope. An electrical equipment’s insulation systems are more susceptible to failure under negative polarity voltages. The reference voltage of the surge arrester is of negative polarity. This is significant as lightning overvoltage in power systems is mostly negative polarity, and applying negative polarity voltage can help detect moisture defects more easily. The circuit diagram of the current distribution experiment can be simplified in Figure 7. The current waveform is related to R, L, and C, and the output current amplitude is adjusted by changing the capacitor charge voltage [33]. The impulse current generator is connected to the ±66 kV DC GISA via a connecting cable. The prototype has three columns connected in parallel. In order to easily measure the three-column current, the prototype does not have an internal earth wire. Three cables are connected to the bottom of the three columns separately and make a connection to the three-column current lead terminal of the tank. In the current distribution experiment of the prototype, the three-column current lead terminal of the tank is grounded separately. Three Hall current sensors are used to detect the current of the three columns, and the current data and waveforms are obtained through an oscilloscope. The Hall current sensor selected in this experiment is CSM3000LTF. The current measurement range of CSM3000LTF is 0- ± 4500 A, and the accuracy can reach ±0.3%. The ±66 kV DC GISA outside is equipped with a three-column current measurement junction port, which leads the three-column current out to the measurement device and connects to the oscilloscope.
The power frequency voltage of 57 kV (RMS) is applied. Setting the frequency of the alternating current allows the varistors to accumulate heat and then achieve a stable temperature rise. The maximum temperature is 355 K after loading for 16 min, and then, the internal temperature of the arrester is gradually reduced to room temperature after standing for about 5 h. The temperature change of each part of the arrester is observed by the optical fiber temperature sensor inside and is displayed on the temperature indicator outside.
The ±66 kV DCGISA core is a three-column parallel structure with 13 ZnO varistors and four spacers per column. The ZnO varistors and spacers of the arrester are arranged with 12 temperature measurement points. According to the order of potential from high to low, each column ZnO varistor and spacer is numbered. Arabic numerals are used for ZnO varistors, and Roman numerals are used for spacers. Taking column 2 as an example, the number is shown in Figure 8. The temperature measuring points of the ±66 kV DCGISA prototype are 1-6, I-I, 2-5, II-I, 3-6, and III-I.

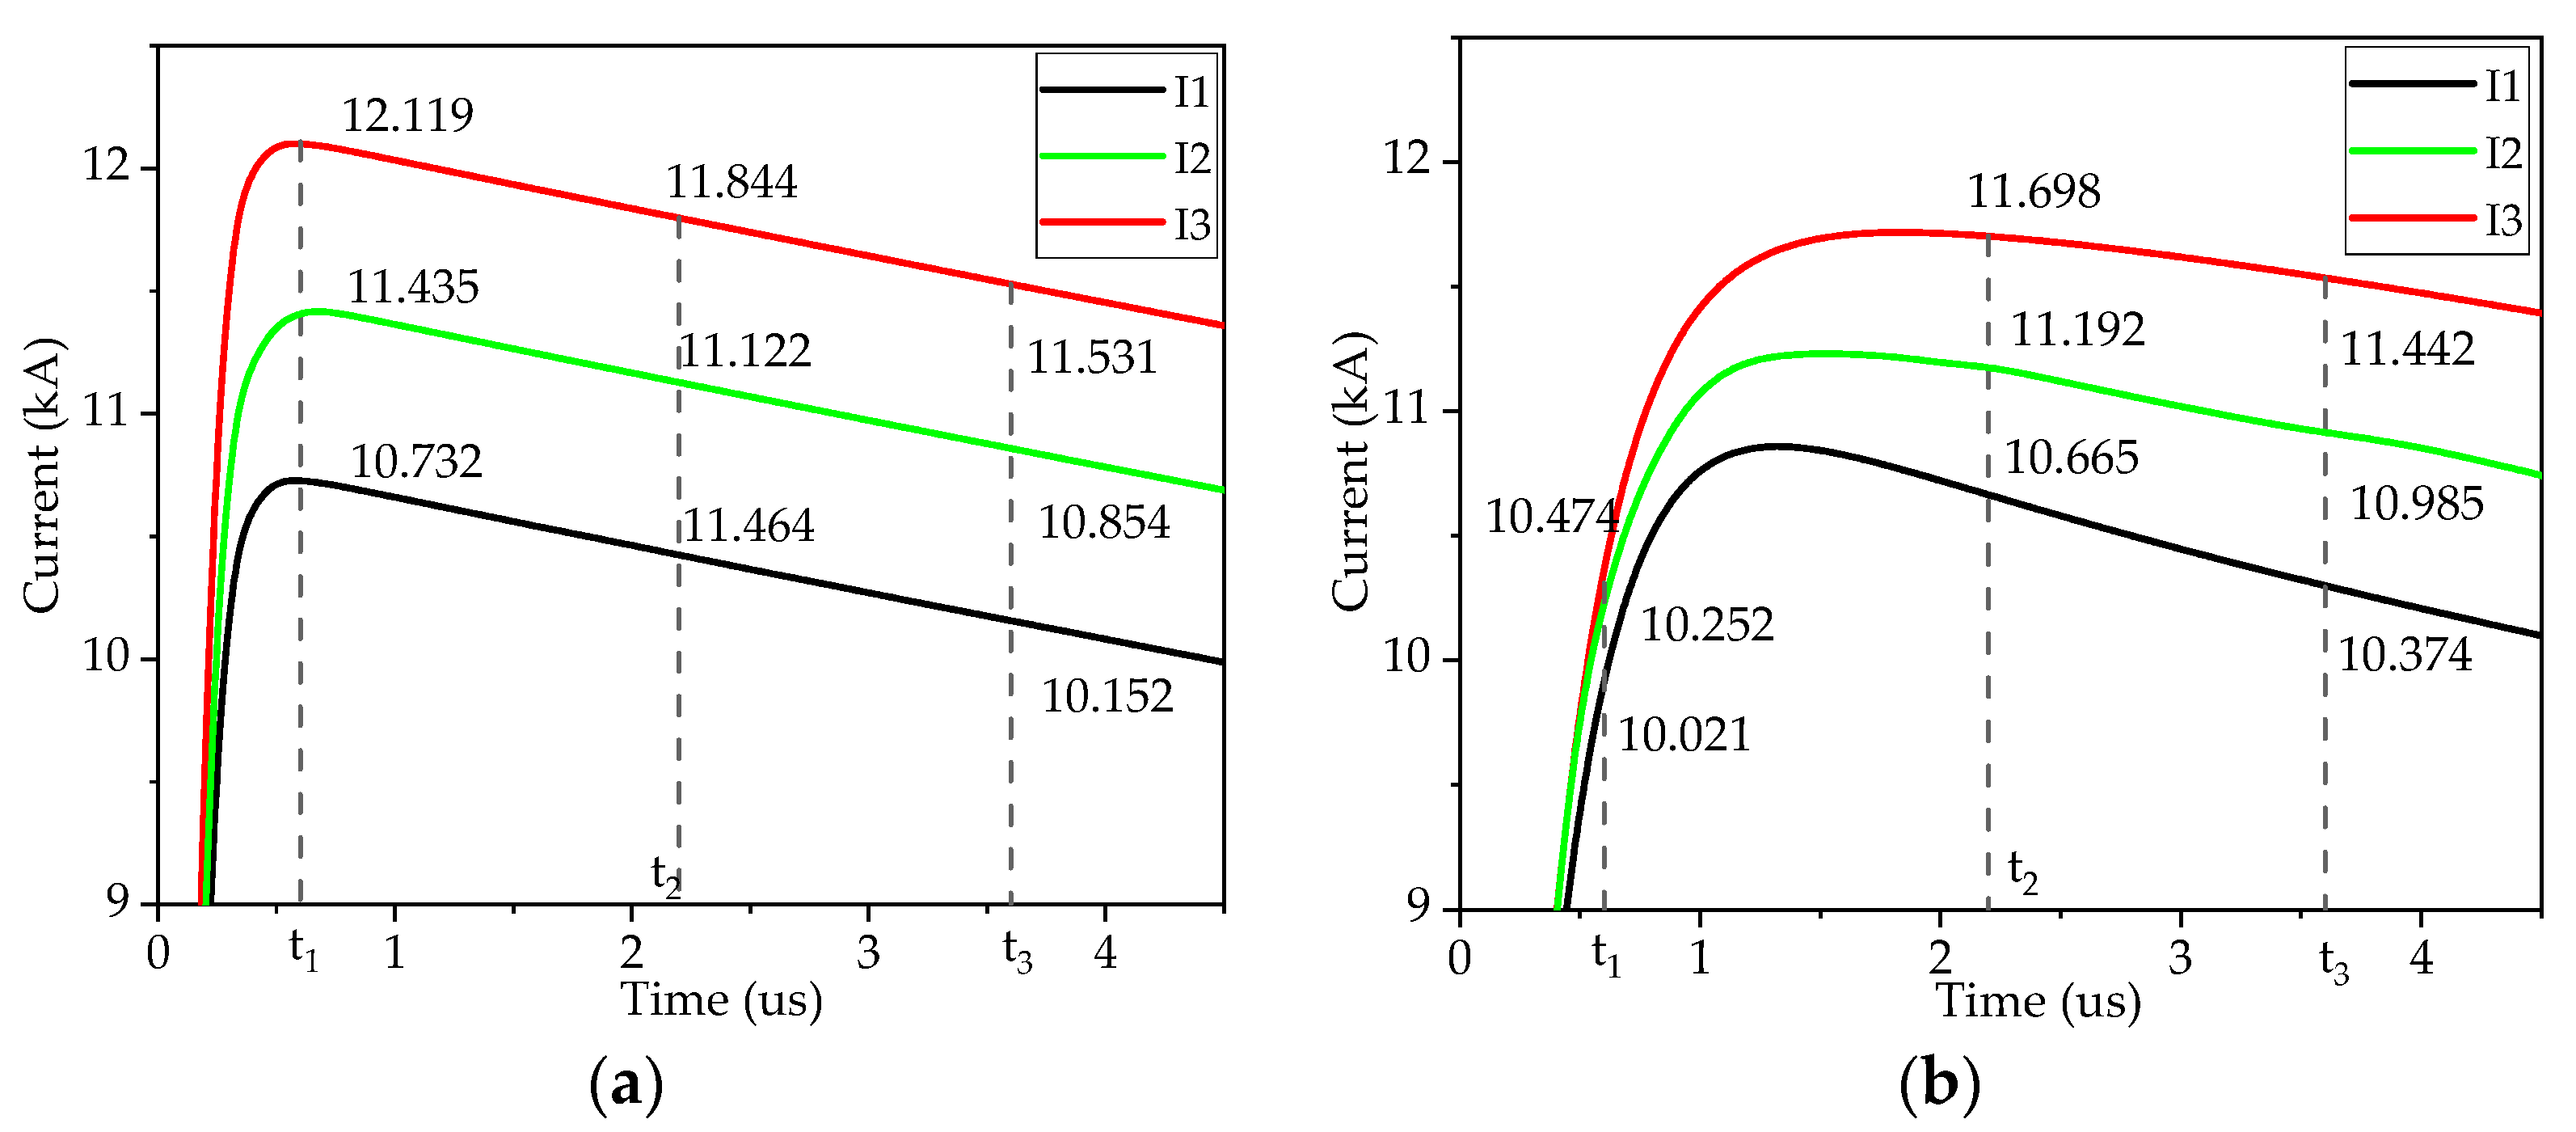
3.3. Simulation Results and Experimental Verification

The capacitor charging voltage of the impulse current generator, the voltage amplitude of the surge arrester, and the current amplitude of each column of the surge arrester are recorded in Table 4. The coefficients of the current distribution corresponding to each group of tests are also calculated. Due to the difference in V-I characteristics of each column, the current through each column is uneven. The current distribution is plotted as a function of the amplitude of the surge arrester in Figure 9. The current of columns 1, 2, and 3 increases sequentially. With the current increase, the coefficient of the current distribution β decreases. When the test voltage is applied to the parallel varistor columns, column 1 has the smallest current, while column 3 has the largest current. When the capacitive charge voltage of the impulse current generator is 90–195 kV, the single-column current is between 154 and 1270 A. The residual voltage range of the arrester is 82–105 kV. When the capacitor charging voltage is 90 kV, the total current amplitude flowing through the arrester is 484 A, and the residual voltage of the arrester is 82 kV. The currents of column 1, column 2, and column 3 are 154 A, 162 A, and 168 A respectively. The non-uniform coefficient of the current distribution is the maximum 1.041. When the capacitor charging voltage is 375 kV, the total current amplitude through the arrester is 9280 A, and the residual voltage of the arrester is 131 kV. The currents of columns 1, 2, and 3 are 3040 A, 3100 A, and 3140 A, respectively, and the non-uniform coefficient of current distribution is the minimum 1.015.
Figure 10 compares the three-column ZnO varistors’ simulation and experiment comparison results. It is a comparison diagram of the temperature rise process and temperature drop process of the ZnO varistors. Figure 11 illustrates the simulation and experiment comparison results of the three-column spacers. It is a comparison diagram of the temperature rise process and temperature drop process of the spacers. Lines and dots are used to represent the simulation and experiment results. The three colors correspond to the situation on the three columns.
From the simulation results of the ZnO varistors, the maximum temperature of column 1 is 76.60 °C, the maximum temperature of column 2 is 63.90 °C, and the maximum temperature of column 3 is 80.50 °C. From the experiment results of the ZnO varistors, the maximum temperature of column 1 is 74.39 °C, the maximum temperature of column 2 is 62.41 °C, and the maximum temperature of column 3 is 77.30 °C. The difference between the experimental results and the simulation results is within 3.9%. This is mainly due to imprecise simulation settings and experimental measurements.
The currents of columns 1, 2, and 3 increase sequentially. According to the thermal effect of current flowing through varistor, the column with a higher current accumulates more heat and the temperature rises faster for the same structure. The temperature rise of the ZnO varistor increases sequentially as well. Combining the experimental results in Figure 10 and Figure 11, the experimental results are in accordance with the theoretical analyses. The lowest temperature in column 2 in Figure 10 is due to the special measurement point chosen. The column 2 ZnO varistor’s temperature measurement points are 2–5, as shown in Figure 8. This ZnO varistor is relatively close to spacer II-II.
Due to the significant difference in the conductivity of the materials, the rise in temperature of the ZnO varistor is greater than that of the spacer. It promotes the temperature transfer between the ZnO varistor and the spacer. During the temperature rise, the temperature of the ZnO varistors near the spacers is lower, and their temperature away from the spacers is higher. Placing spacers around the ZnO varistors can reduce the temperature rise and improve their reliability. The time for the temperature to be lowered to room temperature is about 300 min. The simulation results show that the temperature of the three ZnO varistors decreases from 76.60 °C, 62.90 °C, and 80.50 °C to 20.00 °C. The experimental results show that the temperature of the three ZnO varistors decreases from 74.39 °C, 62.41 °C, and 76.30 °C to 20.80 °C. The temperature of the ZnO varistor in column 2 is low, and the descent process is gentle. In Figure 10, the simulation results agree with the experimental results. The maximum error of the ZnO varistor in column 1 is 2.98% at 14 min. The maximum error of column 2 ZnO varistor is 4.30% at 14 min. The maximum error of the ZnO varistor in column 3 is 4.60% at 14 min.
From the simulation results of the spacers, the maximum temperature of column 1 is 48.50 °C, the maximum temperature of column 2 is 45.70 °C, and the maximum temperature of column 3 is 42.90 °C. From the experiment results of the spacers, the maximum temperature of column 1 is 47.34 °C, the maximum temperature of column 2 is 44.12 °C, and the maximum temperature of column 3 is 41.76 °C. In both the simulation and experimental results, the maximum temperature of the column 1, 2, and 3 spacers increases sequentially. This is based on the current in Figure 9. The temperature of the column ZnO varistor with a high current is higher. The temperature difference between the adjacent ZnO varistor and the spacer is even greater. The ZnO varistor and spacer have more heat conduction energy. The temperature of the spacer is higher, and the temperature of the ZnO varistor adjacent to the spacer is lower in Figure 10. In Figure 11, the temperature of the three-column spacer gradually reduces to room temperature. The maximum error of the spacer in column 1 is 2.54% at 14 min. The maximum error of the column 2 spacer is 4.74% at 14 min. The maximum error of the spacer in column 3 is 4.45% at 14 min.

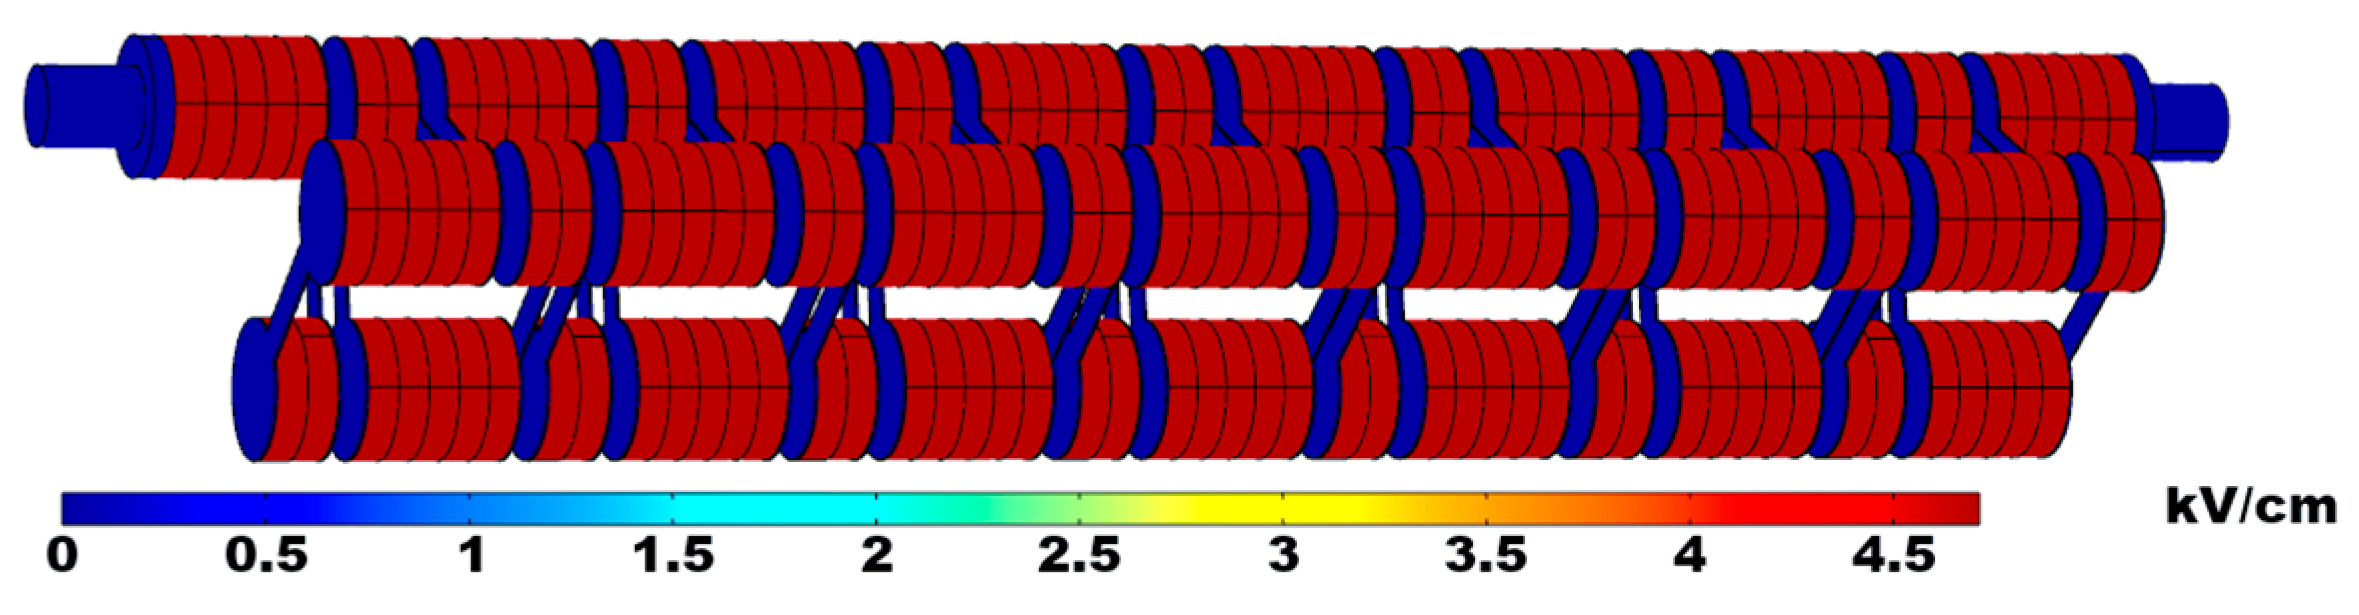
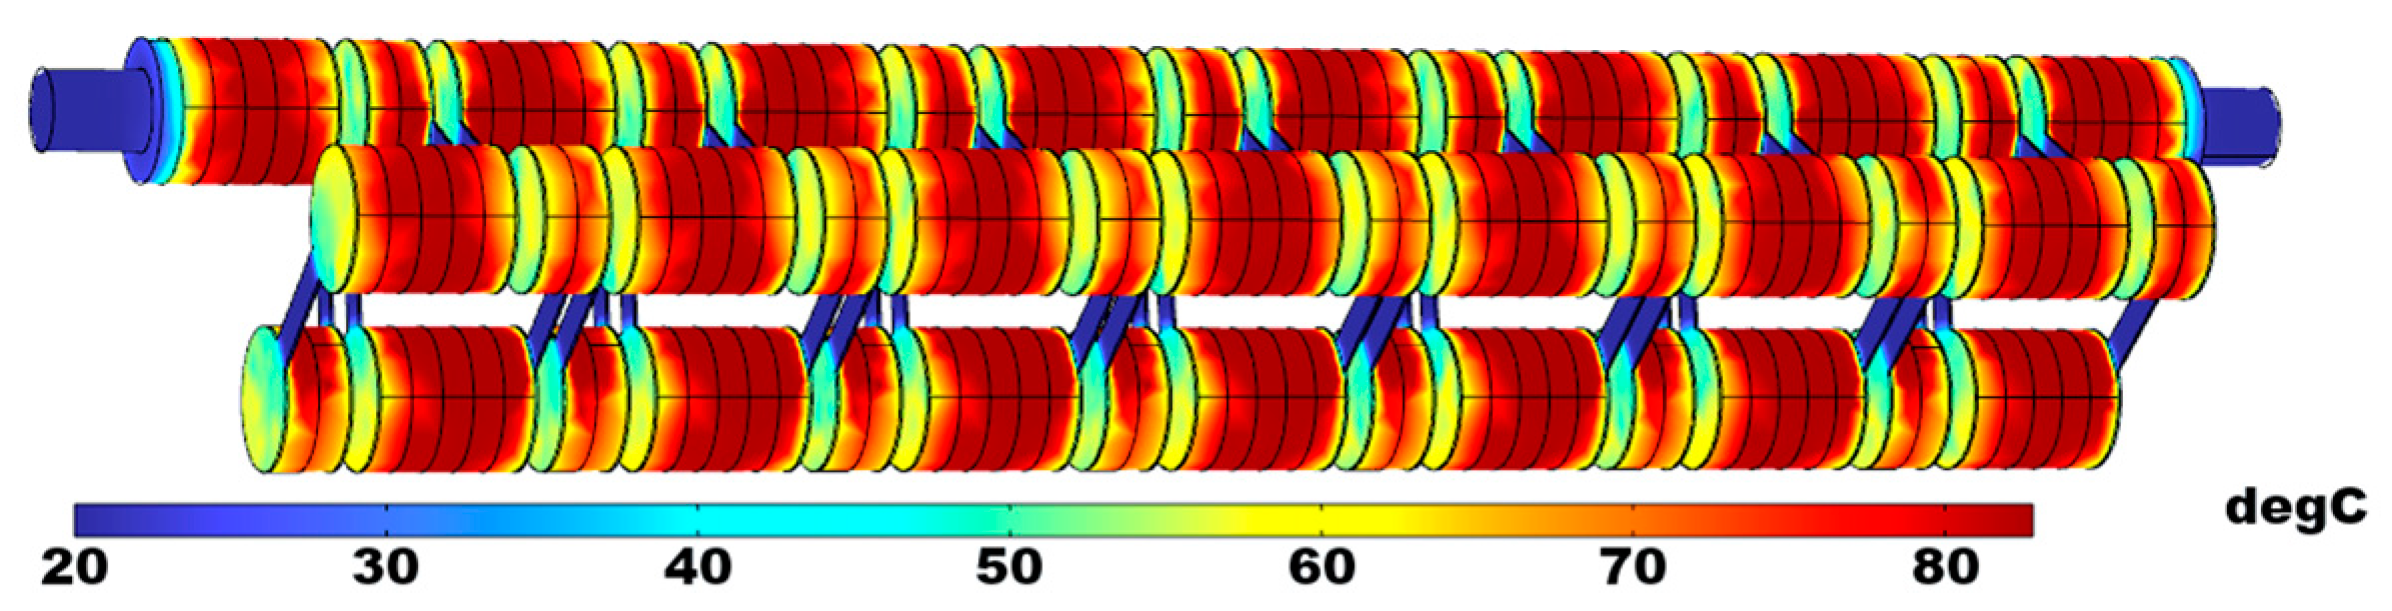
3.4. Simulation Results of ±550 kV DC GISA

Energy is injected at the arrester’s terminal to raise the temperature of the arrester ZnO varistor to about 80 °C. The simulation settings are consistent with those in Section 3.1. The three-dimensional model of the ±550 kV DC GISA is appropriately simplified for the multi-physics simulation. After the simulation analysis, the electric field distribution, magnetic field distribution, and temperature distribution are obtained. The insulating parts and the arrester tank do not affect the results of the core, and the electromagnetic field and temperature changes in these parts are not significant. Only the core part is displayed when analyzing the results. The three-dimensional electric field distribution of the arrester core is shown in Figure 12.
The maximum field strength is 4.85 kV/cm at the ZnO varistors. The ZnO varistors are surrounded by insulating boards and rods acting as supports. Due to this spiral structure, the electric field on the upper and lower surfaces of the insulating board is very different. It is necessary to pay attention to the dielectric strength in these parts.
In Figure 13, the magnetic flux is mainly distributed around the spacers connected to the ZnO varistors, and there is relatively little around the ZnO varistors. The value goes from small to large as the color changes from gray to red. The red arrows on the section indicate the direction of the magnetic field. As can be seen from the distribution of the magnetic field in the cross-section, the magnetic field is mainly distributed inside the spiral structure. The simulation results show that the self-generated inductor of the ±550 kV DC GISA single-column spiral core is 6.4 μH. The calculation of the self-generated inductor satisfies
L = W I 2
where W is the total magnetic energy in the entire space and I is the value of the current passing through the conductor.
The ZnO varistors have the most significant temperature rise of the arrester. When the temperature of the ZnO varistors rises from 20 °C to 85 °C, the maximum temperature of the spacers is 45 °C in Figure 14. Most of the injected overvoltage energy is absorbed by the ZnO varistors. The thermal conduction of the spacers and the ZnO varistors increases the temperature of the spacers. The temperature of the ZnO varistors near the spacers is relatively low. Heat is transferred from the ZnO varistors to other locations, mainly in heat conduction and convection. Heat conduction occurs in solid parts with temperature differences, and thermal convection occurs between solids and gases. The difference in V-I characteristics of each column ZnO varistors leads to uneven current distribution between columns. This leads to uneven temperature distribution of each column ZnO varistor. The temperature of the ZnO varistors near the spacers is lower, and the temperature of the ZnO varistors away from the spacers is higher. The temperatures of the ZnO varistors in the three columns away from the spacers are selected for a comparison. The highest temperature among the three ZnO varistors are 78 °C, 81 °C, and 85 °C. The temperature difference of the ZnO varistors under the same conditions is 7 °C. More critically, the higher the temperature, the greater the conductivity of the ZnO varistors. It is positive feedback, resulting in a higher temperature difference. This situation is detrimental to the continuous and reliable operation of the arrester.

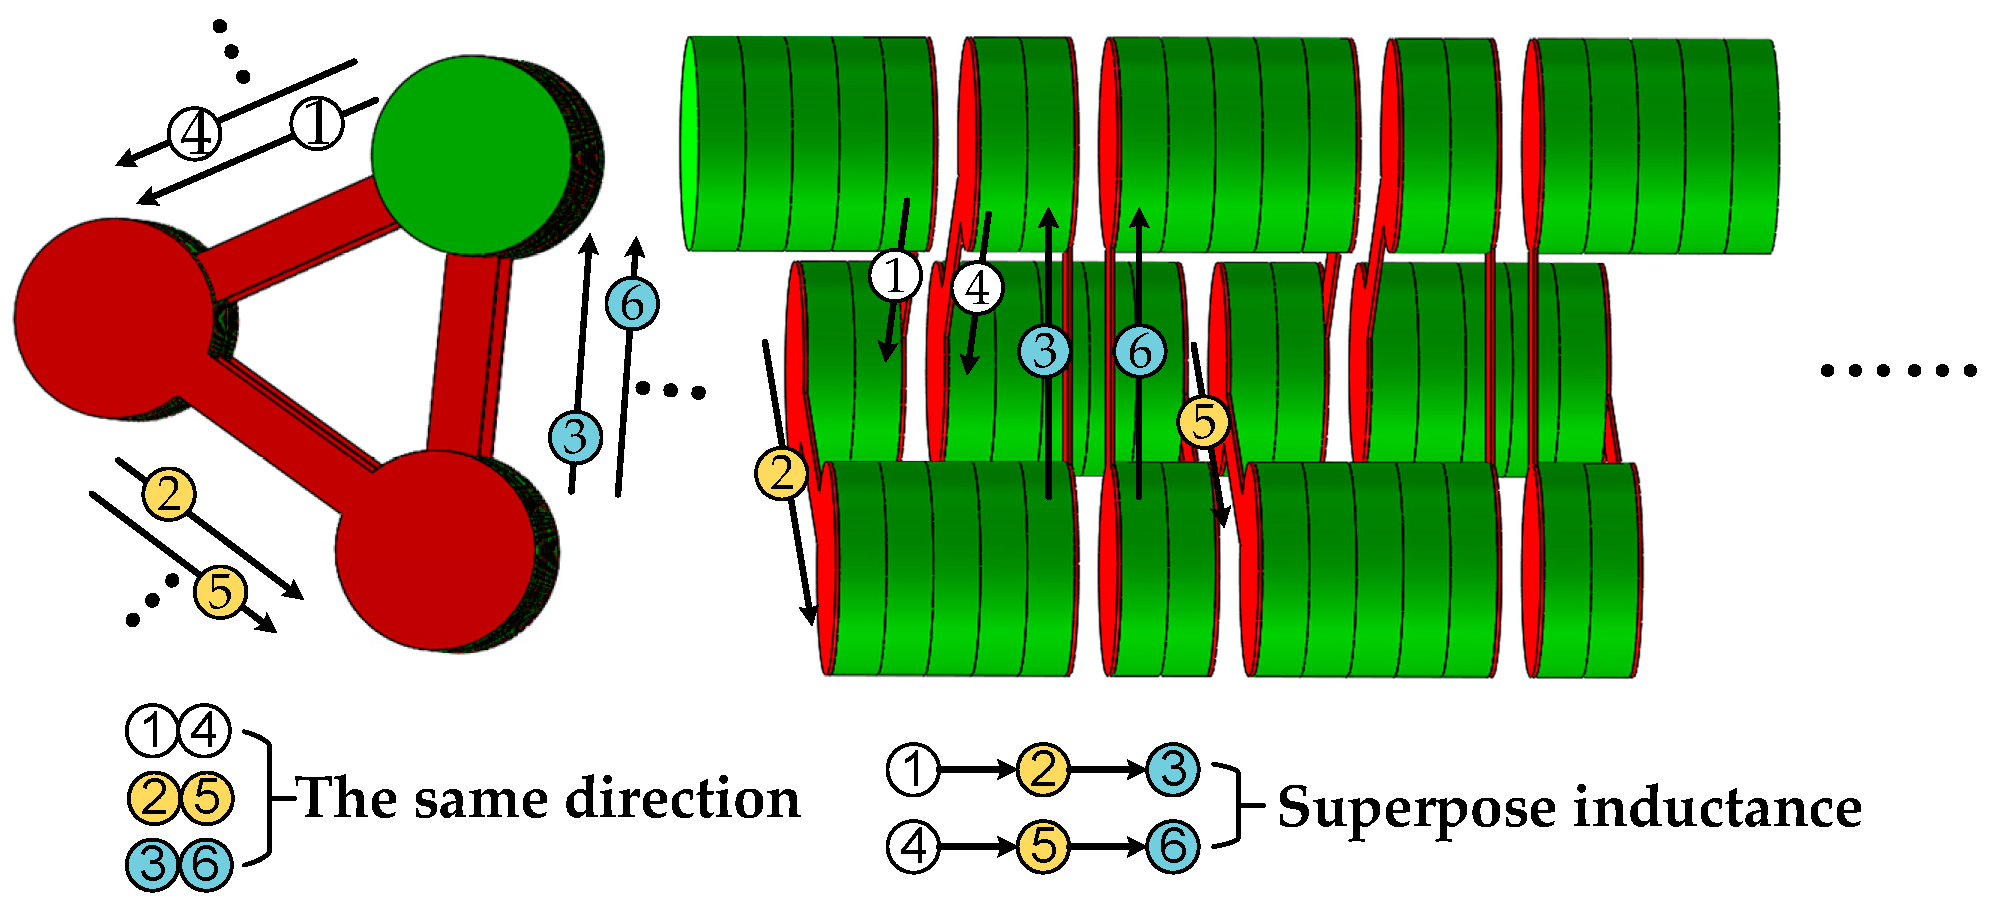
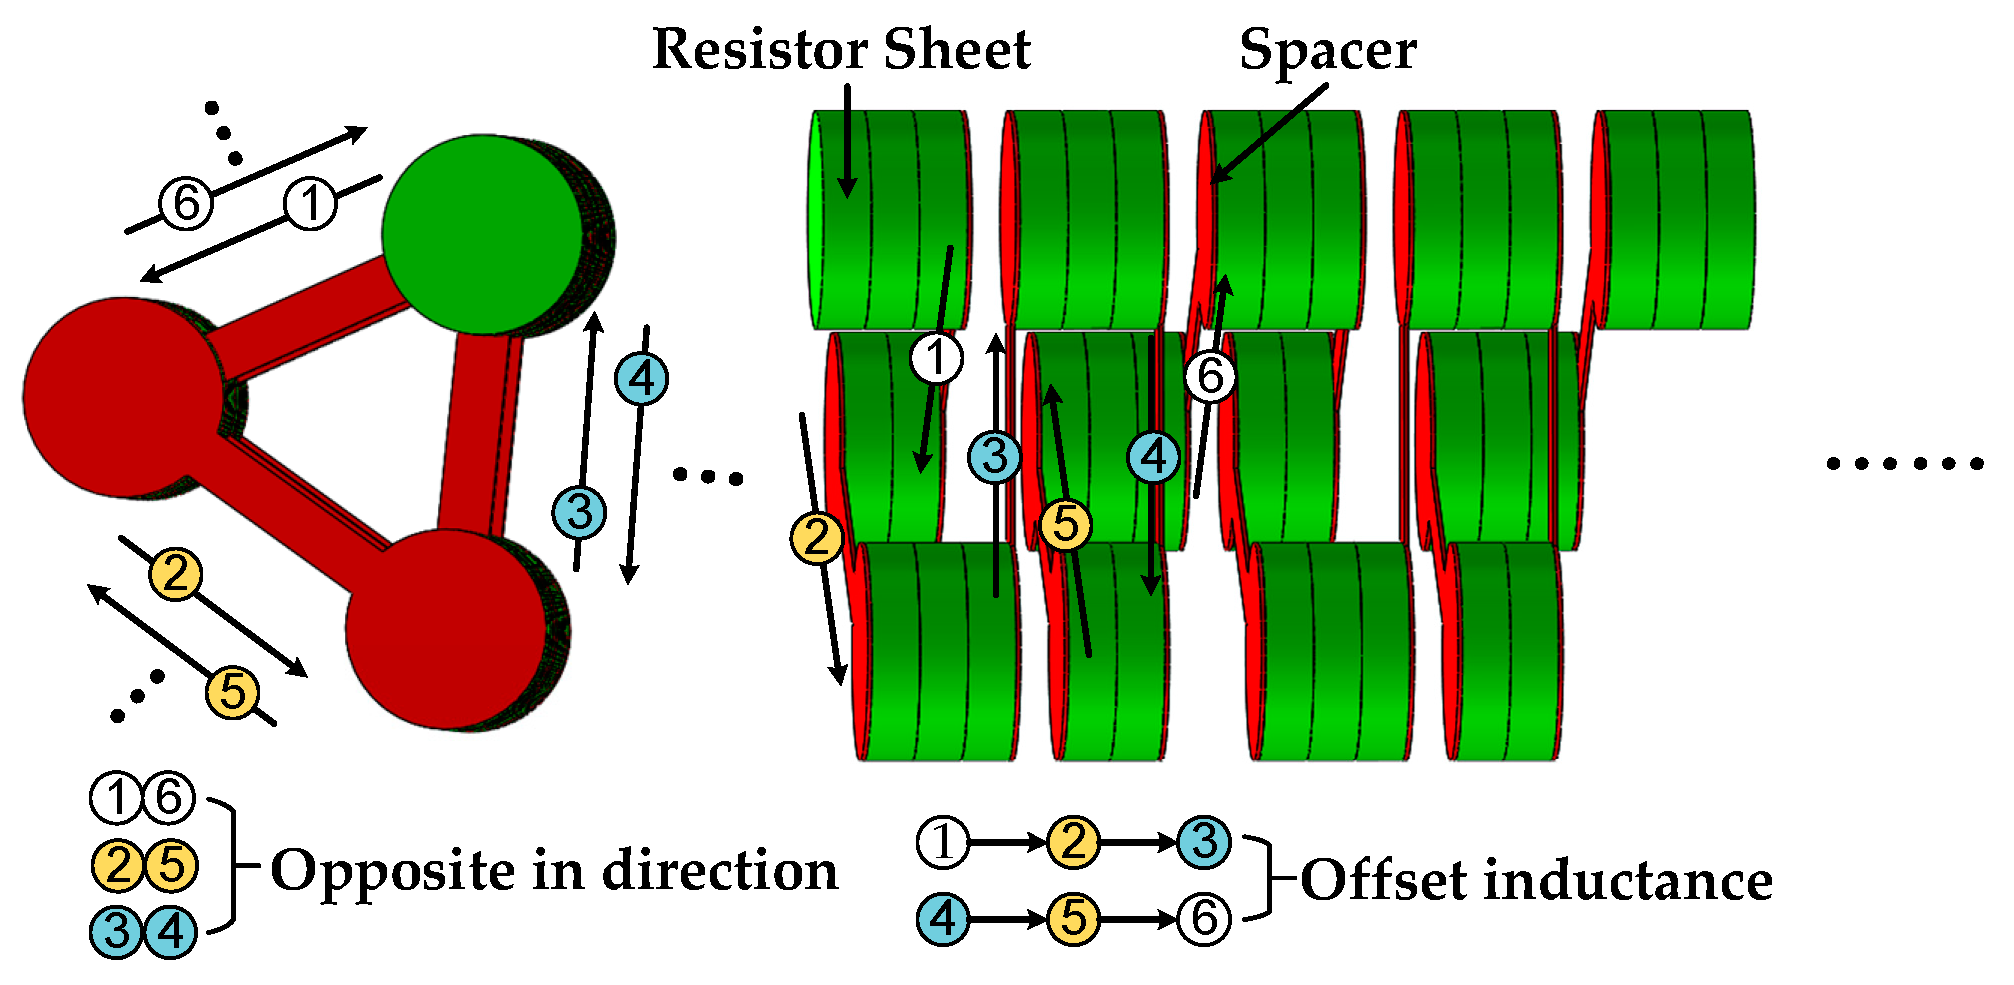
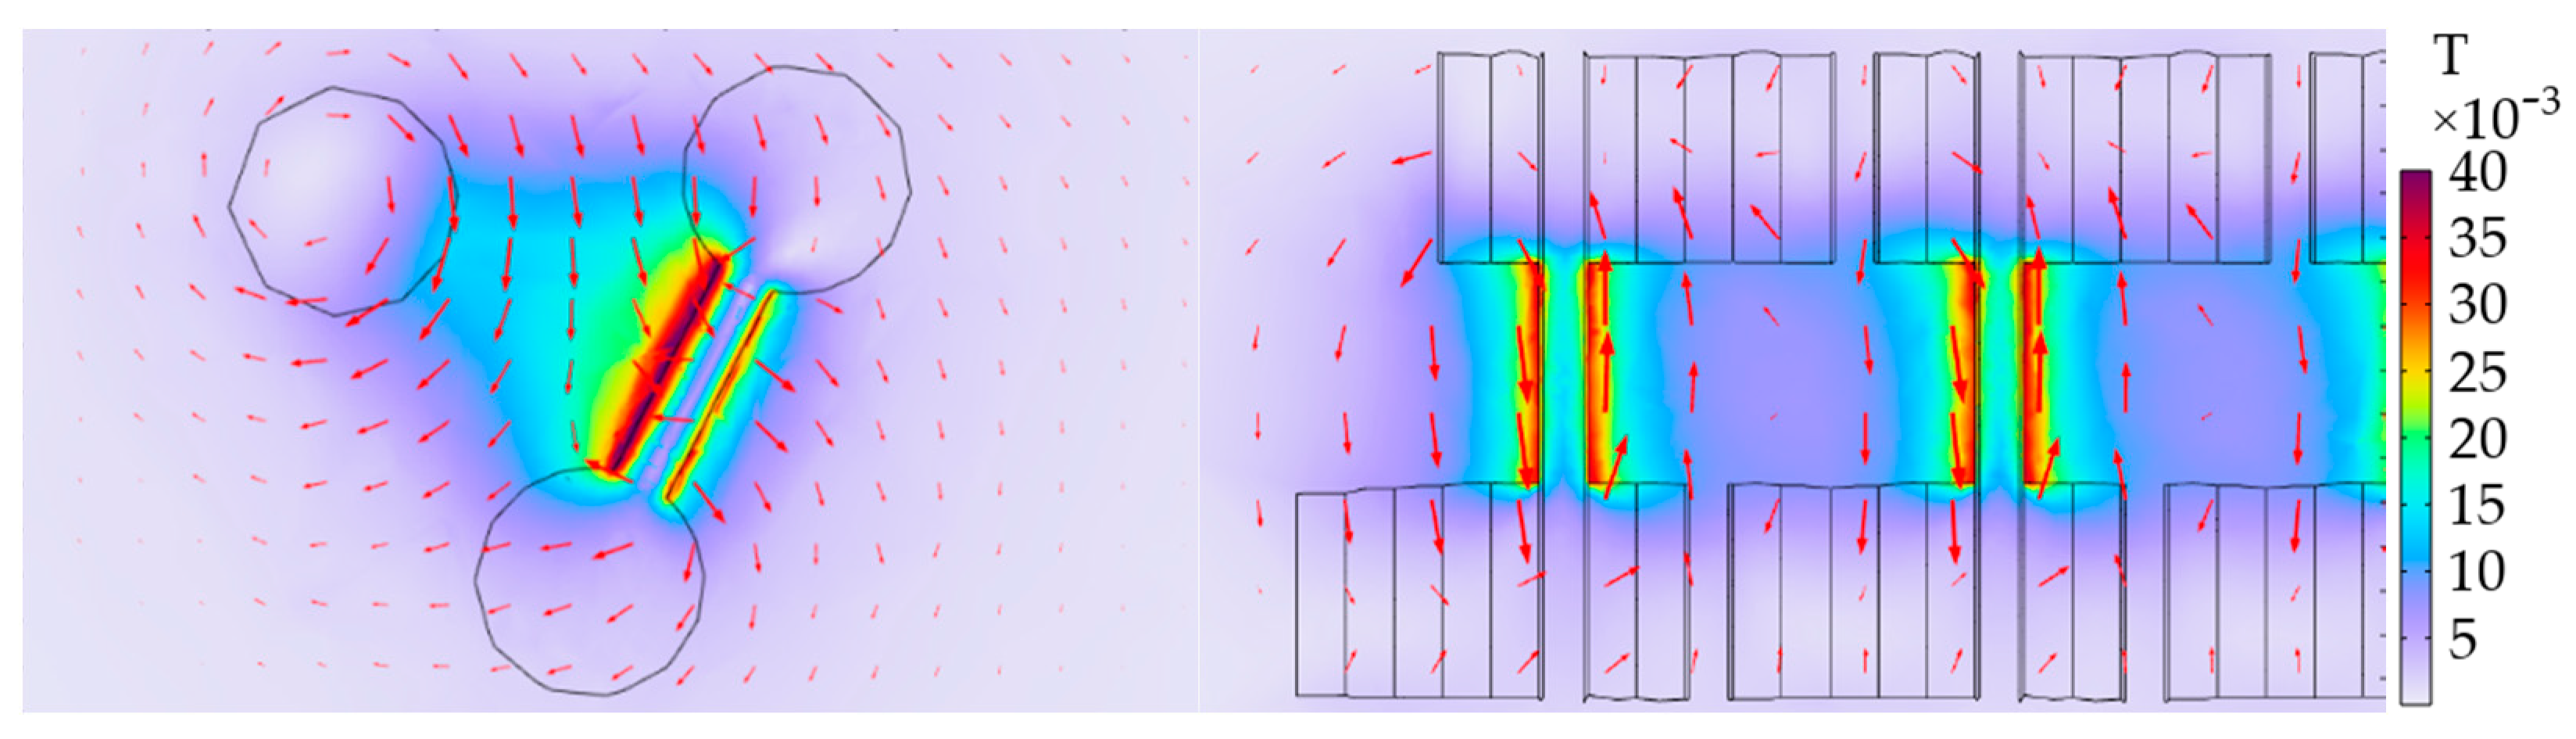
4. Verification of Self-generated Inductor Current Uniformity

Even a minimal difference in the V-I characteristic curve can lead to a large deviation in the current between columns. According to the above simulation calculation, the self-generated inductor of the spiral core of the ±550 kV DC GISA is calculated by simulation to be 6.4 μH. The core can be regarded as three 6.4 μH self-generated inductors connected in parallel by three columns, as shown in Figure 15.
When a variable voltage is applied to the arrester, the current of each column changes, and the current of each column is different due to the difference in V-I characteristics. When the impulse current rapidly changes, a voltage drop occurs on the inductor. The greater the rate of change in the inrush current, the greater the voltage drop on the inductor. Due to the difference in the nonlinear V-I characteristics of the three columns of the arrester, the inductor voltage of the column with a more significant current change rate is larger, so the voltage of the ZnO varistor is smaller, and the current of the column decreases to achieve current uniformity, as shown in Figure 16.
The function of the self-generated inductor of each column is to dynamically correct the current between the columns and reduce the uneven coefficient of current distribution between the columns. The arrester is simulated as three columns in parallel. The nonlinear V-I characteristics of each column are set to make the coefficient of the current distribution different. The 1 mA reference voltage of the ZnO varistor columns is set to 600 kV, 640 kV, and 680 kV, respectively. The three-column current distribution characteristic curve is plotted when a variable voltage is loaded for the three-column parallel arrester. Figure 17a shows the current distribution of the three-column arrester with a linear structure; Figure 17b shows the current distribution of a three-column arrester with a spiral structure (6.4 μH inductor in series).
Three identical moments are selected to calculate the non-uniform current distribution coefficient and current deviation coefficient of the three columns in parallel. When the single-column has no inductor in series, the three-column currents corresponding to t1 are 10.732 kA, 11.435 kA, and 12.119 kA; the three-column currents corresponding to t2 are 10.464 kA, 11.122 kA, and 11.844 kA; and the three-column currents corresponding to t3 are 10.152 kA, 10.854 kA, and 11.531 kA. The current deviation coefficients for these three moments are 1.061, 1.063, and 1.063, respectively. When the single column has a 6.4 μH inductor in series, the three-column currents corresponding to t1 are 10.021 kA, 10.252 kA, and 10.474 kA; the three-column currents corresponding to t2 are 10.665 kA, 11.192 kA, and 11.698 kA; and the three-column currents corresponding to t3 are 10.374 kA, 10.985 kA, and 11.442 kA. The current deviation coefficients for these three moments are 1.021 kA, 1.044 kA, and 1.045 kA, respectively. The current deviation coefficients of the three moments in Figure 17a are 6.1%, 6.3%, and 6.3%. The current deviation coefficients of the three moments in Figure 17b are 2.1%, 4.4%, and 4.5%. The current deviation coefficients are reduced by 28–65%. The self-generated inductor of the spiral structure has a significant current-sharing effect on the multi-column parallel arrester.

5. Conclusions

This paper proposes a new scheme for the current uniformity of a ±550 kV DC GISA using a spiral-stacked core self-generated inductor. The research focuses on the electrical–magnetic–thermal-flow multi-physics simulation of a ±550 kV DC GISA and the current uniformity of the spiral structure of the self-generated inductor. A simulation and an experiment of the miniature model validate the simulation method and model. The spiral-stacked arrester tank’s electric field and temperature distribution are obtained. The results of the study are summarized below.
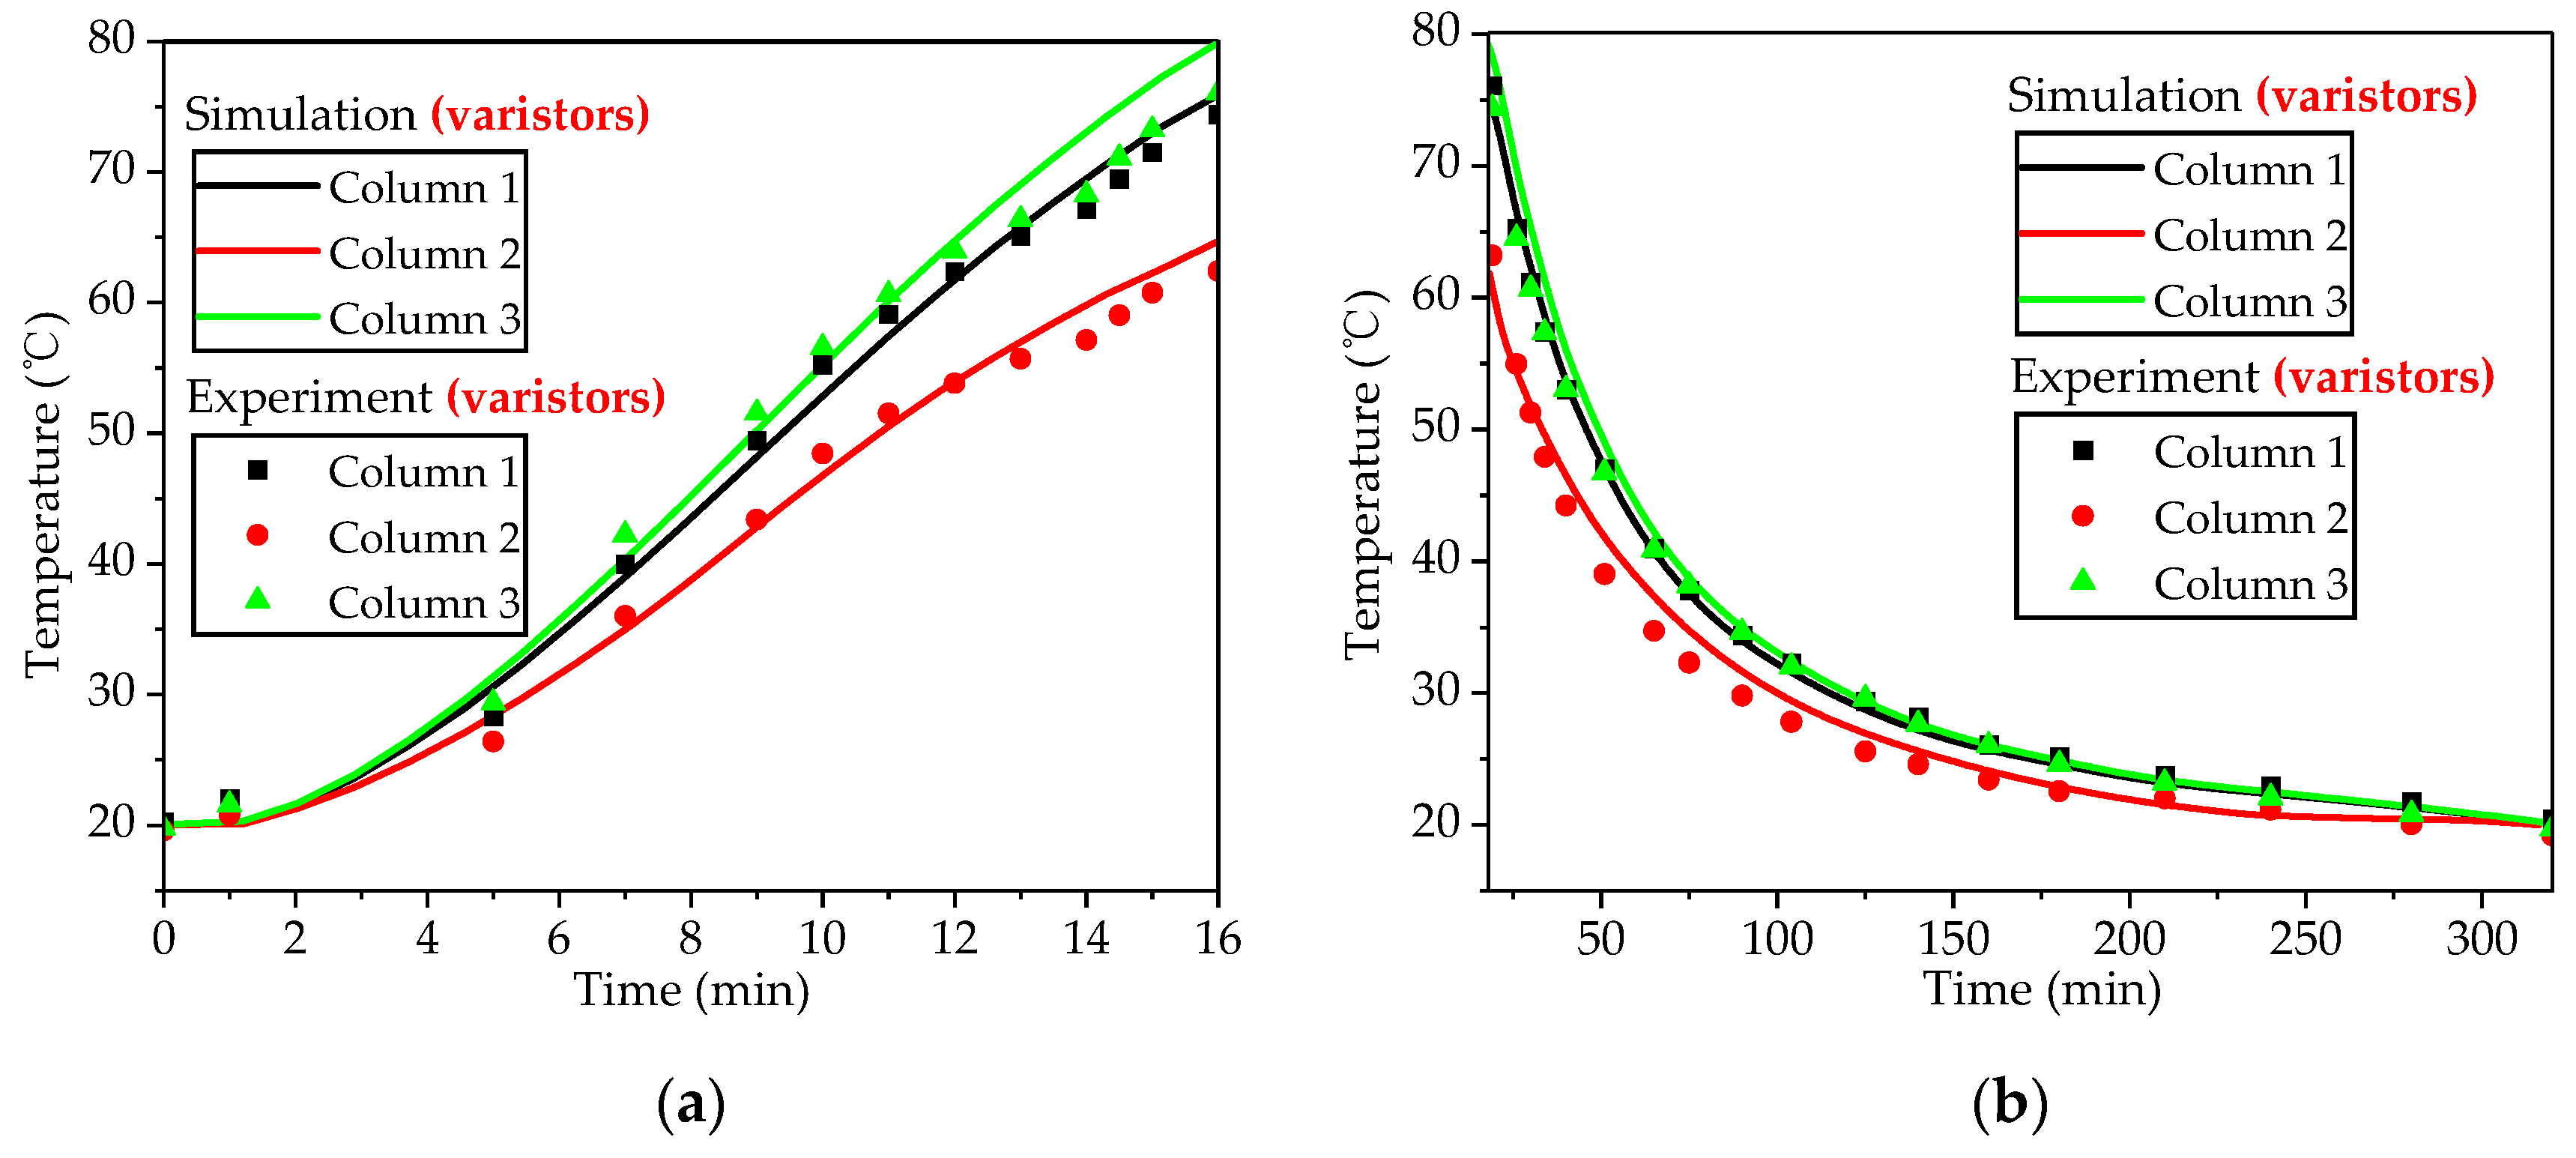
  • The spiral structure of the ±550 kV DC GISA core reduces the length of the core by 56.25%. In the simulation results of the ±550 kV DC GISA, the maximum electric field strength is 4.85 kV/cm. The self-generated inductor of the ±550 kV DC GISA spiral structure is calculated to be 6.4 μH. The temperature difference of the ZnO varistors under the same condition is 7 °C.
  • In the experimental results of the ±66 kV DC GISA miniature model, in the range of 154–3140 A per column, the current distribution coefficient β of the ±66 kV DC GISA prototype is between 1.01 and 1.04. With the increase in current, the inter-column current coefficient β decreases gradually. The current of columns 1, 2, and 3 increases sequentially, and the energy absorbed increases.
  • The current uniformity effect of the 6.4 μH inductor is validated. The results show that compared with the linear structure arrester (which has no inductor), the self-generated inductor of the spiral structure reduces the uneven coefficient of current distribution from 1.06 to 1.02. The current deviation coefficients are reduced by 28–65%. This current uniformity scheme automatically plays a role in the use of the arrester, which relies on the self-generated structure of the arrester for current uniformity. It provides a new direction for improving the current uniformity of multi-column parallel arresters.

Author Contributions

Conceptualization, S.L. (Siyuan Liu) and L.W.; methodology, S.L. (Siyuan Liu) and L.W.; writing—original draft preparation, L.W.; writing—review and editing, S.L. (Siyuan Liu) and S.L. (Shiyu Liu); supervision, Z.L.; project administration, Y.G. All authors have read and agreed to the published version of the manuscript.

Funding

This work was supported by the National Key Research and Development Program of China, grant number 2021YFB2400604.

Institutional Review Board Statement

Not applicable.

Informed Consent Statement

Not applicable.

Data Availability Statement

The raw data supporting the conclusions of this article will be made available by the authors on request.

Conflicts of Interest

The authors declare no conflicts of interest.

References

  1. Wu, H.; Yu, J.; Liu, J.; Mei, R.; Ji, X.; Wang, H. Voltage control of offshore wind farm considering reactive ability of electrochemical energy storage. In Proceedings of the 2022 IEEE Sustainable Power and Energy Conference (ISPEC), Perth, Australia, 4–7 December 2022. [Google Scholar]
  2. Li, L.; Yang, C.; Xu, H.; Yan, Q.; Zhou, S.; Yang, H. Coordinated Voltage Control for Offshore Wind Farm Equipped with SVG and Energy Storage. In Proceedings of the 2022 12th International Conference on Power and Energy Systems, ICPES, Guangzhou, China, 23–25 December 2022; pp. 800–804. [Google Scholar]
  3. Li, Y.; Zhang, B.; Li, X.; Li, K.; Ji, K.; Nan, Z.; Yao, X. Optimization of insulators in ±550 kV HVDC GIS for offshore wind platform considering charge accumulation. Electr. Power Syst. Res. 2023, 223, 109549. [Google Scholar] [CrossRef]
  4. Kosse, M.; Juhre, K.; Kuschel, M.; Dejun, L. Overview of development, design, testing and application of compact gas-insulated DC systems up to 550 kV. Glob. Energy Interconnect. 2019, 2, 567–577. [Google Scholar] [CrossRef]
  5. Guo, L.; Du, Y.; Yang, Z.; Xiong, X.; Wang, Q.; Jia, F. Non-communication Dynamic Low-Frequency Wind Power System and Its Generator Types. In Proceedings of the 4th International Conference on Advanced Electrical and Energy Systems (AEES), Shanghai, China, 1–3 December 2023; Volume 2023, pp. 287–292. [Google Scholar] [CrossRef]
  6. Meinecke, H. High voltage gas insulated switchgear: An overview. In Proceedings of the IEE Colloquium on GIS (Gas-Insulated Switchgear) at Transmission and Distribution Voltages, Nottingham, UK, 14 November 1995; pp. 3/1–3/8. [Google Scholar]
  7. Tian, X.; Xu, L.; Sun, H.; Dong, H. Temperature field Simulation of 27.5 kV Environment-friendly Gas Insulated Switchgear based on ANSYS. In Proceedings of the 3rd International Academic Exchange Conference on Science and Technology Innovation (IAECST), Guangzhou, China, 10–12 December 2021; Volume 2021, pp. 184–187. [Google Scholar]
  8. Zhong, J.; Zhang, B.; Guo, Y.; Wang, Z.; Yao, Y.; Zhang, H.; Liu, Y. Gas and solid insulation in HVDC gas insulated switchgear. In Proceedings of the IEEE Conference on Energy Internet and Energy System Integration (EI2), Beijing, China, 26–28 November 2017; Volume 2017, pp. 1–5. [Google Scholar]
  9. Sun, Q.Q.; Yang, L.; Zheng, Z.; Han, J.H.; Wang, Y.Z.; Yao, L. A comprehensive lightning surge analysis in offshore wind farm. Electr. Power Syst. Res. 2022, 211, 108259. [Google Scholar] [CrossRef]
  10. Abouelatta, M.A.; Ward, S.A.; Sayed, A.M.; Mahmoud, K.; Lehtonen, M.; Darwish, M.M.F. Fast corona discharge assessment using FDM integrated with full multigrid method in HVDC transmission lines considering wind impact. IEEE Access 2020, 8, 225872–225883. [Google Scholar] [CrossRef]
  11. Gouda, O.E.; Darwish, M.M.F.; Mahmoud, K.; Lehtonen, M.; Elkhodragy, T.M. Pollution severity monitoring of high voltage transmission line insulators using wireless device based on leakage current bursts. IEEE Access 2022, 10, 53713–53723. [Google Scholar] [CrossRef]
  12. Riechert, U.; Straumann, U.; Gremaud, R. Compact gas-insulated systems for high voltage direct current transmission: Design and testing. In Proceedings of the IEEE/PES Transmission. and Distribution Conference and Exposition, Dallas, TX, USA, 3–5 May 2016; pp. 1–5. [Google Scholar]
  13. Li, S.T.; He, J.Q.; Lin, J.J.; Wang, H.; Liu, W.F.; Liao, Y.L. Electrical-Thermal Failure of Metal-Oxide Arrester by Successive Impulses. IEEE Trans. Power Deliv. 2016, 6, 2538–2545. [Google Scholar] [CrossRef]
  14. Zhang, C.; Yi, X.; Li, C.; Xu, Y.; Xing, H. Study on the Influence of Thermal Effect of Multi-Pulse Lightning Current on the Aging Characteristics of ZnO Varistor. In Proceedings of the IEEE 15th International Conference on Electronic Measurement & Instruments (ICEMI), Nanjing, China, 29–31 October 2021; Volume 2021, pp. 206–211. [Google Scholar]
  15. Metwally, I.A.; Gastli, A.; Ahmed, M.M.; Al-Badi, A. Surge arrester performance under AC artificial pollution and impulse conditions: A comparative investigation. Electr. Power Compon. Syst. 2006, 34, 1243–1251. [Google Scholar] [CrossRef]
  16. Meng, P.; Cao, W.; Chen, C.; Wan, S.; Xu, H.; Hu, J.; He, J. Excellent electrical properties of zinc-oxide varistors by tailoring sintering process for optimizing line-arrester configuration. In Proceedings of the 2020 IEEE International Conference on High Voltage Engineering and Application (ICHVE), Beijing, China, 6–10 September 2020; pp. 1–4. [Google Scholar]
  17. Tarfulea, N.; Frigura-Iliasa, F.M.; Vatau, D.; Frigura-Iliasa, M.; Andea, P.; Balcu, F.I. Research and Developpment of a new Material for Metal Oxide Varistors. In Proceedings of the 2018 IEEE International Conference on Environment and Electrical Engineering and 2018 IEEE Industrial and Commercial Power Systems Europe (EEEIC/I&CPS Europe), Palermo, Italy, 12–15 June 2018; pp. 1–4. [Google Scholar]
  18. Bartkowiak, M.; Mahan, G.D.; Modine, F.A.; Alim, M.A.; Lauf, R.; McMillan, A. Voronoi network model of ZnO varistors with different types of grain boundaries. J. Appl. Phys. 1996, 80, 6516–6522. [Google Scholar] [CrossRef]
  19. Hu, S. Research on Pole Bus Metal Oxide Surge Arrester for 800 kV UHVDC Converter Station. High Volt. Appar. 2016, 52, 34–40+45. [Google Scholar] [CrossRef]
  20. Liu, Z. Research on the method of ZnO varistor combination of multi-column parallel arrester group based on energy absorption equilibrium. Insul. Surge Arresters 2022, 1, 62–68. [Google Scholar]
  21. Haddad, A.; Waters, R.T.; German, D.M.; Abdul-Malek, Z. Current disparity in multi-column surge arresters. IEE Proc.-Gener. Transm. Distrib. 2005, 152, 945–951. [Google Scholar] [CrossRef]
  22. Lu, W.; Wen, W.; Liu, W.; Zhuang, D.; Wen, Q. Current uniformity characteristics of multi-column parallel arresters under long persistent overvoltage. High Volt. Appar. 2019, 45, 3280–3289. [Google Scholar]
  23. Tuczek, M.N.; Broeker, M.; Hinrichsen, V.; Goehler, R. Effects of Continuous Operating Voltage Stress and AC Energy Injection on Current Sharing Among Parallel-Connected Metal-Oxide Resistor Columns in Arrester Banks. IEEE Trans. Power Deliv. 2015, 30, 1331–1337. [Google Scholar] [CrossRef]
  24. Kosse, M.; Tuczek, M.; Klein, C.; Claus, M. Experiences with on-site dielectric testing during commissioning tests of world’s first offshore HVDC GIS 320 kV. In Proceedings of the VDE High Voltage Technology: 4. ETG-Symposium, Berlin, Germany, 8–10 November 2022; pp. 1–6. [Google Scholar]
  25. Jiang, S.; Ding, G. State Monitoring of Mechanical and Electrical Equipment for Offshore Platform Based on PHM. In Proceedings of the 2nd International Seminar on Artificial Intelligence, Networking and Information Technology (AINIT), Shanghai, China, 15–17 October 2021; Volume 2021, pp. 695–698. [Google Scholar]
  26. Imato, S.; Baba, Y.; Nagaoka, N.; Itamoto, N. FDTD Analysis of the Electric Field of a Substation Arrester Under a Lightning Overvoltage. IEEE Trans. Electromagn. Compat. 2016, 58, 615–618. [Google Scholar] [CrossRef]
  27. Spaeck-Leigsnering, Y.; Ruppert, M.G.; Gjonaj, E.; De Gersem, H.; Hinrichsen, V. Simulation Analysis of Critical Parameters for Thermal Stability of Surge Arresters. IEEE Trans. Power Deliv. 2022, 37, 871–879. [Google Scholar] [CrossRef]
  28. Spaeck-Leigsnering, Y.; Gjonaj, E.; De Gersem, H.; Weiland, T.; Giessel, M.; Hinrichsen, V. Electroquasistatic-Thermal Modeling and Simulation of Station Class Surge Arresters. IEEE Trans. Magn. 2016, 52, 2319–2325. [Google Scholar] [CrossRef]
  29. Liu, S.; Popov, M.; Belda, N.A.; Smeets, R.P.P.; Liu, Z. Thermal FEM Analysis of Surge Arresters During HVdc Current Interruption Validated by Experiments. IEEE Trans. Power Deliv. 2022, 37, 1412–1422. [Google Scholar] [CrossRef]
  30. He, J.L.; Zeng, R.; Chen, S.M.; Tu, Y.P. Thermal characteristics of high voltage whole-solid-insulated polymeric ZnO surge arrester. IEEE Trans. Power Deliv. 2003, 18, 1221–1227. [Google Scholar] [CrossRef]
  31. Cheng, J.; Jiang, Z.; Zou, H.; Deng, G. Research and Test of 10 kV ZnO Thermal Stability Based on Finite Element Analysis. In Proceedings of the China International Conference on Electricity Distribution (CICED), Shanghai, China, 7–9 April 2021; Volume 2021, pp. 662–667. [Google Scholar]
  32. IEC 60099-4; Surge Arresters—Part 4: Metal-Oxide Surge Arresters Without Gaps for a.c. Systems. International Electrotechnical Commission: Geneva, Switzerland, 2014.
  33. Illias, H.A.; Abd Halim, S.; Abu Bakar, A.H.; Mokhlis, H. Determination of surge arrester discharge energy using finite element analysis method. IET Sci. Meas. Technol. 2015, 9, 693–701. [Google Scholar] [CrossRef]
  34. Denz, F.; Gjonaj, E.; Weiland, T.; Tuczek, M.; Hinrichsen, V. Electric and thermal reaction of zinc oxide to current impulses. In Proceedings of the 2010 30th International Conference on Lightning Protection (ICLP) 2010, Cagliari, Italy, 13–17 September 2010. [Google Scholar]
  35. Xie, P.; Jiang, Z.; Huang, K.; Hu, J. Experimental Study on Current Distribution Characteristics of Multi-column Parallel Zinc Oxide Resistors. In Proceedings of the China International Conference on Electricity Distribution (CICED), Changsha, China, 7–8 September 2022; Volume 2022, pp. 160–163. [Google Scholar]
Figure 1. Spiral structure with superposed inductor (structure in this paper).
Applsci 14 05744 g001
Figure 2. Spiral structure with offset inductor (general spiral structure).
Applsci 14 05744 g002
Figure 3. Three-dimensional model of a single-column core.
Applsci 14 05744 g003
Figure 4. Three-dimensional model of a ±550 kV DC GIS arrester.
Applsci 14 05744 g004
Figure 5. Prototype of the ±66 kV DC GIS arrester. (a) is the internal composition of the ±66 kV DC GIS arrester. (b) is the prototype of the ±66 kV DC GIS arrester.
Applsci 14 05744 g005
Figure 6. The voltage–current curve of the ZnO varistor in a ±550 kV DC GIS surge arrester.
Applsci 14 05744 g006
Figure 7. Laboratory setup of the current distribution experiment.
Applsci 14 05744 g007
Figure 8. Number schematic diagram.
Applsci 14 05744 g008
Figure 9. The influence of different current amplitudes on β.
Applsci 14 05744 g009
Figure 10. Temperature comparison diagrams of the simulation and experiment between each column ZnO varistor. (a) is the temperature rise process of the ZnO varistors. (b) is the temperature drop process of the ZnO varistors.
Applsci 14 05744 g010
Figure 11. Temperature comparison diagrams of the simulation and experiment between each column spacer. (a) is the temperature rise process of the spacers. (b) is the temperature drop process of the spacers.
Applsci 14 05744 g011
Figure 12. Three-dimensional electric field distribution of ±550 kV DC GISA core.
Applsci 14 05744 g012
Figure 13. The magnetic induction intensity distribution of the core section of the arrester.
Applsci 14 05744 g013
Figure 14. Three-dimensional temperature distribution of ±550 kV DC GISA.
Applsci 14 05744 g014
Figure 15. Topology diagrams of a linear structure and a spiral structure of a ±550 kV DC GISA. (a) is the topology diagram of the linear structure. (b) is the topology diagram of the spiral structure.
Applsci 14 05744 g015
Figure 16. The current uniformity effects of the spiral structure self-generated inductor. (a) is the V-I curve with no inductor. (b) is the V-I curve with the 6.4 μH inductor.
Applsci 14 05744 g016
Figure 17. The influence of the inductor on the three-column current distribution. (a) is the current distribution with no inductor. (b) is the current distribution with the 6.4 μH inductor.
Applsci 14 05744 g017
Table 1. Main reference parameters.
ParametersUnitValue
Surge arresterDC reference voltagekV640
Continuous operation voltagekV541
Rated absorbed energyMJ1
ZnO varistorDC reference voltagekV5
Continuous operation voltagekV4
Rated absorbed energykJ38
Diametermm100
Thicknessmm22
Table 2. Model material parameters.
PositionMaterial
ZnO varistorZnO
Conductor rodAluminum
SpacerAluminum
TankAluminum
Insulating BoardEpoxy Resin
Insulating RodEpoxy Resin
Table 3. Characteristics of the materials.
Mass density ρ (kg/m3)
Zinc oxide5672.5 − 1.4 × 10⁻³T − 1.4 × 10⁻⁴T2 − 7.6 × 10⁻⁸T3
Aluminum2736.9 − 2.8 × 10⁻²T − 1.0 × 10⁻³T 2 − 71.7 × 10⁻⁵T3
Epoxy Resin1673.0
Heat capacity Cp (J/(kg·K))
Zinc oxide41.6 + 3T − 6.8 × 10⁻³T2 + 7.3 × 10⁻⁶T3
Aluminum596.7 + 1.5T − 2.1 × 10⁻³T2 + 1.3 × 10⁻⁶T3
Epoxy Resin550.0
Thermal conductivity k (W/(m·K))
Zinc oxide255.5 − 1.7T + 6.5 × 10⁻³ T2 − 1.4 × 10⁻⁵T3
Aluminum39.6 + 1.7T − 5.4 × 10⁻³T2 + 8.4 × 10⁻⁶T3
Epoxy Resin−0.03 + 0.002 × T
Table 4. The data of the current distribution experiment.
Capacitor Charging Voltage/kVVoltage Amplitude of the Surge Arrester/kVCurrent Amplitude/AThe Coefficient of the Current Distribution β
123
90821541621681.041
120873143203341.035
135914885005161.029
150956806987181.028
165988688729041.026
1801021040106010901.025
1951051220124012701.021
2101101420144014801.023
2251121610166016901.022
2551191980204020801.023
2851252360244024801.022
3151282540256026201.018
3601302900292030001.020
3751313040310031401.015
Disclaimer/Publisher’s Note: The statements, opinions and data contained in all publications are solely those of the individual author(s) and contributor(s) and not of MDPI and/or the editor(s). MDPI and/or the editor(s) disclaim responsibility for any injury to people or property resulting from any ideas, methods, instructions or products referred to in the content.

