Review

A Review of Impedance Spectroscopy Technique: Applications, Modelling, and Case Study of Relative Humidity Sensors Development

by
Georgenes M. G. da Silva
1,
Pedro M. Faia
2,*,
Sofia R. Mendes
2 and
Evando S. Araújo
3
1
Federal Institute of Education, Science and Technology of the Sertão Pernambucano, Petrolina 56314-520, Brazil
2
CEMMPRE—Electrical and Computer Engineering Department, University of Coimbra, FCTUC, Polo 2, Pinhal de Marrocos, 3030-290 Coimbra, Portugal
3
Research Group on Electrospinning and Nanotechnology Applications, Department of Materials Science, Federal University of São Francisco Valley, Juazeiro 48902-300, Brazil
*
Author to whom correspondence should be addressed.
Appl. Sci. 2024, 14(13), 5754; https://doi.org/10.3390/app14135754
Submission received: 5 June 2024 / Revised: 26 June 2024 / Accepted: 28 June 2024 / Published: 1 July 2024

Abstract

:
Impedance Spectroscopy (IS) is a general term for the technique referring to small-signal measurements of the linear electrical response of a domain of interest. This method is based on the analysis of the system’s electrical response to yield helpful information about its domain-dependent physicochemical properties (generally, the analysis is carried out in the frequency domain). Nowadays, there are many areas of application where IS can be used to evaluate or enhance the development of emerging products and processes. As a contribution to this field of research, this paper presents relevant theoretical–practical aspects of the interpretation and analysis of the electrical behavior of materials based on IS and IS modelling. The work starts by historically introducing IS and then goes through different domains of application of the technique, such as Materials Science and correlated areas. Afterwards, an introduction to IS usage for constructing equivalent electrical circuits is presented, aiming at modelling the materials’ electrical behavior, followed by examples from the literature that use the two possible circuit development approaches, the series and the parallel association of circuit elements. Lastly, the authors present a case study of their most recent efforts of a circuit model development of relative humidity (RH) sensors based on heterogeneous mixed metal oxide (MMO) nanostructures, used to understand and identify existing contributions to the overall electrical response of the sensors to moisture; in their case, the electrical response of the MMO sensors was modelled with a high level of superposition between the experimental and fitted data, using a parallel combination of circuit elements, which is an unconventional one.

1. Introduction

Impedance Spectroscopy (IS) plays a fundamental role in many research and development (R&D) areas, particularly in Materials Science and Electrochemistry, where it is an essential analytical technique for studying the performance of functional materials [1,2]. It is a methodology that allows for the characterization of the electrical behavior of systems for which differently coupled processes contribute to their overall response. With advances in electronics, such as high-quality impedance bridges and large-frequency-band integrated circuits (such as multipliers, integrators, demodulators, etc.), impedance measuring equipment has become cheaper and popular, and consequently more engineers and researchers are using them [3].
The history of IS dates back to the 19th Century, during which linear systems theory found significant advances. Near the end of the same century, E. Warburg carried out its efforts and enlarged IS application to electrochemical systems [4]. During the second half of the 20th century, the world witnessed the development of solid-state batteries, a revolution in high-temperature electrochemical sensors, among other fields (by the time the potentiostat was invented, followed by the arrival of frequency response analyzers) [3,5,6].
The major advance during that period was the application of IS to solid systems, instead of their usage mainly for the characterization of aqueous systems, which allowed for the conduction mechanisms present on solid–solid and solid–liquid interfaces (where it is quite common to observe ionic nature phenomena) to be revealed [1,3]. Near the interfaces, crystallographic, mechanical, compositional, and electrical properties induce changes in the charge distribution, governing the overall electrical conductivity of a system [7]. When an electrical potential differential is applied to the diverse interfaces composing a system, they will become polarized in unique ways. The rate at which the polarization of each region changes with the reversion of applied electric potential is characteristic of each interface; for instance, it is slow near the triple structure composed of electrode, electrolyte, and surrounding environment but considerably faster in the grain boundaries of the electrolyte [8]. So, phenomena analysis shifted from time/concentration to frequency-related dependencies evaluation; therefore, electric double layers are now characterized by a distribution of relaxation times.
In summary, the electrical response of heterogeneous systems varies and depends on the charge species available, the microstructure, the electrodes’ shape, placement, and type, and IS can be used to assess how charges are bounded or transferred along the bulk or along the existing interfaces (solid–solid, solid–liquid, etc.) in almost every solid and liquid; consequently, semiconductors, ionic, electronic, and mixed-type materials, among others, can all be evaluated [9]. Characterizing electrolytes’ electrical behavior by IS implies using electrodes to perform the measurements [10,11]. The technique consists of applying an electrical stimulus through the electrodes (a known and defined current or voltage) and analyzing the system response, assuming that the system’s electrical properties are time-invariant [10]. If so, several contributions to the overall electrical response can occur: electrons transport along the electrolyte, electrons transfer along the interface composed by the electrode and electrolyte, or ions flow through the electrolyte structural defects [10,11,12]. Therefore, the flow rate of the charged particles and, consequently, of the current, depends on the ohmic resistance of the electrodes and electrolyte, and on the reaction rates at the existing interfaces (it should not be forgotten that band structure anomalies or structural defects can further impede charge flow).
Three different types of electrical stimuli can be used when applying IS [13]. For transient measurements, a step voltage function, v(t), is applied (such as v ( t ) = 0   V for t < 0 s, while v ( t ) = V 0   V for t 0 s), and the respective resulting time-variant current response, i(t), is measured [14,15]. The quotient between v(t) and i(t) is the time-varying resistance, and allows for the material’s impedance due to the step voltage perturbation at the interface to be determined. A second type of stimulus consists of applying a random white noise signal to the interface, followed by measuring the resulting current [16]. The third and most common form of use is the one in which the impedance is directly measured by applying a single-frequency voltage sinusoidal signal to the interface, after which the resulting current amplitude and phase shift are measured for that same frequency (or their respective real and imaginary parts) [17,18]. When, instead of evaluating the response to a single frequency stimulus, a chosen set of frequencies is examined, a sweep, the obtained set of impedances, can be represented in the form of a Nyquist plot (the imaginary part of the impedance as a function of the real part of the impedance), or of Bode plots (the imaginary part of the impedance as a function of frequency, and the real part of the impedance as a function of frequency).
A three- or two/four-points measuring configuration can be used, depending on the intended characterization. The configuration with three electrodes results in the designation in the literature of Electrochemical Impedance Spectroscopy (EIS). Specifically, a common electrode (the designated reference electrode) is used both for the excitation and measuring procedures, a counter electrode for applying the excitation signal to the media under evaluation, and a working electrode to measure the media electrical response. Measurements via the two electrodes configuration option refer to the literature-described approach of Electrical Impedance Spectroscopy (EleIS). In this case, the same pair of electrodes is used simultaneously for applying the excitation to the media intended to be analyzed and for measuring its electrical response; the four-points configuration is an extension of this approach and intended to diminish the measuring electronics setup impedance, and consequently its influence on the impedance measurements. However, independently of the measuring strategy used, measured complex data integrity must be assured (the real and imaginary components of the assessed complex impedance must have finite values over the entire evaluated frequency range). That is achieved using the Kramers–Kronig relations [19] (named in honor of Ralph Kronig and Hendrik Anthony Kramers [20,21]). They can detect errors in the impedance spectrum of a system through data integration over the entire frequency range. However, Kramers–Kronig relations evaluation requires integration over a wide range of frequencies (from zero to infinity): since no one can measure spectral data over that range, the assessment always involves assumptions about the behavior of the spectrum outside the measured frequency range. In practice, the analysis is performed by fitting a generalized model to the complex data: for instance, Agarwal et al. [22] proposed a serial association between a resistor and several R//C circuit elements (elements composed by a resistor connected in parallel with a capacitor), while Boukamp [23] proposed achieving it by fitting a set of linear equations, eliminating possible non-convergence issues. Presently almost all impedance analyzers that display the capacity of fitting obtained data by equivalent circuits (or software tools that perform the same procedure), possess in-built Kramers–Kronig evaluation, so the researchers’ task is facilitated.
This work addresses the application of IS for the development and improvement of functional devices in emerging technological areas, the modelling of their electrical properties employing equivalent electrical circuits, and the presentation of a case study of IS model development for the complete comprehension of the electrical response of metal oxides-based relative humidity (RH) sensors. Authors expect it to contribute significantly to the research community.

2. Impedance Spectroscopy

2.1. Scopes of Application

IS has been used in many domains to characterize materials and systems. Impedance Spectroscopy is exceptionally attractive in terms of applications as it uses a non-destructive approach, is easily implemented for the evaluation of systems, and due to the usefulness of the obtained data. Industrial and scientific communities have started to recognize IS’ potential due to its wide use in electrocatalysis and energy [24,25], in the evaluation of coatings quality [26], in corrosion phenomenon surveillance [27,28], and in sensors evaluation and tuning [29,30].

2.1.1. IS in Human Health Safety Due to Water Sources Contamination

Food and water safety have recently become universal concerns [31,32,33,34,35]; consequently, there is a significant demand for methods capable of detecting water and food contaminants. For instance, in the case of water (the most crucial source for human existence and development), due to the evolution of human life the widespread use of chemicals came about and their resultant innumerable contaminants threaten aquatic systems (heavy metals, sulphates, phosphates, dyes, and pesticides, to mention some). If we take into consideration heavy metals (like As, Cd, Cr, Pb, and Hg, which have been reported to be very toxic), they are non-degradable and widely used in industrial, domestic, and agricultural applications; so, once food production became water-dependent, food safety became a significant issue and, consequently, the potential influence on public health of water pollution is extremely concerning. Dyes are also significant water pollutants; they can color substantial volumes of water, even if discharged as traces. The textile industry is one of the highest volume contributors, discharging significant amounts of polluted waste by dyes with various chemical structures. Dyes usage and their consequent release into the water directly affect aquatic beings and, indirectly, human health; the impact of these agents includes carcinogenicity and poisoning [36,37].
As mentioned, the discharge of heavy metals, HMs, into the water via industrial activities, among other sources, significantly influences the environment and human health; their toxicity, degradation rate, accumulation, uptake, and bioavailability need to be evaluated. In the research carried out by Tekaya et al. [38], a bi-enzymatic biosensor (Arthrospira platensis cells were immobilized on gold-interdigitated structures) was developed that inhibited phosphatase and esterase activities by heavy metals and pesticides, respectively, consequently avoiding their liberation in wastewaters. When they assessed the sensor operation by Electrical Impedance Spectroscopy, EleIS, they were able to determine Hg2+ and Cd2+ species, as well as parathion, paraoxon, and triazine pesticides, alone or in a mixture containing the heavy metals (and for the four-points measurement configuration, performed in the frequency range of 100 mHz to 100 kHz at room temperature). Trying to prevent the release of some heavy metals into wastewater, Avuthu and his co-workers [39] fabricated a three-electrode sensor configuration printed on a polyethylene terephthalate film; using Electrochemical Impedance Spectroscopy, EIS, they applied this sensor to the impedimetric determination of Pb2+ and Cd2+ species in water samples at the nanomolar level (measurements were made while applying a voltage of 1 V and with operating frequencies in the range of 1 Hz to 100 kHz). EIS, applied in the frequency range of 1 mHz to 1 MHz, was also the way Liu and colleagues [40] evaluated an electrochemical DNA biosensor made of cuprous oxide and nanochitosan microspheres, for Hg2+ detection in river water (which included an Au electrode, a Pt-slide auxiliary electrode, and an Ag/AgCl reference electrode); the measured detection limit was of 0.15 nM.
Examples of IS usage for exploring food contamination situations are likewise found in the literature. For instance, Castillo et al. [41] determined ochratoxin mycotoxin (mycotoxins are toxic secondary metabolites produced by fungi capable of causing diseases and death in both humans and animals) using a thiolated DNA aptamer (aptamers are artificial short sequences of Deoxyribonucleic acid, DNA, Ribonucleic acid, RNA, Xeno Nucleic Acid, XNA, or of short protein chains, named peptides, that bind a specific target molecule, or family of molecules), immobilized by chemisorption to the surface of an Au electrode, which they stimulated by EIS (a standard three-cell was utilized, consisting of a gold working electrode, a Pt wire auxiliary electrode, and an Ag/AgCl/1 M KCl reference electrode; measurements were taken in a frequency range of 0.1 Hz–100 kHz, using an AC voltage of 5 mV combined with a DC one of 0.165 mV). Castillo et al.’s team carried out their initial work and detected other mycotoxins, such as Aflatoxin B1 using a layer coating of cystamine, poly (amido-amine) dendrimers (polymeric nanoparticles) of generation 4.0 (PAMAM G4), and DNA aptamers on Au electrodes, once again employing EIS (measures were done in the frequency range from 0.1 Hz to 100 kHz, while applying 5 mV amplitude AC voltage with DC component of 0.22 V, using a standard EIS cell composed of a gold working gold electrode, an Ag/AgCl/1 M KCl reference electrode, and a Pt wire auxiliary electrode) [42].
In their turn, Jiang and colleagues [43] evaluated pesticides presence, such as acetamiprid, in samples of vegetables (tomatoes and cucumbers) using AgNP-modified nitrogen-doped graphene (AgNP stands for Argenta Nanoparticles); the developed aptasensor (an aptasensor is a biosensor which recognizes biological elements like DNA or RNA aptamer) evaluated by EIS (for the experimental characterization, frequencies in between 0.01 Hz and 10 kHz were applied, with an AC voltage amplitude of 5 mV; a glassy carbon working electrode, a saturated calomel reference electrode, and a platinum wire counter electrode composed the conventional three-electrode system used), was sensitive, selective, and economical, and did not require intricate labelling procedures. Gold nanoparticles (GNPs) electrodes (modified screen-printed carbon electrode), developed by Labib and co-authors [44], were used on another aptasensor, also assessed by EIS (measurements were conducted at room temperature, in the frequency range of 0.1 Hz to 100 kHz, using an AC voltage of 5 mV amplitude combined with a DC component of 250 mV, and a three-electrode configuration printed on a ceramic substrate). For the mensurations, a GNPs-SPCE working electrode (a gold nanoparticles-modified, screen-printed carbon electrode), a carbon counter electrode, and a silver pseudo-reference electrode were combined for tracing Salmonella (Salmonella is a genus of rod-shaped, gram-negative bacteria of the family Enterobacteriaceae); the sensor displayed selectivity to Salmonella enteritidis (present in pork products and globally responsible for a high number of human infections around the world) and showed a negative response towards the mixture of other pathogens. Ma et al. [45] also fabricated a Salmonella enterica serovar Typhimurium sensor using glass carbon electrodes (GCE) modified by graphene oxide/Gold-mixed nanoparticles (GO/Au NPs-modified GCE); they used EIS to evaluate the sensor against pork samples, for which it achieved a limit of detection of 3.0 colony-forming units (CFU mL−1).
Pharmaceutically active materials also stand as significant aquatic pollutants; when released into the water systems, they are of major concern, and several drugs’ existence in diverse forms/systems was evaluated using IS, intending to avoid their release into water systems (managing the systems containing the drugs differently, without disposing of them in water systems). Jahanbani and Benvidi [46] used EIS on two aptasensors (a platinum counter electrode and Ag/AgCl or KCl reference electrodes were combined for the evaluation of the two under test working aptasensor electrodes, for frequencies between 0.01 Hz and 100 kHz, with an AC voltage of amplitude 10 mV), one based on a carbon paste electrode with oleic acid and the other based on a magnetic bar carbon paste electrode containing Fe3O4 magnetic nanoparticles and oleic acid (following the modification of electrode surfaces using an anti-TET, tetracycline approach), to perform label-free detection of tetracycline (an oral antibiotic). When used for assessing tetracycline content in pharmaceutical formulations, serum samples, and food products (milk and honey), the sensors’ detection limits were 1.0 × 10⁻¹² to 1.0 × 10⁻⁷ M and 3.0 × 10⁻¹³ M, respectively. Wang et al. [47] fabricated an EIS-operated sensor (for testing it, they used a standard three-electrode system, including a gold working electrode, a Pt wire counter electrode, and an Ag/AgCl-saturated KCl as reference electrode; data were recorded within the frequency range of 0.01 Hz–100 kHz with an AC voltage amplitude of 5 mV) based on nanocomposites of mC with SnOx and TiO2 nanocrystals, and they used it to evaluate the presence of tobramycin (an aminoglycoside antibiotic) in urine and serum samples, and the presence of kanamycin, oxytetracycline, and doxycycline (all also antibiotics); the sensor displayed a detection limit of 0.01 nM.
Jiménez and colleagues [48] evaluated Bisphenol A (a xenoestrogen with an estrogen-mimicking effect, not produced by the human body, widely used as a precursor in the plastics industry) utilizing a labelled EIS-stimulated aptasensor (the cell was composed of a rod of GNPs and functionalized carbon nanotubes, GNPs/PB/CNTs-COOH, a working electrode, an Ag/AgCl reference electrode, and a Pt wire auxiliary electrode; testing was made using alternating voltage potential of 10 mV with a 0.190 V DC potential, in the frequency range from 0.1 Hz to 10 KHz). The determination of progesterone (a hormone that supports menstruation and maintains pregnancy, and of which low levels can cause complications) in water and other clinical samples was performed using single-stranded ssDNA aptamers that possessed high binding affinity with progesterone P4.
Chen et al. [49] assessed raloxifene interfacial properties (a selective estrogen receptor modulator that is used to prevent and treat osteoporosis and reduce the risk of invasive breast cancer), utilizing three sensing electrode materials and EIS; a bare screen-printed carbon electrode, a graphene oxide/glassy carbon electrode, and a neodymium sesquioxide nanoparticles electrode (Nd2O5 NPs@GO/GCE). The results obtained showed that the charge transfer resistance of the neodymium sesquioxide nanoparticles electrode was much lower than that of the other two. In a work by Song and co-authors [50], oxytetracycline (a tetracycline class of antibiotics, a subset of antimicrobials included in an essential class of pharmaceutically active materials) was tested for label-free detection in milk samples. A mixture of iron oxide and mesoporous carbon (Fe3O4@mC), together with nanocomposites made from Fe(II)-based metal-organic frameworks (525-MOF), was calcined at different temperatures and used as sensing material. The sensing material was assessed by EIS (a conventional cell composed of the working electrode, an Ag/AgCl-saturated KCl reference electrode, and a platinum slide counter electrode were used; the impedance plots were obtained by applying an AC voltage potential with an amplitude of 5 mV, possessing a DC component with 0.21 V, in the frequency range 0.1 Hz to 100 kHz) and showed very high sensitivity with a detection limit of around 0.027 pg/mL in the range of 0.005–1.0 ng/mL, as well as high selectivity for oxytetracycline in the presence of tetracycline, doxycycline, and chlortetracycline (all antibiotics).
Still considering the removal of water contaminants, the use of filters is also a common approach. Indeed, ultrafiltration, microfiltration, and nanofiltration can be carried out by membranes to provide the adequate removal of pathogenic bacteria, such as Cryptosporidium and Giardia, among others. Filtering membranes used in the industry can have their performance and lifetime improved through EleIS evaluation. Miele et al. [51] used the previously mentioned approach to check the life cycle of graphene industrial filters used for water remediation of acetonitrile (CH3CN) and 2,4-dichlorophenol (Cl2C6H4O) pollutants (they used these for the characterization of a four-wire measurement setup, in the frequency range from 1 to 100 kHz).
So, in summary and as reported, the growing concerns regarding the presence of contaminants in food and water, even at relatively low concentrations, have contributed to the use of IS by researchers for detection/measuring purposes.

2.1.2. IS Applied in Forest and Agriculture Management

Structural changes observed in plants or animal tissue reflect the organisms’ physiological state. In the case of plants, there are already strong indications that their impedance evaluation over a range of frequencies allows for the ascertainment of diverse physiological characteristics. For instance, phospholipid bilayers (phospholipids are a class of lipids that contain a hydrophilic head and a hydrophobic tail) are critical components of plants’ cell membranes; lipid bilayers act as barriers to the passage of molecules and ions into and out of the cell and are revealed when an electrical field is applied to the plants. Consequently, changes in plant physiology are reflected in the different polarization processes taking place; their evaluation by Impedance Spectroscopy is typically carried out on the leaves, fruits, stems, or roots [52].
It is essential to analyze plants’ roots to understand their interactions with soil and/or climate. For instance, optimal water and fertilizer usage may be established through the characterization of plant root systems, which provide conditions to maximize crop production and respective quality. For example, Ozier–Lafontaine et al. [53] identified essential connections between the root tissue’s capacitance and the roots’ weight under dry and wet conditions through EleIS (experiments were carried out using a four-electrode configuration for frequencies varying between 10 Hz and 1 MHz).
EleIS has also been used in plant roots to evaluate morphological indices [54] (experiments were performed using a four-electrode configuration for frequencies varying between 60 Hz and 60 kHz, inserting one electrode in the middle position of the stem while the other one was positioned on the bottom of the container filled with the nutrient solution where the root of the stem was placed), to assess cadmium pollution and freeze-thaw damage [55] (for the characterization, the authors used frequency sweeps in the 5–100 kHz interval, with an AC voltage difference of 10 mV, using a four-electrode configuration approach), to measure cold acclimation and root hypoxia [56] (the magnitude and phase angle of the electrical impedance were determined experimentally using a four-points acquisition configuration in the frequency range from 30 Hz up to 1 MHz, using an AC voltage level of 1 V), and to characterize mycorrhizal colonization [57] (the frequencies used for the characterization varied between 5 Hz and 100 kHz, for an AC voltage difference with an amplitude of 10 mV, utilizing a four-points measuring setup).
Regarding the stem of the plants, EleIS measurements were used for in vivo, in situ, and non-destructive monitoring of the plant’s physiology [58] (for the measurements, an AC voltage possessing an RMS amplitude of 500 mV was adjusted, while frequencies were swept logarithmically across the 50 Hz–4 MHz interval). The attached setup to the stem of the Nicotiana tabacum plant (used as a dicot plant model) was composed of a four-electrodes measuring points system and allowed for the successful linking of their living electrical characteristics to the stem’s internal structure. Tomkiewicz et al. [59] introduced a nutritional index calculated using the impedance modulus values measured at the stem of tomato plants, using EleIS results (the data sweeps were obtained for frequencies starting at 100 Hz through 50 kHz, for a peak-to-peak value of the sinusoidal signal voltage of 0.4 V, using a four-points measuring configuration). Borges and colleagues [60] gathered evidence of EleIS potential for earlier detection of plant diseases (they used in their study a four-points measuring setup and a range of frequencies starting at 1 kHz and extending up to 1 MHz). They observed differences in impedance spectra measured at the stem of young pine plants infected with the nematode Bursaphelenchus xylophilus.
Leaves are an essential part of plantsonce through them, carbohydrates are assimilated by photosynthesis and they help to regulate water flow during evapotranspiration. Basak et al. [61] proposed to evaluate plant water status; they utilized EleIS to model the relative water content of canola, corn, wheat, and soybean leaves (impedance spectroscopy measurements were made employing a four-points setup for operating frequencies in the range 5–100 kHz, and a 2Vp-p AC voltage amplitude). Recently, Basak and his team [62] pursued their research into ageing using EleIS (a 2Vp-p AC voltage amplitude was applied while varying the frequency in a range from 5 to 15 kHz for a four-points measuring setup) and evaluated the nitrogen content of the leaves of those same crops (canola, corn, wheat, and soybean); they observed a strong connection between the leaves’ impedance and their water availability. Sugiyama and co-workers [63] demonstrated that the incidence of solar light on plant leaves is reflected in their impedance spectra; they conducted their EleIS experiments under dark conditions at 23 °C while applying a 20 mV AC signal possessing frequencies ranging from 10 Hz to 10 MHz, using a four-points measuring setup.
Still in the domain of plants, the evaluation of fruits, particularly those that contain seeds required for reproduction, is of great commercial interest. EleIS measurements allowing for the evaluation of fruit maturity and firmness were performed by Ivanovski and colleagues [64] (impedances were measured using a four-points configuration, applying an AC voltage with 500 mV of amplitude and possessing a frequency of 10 kHz). The experimental results showed a significant correlation between impedance and firmness (the more mature the fruit was, the lower the impedance was). The results allowed them to conclude that the measured impedances could be used to predict fruit firmness when combined with machine learning models.
EleIS has also been applied to evaluate the effects of some agricultural products’ processing procedures, such as drying and freeze–thawing. Wu et al. [65] performed such evaluation on eggplant pulp; the impedance, resistance, and reactance of the samples were obtained over the frequency range of 42 Hz–5 MHz under an AC voltage with an amplitude of 1 V, utilizing a four-points measuring setup. Watanabe et al. [66] extracted a feature from the Nyquist plots (length of the impedance vector, Ztop, where the circular arc in the Nyquist plot reaches its zenith) and proposed it to assess damage in biological tissue during the processing of agricultural products. They conducted the study in Japanese pears after drop tests, and the results showed that the resistance of the protoplasm of the injured tissues increased slightly; in contrast, the capacitance of cell membranes and the resistance of apoplast fluids (apoplast is the continuous space external to the plasma membranes existent throughout the plants that facilitate the transport of water and solutes) significantly decreased (the Nyquists were obtained at a 25 °C temperature, for frequencies in the interval 42 Hz to 1 MHz, possessing an AC voltage amplitude of 1.0 V, using a four-points measurement setup).

2.1.3. IS in Materials Science and Applied Technologies

Impedance Spectroscopy is an essential analysis tool in several areas of Materials Science, being capable of providing important information about the electrical properties of materials, which are directly related to the rates at which chemical reactions occur, their dielectric characteristics, corrosion potential, microstructure, and types of conduction mechanism [67,68,69,70]. The electrical response determined by IS has been widely used as a signature of phenomena experienced by materials based on their interaction with the environment and/or other materials. Flexible electrode devices, sensors, biosensors, photoelectrochemical cells, supercapacitors, fuel cells, and protective coatings are emerging areas where Impedance Spectroscopy is applied in developing new functional materials [71,72,73,74]. Metal oxides, metal nanoparticles, and carbon-based materials have been widely used to produce functional devices that meet emerging demands in these areas due to their viable electronic properties, sensitivity to variations in environmental parameters, high chemical and structural stabilities over a wide range of temperatures, nanoscale size particle distribution, high surface area/volume ratio, and interaction with other functional materials.

IS in Flexible Structures and Sensing Applications Assessment

IS has been used to study flexible materials applications, such as electrodes for miniaturized devices with reliable and reproducible responses (for usage in systems with high potential, on-demand solutions for emerging micro and nanoelectronics technologies). Conductive inks based on silver nanoparticles, with different formulations, were produced to develop inkjet-printed flexible electrodes [75]. The authors assessed by EleIS the electrical behavior of the electrodes, and demonstrated that it was directly influenced by the ink curing temperature (150–300 °C) and by the electrode design (measurements were performed using a four-points setup using an input AC voltage possessing an amplitude of 10 mV, in a frequency range from 0.1 Hz to 100 kHz). The resistivity of the inks was recorded in the range of 3 to 5 µΩ.cm, and the fabricated electrodes had an electrical impedance modulus of less than 200 Ω, confirming their viability for sensing applications employment.
Maged et al. [76] recently developed a new electrically conductive paint based on copper oxide (CuO) nanospheres and reduced graphene oxide (rGO) nanoplates for producing flexible electrodes. EleIS was used to model the electrical response of the paint as a function of the variation in the CuO/rGO ratio (impedance spectra were acquired while applying to the electrode specimens a constant current density of 50 mA·cm−2, in a frequency range between 0.1 Hz and 10 kHz, using a four-point measurement arrangement). The results revealed that it was possible to develop electrodes that displayed energy-storing properties and, consequently, that could be used in batteries.
Tai and colleagues [77] used rGO nanoplates to develop three flexible electrode types for humidity sensors. Assuming that carbon-based nanomaterials actively respond to variations in moisture concentration, the authors produced sensors with reversible responses in short time intervals; using EleIS data analysis and interpretation tools, they related the results gathered for varying humidity levels directly with the alterations in the contact resistance of the samples, with the capacitive reactance at the interface between the rGO nanoplates, and with the observed electrical resistance of the nanoplates (EleIS data was obtained using a four-points configuration approach, with frequencies ranging from 20 Hz to 2 MHz). The electrical signature of humidity variations over a wide range of relative humidity (20–95%) was validated by repeated experiments, demonstrating the predominance of a proton-hopping conduction mechanism.
Bhat’s group [78] studied a flexible electrode based on multi-layer carbon nanotubes (MWCNTs), which are eco-friendly and prepared without the presence of binding additives. Using EleIS, the Nyquist plots of the evaluated electrodes showed a straight line inclined at 45° in the low-frequency region, and a small semicircle at high frequencies (a four-points measuring setup was used while stimulating the electrodes in the range of 10 mHz to 100 kHz); accordingly, the authors concluded that the electrode possessed an electrical behavior with high similarity to that presented by a capacitor, displaying fast energy charge and discharge cycles. Reshma et al. [79] developed a flexible electrode based on an MWCNTs nanocomposite functionalized with copper (Cu) and tungsten trioxide (WO3) nanoparticles for sensing the valuable life of lubricating oils. Intending to establish a quality control tool for oil samples, they applied EleIS to determine the electrical response of nanocomposites to oils’ oxidation dynamics (obtained via the application of a four-points measuring setup in the frequency range of 1 Hz to 1 MHz), which showed it to be essential to differentiate fresh oil from aged ones.
Due to the demands of the soft robotics area, Nguyen et al. [80] used EleIS to characterize a tactile, flexible, and highly sensitive proximity sensor (for the measurements, they used a four-points configuration and a stimulus possessing a frequency of 100 kHz). The sensor prototype was produced using carbon micro-coils on a dielectric elastomer substrate. The researchers demonstrated that sensors with dimensions of 10 cm × 10 cm could detect objects with a mass of the order of mg at up to 15 cm from the sensor surface, with repeatability and structural durability.
Quan et al. [81] proposed an electrically functional adhesive tape for detecting water leaks in plumbing systems. The tape was made using low-cost commercial materials, and presented a sandwich design consisting of a sheet of dielectric material between layers of flexible electrodes, followed by adhesive fixation layers. The entire length of the device inside the tubes was monitored by an electronic control unit using the EleIS technique (a conventional four-points measuring strategy was used, stimulated by a sinusoidal signal posing a frequency of 10 Hz and peak-to-peak voltage of 10 V). The build devices were successfully applied to monitor leaks of minimum volumes of water (on the order of μL) with a temporal resolution of 5 s. The authors expect the positive results to serve as the basis for developing continuous-leak-monitoring systems in real-time and with a viable cost–benefit.
Soares et al. [82] developed a carbon dot-based electronic tongue to detect milk bacteria. Zein electrospun nanofibers (regenerated protein fibers made from corn and maize) were dispersed over a carbon layer to provide the nanodevice with a more reactive surface. EleIS monitored the population dynamics of Staphylococcus aureus bacteria in milk (measures were conducted utilizing a four-points measuring setup for frequencies between 1 Hz and 2 MHz), providing a unique electrical behavior pattern when in contact with the device. The obtained capacitance data were translated into machine language and interpreted according to the known conditions of the infected milk samples. The results confirmed a device with high sensitivity, selectivity, and reproducibility, with an accuracy rate of around 80%. The authors predict that the scalability of the device could make it essential for the early and in situ detection of the disease without additional laboratory tests.

IS Used on the Development/Optimization of Materials for Applications Related to Electrical Energy Production/Storage

IS has been used to study new materials that comply with current electrical energy demands [83,84,85]. For example, photoelectrochemical cells are efficient devices for converting light into electrical energy and are an alternative solution to solid-state photovoltaic systems. Their construction is relatively simple and low-cost compared to other energy conversion technologies. Developing a photoelectrochemical cell involves the availability of conductive and semiconductor materials that close the electrical circuit when contacting the electrodes.
A nanocomposite of erbium, zirconium, nickel sulphide, and graphene oxide was prepared on an ITO surface (glass sheet coated with indium-doped tin oxide) as a transparent photoelectrode for a photoelectrochemical cell [86]. The electrical characterization of the cell by EleIS (the assessment was performed in the range of 0–10 kHz with an AC voltage with an amplitude of 0.01 V using a four-points setup) showed that the molecular interactions between the cell materials guaranteed the device a bandgap of 2.9 eV, a specific capacitance of 580 F/g in the presence of light, a photocurrent density of 35 mA, and a cell electrical resistance of 268 Ω; the electrical evaluation also allowed them to demonstrate that the diffusion of ions occurs easily through the electrolyte. The relationship between the surface area of the composite (optimized by the introduction of GO) and the impedance justified the statement that ions penetrate the entire available area of the electrode, increasing the efficiency of redox reactions. In addition, EleIS allowed them to conclude that the device’s energy efficiency is directly related to the order of magnitude of the resistance of the cell, and to identify possible limitations in the use of the nanocomposite film.
Liu et al. [87] developed perovskite-based solar cells with improved performance. The authors reported a cell’s carbon electrode coated with a heterojunction formed by lead iodide perovskite and titanium dioxide, and subsequently encapsulated with polydimethylsiloxane. This approach guaranteed the device an excellent photovoltaic efficiency (short-circuit photocurrent, JSC, of 23.5 mA/cm2, and open-circuit photovoltage, VOC, of 0.97 V), which offered an efficiency of converting light into electrical energy of approximately 11% under simulated sunlight (standard 1.5 air mass, and 100 mW/cm2 intensity), and stability for up to 3000 h of tests. Impedance spectroscopy measurements (conducted in the frequency range from 100 Hz to 1 MHz, for different applied bias, between −0.20 V to −0.9 V, using a four-points configuration procedure) revealed more efficient charge transport with a significant reduction in charge recombination in the system. This analysis suggests that the nanocomposite is a candidate material for developing new perovskite-based hybrid solar cells with low cost, high efficiency, and improved stability.
The Gul group [72,85,86,88] has recently contributed new sustainable solutions to this field of research, using sulphide metals derived from rare earths (known to increase optical transparency and improve the device’s electrical and photocatalytic characteristics). In one of their recent efforts [72], they proposed a photoelectrochemical cell with a neodymium indium sulphide electrode. The electrode preparation process involved the deposition of Nd4In5S13 on an ITO substrate using a spin coating technique and subsequent heating process of the resulting materials. Samples characterization revealed a nanomaterial with a crystalline and compact structure, with high specific capacitance (570 F/g in light—150 W Halogen lamp, and 481 F/g in darkness) and short-circuit photocurrent above 280 mA/cm2. Electrical investigation of the cell electrode by EleIS (evaluation carried out for a frequency range from 0 to 10 kHz with an AC voltage amplitude of 0.01 V through a classic four-points setup) demonstrated that it possessed an internal resistance of approximately 230 Ω. In other work by the Gul group, neodymium and ytterbium sulphide (NdYbS3) [88], and a composite of ytterbium, copper and zinc sulphides (Yb2S3:Cu2S:ZnS) [85], were made using a similar preparation method and studied as electrodes. The electrodes presented an even higher specific capacitance (851 F/g for NdYbS3 and 789 F/g for Yb2S3:Cu2S:ZnS in light) and internal resistances of around 220 Ω and 23 Ω, respectively. In both cases, the evaluation of the cell electrodes was done by EleIS (measurements were conducted for frequencies between 0 Hz and 10 kHz, with an AC voltage amplitude of 0.01 V and using a four-points configuration), and the observations were used to support the claim that the new materials were efficient for usage in supercapacitor and solar cell applications.
Supercapacitors represent other emerging functional materials where IS usage is essential for developing and improving manufactured devices. Supercapacitors represent an emerging class of capacitors that store and deliver between 10 and 100 times more electrical energy from their bulks faster than usual capacitors. These materials are generally used in devices that require fast charge and discharge cycles, such as batteries, photovoltaic cells, smart windows, and wearable capacitors. A supercapacitor comprises two electrodes with a porous surface and a thin separator, with high electrical resistance between them. During an interaction with the electrolyte (usually a selective salt-containing solvent), the separator material must prevent contact between the electrodes but allow charge transfer in the system. One of the challenges involves the development of environmentally friendly devices with the potential to solve energy problems of global interest.
In a recent work, a nickel-doped nano spinel magnesium ferrite (Ni-doped MgFe2O4 samples)/1 M KOH electrolyte system was evaluated as a supercapacitor [89]. The Ni0.35Mg0.65Fe2O4 combination exhibited an extraordinary specific capacitance of 119 F/g, maintaining approximately 95% cyclic stability after 5000 charge and discharge cycles. EIS was used to analyze the electrochemical properties of the device (using a three-electrode cell configuration, where Pt served as the counter electrode in addition to the working electrode and Hg/HgO reference electrode), and the obtained electric results were related to the nanometric size of the crystallites (in the range of 8–11 nm), and with the excellent diffusion capacity of the ions. Using the same electrolyte, another semiconductor configuration, zinc ferrite oxide (ZnFe2O4), exhibited an even higher specific capacitance of 131 F/g, with cyclic stability of 92% after 1000 cycles [90]; all EIS measurements were carried out using a three-electrode system with a working electrode, a saturated calomel reference electrode, and a platinum wire counter electrode in the frequency range of 0.01 Hz and 100 kHz.
The emergent appeal for developing new sustainable and low-cost materials with improved performance has triggered the search for functional natural and/or recyclable materials for manufacturing supercapacitors. For example, Das et al. [91] developed a supercapacitor with eggshell membrane (ESM) electrodes coated with carbon nanotubes and an in-natura ESM separator in a 1 M KOH electrolyte. The device exhibited a constant current density of 10 mA·cm−2 and an excellent stability of approximately 99% after 2 × 10⁵ cycles. EleIS characterization in the 10 mHz to 100 kHz range was established as a signature of the hybrid electrodes’ ion transfer and electrical conductivity for a typical coin-cell configuration (two-points measuring setup). In the same vein, Figueroa-González et al. [92] studied the potential usage of recycled tetrapak packaging impregnated with silver nanoparticles/barium molybdate (Ag/BaMoO4) as a flexible and high-efficiency supercapacitor (capacitance of 443 F/g and 92% stability after 500 charge/discharge cycles). EleIS tests were carried out using an AC voltage with 30 mV of amplitude, in the frequency range of 10 Hz–100 kHz, under a typical capacitor configuration; results showed that the progressive introduction of nanoparticles significantly reduced the charge-transfer resistance, facilitating the diffusion of ions in the system.

IS Used on the Development/Optimization of Materials for Corrosion Processes Assessment

Metal surface protection systems (or anticorrosive coatings) are required to prevent the corrosive action of the medium (generally oxygen in the air or water) in which the metal is located. In this context, Impedance Spectroscopy is an effective tool for monitoring and preventing the degradation that metal materials can experience. Reinhard et al. [93] used EleIS for characterizing the corrosion-protective performance of organic coatings on metals (impedance was acquired using a capacitor-type sandwich cell in the frequency range of 0.05 to 50 kHz, with an AC voltage possessing an amplitude of 20 mV). Roggero et al. [94] developed an epoxy varnish to protect carbon steel. The corrosion experiments were carried out in an aqueous solution of sodium chloride; EIS evaluation demonstrated that the study of the mobility of epoxy protection in this environment was essential for analyzing its barrier property against carbon steel corrosion (measurements were performed with a conventional three-electrode cell, where a REF201 Red-Rod saturated KCl served as reference electrode, and a graphite rod was used as a counter-electrode, in the frequency range of 10−2–105 Hz, with a voltage of an amplitude of 1 V, RMS). Narozny et al. [95] applied EIS to study 4 types of steel protective coatings of a cathode material soaked in artificial seawater, seeking to develop a new construction material (experiments were performed with an AC voltage of 15 mV of amplitude, a frequency interval ranging from 0.05 Hz to 10 kHz, and in a three-points standard cell arrangement). The temporal evolution of the EIS spectra of the samples was directly related to the corrosion rates and allowed for the distinction between samples with and without coating protection. The Šoić group [96] contributed to this research topic, developing a new type of electrolytic cell by applying a conductive paste in a two-electrode system, which was used to evaluate the effect of organic protective layers on bronze. EIS assessment showed the system’s sensitivity for monitoring and preventing corrosion in metal (the frequency range used in the measurements was between 10−1 and 105 Hz, and an AC voltage signal of 10 mV of amplitude, in a three-points standard cell where a single carbon-based polymer electrode acted as a counter and reference electrode simultaneously). Almufarij [97] recently proposed a new environmentally friendly, low-cost coating for protecting mild steel in acidic media (1 M HCl). The coatings were produced with shrimp shell waste and polystyrene without additives. The results of the EIS measurements confirmed that the alternative coating material efficiently protected steel in acidic environments (measurements were conducted in a conventional three-electrode cell configuration consisting of the proposed modified electrode as working electrode, Ag/AgCl as reference electrode, and a platinum wire as counter electrode in the frequency range from 1 to 105 Hz, with an AC voltage of 0.05 V of amplitude).

2.1.4. IS Summary

In summary, for all mentioned examples, IS was established as an essential investigative technique for the electrical characterization of materials/systems. Table 1 displays a summary of the data collected, mainly regarding the cell configuration approach and frequency range, from which their importance in developing and improving new solutions in many application domains can be concluded. Nevertheless, it can also be observed that when applying EleIS, the frequency ranges are wider and reach MHz. Also, in contrast, it can be observed that several works reported the simultaneous use of a DC bias signal together with the AC applied one when using EIS.

2.2. Basics of Impedance Spectroscopy and Modelling

In the study of the electrical properties of materials, it is common to apply the term electrical resistance for data analysis. This term can be interpreted as the ability of a material to oppose the passage of an electric current. The so-called Ohm’s Law defines ohmic resistance ( R Ω ) in terms of the ratio between voltage (V) and current (I), R Ω = V / I . Although this relationship is well known, its use is limited to direct current, DC, mode excitation.
More generally, and for a deeper understanding of the electrical response of a system, a more comprehensive approach needs to be used, known as the generalized Ohm’s Law, where an impedance is calculated instead. In it, an alternate current, AC, typically with a sinusoidal form ( I = I m c o s w t + , where I m is the current maximum amplitude, w is the angular velocity given w = 2 π f , and is the respective phase angle), is applied as a stimulus, and the voltage produced at the system terminals is measured ( V = V m c o s w t + θ , where V m is the current maximum amplitude, and θ is the respective phase angle. The impedance is then determined by dividing the measured voltage by the used current; if performed in the frequency domain, the impedance Z is given by Z = V m I m × e j ( θ ) , or in the complex form, Z = R + j X , where R is the resistance of the system ( Z = R = Z c o s ( θ ) ), and X is the reactance ( Z = X = Z s i n ( θ ) ).
If a purely resistive system is under evaluation (for instance, a single resistor), then the alternating current and respective voltage across the resistor will both be in phase. However, other circuit elements, such as inductors and capacitors, must be considered for a more detailed analysis of the electrical behavior of systems. Inductors and other known electrical components of systems represented (each displaying its own distinctive electrical behavior) are characterized by their inductance (L) and capacitance (C), respectively. Both are reactive in nature, with the main difference being that, while resistances dissipate energy in the form of heat, reactances store energy in the form of electric and magnetic fields.
The impedance is commonly measured using a low amplitude excitation signal to obtain its value as close as possible to the linearity condition (similar to DC mode excitation). In addition, it is possible to evaluate a material sample by analyzing its electrical response over a wide range of frequencies or frequency sweeps since the voltage potentials comply with a sinusoidal wave [5,99].
The main advantage of IS is that it allows for the identification of each electrical phenomenon present in a system once it reaches its maximum contribution at different excitation frequencies of the applied current. Besides, an equivalent electrical circuit that models the system response can be constructed. From those models, it is possible to analyze and interpret the transport of charges in solids and liquids, conductivity of films, capacitance of the electric double layer (resulting from the charge separation at the electrode/material interface), and the diffusion coefficients of charge carriers, among other phenomena [5,13,99].
If the under-evaluation system comprises a capacitor, the current and voltage observed will be out of phase. Thus, the impedance can be described in a phase diagram by a phasor with module |Z| and phase angle θ, with corresponding horizontal and vertical components representing the resistive and capacitive terms, respectively (the impedance Z can be written as Z = Z + i Z , where i = 1 , being the real part of Z, Z’ or ReZ, given by | Z | × c o s ( θ ) , and the imaginary part of Z, Z” or ImZ, described by | Z | × s i n ( θ ) ). In the literature, it is usual to plot instead Z = Z i Z , ensuring that the graphic representation stays in the first quadrant of the polar/complex representation. The impedance graph that relates its real and imaginary parts (ImZ versus ReZ) is called the Nyquist diagram (Figure 1a). From the graph, it is possible to obtain relevant information about the system, such as the bulk resistance ( R Ω ) and charge transfer resistance ( R c t ) of the material, as well as to detect the occurrence of diffusion processes.
Classical electrical components can be used to represent the known contributions to the total electrical conduction of a system in the equivalent electrical circuit model. For instance, it is common to use a resistor to represent the conduction paths along the grains of a material. However, the most common circuit component is a parallel association of a resistor and a capacitor. This fact is due to the diversity of conduction mechanisms that can be represented by it; among them are the conduction mechanisms along the grain boundaries caused by, for example, ion hopping or conduction along the surface of the grains/material (mechanisms of an electronic nature) [100,101] in the frequency domain Z R / / C = R 1 + j W R C . Figure 1b shows the trace of this element in the frequency domain using an Nyquist plot. Also, the electrical double layer formed in the interface between the material surface and the measuring electrodes, applied to measure the material impedance, can be represented by an R//C circuit.
In theory, at high frequencies, the interception of the Nyquist graph with the x–axis represents the ohmic resistance ( R Ω ), or simply the internal resistance of the system. In addition, the interception of the graph at low frequencies returns information about the value of charge transfer resistance ( R c t ) at the bulk/electrode interface. However, often, a depressed semicircle can be observed as a signature of the non-ideal behavior of the system under study (Figure 1c). This behavior may be related to environmental factors (temperature and pressure) and/or to different internal factors, such as the presence of a polycrystalline or multiphase structure (with different grain and sub-grain boundaries and grain sizes), the existence of functional groups at the grain/electrolyte interface, electrode effects (presence of porosity and/or different grain sizes), or to additional resistance of the electrolyte. This behavior may represent reactions with heterogeneous kinetics and different relaxation times in the sample (distribution of relaxation constants), determined from modelling using equivalent electrical circuits [1,2,102].
Constant-phase elements, CPEs, are also commonly used elements in model building. These elements are used to depict phenomena due to surface or the normal-to-surface distribution of properties (which combination can yield a surface-position-dependent local impedance, resulting from capacitance distribution in polycrystals [103], electrode geometry [104], and normal-to-surface distributions, such as resistivity or permitivity in oxide layers, passive films, and coatings [105]), electric double layers in the interfaces of systems under evaluation (such as electrode–electrolyte ones, which almost never behave as pure capacitors [106]), dispersion effects caused by ion adsorption/diffusion phenomena (for instance, charge transport phenomena occurring along open pores filled with water molecules and along the interface between the material and the measuring electrodes are examples of this type of mechanism [100,101,107]), or system-surface roughness [108]. In the frequency domain, Z E F C = A f n c o s n π 2 j s i n n π 2 , where A is the impedance value for the angular velocity of 1 rad/s, and f is the frequency. Figure 2 shows a trace of this type of element in the frequency domain using the Nyquist representation.
The Warburg impedance is a constant phase element with an angle of 45°. It typically represents diffusion mechanisms due to diffusion phenomena of reactive species or ions, such as the case where water is present (so, diffusion can be the consequence of conduction along open pores filled with water [109,110]). It should be noted that the Warburg impedance increases with decreasing frequency or with decreasing diffusion coefficient (the diffusion coefficient in the case of pores filled with water molecules represents the charge-transport-capacity provided by the interaction between a solute, in this case water, and a solvent, the porous medium filled with water molecules). In the frequency domain, Z W a r = A w 1 2 j A w 1 2 (where A is the Warburg coefficient, inversely proportional to the d i f f u s i o n   c o e f f i c i e n t 1 2 ) [99], and w is the angular velocity). Figure 2 shows the trace of this element in the frequency domain using the Nyquist representation.
The last most commonly used element in the development of equivalent circuits is the finite-length Warburg one, also referred to as O-element, which is mainly used to characterize diffusion processes in electrodes [111]. Mathematically, it is defined in the frequency domain by Z O = t a n h B × j w 2 Y 0 × j w 2 , where B = δ D (δ is the thickness of the diffusion layer and D is the diffusion coefficient), Y 0 = 1 2 2 × A (A is Warburg coefficient), and w is the angular velocity; the Nyquist plot can be seen in Figure 3.
To complement the Nyquist plots, Z’ and Z’‘ as frequency functions can also be plotted, known as Bode diagrams (Figure 4).
The combined analysis of the Nyquist diagram and the Bode curves provides complete information on the electrical behavior of the system.
In general, researchers combine elementary circuit elements to create their equivalent circuit models for representing the occurring phenomena in the under-evaluation systems by IS. To exemplify this procedure, we can mention the simplified Randles cell (which accounts for a solution resistance, a double layer capacitor and a charge transfer, or polarization resistance), that is typically the starting point for the development of other more complex models, the equivalent circuit and Nyquist plot of which are schematized in Figure 5.

2.3. Impedance Spectroscopy Modelling

The equivalent and representative model of the electrical response of the materials/systems must be simple, and the choice of its components must be consistent and in accordance with the physical/chemical mechanisms that take place [5,100,101,107,109]. Consequently, constructing an equivalent model based on a set of elements involves their association according to the classical rules of the theory of electrical circuit analysis, i.e., in series or parallel.
In modelling impedance spectra, the scientific community generalizes and widely accepts using a series association of elements. However, according to this theory, if an element constituting a specific material/system is not supported, i.e., it is not considered to be present (for example, if in a defined measuring range, for specific values, one contribution is not identified), then the approach based on parallel association will be more coherent. An open circuit represents a nonexistent element, according to the theory of electrical circuit analysis. Thus, in a serial association, this would represent a discontinuity in the circuit and, consequently, an interruption of all conduction mechanisms (Figure 6a). In contrast, in a parallel association (Figure 6b), the nonexistence of an element would not have such a consequence since all the remaining conduction mechanisms would maintain their contribution to the total conductance/impedance of the material/system. However, the parallel association rules make this approach much more complicated.

2.4. Materials Modelling by IS

Several examples of electrical circuit development based on IS application to interpret materials’ electrical response for differentiating chemical elements/electrolytes are found in the literature. Continuing the discussion started in the previous section, it is vital to highlight details of models for the analysis of emerging nanostructured materials. For example, and as previously mentioned, the model of one resistor–capacitor in parallel (R//C) is known to fit the impedance of an ideal dielectric, a pristine material with unique and well-defined characteristics (from the micro to the macro scale in its entire volume), and/or only in a specific region of a sample with the same electronic characteristic. An increasing number of scientific and technological applications of functional materials consider using heterogeneous nanostructures due to the possibility of improving characteristics and electrical response (compared to using just one of the pure components). Even using a pristine nanomaterial, it is possible to observe different dielectric behaviors (dielectric discrimination) in different regions and interfaces of the system (involving bulk, grain boundary, and measurement electrodes—see Figure 5); this is mainly due to the enormous surface area/volume ratio in interaction with the environment of these materials. In addition, heterogeneous nanostructures can exhibit polycrystalline behavior with different relaxation times, constituting a non-ideal impedance response. In such cases, the electrical response obtained from material evaluation generally cannot be modelled by the simple R//C model, making it necessary to expand the interpretation of the different contributions (Figure 7). Consequently, the authors use the series approach to represent these aspects [112,113,114,115,116]. The electrical response of several functional nanomaterials, including metal oxides, metal nanoparticles, conducting polymers, carbon-based materials, and their hybrids has been explained from this perspective [117,118,119,120,121,122,123,124,125,126]. For example, an essential contribution to the Materials Science domain was the development of a series of equivalent circuits as a universal model for carbon-based supercapacitors [127]. Activated carbon generally does not have a uniform grain size due to its synthesis process; consequently, a carbon electrode with multiple distributions of micro- and macro-pores in the nanostructure can be generated. So, to model the electrical response of the device, the authors of the work suggested an equivalent circuit with a vertical network of capacitance and resistance contributions from the n-grains in series with a single R//C combination, representing the bulk resistance and capacitance of the electrolyte solution.
Among the diverse examples found in the literature using the serial combination of elements is the one from Zhang et al. [128], where they modelled lithium-ion capacitors based on the experimentally obtained Nyquist data.
They followed a serial approach, for which they identified the following contributions (Figure 8): an internal ohmic resistance (Ro); a charge transfer between electrolyte and electrode corresponding to the embedment/ejection of internal lithium-ion capacitor ions and ion adsorption/desorption, represented by a parallel combination of Rct and Cdl, where Rct is the charge transfer resistance or electrochemical reaction resistance and Cdl is the electrical double-layer capacitance; a constant phase element, QW, in series with intercalation capacitance, CW, due to ion diffusion in the electrodes in a spherical structure, but not along a single direction. In addition to typical cases, this serial approach has recently been used to study the dynamics of biological materials in food and plant science. For example, Liu et al. [116] mentioned researchers using this type of equivalent circuit-building methodology to represent the contributions of electrode–soil and electrode–stem contacts, as well as root medium, to study the state of plant roots.
In contrast, few works can be found in the literature using a parallel association methodology for constructing electrical equivalent circuit models. Edvinsson et al. [129] reported a detailed impedance spectroscopy study of Ni-Mo- and Ni-Fe-based electrocatalytic materials deposited onto porous and compact substrates. The results were interpreted using equivalent circuit models. EIS measurements were carried out in a three-electrode cell at room temperature. The samples were used as working electrodes, while Ag/AgCl and Pt wire or wire mesh were used as reference and counter electrodes, respectively. The electrolytes used were 1 M NaOH or 1 M KOH (pH = 14). The measurements were performed in the frequency range between 0.7 Hz and 100 kHz, using a 10 mV peak amplitude AC voltage. One of the equivalent circuits used to model the electrical response is depicted in Figure 9a. The authors identified the contributions of an electrochemical double layer capacitance, Cdl, a series resistor, Rs (accounting for the substrate and the electrolyte resistance), a resistor Rct (representing the reaction charge transfer resistance), and a resistor in series with an inductor, La-Ra1 (representing the additional part of the impedance response that is due to a changing surface coverage of adsorbed species). A representation of some of the fitted parameters for the proposed model can be seen in Figure 9b.
Tolouei and his collaborators [130] presented three-dimensional impedance-based biochemical sensors based on their work. The 3D sensors use suspended electrodes in contact with the analyte solution through their top and bottom surfaces, doubling the interface area. For characterizing the sensors they used EleIS, and they observed that a larger solution–electrode interface area allowed the electrolyte solution to interact with a larger electrode surface, which resulted in larger values of solution-sensitive parameters, such as double-layer capacitance and Warburg coefficient; consequently, using the results they improved the sensitivity of the sensor. When they compared the performance of one conventional 2D planar interdigitated sensor and two 3D sensors using different concentrations of di-ethylhexyl phthalate in deionized water, they found that the 3D sensors provided higher sensitivity. Using the obtained Nyquist plots (Figure 10a,b), they developed an electrical equivalent model (Figure 10c) using a parallel-based strategy; the fit adjustment was of reasonably good quality (Figure 10d,e). In the equivalent electrical circuit, RT1,2 represent the resistance of the transmission lines connecting the electrodes to the contact pads, Csub1,2 and Rsub1,2 are the capacitance and the resistance between the electrodes and the substrate, respectively, Rsol is the solution resistance, Cdl1,2 represent the double-layer capacitance, ZW1,2 is a Warburg impedance for accounting for the phenomena at the interface between the two electrodes and the solution, while Rdi1,2 and Cdi1,2 represent the resistance and capacitance created on the surface of the polysilicon electrodes due to the formation of a thin silicon dioxide film on the electrodes’ surface, respectively.
Wang et al. [131] also pursued a parallel association approach. In their study, an interdigitated array (IDA) microelectrode-based impedance immunosensor was developed for a new application of sensitive, specific, and rapid detection of the AI virus H5N1. The system was based on combining an IDA microelectrode with specific capture antibodies, red blood cell bio label, and impedance measurements. The collected impedance data were modelled with good superposition between the experimental data and the fits. Figure 11 shows the equivalent circuit in the presence of a redox probe and an example of the immunosensor electrochemical impedance response and respective fitted data. The circuit includes the ohmic resistance of the electrolyte solution, R3, a Warburg impedance, ZW, which resulted from the diffusion of ions to the electrode interface from the bulk of the electrolyte, an electron transfer resistance, R1 which resulted from the diffusion of ions to the electrode interface from the bulk of the electrolyte, an electron transfer resistance, R1, and a double layer capacitance contribution modelled by a parallel association between a capacitor, C1, and a branch composed by a second capacitor, C2, in series with a resistor, R2.
In a work by Faia et al. [132], undoped and niobium oxide-doped TiO2:WO3 MMOs were fabricated. The solid sensors were manufactured from TiO2, WO3, and Nb2O5 powders; initially, TiO2 and WO3 powders were mixed in the molar volume ratio of 48.92:51.08%, respectively; the Nb2O5 dopant was subsequently incorporated, in specific proportions of 4 and 6% wt%. Then, EleIS was used to characterize the electrical response of the samples to variations in relative humidity, using an excitation signal with a maximum amplitude of 0.5 V, in the range of 1.5 kHz to 40 MHz, while varying the humidity concentration from 10 to 100%. In the proposed electrical equivalent model, using a parallel strategy of terms association, see Figure 12 (for which some examples of experimental data fitting are displayed), they identified several terms (in accordance with the known existent phenomena), contributing to the overall electrical response of the sensors.
Based on the Nyquist plots analysis, the identified terms were: (i) a parallel association between a resistor and a capacitor, R1//C1, representing the opposition that grains and grain agglomerates present to the charge transportation; (ii) a constant-phase element, CPEel, representing ion diffusion along the interface between the surface of the material and the measurement electrodes; (iii) a second constant phase element, CPEpo, that stands for diffusion of charges along the pores filled by water molecules; (iv) a capacitor, Cgeo, representing the geometric effect of the location of the measurement electrodes (positioned on the upper face but at opposite ends of the material); (v) a resistor in parallel with a capacitor, R2//C2, that account for the contribution of conduction along the boundaries between grains or between clusters, of the Schottky barrier type; (vi) another resistor in parallel with another capacitor, R3//C3, representing the charge transport that takes place along the surface of the grain agglomerates; (vii) one more resistor in parallel with an additional capacitor, Rsu//CPEsu, standing for the contribution of conduction, by diffusion of ions, along the surface of the samples covered by layers of water vapor because of “electron tunnelling”.
So, in conclusion, independently of the approach taken, the important aspect is that the equivalent circuit model must incorporate, in a proper way, the known existing effects contribution to the overall observed electrical conduction. Each one has its advantages and disadvantages. The serial is classic, and for which the mathematical adjustment of the circuit’s elements is easier. The parallel is more adaptable and coherent along the entire evaluated electrolyte range, with the diverse phenomena present for each evaluated value of the electrolyte; however, the mathematical tuning of the electric circuit parameters is much more complex (due to the differences in the rules in the calculation of series and parallel association of electrical circuits components), so it less used.

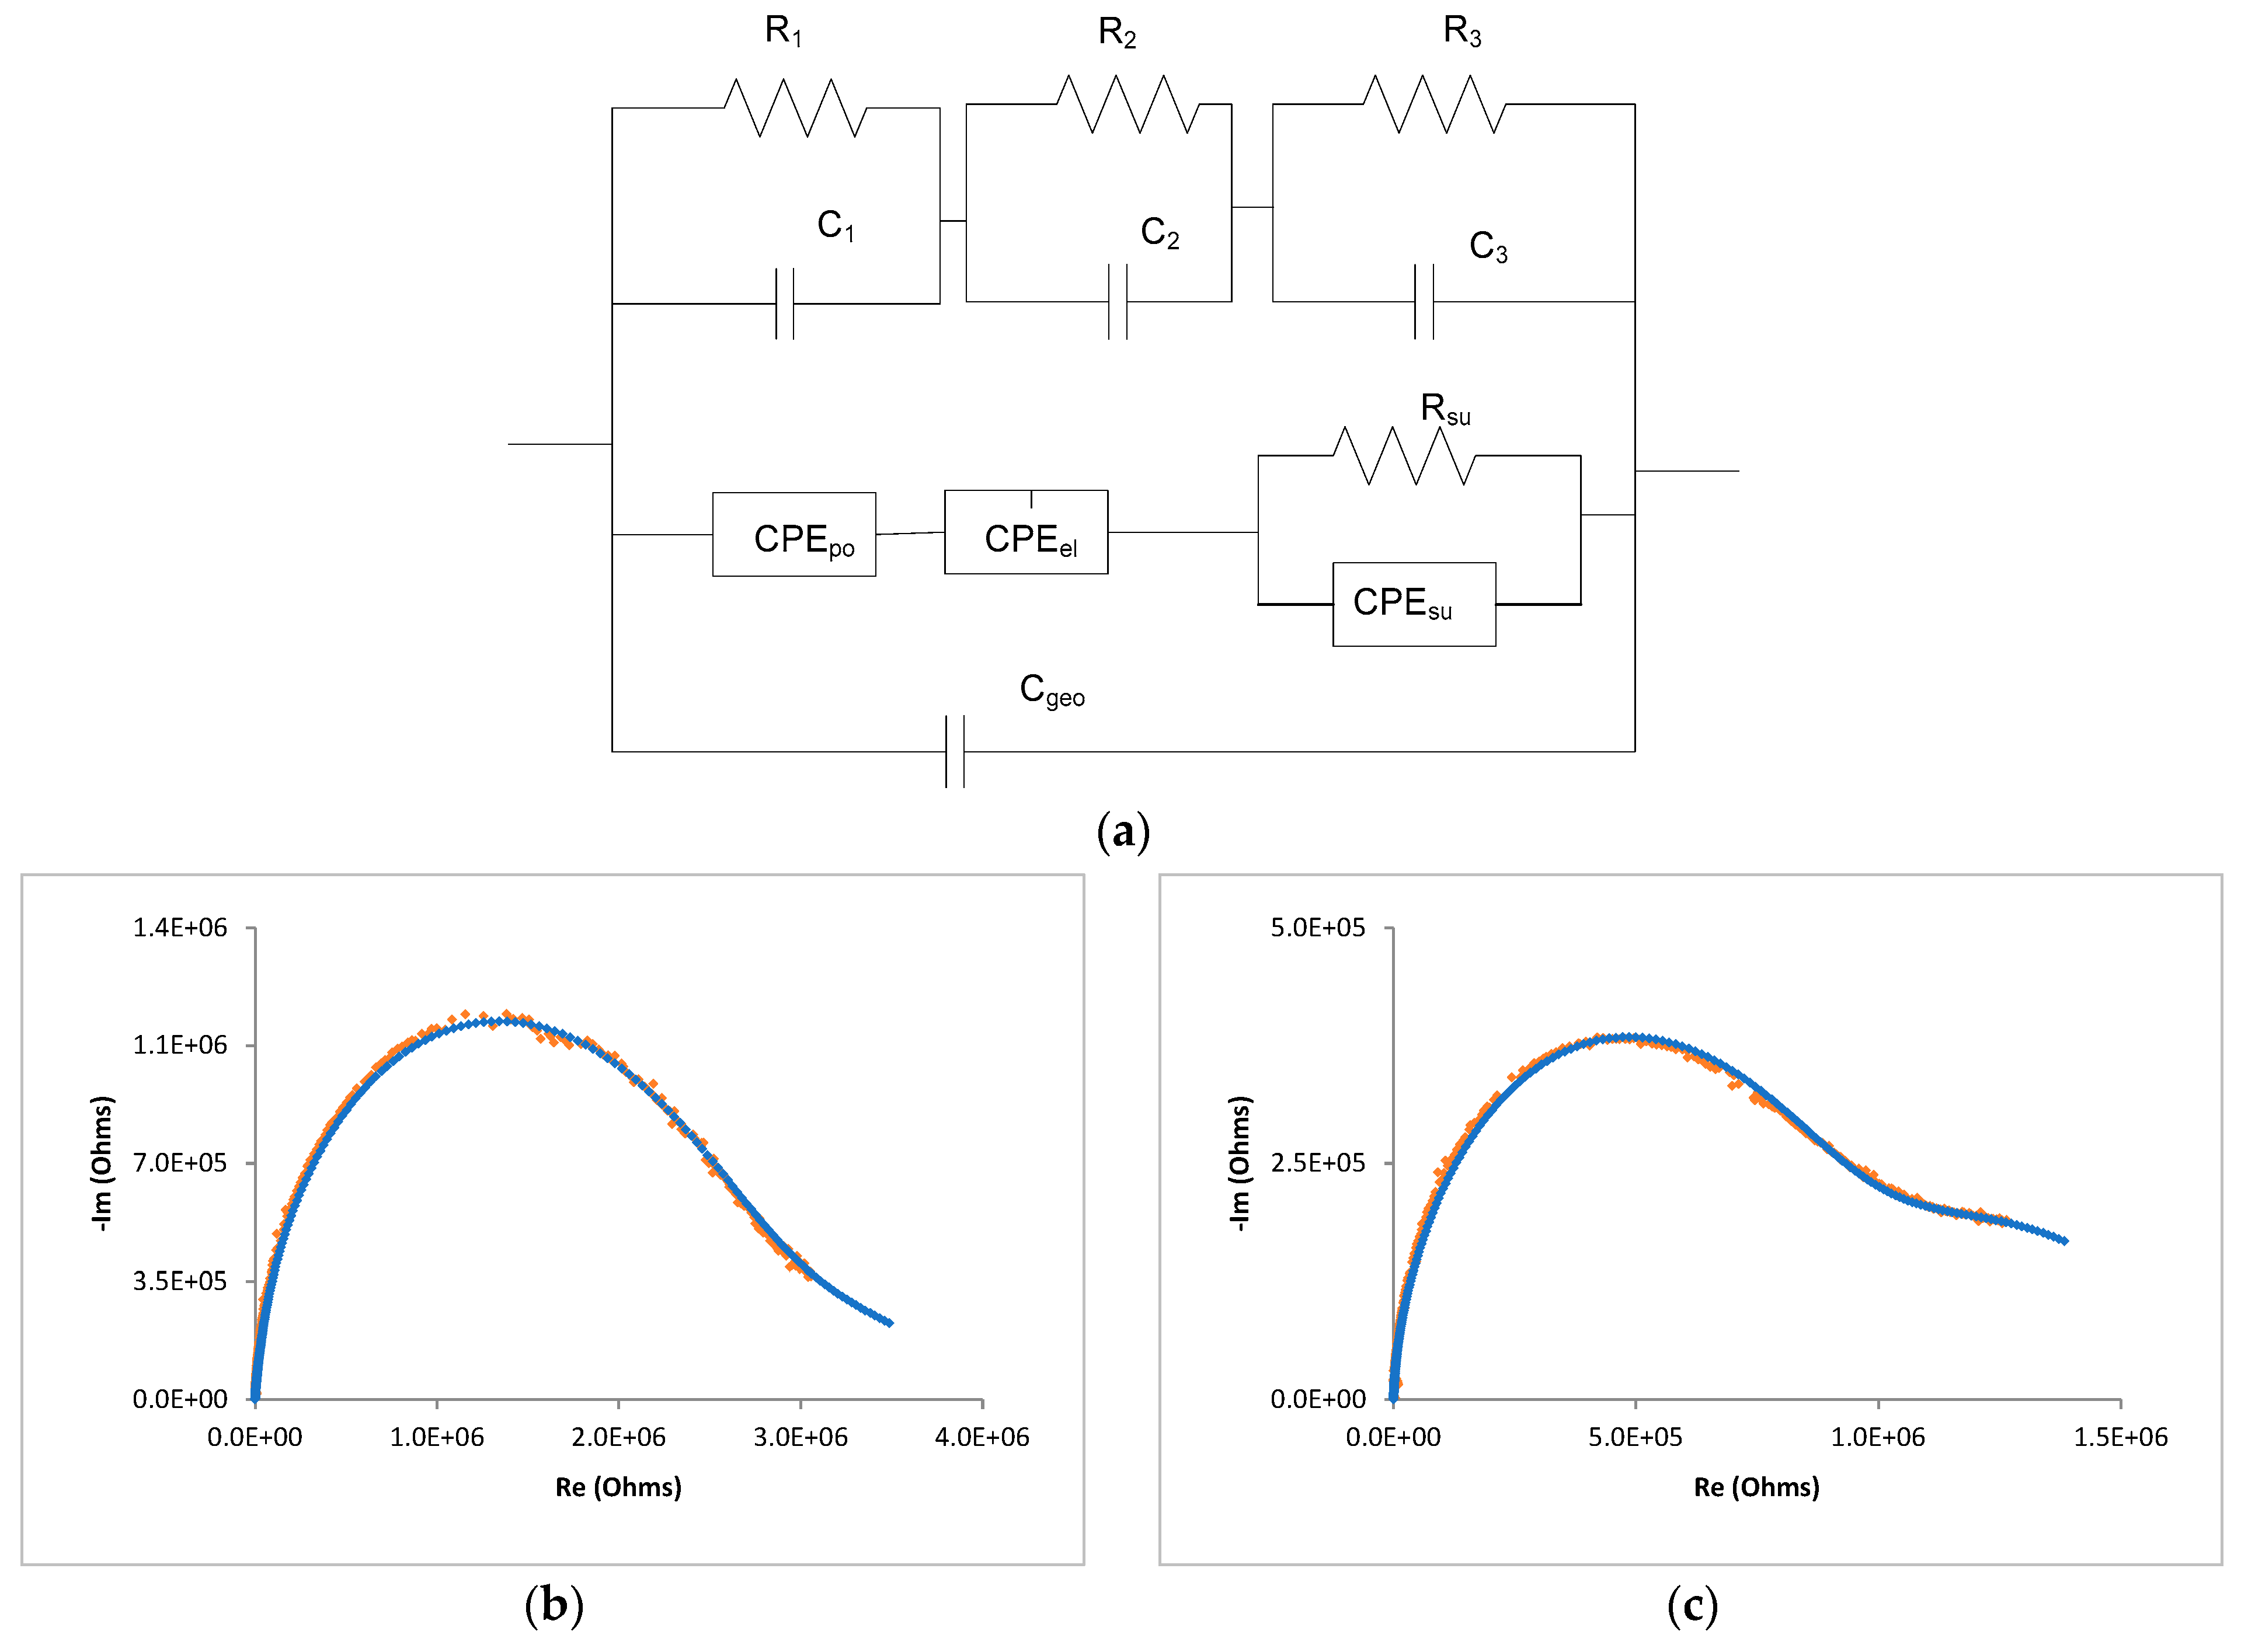
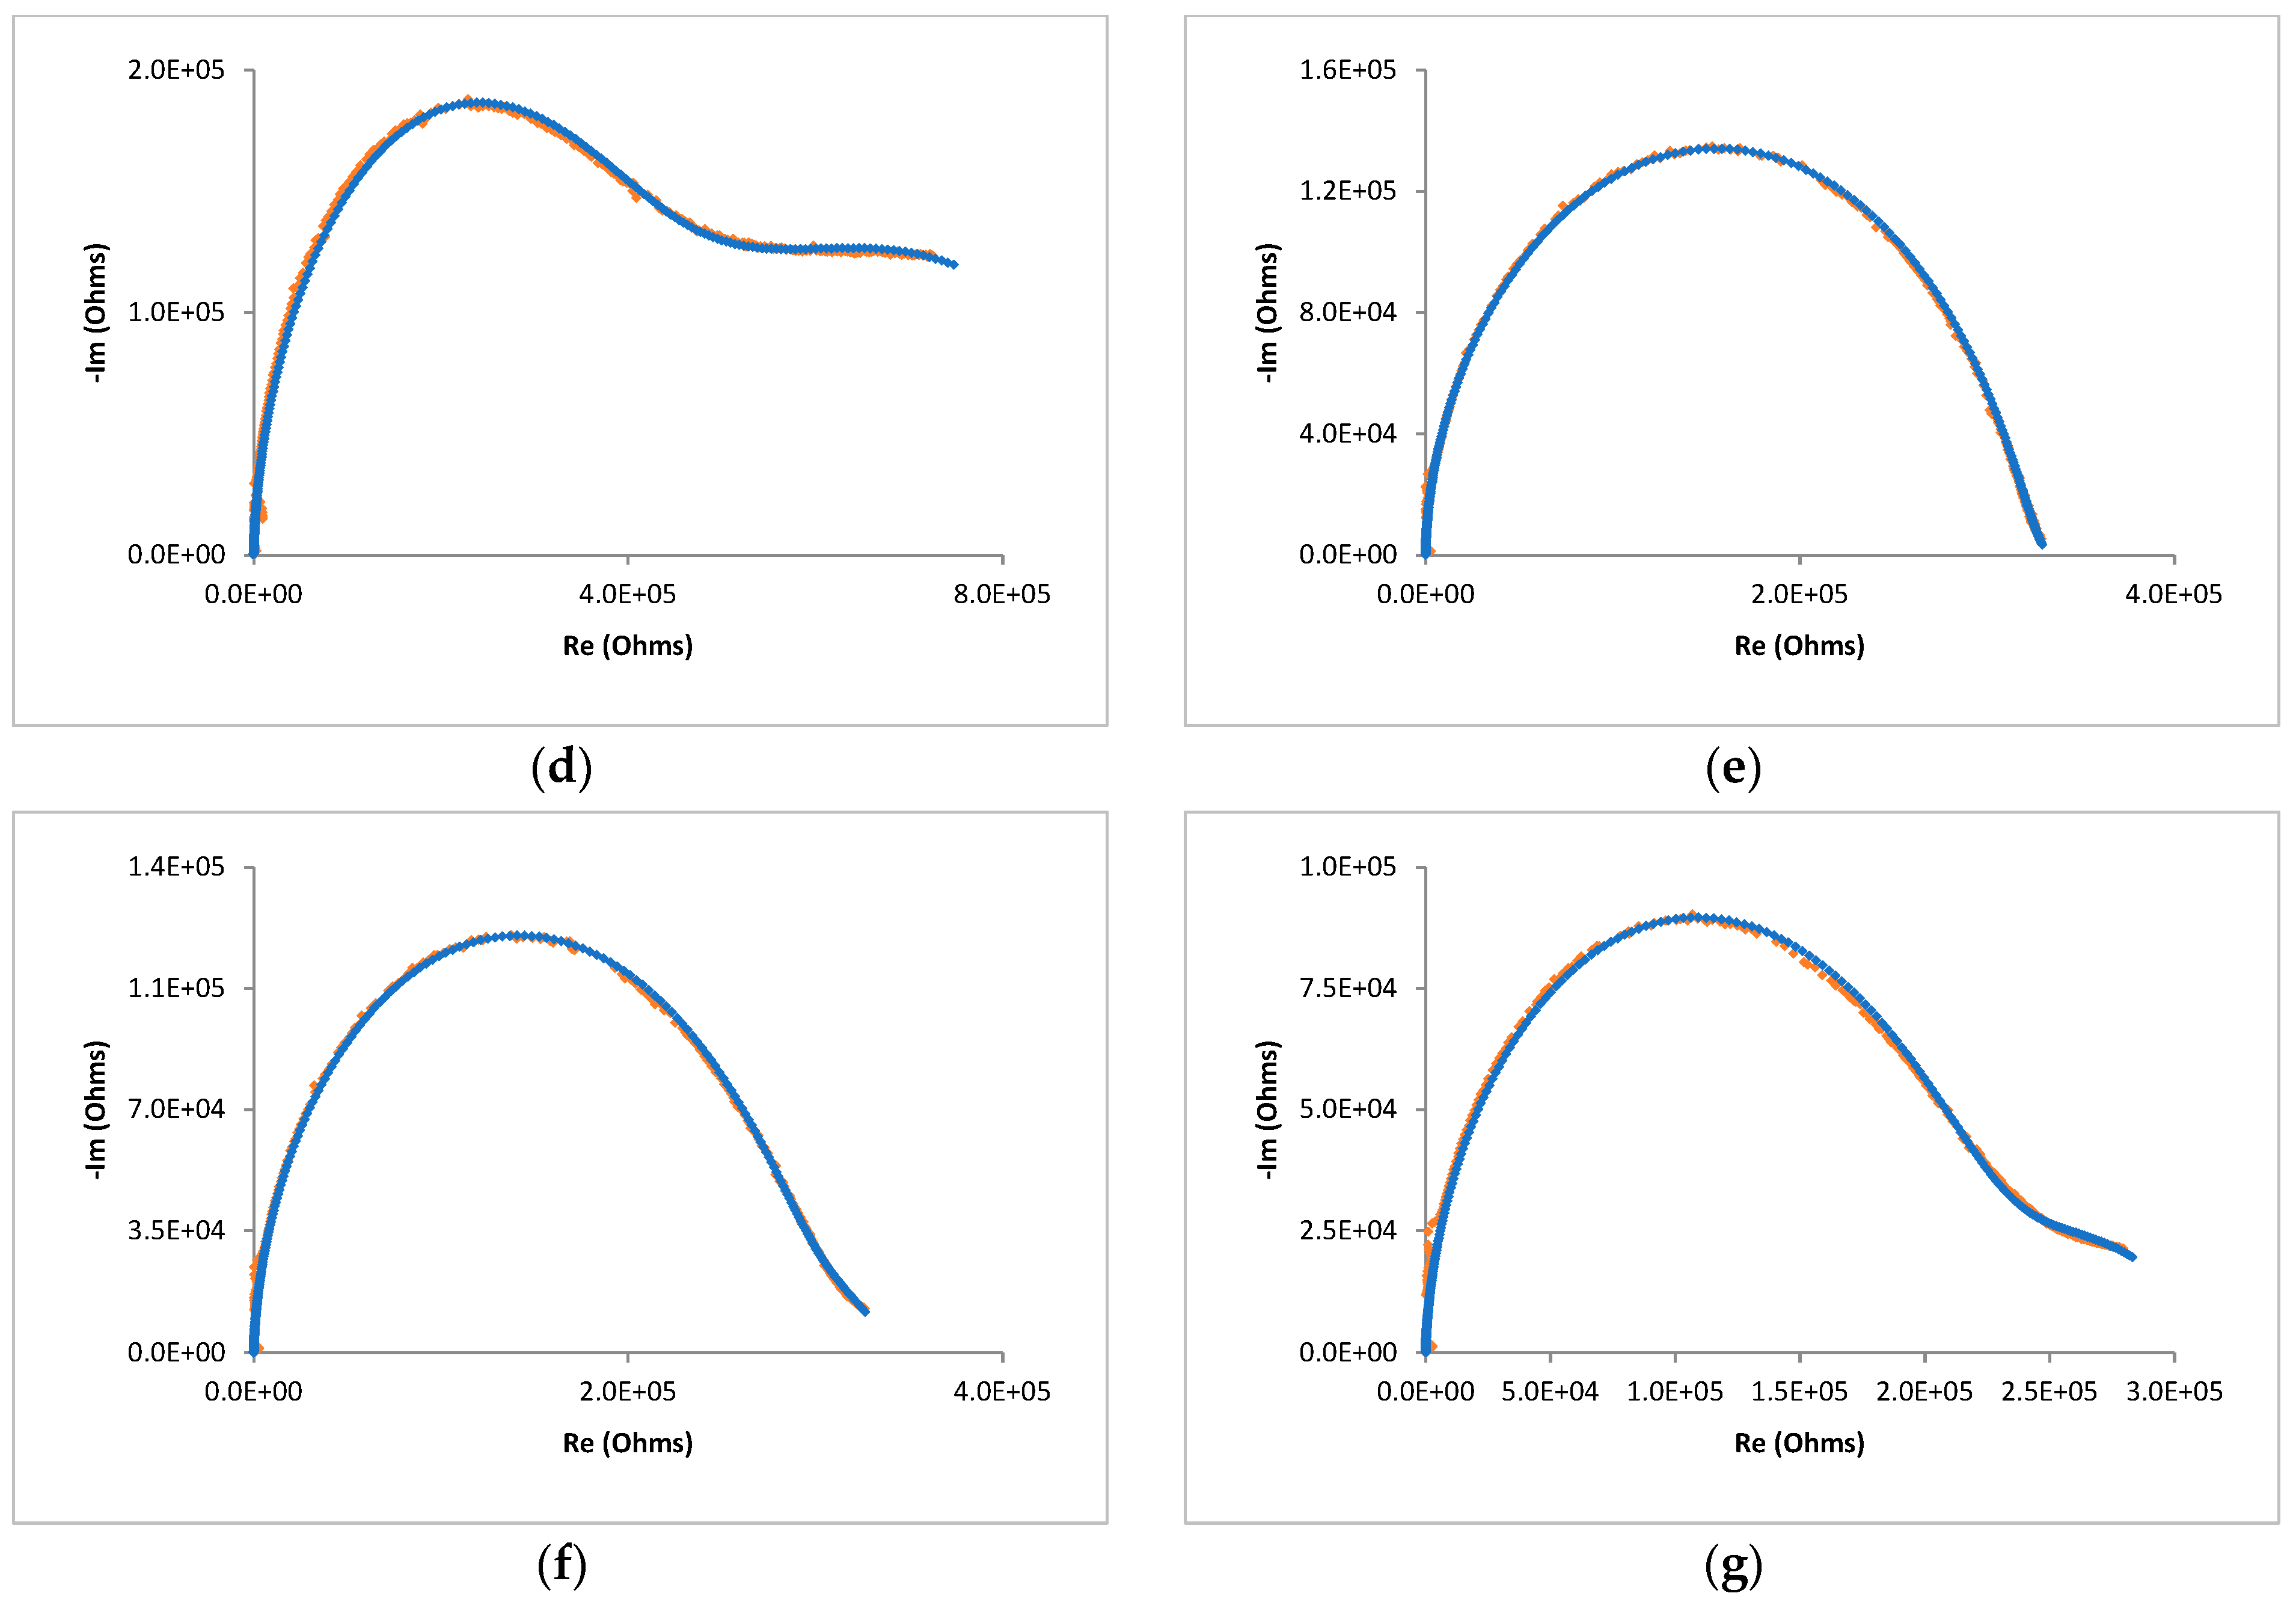
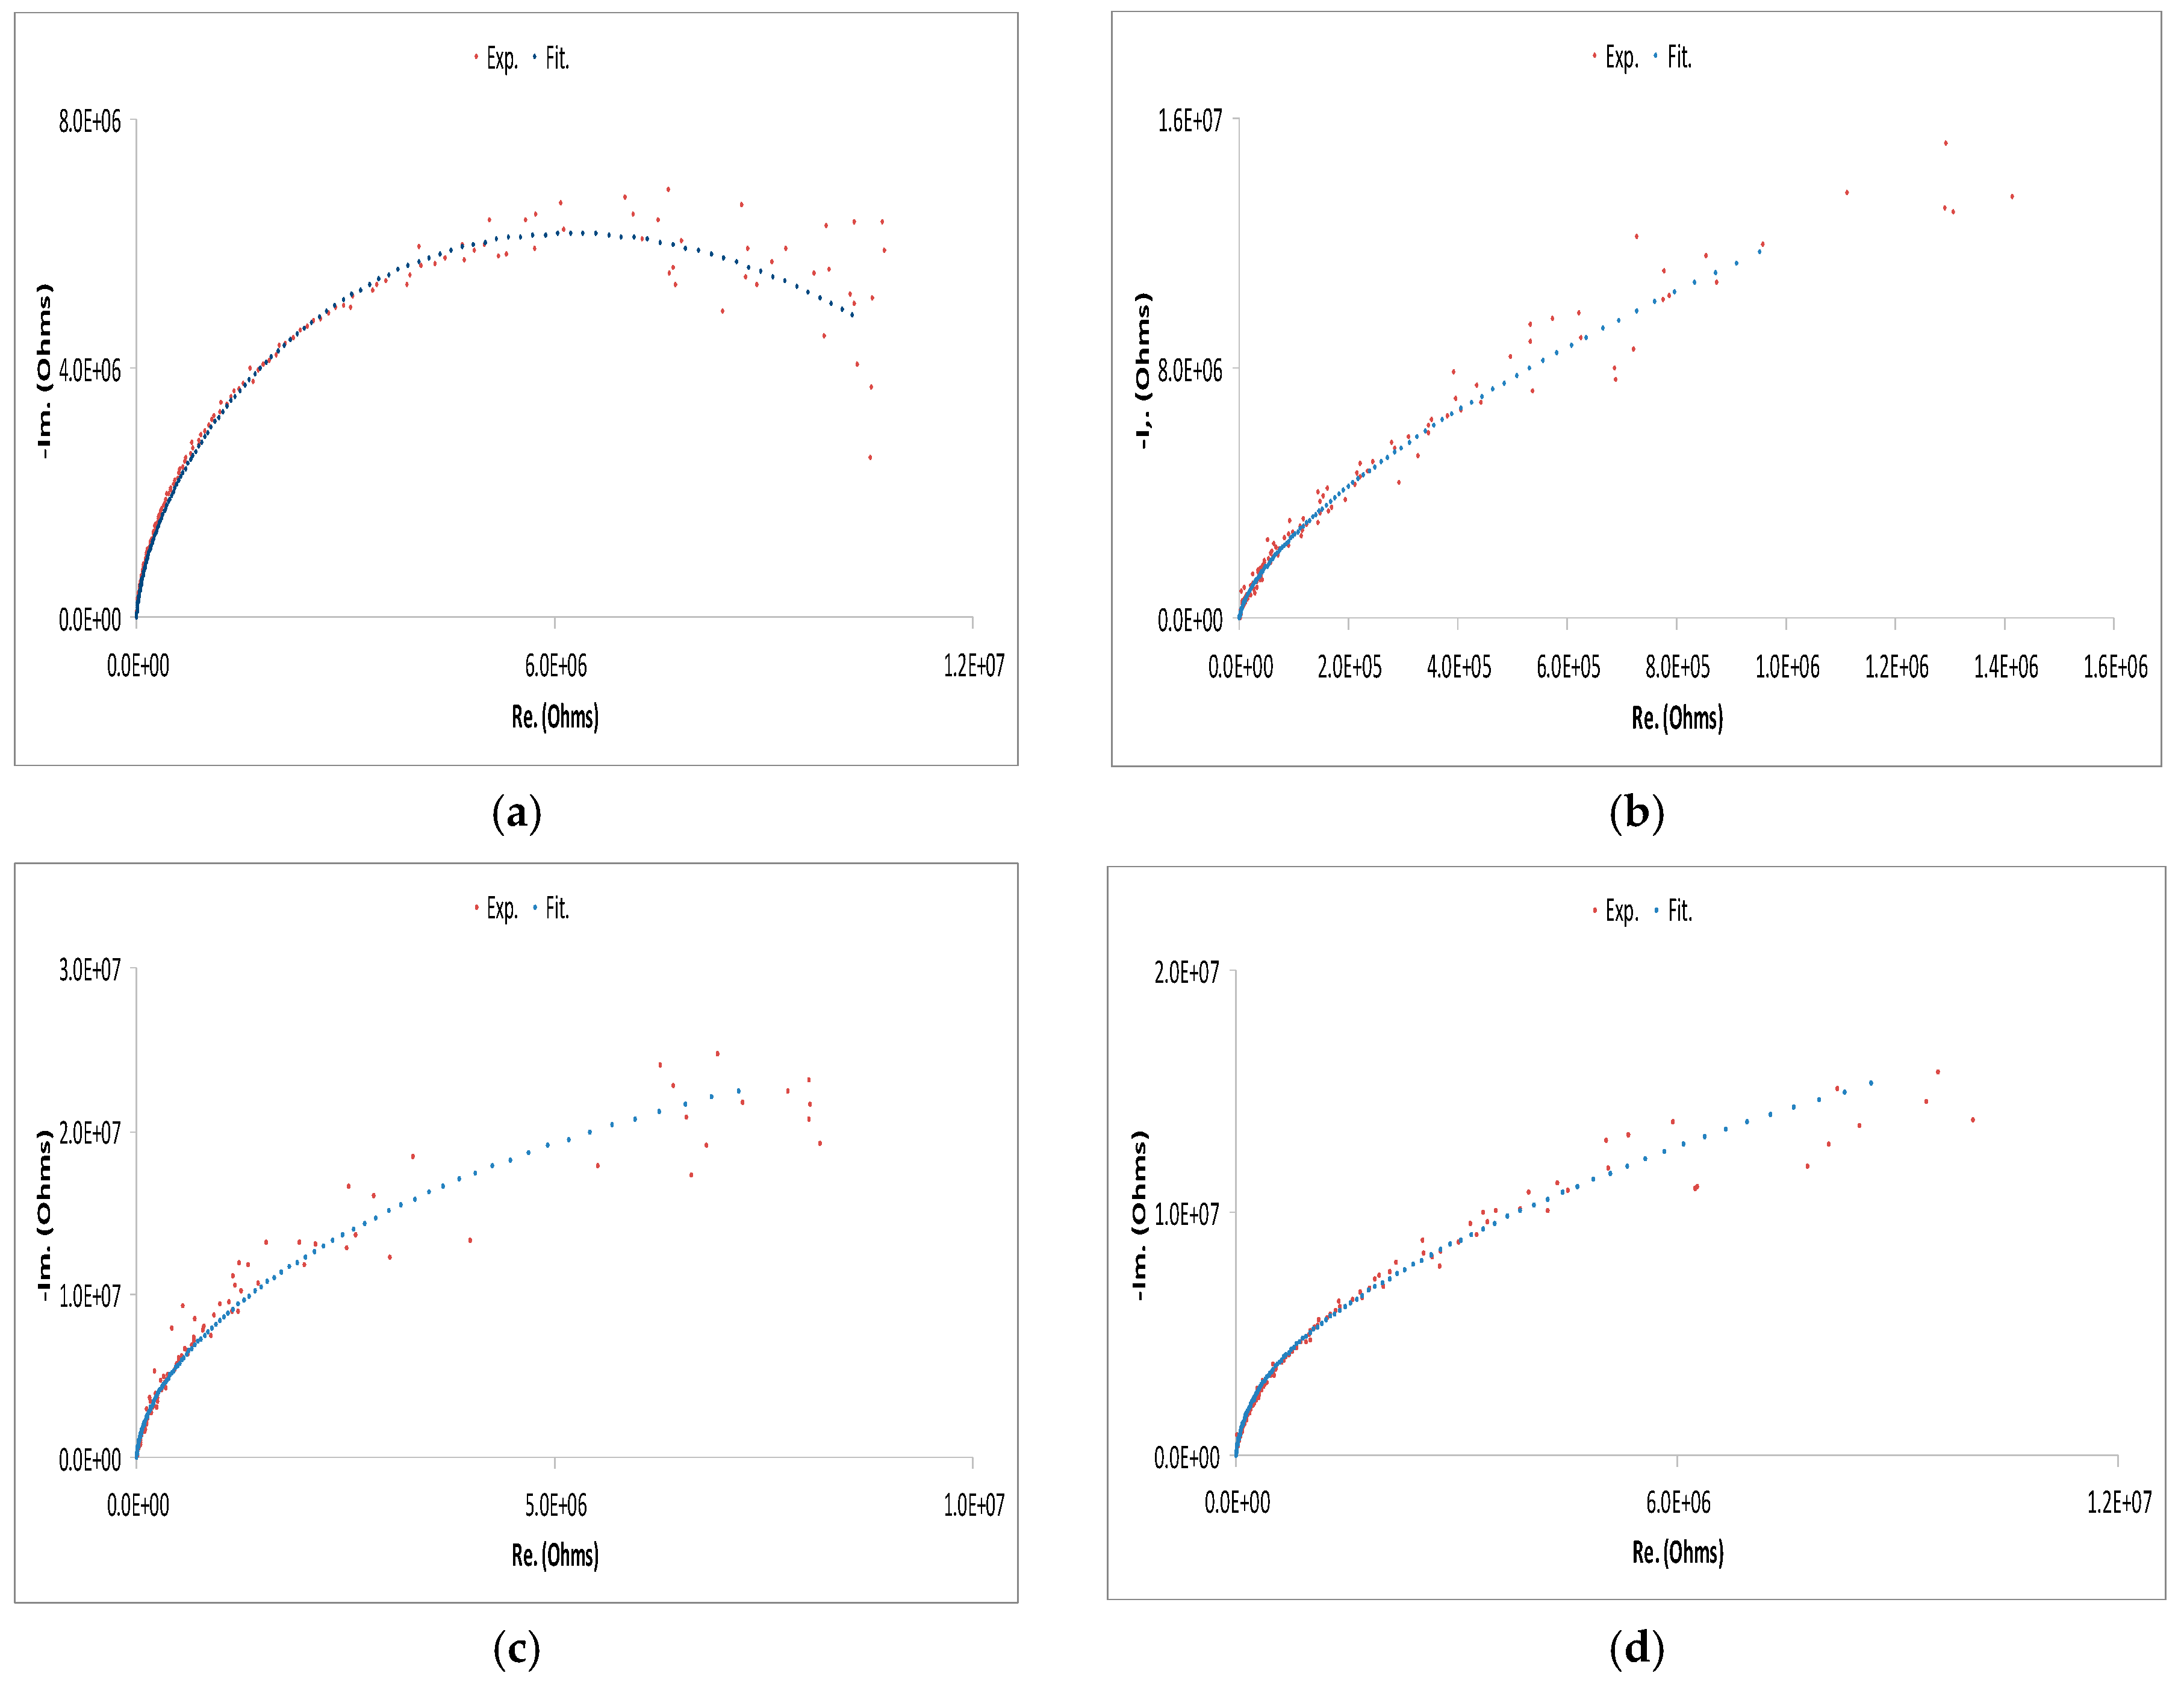
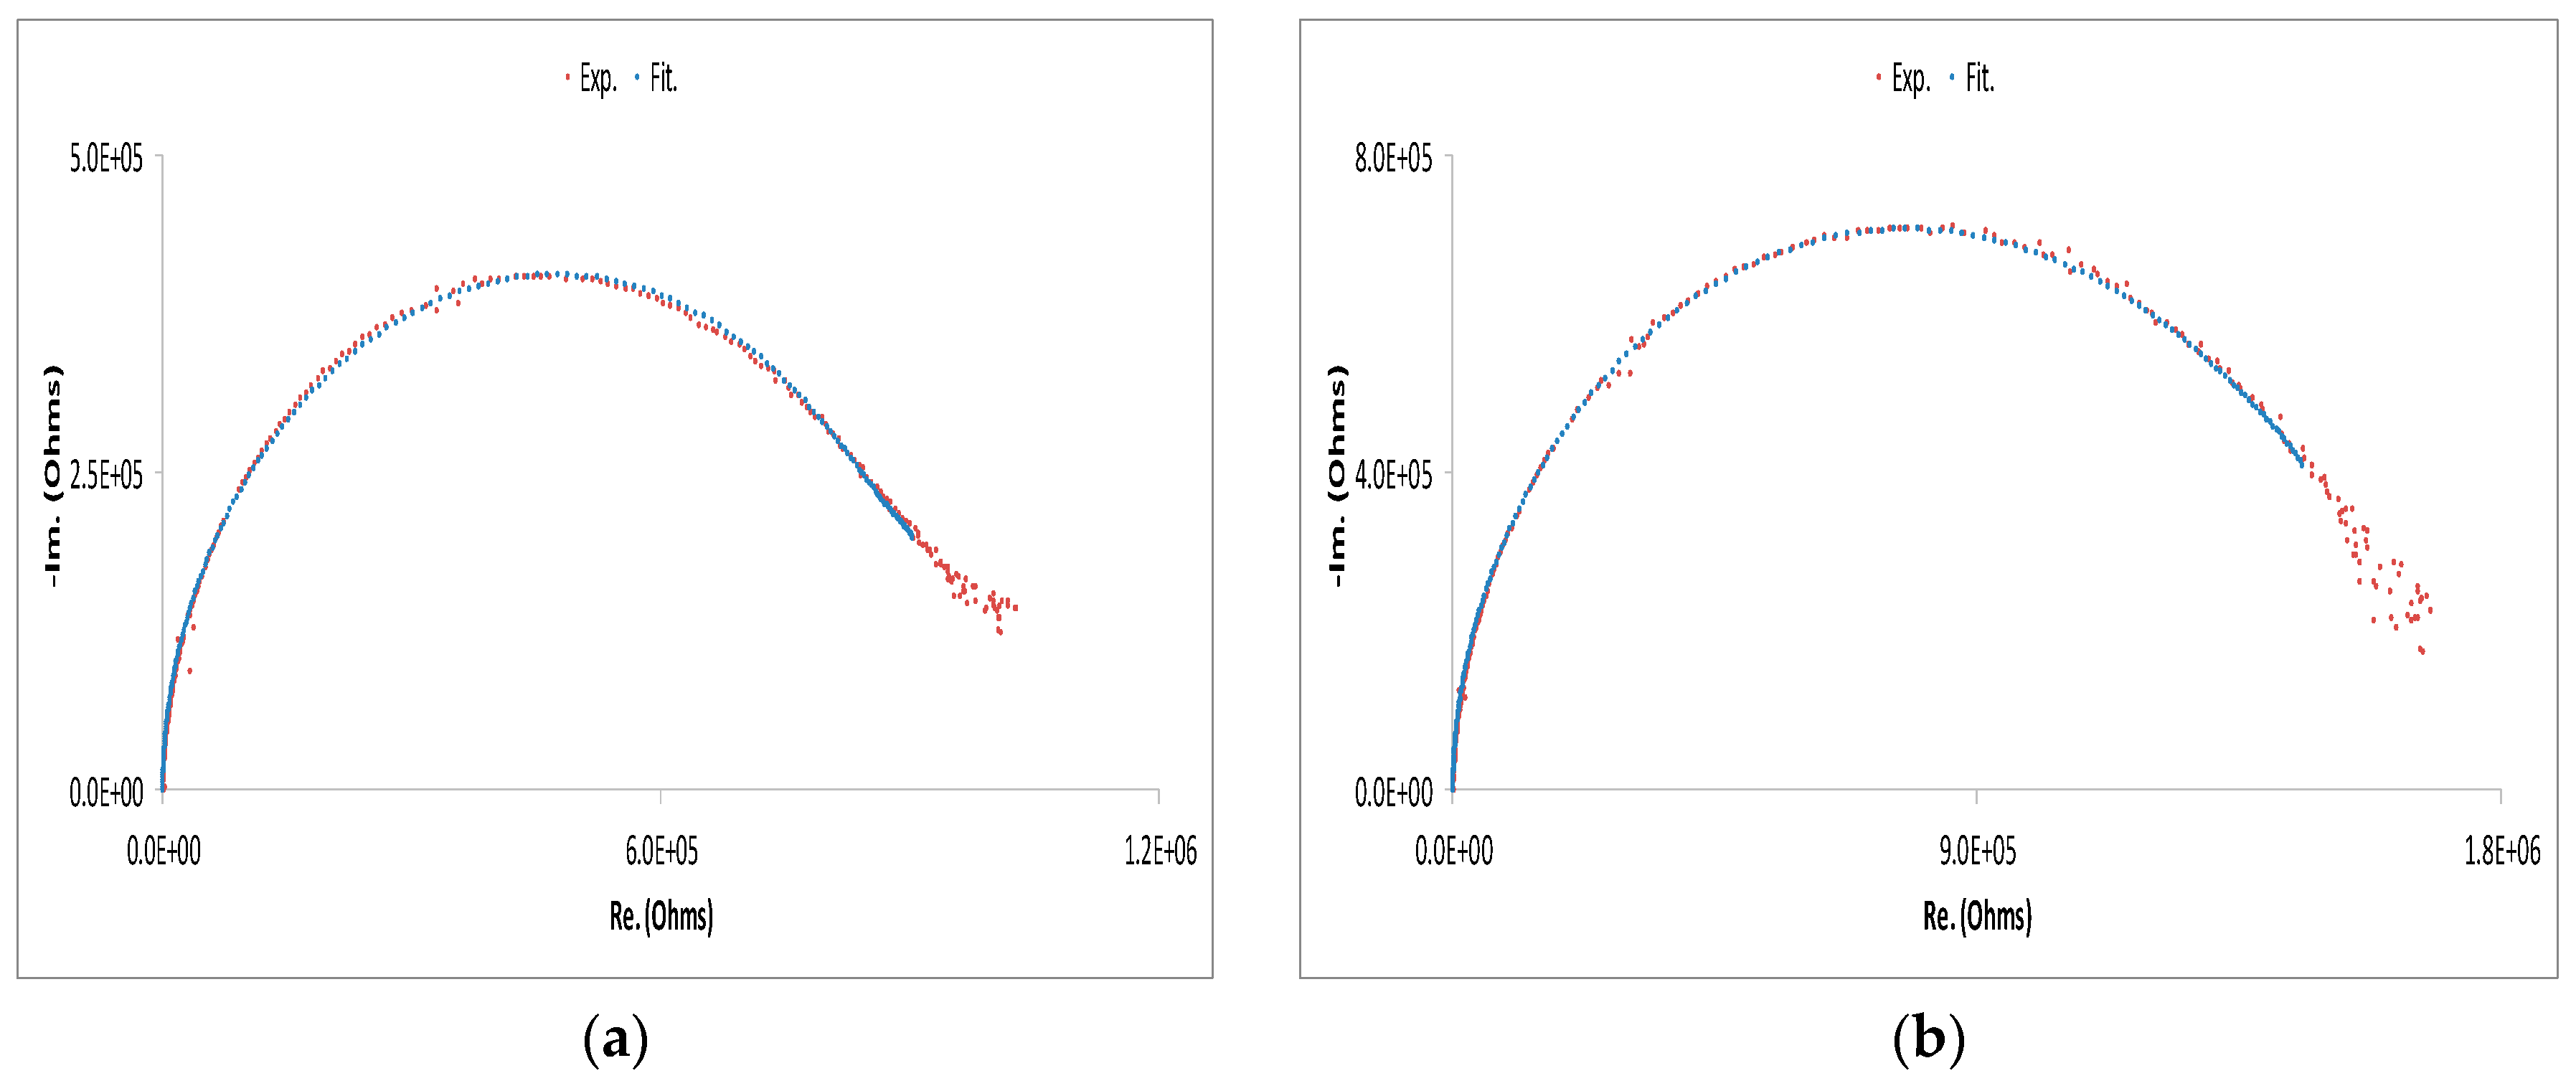
2.5. EleIS Modelling of Electrodeposited Ti-W Undoped and Vanadium Doped Humidity Sensor

In this section, the authors present their latest efforts in modelling Mixed Metal Oxide (MMO) nanostructures again using the parallel approach. Sample preparation and their structural, morphological, and electrical response with relative humidity (RH), characterized using EleIS, have already been reported in the literature [133]. A summary is given here to provide contextualization. TiO2/WO3 (obtained by mixing powders in a molar ratio of 1:1) and doped TiO2/WO3 with V2O5 were incorporated into electrospun fibers (a weight ratio of 94:6 of both copolymers and oxide mixtures, all in wt.%, was used for all samples).
The obtained composites were thermally treated to remove the polymeric matrix. Then, 0.7 g of each mixture was immersed in 3 mL of a polymeric alcohol solution and stirred. The resulting material was put into a conventional syringe and maintained under constant pressure. Using a 15-kV direct current voltage source connected to the dip of the syringe, an electrical field was established between the syringe and the grounded target. The deposition procedure was carried out for 5 min, and the fibers were collected on aluminum foil targets, where a pair of gold interdigital-shaped electrodes were previously deposited (this procedure was repeated to deposit successive layers on the electrode surface, providing one- and three-layer samples).
Then, the samples were sintered in an oven for 1 h at 500 °C, with heating and cooling rates of 20 °C/min; the final doped samples that displayed the best moisture sensitivity were obtained for 5 and 7 wt.% addition of V2O5 powder to the initial mixture (named Tiw) and were designated as TiW-V5 and TiW-V7, respectively. The humidity-dependent electrical properties of the thick films were evaluated by EleIS in the 10–100% RH interval at ambient temperature, employing frequency sweeps in the interval 400 Hz–40 MHz, with an alternating voltage potential possessing an amplitude of 0.5 V.
The electrospun doped films showed increased sensitivity compared to the undoped ones; besides, a p- to n-type transition was observable for the doped sensors. Authors discussed and showed that the conduction-type transition was of an electronic nature since it took place at around 30% RH (the region that is usually typified as the frontier between low and high humidity ranges, when the first complete water layer, the chemisorbed one, covers the sensor surface entirely).
Diverse transport mechanisms were found to contribute to the sensors’ electrical response to RH variations: conduction along grains and grain agglomerates, conduction along the boundaries between grains or between clusters, diffusion along the interface between the surface of the material and the measurement electrodes, and diffusion of charges along the pores filled by water molecules; a capacitive contribution due to the geometric effect of the location of the measurement electrodes; charge transport along the surface of the samples covered along the material surface covered by layers of water vapor due to the effect of “electron tunnelling”. With these contributions, the authors developed the electrical equivalent circuit shown in Figure 13, which accounts for all the identified contributions. Figure 14, Figure 15 and Figure 16 display Nyquist plots for TiW, TiW-V5 and TiW-V7, confirming the adequacy of the chosen model; in them are plotted sets of obtained experimental and respective fitted data. As can be seen, the fits for all three electrospun films display a high level of superposition between the experimental and fitted data.
In Table 2, Table 3 and Table 4, the values of the parameters for the known contributions, all of which are represented in the proposed electrical equivalent circuit, are displayed. In it, using a parallel association strategy of terms, the authors used the following matching criteria: a parallel association R1//C1, representing grains and grain agglomerates contribution; a constant-phase element CPEel, representing ion diffusion along the interface between the surface of the material and the measurement electrodes; a constant phase element, CPEpo, that stands for diffusion of charges along the voids filled by water molecules; a capacitor, Cgeo, representing the geometric effect of the location of the measurement electrodes (positioned on the upper face but at opposite ends of the material); a resistor in parallel with a capacitor, R2//C2, that accounts for the contribution of conduction along the boundaries between grains or between clusters of the Schottky barrier type; and a resistor in parallel with another capacitor, R3//C3, representing the contribution of charge transportation along the surface of the samples covered by layers of water vapor due to the effect of “electron tunnelling”.
After analyzing the parameter values, the following considerations were acknowledged:
Consideration (i). The pairs R1//C1 and R2//C2 represent grain boundaries and grain/grain agglomerate contributions, respectively. Both are electronic nature contributions and suffer variations following RH concentration changes; parameter magnitude differs according to the fibers’ composition (undoped and doped with different amounts of vanadium). For the pair R1//C1, attributed to grain boundaries contribution, the overall impedance decreases with the introduction and subsequent increase of vanadium content, as expected. With doping, titanium or tungsten atoms are replaced by vanadium ones, which possess more valence electrons. Thus, additional free electrons are introduced into the system without establishing connections with the existing surrounding atoms of the initial matrix. Besides, the same pair of parameters also support the electronic nature of the p- to n-type transition; for all cases (undoped and doped), while the capacitive component slightly varies, the resistive contribution shows a tendency to increase to around 40–50% RH concentration, followed by a decrease. This behavior aligns with the established form regarding free electron transportation in ceramics as RH increases. Indeed, ion hopping mechanisms are weak for low RH concentrations, so charge transportation occurs through grain/grain agglomerates; however, it is conditioned by grain boundaries that are more negatively charged (higher number of free electrons) and originates in the higher potential energy barriers. Thus, impedance increases. However, as soon as water molecules start to get physiosorbed and condensate inside the voids and along the ceramic surface, ion hopping starts to dominate, and the grain contribution diminishes once the potential energy barriers in the grain boundaries no longer influence the dominant charge carriers’ transportation paths, which change. That is also visible in the way the overall grain/grain agglomerates contribution varies with the amount of added dopant and with RH increase; with RH increase, for all compositions, the impedance of that pair of parameters, R2//C2, shows a decreasing tendency, and with the addition of increasing amounts of dopant, the impedance of that pair of parameters also decreases.
Consideration (ii). Cgeo shows a slight variation between samples and along the RH tested range, as expected, once electrode placement cannot be reproduced with complete exactitude. Even though the minor variations found for each sample with changing RH are slight, the overall differences are less than one half-order of magnitude, even for TiW-V5, where more significant adjustments are observed.
Consideration (iii). The pair R3//C3 represents the charge transport mechanism along the sample surface, which gets increasingly covered by water vapor layers due to the “electron tunnelling” effect. This contribution diminishes with the increasing addition of dopant, and the fitted parameters reflect that same behavior. Specifically, the greater number of available free electrons (when the layers of chemisorbed and the physiosorbed water molecules are complete) allows for a higher number of negative charges to be transported just above the metal oxide surface by “jumping from atom to atom”.
Consideration (iv). Diffusion through the material/electrodes interface, CPEel, where the respective parameters of all the samples vary as expected, i.e., they change with the increase in RH concentration. Additionally, the fact that the changes are smaller than those observed for denser materials is a consequence of their layered fiber composition. Besides, and as also presumed, the composition induces changes in the interface reactions, which are also observed in the parameters.
Consideration (v). Diffusion through the voids, CPEpo, is one of the parameters expected to display higher variation with the increasing addition of dopant and with RH increase above 50% RH (when physiosorbed layers get formed consecutively on top of each other). Fibers get distributed and spaced in various ways with dopant addition, and the parameters also change; however, for each composition, the variation of the void contribution is not as substantial as that for more compact oxidized composites due to the spacing found between the fibers, which does not form a net of traditional open pores in connection with the surface.

3. Conclusions

In this work, the authors addressed the potential of using Impedance Spectroscopy in diverse domains, emphasizing the identification and interpretation of the conduction mechanisms present in the electrical response of materials to external physical stimuli. For this, the authors first addressed the basics of IS and its usage in diverse fields historically, such as the food industry, water quality assessment, human health, and materials science. Then, they presented the two modelling strategies used for elaborating on electrical equivalent circuits and the typical terms employed in their construction, which permitted the interpretation of the electrical response contributions present in the obtained impedance traces. Lastly, they presented some case studies from the materials science domain, including their most recent ongoing work on IS modelling.

Author Contributions

All the authors contributed equally to this article: Conceptualization, P.M.F. and E.S.A.; formal analysis, S.R.M. and P.M.F.; writing—original draft preparation, P.M.F., G.M.G.d.S. and E.S.A.; writing—review and editing, G.M.G.d.S. and S.R.M. All authors have read and agreed to the published version of the manuscript.

Funding

This research was sponsored by Fundação de Amparo à Ciência e Tecnologia do Estado de Pernambuco—FACEPE, Brazil, through APQ 1387-3.03/22 and IBPG-0849-3.03/20 Projects); and by FCT—Fundação para a Ciência e a Tecnologia, Portugal, under the project UIDB/00285/2020 and LA/P/0112/2020, and by scholarship UI/BD/152285/2021 (https://doi.org/10.54499/UI/BD/152285/2021).

Conflicts of Interest

The authors declare no conflict of interest. The funders had no role in the study’s design, in the collection, analyses, or interpretation of data, in the writing of the manuscript, or in the decision to publish the results.

References

  1. Barsoukov, E.; Macdonald, J.R. Impedance Spectroscopy: Theory, Experiment, and Applications, 3rd ed.; Barsoukov, E., Macdonald, J.R., Eds.; Wiley: Hoboken, NJ, USA, 2018; ISBN 9781119074083. [Google Scholar]
  2. El-Azazy, M. Electrochemical Impedance Spectroscopy (EIS) in Food, Water, and Drug Analyses: Recent Advances and Applications. In Electrochemical Impedance Spectroscopy; El-Azazy, M., Min, M., Annus, P., Eds.; IntechOpen: Rijeka, Croatia, 2020; ISBN 978-1-78985-216-5. [Google Scholar]
  3. Pejcic, B.; De Marco, R. Impedance Spectroscopy: Over 35 Years of Electrochemical Sensor Optimization. Electrochim. Acta 2006, 51, 6217–6229. [Google Scholar] [CrossRef]
  4. Warburg, E. Ueber Das Verhalten Sogenannter Unpolarisirbarer Elektroden Gegen Wechselstrom. Ann. Phys. 1899, 303, 493–499. [Google Scholar] [CrossRef]
  5. Bauerle, J.E. Study of Solid Electrolyte Polarization by a Complex Admittance Method. J. Phys. Chem. Solids 1969, 30, 2657–2670. [Google Scholar] [CrossRef]
  6. Macdonald, D.D. Reflections on the History of Electrochemical Impedance Spectroscopy. Electrochim. Acta 2006, 51, 1376–1388. [Google Scholar] [CrossRef]
  7. Pajkossy, T.; Jurczakowski, R. Electrochemical Impedance Spectroscopy in Interfacial Studies. Curr. Opin. Electrochem. 2017, 1, 53–58. [Google Scholar] [CrossRef]
  8. Lazanas, A.Ch.; Prodromidis, M.I. Electrochemical Impedance Spectroscopy—A Tutorial. ACS Meas. Sci. Au 2023, 3, 162–193. [Google Scholar] [CrossRef] [PubMed]
  9. Orazem, M.E.; Tribollet, B. A Tutorial on Electrochemical Impedance Spectroscopy. ChemTexts 2020, 6, 12. [Google Scholar] [CrossRef]
  10. Bandarenka, A.S. Exploring the Interfaces between Metal Electrodes and Aqueous Electrolytes with Electrochemical Impedance Spectroscopy. Analyst 2013, 138, 5540–5554. [Google Scholar] [CrossRef] [PubMed]
  11. Zhang, S.S.; Xu, K.; Jow, T.R. EIS Study on the Formation of Solid Electrolyte Interface in Li-Ion Battery. Electrochim. Acta 2006, 51, 1636–1640. [Google Scholar] [CrossRef]
  12. Wang, S.; Zhang, J.; Gharbi, O.; Vivier, V.; Gao, M.; Orazem, M.E. Electrochemical Impedance Spectroscopy. Nat. Rev. Methods Primers 2021, 1, 41. [Google Scholar] [CrossRef]
  13. Bard, A.J.; Faulkner, L.R.; White, H.S. Electrochemical Methods: Fundamentals and Applications, 3rd ed.; John Wiley & Sons, Inc.: Hoboken, NJ, USA, 2022; ISBN 978-1-119-33406-4. [Google Scholar]
  14. Shi, X. Experimental Studies and Modelling of Charge Transport and Defect States in Disordered Organic Semiconductors. Ph.D. Thesis, Imperial College London, London, UK, 2017. [Google Scholar]
  15. Popkirov, G.S.; Schindler, R.N. Optimization of the Perturbation Signal for Electrochemical Impedance Spectroscopy in the Time Domain. Rev. Sci. Instrum. 1993, 64, 3111–3115. [Google Scholar] [CrossRef]
  16. Parthasarathy, A.; Davé, B.; Srinivasan, S.; Appleby, A.J.; Martin, C.R. The Platinum Microelectrode/Nafion Interface: An Electrochemical Impedance Spectroscopic Analysis of Oxygen Reduction Kinetics and Nafion Characteristics. J. Electrochem. Soc. 1992, 139, 1634–1641. [Google Scholar] [CrossRef]
  17. Lindahl, P.A.; Cornachione, M.A.; Shaw, S.R. A Time-Domain Least Squares Approach to Electrochemical Impedance Spectroscopy. IEEE Trans. Instrum. Meas. 2012, 61, 3303–3311. [Google Scholar] [CrossRef]
  18. Al Nazer, R.; Cattin, V.; Granjon, P.; Montaru, M.; Ranieri, M.; Heiries, V. Classical EIS and Square Pattern Signals Comparison Based on a Well-Known Reference Impedance. In Proceedings of the 2013 World Electric Vehicle Symposium and Exhibition (EVS27), Barcelona, Spain, 17–20 November 2013; IEEE: Barcelona, Spain, 2013; pp. 1–7. [Google Scholar]
  19. Toll, J.S. Causality and the Dispersion Relation: Logical Foundations. Phys. Rev. 1956, 104, 1760–1770. [Google Scholar] [CrossRef]
  20. Kronig, R.D.L. On the Theory of Dispersion of X-rays. J. Opt. Soc. Am. 1926, 12, 547–557. [Google Scholar] [CrossRef]
  21. Kramers, M.H.A. La Diffusion de La Lumiere Par Les Atomes. Atti del Congresso Internazionale dei Fisici (Onoranze ad Alessandro Volta nel Primo Centenario Della Morte) Como-Pavia-Roma 1927, 2, 545–557. [Google Scholar]
  22. Agarwal, P.; Orazem, M.E.; Garcia-Rubio, L.H. Measurement Models for Electrochemical Impedance Spectroscopy: I. Demonstration of Applicability. J. Electrochem. Soc. 1992, 139, 1917–1927. [Google Scholar] [CrossRef]
  23. Boukamp, B.A. A Linear Kronig-Kramers Transform Test for Immittance Data Validation. J. Electrochem. Soc. 1995, 142, 1885–1894. [Google Scholar] [CrossRef]
  24. Randviir, E.P.; Banks, C.E. Electrochemical Impedance Spectroscopy: An Overview of Bioanalytical Applications. Anal. Methods 2013, 5, 1098–1115. [Google Scholar] [CrossRef]
  25. Rupp, G.M.; Opitz, A.K.; Nenning, A.; Limbeck, A.; Fleig, J. Real-Time Impedance Monitoring of Oxygen Reduction during Surface Modification of Thin Film Cathodes. Nat. Mater. 2017, 16, 640–645. [Google Scholar] [CrossRef]
  26. Song, D.; Wan, H.; Tu, X.; Li, W. A Better Understanding of Failure Process of Waterborne Coating/Metal Interface Evaluated by Electrochemical Impedance Spectroscopy. Prog. Org. Coat. 2020, 142, 105558. [Google Scholar] [CrossRef]
  27. Keddam, M.; Nóvoa, X.R.; Vivier, V. The Concept of Floating Electrode for Contact-Less Electrochemical Measurements: Application to Reinforcing Steel-Bar Corrosion in Concrete. Corros. Sci. 2009, 51, 1795–1801. [Google Scholar] [CrossRef]
  28. Alexander, C.L.; Orazem, M.E. Indirect Electrochemical Impedance Spectroscopy for Corrosion Detection in External Post-Tensioned Tendons: 1. Proof of Concept. Corros. Sci. 2020, 164, 108331. [Google Scholar] [CrossRef]
  29. Brett, C.M.A. Electrochemical Impedance Spectroscopy in the Characterisation and Application of Modified Electrodes for Electrochemical Sensors and Biosensors. Molecules 2022, 27, 1497. [Google Scholar] [CrossRef] [PubMed]
  30. Sankhala, D.; Muthukumar, S.; Prasad, S. A Four-Channel Electrical Impedance Spectroscopy Module for Cortisol Biosensing in Sweat-Based Wearable Applications. SLAS Technol. 2018, 23, 529–539. [Google Scholar] [CrossRef]
  31. Soares, C.; Tenreiro Machado, J.A.; Lopes, A.M.; Vieira, E.; Delerue-Matos, C. Electrochemical Impedance Spectroscopy Characterization of Beverages. Food Chem. 2020, 302, 125345. [Google Scholar] [CrossRef]
  32. Lopes, A.M.; Machado, J.A.T.; Ramalho, E.; Silva, V. Milk Characterization Using Electrical Impedance Spectroscopy and Fractional Models. Food Anal. Methods 2018, 11, 901–912. [Google Scholar] [CrossRef]
  33. Liu, X.; Duckworth, P.A.; Wong, D.K.Y. Square Wave Voltammetry versus Electrochemical Impedance Spectroscopy as a Rapid Detection Technique at Electrochemical Immunosensors. Biosens. Bioelectron. 2010, 25, 1467–1473. [Google Scholar] [CrossRef]
  34. Finšgar, M.; Xhanari, K.; Petovar, B. Copper-Film Electrodes for Pb(II) Trace Analysis and a Detailed Electrochemical Impedance Spectroscopy Study. Microchem. J. 2019, 147, 863–871. [Google Scholar] [CrossRef]
  35. Fan, L.; Zhao, G.; Shi, H.; Liu, M.; Li, Z. A Highly Selective Electrochemical Impedance Spectroscopy-Based Aptasensor for Sensitive Detection of Acetamiprid. Biosens. Bioelectron. 2013, 43, 12–18. [Google Scholar] [CrossRef]
  36. Yadav, A.K.; Jain, C.K.; Malik, D.S. Toxic Characterization of Textile Dyes and Effluents in Relation to Human Health Hazards. J. Sustain. Environ. Res. 2014, 3, 95–102. [Google Scholar]
  37. Islam, T.; Repon, M.R.; Islam, T.; Sarwar, Z.; Rahman, M.M. Impact of Textile Dyes on Health and Ecosystem: A Review of Structure, Causes, and Potential Solutions. Env. Sci. Pollut. Res. Int. 2023, 30, 9207–9242. [Google Scholar] [CrossRef] [PubMed]
  38. Tekaya, N.; Saiapina, O.; Ouada, H.B.; Lagarde, F.; Namour, P.; Ouada, H.B.; Jaffrezic-Renault, N. Bi-Enzymatic Conductometric Biosensor for Detection of Heavy Metal Ions and Pesticides in Water Samples Based on Enzymatic Inhibition in Arthrospira Platensis. J. Environ. Prot. 2014, 5, 441–453. [Google Scholar] [CrossRef]
  39. Avuthu, S.G.R.; Narakathu, B.B.; Eshkeiti, A.; Emamian, S.; Bazuin, B.J.; Joyce, M.; Atashbar, M.Z. Detection of Heavy Metals Using Fully Printed Three Electrode Electrochemical Sensor. In Proceedings of the IEEE SENSORS 2014 Proceedings, Valencia, Spain, 2–5 November 2014; IEEE: Valencia, Spain, 2014; Volume 2014, pp. 669–672. [Google Scholar]
  40. Liu, S.; Kang, M.; Yan, F.; Peng, D.; Yang, Y.; He, L.; Wang, M.; Fang, S.; Zhang, Z. Electrochemical DNA Biosensor Based on Microspheres of Cuprous Oxide and Nano-Chitosan for Hg(II) Detection. Electrochim. Acta 2015, 160, 64–73. [Google Scholar] [CrossRef]
  41. Castillo, G.; Lamberti, I.; Mosiello, L.; Hianik, T. Impedimetric DNA Aptasensor for Sensitive Detection of Ochratoxin A in Food. Electroanalysis 2012, 24, 512–520. [Google Scholar] [CrossRef]
  42. Castillo, G.; Spinella, K.; Poturnayová, A.; Šnejdárková, M.; Mosiello, L.; Hianik, T. Detection of Aflatoxin B1 by Aptamer-Based Biosensor Using PAMAM Dendrimers as Immobilization Platform. Food Control 2015, 52, 9–18. [Google Scholar] [CrossRef]
  43. Jiang, D.; Du, X.; Liu, Q.; Zhou, L.; Dai, L.; Qian, J.; Wang, K. Silver Nanoparticles Anchored on Nitrogen-Doped Graphene as a Novel Electrochemical Biosensing Platform with Enhanced Sensitivity for Aptamer-Based Pesticide Assay. Analyst 2015, 140, 6404–6411. [Google Scholar] [CrossRef] [PubMed]
  44. Labib, M.; Zamay, A.S.; Kolovskaya, O.S.; Reshetneva, I.T.; Zamay, G.S.; Kibbee, R.J.; Sattar, S.A.; Zamay, T.N.; Berezovski, M.V. Aptamer-Based Impedimetric Sensor for Bacterial Typing. Anal. Chem. 2012, 84, 8114–8117. [Google Scholar] [CrossRef]
  45. Ma, X.; Jiang, Y.; Jia, F.; Yu, Y.; Chen, J.; Wang, Z. An Aptamer-Based Electrochemical Biosensor for the Detection of Salmonella. J. Microbiol. Methods 2014, 98, 94–98. [Google Scholar] [CrossRef]
  46. Jahanbani, S.; Benvidi, A. Comparison of Two Fabricated Aptasensors Based on Modified Carbon Paste/Oleic Acid and Magnetic Bar Carbon Paste/Fe3O4@oleic Acid Nanoparticle Electrodes for Tetracycline Detection. Biosens. Bioelectron. 2016, 85, 553–562. [Google Scholar] [CrossRef]
  47. Wang, M.; Hu, B.; Yang, C.; Zhang, Z.; He, L.; Fang, S.; Qu, X.; Zhang, Q. Electrochemical Biosensing Based on Protein-Directed Carbon Nanospheres Embedded with SnO and TiO2 Nanocrystals for Sensitive Detection of Tobramycin. Biosens. Bioelectron. 2018, 99, 176–185. [Google Scholar] [CrossRef] [PubMed]
  48. Jiménez, G.C.; Eissa, S.; Ng, A.; Alhadrami, H.; Zourob, M.; Siaj, M. Aptamer-Based Label-Free Impedimetric Biosensor for Detection of Progesterone. Anal. Chem. 2015, 87, 1075–1082. [Google Scholar] [CrossRef] [PubMed]
  49. Chen, T.-W.; Princy Merlin, J.; Chen, S.-M.; Anandaraj, S.; Elshikh, M.S.; Tseng, T.-W.; Wang, K.; Qi, D.; Jiang, J. Sonochemical Synthesis and Fabrication of Neodymium Sesquioxide Entrapped with Graphene Oxide Based Hierarchical Nanocomposite for Highly Sensitive Electrochemical Sensor of Anti-Cancer (Raloxifene) Drug. Ultrason. Sonochem 2020, 64, 104717. [Google Scholar] [CrossRef] [PubMed]
  50. Song, Y.; Duan, F.; Zhang, S.; Tian, J.-Y.; Zhang, Z.; Wang, Z.-W.; Liu, C.-S.; Xu, W.-M.; Du, M. Iron Oxide@mesoporous Carbon Architectures Derived from an Fe(II)-Based Metal Organic Framework for Highly Sensitive Oxytetracycline Determination. J. Mater. Chem. A Mater. 2017, 5, 19378–19389. [Google Scholar] [CrossRef]
  51. Miele, G.; Bellucci, S.; Cataldo, A.; Di Tinno, A.; Ferrigno, L.; Maffucci, A.; Micheli, L.; Sibilia, S. Electrical Impedance Spectroscopy for Real-Time Monitoring of the Life Cycle of Graphene Nanoplatelets Filters for Some Organic Industrial Pollutants. IEEE Trans. Instrum. Meas. 2021, 70, 1–12. [Google Scholar] [CrossRef]
  52. Van Haeverbeke, M.; De Baets, B.; Stock, M. Plant Impedance Spectroscopy: A Review of Modeling Approaches and Applications. Front. Plant Sci. 2023, 14, 1187573. [Google Scholar] [CrossRef] [PubMed]
  53. Ozier-Lafontaine, H.; Bajazet, T. Analysis of Root Growth by Impedance Spectroscopy (EIS). Plant Soil. 2005, 277, 299–313. [Google Scholar] [CrossRef]
  54. Cao, Y.; Repo, T.; Silvennoinen, R.; Lehto, T.; Pelkonen, P. Analysis of the Willow Root System by Electrical Impedance Spectroscopy. J. Exp. Bot. 2011, 62, 351–358. [Google Scholar] [CrossRef]
  55. Repo, T.; Korhonen, A.; Lehto, T.; Silvennoinen, R. Assessment of Frost Damage in Mycorrhizal and Non-Mycorrhizal Roots of Scots Pine Seedlings Using Classification Analysis of Their Electrical Impedance Spectra. Trees 2016, 30, 483–495. [Google Scholar] [CrossRef]
  56. Vozáry, E.; Jócsák, I.; Droppa, M.; Bóka, K. Connection between Structural Changes and Electrical Parameters of Pea Root Tissue Under Anoxia. In Anoxia; Padilla, P., Ed.; InTech: Rijeka, Croatia, 2012; pp. 132–146. ISBN 978-953-307-664-5. [Google Scholar]
  57. Repo, T.; Korhonen, A.; Laukkanen, M.; Lehto, T.; Silvennoinen, R. Detecting Mycorrhizal Colonisation in Scots Pine Roots Using Electrical Impedance Spectra. Biosyst. Eng. 2014, 121, 139–149. [Google Scholar] [CrossRef]
  58. Bar-On, L.; Garlando, U.; Sophocleous, M.; Jog, A.; Motto Ros, P.; Sade, N.; Avni, A.; Shacham-Diamand, Y.; Demarchi, D. Electrical Modelling of In-Vivo Impedance Spectroscopy of Nicotiana Tabacum Plants. Front. Electron. 2021, 2, 1–12. [Google Scholar] [CrossRef]
  59. Tomkiewicz, D.; Piskier, T. A Plant Based Sensing Method for Nutrition Stress Monitoring. Precis. Agric. 2012, 13, 370–383. [Google Scholar] [CrossRef]
  60. Borges, E.; Matos, A.P.; Cardoso, J.M.; Correia, C.; Vasconcelos, T.; Gomes, N. Early Detection and Monitoring of Plant Diseases by Bioelectric Impedance Spectroscopy. In Proceedings of the 2012 IEEE 2nd Portuguese Meeting in Bioengineering (ENBENG), Coimbra, Portugal, 20–23 February 2012; IEEE: Coimbra, Portugal, 2012; pp. 1–4. [Google Scholar]
  61. Basak, R.; Wahid, K.A.; Dinh, A.; Soolanayakanahally, R.; Fotouhi, R.; Mehr, A.S. Rapid and Efficient Determination of Relative Water Contents of Crop Leaves Using Electrical Impedance Spectroscopy in Vegetative Growth Stage. Remote Sens. 2020, 12, 1753. [Google Scholar] [CrossRef]
  62. Basak, R.; Wahid, K.; Dinh, A. Determination of Leaf Nitrogen Concentrations Using Electrical Impedance Spectroscopy in Multiple Crops. Remote Sens. 2020, 12, 566. [Google Scholar] [CrossRef]
  63. Sugiyama, M.; Okajima, M. Application of Electrochemical Impedance Spectroscopy and Modeling of the Novel Equivalent Circuit for Monitoring Cellular Tissues. Theor. Exp. Plant Physiol. 2022, 34, 501–508. [Google Scholar] [CrossRef]
  64. Ivanovski, T.; Zhang, G.; Jemric, T.; Gulic, M.; Matetic, M. Fruit Firmness Prediction Using Multiple Linear Regression. In Proceedings of the 2020 43rd International Convention on Information, Communication and Electronic Technology (MIPRO), Opatija, Croatia, 28 September–2 October 2020; IEEE: Opatija, Croatia, 2020; pp. 1306–1311. [Google Scholar]
  65. Wu, L.; Ogawa, Y.; Tagawa, A. Electrical Impedance Spectroscopy Analysis of Eggplant Pulp and Effects of Drying and Freezing–Thawing Treatments on Its Impedance Characteristics. J. Food Eng. 2008, 87, 274–280. [Google Scholar] [CrossRef]
  66. Watanabe, T.; Nakamura, N.; Ando, Y.; Kaneta, T.; Kitazawa, H.; Shiina, T. Application and Simplification of Cell-Based Equivalent Circuit Model Analysis of Electrical Impedance for Assessment of Drop Shock Bruising in Japanese Pear Tissues. Food Bioproc. Technol. 2018, 11, 2125–2129. [Google Scholar] [CrossRef]
  67. Patil, A.C.; Fernández la Villa, A.; Mugilvannan, A.K.; Elejalde, U. Electrochemical Investigation of Edible Oils: Experimentation, Electrical Signatures, and a Supervised Learning–Case Study of Adulterated Peanut Oils. Food Chem. 2023, 402, 134143. [Google Scholar] [CrossRef] [PubMed]
  68. Rao, R.K.; Sasmal, S. Nanoengineered Smart Cement Composite for Electrical Impedance-Based Monitoring of Corrosion Progression in Structures. Cem. Concr. Compos. 2022, 126, 104348. [Google Scholar] [CrossRef]
  69. Panda, M. Impedance Spectroscopy of Percolative Polymer Composites. In Percolation, Scaling, and Relaxation in Polymer Dielectrics; Springer Nature Switzerland AG: Cham, Switzerland, 2023; pp. 147–167. ISBN 978-3-031-27940-9. [Google Scholar]
  70. Chikara, K.S.; Bera, A.K.; Kumar, A.; Yusuf, S.M. Li-Ion Conduction Mechanism and Relaxation Dynamics in Sorosilicate Compound Li2Cu5(Si2O7)2. ACS Appl. Electron. Mater. 2023, 5, 5137–5150. [Google Scholar] [CrossRef]
  71. Pitruzzello, G.; Johnson, S.; Krauss, T.F. Exploring the Fundamental Limit of Antimicrobial Susceptibility by Near-Single-Cell Electrical Impedance Spectroscopy. Biosens. Bioelectron. 2023, 224, 115056. [Google Scholar] [CrossRef]
  72. Gul, M.M.; Ahmad, K.S.; Thomas, A.G.; Tawfeek, A.M. Advancing Photoelectrochemical Systems: Unleashing the Remarkable Performance of In:SnO2/Nd4In5S13 for Sustainable Energy Applications. ChemistrySelect 2024, 9, e202304530. [Google Scholar] [CrossRef]
  73. Mercante, L.A.; Andre, R.S.; Facure, M.H.M.; Correa, D.S.; Mattoso, L.H.C. Recent Progress in Conductive Electrospun Materials for Flexible Electronics: Energy, Sensing, and Electromagnetic Shielding Applications. Chem. Eng. J. 2023, 465, 142847. [Google Scholar] [CrossRef]
  74. Milkin, P.; Zhanbassynova, A.; Ionov, L. Superelastic, Soft, Stress-Healable, Recyclable Conductive Materials. Compos. Struct. 2024, 327, 117709. [Google Scholar] [CrossRef]
  75. Fernandes, I.J.; Aroche, A.F.; Schuck, A.; Lamberty, P.; Peter, C.R.; Hasenkamp, W.; Rocha, T.L.A.C. Silver Nanoparticle Conductive Inks: Synthesis, Characterization, and Fabrication of Inkjet-Printed Flexible Electrodes. Sci. Rep. 2020, 10, 8878. [Google Scholar] [CrossRef] [PubMed]
  76. Maged, A.; Madian, A.H.; Raafat, A.I.; Ali, A.E.-H. Cole-Cole Modelling of Reduced Graphene Oxide Decorated CuO Nano-Spheres Based Waterproof Conductive Ink for Flexible Electrodes. In Proceedings of the 2021 38th National Radio Science Conference (NRSC), Mansoura, Egypt, 27–29 July 2021; IEEE: Piscataway, NJ, USA, 2021; pp. 207–214. [Google Scholar]
  77. Tai, Y.; Bera, T.K.; Lubineau, G.; Yang, Z. Combining the Converse Humidity/Resistance Response Behaviors of RGO Films for Flexible Logic Devices. J. Mater. Chem. C Mater. 2017, 5, 3848–3854. [Google Scholar] [CrossRef]
  78. Bhat, B.R.; Aravinda, L.S.; Bhat, K.U. Flexible Binder Free Functionalized Carbon Nanotube Electrodes for Ultracapacitor. In Proceedings of the SPIE 8987, Oxide-Based Materials and Devices V; Teherani, F.H., Look, D.C., Rogers, D.J., Eds.; SPIE: San Francisco, CA, USA, 2014; p. 89871K. [Google Scholar]
  79. Reshma, M.; Manu, R. Fabrication of Cu-WO3-Functionalised Multiwalled Carbon Nanotubes Composite Film Electrode by Direct Deposition for Sensing Application. Thin Solid Film. 2021, 737, 138940. [Google Scholar] [CrossRef]
  80. Nguyen, T.D.; Han, H.S.; Shin, H.-Y.; Nguyen, C.T.; Phung, H.; Van Hoang, H.; Choi, H.R. Highly Sensitive Flexible Proximity Tactile Array Sensor by Using Carbon Micro Coils. Sens. Actuators A Phys. 2017, 266, 166–177. [Google Scholar] [CrossRef]
  81. Quan, J.; Shi, X.; Kim, K.N.; Oh, D.S.; Chua, B. Electrically Functional Water Sensing Duct Tape Suitable for Detection of Indoor Pinhole Leakages with High Spatial and Temporal Resolution. Sens. Actuators A Phys. 2023, 351, 114145. [Google Scholar] [CrossRef]
  82. Soares, A.C.; Soares, J.C.; dos Santos, D.M.; Migliorini, F.L.; Popolin-Neto, M.; dos Santos Cinelli Pinto, D.; Carvalho, W.A.; Brandão, H.M.; Paulovich, F.V.; Correa, D.S.; et al. Nanoarchitectonic E-Tongue of Electrospun Zein/Curcumin Carbon Dots for Detecting Staphylococcus Aureus in Milk. ACS Omega 2023, 8, 13721–13732. [Google Scholar] [CrossRef]
  83. Yu, J.M.; Jang, J.-W. Organic Semiconductor-Based Photoelectrochemical Cells for Efficient Solar-to-Chemical Conversion. Catalysts 2023, 13, 814. [Google Scholar] [CrossRef]
  84. Lo Vecchio, C.; Giacoppo, G.; Barbera, O.; Carbone, A.; Baglio, V.; Aricò, A.S.; Monforte, G.; Trocino, S. Scalability and Investigation of the Geometrical Features and Shapes of a Tandem Photo-Electrolysis Cell Based on Non-Critical Raw Materials. Catalysts 2024, 14, 98. [Google Scholar] [CrossRef]
  85. Gul, M.M.; Ahmad, K.S.; Thomas, A.G.; Ali, D. In:SnO2/Yb2S3:Cu2S:ZnS: A Rare Earth Metal Sulfide-Conjugated Transition Metal Sulfide Photoactive Electrode. Energy Technol. 2023, 11, 2300062. [Google Scholar] [CrossRef]
  86. Gul, M.M.; Ahmad, K.S.; Thomas, A.G.; Almanqur, L.; Alderhami, S.A.; Alharbi, Y.T. A Clear Path to Enhanced Performance: In:SnO2/(Er2S3–ZrS3–NiS2)GO as an Effective Transparent Electrode in Photoelectrochemical Cells. Mater. Chem. Phys. 2023, 309, 128445. [Google Scholar] [CrossRef]
  87. Liu, Z.; Sun, B.; Shi, T.; Tang, Z.; Liao, G. Enhanced Photovoltaic Performance and Stability of Carbon Counter Electrode Based Perovskite Solar Cells Encapsulated by PDMS. J. Mater. Chem. A Mater. 2016, 4, 10700–10709. [Google Scholar] [CrossRef]
  88. Gul, M.M.; Ahmad, K.S.; Thomas, A.G.; Almanqur, L.; Alderhami, S.A. Rare In:SnO2/NdYbS3 Metal Sulphide: A Novel Photoactive Electrode for Sustainable Energy Applications. Ceram. Int. 2023, 49, 32874–32884. [Google Scholar] [CrossRef]
  89. Manohar, A.; Vijayakanth, V.; Prabhakar Vattikuti, S.V.; Kim, K.H. Electrochemical Investigation on Nickel-Doped Spinel Magnesium Ferrite Nanoparticles for Supercapacitor Applications. Mater. Chem. Phys. 2023, 301, 127601. [Google Scholar] [CrossRef]
  90. Zhu, M.; Zhang, X.; Zhou, Y.; Zhuo, C.; Huang, J.; Li, S. Facile Solvothermal Synthesis of Porous ZnFe2O4 Microspheres for Capacitive Pseudocapacitors. RSC Adv. 2015, 5, 39270–39277. [Google Scholar] [CrossRef]
  91. Das, S.; Manuraj, M.; Rakhi, R.B.; Ajayaghosh, A. High-Frequency Electrochemical Double Layer Capacitor Based on Carbon Nanotubes Ink Coated Eggshell Membrane Electrodes. J. Energy Storage 2022, 45, 103799. [Google Scholar] [CrossRef]
  92. Figueroa-González, E.; Oliva, A.I.; Rodriguez-Gonzalez, V.; Gomez-Solis, C.; Garcia, C.R.; Oliva, J. Using Recycled Tetrapak and Ag/BaMoO4 Nanoparticles to Make Efficient and Flexible Solid State Supercapacitors. J. Energy Storage 2022, 47, 103544. [Google Scholar] [CrossRef]
  93. Rammelt, U.; Reinhard, G. Application of Electrochemical Impedance Spectroscopy (EIS) for Characterizing the Corrosion-Protective Performance of Organic Coatings on Metals. Prog. Org. Coat. 1992, 21, 205–226. [Google Scholar] [CrossRef]
  94. Roggero, A.; Caussé, N.; Dantras, E.; Villareal, L.; Santos, A.; Pébère, N. Thermal Activation of Impedance Measurements on an Epoxy Coating for the Corrosion Protection: 2. Electrochemical Impedance Spectroscopy Study. Electrochim. Acta 2019, 305, 116–124. [Google Scholar] [CrossRef]
  95. Narozny, M.; Zakowski, K.; Darowicki, K. Application of Electrochemical Impedance Spectroscopy to Evaluate Cathodically Protected Coated Steel in Seawater. Constr. Build. Mater. 2018, 181, 721–726. [Google Scholar] [CrossRef]
  96. Šoić, I.; Šoljić, I.; Eškinja, M.; Mujezinović, A.; Martinez, S. The Novel Paste Electrolyte Measuring Cell for EIS Testing of the Commonly Used Surface Protection on Bronze. Prog. Org. Coat. 2023, 177, 107442. [Google Scholar] [CrossRef]
  97. Almufarij, R.S. Facile Formulation of New Innovative Eco-Friendly Hybrid Protective Coating for Mild Steel in Acidic Media. Sustainability 2023, 15, 2779. [Google Scholar] [CrossRef]
  98. Bifano, L.; Fischerauer, A.; Liedtke, A.; Fischerauer, G. Characterization of Sand and Sand–Binder Systems from the Foundry Industry with Electrical Impedance Spectroscopy. J. Sens. Sens. Syst. 2021, 10, 43–51. [Google Scholar] [CrossRef]
  99. Mishra, S.K.; Kumar, D.; Biradar, A.M.; Rajesh. Electrochemical Impedance Spectroscopy Characterization of Mercaptopropionic Acid Capped ZnS Nanocrystal Based Bioelectrode for the Detection of the Cardiac Biomarker—Myoglobin. Bioelectrochemistry 2012, 88, 118–126. [Google Scholar] [CrossRef]
  100. Bonavita, A.; Caddemi, A.; Donato, N.; Accordino, P.; Galvagno, S.; Neri, G. Electrical Characterization and Modeling of Thin-Film Humidity Sensors. In Proceedings of the ICECS 2001, 8th IEEE International Conference on Electronics, Circuits and Systems (Cat. No.01EX483), Malta, 2–5 September 2001; IEEE: Malta, 2001; Volume 2, pp. 673–676. [Google Scholar]
  101. Faia, P.M.; Furtado, C.S.; Ferreira, A.J. AC Impedance Spectroscopy: A New Equivalent Circuit for Titania Thick Film Humidity Sensors. Sens. Actuators B Chem. 2005, 107, 353–359. [Google Scholar] [CrossRef]
  102. Maritinsen, O.G.; Grimnes, S.; Schwan, H.P. Interface Phenomena and Dielectric Properties of Biological Tissue. In Encyclopedia of Surface and Colloid Science; Hubbard, A.T., Ed.; Marcel Dekker, Inc.: New York, NY, USA, 2002; ISBN 9780824707965. [Google Scholar]
  103. Kerner, Z.; Pajkossy, T. On the Origin of Capacitance Dispersion of Rough Electrodes. Electrochim. Acta 2000, 46, 207–211. [Google Scholar] [CrossRef]
  104. Huang, V.M.-W.; Vivier, V.; Orazem, M.E.; Pébère, N.; Tribollet, B. The Apparent Constant-Phase-Element Behavior of an Ideally Polarized Blocking Electrode: A Global and Local Impedance Analysis. J. Electrochem. Soc. 2007, 154, C81–C88. [Google Scholar] [CrossRef]
  105. Orazem, M.E.; Frateur, I.; Tribollet, B.; Vivier, V.; Marcelin, S.; Pébère, N.; Bunge, A.L.; White, E.A.; Riemer, D.P.; Musiani, M. Dielectric Properties of Materials Showing Constant-Phase-Element (CPE) Impedance Response. J. Electrochem. Soc. 2013, 160, C215–C225. [Google Scholar] [CrossRef]
  106. Drüschler, M.; Huber, B.; Passerini, S.; Roling, B. Hysteresis Effects in the Potential-Dependent Double Layer Capacitance of Room Temperature Ionic Liquids at a Polycrystalline Platinum Interface. J. Phys. Chem. C 2010, 114, 3614–3617. [Google Scholar] [CrossRef]
  107. Lensch, H.; Bastuck, M.; Baur, T.; Schütze, A.; Sauerwald, T. Impedance Model for a High-Temperature Ceramic Humidity Sensor. J. Sens. Sens. Syst. 2019, 8, 161–169. [Google Scholar] [CrossRef]
  108. Rammelt, U.; Reinhard, G. On the Applicability of a Constant Phase Element (CPE) to the Estimation of Roughness of Solid Metal Electrodes. Electrochim. Acta 1990, 35, 1045–1049. [Google Scholar] [CrossRef]
  109. Zelinka, S.L.; Rammer, D.R.; Stone, D.S. Impedance Spectroscopy and Circuit Modeling of Southern Pine above 20% Moisture Content. Holzforschung 2008, 62, 737–744. [Google Scholar] [CrossRef]
  110. Park, Y.-J.; Lee, S.; Kim, B.; Kim, J.-H.; So, J.-H.; Koo, H.-J. Impedance Study on Humidity Dependent Conductivity of Polymer Composites with Conductive Nanofillers. Compos. B Eng. 2020, 202, 108412. [Google Scholar] [CrossRef]
  111. Nguyen, T.Q.; Breitkopf, C. Determination of Diffusion Coefficients Using Impedance Spectroscopy Data. J. Electrochem. Soc. 2018, 165, E826–E831. [Google Scholar] [CrossRef]
  112. Xie, D.-M.; Wang, T.-Y.; Xie, J.-P.; Cao, F.-Y.; Wang, Y.-G. Comparative Study of Two Equivalent Circuit Models for Electrochemical Impedance Spectroscopy Analysis of Epoxy Zinc-Rich Coatings. Corros. Eng. Sci. Technol. Int. J. Corros. Process. Corros. Control. 2023, 58, 734–746. [Google Scholar] [CrossRef]
  113. Kemp, N.T. A Tutorial on Electrochemical Impedance Spectroscopy and Nanogap Electrodes for Biosensing Applications. IEEE Sens. J. 2021, 21, 22232–22245. [Google Scholar] [CrossRef]
  114. Nam, I.; Kim, G.-P.; Park, S.; Han, J.W.; Yi, J. All-Solid-State, Origami-Type Foldable Supercapacitor Chips with Integrated Series Circuit Analogues. Energy Env. Sci. 2014, 7, 1095–1102. [Google Scholar] [CrossRef]
  115. Kampouris, D.K.; Ji, X.; Randviir, E.P.; Banks, C.E. A New Approach for the Improved Interpretation of Capacitance Measurements for Materials Utilised in Energy Storage. RSC Adv. 2015, 5, 12782–12791. [Google Scholar] [CrossRef]
  116. Liu, Y.; Li, D.; Qian, J.; Di, B.; Zhang, G.; Ren, Z. Electrical Impedance Spectroscopy (EIS) in Plant Roots Research: A Review. Plant Methods 2021, 17, 118. [Google Scholar] [CrossRef] [PubMed]
  117. Schipani, F.; Miller, D.R.; Ponce, M.A.; Aldao, C.M.; Akbar, S.A.; Morris, P.A. Electrical Characterization of Semiconductor Oxide-Based Gas Sensors Using Impedance Spectroscopy: A Review. Rev. Adv. Sci. Eng. 2016, 5, 86–105. [Google Scholar] [CrossRef]
  118. Elseady, A.A.E.; Lee, I.; Zhuge, Y.; Ma, X.; Chow, C.W.K.; Gorjian, N. Piezoresistivity and AC Impedance Spectroscopy of Cement-Based Sensors: Basic Concepts, Interpretation, and Perspective. Materials 2023, 16, 768. [Google Scholar] [CrossRef] [PubMed]
  119. Chen, X.; Liang, F.; Lu, W.; Zhao, Y.; Fan, G.; Wang, X. Improved Dielectric Properties of Ag@TiO2/PVDF Nanocomposites Induced by Interfacial Polarization and Modifiers with Different Carbon Chain Lengths. Appl. Phys. Lett. 2018, 112, 162902. [Google Scholar] [CrossRef]
  120. Abouelamaiem, D.I.; He, G.; Neville, T.P.; Patel, D.; Ji, S.; Wang, R.; Parkin, I.P.; Jorge, A.B.; Titirici, M.-M.; Shearing, P.R.; et al. Correlating Electrochemical Impedance with Hierarchical Structure for Porous Carbon-Based Supercapacitors Using a Truncated Transmission Line Model. Electrochim. Acta 2018, 284, 597–608. [Google Scholar] [CrossRef]
  121. Abouelamaiem, D.I.; He, G.; Parkin, I.; Neville, T.P.; Jorge, A.B.; Ji, S.; Wang, R.; Titirici, M.-M.; Shearing, P.R.; Brett, D.J.L. Synergistic Relationship between the Three-Dimensional Nanostructure and Electrochemical Performance in Biocarbon Supercapacitor Electrode Materials. Sustain. Energy Fuels 2018, 2, 772–785. [Google Scholar] [CrossRef]
  122. Mikolajek, M.; Reinheimer, T.; Bohn, N.; Kohler, C.; Hoffmann, M.J.; Binder, J.R. Fabrication and Characterization of Fully Inkjet Printed Capacitors Based on Ceramic/Polymer Composite Dielectrics on Flexible Substrates. Sci. Rep. 2019, 9, 13324. [Google Scholar] [CrossRef]
  123. Abdelrahman, A.A.; Bendary, S.H.; Mahmoud, S.A. Synthesis and Electrochemical Properties of Ni-Al LDH@RGO Hierarchical Nanocomposite as a Potential Counter Electrode in Dye Sensitized Solar Cells. Diam. Relat. Mater. 2023, 134, 109738. [Google Scholar] [CrossRef]
  124. Kononov, N.; Yagudaeva, E.; Voronov, V.; Dorofeev, S.; Malakhova, Y.; Cerven, V.; Zubov, V. Phase Transition in a Tetraaniline/Nanosilicon Composite Film Detected by Impedance Spectroscopy. J. Phys. Chem. C 2023, 127, 17063–17077. [Google Scholar] [CrossRef]
  125. Kowsari, E. High-Performance Supercapacitors Based on Ionic Liquids and a Graphene Nanostructure. In Ionic Liquids—Current State of the Art; Handy, S., Ed.; InTech: Rijeka, Croatia, 2015. [Google Scholar]
  126. Hammons, J.A.; Ustarroz, J.; Muselle, T.; Torriero, A.A.J.; Terryn, H.; Suthar, K.; Ilavsky, J. Supported Silver Nanoparticle and Near-Interface Solution Dynamics in a Deep Eutectic Solvent. J. Phys. Chem. C 2016, 120, 1534–1545. [Google Scholar] [CrossRef]
  127. Fletcher, S.; Black, V.J.; Kirkpatrick, I. A Universal Equivalent Circuit for Carbon-Based Supercapacitors. J. Solid State Electrochem. 2014, 18, 1377–1387. [Google Scholar] [CrossRef]
  128. Zhang, X.; Zhang, X.; Sun, X.; An, Y.; Song, S.; Li, C.; Wang, K.; Su, F.; Chen, C.-M.; Liu, F.; et al. Electrochemical Impedance Spectroscopy Study of Lithium-Ion Capacitors: Modeling and Capacity Fading Mechanism. J. Power Sources 2021, 488, 229454. [Google Scholar] [CrossRef]
  129. Niklasson, G.A.; Qiu, Z.; Bayrak Pehlivan, I.; Edvinsson, T. Impedance Spectroscopy of Water Splitting Reactions on Nanostructured Metal-Based Catalysts. In Proceedings of the IOP Conference Series: Materials Science and Engineering, Functional Materials and Nanotechnologies (FM&NT 2018), Riga, Latvia, 2–5 October 2018; Volume 503, p. 012005. [Google Scholar]
  130. Tolouei, N.E.; Mazrouei, R.; Shavezipur, M. Three-Dimensional Impedance-Based Sensors for Detection of Chemicals in Aqueous Solutions. Int. J. Anal. Bioanal. Methods 2020, 2, 35840. [Google Scholar] [CrossRef]
  131. Wang, R.; Wang, Y.; Lassiter, K.; Li, Y.; Hargis, B.; Tung, S.; Berghman, L.; Bottje, W. Interdigitated Array Microelectrode Based Impedance Immunosensor for Detection of Avian Influenza Virus H5N1. Talanta 2009, 79, 159–164. [Google Scholar] [CrossRef] [PubMed]
  132. Faia, P.M.; Libardi, J.; Barbosa, I.; Araújo, E.S.; de Oliveira, H.P. Preparation, Characterization, and Evaluation of Humidity-Dependent Electrical Properties of Undoped and Niobium Oxide-Doped TiO2:WO3 Mixed Powders. Adv. Mater. Sci. Eng. 2017, 2017, 2808262. [Google Scholar] [CrossRef]
  133. Araújo, E.S.; Libardi, J.; Faia, P.M.; de Oliveira, H.P. Characterization and Electrical Response to Humidity of Sintered Polymeric Electrospun Fibers of Vanadium Oxide-TiO2/WO3. J. Electron. Mater. 2018, 47, 2710–2717. [Google Scholar] [CrossRef]
Figure 1. (a) Illustrative Nyquist diagram (−Z’’ versus Z’); (b) R//C circuit frequency domain Nyquist plot; (c) depressed semicircle model (x ≠ y) in a Nyquist plot.
Applsci 14 05754 g001
Figure 2. Nyquist plot illustrating a CPE or a Warburg element in the frequency domain.
Applsci 14 05754 g002
Figure 3. Illustrative Nyquist diagram of an O-element.
Applsci 14 05754 g003
Figure 4. Z’ and Z’‘ parts of the impedance as a function of the angular velocity form their respective Bode diagrams.
Applsci 14 05754 g004
Figure 5. Simplified Randles cell equivalent circuit model and Nyquist representation.
Applsci 14 05754 g005
Figure 6. Possibilities of associating elements according to the classical rules of analysis of electrical circuits, considering the nonexistence of a contribution under certain conditions. (a) serial association (b) parallel.
Applsci 14 05754 g006
Figure 7. Illustration of the different regions in the nanostructured sample between electrodes and the modelling of the electrical response of each of them (R1//C1, R2//C2, and R3//C3, under the influence of the bulk, grain boundary and electrodes, respectively).
Applsci 14 05754 g007
Figure 8. Experimental and fitted data using the proposed model circuit [128].
Applsci 14 05754 g008
Figure 9. The parallel association approach carried out by Edvinsson et al. [129]. (a) Model schematic; (b) some of the fitted circuit parameters as a function of applied potential vs. Ag/AgCl (3 M KCl); charge transfer resistance Rct, adsorption resistance Ra1, and inductance La.
Applsci 14 05754 g009
Figure 10. Parallel association approach carried out by Tolouei et al. [130] (a) Nyquist diagram of an IDE sensor; (b) Nyquist diagram of a three-dimensional sensor with two suspended electrodes; (c) electrical equivalent circuit model; (d) fitting of the Nyquist data of the IDE sensor obtained at 2 ppm DEHP concentration; (e) fitting of the Nyquist data of 3D sensor with two suspended electrodes obtained at 2 ppm DEHP concentration.
Applsci 14 05754 g010aApplsci 14 05754 g010b
Figure 11. Parallel association approach used by Wang et al. [131]; (a) proposed equivalent circuit; (b) example of the simulated and measured data (on the right).
Applsci 14 05754 g011
Figure 12. Some data concerning the characterization of TiO2:WO3 compounds doped with Nb2O5; (a) equivalent model developed; (bd) experimental and simulated Nyquist diagrams using the model for a sample with 4% of niobium oxide, at 20 °C for 20, 50 and 70% RH, respectively; (eg) experimental and simulated Nyquist diagrams using the model for sample with 6% niobium oxide, at 20 °C for 20, 50 and 70% RH, respectively [132].
Applsci 14 05754 g012aApplsci 14 05754 g012b
Figure 13. Equivalent circuit adopted for modelling vanadium undoped and doped electrodeposited Ti-W films.
Applsci 14 05754 g013
Figure 14. TiW 1 layer—Experimental and fitted data using the proposed model circuit for different RH concentrations: (a) 10%, (b) 40%, (c) 70%, (d) 100%.
Applsci 14 05754 g014
Figure 15. TiW-V5 1 layer—Experimental and fitted data using the proposed model circuit for different RH concentrations: (a) 10%, (b) 40%, (c) 70%, (d) 100%.
Applsci 14 05754 g015
Figure 16. TiW-V7 1 layer—Experimental and fitted data using the proposed model circuit for different RH concentrations: (a) 10%, (b) 40%, (c) 70%, (d) 100%.
Applsci 14 05754 g016aApplsci 14 05754 g016b
Table 1. Comparative summary of Impedance Spectroscopy data.
Cell Configuration Approach (n° of Points)Frequency Range (Hz)Use of Bias SignalReported in
EleISStarting from 0.01 Hz up to 10 MHzNo[38,51,53,54,55,56,57,58,61,62,63,65,66,75,76,77,78,79,82,85,87,88,91,92,93,96,98]
EISStarting from 0.01 Hz up to 100 kHzYes[41,42,43,44,46,47,48,50,89,94,95]
Table 2. Determined parameters for TiW 1 layer.
RH (%)R1 (Ω)C1 (F)R2 (Ω)C2 (F)Ypo (Ω)npo (a.u.)Yel (Ω)nel (a.u.)Cgeo (F)R3 (Ω)C3 (F)
101.2 × 1078.0 × 10−122.1 × 1066.0 × 10−121.2 × 10−95.1 × 10−14.0 × 10−96.1 × 10−13.2 × 10−112.3 × 1076.0 × 10−12
203.4 × 1072.0 × 10−112.2 × 1078.1 × 10−111.2 × 10−94.9 × 10−16.0 × 10−96.1 × 10−12.3 × 10−113.5 × 1076.0 × 10−12
303.6 × 1072.5 × 10−119.2 × 1061.1 × 10−101.1 × 10−94.9 × 10−16.0 × 10−95.8 × 10−12.3 × 10−115.0 × 1077.0 × 10−12
403.6 × 1072.5 × 10−113.2 × 1061.1 × 10−101.1 × 10−94.9 × 10−16.0 × 10−95.8 × 10−12.3 × 10−115.0 × 1077.0 × 10−12
501.6 × 1072.5 × 10−113.2 × 1061.1 × 10−101.2 × 10−94.9 × 10−16.0 × 10−95.8 × 10−12.3 × 10−113.6 × 1071.3 × 10−11
601.6 × 1072.5 × 10−113.2 × 1061.1 × 10−101.2 × 10−94.9 × 10−16.0 × 10−95.8 × 10−12.3 × 10−113.6 × 1071.3 × 10−11
701.4 × 1072.2 × 10−111.7 × 1062.3 × 10−101.6 × 10−94.9 × 10−17.0 × 10−95.9 × 10−12.3 × 10−112.1 × 1071.4 × 10−11
801.1 × 1072.2 × 10−111.1 × 1062.3 × 10−101.6 × 10−95.0 × 10−11.0 × 10−86.2 × 10−12.3 × 10−111.1 × 1071.8 × 10−11
901.0 × 1072.2 × 10−119.2 × 1052.3 × 10−101.6 × 10−95.0 × 10−11.0 × 10−86.2 × 10−12.3 × 10−119.3 × 1061.9 × 10−11
1006.5 × 1062.2 × 10−118.4 × 1052.3 × 10−101.6 × 10−95.0 × 10−11.0 × 10−86.2 × 10−12.3 × 10−116.3 × 1062.1 × 10−11
Table 3. Determined parameters for TiW-V5 1 layer.
RH (%)R1 (Ω)C1 (F)R2 (Ω)C2 (F)Ypo (Ω)npo (a.u.)Yel (Ω)nel (a.u.)Cgeo (F)R3 (Ω)C3 (F)
101.6 × 1071.4 × 10−111.7 × 1061.7 × 10−107.2 × 10−105.2 × 10−11.9 × 10−96.5 × 10−11.2 × 10−112.1 × 1079.1 × 10−12
207.6 × 1072.4 × 10−111.7 × 1071.7 × 10−94.1 × 10−105.2 × 10−19.9 × 10−96.2 × 10−15.2 × 10−113.7 × 1087.2 × 10−12
307.6 × 1072.1 × 10−111.7 × 1071.7 × 10−91.6 × 10−105.2 × 10−19.9 × 10−97.2 × 10−13.2 × 10−113.7 × 1086.0 × 10−12
407.6 × 1072.1 × 10−111.7 × 1071.7 × 10−91.6 × 10−105.2 × 10−19.9 × 10−97.2 × 10−13.2 × 10−113.7 × 1084.0 × 10−12
507.6 × 1072.1 × 10−111.7 × 1071.7 × 10−91.6 × 10−105.0 × 10−19.9 × 10−97.2 × 10−13.2 × 10−111.8 × 1086.0 × 10−12
607.6 × 1076.1 × 10−113.7 × 1073.7 × 10−111.6 × 10−104.9 × 10−19.9 × 10–106.0 × 10−10.7 × 10−111.8 × 1083.0 × 10−11
703.1 × 1076.1 × 10−115.7 × 1072.7 × 10−111.3 × 10−104.9 × 10−12.0 × 10−83.0 × 10−10.1 × 10−112.0 × 1073.1 × 10−11
803.1 × 1075.1 × 10−116.7 × 1071.6 × 10−112.3 × 10−104.9 × 10−12.0 × 10−83.0 × 10−11.0 × 10−112.7 × 1073.6 × 10−11
904.1 × 1075.1 × 10−116.7 × 1071.6 × 10−113.2 × 10−104.9 × 10−12.0 × 10−83.0 × 10−10.8 × 10−113.5 × 1072.5 × 10−11
1005.1 × 1065.1 × 10−116.7 × 1071.6 × 10−113.2 × 10−104.9 × 10−110.0 × 10−83.0 × 10−11.0 × 10−113.8 × 1062.2 × 10−11
Table 4. Determined parameters for TiW-V7 1 layer.
RH (%)R1 (Ω)C1 (F)R2 (Ω)C2 (F)Ypo (Ω)npo (a.u.)Yel (Ω)nel (a.u.)Cgeo (F)R3 (Ω)C3 (F)
102.3 × 1051.1 × 10−107.2 × 1054.5 × 10−129.0 × 10−128.8 × 10−12.9 × 10−72.1 × 10−24.1 × 10−112.7 × 1051.8 × 10−9
202.3 × 1051.1 × 10−101.2 × 1064.5 × 10−129.0 × 10−128.8 × 10−12.9 × 10−72.1 × 10−24.1 × 10−113.9 × 1051.2 × 10−9
302.3 × 1051.1 × 10−101.4 × 1064.5 × 10−129.0 × 10−128.8 × 10−12.9 × 10−72.1 × 10−24.1 × 10−114.3 × 1051.1 × 10−9
402.3 × 1051.1 × 10−101.4 × 1064.5 × 10−129.0 × 10−128.8 × 10−12.9 × 10−72.1 × 10−24.1 × 10−114.5 × 1059.2 × 10−10
502.3 × 1051.1 × 10−101.2 × 1064.5 × 10−129.0 × 10−128.8 × 10−12.9 × 10−72.1 × 10−24.1 × 10−114.6 × 1059.5 × 10−10
602.3 × 1051.1 × 10−101.2 × 1064.5 × 10−129.0 × 10−128.8 × 10−12.9 × 10−72.1 × 10−24.1 × 10−114.6 × 1059.5 × 10−10
702.0 × 1051.1 × 10−108.4 × 1054.5 × 10−129.0 × 10−128.8 × 10−12.9 × 10−72.1 × 10−24.1 × 10−113.6 × 1051.1 × 10−9
801.9 × 1051.1 × 10−106.4 × 1054.5 × 10−129.0 × 10−128.8 × 10−12.9 × 10−72.1 × 10−24.1 × 10−112.5 × 1051.6 × 10−9
901.6 × 1051.2 × 10−105.2 × 1054.5 × 10−129.0 × 10−129.0 × 10−12.9 × 10−72.1 × 10−24.1 × 10−112.1 × 1051.6 × 10−9
1001.4 × 1051.5 × 10−104.6 × 1054.7 × 10−124.0 × 10−119.0 × 10−15.0 × 10−71.9 × 10−24.1 × 10−111.6 × 1052.0 × 10−9
Disclaimer/Publisher’s Note: The statements, opinions and data contained in all publications are solely those of the individual author(s) and contributor(s) and not of MDPI and/or the editor(s). MDPI and/or the editor(s) disclaim responsibility for any injury to people or property resulting from any ideas, methods, instructions or products referred to in the content.

