Article

The Influence of AI and AR Technology in Personalized Recommendations on Customer Usage Intention: A Case Study of Cosmetic Products on Shopee

by
Siti Rabiatul Adawiyah
*,
Betty Purwandari
,
Imairi Eitiveni
and
Erisva Hakiki Purwaningsih
*
Faculty of Computer Science, University of Indonesia, Depok 16424, Indonesia
*
Authors to whom correspondence should be addressed.
Appl. Sci. 2024, 14(13), 5786; https://doi.org/10.3390/app14135786
Submission received: 26 April 2024 / Revised: 18 June 2024 / Accepted: 21 June 2024 / Published: 2 July 2024
(This article belongs to the Special Issue Advances in Intelligent Information Systems and AI Applications)

Abstract

:

Featured Application

Shopee, SmartPLS 3.

Abstract

With the rapid growth of Augmented Reality (AR) in e-commerce, it is necessary to conduct in-depth studies related to the integration of AR with Artificial Intelligence (AI) technology to improve personalization in product recommendations. AI and AR are expected to work together, where AI systems analyze consumer data to provide more suitable product recommendations, while AR helps consumers visualize these recommendations in the real world. This research explores the influence of AI and AR technology integration in personalized recommendations on customer usage intention, with a focus on the cosmetics industry on the e-commerce platform Shopee. Adopting the Technology Acceptance Model (TAM) and the Theory of Planned Behavior (TPB), this research uses quantitative methods with the try-on feature of cosmetic products as the main focus. With a total number of 387 respondents, the results of the PLS-SEM analysis revealed factors impacting the intention to use, such as perceived ease of use, perceived usefulness, and users’ perceived trust, on the intention to use personalized recommendations. This research contributes to the understanding of AI–AR technology acceptance in the context of online shopping, particularly in the cosmetics sector.

1. Introduction

E-commerce, a cornerstone of the modern retail ecosystem, has witnessed a global surge, reshaping traditional consumer behaviors and market dynamics. Key players in the global e-commerce arena have pioneered innovations to enhance user experiences, streamline transactions, and cater to diverse consumer needs [1]. Platforms such as Amazon, Alibaba, and eBay have emerged as giants, each contributing distinct features and strategies to the competitive landscape [2]. Amazon, a juggernaut in the industry, stands out for its extensive product offerings, efficient logistics, and customer-centric approach. The platform has set high standards for convenience and reliability, catering to a vast global audience. Alibaba, a giant in the Chinese market, has excelled through its diversified ecosystem, incorporating e-commerce, cloud computing, and digital entertainment. Its influence extends beyond traditional online retail, contributing to a comprehensive digital lifestyle. Shopee, on the other hand, has carved a niche in Southeast Asia with its emphasis on mobile-first strategies, innovative marketing campaigns, and localized services. To provide a better understanding of the Shopee application interface, a screenshot of the app was taken (see Figure 1).
Shopee, as one of the leading e-commerce platforms in the Southeast Asian region, boasts a wide and dynamic market share. Its strong presence in different countries allows researchers to explore the diversity of users and varied consumer preferences, providing a comprehensive picture of the influence of AI and AR technology integration on customer usage intentions. In addition, Shopee is known as a pioneer in implementing advanced technologies [3], including the try-on feature of cosmetic products, which is the main focus of this study. This uniqueness provides an opportunity to deeply understand how the integration of these technologies affects consumer behavior in the cosmetics sector, creating a relevant and powerful foundation for knowledge development in this field. As such, the selection of Shopee as a research platform was not based solely on its popularity, but rather on its rich exploratory potential and relevance to current developments in e-commerce technology.
According to the statistics in Figure 2, the most visited platform in Indonesia during this period is Shopee, which holds the primary position in e-commerce popularity within the market. With a significant number of visitors, Shopee reinforces its presence as a highly relied-upon platform by Indonesian consumers. Shopee’s leadership in visitor statistics reflects various factors, including innovative marketing strategies, collaborations with diverse brands, and a focus on a personalized and enjoyable user experience. With a strong foothold at the local level, Shopee emerges as a noteworthy phenomenon in the Indonesian e-commerce landscape in early 2023.
This research is motivated by the increasingly dominant role of Augmented Reality (AR) in the context of e-commerce, where AR becomes an interactive tool that allows the merging of the real and the virtual worlds. The presence of AR technology in e-commerce offers significant opportunities to influence consumer behavior and change the dynamics of the business sector [5]. In particular, the integration of AR in e-commerce platforms, such as Shopee, can provide a more interactive and immersive online shopping experience for customers, especially in the context of the cosmetics industry.
In the context of e-commerce, AR has been proven to enhance the shopping experience by allowing customers to interact virtually with products [6,7,8]. This helps consumers to better visualize products before making a purchase decision, address the issue of returns, and create an experience closer to shopping in a physical store [6]. With the rapid growth of AR in e-commerce [5,6,9] it is necessary to conduct in-depth studies related to the integration of AR with Artificial Intelligence (AI) technology to improve personalization in product recommendations. AI and AR are expected to work together, where AI systems analyze consumer data to provide more suitable product recommendations, while AR helps consumers visualize these recommendations in the real world. Shopee’s uniqueness as the leading e-commerce platform in Southeast Asia provides an opportunity to explore the diversity of users and consumer preferences, particularly in the cosmetics industry, which is the subject of this research.
It was found that the aspects of technology, consumers, and sellers each have completely different challenges. Challenges in the technological aspect have a lot to do with the flexibility and realism of AR technology itself, thus requiring a new approach or technology integration in order to maximize the utilization and application of AR in e-commerce [9,10]. Meanwhile, from the consumer and seller sides, the challenges faced focus on individual preferences and require solutions that lead to regulatory adjustments or relate to human psychology [5,7,9]. The most common challenges faced in integrating AR into e-commerce, such as technical complexity [5,9], development and integration of AR technology that requires significant financial investment [11], and privacy concerns [7], provide the impetus to explore the potential for optimizing recommendation systems using AI, as well as the impact of AR as a means of visualization on consumer perceptions and usage intentions. While significant advancements have been made in the integration of AI and AR technologies within various sectors, the application and impact of these technologies in personalized recommendations, particularly in the cosmetics industry, remain underexplored. This study aims to fill this research gap by examining how AI and AR integration can enhance customer experience and usage intention on e-commerce platforms. By focusing on Shopee, a leading e-commerce platform in Southeast Asia, this research provides unique insights into a rapidly growing market, highlighting the potential for these technologies to transform online shopping experiences. Therefore, this study aims to answer two main questions: What impact does the integration of AI and AR technologies in personalized recommendation have on customer usage intention? And what factors influence customer usage intention towards the integration of AI and AR technologies in personalized recommendation?
This research aims to provide a comprehensive understanding of how technology is transforming the online shopping experience, especially within the cosmetics industry. The findings are anticipated to contribute to the theoretical literature on AI and human–computer interaction in e-commerce while also offering practical guidance for e-commerce companies like Shopee. This guidance will help in optimizing recommendation systems, enhancing user experience, and boosting customer purchase intentions. Therefore, this research is expected to make significant contributions both theoretically and practically to the advancement of e-commerce technology.

2. Literature Review

The literature review section establishes the foundational knowledge for the research, focusing on the convergence of e-commerce, augmented reality (AR), and artificial intelligence (AI) in personalized recommendations for cosmetics on Shopee.

2.1. E-Commerce

Electronic commerce, commonly known as e-commerce, has evolved as a significant facet of business activities in the digital era. The term encompasses a broad range of online transactions, including buying, selling, and trading goods, services, or data over the Internet [12]. Often confused with e-business, which encompasses a wider array of online business activities, e-commerce has diversified applications such as business-to-consumer (B2C), business-to-business (B2B), consumer-to-consumer (C2C), and various others [13,14]. The rapid expansion of e-commerce was catalyzed by the emergence of the World Wide Web in the early 1990s [15]. However, e-commerce faces challenges, both technological and non-technological, such as security concerns, inadequate telecommunication bandwidth, and unresolved legal and public policy issues [16].

2.2. Augmented Reality in E-Commerce

Augmented Reality (AR) is a technology that overlays computer-generated images onto the user’s view of the real world, creating a blended experience [17]. In the context of e-commerce, AR enhances the online shopping experience by enabling customers to visualize products in their real-world environment before making a purchase [16,18]. For instance, furniture retailers can use AR to show customers how a particular piece would look in their homes [10,19]. This visualization aids customers in making more informed purchase decisions, reducing the likelihood of returns. AR can also provide additional product information, such as reviews, specifications, or instructions, enhancing the bridge between online and offline shopping experiences and increasing customer engagement and satisfaction.

2.3. Artificial Intelligence in E-Commerce

The integration of Artificial Intelligence (AI) in e-commerce is becoming increasingly prevalent, aiming to enhance customer experience, optimize operations, and boost sales [20,21]. Common applications of AI in e-commerce include personalized product recommendations, chatbots, pricing optimization, demand forecasting, smart search, and logistic optimization [22]. AI assists businesses in analyzing customer data, making real-time decisions, and automating processes, ultimately leading to a more engaging and efficient shopping experience [22]. Implementing AI in e-commerce involves identifying business goals and challenges, researching the best AI tools for the business, and consulting with experienced developers to create specific solutions if necessary.

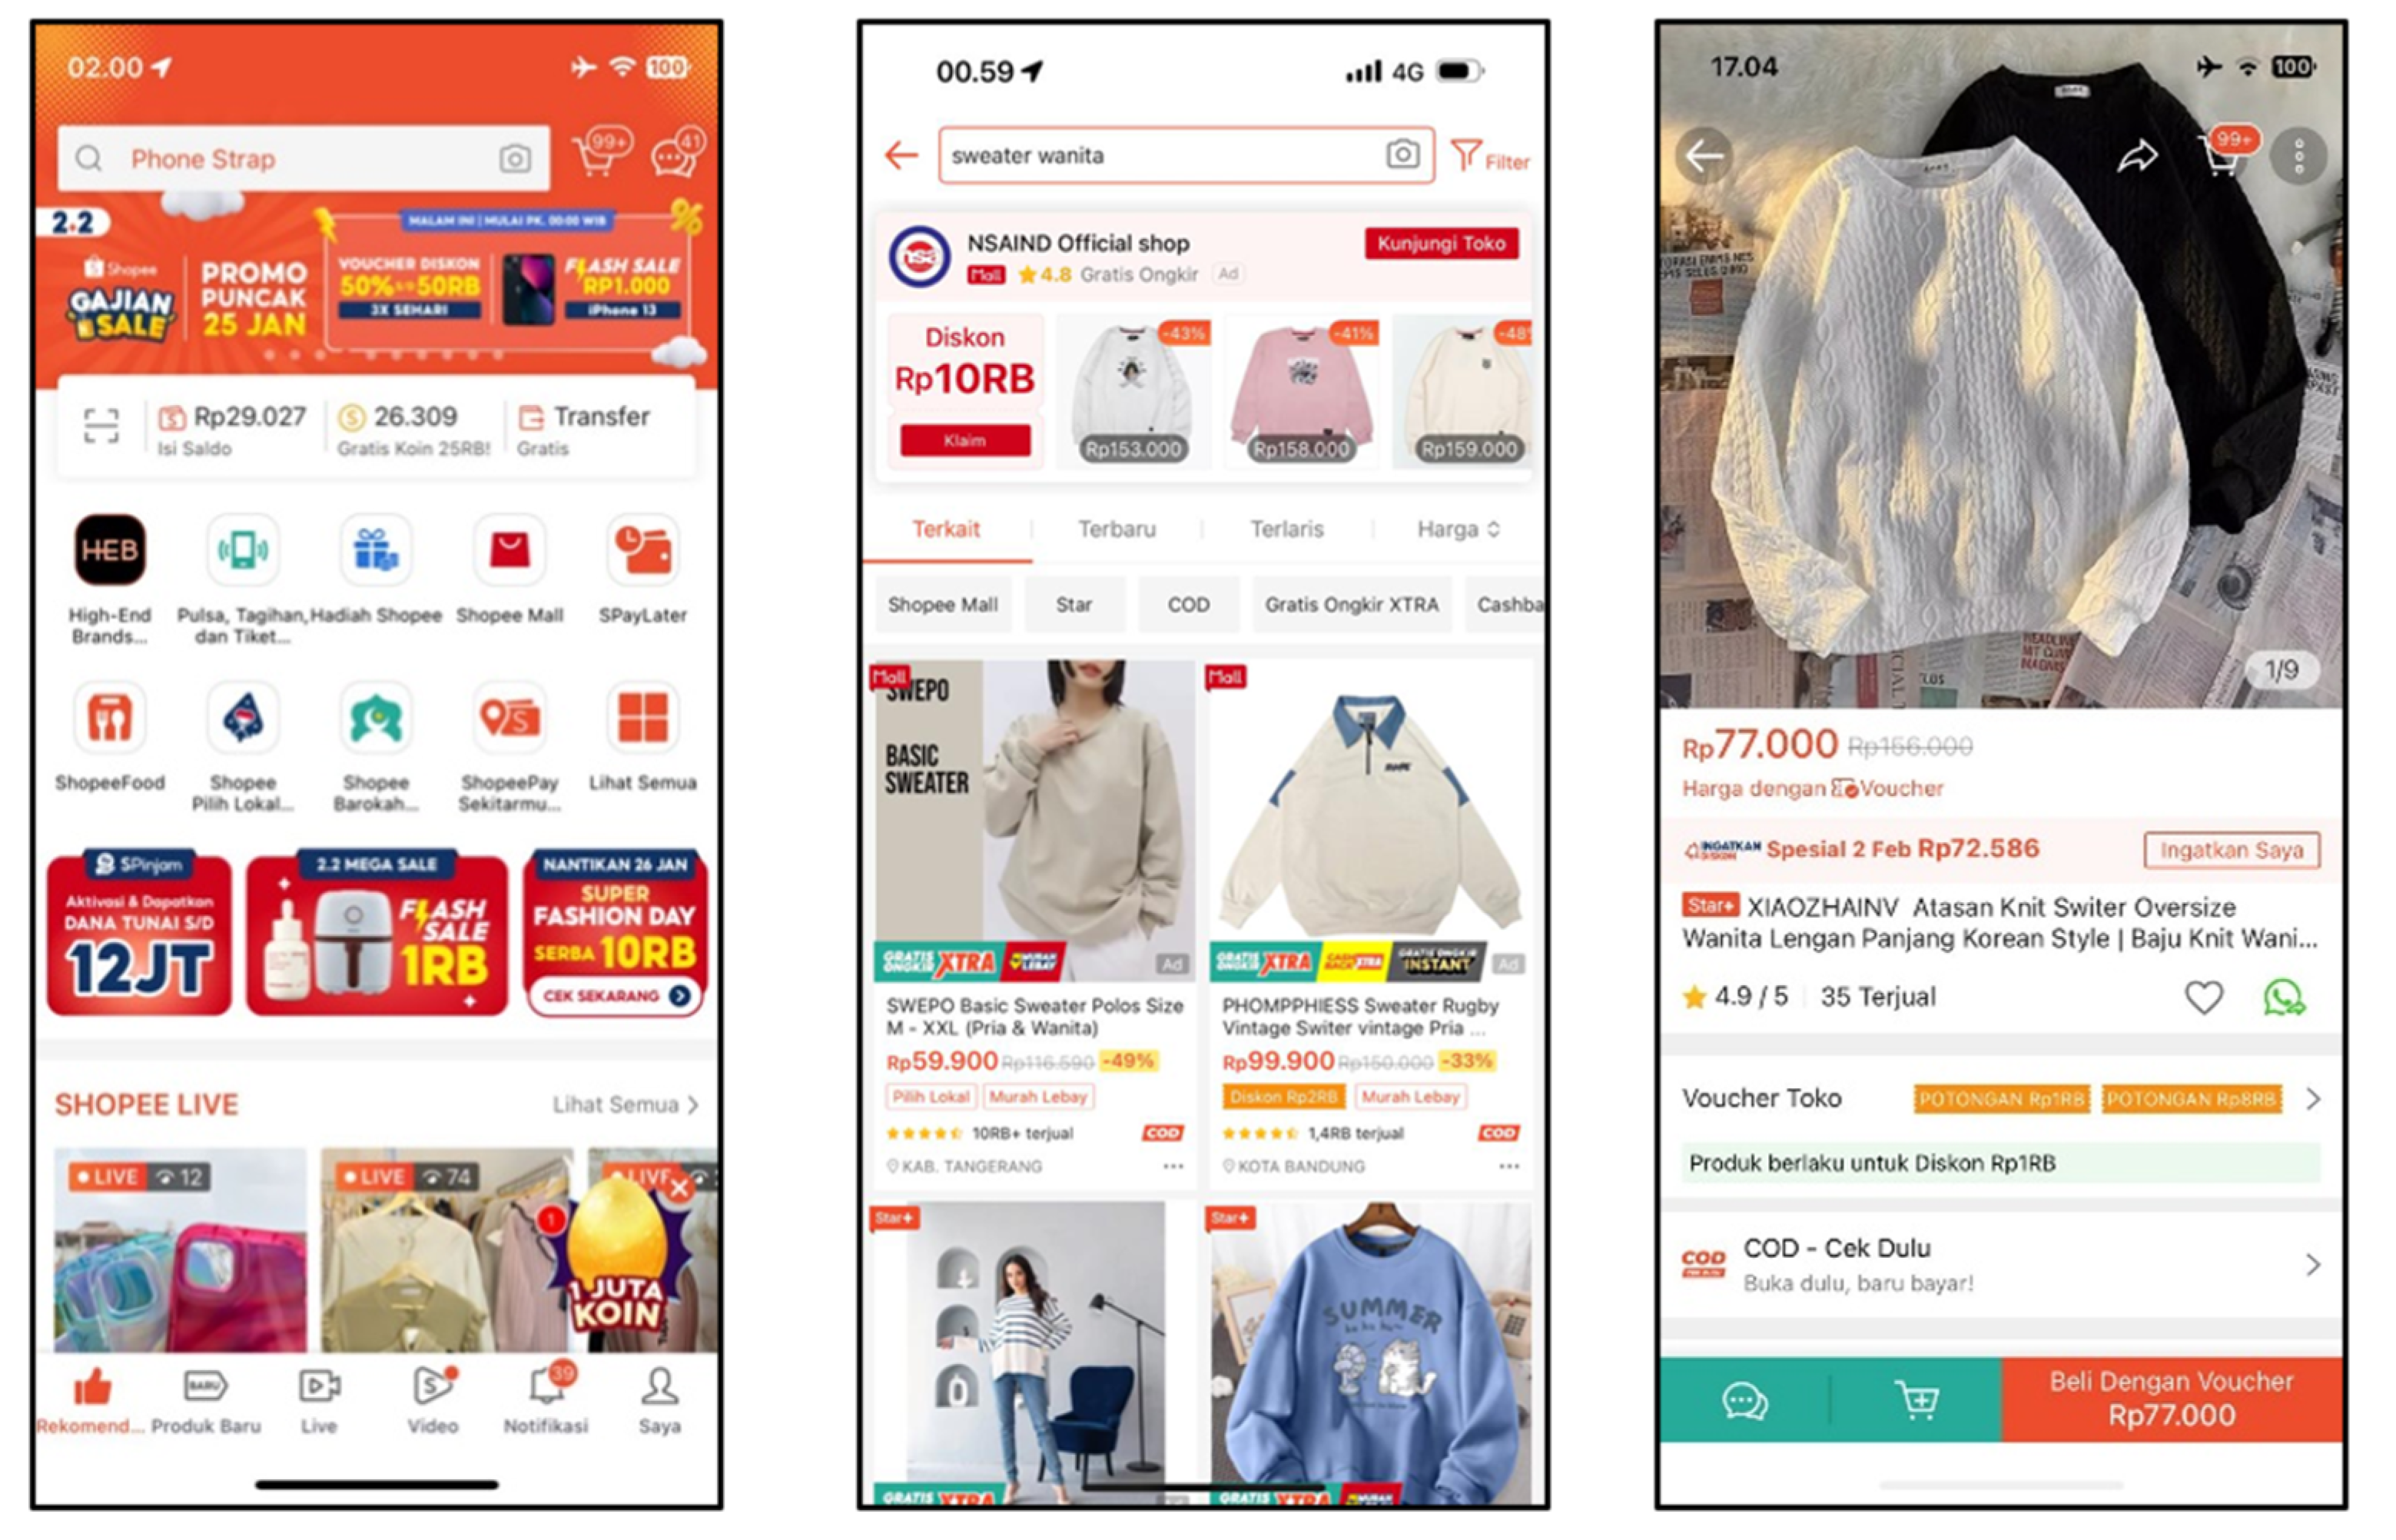
2.4. Personalized Recommendation in Shopee

Personalized product recommendations in e-commerce involve using AI models to provide tailored suggestions for individual buyers [23]. These recommendations are based on visitor behavior and profiles, such as search history or purchase patterns [24]. The aim is to enhance the user experience, increase conversion rates, reduce shopping cart abandonment, and raise the average order value. E-commerce platforms can generate personalized product recommendations using backend AI, creating online personality models for each customer and analyzing various data points, including search queries, demographics, purchase history, and social behavior [24]. Implementing personalized product recommendations can significantly enhance customer engagement and conversion rates in e-commerce.

2.5. Partial Least Squares Structural Equation Modeling (PLS-SEM)

Partial Least Squares Structural Equation Modeling (PLS-SEM) is a statistical approach used to analyze complex relationships between variables in a conceptual model. PLS-SEM allows for modeling multiple variables and relationships, accommodates formative and reflective measures, and possesses strong statistical predictive capabilities [25]. This approach is particularly useful when dealing with a large number of variables and limited sample sizes, as it handles complex causal relationships [26]. Researchers employing PLS-SEM typically compare specific direct and indirect effects to identify potential mediating effects [27]. In the context of this research, PLS-SEM is employed to evaluate and test the conceptual model developed to understand the impact of integrating AI and AR technologies into personalized recommendations on cosmetic users’ intention on the Shopee platform. Implementation steps of PLS-SEM involve model construction, data collection, model estimation, and hypothesis testing [26]. Model estimation is carried out by minimizing the error between empirical data and model predictions, enabling researchers to evaluate and interpret the interconnectedness of measured and latent variables [26].

2.6. Theoretical Framework

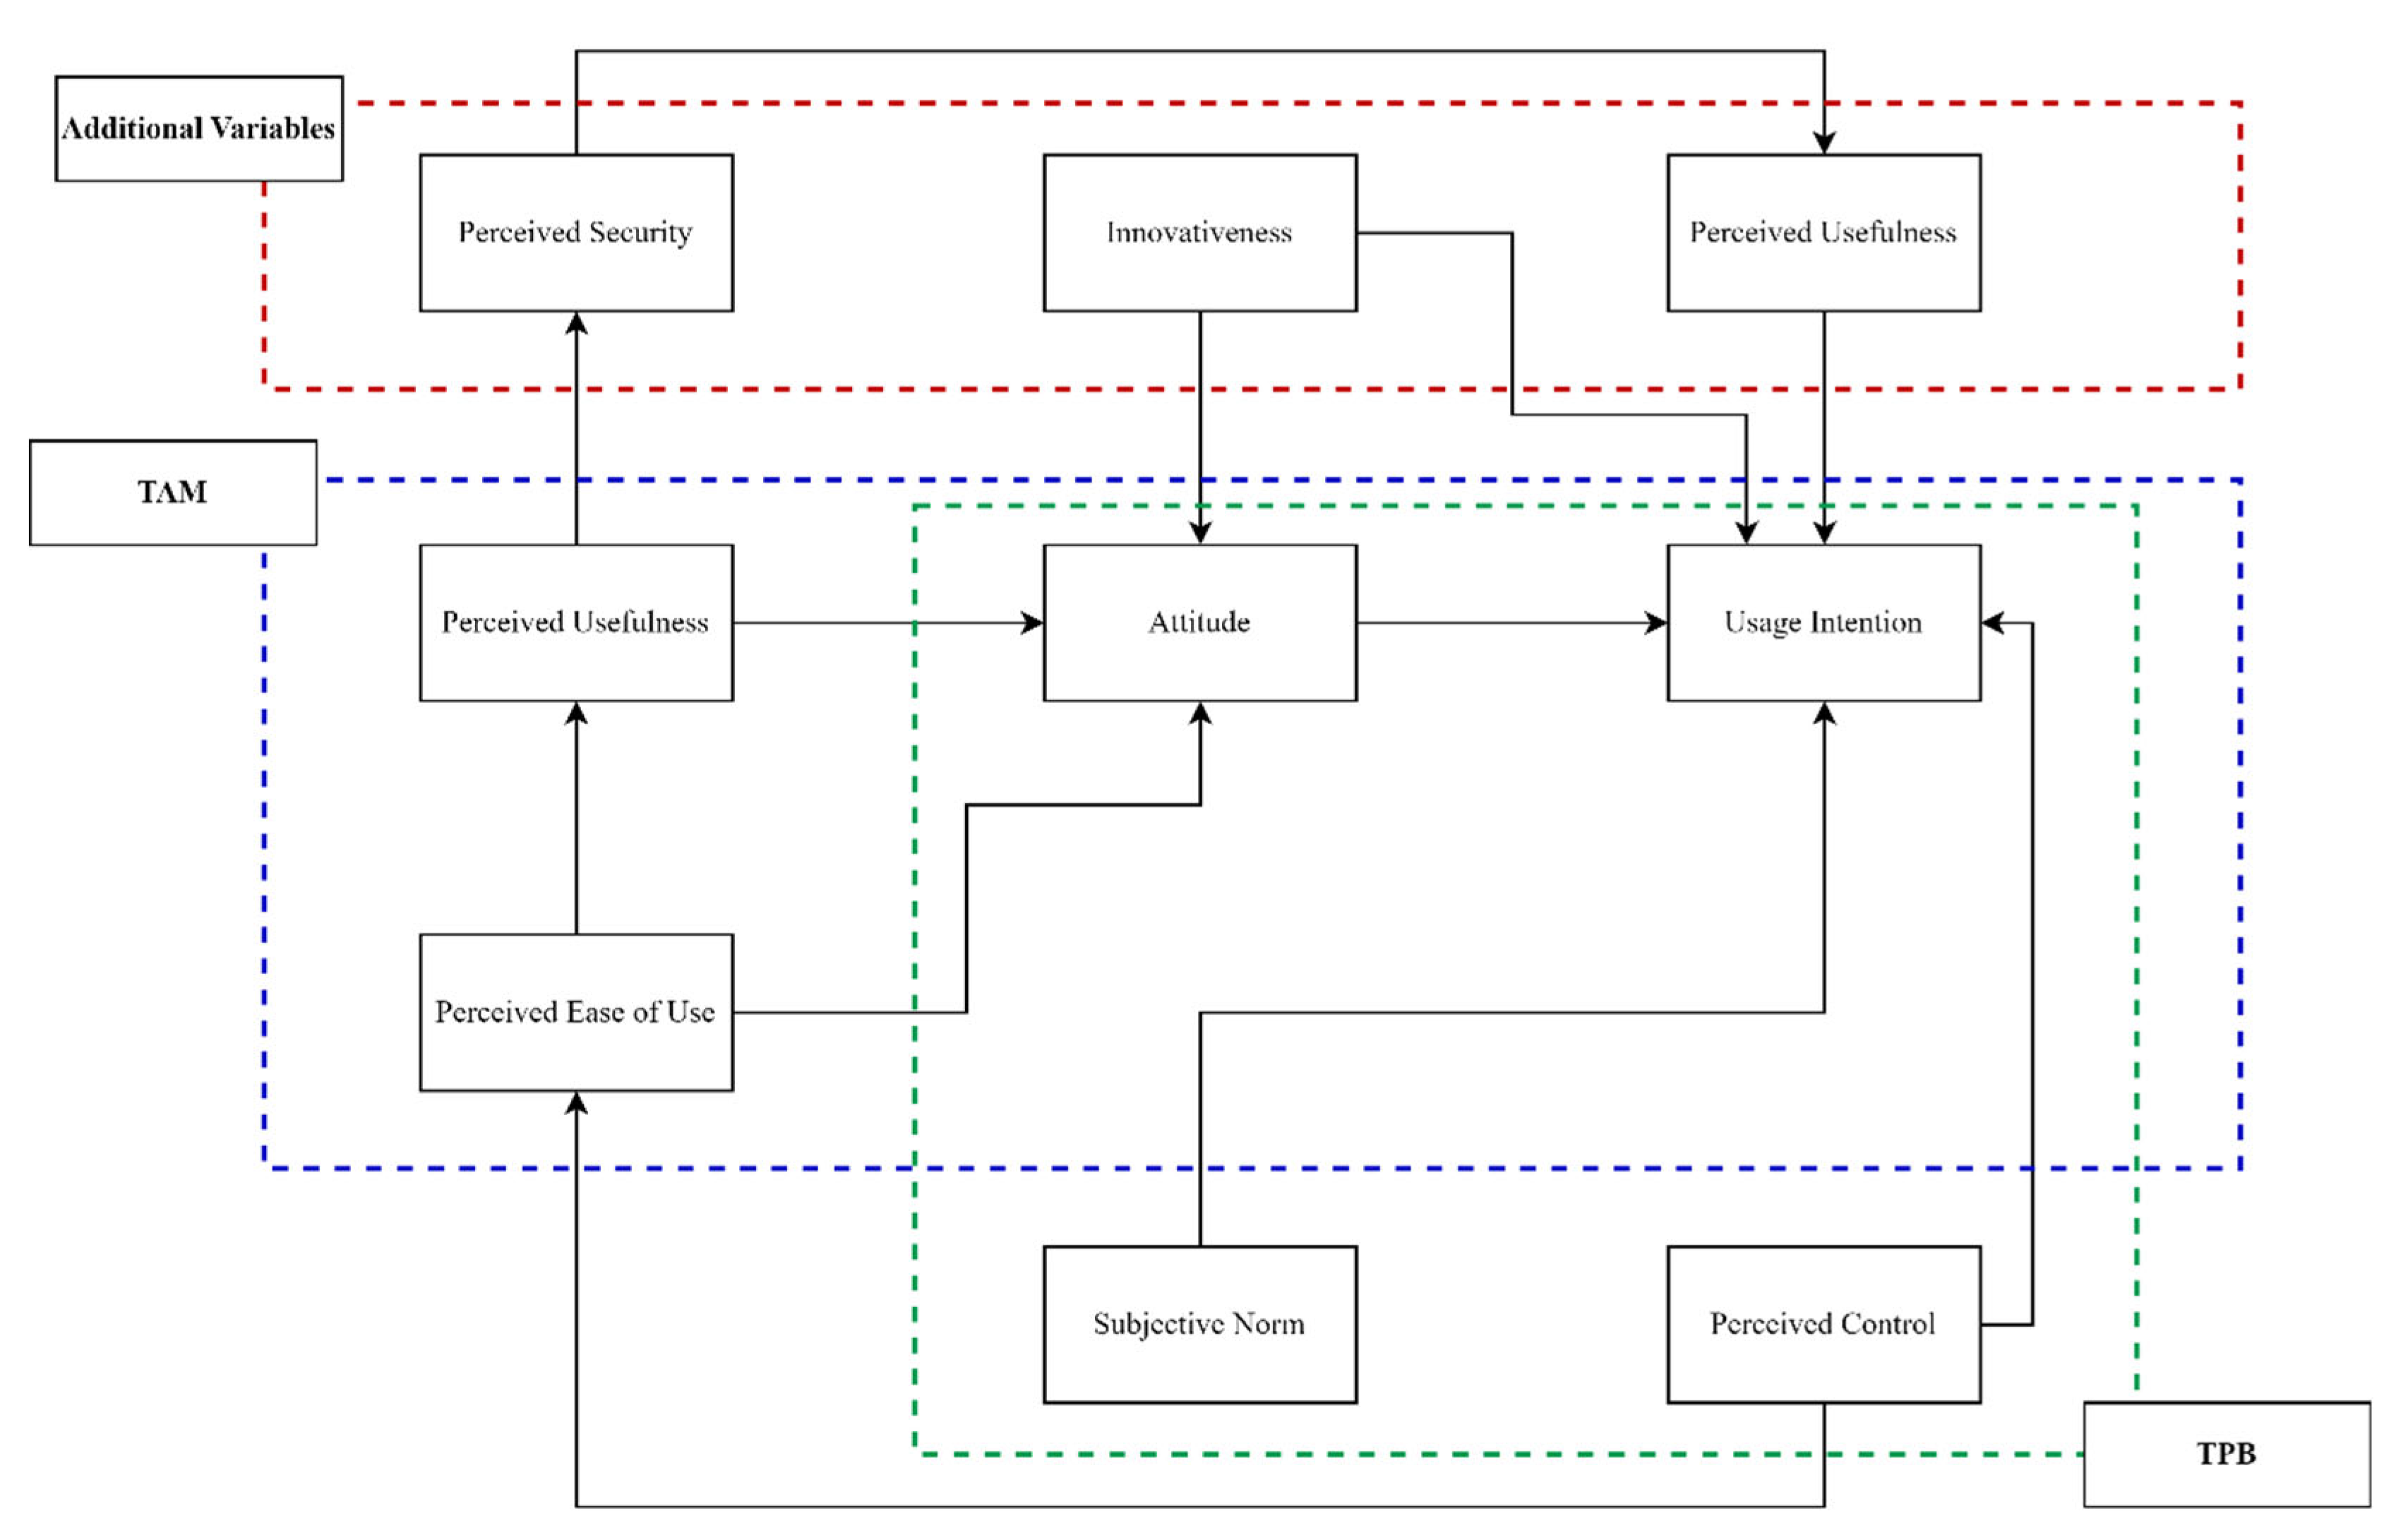
2.6.1. Technology Acceptance Model (TAM)

The Technology Acceptance Model (TAM) was originally introduced by Fred Davis in 1986 when he was part of the Computer and Information Systems, Graduate School of Business Administration at the University of Michigan [28]. TAM was developed in the 1980s, due to concerns that workers were not using information technology (IT) that was intended for them. Its founders argued that the key to increased usage was increasing IT acceptance, which could be assessed by asking individuals about their future intentions to use IT [29]. Knowing the factors that shape a person’s intentions will allow organizations to manipulate those factors to increase acceptance, and thus increase IT usage [30]. The original TAM model has gone through several revisions until the final model was proposed by Fred Davis and Venkatesh in 1996 (see Figure 3).

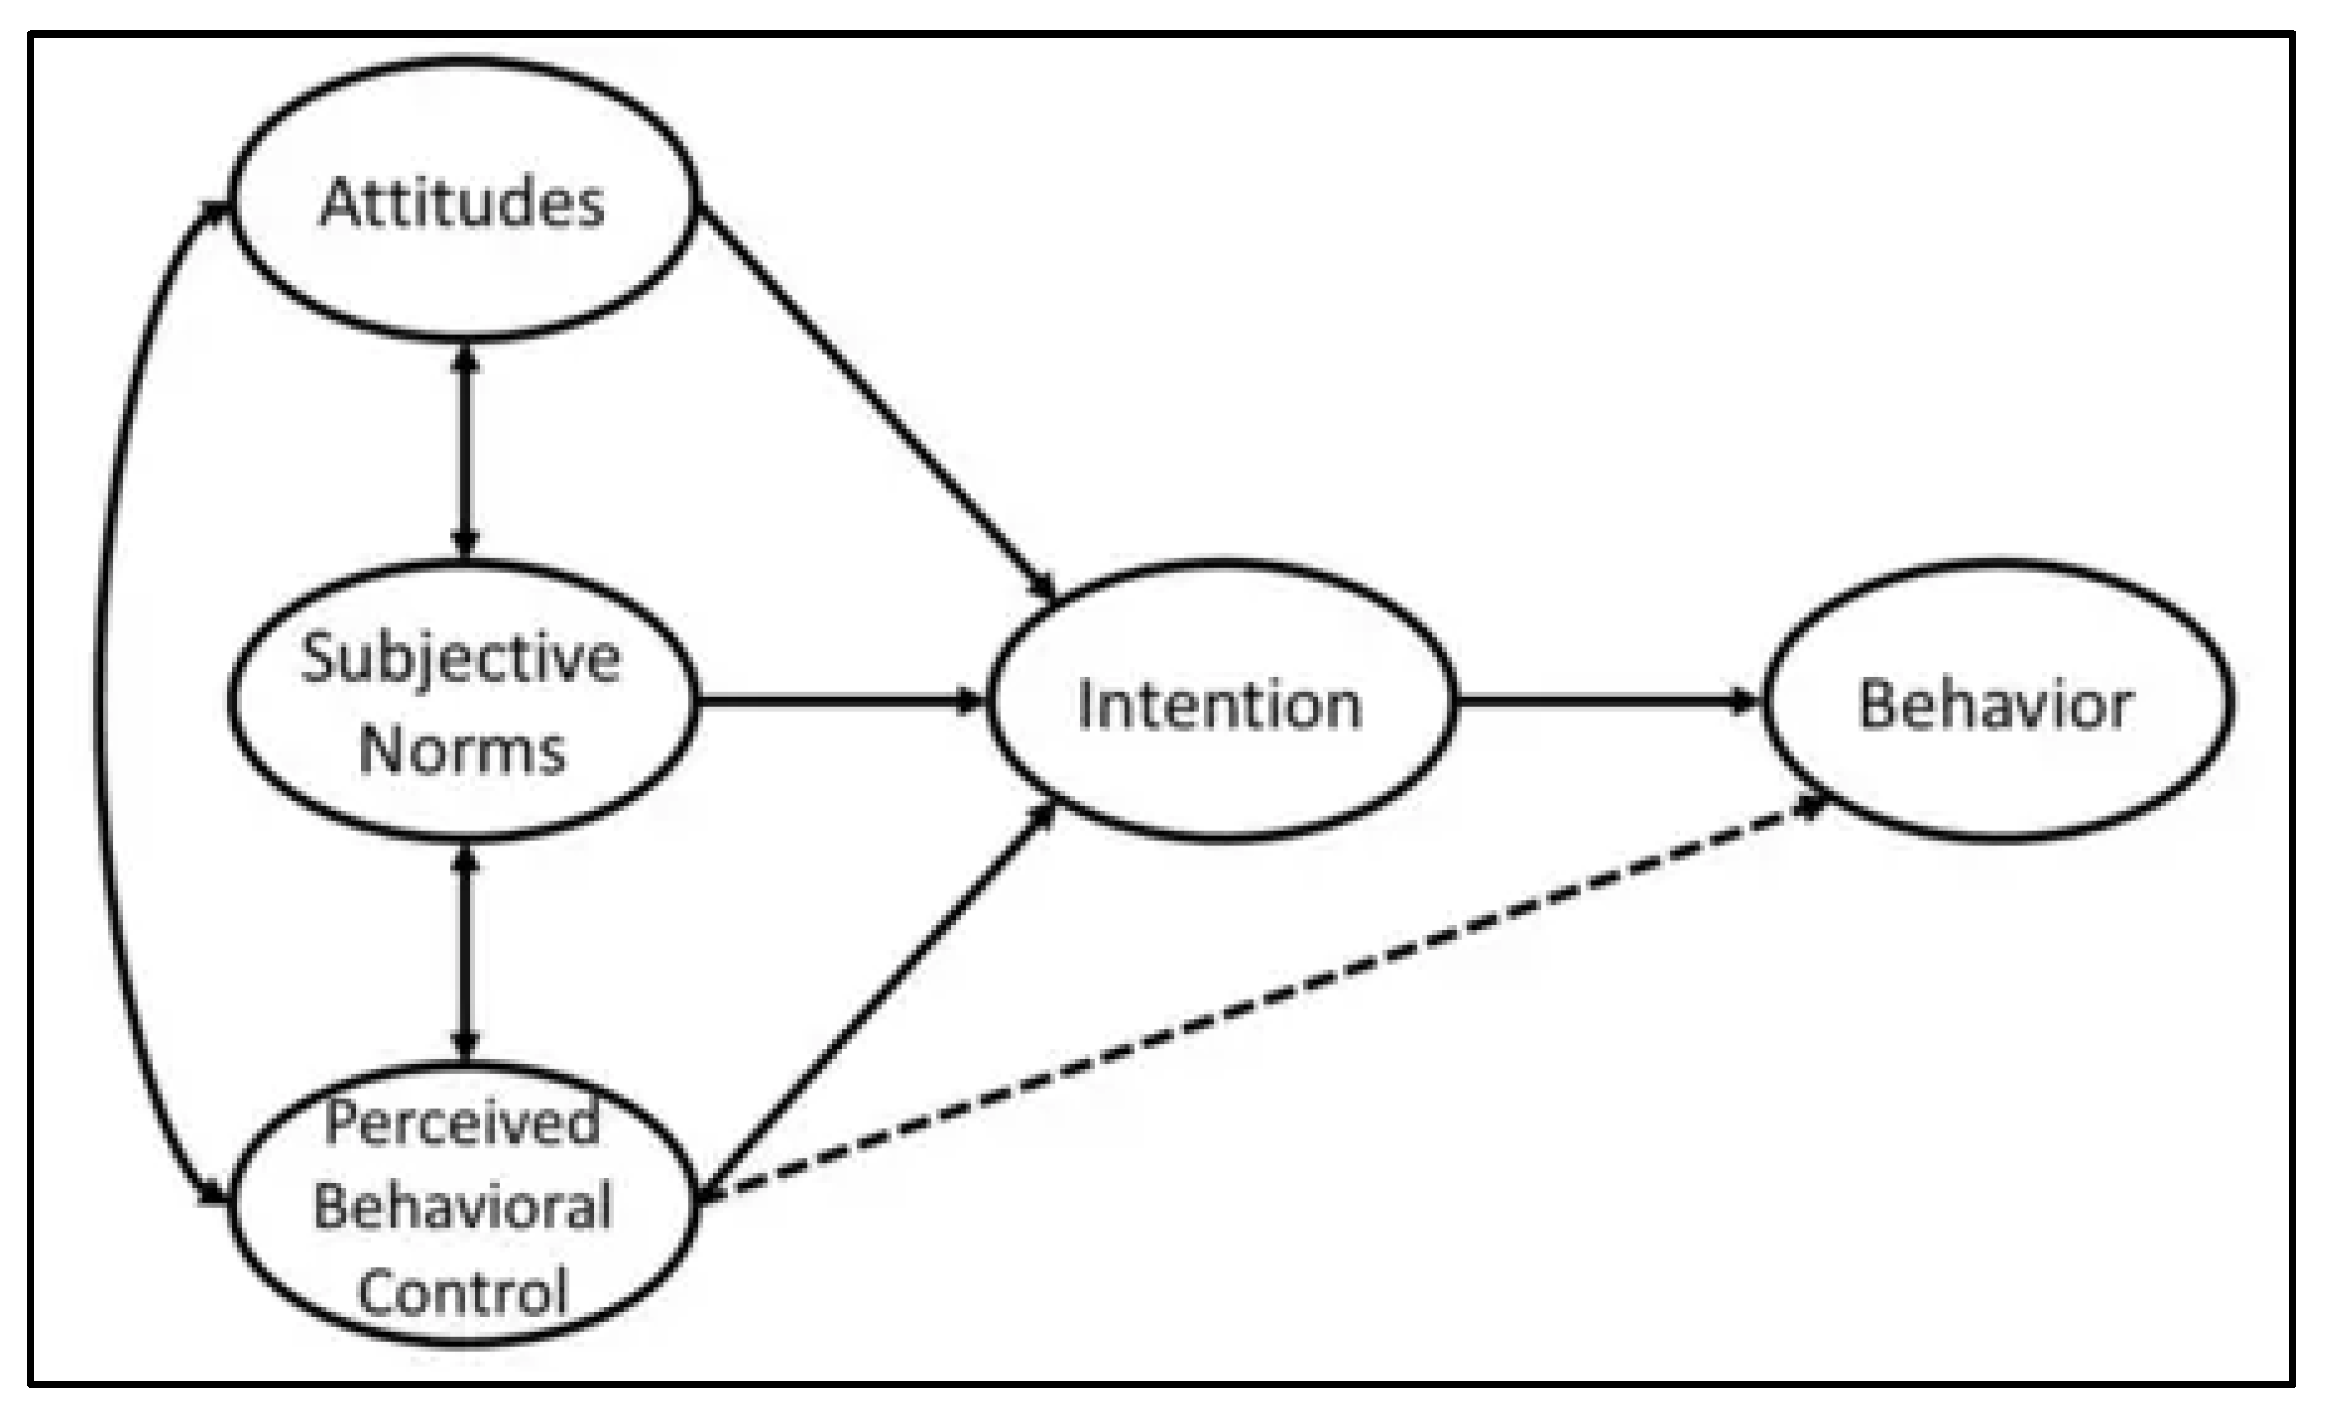
2.6.2. Theory of Planned Behavior (TPB)

The Theory of Planned Behavior (TPB) extends the Theory of Reasoned Action (TRA) to address situations where individuals have incomplete volitional control over their behavior [31,32]. TPB centers on individual intentions to perform a specific behavior. For TPB, attitudes toward the target behavior and subjective norms about involvement in the behavior are believed to influence intentions, with TPB incorporating perceived behavioral control over involvement in behavior as a factor affecting usage intentions [32,33]. As illustrated in Figure 4, the TPB model outlines the relationships between attitudes, subjective norms, perceived behavioral control, intention, and behavior. The dotted line between Perceived Behavioral Control and Behavior indicates an indirect effect, suggesting that while perceived behavioral control can directly influence behavior, its primary influence is mediated through intention. This distinction is important as it highlights the conditional nature of the direct influence of perceived behavioral control on behavior, which may vary depending on specific circumstances or contexts.

2.7. Conceptual Model and Hypotheses

This study integrates TAM and TPB to form a comprehensive and cohesive model (see Figure 5). The combination of these two theories has proven to yield more robust research outcomes [33]. The formed model encompasses key variables influencing user behavior, comprising attitude, innovativeness, perceived control, perceived ease of use, perceived security, perceived trust, perceived usefulness, subjective norm, and usage intention.
The TPB variables of attitude and subjective norm are merged with TAM variables, including perceived ease of use, perceived usefulness, perceived security, and perceived trust. Meanwhile, innovativeness and perceived control provide additional dimensions enriching the analysis concerning user innovation tendencies and the level of control perceived in adopting new technology, acting as supplementary variables. By combining the strengths of each theory, this new model is expected to offer a more comprehensive and relevant insight into the factors influencing the adoption of AI and AR technologies in the context of online cosmetic shopping.

2.7.1. Perceived Ease of Use

Perceived ease of use is a crucial aspect in understanding how users perceive the simplicity [28] of using innovative features implemented in the Shopee platform, particularly in the context of AI and AR technologies applied to personalized recommendation features. Perceived ease of use reflects the extent to which users feel that using the feature is relatively straightforward and uncomplicated. It is also stated that perceived ease of use is the relationship between ease of use, usefulness, and system usage of information technology [34]. The hypotheses proposed for perceived ease of use are as follows:
H1
Perceived ease of use significantly influences perceived usefulness.
H2
Perceived ease of use significantly influences attitude.
These hypotheses assume that the easier users find it to use personalized recommendation features enriched with AI and AR technologies on Shopee, the more beneficial it is for users, positively affecting their attitudes toward the feature.

2.7.2. Perceived Usefulness

Perceived usefulness is a vital aspect in users’ understanding of the value and benefits derived [28] from using personalized recommendation features enriched with AI and AR technologies on the Shopee platform. Perceived usefulness reflects the extent to which users believe that using the feature will enhance effectiveness and efficiency in achieving their online shopping goals. Perceived usefulness in TAM is a significant factor that influences users’ intentions and attitudes towards adopting and using various information systems, and it is affected by perceived ease of use [DAVIS]. The hypotheses proposed for perceived usefulness are as follows:
H3
Perceived usefulness significantly influences perceived security.
H4
Perceived usefulness significantly influences attitude.
These hypotheses assume that the more users perceive the feature as useful, the more positive their attitudes and perceptions of the feature’s security.

2.7.3. Perceived Security

Perceived security plays a role in shaping users’ perceptions of features involving AI and AR technologies, such as personalized recommendations on Shopee. Perceived security reflects the extent to which users feel that their information and transactions are safe and protected when using the feature [33]. The hypothesis proposed for perceived security is as follows:
H5
Perceived security significantly influences perceived trust.
It is assumed that the higher the perceived security level of users, the greater the trust placed in personalized recommendation features. In this context, perceived security is considered a positive factor motivating users to trust and adopt the feature more actively.

2.7.4. Innovativeness

Innovativeness is essential in understanding users’ characteristics regarding innovative technology, specifically, personalized recommendations with AI and AR technologies on Shopee. Innovativeness reflects the user’s tendency to accept and adopt new technological innovations [33]. The hypotheses proposed for innovativeness are as follows:
H6
Innovativeness significantly influences attitude.
This hypothesis assumes that the level of innovativeness of users positively influences their attitudes toward innovative features like personalized recommendations.
H7
Innovativeness significantly influences usage intention.
It is assumed that user innovativeness also contributes positively to the intention to use the feature. More innovative users are expected to have a more positive inclination toward adopting and using this new technological feature.

2.7.5. Perceived Trust

Perceived trust is a factor in the formation of user perceptions of technological features, especially personalized recommendations with AI and AR technologies on Shopee. Perceived trust reflects the extent to which users feel confident and believe in the reliability and credibility of the feature [33]. The hypothesis proposed for perceived trust is as follows:
H8
Perceived trust significantly influences usage intention.
It is assumed that the higher the perceived trust level of users in personalized recommendation features, the greater the intention to use the feature. Perceived trust is considered a positive motivating factor for users to adopt and use the feature actively.

2.7.6. Attitude

Attitude plays a crucial role in understanding user behavior toward AI and AR technologies on Shopee. User attitudes reflect the positive or negative evaluations individuals have regarding the use of such technology [28]. In the context of this research, attitude describes user perceptions of innovative features like personalized recommendations enriched with AI and AR technologies on the Shopee platform. The hypothesis proposed for attitude is as follows:
H9
Attitude significantly influences usage intention.
This hypothesis assumes that the more positive users’ attitudes are, the higher their intention to use personalized recommendation features.

2.7.7. Perceived Control

Perceived control plays a significant role in understanding the extent to which users feel capable of controlling or manipulating [28] AI and AR technology features, such as personalized recommendations on Shopee. Perceived control reflects users’ perceptions of their ability to use and master the feature. The hypotheses proposed for perceived control are as follows:
H10
Perceived control significantly influences usage intention.
This hypothesis assumes that the higher the perceived control level of users, the greater the intention to use personalized recommendation features.
H12
Perceived control significantly influences perceived ease of use.
It is assumed that users’ perceptions of control also positively contribute to the perceived ease of use. Users who feel they have greater control are expected to find the use of the feature easier as they believe they can manage the user experience effectively.

2.7.8. Subjective Norm

Subjective norm is an element in understanding the influence of individuals’ views and norms on the intention to use a technological feature, particularly personalized recommendations with AI and AR technologies on Shopee. The subjective norm variable reflects the extent to which users feel influenced or encouraged by people around them to use the feature [28]. The hypothesis proposed for subjective norm is as follows:
H11
Subjective norm significantly influences usage intention.
This hypothesis assumes that the greater the influence of social norms or opinions from people around the user, the greater the intention to use personalized recommendation features. The perception of encouragement or social norms supporting the use of the feature is considered a positive factor motivating users to adopt and use the feature.

2.7.9. Usage Intention

Usage intention, also known as intention to use, refers to an individual’s desire to behave by using technology or a system [28], such as e-commerce. It is a key component of TAM and TPB models, widely used to predict and explain technology adoption and usage [32,33]. Various factors influence usage intention, including perceived usefulness, ease of use, risk, and trust. Usage intention in e-commerce is a critical component in predicting and understanding consumer behavior, helping businesses identify potential customers and formulate effective marketing strategies.

3. Materials and Methods

This study falls under the category of quantitative research, which consists of collecting, analyzing, and displaying data in the form of numbers [35]. In the quantitative approach for this research, a quantitative method is adopted to measure and analyze the impact of the integration of AI and AR technologies. This approach involves collecting quantitative data through online surveys or systematically designed questionnaires. Respondents consisting of Shopee users who have experience using the try-on feature of cosmetic products were asked to provide responses regarding their perceptions of personalized recommendations, use of AI and AR technology, and purchase intentions.
The research methodology unfolds in a carefully structured progression, starting with an in-depth exploration of the research problem—with a focus on the integration of Augmented Reality (AR) technology in the e-commerce landscape, and specifically, in platforms such as Shopee. This exploration was supported by an in-depth review of the relevant literature, which revealed the growing importance of AR integration in e-commerce to enhance user experience and support purchase decision-making.
The next phase utilized Kitchenham’s Systematic Literature Review method, a systematic approach to literature analysis, to pinpoint gaps in existing knowledge [36]. This process serves as a foundation for formulating appropriate research questions that guide the investigation. The literature study involved synthesizing theories and empirical findings, culminating in the development of a robust conceptual framework [36,37]. This framework serves as the theoretical foundation for the next stage of the research.
Going forward, this research delves into model formulation by integrating theories such as the Technology Acceptance Model (TAM) and Theory of Planned Behavior (TPB). This integration reflects a different understanding of the complex relationship between AI and AR technologies, personalized recommendations, and user intent, specifically in the domain of purchasing cosmetics on Shopee.
The model underwent an important validation process by experts, including the course instructor, and peer review from fellow students. This validation ensured that the model accurately reflected the conceptual framework, taking into account the intricacies of the variables involved. The refined model then served as the blueprint for drafting the research instrument (see Table 1). The final research model can be seen in Figure 5.
This instrument, carefully designed based on the final model, underwent a rigorous stage of readability testing. This testing, which involved reviews by course instructors, teaching assistants, and peers, ensured clarity and fluency in the respondents’ understanding. Finalizing the research instrument laid the foundation for the next stage of data collection.
Data collection was carried out through distributing questionnaires to respondents who fit the research target population through the Google Form platform, which was distributed within the time span from 21 November 2023 to 10 December 2023. The sample for this study was selected based on specific criteria to ensure the relevance and representativeness of the respondents. Participants were required to be active Shopee users with experience using the try-on AR feature for cosmetic products. The sample size of 387 respondents was determined using purposive sampling to ensure a diverse representation of demographics such as age, gender, and income levels. The sample size of 387 respondents was determined using the 10-times rule, a common guideline in PLS-SEM studies. According to this rule, the minimum sample size should be 10 times the maximum number of arrowheads pointing at any latent variable in the model [44]. Given the complexity of our model, which includes multiple constructs and paths, a sample size of 387 ensures robust statistical power and reliability of the results. The questionnaire then distributed widely and evenly to cover the diversity of Shopee users who have experience using the try-on feature of cosmetic products through WhatsApp, Instagram, X, LinkedIn, and Telegram social media platforms. The questionnaire used a Likert scale system ranging from strongly agree to strongly disagree, as detailed in Table 2.
The research synthesis process began by utilizing the survey data that had been collected from respondents. Data analysis was conducted to identify the impact of AI and AR technology integration on customer usage intention in the context of purchasing cosmetic products at Shopee. This process includes the use of SmartPLS 3 tools in processing statistical data to test hypotheses. The test carried out in this data analysis is the Structural Equation Model (SEM) which consists of three stages, including testing the measurement model (outer model), testing the structural model (inner model), and testing the hypothesis. The details of the outer model testing can be found in Table 3, while the results of the inner model testing are presented in Table 4. Finally, the hypotheses testing outcomes are detailed in Table 5.
The results of the data analysis form a data synthesis that describes the key findings and patterns that emerged from the research. This synthesis includes an in-depth understanding of how the integration of AI and AR technologies affects personalized recommendations and how it relates to customer usage intentions.

4. Results

4.1. Demography

Based on Table 2, there were seven questions regarding the demographics of research respondents consisting of gender, age, occupation, domicile, income per month, education being pursued, and how often they had bought cosmetics on the Shopee platform in the last 3 months. To make it easier to read the data from these questions, a summary of the demographics of the research respondents was made, as shown in Table 6.
In addition, there was also a validation question to ascertain whether the respondent has used personalized recommendations at Shopee after using the AR try-on feature when shopping at Shopee. The results reflect the level of user adoption and interaction with personalized features in e-commerce platforms. Of the total respondents, 80.4% stated that they had used personalized recommendations after trying out the try-on AR feature in Shopee. On the other hand, around 19.6% of respondents stated that they had never used personalized recommendations after trying out the try-on AR feature. Those who answered that they had would fill in all the indicators of the existing variables, while those who answered that they had never would only answer the indicators of the usage intention variable.

4.2. PLS-SEM Measurement Model Testing

The first test is the measurement model test. At this stage, a series of analyses were conducted to evaluate the extent to which the measurement instrument is able to measure precisely the variables being measured, as well as how consistent and reliable the instrument is in measuring the concepts represented by each variable. Through this approach, this research seeks to ensure that each question or indicator used in the survey can provide an accurate and consistent description of the construct to be measured. The components tested were reliability test, convergent validity, and discriminant validity [45].

4.2.1. Reliability Test

A reliability test was conducted to determine the consistency of all indicators contained in the research model. Reliability reflects the extent to which questions or indicators in a measurement instrument are consistent in measuring a concept or variable over time or in various situations [45]. In this study, reliability was measured using Cronbach Alpha and Composite Reliability, which provide an overview of the extent to which the questions in each construct have internal consistency. The results of these reliability tests are detailed in Table 7 to demonstrate the high internal consistency of the constructs used in this research.
Based on the results of Cronbach’s Alpha testing, it was found that there are eight variables that have a value below 0.70, namely attitude, innovativeness, perceived control, perceived ease of use, perceived trust, perceived usefulness, subjective norm, and usage intention variables. However, as long as the Cronbach’s Alpha value remains within the range of 0.60 to 0.70, the value is still acceptable [46]. Therefore, in this context, all variables still meet the standard Cronbach’s Alpha test value.
The results of Composite Reliability testing stated that all indicators used in this study showed test values that met the eligibility standards. These values at least reach a minimum of 0.6, which indicates an adequate level of reliability in measuring the construct or latent variable represented by each indicator [47]. These results provide confidence that the measurement instruments used in this study are reliable and consistent in reflecting the dimensions or aspects to be measured, strengthening construct validity and data collection accuracy for further analysis. In other words, the Composite Reliability value that is met indicates that these indicators can be relied upon as a consistent and reliable measuring instrument in describing the variables in the research context.

4.2.2. Convergent Validity Test

Convergent validity analysis provides certainty that the measurement instrument can produce consistent and valid results in measuring a variable. In this study, convergent validity was measured through evaluating factor loadings and Average Variance Extracted (AVE) values for each construct [47]. A high factor load indicates that each item has a good measurement of its construct, while a high AVE value indicates that a large amount of variance from the items actually reflects the measured construct [47]. This convergent validity analysis aims to ensure that each variable measured has a significant contribution to the representation of the concept represented by the variable, so that the data collected through the measurement instrument provides an accurate and valid picture related to these variables. The factor loadings values, detailed in Table 8, confirm the robustness of the measurement items in representing their respective constructs.
Based on the results of testing factor loadings in the table above, several test values were found to be below the standard threshold of 0.7. Although some factor loadings test values show low numbers, reference [45] explains that a value of 0.5 can still be considered an acceptable or valid factor loading, especially if there are other factors in the same construct that have high values. Therefore, although some factor loadings values may not reach the 0.7 threshold, the emphasis on the presence of other factors in the construct that support these values makes these indicators still meet the validity standards in the context of the measurements taken. Additionally, the Average Variance Extracted (AVE) values, presented in Table 9, further support the validity of the constructs by showing that a substantial amount of variance is captured by the indicators. Thus, it can be concluded that all indicators still meet the factor loadings test values based on the terms of reference from the references mentioned.
The minimum generally accepted Average Variance Extracted (AVE) value is more than 0.5, according to reference [47]. However, if the AVE value is less than 0.5, but the Composite Reliability reaches or exceeds 0.6, it is still considered acceptable according to the views expressed by Lam in 2012 [48]. Thus, in the context of this study, all indicators still meet the AVE test value by considering the sufficient Composite Reliability value (see Table 7) as an alternative to construct validity. These results provide confidence that the variables measured by these indicators are reliable in building and measuring relevant constructs in the research model.

4.2.3. Discriminant Validity Test

The discriminant validity test is carried out to separate or distinguish variable questions that should not have a higher correlation value than questions contained in other variables. If there are questions that have a higher correlation value than other variable questions, then the question is ambiguous and needs to be deleted. This can be tested using cross loading testing. The cross loading value on the diagonal must be higher than the cross loading in other rows and columns. The results of this test are detailed in Table 10, where the cross loading values demonstrate that each variable’s indicators have higher correlations within their respective constructs compared to other constructs, thereby confirming the discriminant validity of the measurement model.
To ensure the discriminant validity of an indicator against its construct, the cross loadings value of the indicator against its own construct should be greater than the cross loadings value against other constructs [49]. The analysis results show that the cross loadings test values on all indicators in this study meet these criteria. In other words, each indicator is significantly higher on the intended construct compared to other constructs. Therefore, it can be concluded that all indicators in this study successfully meet the cross loadings test value and can be considered as valid indicators in measuring the construct represented by each indicator. These results provide additional confidence in the contribution of each indicator in the construction of the research conceptual model.

4.3. PLS-SEM Structural Model Testing

Testing the structural model provides in-depth insights into the extent to which the integration of AI and AR technologies in personalized recommendations has an effect on customer usage intentions, specifically in the context of purchasing cosmetic products on Shopee. In this process, each hypothesis proposed in this study was tested for validity, and the parameters involved were evaluated to understand the impact of each variable on the others.

4.3.1. Path Coefficient

The path coefficient refers to a quantitative measure of the direct relationship between variables in a structural model. Using path coefficient analysis, this research seeks to investigate how much impact each variable has on the other variables, constructing a network map of causal relationships within the conceptual framework [49]. This research uses the path coefficient to measure the strength and direction of influence between variables, providing a more detailed picture of the dynamics of the relationships in the model. A positive value on the path coefficient indicates a positive relationship, while a negative value indicates a negative relationship. A path coefficient value close to one indicates a strong influence, while a value close to zero indicates a weak influence [45].
Table 11 shows the results of the path coefficient test. The path coefficient analysis in this study produced findings that provide deep insight into the relationship between variables in the conceptual model. It was found that innovativeness has a significant positive impact on user attitude and has a strong influence on usage intention. Perceived ease of use showed a moderate positive impact on attitude but had a very strong influence on perceived usefulness. In contrast, perceived trust has a very strong influence on perceived security, and both contribute positively to usage intention. In the context of control variables, it was found that perceived control has a significant influence on perceived ease of use and has a positive impact on intention to use, although the latter effect is low. Subjective norm factors showed a relatively low impact on intention to use. Although some effects are low, the overall model shows complexity and diversity in the influence between variables, providing a more comprehensive understanding of the factors that shape intention to use in the specific context of cosmetic products on Shopee.

4.3.2. R-Square

The R-Square value reflects the extent to which the variability of the dependent variable can be explained by the independent variables in the model. R-Square is used to evaluate how well the customer usage intention variable can be explained by the explanatory (independent) variables involved [45]. A high R-Square value indicates that the model has a good ability to explain variations in the customer usage intention variable. In the context of this study, R-Square provides a view of how much factors such as the integration of AI and AR technology, try-on cosmetic products, and personalized recommendations can contribute to variations in customer usage intention on the Shopee platform.
Table 12 shows the results of the R-Square test. Attitude, as the user attitude variable, has an explanatory level of 48.4%, indicating that the independent variables involving innovativeness, perceived ease of use, and perceived usefulness together provide a considerable explanation for user attitudes towards AI and AR technology on the Shopee platform. Perceived ease of use and perceived usefulness have an explanatory level of 36.9% and 46.2%, respectively, indicating that perceived ease of use and usefulness both have a significant contribution in explaining variations in user attitudes. Similarly, the usage intention variable, which reflects usage intention, has an explanation level of 61.7%, indicating that factors such as attitude, innovativeness, and perceived security and trust together provide a strong explanation for the intention to use the technology. On the other hand, perceived security and perceived trust have an explanatory level of 23.1% and 49.4%, respectively, indicating that perceived security and trust make a considerable contribution in explaining variations in usage intention. These results provide an in-depth picture of the extent to which these factors can predict and describe customer adoption rates and usage intentions towards AI and AR technologies in the context of cosmetics shopping at Shopee.

4.3.3. Effect Size (f-Square)

f-Square is used to evaluate how much an independent variable contributes to the variability of the dependent variable beyond the influence of other variables in the model. In this study, f-Square is used to measure the relative strength of each independent variable in explaining the variability of customer usage intentions. A high f-Square value indicates that the variable makes a significant contribution [49] and has a substantial effect on the variability of customer usage intentions, after considering the influence of other variables in the model.
Table 13 shows the results of the f-Square test. It was found that innovativeness has a relatively small impact on user attitude, with an f-Square value of 0.025. However, its greater impact on usage intention, with an f-Square value of 0.329, indicates that innovativeness is more significant in influencing users’ decisions to adopt AI and AR technology. The perceived control variable shows a very large impact on perceived ease of use, with an f-Square value of 0.548, while its impact on usage intention is relatively small, with a value of 0.007. In contrast, perceived ease of use has a large impact on perceived usefulness (f-Square = 0.858), indicating that perceived ease of use is strong in shaping perceived usefulness. Perceived security and perceived trust have a very large impact on their respective variables, namely, perceived trust (f-Square = 0.978) and usage intention (f-Square = 0.049). This indicates that perceived security and trust are very dominant in shaping user trust and usage intention. With an f-Square value of 0.140, perceived ease of use also contributes significantly to user attitudes. Meanwhile, subjective norm has a relatively small impact on intention to use, with an f-Square value of 0.007.

4.3.4. Predictive Relevance (Q-Square)

Q-Square is used to evaluate the level of model prediction of observed variables. A high Q-Square value indicates that the measurement model can accurately and effectively predict the observed manifest variables. In other words, the higher the Q-Square value, the better the model is able to explain the variation in the measured indicators [50]. This evaluation is crucial in ensuring that the constructs measured in this study can be well explained by the developed model.
Table 14 shows the results of testing the Q-Square value. It was found that this predictive model was able to explain 22.6% of the variation in user attitude, indicating a moderate level of predictive relevance. The perceived ease of use variable has a predictive relevance of 17.5%, while perceived trust has a considerable predictive relevance of 27.8%. The perceived usefulness and usage intention variables also show a significant level of predictive relevance, with values of 20.4% and 29.7%, respectively. This indicates that the model is successful in predicting the extent to which perceived usefulness and usage intention can be explained by the independent factors in the model. On the other hand, the innovativeness, perceived control, perceived security, and subjective norm variables did not have measured q-Square values. This could imply that the model may have limitations in explaining the variation of these variables or that other factors not included in the model need to be considered.

4.3.5. Respondents Who Have Never Used AI–AR Personalized Recommendation

Data analysis of respondents who did not use AI–AR personalized recommendation was an important stage in understanding the profile of users who had not utilized the feature in Shopee. In this consideration, respondents were only directed to fill in indicators from the usage intention variable to evaluate their usage intention. The survey results are presented descriptively in Table 15 to provide a comprehensive picture of the characteristics of users who had not used the AI–AR personalized recommendation feature.
Based on the results of the analysis, the majority of respondents who had not used AI–AR personalized recommendations at Shopee showed a positive attitude towards the potential use of this technology. Consistently, most respondents agreed or strongly agreed to questions related to usage intention. This indicates that, although not yet using the feature, respondents have an interest and potential to adopt AI–AR personalized recommendation technology if it is available on the e-commerce platform they use. This conclusion can be the basis for Shopee to develop more effective marketing and education strategies to increase the adoption of this feature among users who have not yet utilized it.

4.4. Hypotheses Testing

In this study, hypothesis testing used the two-tailed method, with a significance level of 0.05, in accordance with general standards in scientific research [47]. The two-tailed method is used to determine whether there is a significant difference or relationship either positively or negatively. A significance level of 0.05 indicates that we have 95% confidence in the test results. Furthermore, the minimum t-values of 1.96 indicate the critical limit where if the t-values of the actual test exceed this number, then we can reject the null hypothesis. Meanwhile, the maximum p-values of 0.05 indicate the significance limit, and if the p-values of the actual test are lower than this number, then the null hypothesis can be rejected.
Table 16 shows the results of hypothesis testing for this study. Based on the t-statistics and p-values of the results of testing the hypothesis of this study, the following conclusions can be drawn:
  • H1: Perceived Ease of Use -> Perceived Usefulness
The hypothesis is accepted; there is a significant positive relationship between perceived ease of use and perceived usefulness.
  • H2: Perceived Ease of Use -> Attitude
The hypothesis is accepted; there is a significant positive relationship between perceived ease of use and attitude.
  • H3: Perceived Usefulness -> Perceived Security
The hypothesis is accepted; there is a significant positive relationship between perceived usefulness and perceived security.
  • H4: Perceived Usefulness -> Attitude
The hypothesis is accepted; there is a significant positive relationship between perceived usefulness and attitude.
  • H5: Perceived Security -> Perceived Trust
The hypothesis is accepted; there is a significant positive relationship between perceived security and perceived trust.
  • H6: Innovativeness -> Attitude
The hypothesis is accepted; there is a significant positive relationship between innovativeness and attitude.
  • H7: Innovativeness -> Usage Intention
The hypothesis is accepted; there is a significant positive relationship between innovativeness and usage intention.
  • H8: Perceived Trust -> Usage Intention
The hypothesis is accepted; there is a significant positive relationship between perceived trust and usage intention.
  • H9: Attitude -> Usage Intention
The hypothesis is accepted; there is a significant positive relationship between Attitude and Usage Intention.
  • H10: Perceived Control -> Usage Intention
The hypothesis is rejected; there is no significant relationship between perceived control and usage intention.
  • H11: Subjective Norm -> Usage Intention
The hypothesis is rejected; there is no significant relationship between subjective norm and usage intention.
  • H12: Perceived Control -> Perceived Ease of Use
The hypothesis is accepted; there is a significant positive relationship between perceived control and perceived ease of use.

4.5. Summary of Key Findings

To provide a clear overview of the key findings and their consistency with previous studies, we constructed a summary table as shown in Table 17. This helps in understanding how the current study aligns with or differs from existing literature.

5. Discussion

From the collected responses of 387 participants, it is evident that this research survey was predominantly represented by female participants, constituting 68% of the total respondents, while 31% were male, and 1% chose not to disclose their gender. This distribution aligns with the assumption that females are more inclined to use cosmetics, corroborated by data from Statista Consumer Insight Global in August 2023 [60], which indicates a higher usage of cosmetics by females compared to males.
The age demographic analysis reveals that the majority of respondents fall within the young adult category, specifically, in the age range of 18–25 years, accounting for a substantial 61.5% of the total. This age distribution corresponds with the dominance of student respondents, comprising 40.6% of the participants. The prevalence of students aligns with the age demographic, indicating a strong representation of individuals in the 18–25 age range.
Occupationally, the majority of respondents identified as students, constituting 40.6%. This aligns with the age demographics, primarily dominated by individuals in the 18–25 age range, assuming that many are students or early in their careers. In terms of domicile, respondents are predominantly from Java Island, both within and outside the Greater Jakarta area (Jabodetabek), consistent with Statista Consumer Insights Global data as of August 2023 [60], which notes that consumers purchasing cosmetic products are concentrated in cities with populations exceeding one million.
When considering monthly income, three significant income groups emerge: those earning less than 1,000,000 IDR (20.9%), 1,000,000–3,000,000 IDR (29.5%), and 3,000,000–5,000,000 IDR (25.6%). This income distribution correlates with the age demographic dominated by the 18–25 age range, assuming respondents in this group are either students or early in their careers.
In terms of education, the survey captures respondents at various educational levels. The majority consists of those currently not pursuing education (36.2%) and undergraduate students (S1/D4) at 35.4%. This aligns with the earlier demographics, dominated by the 18–25 age range, mainly comprising students and private sector employees.
Regarding shopping frequency in the last three months, a notable 54.8% of respondents reported shopping 2–5 times. This can be linked to the age and income groups, with a focus on basic necessities, considering the majority fall within the 18–25 age range and have incomes between 1,000,000–5,000,000 IDR.

5.1. Significant Relationship

In the exploration of the factors influencing the adoption of AI–AR personalized recommendation technology on Shopee, several key findings emerged. The study delved into three critical dimensions: perceived ease of use and usefulness, perceived security and trust, and the interplay between innovativeness and perceived control.
In the realm of user experience, it was evident that perceived ease of use played a pivotal role. The research uncovered a positive and significant correlation between perceived ease of use and perceived usefulness. This aligns with previous studies [61,62,63], affirming that the smoother the interaction with AI–AR personalized recommendation technology, the more users perceive its benefits. Particularly within the context of Shopee, the ease and convenience of utilizing this feature emerged as a driving force behind its adoption by users.
Moving into the domain of trust, the study highlighted the crucial relationship between perceived security and user trust. The findings illuminated a positive connection, emphasizing the paramount importance of fostering a secure and trustworthy environment for users. This correlation echoed the conclusions drawn from previous studies [64,65,66], underlining the significance of perceived security, especially in the realm of AI–AR technologies that involve the exchange of users’ personal data.
The third dimension of the study focused on the influence of innovativeness and perceived control. Drawing from earlier research [67,68,69], the study reaffirmed that user innovativeness and the perception of control wield a positive impact on user attitude and usage intention. This suggests that users exhibiting an inclination towards innovation and a sense of control over the technology tend to harbor a positive attitude and a heightened inclination to adopt the feature.
In essence, these findings paint a comprehensive picture of the multifaceted factors steering the acceptance and adoption of AI–AR personalized recommendation technology on Shopee. From the ease of use to the foundations of trust and the user’s sense of control, each dimension contributes to the intricate web of considerations influencing users’ decisions and attitudes towards this innovative technological feature.

5.2. Insignificant Relationship

The finding that there is an insignificant relationship between subjective norm and usage intention, as well as between perceived control and usage intention, can be interpreted as these being variables that may have a more limited impact in the context of using AI–AR technology in Shopee. This finding is different from previous studies which state that both variables should have a positive and significant impact on usage intention [70,71,72,73]. This could be due to several things:
  • There is a relatively lower influence of subjective norm and perceived control on usage intention compared to other variables, so although there is an influence, it is not statistically significant.
  • The factors measured by subjective norm and perceived control may not have a significant impact in the context of this study. Both variables may have less relevance in predicting usage intention for specific cases.
  • The characteristics of the respondents or the sample used in the study may affect the results. If the sample was more numerous and diverse, it is possible that the variation in subjective norm and perceived control between respondents may change and affect the statistical significance.

5.3. Research Implications

This research not only provides deep insights into the factors that influence the intention to use AI–AR personalized recommendation technology on the Shopee platform, but also has significant implications at both the theoretical and the practical levels.

5.3.1. Theoretical Implications

This research provides significant theoretical implications for understanding user behavior in adopting AI–AR personalized recommendation technology on the Shopee platform. The results confirm and complement existing theories in the literature, particularly the Technology Acceptance Model (TAM) and Theory of Planned Behavior (TPB). By focusing on key variables such as perceived ease of use, usefulness, security, and trust, this study contributes to the literature by providing additional insights that enrich the understanding of the factors that influence user intention in adopting AI–AR technology in the context of online shopping.
The research findings also open up opportunities for the development of new theoretical models that can accommodate variables that may not have been covered in existing theoretical frameworks. This creates a basis for further research that can explore the complexity of variable interactions in the adoption of AI–AR technologies. In addition, this study has the potential to generalize its theoretical findings in a broader e-commerce context and is not just limited to the Shopee platform. Thus, the results of this study not only contribute to the existing literature, but also pave the way for the development of new theories or further development of existing theories in the context of AI–AR technology in the e-commerce industry.

5.3.2. Practical Implications

This study provides several practical implications for e-commerce platforms and marketers aiming to leverage AI and AR technologies. Firstly, ensuring user-friendly interfaces and emphasizing the practical benefits of AI–AR technologies can significantly enhance user adoption. Platforms should invest in intuitive design and clear communication of the advantages these technologies offer. Secondly, building and maintaining user trust is crucial. E-commerce companies should implement transparent privacy policies and robust security measures to foster user confidence. Additionally, highlighting innovative features and staying abreast of technological advancements can attract tech-savvy users and enhance the overall shopping experience.
  • User Interface Design: Simplifying the user interface enhances ease of use by ensuring intuitive navigation and logical placement of menus and buttons. Responsive design ensures consistency across all devices, while a minimalistic layout reduces cognitive load and highlights essential features. Incorporating interactive elements like tooltips and guided tours helps users understand AI and AR features without being overwhelmed.
  • Privacy and Security: Strengthening privacy measures is crucial for building user trust. This involves implementing transparent privacy policies, strong data encryption, and regular security audits to protect user data. Ensuring user consent for data collection and allowing easy management of privacy settings further enhances trust.
  • Innovative Features: Continuously integrating cutting-edge AI and AR features, such as personalized recommendations and virtual try-on options, enhances the shopping experience. Real-time AI-powered assistance improves customer service and engagement. Regular updates ensure the technology remains relevant and meets user expectations.
  • Clear Communication: Clearly articulating the benefits of AI–AR technologies to users involves providing concise information, user education through tutorials, and showcasing real-life success stories. Targeted marketing campaigns and visual aids, such as videos and demos, help users understand and appreciate the technology. Highlighting these benefits can significantly enhance user adoption.
  • Customer Support: Providing robust customer support includes offering multichannel assistance through live chat, email, phone, and social media. Developing a comprehensive knowledge base with articles and tutorials helps users resolve common issues independently. Implementing a feedback mechanism and proactive assistance using AI ensures continuous improvement and user satisfaction.
These insights are crucial as they directly address the practical challenges and opportunities in implementing AI–AR technologies in e-commerce. By focusing on these areas, platforms can enhance user satisfaction, drive adoption, and ultimately increase sales and customer loyalty.
By integrating the findings of this study into operational and marketing strategies, e-commerce companies can increase their competitiveness, provide a better shopping experience, and support users’ adoption of AI–AR technology. As a result, the practical implications of this study can help improve the effectiveness and success of AI–AR technology implementation in e-commerce environments.

5.3.3. Implementation Costs and Return of Investment (ROI)

The integration of AI and AR technologies in personalized recommendations involves significant financial considerations. These costs can be broadly categorized into initial setup expenses, ongoing maintenance, and potential upgrades.

Initial Setup Costs

The initial investment includes the cost of developing and implementing AI algorithms and AR features. This may involve hiring skilled professionals, purchasing software licenses, and investing in necessary hardware. For instance, developing a robust AI recommendation system requires substantial computational resources and advanced machine learning models, which can be costly.
  • Development: Includes salaries for data scientists, AI engineers, and AR developers.
  • Software Licenses: Costs for AI and AR software tools and platforms.
  • Hardware: Investment in servers, GPUs, and other necessary hardware for processing AI models.

Ongoing Maintenance

Continuous maintenance is required to ensure the AI and AR systems function effectively. This includes regularly updating the software, monitoring system performance, and addressing any technical issues that arise. Additionally, data storage and processing costs can accumulate over time, especially as the volume of user data grows.
  • Software Updates: Regular updates to ensure the system remains current and secure.
  • Performance Monitoring: Continuous monitoring to ensure optimal performance.
  • Data Storage: Costs associated with storing and processing large volumes of user data.

Upgrades and Enhancements

As technology evolves, periodic upgrades will be necessary to keep the AI and AR systems current. This could involve integrating new features, improving existing algorithms, or adopting more advanced technologies. Such enhancements can further increase the overall costs.
  • Feature Integration: adding new functionalities to enhance user experience.
  • Algorithm Improvement: refining algorithms to improve accuracy and performance.
  • Advanced Technologies: adoption of newer technologies to stay ahead in the market.

Return of Investment (ROI)

Despite the high cost, the potential ROI of implementing AI and AR technologies in e-commerce can be huge. The following points outline the key benefits and potential financial gains:
  • Increased Customer Engagement
AI and AR technologies provide a more personalized and interactive shopping experience, which can increase customer satisfaction and engagement. Engaged customers are more likely to make repeat purchases, thus increasing overall sales. According to [74], such technologies drive customer experience and value co-creation, leading to better business outcomes.
2.
Increased Conversion Rate
By offering customized recommendations and allowing customers to visualize products through AR, this technology can significantly increase conversion rates. Customers are more likely to purchase products that they feel are specifically recommended to them and that they can visualize in real-time. Research has shown that personalized recommendations can increase conversion rates by up to 20% [75].
3.
Reduced Return Rate
AR features allow customers to try products virtually, thus reducing the chances of returns. This can result in significant cost savings for e-commerce platforms, as handling returns is often expensive. Belenioti [76] highlights how digital innovation can reduce operational costs and improve customer satisfaction.
4.
Data-driven Insights
AI systems can analyze large amounts of data to provide valuable insights into customer behavior and preferences. This information can be used to optimize marketing strategies, inventory management, and overall business operations, contributing to increased profitability.
5.
Competitive Advantage
Implementing cutting-edge technology can set e-commerce platforms apart from their competitors. Offering advanced AI and AR features can attract tech-savvy customers and establish the platform as an industry leader, potentially resulting in market share growth. This is in line with the findings of [74], who emphasized the role of advanced technology in maintaining competitive advantage.

5.4. Research Limitations

This study has several limitations that need to be acknowledged. Firstly, although minimal privacy concerns and biases were found on average, there is potential for these issues to arise. Recommendation systems may inadvertently favor demographic groups with better access to advanced devices, leading to unequal benefits. Future research should consider implementing safeguards and equitable algorithms to mitigate these biases. Secondly, the detailed implementation costs and return on investment (ROI) associated with integrating AI and AR technologies were not explored. While the potential benefits are significant, the initial and ongoing financial investments are substantial and warrant further investigation. Comprehensive cost–benefit analyses in future studies could guide e-commerce platforms in making informed decisions.
The study employed purposive sampling method, which, while ensuring representation of specific user groups, may limit the generalizability of the findings to the broader population. Future research should consider a more diverse and larger sample to enhance the generalizability of the results. Additionally, the rapid pace of technological advancements in AI and AR means that the findings of this study may quickly become outdated. Continuous updates and follow-up studies are necessary to keep the research relevant and reflective of the current state of technology. The focus on users who have engaged with the AR try-on feature for cosmetics on Shopee may overlook the experiences of those who have not used these features. Including these users in future research could provide a more comprehensive understanding of the barriers to adoption and broader user perspectives.
Data collection in this study relied on self-reported measures, which can introduce response biases. The use of quantitative methods provided a broad overview but may lack the depth of qualitative insights. Incorporating qualitative approaches, such as interviews or focus groups, in future research could offer deeper insights into user experiences and perceptions. By acknowledging these limitations, this study provides a transparent view of its scope and boundaries, offering a solid foundation for future research to build upon.

6. Conclusions

The results of this study provide robust support for the theoretical models applied, specifically, the Technology Acceptance Model (TAM) and the Theory of Planned Behavior (TPB). The findings demonstrate that perceived ease of use and perceived usefulness are critical determinants of user attitudes towards AI–AR technologies in e-commerce. Furthermore, perceived security and trust are essential in fostering user acceptance and intention to use these technologies. These results are consistent with prior research, reinforcing the importance of these constructs in technology adoption models. The study’s contributions lie in extending the application of these models to the context of AI and AR in the cosmetics industry on Shopee, providing both theoretical and practical insights.
Overall, this study reveals that the integration of AI and AR technologies in personalized recommendations, particularly on the Shopee e-commerce platform, has a significant positive impact on customer usage intention. Key factors such as perceived ease of use, perceived usefulness, user trust, and innovativeness play important roles in shaping user attitudes and intentions towards the adoption of AI–AR technology. The findings contribute to a better understanding of the interaction dynamics between customers and AI–AR technologies in the context of online shopping. The practical implications of this research can help e-commerce companies improve AI–AR technology implementation strategies and provide a better shopping experience for users.
Based on the research results, significant conclusions can be drawn regarding the two main problem formulations:
  • The impact of AI and AR technology integration in personalized recommendation on customer intention to use: The results show that the integration of AI and AR technologies in personalized recommendations has a significant positive impact on customer usage intentions. Factors such as perceived ease of use, benefits of use, and user trust in these technologies contribute positively to the formation of usage intentions. This shows that the implementation of AI–AR technology in presenting personalized recommendations is able to increase user interest and intention to take advantage of these features in the context of online shopping.
  • Factors influencing customers’ intention to use the integration of AI and AR technology in personalized Recommendation: The key factors that influence usage intention involve perceived ease of use, benefits of use, user trust, and innovativeness. The use of AI–AR technology in presenting personalized recommendations on e-commerce platforms, such as Shopee, requires an easy-to-use interface design, emphasis on the benefits provided to users, and efforts to increase the level of user trust in the technology. In addition, the innovation factor is also proven to play an important role in shaping user attitudes and intentions towards the use of AI–AR technology.
The following are some suggestions for further research that can be carried out based on the findings of this study:
  • Expansion to other platforms: Conduct similar research on other e-commerce platforms to understand whether the findings are generally applicable or whether there is variability in the use of AI–AR technology across different e-commerce contexts.
  • Demographic variability analysis: Conduct deeper analysis into the variability in the impact of AI–AR technologies based on demographic factors such as age, gender, and education level. This can provide deeper insights into how these factors affect user acceptance and intentions.
  • Qualitative studies: Engage in qualitative studies, such as interviews or focus groups, to understand user perspectives more deeply. This can provide richer context and explanations related to users’ motivations and experiences.

Author Contributions

Conceptualization, S.R.A. and B.P.; Formal analysis, S.R.A.; Methodology, S.R.A. and I.E.; Resources, B.P. and E.H.P.; Software, S.R.A.; Supervision, B.P., I.E. and E.H.P.; Validation, B.P., I.E. and E.H.P.; Writing—original draft, S.R.A.; Writing—review & editing, S.R.A., B.P. and I.E. All authors have read and agreed to the published version of the manuscript.

Funding

This research received no external funding and the APC was funded by Faculty of Computer Science, University of Indonesia.

Institutional Review Board Statement

Not applicable.

Informed Consent Statement

Not applicable.

Data Availability Statement

The original contributions presented in the study are included in the article, further inquiries can be directed to the corresponding authors.

Conflicts of Interest

The authors declare no conflict of interest.

References

  1. Kedah, Z. Use of E-Commerce in The World of Business. Startupreneur Bus. Digit. (SABDA J.) 2023, 2, 51–60. [Google Scholar] [CrossRef]
  2. Rakhim, M.; Umar, A.; Abdumalik, R. The Role of E-Commerce in the World Economy. Psychol. Educ. J. 2021, 58, 6281–6285. [Google Scholar] [CrossRef]
  3. Kee, D.M.H.; Wawi, M.H.H.; Zohri, M.H.A.; Mok, H.X.; Mok, M.N.; Rafif, M.I.; Lutfiani, L.S.; Hafizh, U.; Priyambodo, H.G. Are You Satisfied with Shopee? A Study of Customer Satisfaction Towards Shopee. Int. J. Tour. Hosp. Asia Pasific 2023, 6, 102–115. [Google Scholar] [CrossRef]
  4. E-Commerce Dengan Pengunjung Terbanyak Kuartal I 2023. Available online: https://databoks.katadata.co.id/datapublish/2023/05/03/5-e-commerce-dengan-pengunjung-terbanyak-kuartal-i-2023 (accessed on 20 December 2023).
  5. Dogra, P.; Kaushik, A.K.; Kalia, P.; Kaushal, A. Influence of augmented reality on shopping behavior. Manag. Decis. 2023, 61, 2073–2098. [Google Scholar] [CrossRef]
  6. Arghashi, V. Shopping with augmented reality: How wow-effect changes the equations! Electron. Commer. Res. Appl. 2022, 54, 101166. [Google Scholar] [CrossRef]
  7. Jayaswal, P.; Parida, B. The role of augmented reality in redefining e-tailing: A review and research agenda. J. Bus. Res. 2023, 160, 113765. [Google Scholar] [CrossRef]
  8. Dethe, H.S.; Joy, E. Revolutionizing E-commerce with 3D Visualization: An Experimental Assessment of Behavioural Shopper Responses to Augmented Reality in Online Shopping. In Proceedings of the 2023 4th International Conference for Emerging Technology (INCET), Belgaum, India, 26–28 May 2023; pp. 1–6. [Google Scholar]
  9. Jessen, A.; Hilken, T.; Chylinski, M.; Mahr, D.; Heller, J.; Keeling, D.I.; de Ruyter, K. The playground effect: How augmented reality drives creative customer engagement. J. Bus. Res. 2020, 116, 85–98. [Google Scholar] [CrossRef]
  10. Joshi, A.; Jain, S. An Approach of Augmented Reality in Field of Furniture Shopping. In Proceedings of the 2022 Fourth International Conference on Emerging Research in Electronics, Computer Science and Technology (ICERECT), Mandya, India, 26–27 December 2022; pp. 1–6. [Google Scholar]
  11. Brengman, M.; Willems, K.; Van Kerrebroeck, H. Can’t touch this: The impact of augmented reality versus touch and non-touch interfaces on perceived ownership. Virtual Real. 2019, 23, 269–280. [Google Scholar] [CrossRef]
  12. Turban, E.; Outland, J.; David, K.; Lee, J.K.; Liang, T.-P.; Turban, D.C. Electronic Commerce 2018: A Managerial and Social Networks Perspective; Springer: Cham, Switzerland, 2018; Volume 2017. [Google Scholar]
  13. Nemat, R. Taking a look at different types of e-commerce. World Appl. Program. 2011, 1, 100–104. [Google Scholar]
  14. Kayte, S.N. A Review Paper on E-Commerce. J. Emerg. Technol. Innov. Res. (JETIR) 2019, 6, 557–560. [Google Scholar]
  15. Dou, Z.; Gong, H.; Xia, L. Analysis of E-Commerce Management Policies Based on The Current Situation of Development. J. Educ. Humanit. Soc. Sci. 2023, 15, 91–96. [Google Scholar] [CrossRef]
  16. Diana, D.; Angelina, G.; Sutandyo, I.H.; Yuwono, J.M.; Edbert, I.S.; Aulia, A. Implementation of Augmented Reality Shopping in E-Commerce to Increase Customer’s Purchase Intention. Eng. Math. Comput. Sci. J. (EMACS) 2023, 5, 97–102. [Google Scholar] [CrossRef]
  17. Berryman, D.R. Augmented reality: A review. Med. Ref. Serv. Q. 2012, 31, 212–218. [Google Scholar] [CrossRef] [PubMed]
  18. Iisnawati, I.; Marwa, T.; Shihab, M.S.; Yuliani, Y.; Yunita, D.; Daud, I. Could the Implementation of Augmented Reality Influence Consumers’ Purchase Intention in E-Commerce? J. Manaj. DAN Kewirausahaan 2023, 11, 12–19. [Google Scholar] [CrossRef]
  19. Sato, K.; Soejima, T.; Saito, M.; Sasage, R.; Kamioka, N.; Goto, N.; Kawai, Y. Development of Augmented Reality-Based Application to Search for Electric Appliances and Furniture. In Proceedings of the 2021 IEEE 3rd Global Conference on Life Sciences and Technologies (LifeTech), Nara, Japan, 9–11 March 2021; pp. 214–216. [Google Scholar]
  20. Heins, C. Artificial intelligence in retail—A systematic literature review. Foresight 2023, 25, 264–286. [Google Scholar] [CrossRef]
  21. Devagiri, J.S.; Paheding, S.; Niyaz, Q.; Yang, X.; Smith, S. Augmented Reality and Artificial Intelligence in industry: Trends, tools, and future challenges. Expert Syst. Appl. 2022, 207, 118002. [Google Scholar] [CrossRef]
  22. Bawack, R.E.; Wamba, S.F.; Carillo, K.D.A.; Akter, S. Artificial intelligence in E-Commerce: A bibliometric study and literature review. Electron. Mark. 2022, 32, 297–338. [Google Scholar] [CrossRef] [PubMed]
  23. Vullam, N.; Vellela, S.S.; Venkateswara, R.; Rao, M.V.; Basha, S.K.K.; Roja, D. Multi-Agent Personalized Recommendation System in E-Commerce based on User. In Proceedings of the 2nd International Conference on Applied Artificial Intelligence and Computing, ICAAIC 2023, Salem, India, 4–6 May 2023; pp. 1194–1199. [Google Scholar]
  24. Li, S. Big Data-Based Recommendation Algorithm in E-commerce Personalized Marketing Shujun. In Wuhan International Conference on e-Business at AIS Electronic Library (AISeL); Springer: Cham, Switzerland, 2023; pp. 5–7. [Google Scholar]
  25. Sarstedt, M.; Moisescu, O.-I. Quantifying uncertainty in PLS-SEM-based mediation analyses. J. Mark. Anal. 2023, 12, 87–96. [Google Scholar] [CrossRef]
  26. Tian, H.; Iqbal, S.; Akhtar, S. Exploring predictors of innovation performance of SMEs: A PLS-SEM approach. Empl. Relat. 2023, 45, 909–924. [Google Scholar] [CrossRef]
  27. Tang, X.; Goh, Y. Evaluating Four Factors of Students’ Career Adaptabilities (Caa) Using Pls-Sem Approach. Int. J. Entrep. Bus. Technol. 2023, 1, 14–26. [Google Scholar] [CrossRef]
  28. Davis, F.D. Perceived usefulness, perceived ease of use, and user acceptance of information technology. MIS Q. 1989, 13, 319–340. [Google Scholar] [CrossRef]
  29. Surendran, P. Technology Acceptance Model: A Survey of Literature. Int. J. Bus. Soc. Res. (IJBSR) 2012, 2, 463–468. [Google Scholar] [CrossRef]
  30. Holden, R.J.; Karsh, B.-T. The Technology Acceptance Model: Its past and its future in health care. J. Biomed. Inform. 2010, 43, 159–172. [Google Scholar] [CrossRef]
  31. Sentosa, I. Examining a Theory of Planned Behavior (TPB) and Technology Acceptance Model (TAM) in Internetpurchasing Using Structural Equation Modeling. J. Arts Sci. Commer. 2012, 3, 62–77. [Google Scholar]
  32. Ajzen, I. The Theory of Planned Behavior. Organ. Behav. Hum. Decis. Process. 1991, 50, 179–211. [Google Scholar] [CrossRef]
  33. Ruiz-Herrera, L.G.; Valencia-Arias, A.; Gallegos, A.; Benjumea-Arias, M.; Flores-Siapo, E. Technology acceptance factors of e-commerce among young people: An integration of the technology acceptance model and theory of planned behavior. Heliyon 2023, 9, e16418. [Google Scholar] [CrossRef] [PubMed]
  34. Adams, D.A.; Nelson, R.R.; Todd, P.A. Perceived usefulness, ease of use, and usage of information technology: A replication. MIS Q. 1992, 16, 227–247. [Google Scholar] [CrossRef]
  35. Satoh, Y.; Shiogama, H.; Hanasaki, N.; Pokhrel, Y.; Boulange, J.E.S.; Burek, P.; Gosling, S.N.; Grillakis, M.; Koutroulis, A.; Schmied, H.M.; et al. A quantitative evaluation of the issue of drought definition: A source of disagreement in future drought assessments. Environ. Res. Lett. 2021, 16, 104001. [Google Scholar] [CrossRef]
  36. Kitchenham, B. Procedures for Performing Systematic Reviews; Keele University: Keele, UK, 2004; Volume 33, pp. 1–26. [Google Scholar]
  37. Keele, S. Guidelines for Performing Systematic Literature Reviews in Software Engineering; Technical Report, Technical Report, Ver. 2.3, EBSE Technical Report; EBSE. 2007, Volume 5. Available online: https://www.researchgate.net/profile/Barbara-Kitchenham/publication/302924724_Guidelines_for_performing_Systematic_Literature_Reviews_in_Software_Engineering/links/61712932766c4a211c03a6f7/Guidelines-for-performing-Systematic-Literature-Reviews-in-Software-Engineering.pdf (accessed on 20 December 2023).
  38. Wang, C.; Ahmad, S.F.; Ayassrah, A.Y.B.A.; Awwad, E.M.; Irshad, M.; Ali, Y.A.; Al-Razgan, M.; Khan, Y.; Han, H. An empirical evaluation of technology acceptance model for Artificial Intelligence in E-commerce. Heliyon 2023, 9, e18349. [Google Scholar] [CrossRef]
  39. Tong, T.; Xiong, Y. Modeling Intention-Based Critical Determinants of E-Commerce Utilization: Emerging Business Models and Transformation in the Digital World. Front. Psychol. 2022, 13, 889147. [Google Scholar] [CrossRef] [PubMed]
  40. Van Dolen, W.M.; Dabholkar, P.A.; de Ruyter, K. Satisfaction with Online Commercial Group Chat: The Influence of Perceived Technology Attributes, Chat Group Characteristics, and Advisor Communication Style. J. Retail. 2007, 83, 339–358. [Google Scholar] [CrossRef]
  41. Kim, S.S. Purchase intention in the online open market: Do concerns for E-commerce really matter? Sustainability 2020, 12, 773. [Google Scholar] [CrossRef]
  42. Owusu, P.R.; Asiedu, E.P.; Ji, J.; Sarpong, F.A. Innovation and Evaluation of Technology Acceptance Model (Tam) in S-Commerce: A Case of Social Media Platforms in Ghana. J. Comput. Commun. 2022, 10, 100–124. [Google Scholar] [CrossRef]
  43. Bhattacharya, B. Impact of AR and VR in Industrial Revolution. Int. J. Res. Appl. Sci. Eng. Technol. 2022, 10, 732–736. [Google Scholar] [CrossRef]
  44. Thompson, R.; Barclay, D.; Higgins, C.A. The partial least squares approach to causal modeling: Personal computer adoption and use as an illustration. Technol. Stud. 1995, 2, 284–324. [Google Scholar]
  45. Chin, W.W. The partial least squares approach for structural equation modeling. In Modern Methods for Business Research; Methodology for Business and Management; Lawrence Erlbaum Associates Publishers: Mahwah, NJ, USA, 1998; pp. 295–336. [Google Scholar]
  46. Hinton, P.; McMurray, I.; Brownlow, C. SPSS Explained, 1st ed.; Routledge: London, UK, 2004. [Google Scholar] [CrossRef]
  47. Sarstedt, M.; Ringle, C.M.; Hair, J.F. Partial Least Squares Structural Equation Modeling. In Handbook of Market Research; Springer International Publishing: Cham, Switzerland, 2017; pp. 587–632. [Google Scholar]
  48. Lam, L.W. Impact of competitiveness on salespeople’s commitment and performance. J. Bus. Res. 2012, 65, 1328–1334. [Google Scholar] [CrossRef]
  49. Hair, F.J., Jr.; Sarstedt, M.; Hopkins, L.; Kuppelwieser, V.G. Partial least squares structural equation modeling (PLS-SEM): An emerging tool in business research. Eur. Bus. Rev. 2014, 26, 106–121. [Google Scholar] [CrossRef]
  50. Henseler, J.; Ringle, C.M.; Sarstedt, M. A new criterion for assessing discriminant validity in variance-based structural equation modeling. J. Acad. Mark. Sci. 2015, 43, 115–135. [Google Scholar] [CrossRef]
  51. King, W.R.; He, J. A meta-analysis of the technology acceptance model. Inf. Manag. 2006, 43, 740–755. [Google Scholar] [CrossRef]
  52. Alalwan, A.A.; Dwivedi, Y.K.; Williams, M.D. Customers’ Intention and Adoption of Telebanking in Jordan. Inf. Syst. Manag. 2016, 33, 154–178. [Google Scholar] [CrossRef]
  53. Mou, J.; Shin, D.-H.; Cohen, J.F. Trust and risk in consumer acceptance of e-services. Electron. Commer. Res. 2017, 17, 255–288. [Google Scholar] [CrossRef]
  54. Ozturk, A.B.; Bilgihan, A.; Salehi-Esfahani, S.; Hua, N. Understanding the mobile payment technology acceptance based on valence theory: A case of restaurant transactions. Int. J. Contemp. Hosp. Manag. 2017, 29, 2027–2049. [Google Scholar] [CrossRef]
  55. Kim, Y.; Peterson, R.A. A Meta-analysis of Online Trust Relationships in E-commerce. J. Interact. Mark. 2017, 38, 44–54. [Google Scholar] [CrossRef]
  56. Sharma, G.; Lijuan, W. The effects of online service quality of e-commerce Websites on user satisfaction. Electron. Libr. 2015, 33, 468–485. [Google Scholar] [CrossRef]
  57. Chiu, W.; Chiu, W.; Cho, H.; Cho, H. The role of technology readiness in individuals’ intention to use health and fitness applications: A comparison between users and non-users. Asia Pac. J. Mark. Logist. 2020, 33, 807–825. [Google Scholar] [CrossRef]
  58. Hsiao, K.-L.; Chen, C.-C. What drives smartwatch purchase intention? Perspectives from hardware, software, design, and value. Telemat. Inform. 2018, 35, 103–113. [Google Scholar] [CrossRef]
  59. Han, X.; Wang, L.; Fan, W. Understanding and Predicting Electronic Commerce Adoption: An Extension of the Theory of Planned Behavior. MIS Q. 2006, 45, 821–858. [Google Scholar] [CrossRef]
  60. Target Audience: Decorative Cosmetics Users in Indonesia|Statista. Available online: https://www.statista.com/study/125831/decorative-cosmetics-users-in-indonesia/ (accessed on 20 December 2023).
  61. Maryanto, R.H.; Kaihatu, T.S. Customer Loyalty as an Impact of Perceived Usefulness to Grab Users, Mediated by Customer Satisfaction and Moderated by Perceived Ease of Use. Binus Bus. Rev. 2021, 12, 31–39. [Google Scholar] [CrossRef]
  62. Wilson, N. The Impact of Perceived Usefulness and Perceived Ease-of-Use Toward Repurchase Intention in the Indonesian E-Commerce Industry. J. Manaj. Indones. 2019, 19, 241–249. [Google Scholar] [CrossRef]
  63. Sherifi, D. Perceived Usefulness and Perceived Ease of Use Impact on Patient Portal Use. 2018. Available online: https://api.semanticscholar.org/CorpusID:79876699 (accessed on 14 December 2023).
  64. Damghanian, H.; Zarei, A.; Kojuri, M.A.S. Impact of Perceived Security on Trust, Perceived Risk, and Acceptance of Online Banking in Iran. J. Internet Commer. 2016, 15, 214–238. [Google Scholar] [CrossRef]
  65. Alotaibi, R.; Alghamdi, A. The Impact of Perceived Security and Perceived Trust on the Use of m-Payment Applications in Saudi Arabia. Int. J. Adv. Sci. Eng. Inf. Technol. 2022, 12, 2398–2403. [Google Scholar] [CrossRef]
  66. Almaiah, M.A.; Al-Otaibi, S.; Shishakly, R.; Hassan, L.; Lutfi, A.; Alrawad, M.; Qatawneh, M.; Abu Alghanam, O. Investigating the Role of Perceived Risk, Perceived Security and Perceived Trust on Smart m-Banking Application Using SEM. Sustainability 2023, 15, 9908. [Google Scholar] [CrossRef]
  67. Hegner, S.M.; Beldad, A.D.; Brunswick, G.J. In Automatic We Trust: Investigating the Impact of Trust, Control, Personality Characteristics, and Extrinsic and Intrinsic Motivations on the Acceptance of Autonomous Vehicles. Int. J. Human–Comput. Interact. 2018, 35, 1769–1780. [Google Scholar] [CrossRef]
  68. Dawwas, A.; Al-Haddad, S. The Impact of Locus of Control on Innovativeness. 2018. Available online: https://api.semanticscholar.org/CorpusID:199463023 (accessed on 15 December 2023).
  69. Darawong, C. The influence of leadership styles on new product development performance: The moderating effect of product innovativeness. Asia Pac. J. Mark. Logist. 2020, 33, 1105–1122. [Google Scholar] [CrossRef]
  70. Choi, G.; Chung, H. Applying the Technology Acceptance Model to Social Networking Sites (SNS): Impact of Subjective Norm and Social Capital on the Acceptance of SNS. Int. J. Hum. Comput. Interact. 2013, 29, 619–628. [Google Scholar] [CrossRef]
  71. Kang, J.M.; Park, C. Effects of Perceived Control on Usage Intention toward Digital Finance Service: Moderating Role of Privacy Concern. Inf. Syst. Rev. 2023, 25, 161–181. [Google Scholar] [CrossRef]
  72. Zhang, T.; Tan, H.; Li, S.; Zhu, H.; Tao, D. Public’s acceptance of automated vehicles: The role of initial trust and subjective norm. Proc. Hum. Factors Ergon. Soc. Annu. Meet. 2019, 63, 919–923. [Google Scholar] [CrossRef]
  73. Shuhaiber, A.H. The Role of Perceived Control, Enjoyment, Cost, Sustainability and Trust on Intention to Use Smart Meters: An Empirical Study Using SEM-PLS. In WorldCIST. 2018. Available online: https://api.semanticscholar.org/CorpusID:13782821 (accessed on 19 December 2023).
  74. Buhalis, D.; Lin, M.S.; Leung, D. Metaverse as a driver for customer experience and value co-creation: Implications for hospitality and tourism management and marketing. Int. J. Contemp. Hosp. Manag. 2023, 35, 701–716. [Google Scholar] [CrossRef]
  75. Carignani, F.; Gesualda, I.; Francesco, B. How management uses AI in the museum field: From chatbots towards chatGTP. In Proceedings of the Intervento Presentato al Convegno Sinergie-SIMA 2023 Conference, Bari, Italy, 29–30 June 2023; pp. 407–413. [Google Scholar] [CrossRef]
  76. Belenioti, Z.C. COVID-19 resilience via digital cultural heritage; digital life in museums and festivals during the anthropause. Int. J. Technol. Mark. 2022, 16, 403. [Google Scholar] [CrossRef]
Figure 1. E-Commerce Shopee.
Applsci 14 05786 g001
Figure 2. Average E-Commerce Site Visits per Month in Indonesia (Q1 2023) [4].
Applsci 14 05786 g002
Figure 3. TAM Final Model.
Applsci 14 05786 g003
Figure 4. TPB Model. The dotted line represents the indirect effect of perceived behavioral control on behavior, mediated through intention.
Applsci 14 05786 g004
Figure 5. Research model [33]. Red line indicates additional variables, blue line indicates TAM, and green line indicates TPB.
Applsci 14 05786 g005
Table 1. Final research instruments.
VariablesCodeCustomized IndicatorsSource
AttitudeA1I like the idea of AI–AR personalized recommendations in e-commerce[33]
A2AI–AR personalized recommendations are a good idea
A3AI–AR personalized recommended products according to tastes and needs
A4I am excited about e-commerce platforms powered by AI–AR personalized recommendations[38]
Perceived TrustPT1I am confident that AI–AR’s personalized recommendation feature can provide trustworthy product suggestions[33]
PT2I believe that AI–AR’s personalized recommendations can protect my personal information and privacy
PT3I am confident that AI–AR integrated personalized recommendations only collect the user’s personal data necessary for its activities[39]
Perceived ControlPC1Using AI–AR personalized recommendations in buying goods in e-commerce saves time[33]
PC2I intend to use AI–AR personalized recommendations to make online purchases/transactions
PC3I feel more in control of my online shopping when using AI–AR personalized recommendations[40]
Perceived Ease of UsePEU1I believe that AI–AR technology in personalized recommendations is easy to understand and use[33]
PEU2I feel comfortable with the level of ease of use of AI–AR technology in personalized recommendations
PEU3I believe that AI–AR technology in personalized recommendations can help me find the products I want easily
PEU4Buying products recommended by AI–AR integrated technology is easy and efficient in many ways[41]
Innovation or InnovativenessI1I find it interesting to use AI–AR technology in personalized recommendations[33]
I2I tend to be interested in trying new technologies such as AI–AR in personalized recommendations
I3Usually, I always want to try a new app or technology
I4AI–AR personalized recommendations will be useful every time I shop on e-commerce[42]
Usage IntentionUI1I will use AI–AR technology in personalized recommendations if it is available on the e-commerce platform I use[33]
UI2I would recommend the use of AI–AR technology in personalized recommendations to my friends and family
UI3I will use AI–AR technology in personalized recommendations regularly if it can provide a better shopping experience
UI4I am willing to use AI–AR technology in personalized recommendations because I have knowledge about it[39]
Subjective NormSN1I feel that the important people in my life support the use of AI–AR technology in personalized recommendations
SN2I will use AI–AR personalized recommendations if important people in my life recommend it
SN3Many people around me are using AI–AR personalized recommendations[43]
Perceived SecurityPS1I feel confident that these AI–AR technologies do not collect too much data[33]
PS2I feel safe when using AI–AR technology in personalized recommendations while shopping
PS3I believe that AI–AR technology in personalized recommendations can provide good protection against security risks in the use of my personal data
PS4I feel confident that AI–AR technology will not use my personal information for other purposes without my permission[41]
Perceived UsefulnessPU1I feel that the use of AI–AR technology in personalized recommendations is beneficial[33]
PU2I feel that the use of AI–AR technology in personalized recommendations can help me save time in searching for the products I want
PU3I believe that the use of AI–AR technology in personalized recommendations can help me find products that better suit my needs
PU4I believe that the use of AI–AR technology in personalized recommendations can help me find more affordable products
Table 2. Demographic questions.
QuestionAnswer Types
Name/InitialsShort text
E-mailShort text
GenderRadio Button:
Male
Female
Chose not to answer
AgeRadio Button:
<18 years old
18–25 years old
26–35 years old
36–55 years old
>55 years old
Work Radio Button:
Middle/Senior High School Students
College Students
Entrepreneurs
Civil Servants
Private Employees
Housewife/Husband
Not Working/Retired
Others: …
Domicile Radio Button:
Jabodetabek (Jakarta, Bogor, Depok, Tangerang, Bekasi)
Java Island (Non-Jabodetabek)
Sumatra Island
Kalimantan Island
Sulawesi Island
Bali Island
NTT and NTB Islands
Maluku/Papua Island
Others: …
Income per month Radio Button:
<IDR 1.000.000 (under USD 63.72)
IDR 1.000.000–3.000.000 (USD 63.72–191.16)
IDR 3.000.000–5.000.000 (USD 191.16–318.61)
IDR 5.000.000–10.000.000 (USD 318.61–637.21)
IDR 10.000.000–20.000.000 (USD 637.21–1274.3)
>IDR 20.000.000 (above USD 1274.3)
Current education Radio Button:
Not currently pursuing Education
Middle School
High School/Vocational School/Equivalent
D1/D2/D3
S1/D4 (Bachelor)
S2 (Masters)
S3 (Doctorate)
How often did you buy cosmetic products on the Shopee platform in the last 3 months? Radio Button:
Never
1 time
2–5 times
6–10 times
More than 10 times
Table 3. Outer model testing [45].
Test TypeParameterRule of Thumb
Validity ConvergentLoading FactorValid: ≥0.7
Eliminated: <0.4
Average Variance Extracted (AVE)Valid: >0.5
Validity DiscriminantCross LoadingItem value in the construct >Reflected construct value
ReliabilityCronbach’s AlphaReliable: >0.6
Composite ReliabilityReliable: >0.6
Table 4. Inner model testing [45].
CriteriaRule of Thumb
Path Coefficient valueClose to 1: strong, close to 0: weak
(+): relationship unidirectional, (−): relationship backwards
Mark   R 2 0.19: weak
0.20–0.33: moderate
0.34–0.67: strong
Mark   Q 2 Q 2 > 0: the model has good predictive relevance
Q 2 not have good predictive relevance
Mark   F 2 0.02: weak influence
0.15: moderate influence
0.35: strong influence
Table 5. Hypotheses testing [45].
CriteriaParameterExplanation
H 0   accepted   and   H 1 rejectedStatistical T value < Z-Score (1.96)
p-Value > 0.05
There is not any significant influence
H 1     accepted   and   H 0 rejectedStatistical T value > Z-Score (1.96)
p-Value < 0.05
There is significant influence
Table 6. Demographic summary.
QuestionOptionsNumberPercentage
Gender
Male
Female
Chose not to answer
120
263
4
31%
68%
1%
Age
<18 years old
18–25 years old
26–35 years old
36–55 years old
>55 years old
18
238
112
18
1
4.7%
61.5%
28.9%
4.7%
0.3%
Work
Middle/Senior High School Students
College Students
Entrepreneurs
Civil Servants
Private Employees
Housewife/Husband
Not Working/Retired
Others: …
20
157
46
41
88
12
9
14
5.2%
40.6%
11.9%
10.6%
22.7%
3.1%
2.3%
3,6%
Domicile
Jabodetabek (Jakarta, Bogor, Depok, Tangerang, Bekasi)
Java Island (Non-Jabodetabek)
Sumatra Island
Kalimantan Island
Sulawesi Island
Bali Island
NTT and NTB Islands
Maluku/Papua Island
Others: …
145
 
92
24
9
90
12
9
2
4
37.5%
 
23.8%
6.2%
2.3%
23.3%
3.1%
2.3%
0.5%
1%
Income per month
<IDR 1.000.000 (under USD 63.72)
IDR 1.000.000–3.000.000 (USD 63.72–191.16)
IDR 3.000.000–5.000.000 (USD 191.16–318.61)
IDR 5.000.000–10.000.000 (USD 318.61–637.21)
IDR 10.000.000–20.000.000 (USD 637.21–1274.3)
>IDR 20.000.000 (above USD 1274.3)
81
114
 
99
 
73
 
13
 
7
20.9%
29.5%
 
25.6%
 
18.9%
 
3.4%
 
1.8%
Current education
Not currently pursuing education
Middle school
High school/vocational school/equivalent
D1/D2/D3
S1/D4 (Bachelor)
S2 (Masters)
S3 (Doctorate)
140
1
26
 
27
137
54
2
36.2%
0.3%
6.7%
 
7%
35.4%
14%
0.5%
How often did you buy cosmetic products on the Shopee platform in the past 3 months?
Never
1 time
2–5 times
6–10 times
More than 10 times
28
63
212
69
15
7.2%
16.3%
54.8%
17.8%
3.9%
Table 7. Reliability test results.
Cronbach’s AlphaComposite Reliability
Attitude0.6530.794
Innovativeness0.6100.772
Perceived Control0.6440.808
Perceived Ease of Use0.6610.798
Perceived Security0.7790.857
Perceived Trust0.6470.809
Perceived Usefulness0.6050.772
Subjective Norm0.6110.794
Usage Intention0.6640.799
Table 8. Factor loadings value.
AIPCPEUPSPTPUSNUI
A10.733
A20.664
A30.651
A40.751
I1 0.727
I2 0.608
I3 0.605
I4 0.761
PC1 0.762
PC2 0.738
PC4 0.793
PEU1 0.765
PEU2 0.660
PEU3 0.672
PEU4 0.719
PS1 0.733
PS2 0.751
PS3 0.803
PS4 0.810
PT1 0.687
PT2 0.799
PT3 0.806
PU1 0.698
PU2 0.601
PU3 0.711
PU4 0.694
SN1 0.814
SN2 0.745
SN3 0.687
UI1 0.718
UI2 0.674
UI3 0.698
UI4 0.733
Table 9. Average Variance Extracted values.
Average Variance Extracted (AVE)
Attitude0.491
Innovativeness0.461
Perceived Control0.585
Perceived Ease of Use0.497
Perceived Security0.600
Perceived Trust0.586
Perceived Usefulness0.459
Subjective Norm0.563
Usage Intention0.499
Table 10. Cross loading values.
AIPCPEUPSPTPUSNUI
A10.7330.3830.3680.4970.2970.3650.4440.3630.429
A20.6640.3700.3270.4480.2550.3350.4220.2390.410
A30.6510.3620.3460.4360.3210.3400.3790.3370.412
A40.7510.3570.4260.4170.2830.3170.4720.2490.406
I10.3790.7270.3880.3570.2860.2610.4250.3800.516
I20.3440.6080.3520.3790.2320.2430.4460.2680.434
I30.2900.6050.3450.3210.1730.2360.3520.3540.376
I40.4010.7610.3990.4670.4270.4210.4420.3940.598
PC10.3640.4350.7620.4760.2910.2870.4630.3620.405
PC20.3860.3820.7380.4460.2670.2310.3700.3390.387
PC30.4500.4350.7930.4710.4660.4790.5110.4250.432
PEU10.4620.3790.4280.7650.3350.4080.4830.4000.472
PEU20.4530.4520.4220.6600.2710.3260.4750.3390.452
PEU30.4830.3950.4050.6720.2620.3570.4590.3110.450
PEU40.4150.3710.4550.7190.4370.4090.4970.4920.477
PS10.2450.2840.3010.2980.7330.4450.3020.3540.316
PS20.3680.3130.3730.4190.7510.5180.3940.4190.406
PS30.3110.3690.3550.3720.8030.5770.4210.4260.455
PS40.3440.3520.3580.3430.8100.6190.3610.3870.420
PT10.3860.3610.3510.4130.3750.6870.4110.3770.448
PT20.3720.3470.2920.3970.6480.7990.3630.3850.386
PT30.3640.3060.3750.4210.5620.8060.3780.4050.411
PU10.4380.3710.3590.4560.3130.3670.6980.3290.415
PU20.3810.4120.4080.4510.2570.2720.6010.3000.393
PU30.4510.4760.4020.4890.3250.3060.7110.2930.449
PU40.3910.4030.4270.4460.4010.3960.6940.4060.408
SN10.3460.3690.3780.4200.4100.4480.4130.8140.392
SN20.3380.4690.3780.4140.3710.3440.3850.7450.419
SN30.2650.3050.3490.3990.3740.3470.2940.6870.333
UI10.4390.4930.3850.4720.3150.3760.3640.3790.718
UI20.4020.5030.3530.4590.4360.4180.4730.3650.674
UI30.4490.4850.3640.5070.3720.3780.4410.3380.698
UI40.3820.5510.4070.4180.3470.3430.4580.3640.733
Table 11. Path coefficient values.
AIPCPEUPSPTPUSNUI
Attitude 0.199
Innovativeness0.148 0.471
Perceived Control 0.607 0.066
Perceived Ease of Use0.379 0.679
Perceived Security 0.703
Perceived Trust 0.171
Perceived Usefulness0.265 0.480
Subjective Norm 0.066
Usage Intention
Table 12. R-Square values.
R-Square
Attitude0.484
Perceived Ease of Use0.369
Perceived Security0.231
Perceived Trust0.494
Perceived Usefulness0.462
Usage Intention0.617
Table 13. f-Square values.
AIPCPEUPSPTPUSNUI
Attitude 0.062
Innovativeness0.025 0.329
Perceived Control 0.584 0.007
Perceived Ease of Use0.140 0.858
Perceived Security 0.978
Perceived Trust 0.049
Perceived Usefulness0.063 0.300
Subjective Norm 0.007
Usage Intention
Table 14. Q-Square values.
Q2 (=1 − SSE/SSO)
Attitude0.226
Innovativeness
Perceived Control
Perceived Ease of Use0.175
Perceived Security0.133
Perceived Trust0.278
Perceived Usefulness0.204
Subjective Norm
Usage Intention0.297
Table 15. Respondent’s usage intention towards AI–AR personalized recommendation.
Likert Scale AnswerPercentage
UI1Strongly Agree25%
Agree36.8%
Neutral28.9%
Disagree6.6%
Strongly Disagree2.6%
UI2Strongly Agree15.8%
Agree39.5%
Neutral32.9%
Disagree7.9%
Strongly Disagree3.9%
UI3Strongly Agree28.9%
Agree42.1%
Neutral23.7%
Disagree1.3%
Strongly Disagree3.9%
UI4Strongly Agree22.4%
Agree28.9%
Neutral30.3%
Disagree15.8%
Strongly Disagree2.6%
Table 16. Hypotheses testing values.
T Statisticsp Values
H1Perceived Ease of Use -> Perceived Usefulness12.7320.000
H2Perceived Ease of Use -> Attitude4.8210.000
H3Perceived Usefulness -> Perceived Security8.0830.000
H4Perceived Usefulness -> Attitude3.6580.000
H5Perceived Security -> Perceived Trust17.0830.000
H6Innovativeness -> Attitude2.4570.014
H7Innovativeness -> Usage Intention8.6120.000
H8Perceived Trust -> Usage Intention3.0940.002
H9Attitude -> Usage Intention3.9680.000
H10Perceived Control -> Usage Intention1.4050.161
H11Subjective Norm -> Usage Intention1.2510.212
H12Perceived Control -> Perceived Ease of Use12.0170.000
Table 17. Summary of key findings.
Key FindingsConsistency with Previous Studies
Perceived ease of use positively influences perceived usefulness and attitudeConsistent with [51,52]
Perceived usefulness positively influences perceived security and attitudeAligns with [53,54]
Perceived security positively influences perceived trustSupported by [55,56]
Innovativeness positively influences attitude and usage intentionReflects findings by [57]
Attitude positively influences usage intentionConsistent with [58,59]
Disclaimer/Publisher’s Note: The statements, opinions and data contained in all publications are solely those of the individual author(s) and contributor(s) and not of MDPI and/or the editor(s). MDPI and/or the editor(s) disclaim responsibility for any injury to people or property resulting from any ideas, methods, instructions or products referred to in the content.

