Article

Cognitive Principles for Remote Condition Monitoring Applied to a Rail Pantograph System

School of Engineering, Newcastle University, Newcastle Upon Tyne NE1 7RU, UK
*
Author to whom correspondence should be addressed.
Appl. Sci. 2024, 14(13), 5801; https://doi.org/10.3390/app14135801
Submission received: 19 April 2024 / Revised: 24 June 2024 / Accepted: 26 June 2024 / Published: 3 July 2024

Abstract

:
Remote condition monitoring (RCM) aims to ensure the availability of railway assets. Previous work has indicated the importance of a user-centred RCM design approach based on cognitive principles, but there has been no known demonstration of the application of these principles. The following paper takes this theory-based approach and applies it to the design of an RCM system for the rail pantograph/Overhead Line (OHL) system. The paper first presents a high-level conceptual architecture, based on four stages of cognitive decision-making (notification, acceptance, analysis and clearance), linked to the wider monitoring architecture. Second, the paper uses cognitive principles to propose demonstration Human–Machine Interface designs for the OHL system. These HMIs were presented in an evaluation with subject matter experts. The outcomes of the process generated user-centred design recommendations for RCM. Furthermore, the evaluation suggested the importance of multiple paths through the HMI dependent on the type and urgency of fault. Finally, the outcomes of the evaluation also highlighted the importance of considering context when deploying user-centred RCM.

1. Introduction

The running of a railway system is a complex socio-technical system [1,2]. With so many moving parts, infrastructure and people involved, it can be challenging to keep assets operational. This challenge is becoming more acute as railways strive to remain resilient in the face of climate change-related threats [3]. Downtime in a railway service can have significant safety, economic and social consequences. Access to track is a specific safety concern, and working around the live railway to inspect or maintain assets is one of the highest sources of risk to rail staff [4,5].
One method of reducing unexpected downtime is by using routine, preventative maintenance. This is when maintenance is scheduled and conducted at regular, predetermined intervals. Although this helps to reduce unplanned downtime, it means that maintenance is conducted whether or not there is a need for it: ‘fixing’ an issue that was never there in the first place, wasting time and resources, and requiring staff to go on or near track. An alternative method of scheduling maintenance, and the one explored in this project, is that of using Remote Condition Monitoring (RCM) to determine the current condition of the asset [6,7]. With RCM, sensors on the asset process information about the current status of the asset. This may be combined with historical or environmental data to not only give an indication of the current status of the asset, but also its potential future state and failure modes. If the RCM system implies the asset is nearing the end of its life, maintenance can be scheduled; this is a form of predictive maintenance [8]. Additionally, live remote sensing can give instantaneous intelligence of emerging faults, and alarms can trigger warnings for current, or imminent, asset failure. In this way, sensing and remote condition monitoring ensures continuity of the rail service.
The problem is that such technologies are typically built in a data-led, rather than user-led, manner [9,10]. Anecdotal and empirical evidence indicates that solutions may be difficult to use for operators, either presenting the user with too much or too little information, or in a format that is difficult to interpret [11,12]. When automation and intelligence (or machine learning) is involved, it may be difficult for the operator to build a model of how the RCM system is arriving at diagnoses [13]. In potential fault events, operators may be overloaded with alarms, many of which are duplicates or redundant [14]. Finally, significant business change is required and the shift from manual and engineering maintenance skills to digital skills is an area that many organisations are not prepared for unless the presentation of information through the Human–Machine Interface (HMI) is closely tailored to the needs of operational staff [15].
The solution is to build RCM tools that are designed with decisions and end-users in mind. This involves understanding the decision-making process of operators as they respond to tasks, and how cognition allows operators to build an understanding of both the condition of the asset or assets, and determine a course of action [16]. Work to date in human–automation systems has generally described this as a multi-stage process of notification, acceptance, analysis and clearance [17].
A programme of work to study the deployment of rail condition monitoring technologieshas found evidence to support the application of this general model of cognition to the rail asset context [9,11]. However, this requires empirical validation of whether these principles would genuinely support RCM-based decision making.
The following paper addresses that gap by taking the principles described in [9,11,17] and applying them to the design of a hypothetical demonstration RCM system in a key area for rail performance—pantograph monitoring [18,19]. These hypothetical HMIs represent the functional aspects of a potential RCM system. The contributions of this paper are:
  • A high-level conceptual architecture for a pantograph monitoring system that is linked to cognitively-orientated HMIs
  • Demonstration of cognitively-orientated HMIs for the pantograph system
  • Validation and feedback from subject matter experts, shedding light on the relevance of the staged cognitive approach identified in [9,11].
The paper is structured as follows. Section 2 covers background both on pantograph behaviours and on cognition in RCM environments. Section 3 covers the high-level conceptual model of how RCM data link to the HMI. Section 4 covers detailed design for the HMI. Section 5 covers a subject matter expert evaluation. Section 6 discusses the outcomes of the work, along with limitations and future directions.

2. Background

2.1. Pantograph System

A pantograph is the part of an electric tram or train that connects the vehicle to the catenary system (primarily consisting of a catenary wire and a contact wire), supplying the vehicle with the current it needs for power. The part of the pantograph that touches the catenary is known as the contact strip. This strip of graphite acts as both a conductor and as a lubricant. For the train to have a steady power supply, the surfaces of the strip and contact wire need to be smooth enough to slide across one another without jumping or snagging.
A number of factors can affect pantograph performance. This can include the speed of the train, with a high-speed system being more demanding on the catenary–pantograph system than an urban or metro system. Weather can be a factor, including wind (which can impact contact forces) or rain and snow (which can impact the connectivity between pantograph and catenary). In addition, the general state of wear to either the pantograph, specifically to the contact strip or more generally to the mechanical operation of the pantograph, or to the catenary, can all have an impact on performance.
Some of the common failure modes of the pantograph/catenary system identified in the literature [20,21] are:
  • − Pantograph aerodynamics are disturbed or set incorrectly
  • − Worn pantograph contact strip
  • − Pantograph geometry set incorrectly
  • − Incorrect contact wire height
  • − Catastrophic failure of pantograph or catenary system (often caused by other failure modes)
  • − Failure or displacement of droppers (often causing damage through contact with a pantograph)
  • − Uneven contact wire wear at discontinuity
  • − Formation of ice coating on contact wire (only an issue in certain seasons and/or climates).
Issues with pantograph performance range from poorer conductivity through to the contact strip catching on the contact wire, tearing the entire catenary system down. This is very costly in terms of money and time. To prevent this, it is essential to monitor the pantograph–catenary interaction, analysing any unusual results. Furthermore, general monitoring of pantograph system behaviour can encourage both predictive maintenance and more cost-effective scheduling of component replacement for either the pantograph or the catenary.
There are several metrics that can be used to indicate the wear of a pantograph contact strip, which include:
- Lateral Acceleration of the Contact Wire: As a result of the side-to-side motion of the contact point, any inconsistencies or irregularities on the contact strip could ‘catch’ on the contact wire, exciting it laterally. The values expected for a pantograph in good condition range from 3–5 m/s2, but for a worn or damaged contact strip these values tend to exceed 10 m/s2 [22]. It is recommended that acceleration be measured using optical accelerometers that are attached to the contact wire and oriented perpendicular to the direction of the tracks. The use of optical transducers is recommended because they do not suffer from electrical interference created by the pantograph–catenary interaction.
- Temperature: If the temperature of a pantograph contact strip exceeds what is expected (based on an estimation using a complex fuzzy system [23]), then a fault in the pantograph contact area is likely. When using temperature as a wear indicator, a good method for measurement of the contact strip is to use a thermal camera along with image processing techniques. This allows the whole of the contact strip to be monitored, while recording the point of maximum temperature as it moves across the length of the strip.
- Shape of the Contact Strip: In order to transfer current from the catenary to the vehicle, the contact plate needs to be touching the contact wire. Over time, the friction from this contact causes a number of defects that can be visually identified, the most common of these being over-abrasion, partial abrasion, chipping, and groove-shaped abrasion. Groove-shaped abrasion is considered particularly dangerous, as if the contact wire catches in the groove, it could tear the entire catenary system down. Visually, it is easy to identify these defects during an in-person inspection. However, it can be more difficult to spot these through video. In order to identify these remotely, a number of deep learning algorithms have been developed [24,25]. These algorithms use a convolutional neural network (CNN) to identify a pantograph from an image and determine which defect category the image should be classified as. However, carrying out maintenance activity requires more than just simply categorizing the defect. In order to have a quantitative representation of the defect, image processing methods can be used. Most image processing starts with some form of edge detection algorithm. The most effective for use on the pantograph–catenary [24,26] uses a multi-stage algorithm to intensify and suppress certain pixels, leaving just the edges. The method described in [24] gives an estimate of wear depth by first picking out the required edges using the Hough transformation, an image processing method for identifying complex patterns in images [27]. These selected edges are then smoothed to remove any noise before the distance between the top and bottom edges is calculated.
- Position of Contact with Wire: Due to the stagger (zig-zag path) of the contact wire, the point of contact between the pantograph and catenary should continuously slide across the contact strip from one side to the other [28] (see Figure 1). However, the contact strip of a worn pantograph is neither perfectly flat nor smooth. The wire will always move across the pantograph in the direction of least resistance; due to this, the contact position plot for a worn contact strip (see Figure 2) does not show the same uniform, side-to-side motion as that of the healthy pantograph. It is possible to determine the contact position using the dynamic response of the pantograph [29]; however, this requires the integration of accelerometers and strain gauges into the panhead. Another solution is to use some form of edge detection algorithm, to first detect the pantograph and overhead line, and then use an algorithm like that proposed in [28] to scan the video frame by frame, locating and saving the contact point for each.
- Arcing: Arcing occurs when the pantograph loses contact with the contact wire, forcing the current to travel through the air, resulting in a visible flash, high temperatures and electrical interference [21,23]. Although the presence of arcing is not necessarily a direct wear indicator, it is an unpredictable and inevitable phenomenon that can cause significant damage to both the contact strip [21] and the catenary [30], as well as other railway equipment. For this reason, the detection of arcing is essential to any pantograph monitoring system.

2.2. Cognition for Remote Condition Monitoring

The role that a user interface plays in an RCM system is to take the data recorded by sensors, which are potentially uninterpretable by the user, and translate them into information in a form that the human user can understand and utilise in decision making [31]. The amount of useful information that can be extracted from the data is directly linked to the efficiency by which this transformation occurs. Because of this, a Human–Machine Interface (HMI) is required, with the cognitive process of the user being a key consideration. An accurate understanding of what the user requires of the system provides a strong foundation upon which the design can be built. The system designed in this project could be described as a joint cognitive system, one in which the human user and system work together to achieve the desired goal [32]. Designing a system with the users’ goals and needs at the forefront can increase productivity whilst making tasks easier to understand, reducing cognitive load and stress experienced [33].
ISO-9241-210 [33] outlines the principles of human-centred design, and the process by which user understanding can be successfully embedded within design. This is a five-stage process involving planning of the project, understanding context of use, specifying requirements, designing the interface, and evaluation.
While valuable, the approach is general to any technology or product development. In terms of context and fundamental requirements, work has already been conducted to observe operators in maintenance control environments to understand the cognitive stages that need to be reflected in the operation of RCM technologies. Based on a cognitive model of alarm response, it was identified in [11] that there are four high-level activities in the process of fault handling of railway assets.
Firstly, the user must acknowledge the presence of an alarm; this stage is named “notification”. Once the user is aware of the alarm, they must determine the validity of the event. This stage of verification is called the “acceptance” stage. After verifying the fault, the operator must analyse the available information to determine the cause of the fault. In this stage, “analysis”, it was identified that contextual information, such as recent history of faults at that location, was a particularly useful type of information [11]. The final stage, “clearance”, involves the user selecting the optimum method of dealing with the fault. After a plan for rectifying the fault has been made, the event can be ‘cleared’. These four stages could be considered four major decisions the operator needs to make before they can move on to the next fault, these decisions being:
  • Is there a fault?
  • Is the fault legitimate?
  • What was the cause of the fault?
  • What should be done about the fault?
These stages may vary in relevance depending on the domain, task and information needs of any RCM use case [11,32]. This may be particularly the case where there is insufficient information. Heuristic strategies such as extrapolating from previous incidents or making judgements based on the frequency of previous events may support problem solving, but also may lead the user to erroneous conclusions. Equally, too much information can lead to strategies such as reducing the precision of decision making, or filtering out certain categories of event or information that may be seen as less relevant or pressing. Therefore, the HMI design must be conscious of the need to support effective processing of information and guarding against inappropriate conclusions. A strategic approach to supporting decision-making through cognitively staged HMIs may alleviate these issues.
Additionally, work in HMI and other considerations for RCM have highlighted the importance of considering the wider context where technology is deployed and the need for applications to consider factors such as training and competence [34], the need to adapt to new working patterns and processes [35,36,37], and the control room environment in terms of cooperation and collaboration across roles [9]. Furthermore, active involvement of a human operator can be vital when systems include a machine learning element, as the user can help to refine, train and contextualize analysis and decisions made by automated systems [10,38].

3. High-Level Conceptual Architecture

In order for the user to make the decisions described above, they require information regarding current condition and behaviour, in addition to further context such as weather and historical data regarding the pantograph and location of the event. Prior to the design of the HMIs, a theoretical condition monitoring system was designed based on the methods of measuring pantograph and overhead line wear discussed in literature. The information displayed by the user interface and the data recorded by the theoretical condition monitoring system to derive it are shown in Table 1.
The system was designed so that the storage of data over a twenty-five-second period is triggered if any of the sensor readings have exceeded their acceptable limits (though each OHLE/Pantograph system will have differing acceptable ranges). Each twenty-five-second data set is stored in a database as one “Event”.
From here, it is possible to describe a conceptual model or architecture whereby the specific aspects of condition monitoring are linked to the four stages of decision-making. Figure 3 details a high-level view of the joint cognitive system and the interaction between data, the decisions being made and the user. Each blue process correlates to one screen of the user interface and one decision to be made in the four stages of alarm handling. With these decisions forming the backbone of the system, it is possible to sequentially guide the user though the fault handling process one decision at a time. This allows for the progressive disclosure of information, only displaying information that assists the user in making the decision required at that moment in time and avoiding the display of information that does not.

4. Demonstration HMI Design

Having defined the overall conceptual architecture, the next stage was to design the more detailed elements of each display. There are many guidelines and standards available to one designing a user interface [39,40]. These contain specific tips and features for a designer or developer to implement into their designs. One key concept that frequently appears in the literature to achieve an easy-to-navigate and aesthetically pleasing interface is to only include visual elements that are absolutely essential, avoiding the display of irrelevant information and utilising progressive disclosure (hiding information until it is useful) when necessary [11].
Another key concept is to make the system state clearly visible: ensuring the system accurately represents what is happening in the sensed environment, and keeping the user informed, before and after, of the effects their decisions have. The next concept to keep in mind whilst designing is to make sure that the user feels like they are the one controlling the system, rather than feeling like the system controls them. This involves allowing users to navigate the system whichever way feels natural to them, i.e., allow them to use either the mouse, keyboard, or touchscreen to select an option, then use a different method to select the next option, providing them with multiple routes to achieve a goal. This also involves clearly indicating where the user is in the overall conceptual architecture, and ensuring where possible that every decision the user makes is reversible. Whilst using these concepts, it is important to remember that the tool being designed does not just affect how the user carries out their work, it forms their perception of what the task is [32]. Finally, based on the importance of being able to communicate actions and decisions to multiple actors [36] and the need to evidence and comment on decision making for future learning [10], HMIs should include some capacity for annotation and onward dissemination of actions.
To give the HMIs a specific focus, the application case for the pantograph RCM was the Tyne and Wear Metro. This light rail network covers 77.5 km (48.2 miles) and 60 stations, nine of which are underground. Rolling stock is powered by a 1.5-kV DC overhead line throughout. Metro cars are 40 metric tonnes in weight. Specifically, the application focussed on one of two lines (the ‘Green’ line) of the Metro, which connects Newcastle Airport with the city centre, and onwards to the adjoining urban centre of Sunderland.
Following an iterative design process, designs were initially drawn by hand as low-fidelity prototypes. These were discussed between the authors, and further designs were implemented in Microsoft C# version 11. In a true user-centred design process it would be necessary to involve actual users as part of participatory design, but for this study the HMIs only needed to represent the functions between and within HMIs. These HMIs were further reviewed by two of the authors and assessed against usability heuristics [39] before a final set of designs were produced. These were interactive, in that it was possible to navigate between HMIs, and to access elements such as pop-outs and drop-down menus. The HMIs were not linked to a functioning RCM system.

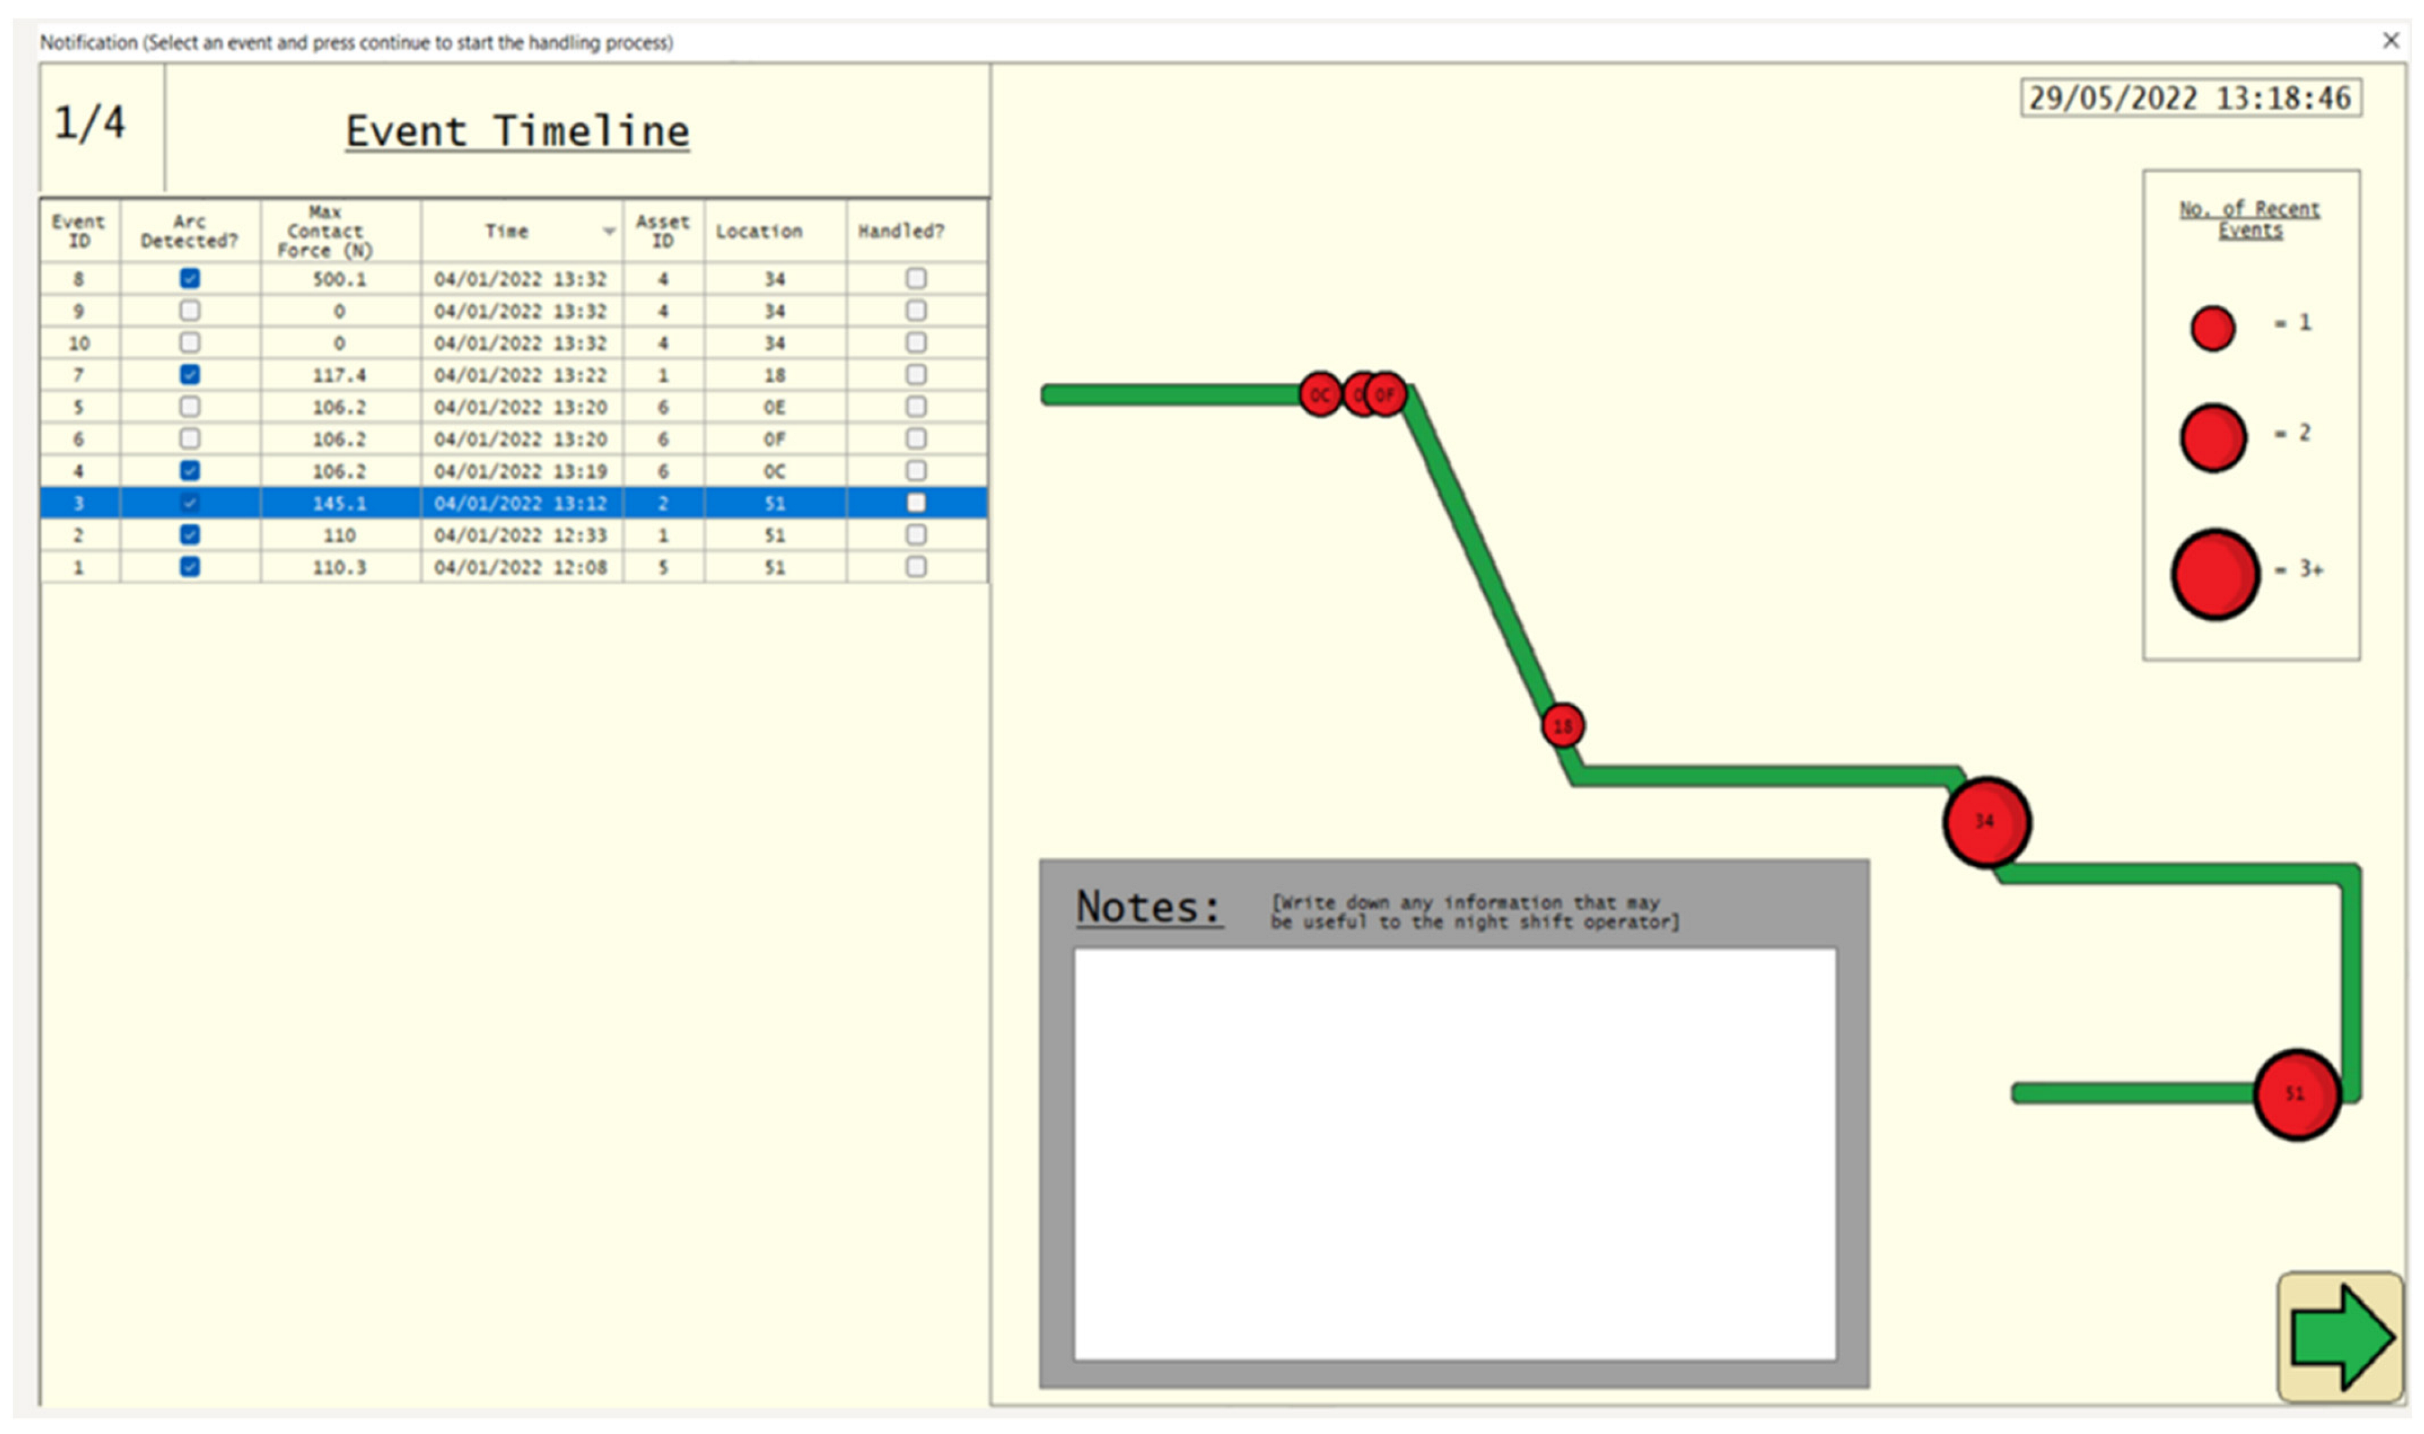
4.1. Stage 1—Notification

With the goal being to notify the user when an event is detected, the notification screen (Figure 4) consists of two primary features, a list of all detected events and an infographic. The list is automatically set to have the most recent events at the top with the option to be reordered by clicking on any of the column headers; it contains some basic information about each event, including a unique event ID number, the time, date and location of the event, as well as the maximum contact force between the pantograph contact strip and the overhead line contact wire used to give the user a gauge of severity and urgency. Additionally, the list includes whether an arc was detected in the video footage, provided by a machine learning algorithm like that discussed in [26]. The infographic displays all of the locations where events have occurred and if there have been multiple events at the same location by increasing the size of markers with the number of events. Once the user clicks an event to further investigate, they then click on the green arrow to proceed to the second stage.
In this way, the HMI for notification limits the amount of complex information about an event, minimizing the risk of information overload, and instead letting the user assess its immediate relevance before they then decide whether to progress to the next level of investigation.

4.2. Stage 2—Acceptance

The goal of the acceptance screen (Figure 5) is to assist the user in determining whether a given event is a false alarm or not. It achieves this primarily by showing video footage of the time of the event alongside a plot showing contact force over time. Red visual indications in the event data table highlight multiple unexpected or abnormal values. Events that are not immediately obvious using these two primary sources of information can be verified through the observation of additional sources of contextual and sensor data from the time of the event. Additionally, moving the cursor over a highlighted value provides a short description of how the data differ from the expected values or where the system is at an increased risk of false alarms. For example, if it is raining, the deflection of light in water droplets on the pantograph can cause false alarms in vision-/light-based detection systems [24].
Several studies have highlighted issues with multiple and false alarms [14,41]. Therefore, once a user determines the validity of the event, they can select yes to indicate a false alarm, marking the event as such and returning to the notification screen, or selecting no to continue to the next stage. Furthermore, this helps with learning and feedback for machine learning systems.
By allowing the user to use their own knowledge of the values expected during normal operation, with the HMI providing additional assistance by highlighting values outside of a predetermined range, the HMI allows less experienced operators to still use the system whilst being ‘taught’ the range of values that may indicate a real fault.

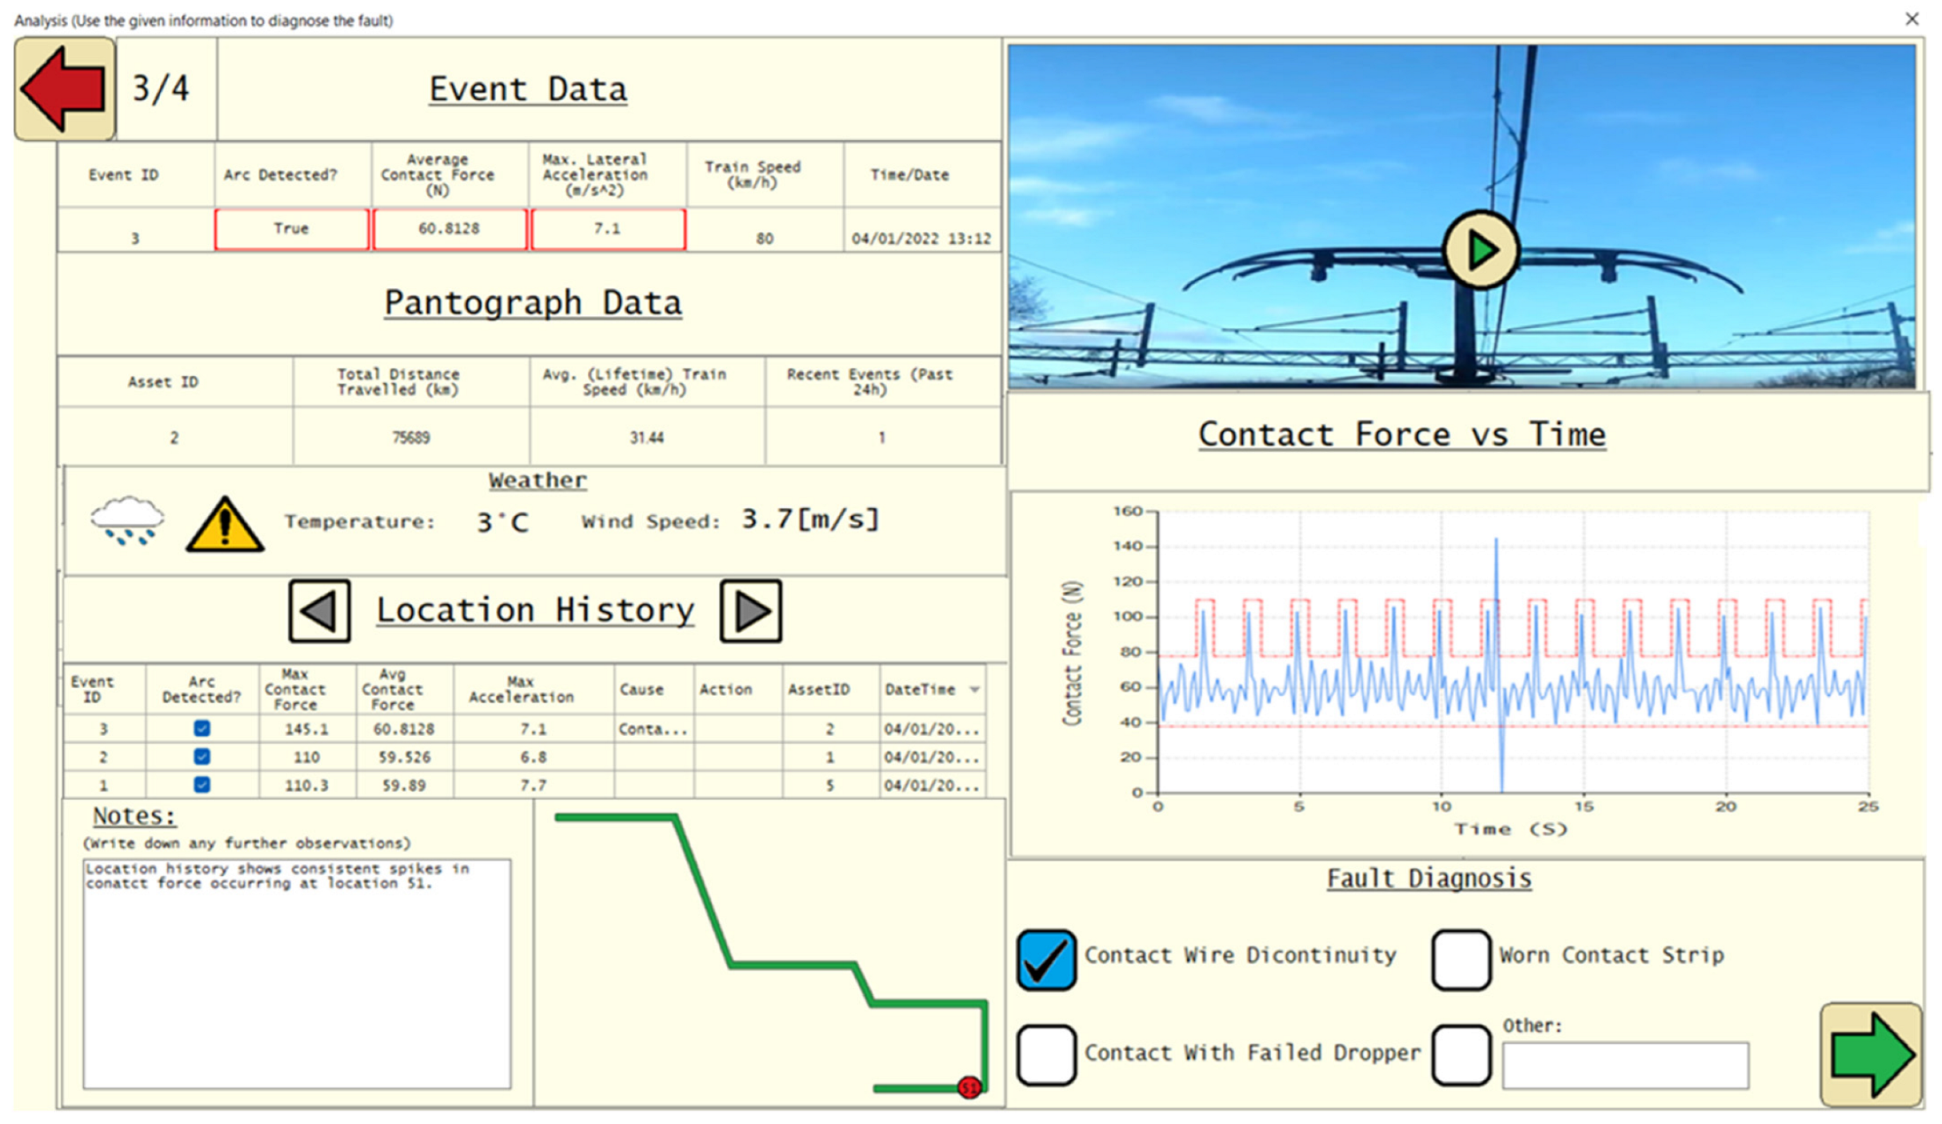
4.3. Stage 3—Analysis

The analysis screen (Figure 6) assists the user in finding the cause of the fault by providing all of the same data as that in Stage 2—Acceptance with the addition of a section where the user can choose between the recent history of the location that the current event occurred at, and the recent history of the pantograph that recorded the current event. This allows the use to assess historical antecedents to the fault, thereby supporting a judgement around its urgency.
This screen also provides a suggestion of the three most likely faults as predicted by the system, displaying a message explaining the range of data to expect for each fault type when the cursor is above each suggestion. If the user does not agree with the suggested faults, there is an option for them to enter their own fault type.
Once a fault type is selected and any observations are entered into the notes section, the green arrow is clicked to proceed to the final stage.

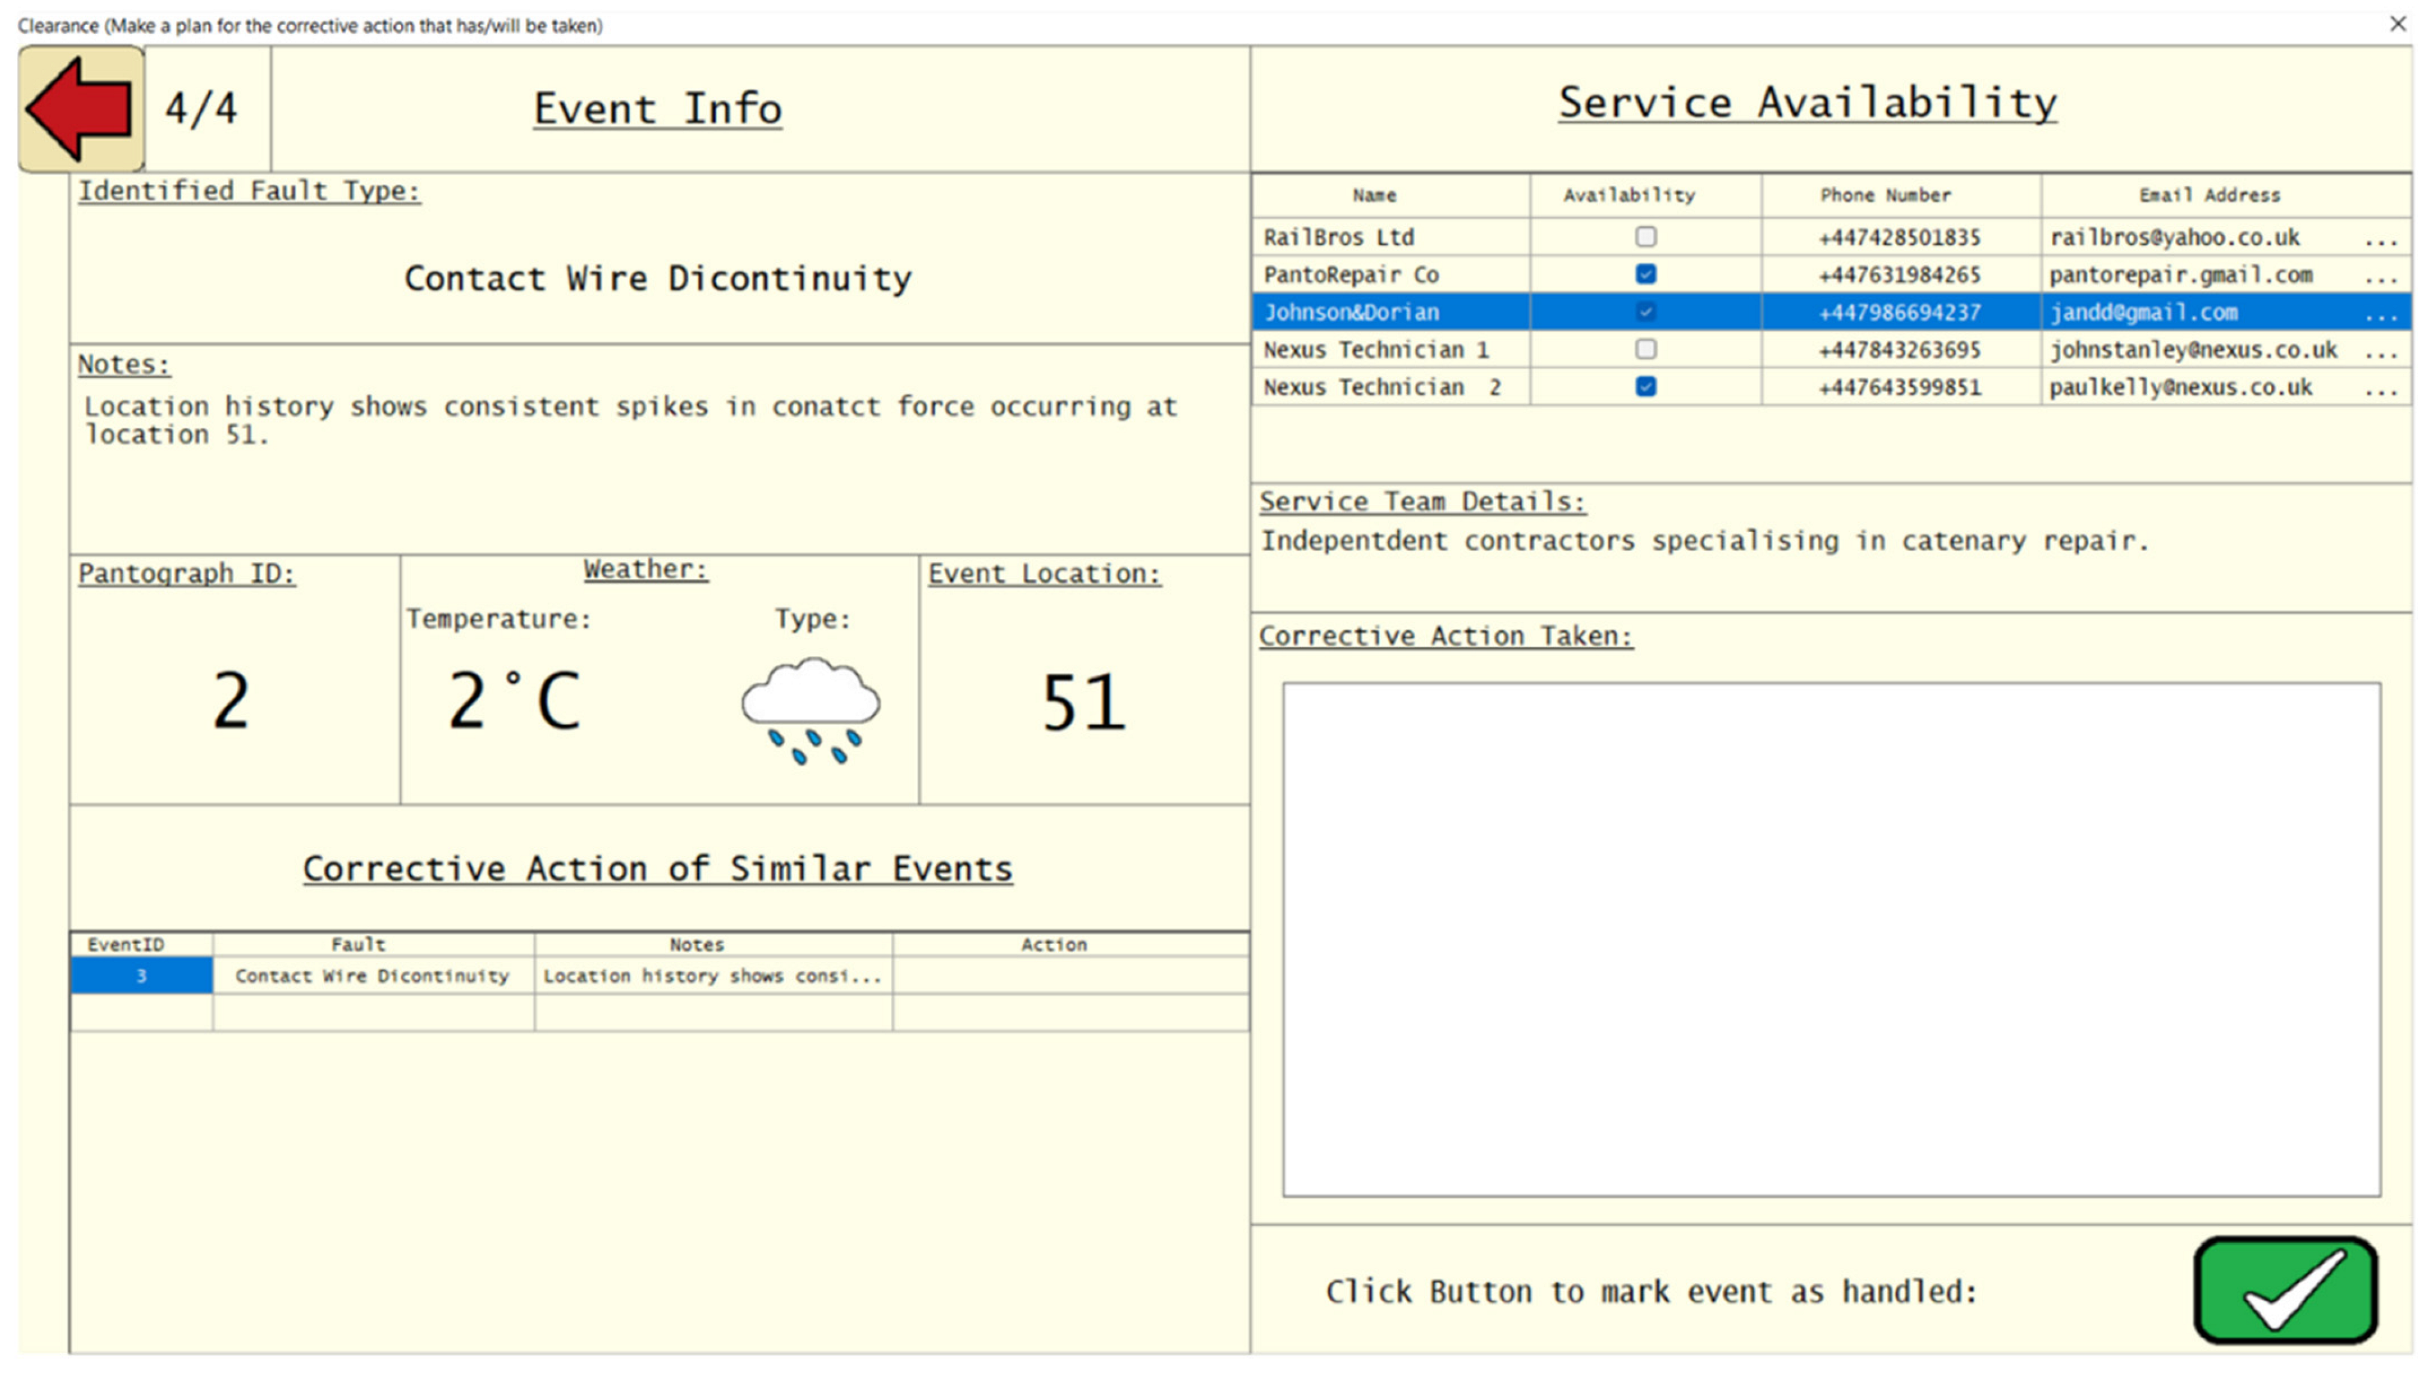
4.4. Stage 4—Clearance

In the clearance screen (Figure 7), the user is assisted in handling the fault by providing them with a list of the corrective actions taken for events of the same fault type. The user is also shown a list of all the service teams that are available, displayed along with their phone numbers and emails so the user can contact them, explaining their plan for resolving the issue. The user then clicks the green tick, marking the event as handled and returning them to the notification screen. Additionally, there is a section including information that may be useful to the service team conducting the repair, containing: the selected fault type and any notes made during the analysis stage, the ID of the pantograph that experienced the event, the current weather conditions, and the ID of the location at which the event occurred. Ideally, this will be prefilled with relevant information, thus reducing the risk of communication error between the RCM operator and maintenance technicians in the field.

5. Subject Matter Validation

5.1. Methodology

5.1.1. Participants

To validate the HMI design, interviews were conducted with six subject matter experts. The participants chosen came from a range of backgrounds. Three worked on the infrastructure and OLE side, two on the rolling stock side, and one human factors expert whose work focuses on the railway condition monitoring and maintenance processes. Of the infrastructure-focused participants, two worked at a strategic level on aspects of OLE, with the other managing the day-to-day operation of an intercity railway system. The final participant from the infrastructure side was a rail systems engineer specialising in railway electrification. From the rolling stock side, one participant worked as a project engineer for a rolling stock leasing company working with train operating companies to improve the reliability and safety of their trains, and the other managed the performance of a fleet operating on an intercity railway system. Two participants had direct experience of the Metro system under exploration, and all others had sufficient rail experience (including of metro operations) to understand the principles being presented, which was part of the selection process for interviewees. Participant experience in the rail sector ranged between 8 and 40 years.

5.1.2. Materials

The interviews were semi-structured and comprised a series of open questions, split into three sections. The first set of questions aimed to gain an understanding of common faults and problems faced during the implementation and operation of RCM systems. This was to validate user requirements and understanding of the context [33]. The second set of questions worked through each of the screens (discussed in Section 4) to determine which features are most useful for making the required decisions as well as to look for advice on additional features or changes to the design to better meet the user requirements. The third set aimed to discuss the decision-making process as a whole, also looking to validate and re-specify requirements as needed. In this manner, the second and third phases of discussion formed the evaluation and interpretation phases of a traditional usability cooperative evaluation [42].

5.1.3. Procedure

The study was approved through the Newcastle University School of Engineering Ethics Procedure Ref 28542/2022. Potential participants were contacted via email to gauge their interest in participation in the study. Subsequently, dates and times for an online interview were organised with the participants who replied showing interest. Once an interview was organised, the participant was sent a consent form explaining how the interview recordings would be used and stored in addition to the structure and general contents of the interviews; each of the participants replied, accepting the consent form. Interviews were conducted via Teams, and lasted approximately 45 min.

5.1.4. Analysis

The interview analysis used a semi-thematic analysis approach [43]. The process of analysing interviews consisted of watching the interview recordings, firstly to create a transcript for further analysis, and then once again purely to make notes and observations on the participants’ comments. After this, interview transcripts were produced and analysed to produce a set of themes. The recordings were then watched once again to ensure that none of the points made by participants were lost during the distillation process. Following this, a table was created showing each of the thematic responses to each of the questions alongside one another. Using this table, it was clear to see where interviewees gave similar responses or raised similar concerns. From this, the table was discussed amongst authors 1 and 2 of this paper, with repeated or particularly significant comments being highlighted, clarified and discussed in further detail.

5.2. Results

From the interview responses it is apparent that, for significant faults, the most valuable piece of information for identifying the validity and fault type is high-definition video footage of the pantograph and overhead line from a vehicle-mounted camera. Since this is a relatively recent development (as of 2023), it can be expensive to fit this camera to every pantograph of every train. Additionally, keeping the lenses clean from carbon dust can be difficult; this system assumes all vehicles are fitted with all sensors. However, the location and asset histories alongside the event data are more useful since they allow users to easily spot trends where a specific pantograph or location is consistently producing faults.
Information regarding faults does not only come from sensor data, but can come from many different sources; for example, drivers play a large role in reporting faults (experience makes them efficient at identifying OHLE sagging, insulators, excessive oscillations or bouncing of the OHLE) and members of the public can also call in to report issues.
The types of faults discussed In the interviews could be separated into three categories: faults relating to the condition of the overhead line equipment, faults relating to the condition of the pantograph, and faults caused by external factors. All of the faults discussed in Table 2 can eventually result in catastrophic failure due to dewirement; avoiding this should be the primary concern of any RCM system.
In terms of stages of cognition, all participants agreed that the overall process of Notification, Acceptance, Analysis, Clearance made sense as a fault handling process. However, multiple participants mentioned that the acceptance stage is less about identifying false alarms (which is still important) and more about the prioritisation of issues: to quote, ‘Does this need to be dealt with right now or can I (or someone else) look into it in more detail later?’
Feedback from experts was that there are two kinds of event type that the system should aim to assist with:
  • Where a significant issue has arisen, and the train needs to be stopped or pantograph needs to be dropped immediately to prevent further damage to the system. In this case, once it is clear that the train needs to be stopped the number of clicks should be minimized;
  • Where trends in the data show a developing issue that should be investigated and resolved before it develops into a significant issue.
In those situations where a significant, urgent event has arisen, it may be necessary to shortcut at least some of the process to immediately determine a course of action that may involve stopping one or more trains. Therefore, participants thought it was also useful to add a means of communicating directly with drivers if necessary.
Interviewees offered specific feedback on HMIs as follows.

5.2.1. Notification

The infographic displaying the locations where events have occurred, and if multiple events have been occurring at the same location, could be misleading, since it only gives an indication of the frequency of events as opposed to the severity. This could lead to situations where one significant event (e.g., the chipping of a pantograph contact strip due to a failed dropper) could go unnoticed because it is overshadowed by many insignificant events (e.g., lateral acceleration limits of the contact wire repeatedly being exceeded during periods of high wind).
One participant mentioned that the data in the table needed to be readable quickly, and also that using contact force as an indicator of fault severity requires understanding and experience with the system. Allowing customizability and allowing the user to specify their own limits, whilst highlighting values exceeding these, could improve rapid interpretation of the information whilst also teaching inexperienced users the range of values to expect.
A participant also suggested that including the speed of the train would help users gauge the severity of faults, and that including the ambient air temperature would also assist users in recognising faults that are more likely to occur in certain temperatures (arcing is unavoidable and much more common in icy weather [21]).

5.2.2. Acceptance

The wording “Is this clearly a false alarm?” was found to be confusing. The use of the word ‘clearly’, was intended to make the user only click yes if they are sure that it is a false alarm, forcing them think more carefully about their decision. Instead, it seemed to make interviewees think more about what the question was asking, rather than thinking more about the decision that needed to be made.

5.2.3. Analysis

There were mixed opinions on whether the fault type suggestion boxes could be misleading; most acknowledged that this would not be an issue if it was 100% accurate, but almost all participants mentioned that they should be treated with caution and that the prominence of decision support (taking up almost a quarter of the screen) could contribute to biases. Multiple recommendations suggested that it should be clear whether the event was an infrastructure or rolling stock fault, as this can be difficult in situations where one fault causes another. A system like this requires full data transparency from both the infrastructure and rolling stock sides, but this could be difficult as it requires information to cross organizational boundaries where there may be either a technical barrier to sharing data, or commercial reluctance to share information [36].

5.2.4. Clearance

There were multiple recommendations for implementing a feature that automatically produces an asset condition report or an event report to share with others. This finding was a reminder that the scope of usability goes beyond considering the immediate user of the RCM system, but needs to reflect the wider needs of a range of users and beneficiaries [9], and that the actions of the user persist over time as a corporate memory.

6. Discussion

The exercise of conveying pantograph behaviours and status through a structured HMI, and the feedback from experts, has demonstrated the general success of a cognitively-staged approach to RCM decision making. Furthermore, Table 3 presents some specific HMI requirements for additional information and features within the HMI. The outputs (architecture, design and evaluation outputs) also point to more structural and organizational considerations. From a technical and sensing standpoint, for a system like this to function efficiently, it requires a shared database that contains data from both vehicle and OHLE mounted sensors as well as accurate fault and service histories from both sides. In the UK, rolling stock and infrastructure are managed by separate organisations that, until recently, due to delay attribution systems, had been reluctant to openly share data [44]. For this reason, during the analysis stage, instead of recommending a fault type, if possible, it may be useful to all organisations that own assets that are part of the system to recommend whether the fault is caused by the pantograph or the OHLE. This comes with challenges, since it requires a complex set of accountability mechanisms, particularly where multiple train operators may be operating in the same part of the network. Such an issue may be seen as technical, functional or linked to business arrangements, but the impact on usability and the utility of the solution for an end-user cannot be ignored.
Furthermore, the theoretical fault detection system discussed in this paper used lateral acceleration of the contact wire as the primary method of detecting whether a pantograph contact strip is worn. In practice, accelerometers mounted to the contact wire would be costly and require significant maintenance. Instead, one of the other wear indicators discussed in Section 2.1 could be used as an alternative. One benefit of the architecture proposed in this paper is that it is agnostic to the underpinning data sets, with new data enhancing or replacing the data streams presented in the prototype HMIs. One area for future work is to understand the transferability of the conceptual architecture to other rail applications.
In terms of the HMI, the outcomes of the SME feedback also highlight that a typical “Red/Amber/Green” approach, which is often favoured by designers because of its simplicity [15], may obscure important information that is required in the diagnostic process. As noted by [32], the designer’s goal should not always be to aim for simplicity and usability, but rather to effectively represent the necessary complexity of the world being represented in the HMI.
However, one area where we had significant deviation from expected results was that, in some cases, the stepwise approach was too constricting and, for want of a better expression, slow for users. This was particularly true in the case of urgent issues that required an immediate response on the part of operators. Earlier work in rail alarm decision making [9,45] has also highlighted these shortcuts, and indeed such shortcuts are hallmarks of expert decision-making [46,47]. Therefore, future iterations of the HMI should accommodate such shortcuts within the HMI design.
The results of the SME input also highlighted the need for channels to communicate with others, either synchronously (through email notifications) or asynchronously (through notes and annotations that can be viewed by other users in the future [10]). This reiterates the wider organizational factors that must be considered in the design of remote condition monitoring systems [35,36]. After interviewing members of management from organisations relating to the infrastructure and rolling stock sides, it became clear that one cannot assume that a control room operator has an in-depth knowledge of the entire pantograph/OHLE system. This is because it is unlikely that the role of control room operators is to look solely for faults in this specific part of the railway system, and even if it was their sole job, they would be part of either a rolling stock- or infrastructure-focused organisation, likely resulting in a bias of knowledge toward one side. This reflects other work demonstrating the importance of considering pre-existing organizational processes in the user-centred design of remote condition monitoring systems [35] and the need for information to often cross organizational boundaries [36].
There are three key limitations to the work. First, the number of subject matter experts was small, though by no means exceptionally so for this phase of work [48]. Rather than this being the end of evaluation, the work here forms a first stage of formative evaluation to be expanded upon in further design iterations [33]. Second, the HMI demonstration was non-interactive, and ideally a higher-fidelity implementation should be developed next to allow quantitative data collection (e.g., in terms of time to process a fault, false detections, error rates, etc.). This would also support the use of survey approaches such as System Usability Scale [49] and A/B testing [50]. Third, this evaluation would be more robust, and the case for the theory be more substantial, if quantitative data for the proposed HMI were compared with data from a more conventional remote condition monitoring system. Once the limitations discussed above have been addressed, the next stage will be to reapply the proposed architecture and designs to a new rail asset context, such as other track assets or rolling stock, to assess transferability.

7. Conclusions

Remote condition monitoring systems are critical for maintaining oversight and continuity of rail asset functioning, particularly in the face of escalating climate impacts. While much attention has been paid to technical innovation in this area, there has been far less attention paid to the user-centred aspects of the technology, despite their importance to acceptance and useful functioning. This paper proposed an architecture based around cognitive stages, HMI designs and initial validation of the cognitive approach with subject matter experts. As such, this paper presents the next stage in the evolution and implementation of ideas that have been previously captured within observational work [9,11,15]. To be clear on the scope and applicability of this paper, the work presented does not present a user-centred design process for actual implementation. The intention is that the principles presented in the paper test a framework to guide future HMI design. Any efforts to build a user-centred HMI must use a full participation of users as specified in ISO9241-210 [33]. The aspiration is that the cognitive principles shown in the paper, and the kind of HMI guidance generated, will help to expedite and shape more usable RCM systems going forward. The results demonstrate the feasibility and utility of a design approach based on cognitive theory—specifically an approach that takes the user through a step-by-step approach to interpreting and managing alarms and information relevant to the pantograph and Overhead Line Electrification system. We note, however, the importance of shortcuts through the information, and the need to consider the wider organisational (and cross-organisational) context where the application would be deployed.

Author Contributions

Conceptualisation, D.G. and R.P.; software, J.R.; methodology, D.G., J.R. and R.P.; resources, D.G. and R.P.; data curation, J.R.; writing—original draft preparation, J.R.; investigation, J.R.; writing—review and editing, D.G., J.R. and R.P.; supervision, D.G.; project administration, D.G. All authors have read and agreed to the published version of the manuscript.

Funding

This research received no external funding.

Institutional Review Board Statement

The study was conducted in accordance with the Declaration of Helsinki, and approved by the Institutional Review Board (or Ethics Committee) of Newcastle University School of Engineering (28542/2022; approved 18 January 2023).

Informed Consent Statement

Informed consent was obtained from all subjects involved in the study.

Data Availability Statement

The data presented in this study are available on request from the corresponding author. The data are not publicly available due to privacy and ethical restrictions.

Conflicts of Interest

The authors declare no conflict of interest.

References

  1. Wilson, J.R.; Farrington-Darby, T.; Cox, G.; Bye, R.; Hockey GR, J. The railway as a socio-technical system: Human factors at the heart of successful rail engineering. Proc. Inst. Mech. Eng. Part F J. Rail Rapid Transit 2007, 221, 101–115. [Google Scholar] [CrossRef]
  2. Waterson, P.; Robertson, M.M.; Cooke, N.J.; Militello, L.; Roth, E.; Stanton, N.A. Defining the methodological challenges and opportunities for an effective science of sociotechnical systems and safety. Ergonomics 2015, 58, 565–599. [Google Scholar] [CrossRef] [PubMed]
  3. Palin, E.J.; Oslakovic, I.S.; Gavin, K.; Quinn, A. Implications of climate change for railway infrastructure. WIREs Clim. Chang. 2021, 12, e728. [Google Scholar] [CrossRef]
  4. Naweed, A.; Young, M.S.; Aitken, J. Caught between a rail and a hard place: A two-country meta-analysis of factors that impact Track Worker safety in Lookout-related rail incidents. Theor. Issues Ergon. Sci. 2019, 20, 731–762. [Google Scholar] [CrossRef]
  5. Rail Accident Investigation Branch (2020) Report 11/2020: Track Workers Struck by a Train at Margam. Available online: https://www.gov.uk/raib-reports/report-11-2020-track-workers-struck-by-a-train-at-margam (accessed on 15 June 2024).
  6. Márquez FP, G.; Schmid, F.; Collado, J.C. A reliability centered approach to remote condition monitoring. A railway points case study. Reliab. Eng. Syst. Saf. 2003, 80, 33–40. [Google Scholar]
  7. Hodge, V.J.; O’Keefe, S.; Weeks, M.; Moulds, A. Wireless sensor networks for condition monitoring in the railway industry: A survey. IEEE Trans. Intell. Transp. Syst. 2014, 16, 1088–1106. [Google Scholar] [CrossRef]
  8. Durazo-Cardenas, I.; Starr, A.; Turner, C.J.; Tiwari, A.; Kirkwood, L.; Bevilacqua, M.; Tsourdos, A.; Shehab, E.; Baguley, P.; Xu, Y.; et al. An autonomous system for maintenance scheduling data-rich complex infrastructure: Fusing the railways’ condition, planning and cost. Transp. Res. Part C Emerg. Technol. 2018, 89, 234–253. [Google Scholar] [CrossRef]
  9. Dadashi, N.; Golightly, D.; Sharples, S.; Bye, R. Intelligent Infrastructure: User-Centred Remote Condition Monitoring; CRC Press: Boca Raton, FL, USA, 2023. [Google Scholar]
  10. Emmanouilidis, C.; Pistofidis, P.; Fournaris, A.; Bevilacqua, M.; Durazo-Cardenas, I.; Botsaris, P.N.; Vassilis, K.; Christos, K.; Starr, A.G. Context-based and human-centred information fusion in diagnostics. IFAC-PapersOnLine 2016, 49, 220–225. [Google Scholar] [CrossRef]
  11. Dadashi, N.; Golightly, D.; Sharples, S. Modelling decision-making within rail maintenance control rooms. Cogn. Technol. Work. 2021, 23, 255–271. [Google Scholar] [CrossRef]
  12. Houghton, R.J.; Patel, H. Interface design for prognostic asset maintenance. In Proceedings of the 19th Triennial Congress of the IEA, Melbourne, Australia, 9–14 August 2015; Volume 9, p. 14. [Google Scholar]
  13. Vollert, S.; Atzmueller, M.; Theissler, A. Interpretable Machine Learning: A brief survey from the predictive maintenance perspective. In Proceedings of the 2021 26th IEEE International Conference on Emerging Technologies and Factory Automation (ETFA), Vasteras, Sweden, 7–10 September 2021; IEEE: New York, NY, USA, 2021; pp. 1–8. [Google Scholar]
  14. Goel, P.; Datta, A.; Mannan, M.S. Industrial alarm systems: Challenges and opportunities. J. Loss Prev. Process Ind. 2017, 50, 23–36. [Google Scholar] [CrossRef]
  15. Golightly, D.; Kefalidou, G.; Sharples, S. A cross-sector analysis of human and organisational factors in the deployment of data-driven predictive maintenance. Inf. Syst. e-Bus. Manag. 2018, 16, 627–648. [Google Scholar] [CrossRef]
  16. Cortés-Leal, A.; Cárdenas, C.; Del-Valle-Soto, C. Maintenance 5.0: Towards a worker-in-the-loop framework for resilient smart manufacturing. Appl. Sci. 2022, 12, 11330. [Google Scholar] [CrossRef]
  17. Stanton, N.A. Alarm initiated activities. In International Encyclopaedia of Ergonomics and Human Factors, 2nd ed.; Karwowski, W., Ed.; Taylor & Francis Group, LLC: Abingdon, UK, 2006; pp. 1008–1011. [Google Scholar]
  18. Zhang, D.; Gao, S.; Yu, L.; Kang, G.; Zhan, D.; Wei, X. A robust pantograph–catenary interaction condition monitoring method based on deep convolutional network. IEEE Trans. Instrum. Meas. 2019, 69, 1920–1929. [Google Scholar] [CrossRef]
  19. Xin, T.; Roberts, C.; Weston, P.; Stewart, E. Condition monitoring of railway pantographs to achieve fault detection and fault diagnosis. Proc. Inst. Mech. Eng. Part F J. Rail Rapid Transit 2020, 234, 289–300. [Google Scholar] [CrossRef]
  20. Keen, P.M. Monitoring overhead line equipment. In Proceedings of the IEE Current Collections for High Speed Trains Seminar (Ref. No. 1998/509), London, UK, 2 October 1998; IET: Birmingham, UK, 1998. [Google Scholar]
  21. Ostlund, S.; Gustafsson, A.; Buhrkall, L.; Skoglund, M. Condition monitoring of pantograph contact strip. In Proceedings of the 2008 4th IET International Conference on Railway Condition Monitoring, Derby, UK, 18–20 June 2008; IET: Birmingham, UK, 2008; pp. 1–6. [Google Scholar]
  22. Betts, A.; Hall, J.; Keen, P. Condition monitoring of pantographs. In Proceedings of the International Conference on Main Line Railway Electrification, North Yorkshire, UK, 25–28 September 1989; IET: Birmingham, UK, 1989. [Google Scholar]
  23. Karakose, M.; Yaman, O. Complex fuzzy system based predictive maintenance approach in railways. IEEE Trans. Ind. Inform. 2020, 16, 6023–6032. [Google Scholar] [CrossRef]
  24. Wei, X.; Jiang, S.; Li, Y.; Li, C.; Jia, L.; Li, Y. Defect detection of pantograph slide based on deep learning and image processing technology. IEEE Trans. Intell. Transp. Syst. 2019, 21, 947–958. [Google Scholar] [CrossRef]
  25. Na, K.M.; Lee, K.; Shin, S.K.; Kim, H. Detecting deformation on pantograph contact strip of railway vehicle on image processing and deep learning. Appl. Sci. 2020, 10, 8509. [Google Scholar] [CrossRef]
  26. Aydin, I. A new approach based on firefly algorithm for vision-based railway overhead inspection system. Measurement 2015, 74, 43–55. [Google Scholar] [CrossRef]
  27. Illingworth, J.; Kittler, J. A survey of the Hough transform. Comput. Vis. Graph. Image Process. 1988, 44, 87–116. [Google Scholar] [CrossRef]
  28. Aydin, I.; Karaköse, M.; Akin, E. A new contactless fault diagnosis approach for pantograph-catenary system. In Proceedings of the 15th International Conference MECHATRONIKA, Prague, Czech Republic, 5–7 December 2012; IEEE: New York, NY, USA, 2012; pp. 1–6. [Google Scholar]
  29. Ikeda, M.; Nagasaka, S.; Takayuki, A.U. A precise contact force measuring method for overhead catenary system. In Proceedings of the World Congress on Railway Research, Köln, Germany, 25–29 September 2001; pp. 1–12. [Google Scholar]
  30. Report 09/2015: Parting of Live Overhead Wire at Walkergate. GOV.UK. 2015. Available online: https://www.gov.uk/government/news/report-092015-parting-of-live-overhead-wire-at-walkergate (accessed on 22 April 2022).
  31. Dadashi, N.; Wilson, J.R.; Golightly, D.; Sharples, S. A framework to support human factors of automation in railway intelligent infrastructure. Ergonomics 2014, 57, 387–402. [Google Scholar] [CrossRef]
  32. Hollnagel, E.; Woods, D.A. Joint Cognitive Systems: Foundations of Cognitive Systems Engineering; CRC Press: Boca Raton, FL, USA, 2005; pp. 177–195. [Google Scholar]
  33. ISO DIS 9241-210; Ergonomics of Human System Interaction—Part 210: Human-Centred Design for Interactive Systems. International Organization for Standardization: Geneva, Switzerland, 2010.
  34. Aboelmaged, M.G. Predicting e-readiness at firm-level: An analysis of technological, organizational and environmental (TOE) effects on e-maintenance readiness in manufacturing firms. Int. J. Inf. Manag. 2014, 34, 639–651. [Google Scholar] [CrossRef]
  35. Ciocoiu, L.; Siemieniuch, C.E.; Hubbard, E.M. From preventative to predictive maintenance: The organisational challenge. Proc. Inst. Mech. Eng. Part F J. Rail Rapid Transit 2017, 231, 1174–1185. [Google Scholar] [CrossRef]
  36. Jonsson, K.; Holmström, J.; Levén, P. Organizational dimensions of e-maintenance: A multi-contextual perspective. Int. J. Syst. Assur. Eng. Manag. 2010, 1, 210–218. [Google Scholar] [CrossRef]
  37. Ingemarsdotter, E.; Kambanou, M.L.; Jamsin, E.; Sakao, T.; Balkenende, R. Challenges and solutions in condition-based maintenance implementation-A multiple case study. J. Clean. Prod. 2021, 296, 126420. [Google Scholar] [CrossRef]
  38. Garrone, A.; Minisi, S.; Oneto, L.; Dambra, C.; Borinato, M.; Sanetti, P.; Vignola, G.; Papa, F.; Mazzino, N.; Anguita, D. Simple Non Regressive Informed Machine Learning Model for Prescriptive Maintenance of Track Circuits in a Subway Environment. In Proceedings of the International Conference on System-Integrated Intelligence, Genova, Italy, 7–9 September 2022; Springer International Publishing: Cham, Switzerland, 2022; pp. 74–83. [Google Scholar]
  39. Nielsen, J. 10 Usability Heuristics for User Interface Design. Nielsen Norman Group. 2020. Available online: https://www.nngroup.com/articles/ten-usability-heuristics (accessed on 22 April 2022).
  40. Bhaskar, N.; Naidu, P.; Ravi Chandra Babu, S.; Govindarajulu, P. General Principles of User Interface Design and Websites. Int. J. Softw. Eng. IJSE 2011, 2, 45–60. [Google Scholar]
  41. Dixon, S.R.; Wickens, C.D.; McCarley, J.S. On the independence of compliance and reliance: Are automation false alarms worse than misses? Hum. Factors 2007, 49, 564–572. [Google Scholar] [CrossRef] [PubMed]
  42. Følstad, A.; Hornbæk, K. Work-domain knowledge in usability evaluation: Experiences with Cooperative Usability Testing. J. Syst. Softw. 2010, 83, 2019–2030. [Google Scholar] [CrossRef]
  43. Hignett, S.; McDermott, H. Qualitative methodology. In Evaluation of Human Work; CRC Press: Boca Raton, FL, USA, 2015; pp. 119–138. [Google Scholar]
  44. Golightly, D.; Easton, J.M.; Roberts, C.; Sharples, S. Applications, value and barriers of common data frameworks in the rail industry of Great Britain. Proc. Inst. Mech. Eng. Part F J. Rail Rapid Transit 2013, 227, 693–703. [Google Scholar] [CrossRef]
  45. Dadashi, N.; Wilson, J.R.; Golightly, D.; Sharples, S.; Clarke, T. Practical use of work analysis to support rail electrical control rooms: A case of alarm handling. Proc. Inst. Mech. Eng. Part F J. Rail Rapid Transit 2013, 227, 148–160. [Google Scholar] [CrossRef]
  46. Naikar, N.; Moylan, A.; Pearce, B. Analysing activity in complex systems with cognitive work analysis: Concepts, guidelines and case study for control task analysis. Theor. Issues Ergon. Sci. 2006, 7, 371–394. [Google Scholar] [CrossRef]
  47. Rasmussen, J. Information Processing and Human-Machine Interaction: An Approach to cognitive Engineering; North-Holland: New York, NY, USA, 1986. [Google Scholar]
  48. Bevan, N.; Barnum, C.; Cockton, G.; Nielsen, J.; Spool, J.; Wixon, D. The “magic number 5” is it enough for web testing? In Proceedings of the CHI’03 Extended Abstracts on Human factors in Computing Systems, Ft. Lauderdale, FL, USA, 5–10 April 2003; pp. 698–699. [Google Scholar]
  49. Bangor, A.; Kortum, P.T.; Miller, J.T. An empirical evaluation of the system usability scale. Intl. J. Hum.–Comput. Interact. 2008, 24, 574–594. [Google Scholar] [CrossRef]
  50. Quin, F.; Weyns, D.; Galster, M.; Silva, C.C. A/B testing: A systematic literature review. J. Syst. Softw. 2024, 211, 112011. [Google Scholar] [CrossRef]
Figure 1. Path of wire on contact strip in good condition (adapted from [28]).
Applsci 14 05801 g001
Figure 2. Path of wire on contact strip in worn condition (adapted from [28]).
Applsci 14 05801 g002
Figure 3. High-level system view.
Applsci 14 05801 g003
Figure 4. Notification HMI.
Applsci 14 05801 g004
Figure 5. Acceptance HMI.
Applsci 14 05801 g005
Figure 6. Analysis HMI.
Applsci 14 05801 g006
Figure 7. Clearance HMI.
Applsci 14 05801 g007
Table 1. Identification of potential data types for pantograph RCM.
InformationDataData Recording Method(s)
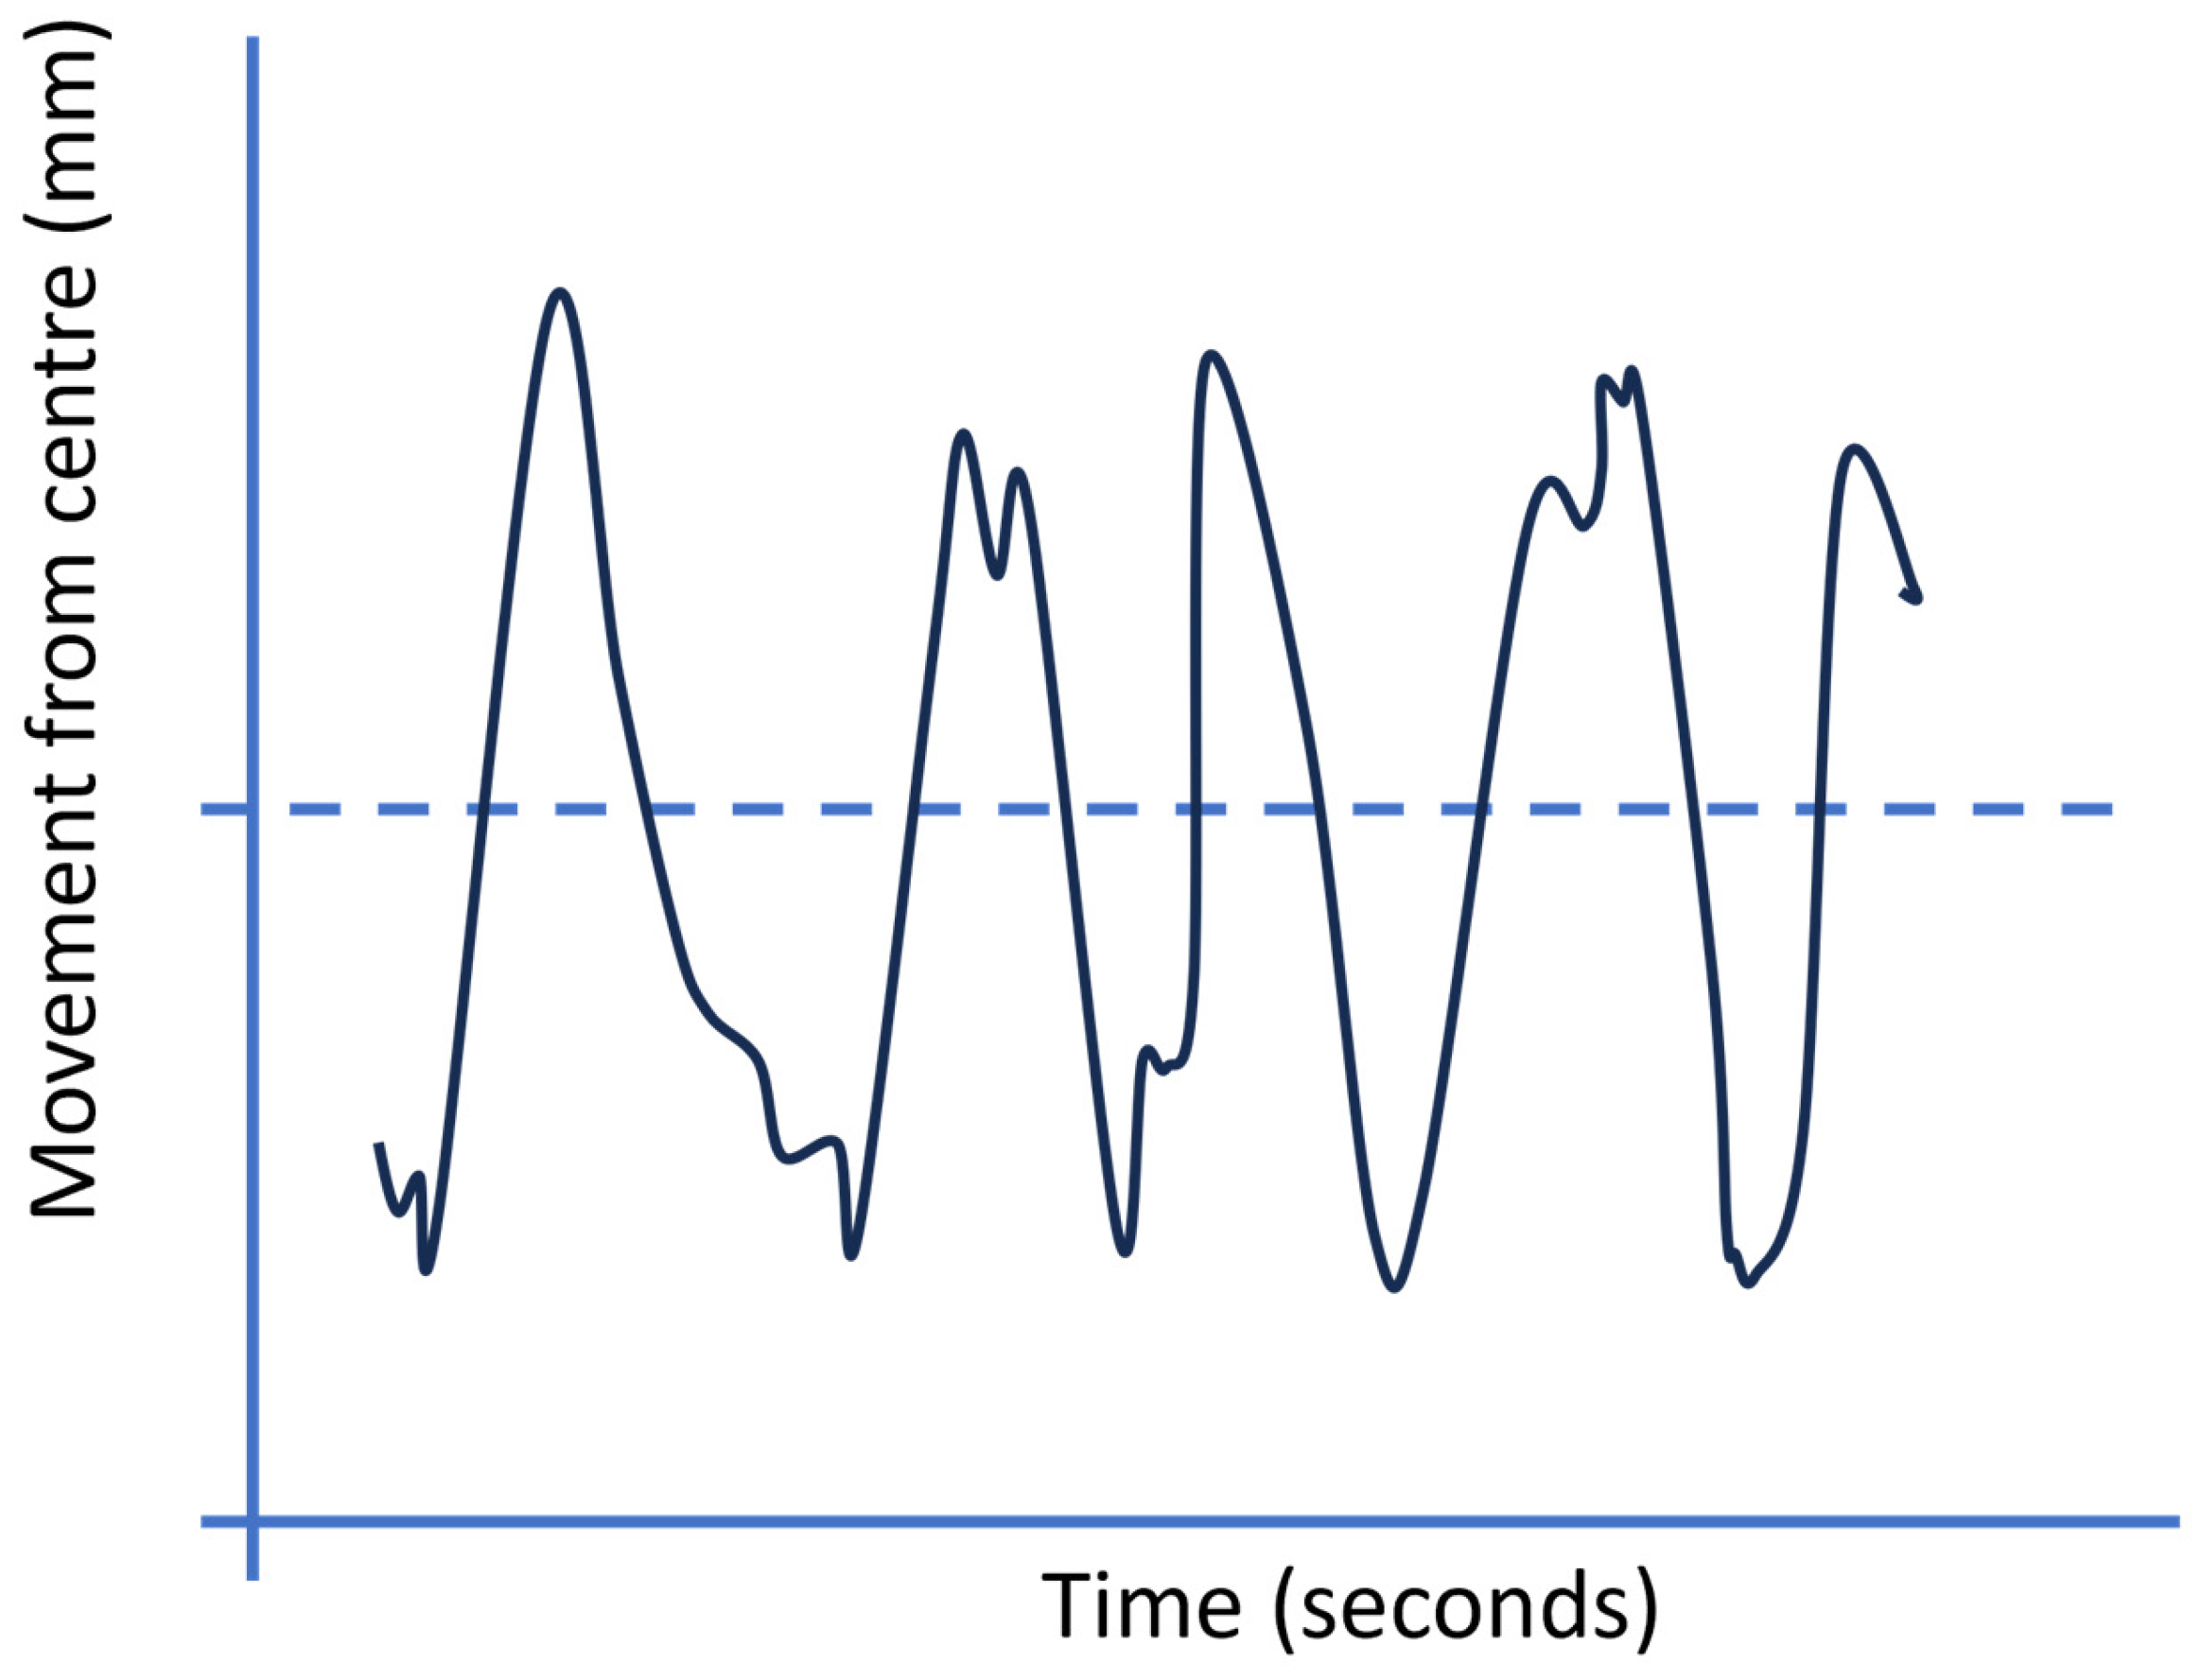
Indication of pantograph contact strip conditionMaximum lateral acceleration (m/s2) of the contact wire at the most recently passed sensor


Average train speed (km/h) over contact strip lifetime

Distance travelled (km) over contact strip lifetime
Optical accelerometers attached to the top of the contact wire oriented perpendicular to the direction of the tracks every 0.5 km [22] or a vison-based system [26] identifying movement parameters through machine learning


Average speed is calculated from wheel rotation using a digital counter on one of the train’s wheelset shafts: Speed (m/s) = Wheel Circumference (m) × Shaft rotations per second (rps)

Distance travelled also calculated from wheel rotation: Distance (m) = Wheel circumference (m) × Total number of shaft rotations
Risk posed by force between contact strip and contact wireContact force (N) over a 25 s periodWhen using the model described in [25] to calculate the dynamic contact force, for this low-speed application the new method described in [25] is not required and the vibration of subsystem 1 (the pantograph contact strip) can be treated as simple rigid-body motion. One accelerometer placed at the centre of the panhead can be used to calculate the inertial force and three load cells placed underneath the contact strip to measure the force of subsystem 2 (panhead) acting on subsystem 1 (contact strip).
Risk posed by the weatherWind speed (m/s)
Weather type
Ambient temperature (°C)
Using local weather available online
Risk posed by the presence of arcingWhether an arc is detected or not (Yes/No)Using video footage from a camera mounted to the roof of the vehicle that is analysed using a vision-based algorithm like that of the firefly algorithm used in [26].
Table 2. Pantograph fault triggers.
TypeFault
OHLE ConditionThinning of contact wire due to wear, resulting in eventual failure.
Failure/wear of section insulation
Contact wire height going out of tolerance
Contact wire stagger going out of tolerance
Failed droppers can cause damage to the pantograph contact strip.
Kinks/Imperfections in the contact wire can cause localised increases in wear as well as damage to the pantograph contact strip.
Bearings/points of movement seizing can result in incorrect contact wire height/tension
Pantograph ConditionThinning of the contact strip due to wear (particularly in icy weather) eventually results in damage to the contact wire or entanglement. Additionally, the build-up of carbon dust can cause a breakdown of insulation.
The seizing of a bearing or the failure of the pantograph air supply can result in the arm exerting the incorrect pressure on the contact wire.
External FactorsWind can cause objects like plastic bags or tree branches to wrap themselves around overhead line equipment.
Trespass and vandalism, particularly shoes thrown over the OHLE, can cause catastrophic failure.
The accumulation of dirt in tunnels or under bridges
Bird strikes can damage pantographs though arcing as well as direct impact.
Table 3. Additional information requirements for HMIs.
ScreenNotificationAcceptanceAnalysisClearance
Suggestions for additional features/
information
Train speed

Ambient temperature

Contact wire deviation

A colour coded indication of how far past the expected value something is, rather than a binary indication
Vehicle ID number

GPS Location

Number of times this alarm has happened in this area

History of any engineering works or repairs to this pantograph/location

A colour coded indication of how far past the expected value something is, rather than a binary indication
Suggestion of whether a fault is caused by infrastructure or rolling stock

Infographic to spot fault trends more easily

A colour coded indication of how far past the expected value something is, rather than a binary indication
Head code

Vehicle ID

Operating Company

Time/Date/User stamp for each cleared event

A feature that automatically sends a text/email with the fault information and corrective action to the chosen person/people

A feature to automatically produce a fault or condition report with one click
Disclaimer/Publisher’s Note: The statements, opinions and data contained in all publications are solely those of the individual author(s) and contributor(s) and not of MDPI and/or the editor(s). MDPI and/or the editor(s) disclaim responsibility for any injury to people or property resulting from any ideas, methods, instructions or products referred to in the content.

