Article

Performance—Based Route Selection for Mountainous Highways: A Numerical Approach to Addressing Safety, Hydrological, and Geological Aspects

by
Dalia Said
1,
Ahmed Foda
2,
Ahmed Abdelhalim
3 and
Mustafa Elkhedr
2,*
1
Traffic and Highway Engineering, Public Works Department, Faculty of Engineering, Cairo University, Giza 12311, Egypt
2
Irrigation and Hydraulics Department, Faculty of Engineering, Cairo University, Giza 12311, Egypt
3
Geology Department, Faculty of Sciences, Cairo University, Giza 12311, Egypt
*
Author to whom correspondence should be addressed.
Appl. Sci. 2024, 14(13), 5844; https://doi.org/10.3390/app14135844
Submission received: 15 May 2024 / Revised: 26 June 2024 / Accepted: 28 June 2024 / Published: 4 July 2024
(This article belongs to the Special Issue Vehicle Safety and Crash Avoidance)

Abstract

:
This study presents an innovative methodology for Highway Route Selection (HRS), specifically tailored for mountainous terrains. The approach focuses on selecting the most suitable route for road alignment while prioritizing road safety and hydrological and geological considerations. Through systematic analysis, the methodology evaluates alternative road alignments by examining various risk factors related to geometric design, hydrological, and geological impacts. Utilizing Fault-Tree Analysis (FTA), 14 key design factors related to geometric design and environmental factors are identified. The results demonstrate the effectiveness of the methodology in selecting road alignments that enhance safety and mitigate environmental risks. A case study is presented where a 90-km segment of a road in Egypt’s Golden Triangle Project, characterized by challenging terrain and diverse geological features, is examined. Through detailed analysis, the study identifies critical design factors to enhance road safety and minimize environmental impact. The methodology’s comprehensive approach offers insights into road design, providing a quantitative framework for decision-making and mitigation strategies.

1. Introduction

Road safety is a global concern, with road crashes causing approximately 1.3 million deaths and 20–50 million injuries worldwide each year [1]. In Egypt, the World Health Organization (WHO) reported 9217 deaths from road crashes in 2018, constituting 1.89% of total deaths. The primary causes identified were speeding and reckless driving [1].
An examination of national crash statistics on rural highways in Egypt revealed that vehicle rollovers (27.80%) and excessive speed (20.20%) were the leading causes, together contributing to 48% of the crashes. These incidents were particularly prevalent on rural highways, influenced by factors like road alignment and speed behavior.
In mountainous regions, conventional geometric design approaches based on standards may prove insufficient to meet the safety and performance requirements of highways. Mountainous roads in rural areas present unique crash factors due to extreme topography and environmental conditions. Hazardous situations, such as restricted sight distance, seasonal environmental challenges, long-steep slopes with sharp curves, and consecutive sharp reverse curves, contribute to crash hotspots [2,3]. Additionally, foggy conditions, wet pavement surfaces, sharp curves, and steep slopes can lead to collisions [3,4]. The interaction of these factors may result in unforgiving road conditions and collision-prone alignments.
This study aims to adopt a performance-based highway design approach, considering geometric design, hydrological aspects, and geological factors to determine the optimal design alternatives with a focus on safety. When designing rural highways in mountainous regions, careful consideration of various factors, including safety, efficiency, and sustainability, should be taken. Recently, there has been a growing interest in performance-based design approaches, which enhance highway design based on various performance measures such as safety, mobility, and environmental impact [5]. NCHRP Report No. 839 suggests that traditional geometric design practices, relying on minimum standards, may not yield optimal solutions. Instead, the report proposes a process involving setting performance targets, establishing design criteria, generating and evaluating alternative designs, and selecting the preferred design. This flexible, data-driven approach to highway design decisions aims to balance competing objectives, resulting in safer and more efficient roadways.
This method assists transportation officials in effectively managing their investments, addressing system-level requirements, and achieving performance objectives with limited resources. It utilizes quantitative analyses to facilitate systematic decision-making for enhanced performance [5].
The paper will address the following key aspects:
  • Geometric Design Evaluation: The evaluation will focus on ensuring that all horizontal and vertical alignment elements adhere to design standards and align with driving behavior. This involves assessing elements such as horizontal curve length, radius, consecutive horizontal reverse curves, vertical curve designs incorporating stopping sight distances, allowable maximum and minimum grades, etc.
  • Hydrological Aspects: Attention will be given to hydrological aspects to ensure the long-term stability of the highway. This involves considerations related to water flow, drainage, and other water-related factors that could impact the road’s structural integrity over time.
  • Geological Aspects: Geological aspects will be examined to identify the rock type and properties of the study area. This information will be significant in determining the most suitable road path and addressing geological hazards that may affect the road’s construction and long-term stability.

1.1. Geometric Design Evaluation

This review examines how multiple factors contribute to road safety in infrastructure design. Traditionally, research has focused on isolated aspects like speed limits or individual geometric features. However, this paper highlights the importance of a comprehensive framework that considers the interaction between driver behavior and the entire road corridor.
This has been introduced in several previous studies. Zhang et al. [6] integrated Fault-Tree Analysis (FTA) and the Decision-Making Trial and Evaluation Laboratory (DEMATEL) process to spatial distribution and distance calculation, that were generated using GIS analysis and statistics techniques. The methodology was used to enhance the geometric design quality (GDQ) of mountainous highways by integrating geometric characteristics with crash data. This method emphasizes the importance of considering a range of factors in road safety evaluations.
Similarly, Jha [7] developed a GIS-based model to analyze various factors such as terrain, traffic volume, and environmental impact, to formulate a cost-effective and efficient highway design. This model allows for evaluating design alternatives and identifying potential environmental and social impacts of road construction.
Furthermore, Castro and De Santos-Berbel [8] used GIS to analyze the relationship between geometric design consistency and road sight distance on rural roads. Field surveys were used to collect data on geometric design consistency and road sight distance. GIS was then used to analyze the spatial distribution of these variables on a sample of rural roads, identifying patterns and correlations between the two variables, and highlighting the importance of consistent design throughout the roadway.

1.2. Hydrological Aspects

Hydrological aspects of highway design and their impact on road safety are another crucial consideration, especially in flood-prone areas. Blanton and Marcus [9] documented the vulnerability of roads in floodplains, emphasizing the need for regional analyses of flood risk. Youssef et al. [10] presented a methodology using remote sensing data to estimate flash flood risk for a specific road in Egypt. This approach is particularly relevant for our study, as it provides a model for incorporating real-time data into hydrological evaluations.
Zhang [11] and Liu et al. [12] proposed methodologies for adapting road designs to minimize floodplain encroachment and optimize traffic flow during floods. These methodologies align with our study’s aim to use HEC-RAS 2D software for simulating flood dynamics and informing flood mitigation strategies, thereby enhancing the long-term stability and safety of highway networks in mountainous regions [13].

1.3. Geological Aspects

Geological factors significantly influence the safety and stability of roads in mountainous regions. Understanding the physical and mechanical properties and characteristics of rocks and soils in an area is essential for designing stable highway alignments [14,15,16]. Smugala et al. [17] specifically addressed the risks associated with changing geological conditions and their potential to disrupt road infrastructure. Similarly, this paper emphasizes the importance of GIS-based geological mapping to implement scored segments with varying soil and rock properties that could impact the stability of highway structures.
By integrating these diverse considerations—geometric design, flood risk assessment, and geological mapping—a more comprehensive framework for road safety and infrastructure design can be achieved.

1.4. Integrated GIS-Based Assessment

Several studies have used GIS to optimize geometric design alignments, specifically on rural roads and mountainous highways. Zhang et al. [6] developed a model for assessing the quality of geometric design on mountainous highways using GIS. The authors developed a model that integrated road geometric characteristics (alignment, cross-section, and gradient) with crash data. The data was then processed using GIS software, including spatial analysis and data visualization tools. Performance indicators were developed to assess the quality of the geometric design of mountainous highways.
Similarly, Sadek et al. [18] proposed an integrated approach that combines geotechnical and environmental factors using GIS technology to support decision-making in highway design. They collected and analyzed data on soil characteristics, geology, topography, hydrology, and land use to create a comprehensive GIS database.
The use of GIS in this paper study aligns with the goal of adopting a performance-based design approach, which enhances decision-making by providing a detailed and holistic view of the road environment.

1.5. Research Objectives

This paper presents an advanced methodology for highway route selection (HRS), integrating various decision-making tools and analytical approaches such as GIS for the evaluation of design alternatives for mountainous highways while balancing hydrological and geological aspects. The innovative methodology encompasses a fault-tree analysis to systematically identify and analyze 14 critical design factors related to geometric design, and a Decision-Making Trial and Evaluation Laboratory (DEMATEL) to quantify the impacts of these safety factors, offering a quantitative measure of risk. GIS is utilized to integrate and visualize diverse datasets, facilitating a comprehensive evaluation of design alternatives by considering multiple aspects simultaneously and integrating critical design parameters, including horizontal and vertical alignment designs and hydrology and geology factors. This comprehensive approach, considering multiple aspects simultaneously, aims to achieve a design that not only enhances safety but also reduces costs, providing a visually clear and intuitive overview of the road alignment.

2. Methodology

Figure 1 presents the methodology proposed in this study to support the decision-making process in highway route selection (HRS). The methodology encompasses three main steps, as explained in this section:
  • Step 1: Determine crash risk factors using Fault Tree Analysis
  • Step 2: DEMATEL process to determine weights of design parameters to calculate safety ratings.
  • Step 3: GIS-based highway route selection

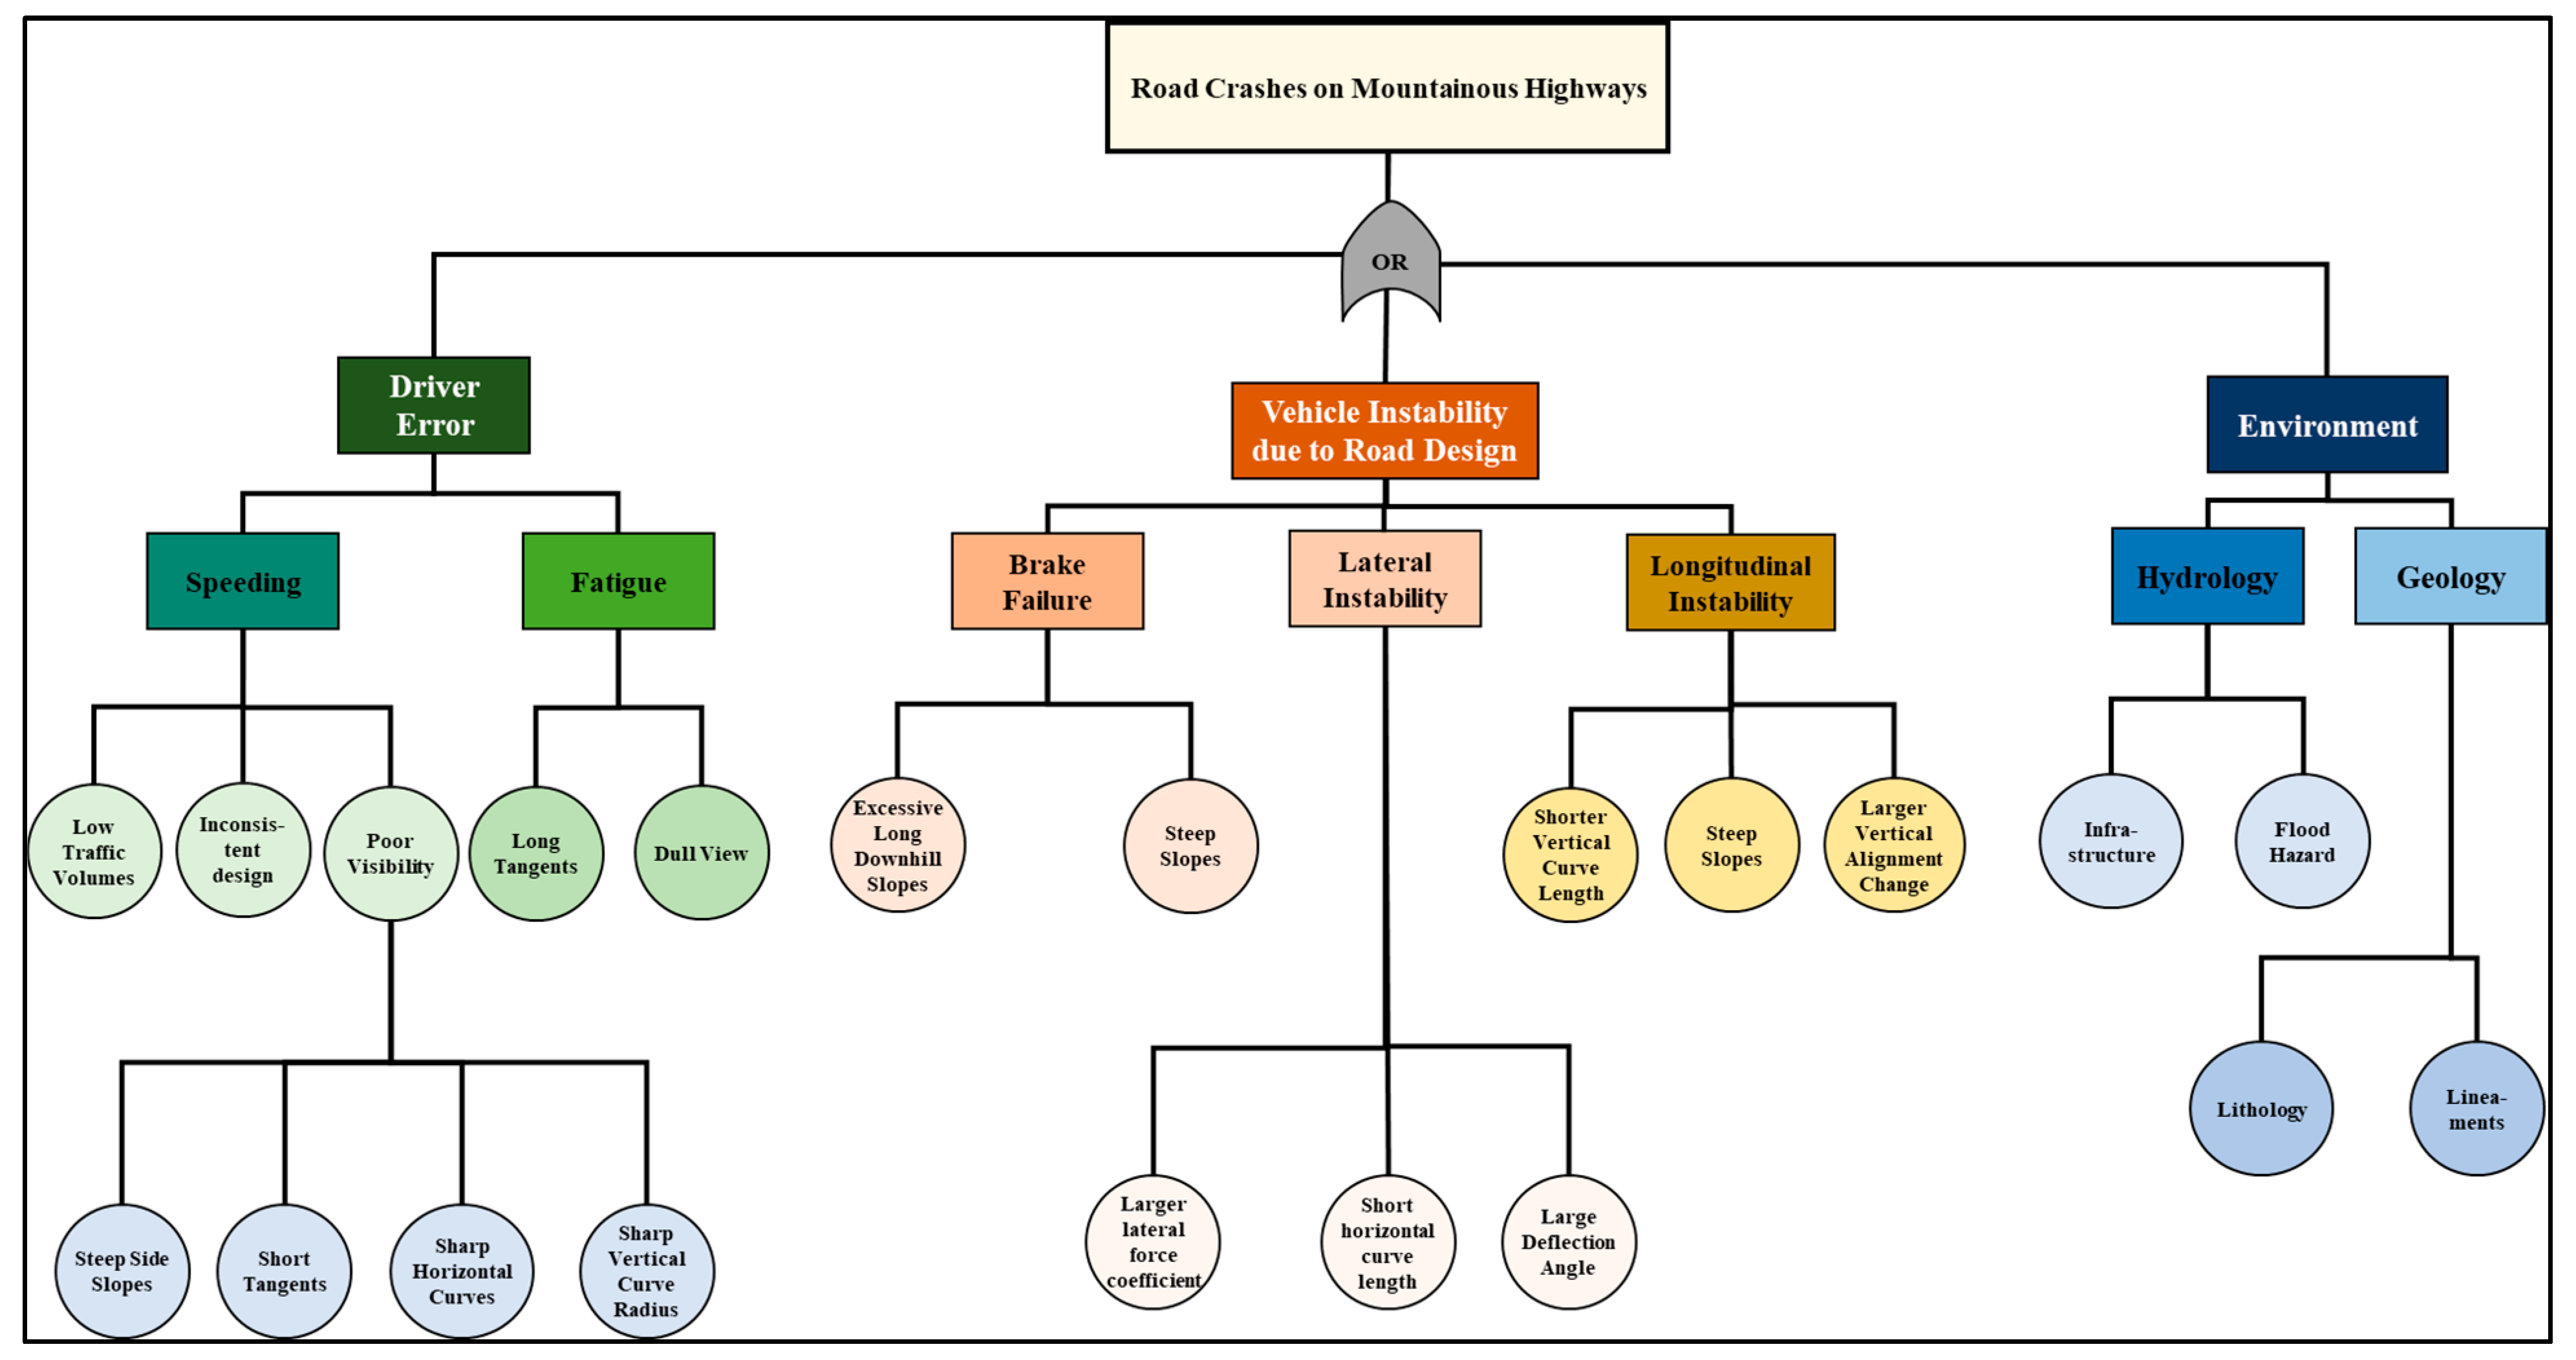
2.1. Determine Crash Risk Factors Using Fault Tree Analysis (FTA)

Crash causes are intricately linked to three primary transportation factors: driver behavior, the vehicle, and the environment. While statistics reveal that over 70% of crashes stem from driver behavior, it is the complex interplay among these factors that can either induce driver errors or intensify the impact of a crash.
Fault-Tree Analysis (FTA), recognized as a root cause analysis method for safety and risk management applications, is used to determine the causes of system failure and their probable reasons [6,11,19]. This approach aims to diagrammatically represent the failure chain of events. If the causes are identified, then corrective actions can help ensure that the problem does not reoccur.
Figure 2 shows the FTA developed in this study. In the case of this study, the top event is a crash on a mountainous highway, with causes associated with driver behavior, the vehicle, and the environment. Intermediate events linked to driver behavior include factors such as speeding, fatigue, or low visibility. The bottom events pertain to design parameters. These design parameters are risk factors that are associated with road safety. The design parameters require standardization since they have different units and risk impacts. A normalized risk intensity value (RIN) is computed, ranging from 1 (indicating the lowest risk intensity) to 10 (representing the highest risk intensity). Based on the value of the design factor (DFi), a corresponding risk intensity is assigned using the scale outlined in Table 1 based on [20,21].
For example, the road user may not be well informed about road risk due to several factors, as shown in the figure such as low traffic volumes, inconsistent design, or poor visibility (and hence a lack of adequate information), which may lead to risky attitudes such as speeding.

2.1.1. Driver Error

Design parameters influencing lower visibility include steep side slopes, short tangents, sharp horizontal curves, or sharp vertical curves. These factors can obstruct a driver’s line of sight and increase the crash risk. Additionally, fatigue is a significant driver behavior-related factor that can compromise road safety. Design parameters such as monotonous views or extended tangents, can contribute to heightened fatigue levels among drivers [22]. Thus, based on the Fault-Tree Analysis (FTA), critical highway design risk parameters have been identified for route selection.

2.1.2. Vehicle Instability Due to Road Design

While vehicle stability is addressed through AASHTO’s balance equation [20], where the minimum radius of a horizontal curve is determined based on the chosen design speed, design guidelines encourage using a radius larger than the minimum to enhance safety. Vehicle instability due to road design results from various design parameters associated with both lateral and longitudinal forces. For instance, lateral instability may arise due to a larger lateral force coefficient, a short horizontal curve length, or a significant deflection angle [6,23]. On the other hand, longitudinal instability may be attributed to a shorter vertical curve length, steep slopes, or substantial changes in vertical alignment [6]. These factors directly impact the stability and control of vehicles navigating mountainous highways, emphasizing the importance of selecting design parameters to mitigate the risk of vehicle instability and enhance overall road safety.
In this study, the horizontal curve radius is assessed simultaneously with other design factors. This evaluation considers the interaction of various factors that may collectively influence risk levels. The presence of multiple factors with certain risks can increase the overall risk factor as determined by the threat score.

2.1.3. Hydrological and Geological Factors

Hydrological dynamics, including rainfall patterns and flood hazards, pose significant risks to road infrastructure by impacting visibility, road stability, and overall driving conditions. Geological considerations, such as rock properties and terrain characteristics, play a role in determining road stability and susceptibility to geological hazards, such as landslides and rockfalls. When integrated into fault tree analysis, these environmental factors help identify potential root causes of road crashes, enabling a better design of roads.

Hydrological Investigations for Flood Hazard Mapping

Flood hazard maps help develop improved routes that prioritize safety from a hydrological perspective. This process involves several key steps:
  • Rainfall Analysis: A comprehensive statistical analysis of rainfall data is conducted to develop Intensity-Duration-Frequency (IDF) curves and design storms, recognizing rainfall as the primary driver of streamflow and vital for flood protection projects.
  • Catchment Delineation and Modeling: Digital Elevation Models (DEMs) with 30 × 30 m resolution are used to delineate streams and their corresponding external catchment areas impacting the proposed road alignments. A hydrological model is then constructed using HEC-HMS software to estimate runoff flows and hyetographs for the delineated catchments.
  • 2D Floodplain Modeling: Leveraging outputs from the hydrological model and high-resolution DEMs, a 2D model is developed in HEC-RAS to accurately map floodplains, water depths, and velocities. This information serves as the foundation for flood hazard assessment, with the rain-on-grid approach adopted to capture the nuances of flood characteristics within each stream segment.
  • Existing Flood Protection Structures: To comprehensively assess the flood risk for both the existing and proposed highway alignments, a thorough survey of existing flood protection structures was conducted. This evaluation helps in understanding the effectiveness of the current infrastructure against flooding events. Additionally, the survey will guide the integration of these structures into the design of the proposed alignments, ensuring they capitalize on available flood mitigation measures while minimizing potential disruptions during construction. A factor measuring this aspect will be considered in the proposed technique.
  • Flood Hazard Assessment: Recognizing the multifaceted nature of flood hazards, beyond flow characteristics, a comprehensive approach is implemented. While water depth and velocity remain the primary indicators, additional social, economic, and environmental factors are considered, albeit challenging to quantify. A bespoke code, utilizing the WRL formula and water depth/velocity data at each HEC-RAS time step, is developed to calculate the flood hazard index. This index, ranging from 1 (low hazard) to 6 (high hazard), is subsequently normalized to a scale of 1–10 for integrated analysis, as shown in Table 2.

Geological Criteria (Lithology and Lineaments Elements)

Rock properties play a significant role in environmental assessment and site selection for construction rather than the lineament elements of tectonic origin, such as faults, joints, contacts, and fractures [24]. In this study, rock types identified in the constructed geological map were classified into soft and hard types based on their origin. Hard rock refers to basement rock (igneous and metamorphic), while soft (weak) rock encompasses sedimentary rocks and alluvium deposits. Earth scientists often prefer a simple, fast, but reliable classification based on visual inspection of geological conditions. In 1997, ref. [25] introduced the Geological Strength Index (GSI), suitable for both hard and soft rock masses. According to the GSI, rocks are classified into five grades: intact/massive, blocky, very blocky, disturbed, and disintegrated. Similarly, the rock cover of the Red Sea Mountain chains can be classified into seven categories, as summarized in Table 3, where hard rocks are deemed unsuitable for roads and highways due to their rigid properties and high excavation costs. Conversely, soft and alluvium deposits facilitate easy excavation for road construction.
On the other hand, the rock categories can be combined with lineament density to characterize the discontinuities of the rock units across five classes, ranging from very good, good, fair, poor, to very poor [11,25,26]. Consequently, the lithological discontinuous character and lineament density indices are categorized into nine indices to be used in the DEMATEL process explained in the following section to assess the road design within specified ranges, as outlined in Table 4. This index is calculated automatically by using the algorithms Bit2line and line module provided by Geomatica PCI to convert DEM into a lineaments map. This line map was used to create an index based on the magnitude per unit area of the created line map, which was classified based on its histogram into nine ranges of gray scales supported by ArcGIS software.

2.2. Determining Design Parameters Weights

2.2.1. DEMATEL Process

DEMATEL is recognized as an effective analysis tool for identifying the cause-and-effect chain components within complex systems. This technique evaluates the interdependent relationships among factors, discerning critical ones through a visual structural model [27,28]. In the context of highway geometric design, especially in challenging conditions like mountainous regions, DEMATEL helps to understand the complex relationships between various design parameters. Based on previous research, Zhang et al. [6] utilized DEMATEL to assess the geometric design quality of highways. In this study, relationships between risk factors were established, the relative importance and net effect of risk factors were calculated, then normalized, and the weight of each risk factor was determined. This paper will adopt a similar methodology to comprehend the inter-relationships among different risk factors.
  • Step 1: Formulation of Matrices
    The process begins by creating three matrices: the direct-relation matrix (Z), the normalized direct-relation matrix (X), and the total-relation matrix (T) are formulated as shown in Equations (1)–(3).
    • Direct-Relation Matrix (Z): This matrix Z = ( z i j ) n × n represents the direct influence of factor i on factor j. Each element z i j is set to 1 if there is an influence, and 0 if there is not.
      Z = ( z i j ) n × n
    • Normalized Direct-Relation Matrix (X): The direct-relation matrix is normalized to form X = ( x i j ) n × n , ensuring that all values are between 0 and 1.
      X = ( x i j ) n × n = Z m a x j = 1 n z i j
    • Total-Relation Matrix (T): This matrix represents the overall influence and relationship among factors and captures both direct and indirect influences among factors. It is calculated using the formula:
      T = ( t i j ) n × n = X I X 1
      where (I) is the identity matrix or self-influencing factor, where diagonal elements equal to 1 and the remaining matrix is 0.
  • Step 2: Determining Relative Importance and Net Effect
    In this step, the distributing influence (Di) and receiving influence (Rj) for each factor are calculated.
    • Distributing Influence (Di): This is the total influence of factor i on other factors, calculated as the sum of the i-th row of the total-relation matrix.
      D i = j = 1 n t i j
    • Receiving Influence (Rj): This is the total influence received by factor j from other factors, calculated as the sum of the j-th column of the total-relation matrix.
      R j = i = 1 n t i j
      These values are then used to calculate the relative importance (qi) and net effect (ni) for each risk factor. Where:
      -
      Relative Importance (qi)
      qi = Di + Rj
      -
      Net effect (ni)
      ni = DiRj
    The relative importance (qi) indicates how important each factor is in relation to others, with a larger value indicating a closer relationship and higher importance. The net effect (ni) classifies factors into causal (positive values) and resultant (negative values), where causal factors have more influence.
  • Step 3: Normalizing Relative Importance
    To facilitate comparison, the relative importance (qi) is normalized to derive the weight of each factor (wi). The weight indicates the factor’s impact on traffic safety, with higher weights indicating more significant effects.
    w i = 1 1 + e q i
    The normalized weight (0 to 1) of each factor is then calculated as:
    w i = w i i = 1 i w i

2.2.2. DEMATEL Results

The results of the DEMATEL analysis are summarized in Table 1. The analysis shows that the design factor with the highest importance is the curve radius (qi = 2), followed by horizontal alignment change (angle of deflection) and vertical alignment change (qi = 1.83), horizontal curve length (qi = 1.33), and longitudinal grades (qi = 1.167).
Environmental hydrology and geological factors exhibit moderate relationships with other factors (qi = 0.67), while tangent length shows loose associations (qi = 0).
Moreover, causal factors were identified based on the net effect values (ni). Curve radius, environmental hydrology and geological factors, horizontal curve length, longitudinal grade, and vertical curve parameters have values of ni greater than 0, establishing them as causal factors. Consequently, they should be carefully considered in highway design as they significantly influence route selection.

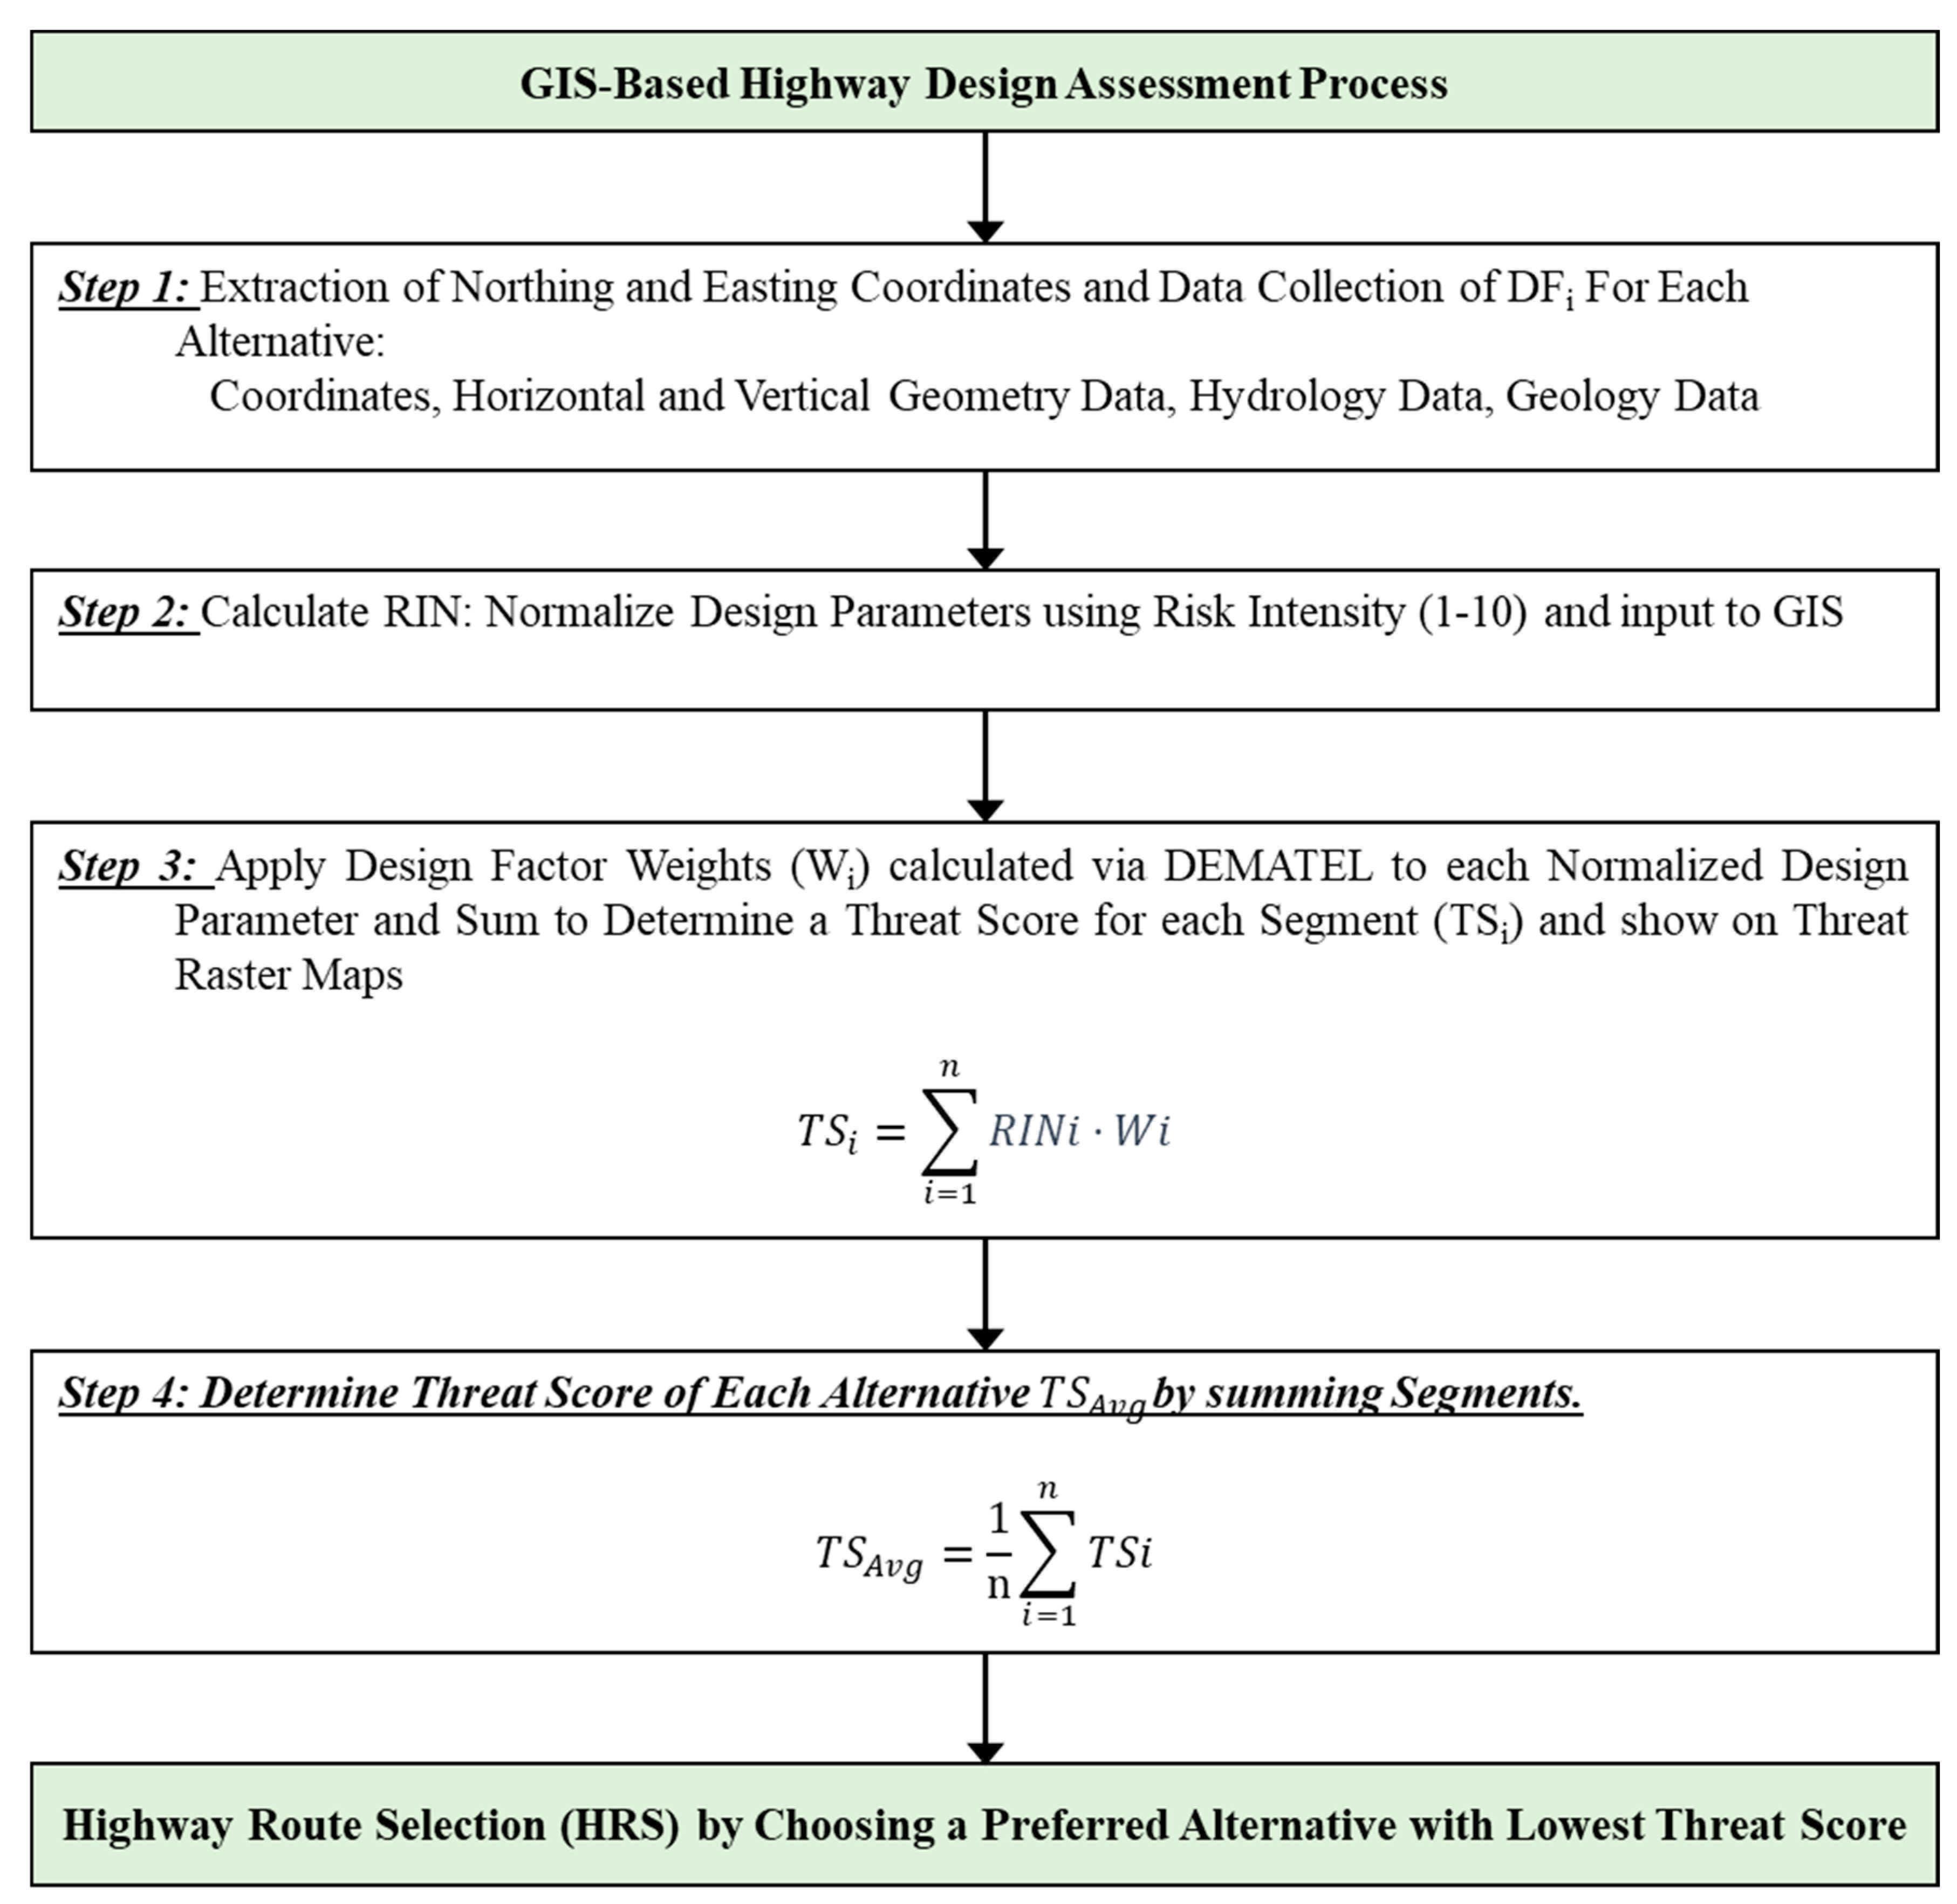
2.3. GIS-Based Highway Route Selection

The process of GIS-based Highway Route Selection (HRS) involves calculating the weighted risk intensity for each design factor to determine the threat score of each 20-m-long segment. Subsequently, the total threat score for each alternative is computed to choose the best route with the least threat. The following process is presented in Figure 3.
Step 1: 
An Excel-based computation is employed to initially tabulate northing and easting coordinates and geometric, hydrology, and geology design factors as outlined in Table 1 for each alternative. Figure 4 shows the Excel-based set-up.
Step 2: 
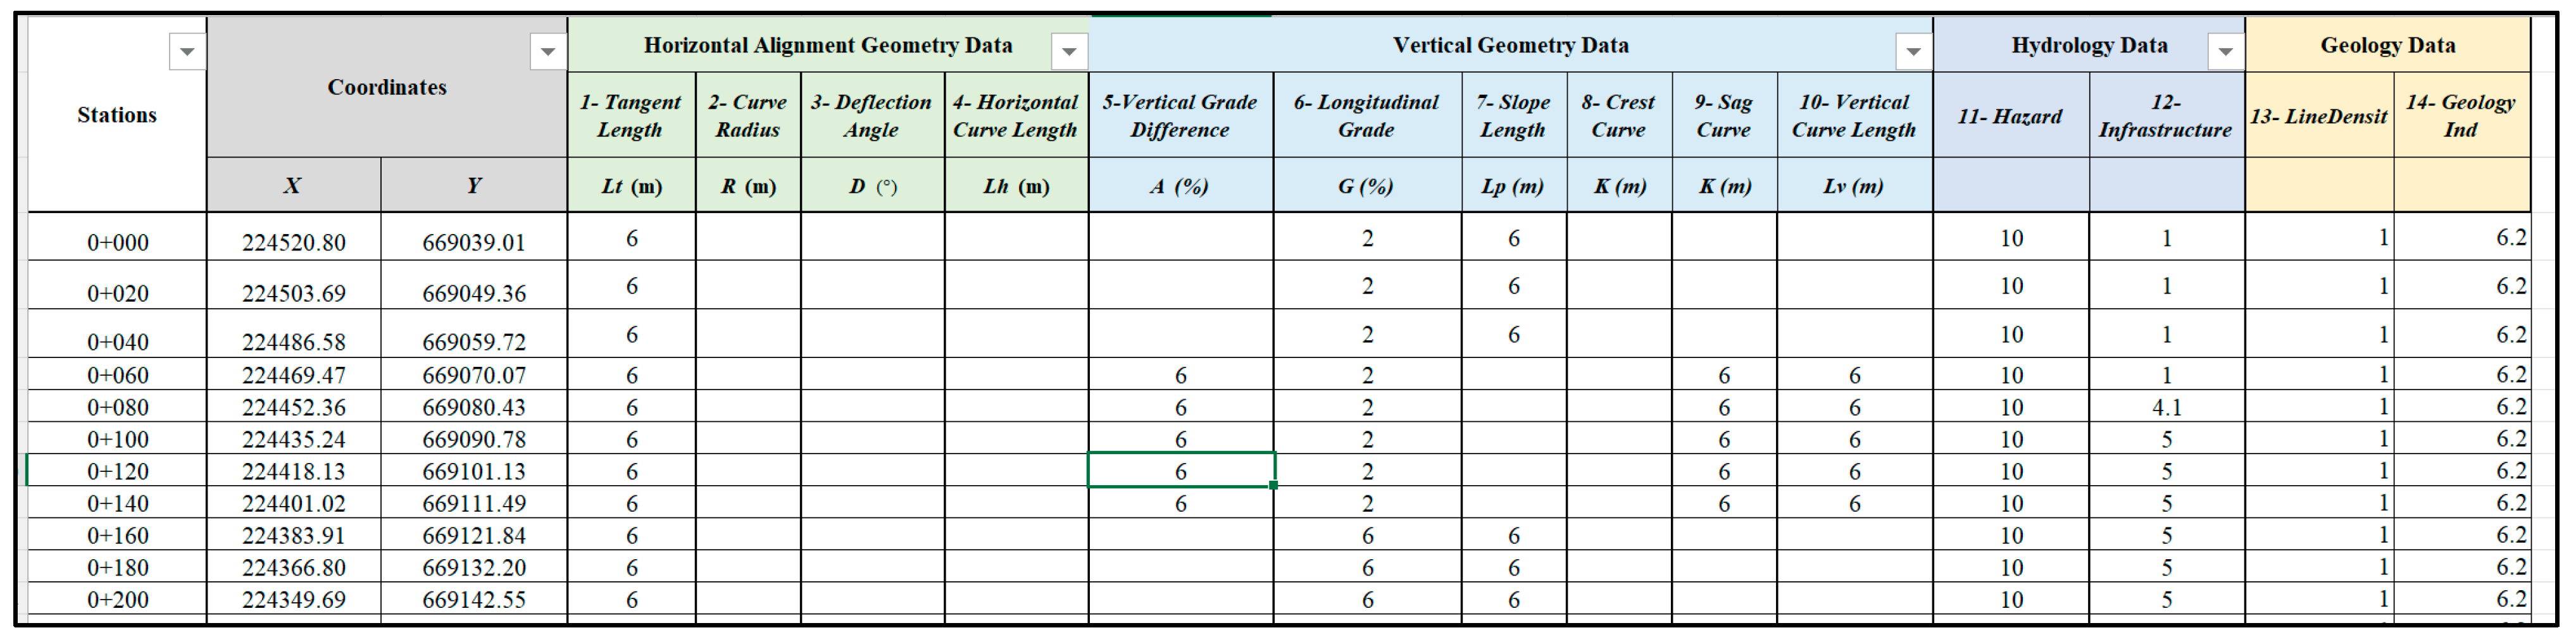
Next, the geometric and environmental characteristics are standardized by computing a normalized risk intensity value (RIN) ranging from 1 (indicating the lowest risk intensity) to 10 (representing the highest risk intensity). An example of Excel output is shown in Figure 5. Based on the value of the design factor (DFi), a corresponding risk intensity is assigned using the scale outlined in Table 1.
Step 3: 
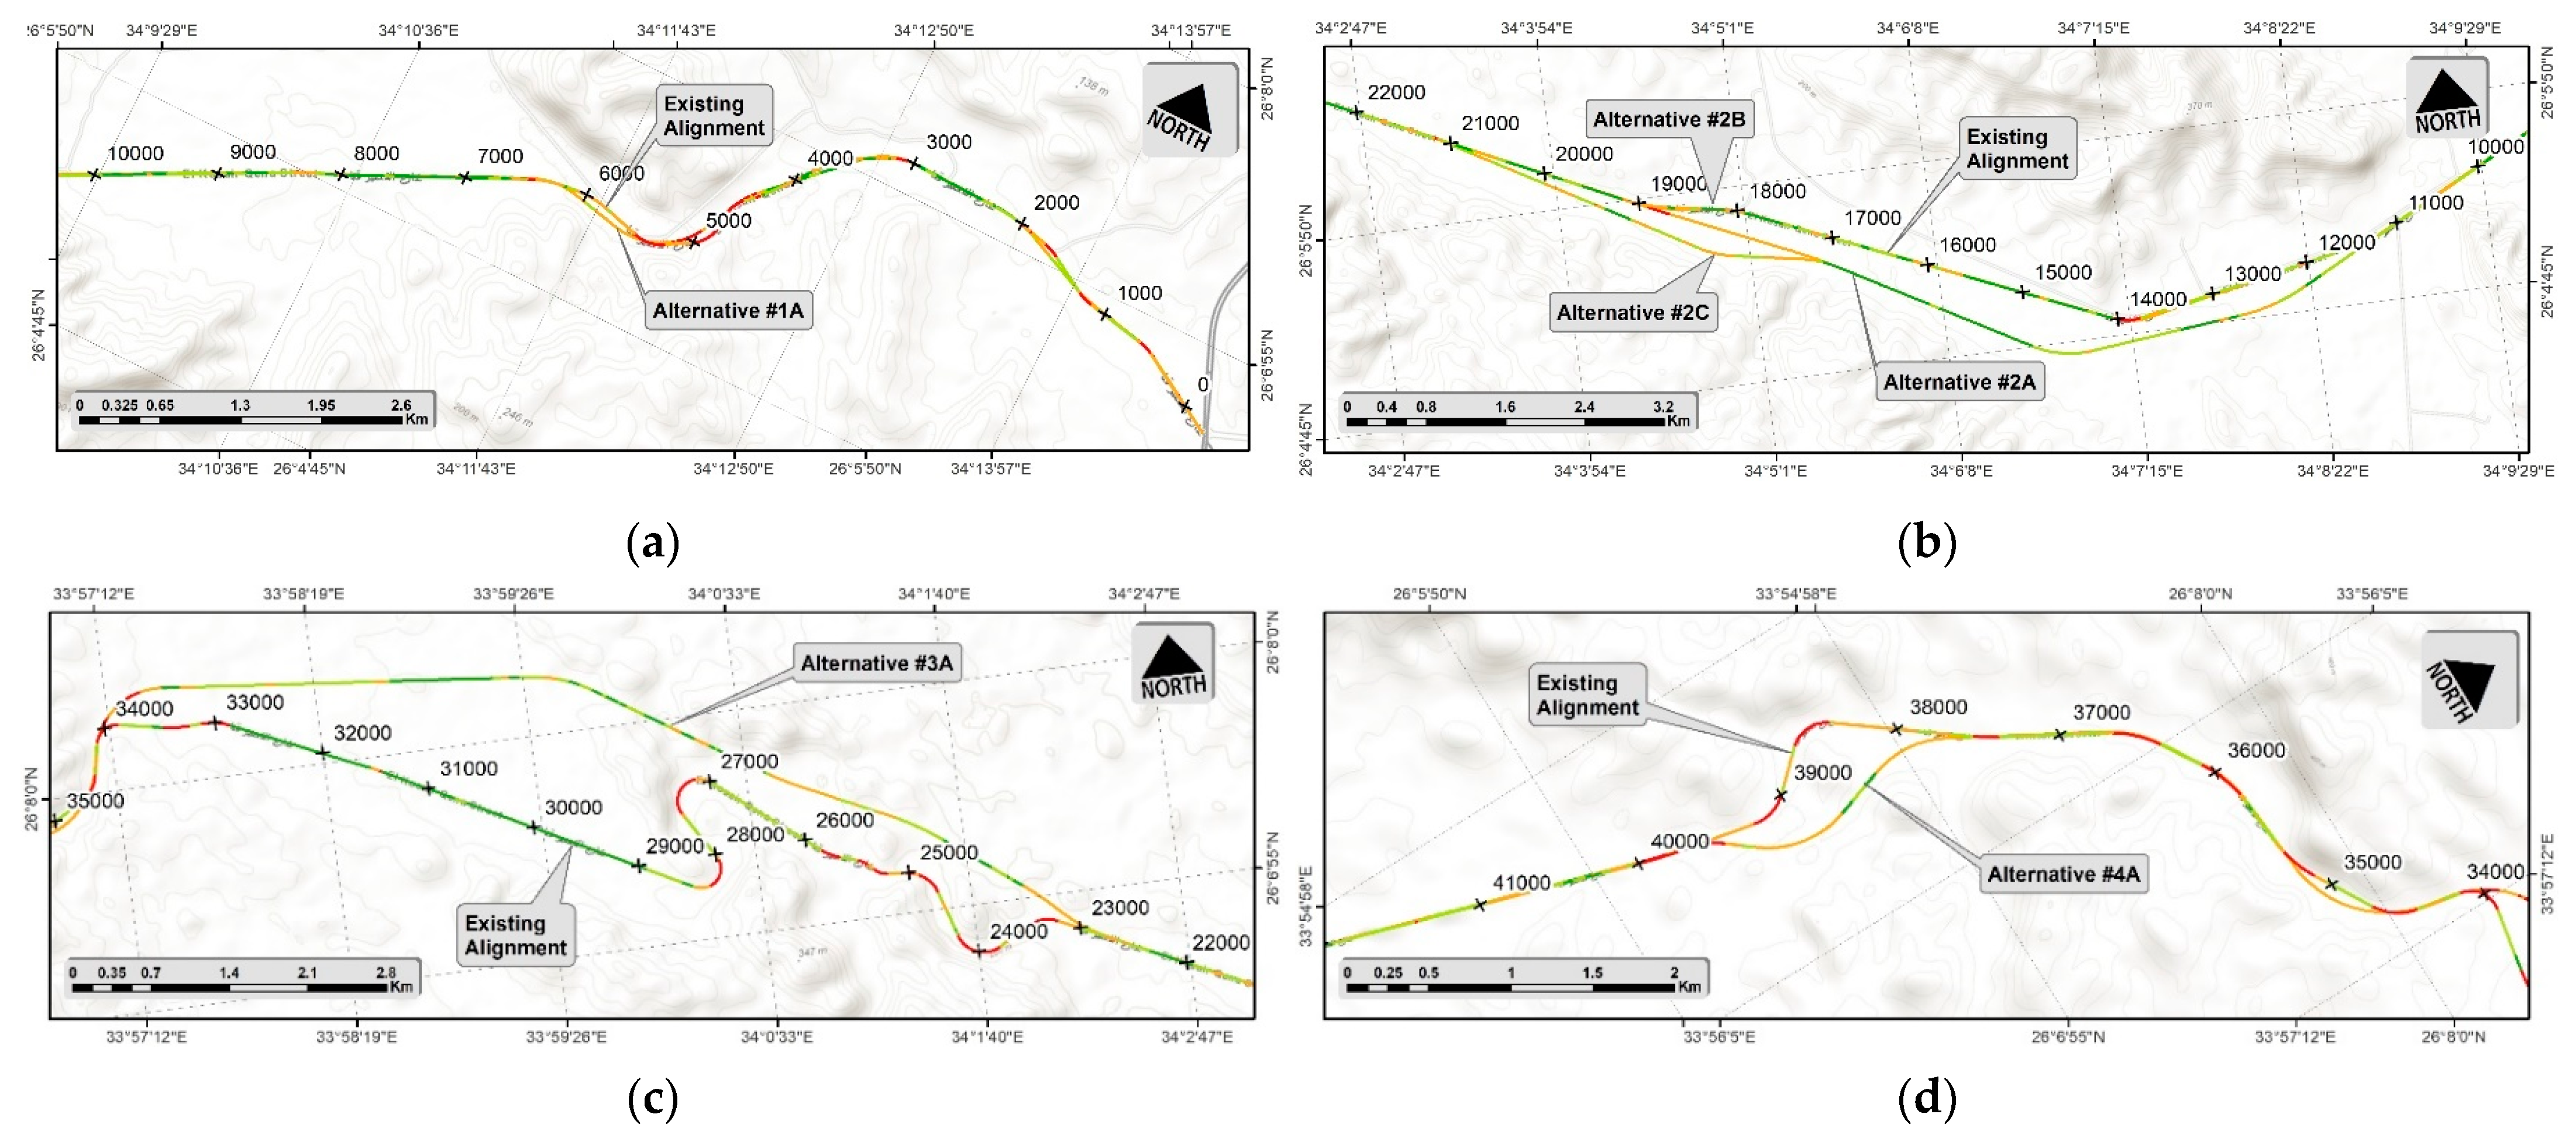
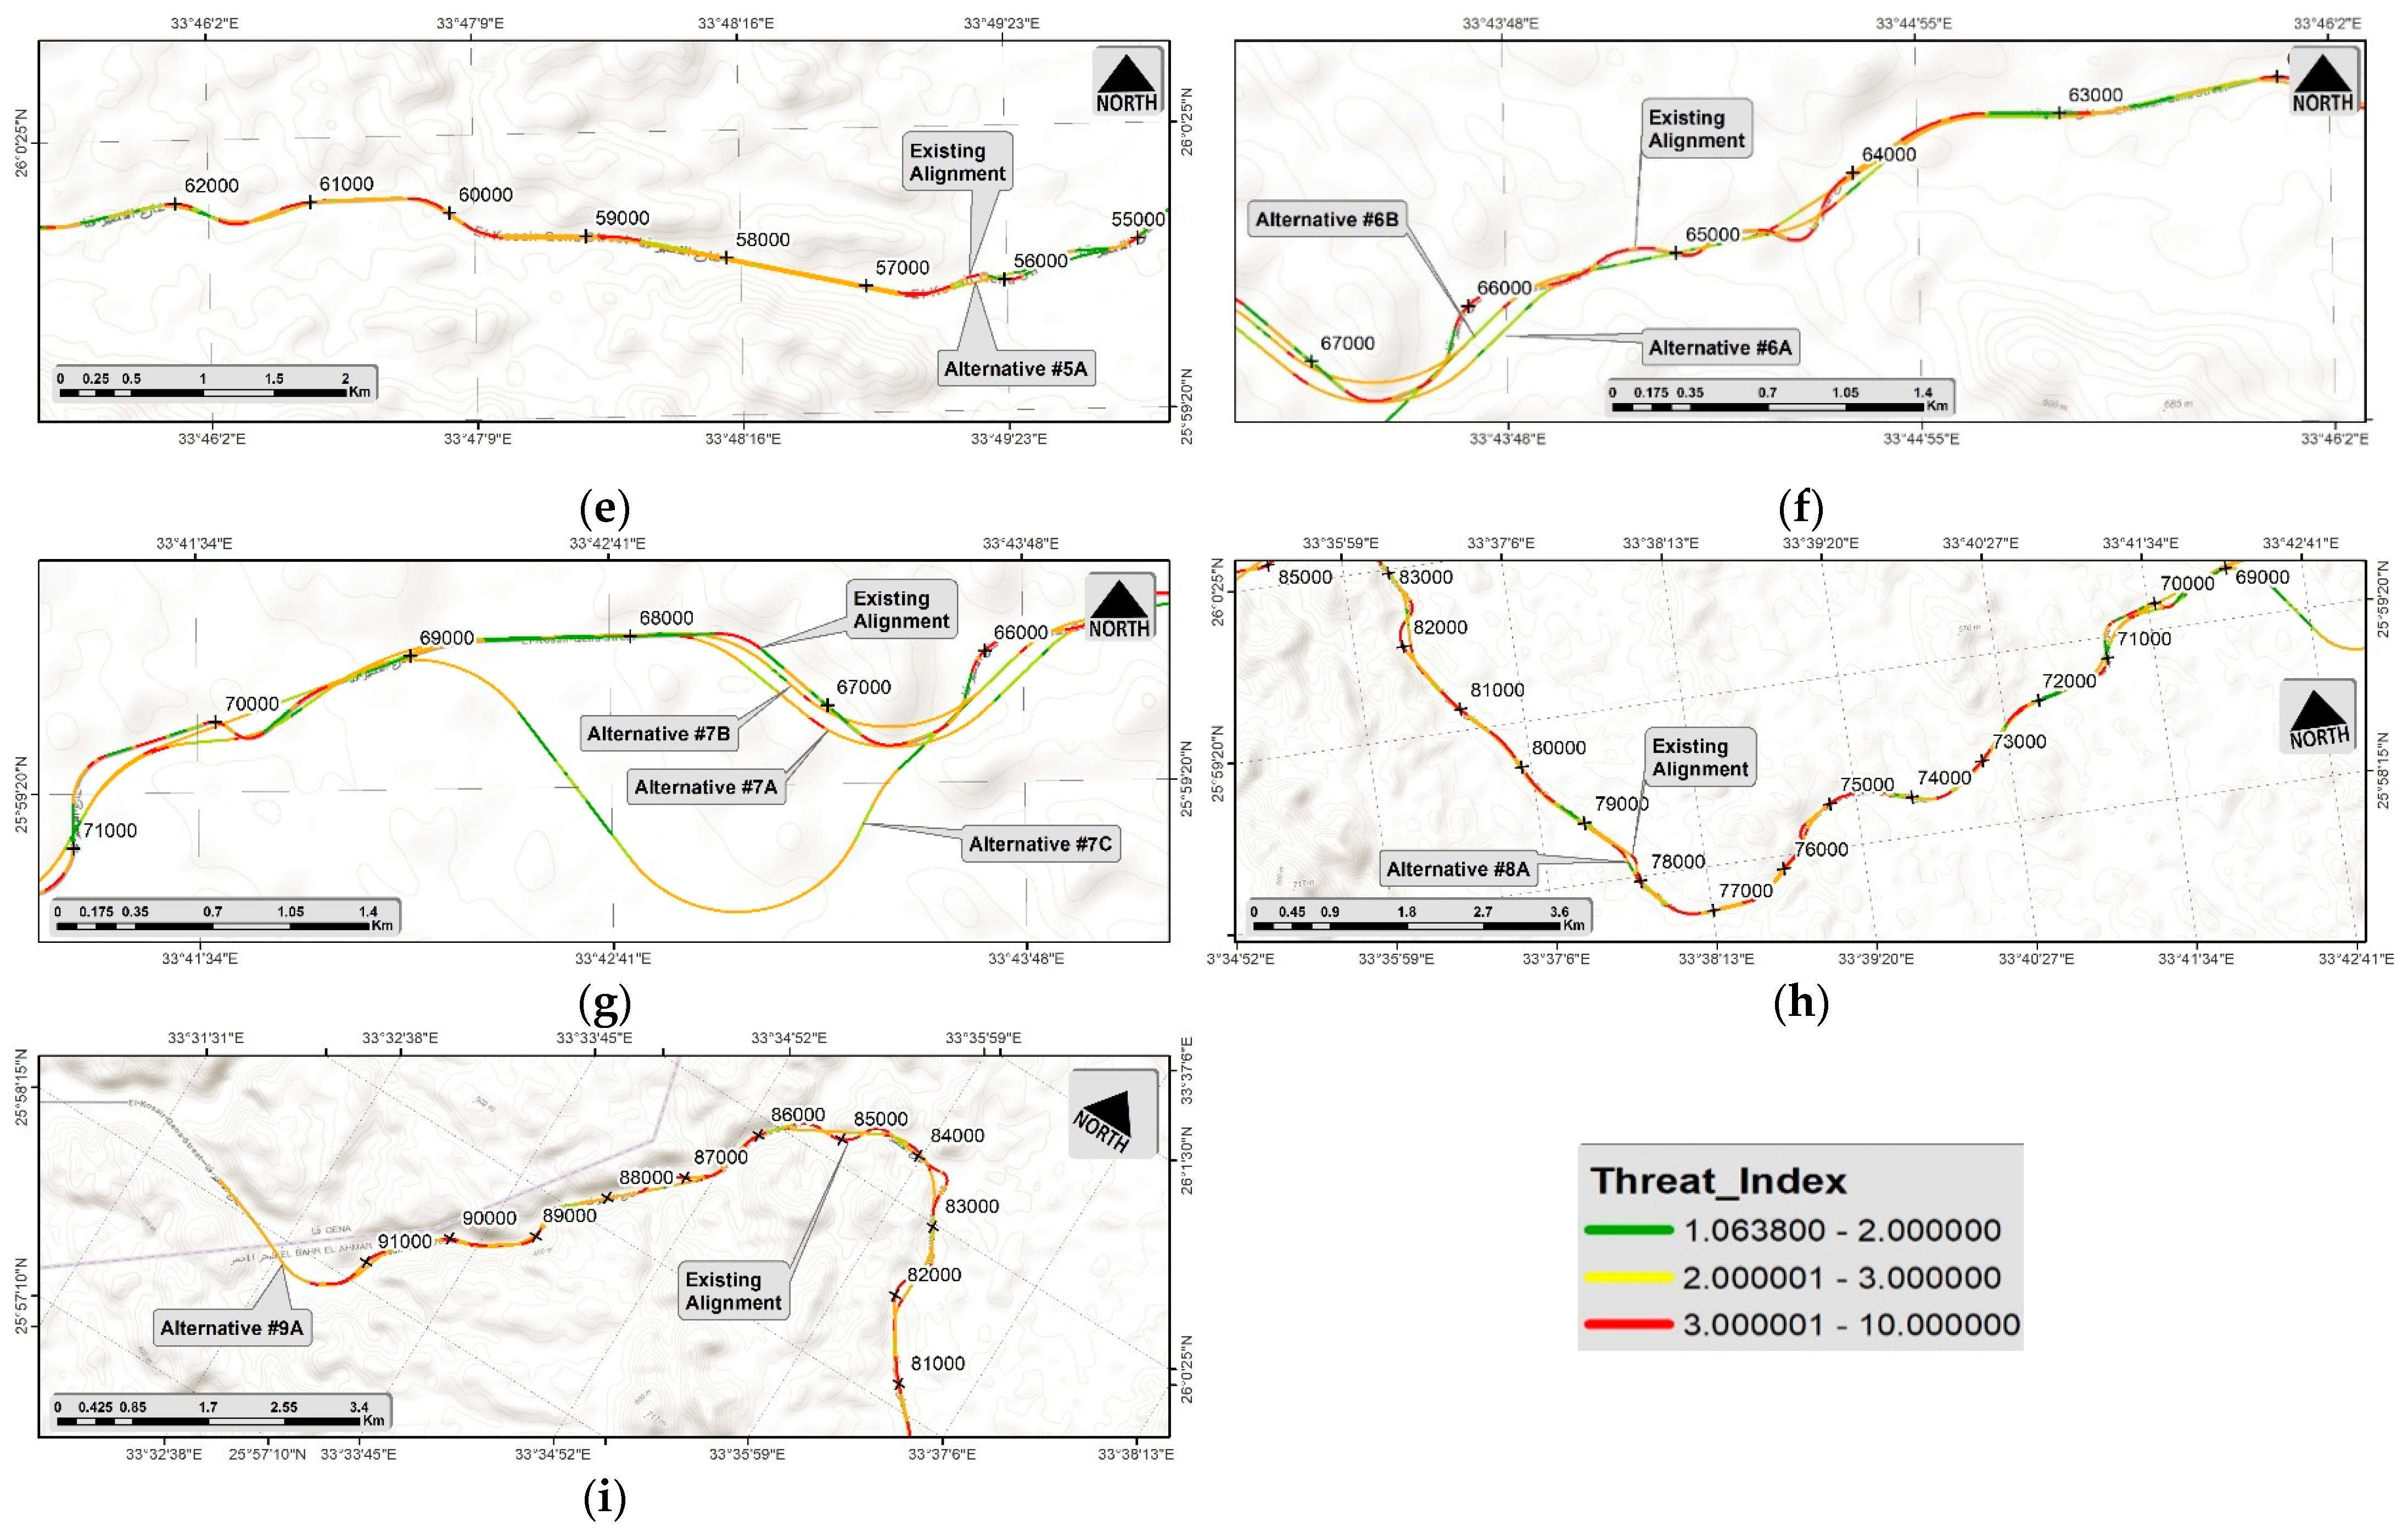
Subsequently, the tables are exported to GIS, where the threat score (TS) for each segment is determined by summing the products of the assigned risk intensities (RINi) and the weights associated with each design factor (Wi) as shown in Equation (10). These weights are established in the preceding DEMATEL step. An example of GIS output is shown in Figure 6.
T S i = i = 1 n R I N i W i
Step 4: 
For each alternative, the average Threat Score ( T S A v g ) is computed as shown in Equation (11) to determine the best alternative for consideration.
T S A v g = 1 n i = 1 n T S i
GIS was utilized in this study to facilitate the calculation process and map production. The GIS platform is employed to acquire and integrate various raster and shapefile layers relevant to different factors affecting the road route. This included data sources, such as digital elevation models, geology maps, and hydrology maps detailing flood water depth, velocity, and flood hazards. Then, a series of geospatial analyses were conducted to quantify hazard risks and scores for each factor affecting the road design. These analyses included hydrologic modeling and zonal statistics. Finally, thematic maps and visualizations were generated to effectively communicate the spatial distribution of flood hazards relative to the road route.

2.4. Mapping of Geological Elements

The geological map was constructed through the visual interpretation of satellite images, employing various remote sensing techniques applied effectively in arid and semiarid terrains for distinguishing rock and soil types [29,30,31,32,33]. Image processing-based remote sensing facilitated the discrimination of lithological cover and lineament elements, both important geological criteria and environmental factors for site selection and road design [11]. The satellite data processing involved several steps:
  • Layer stacking of the different bands in the image.
  • Subsetting of images to focus on the exact area required.
  • Construction of false-color composite images (FCC) using band combination and band ratioing techniques to achieve optimal lithologic discrimination and identify lithological cover.
  • Utilization of enhancement and merging techniques during processing, with images produced in the UTM projection (WGS84 datum, zone 36N).
  • Application of Principle Component Analysis (PCA) to transform images by compressing the dataset and reducing the number of dimensions [31].
  • Implementation of supervised classification, where distinct information categories are initially identified, is followed by an examination of their spectral separability. In contrast, the unsupervised approach involves the computer determining spectrally separable classes and defining their information value.
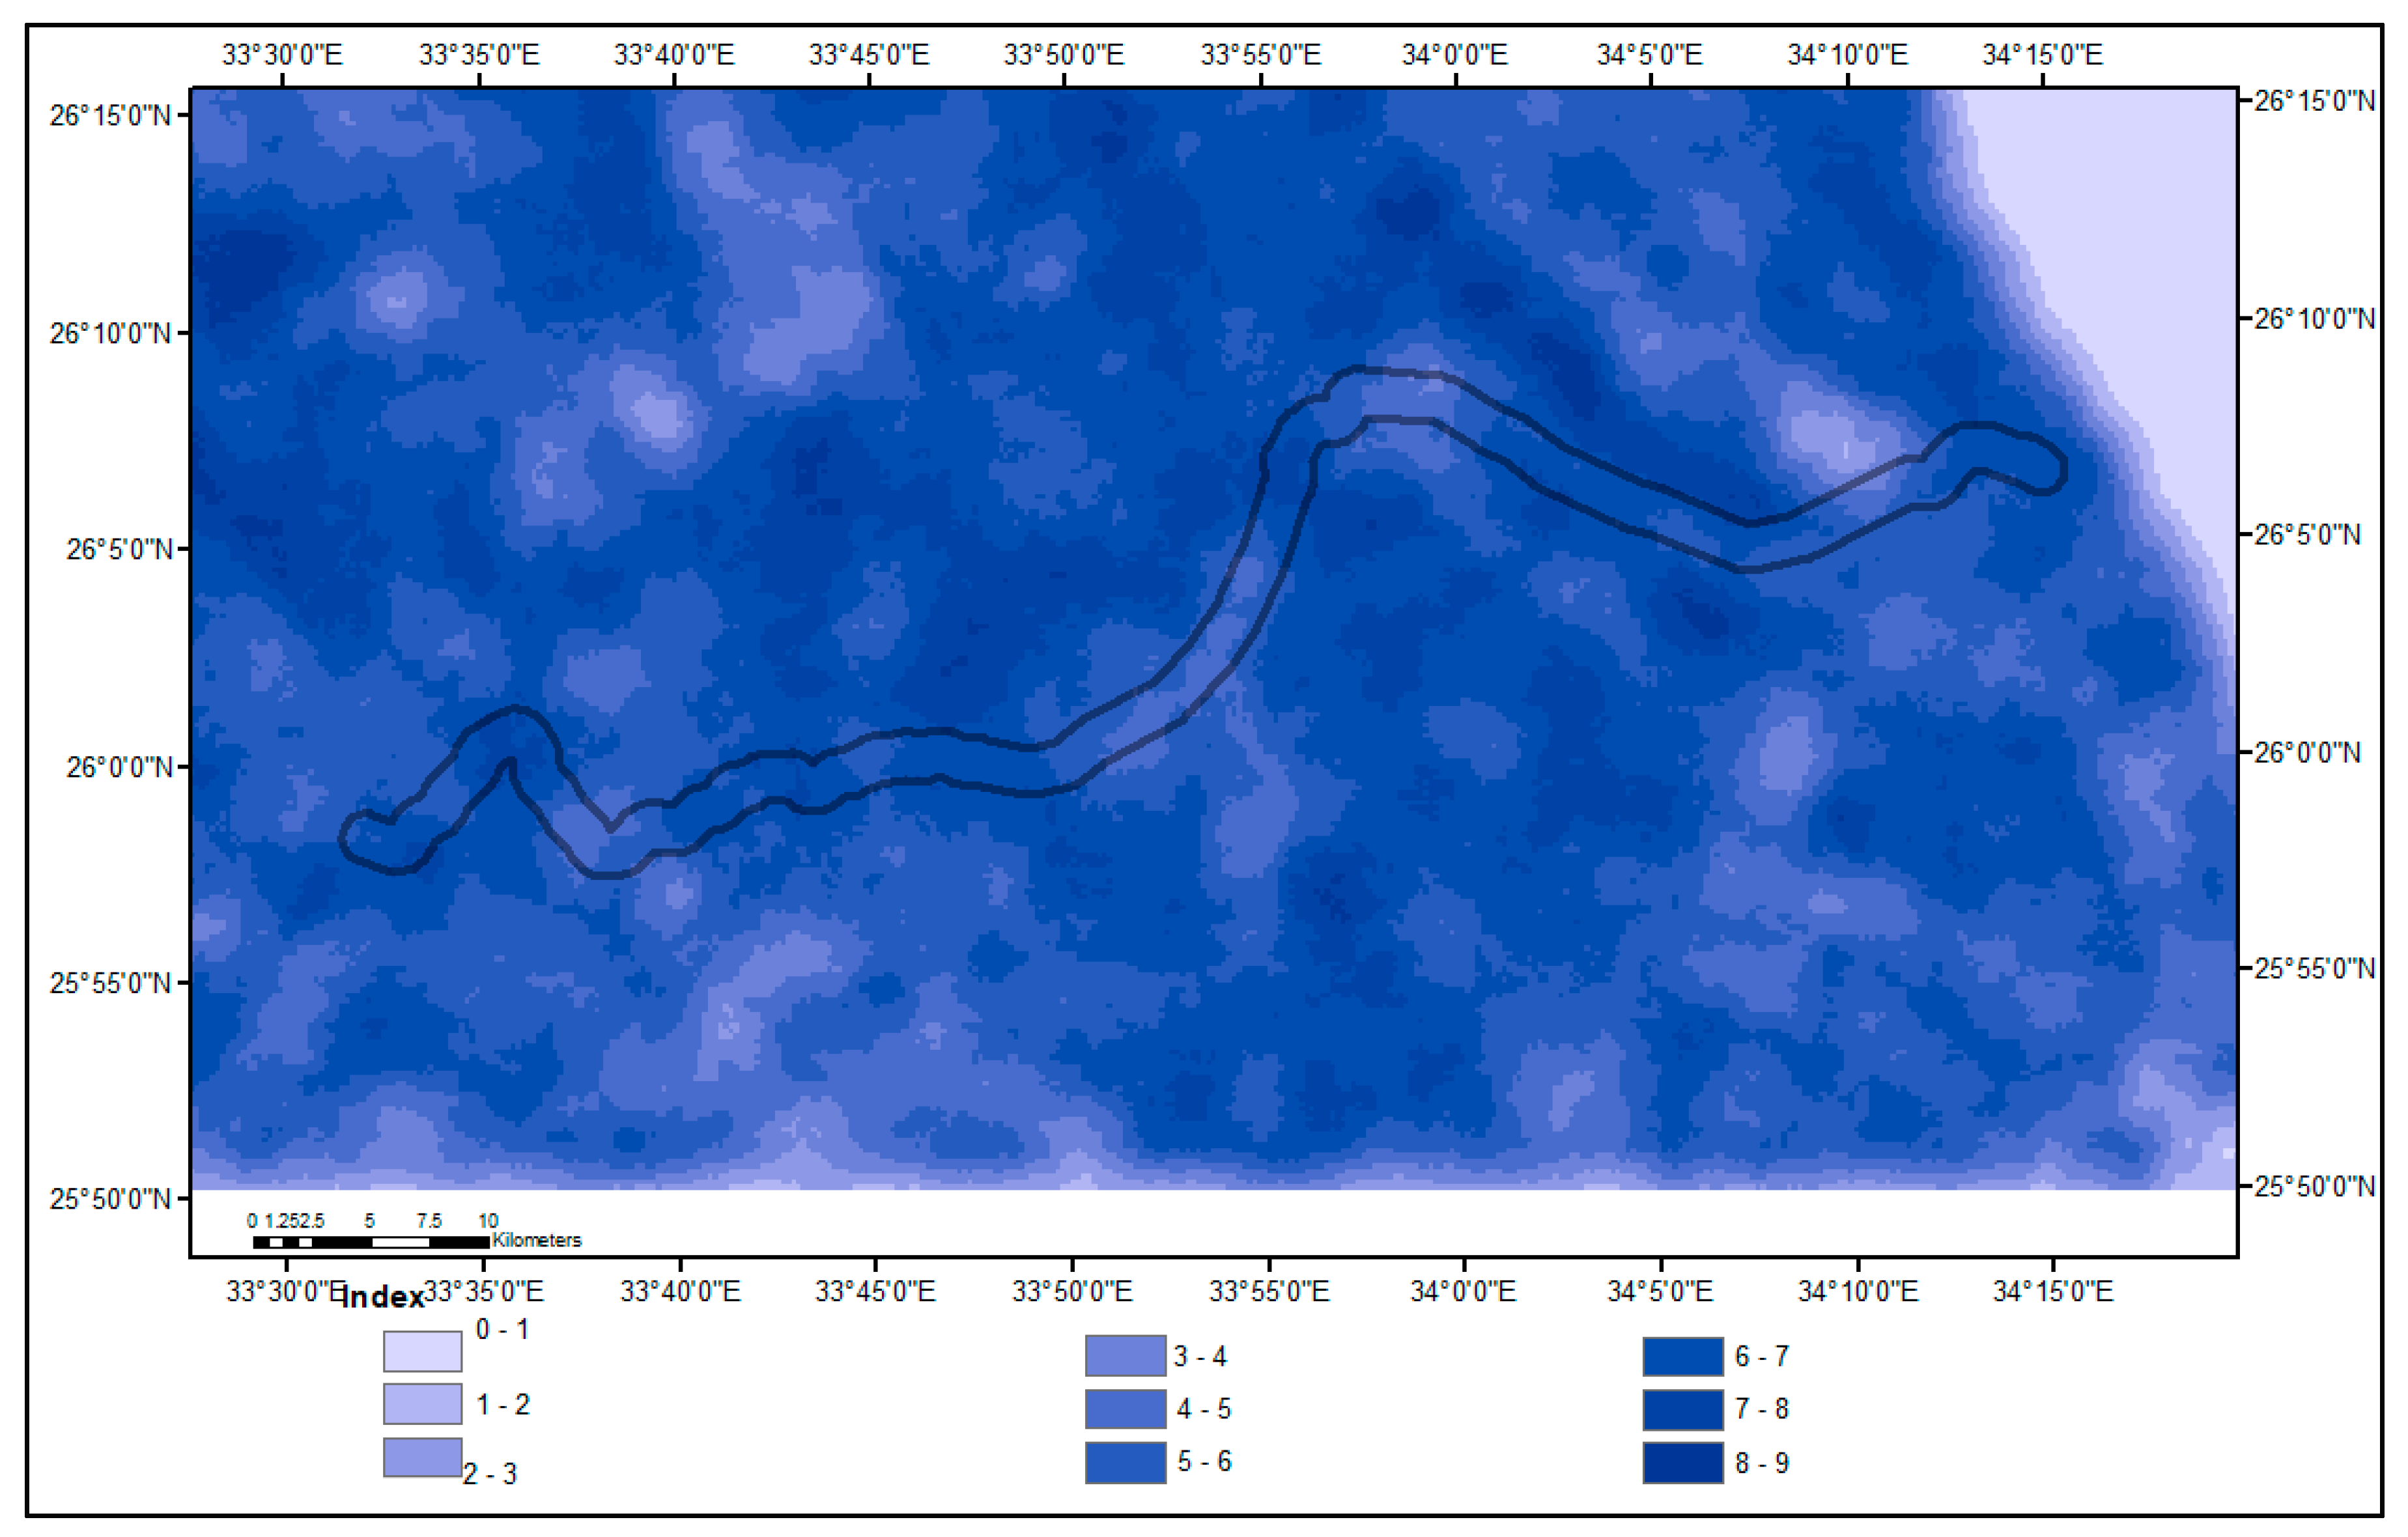
  • Creation of a lineament map using PC images in the Geomatics platform, with a line density layer constructed in the ArcGIS environment.
  • Conducting fieldwork and ground truthing to enhance the accuracy of the geological map.

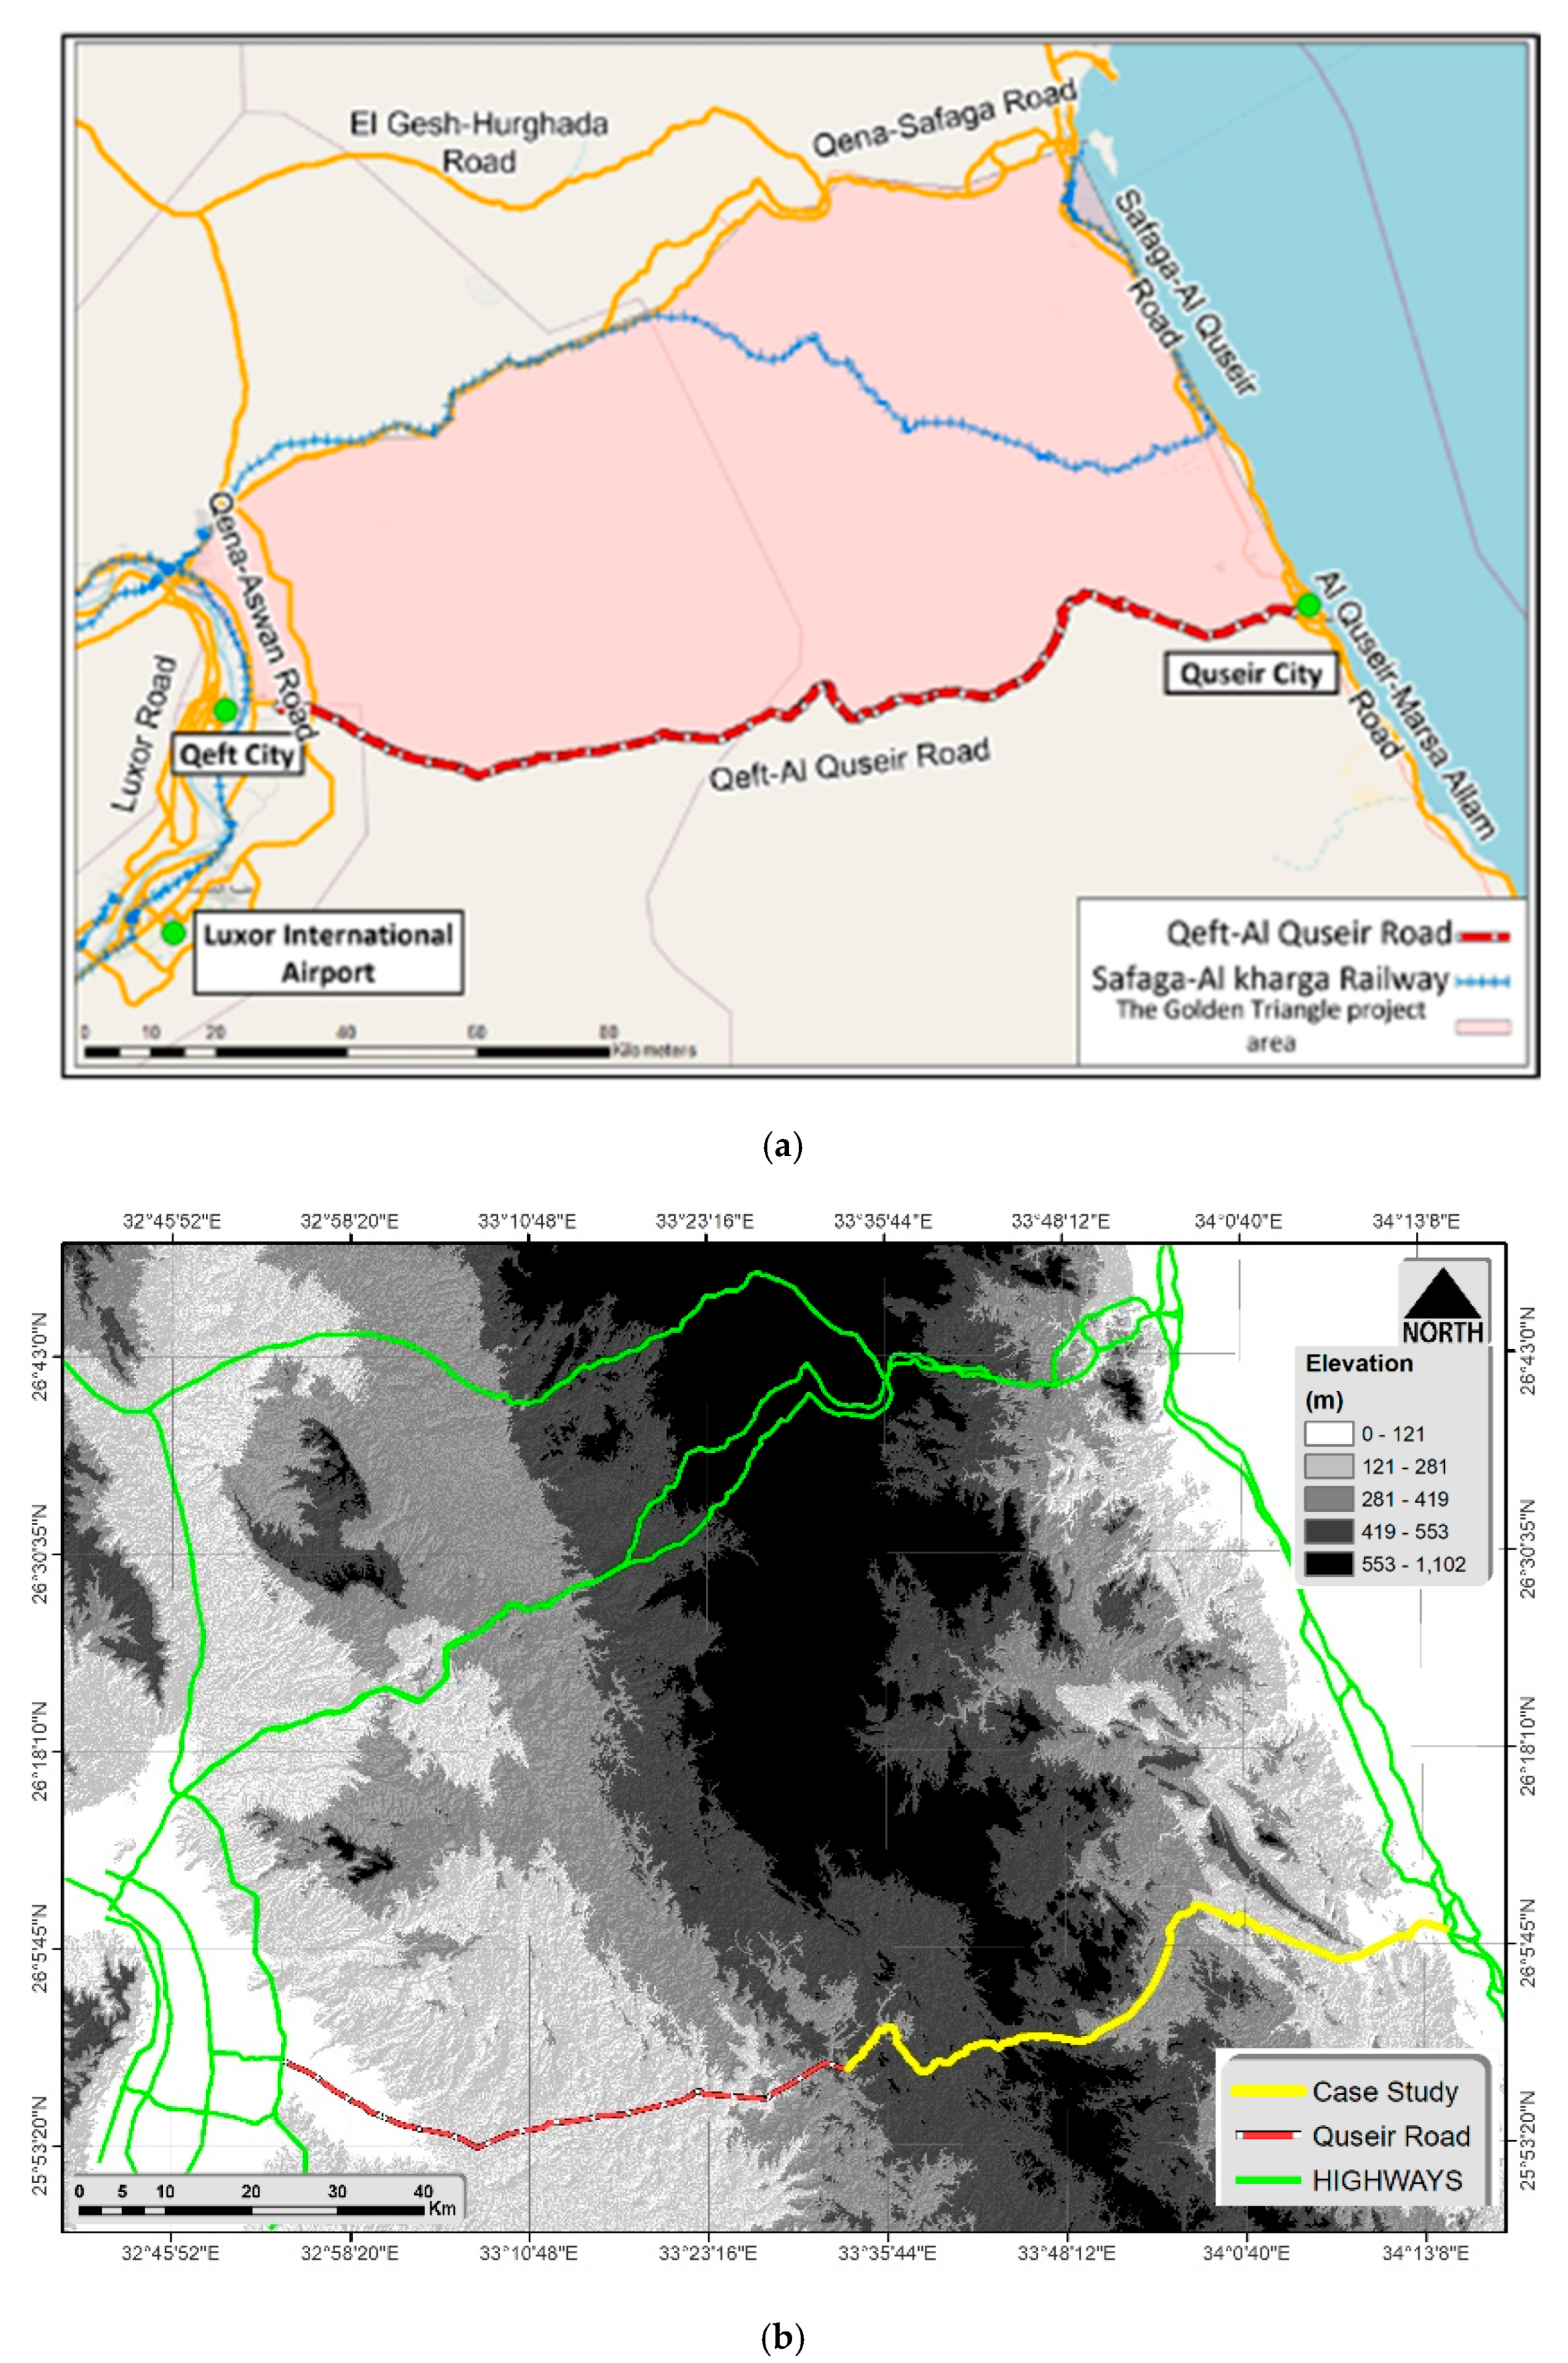
3. Case Study (Quseir Road)

One of Egypt’s significant mega projects towards sustainable development and optimal resource utilization is the Golden Triangle Project. The Golden Triangle, illustrated in Figure 7, connects Quseir on the Red Sea to Safaga and Qena cities along the Nile Valley. The project’s primary goal is to establish links between mining and industrial zones with the Red Sea while fostering the development of new tourism and industrial communities. The Golden Triangle stands out due to its distinctive geographic, sociological, and geological features. To the west, it is bordered by the Nile Valley and Qena City, providing access to a skilled workforce. On the eastern coastal side, the area is bordered by three major mineral seaports: Abou-Tartour Port at Safaga, Quseir Port, and Hamraween Port.
As part of the major development initiatives in the region, the existing 160-km-long two-lane two-way Quseir Road, highlighted in yellow and red in Figure 7a, will be upgraded to become a major multilane freeway with a design speed of 110 km/h. This upgrade necessitates substantial improvements and widening of the road alignment, particularly due to the current industrial developments in this mountainous region and the essential movement of cargo between the ports and the Nile Valley. The project focuses on the redesign, rehabilitation, widening, and enhancement of Quseir Road. The case study outlined in the paper specifically focuses on the 90-km complex mountainous segment of the road, delineated in yellow in Figure 7b.

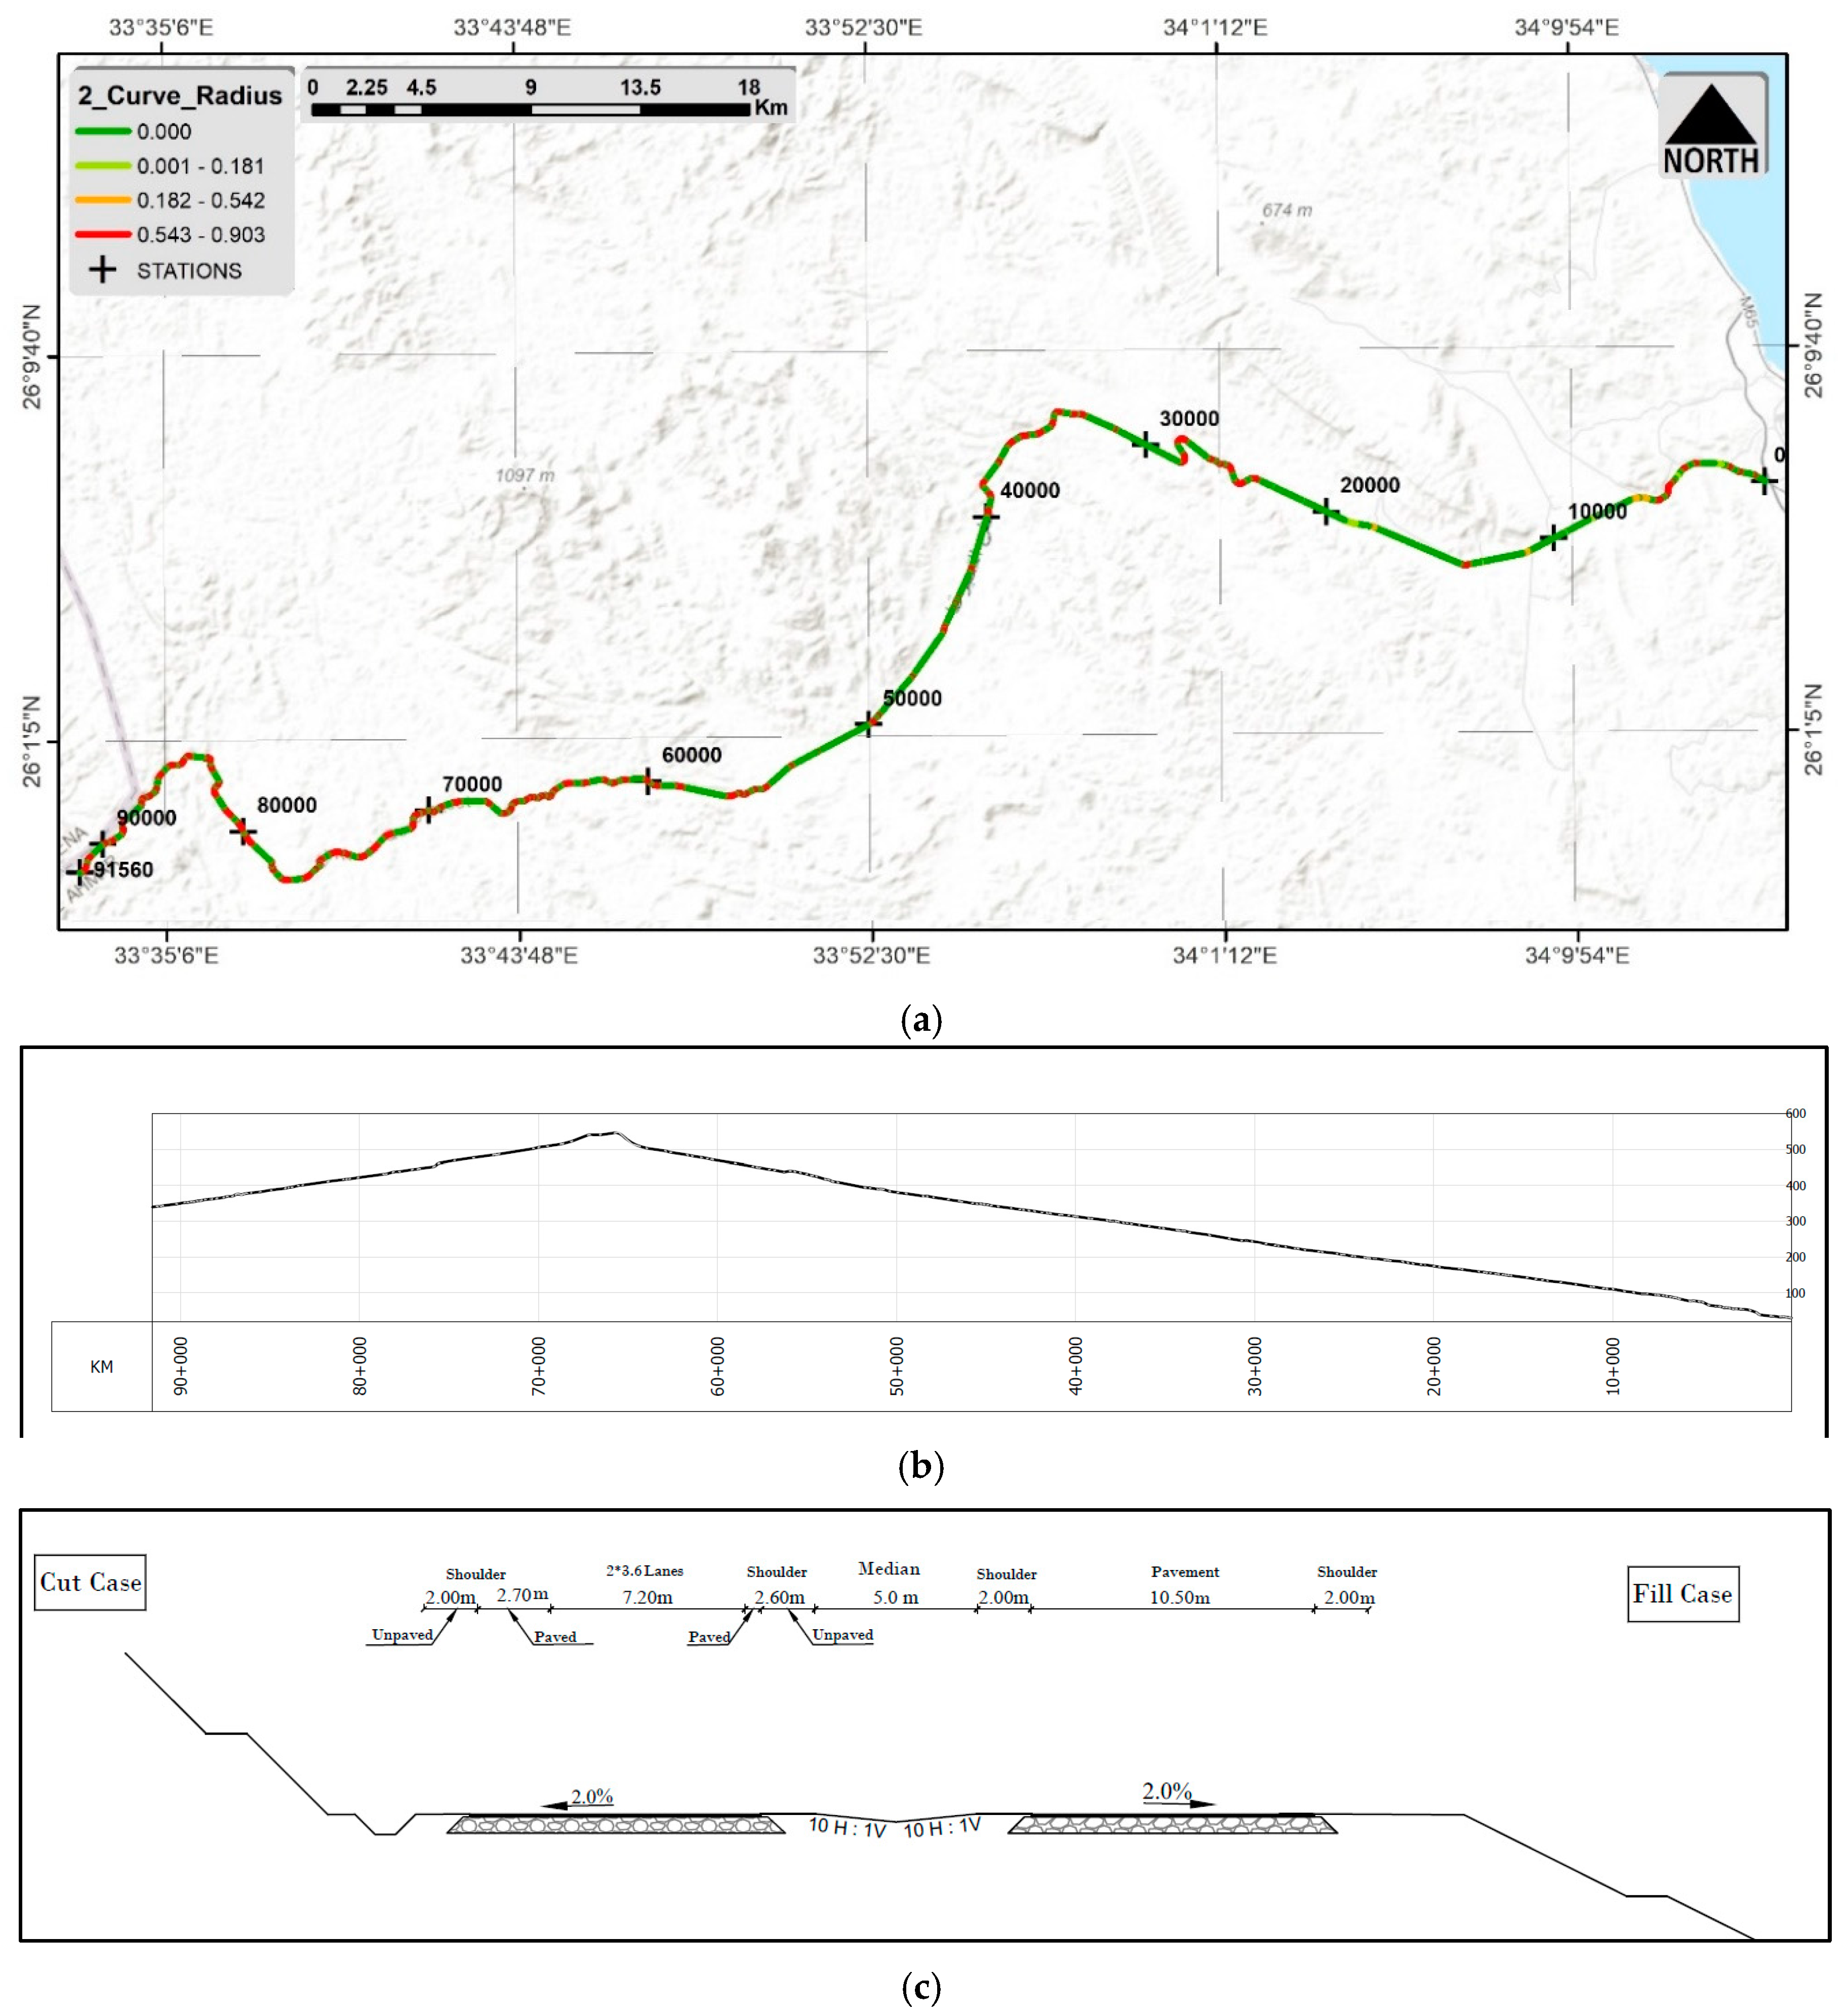
3.1. Evaluation of Existing Geometric Alignment of Quseir Road

The geometric alignment of Quseir Road, depicted in Figure 8, reveals several noteworthy issues that warrant attention in the highway route selection process:
  • Sharp Horizontal Curves: Approximately 21% of the horizontal curves are characterized by sharp radii, indicating speeds below 85 km/h, when back-calculated using the balance equation. Specifically, out of 125 curves, eight curves (6% of the total) feature radii below 135 m, implying speeds between 45 and 55 km/h. Additionally, 11 curves (9%) have radii ranging from 145 m to 210 m, suggesting speeds between 55 and 70 km/h. Moreover, seven curves (6% of the total) exhibit radii between 215 m and 305 m, inferring speeds between 70 and 84 km/h.
  • Consecutive Reverse Curves: The existing alignment features severe consecutive reverse curves, with insufficient lengths of tangent between successive curves for the progression of superelevated edges, in accordance with guidelines [20,21]. This accounts for 4.3% of the total existing alignment.
  • Short Horizontal Curves: The alignment includes extremely short horizontal curves, some as short as 15.5 m, resulting in kinks along the road. Research suggests that horizontal curve length (m) should ideally be three to six times the design speed (km/h), with an absolute minimum of 150 m. Within the 90-km section examined in this study, 47 curves (38% of the total curves in the alignment) have lengths less than 150 m.
  • Small Angles of Deflection: Curves with angles of deflection less than 5 degrees are not preferable as they lead to short horizontal curves or kinks in the alignment [20,21]. The existing road alignment includes 18 curves (14.4% of the total alignment) with angles of deflection less than 5 degrees.
  • Large Angles of Deflection: Similarly, curves with large angles of deflection are undesirable as they can cause discomfort for drivers, particularly on sharp curves [34,35]. As an example, the existing alignment consists of two reverse curves between KM 26+994 and KM 28+470. At this distance, the two reverse curves have radii of 540 m and 460 m consecutively, with angles of deflection measuring 160 and 150 degrees, respectively. This configuration results in a reverse curve alignment spanning almost 1.5 km, coupled with sharp curvatures. The application of the Threat Score in this segment yields an average TSExisting of 2.5.
  • Maximum Vertical Grades: AASHTO [20] specifies that the maximum vertical grades in mountainous regions, designed for speeds of 110 km/h, may reach up to 5%. However, considering the presence of severe combinations of horizontal and vertical curves, it is preferable to limit the maximum grade to 3%. Currently, 1% of the existing alignment consists of grades exceeding 3%, with a maximum grade of 4.5%.

3.2. Flood Plain Analysis of Quseir Road

  • Hydrological Considerations: The catchment area, covering 2260 km2, experiences periodic flash floods during the winter, posing risks to road infrastructure. Analysis of rainfall data from Quseir rainfall stations spanning 34 years revealed that the maximum daily rainfall depth for a 100-year return period is recorded at 28.5 mm.
  • Topographic Diversity: The road encounters a diverse topography characterized by distinct landforms and elevations. The road navigates through a series of wadis, or dry river valleys, that cut through the plateau, creating deep gorges and canyons. As the road progresses, the elevation of the terrain steadily rises, reaching a maximum of approximately 540 m above sea level near Qeft, the inland terminus of the road.
The floodplain simulation and visualization were conducted using HEC-RAS software, producing water depth and velocity maps essential for assessing flood hazards and devising mitigation strategies. Figure 9a shows the water depth distribution map for the case study, while Figure 9b illustrates the velocity distribution map. Water depth and velocity maps were superimposed, creating the flood hazard map as shown in Figure 9c.

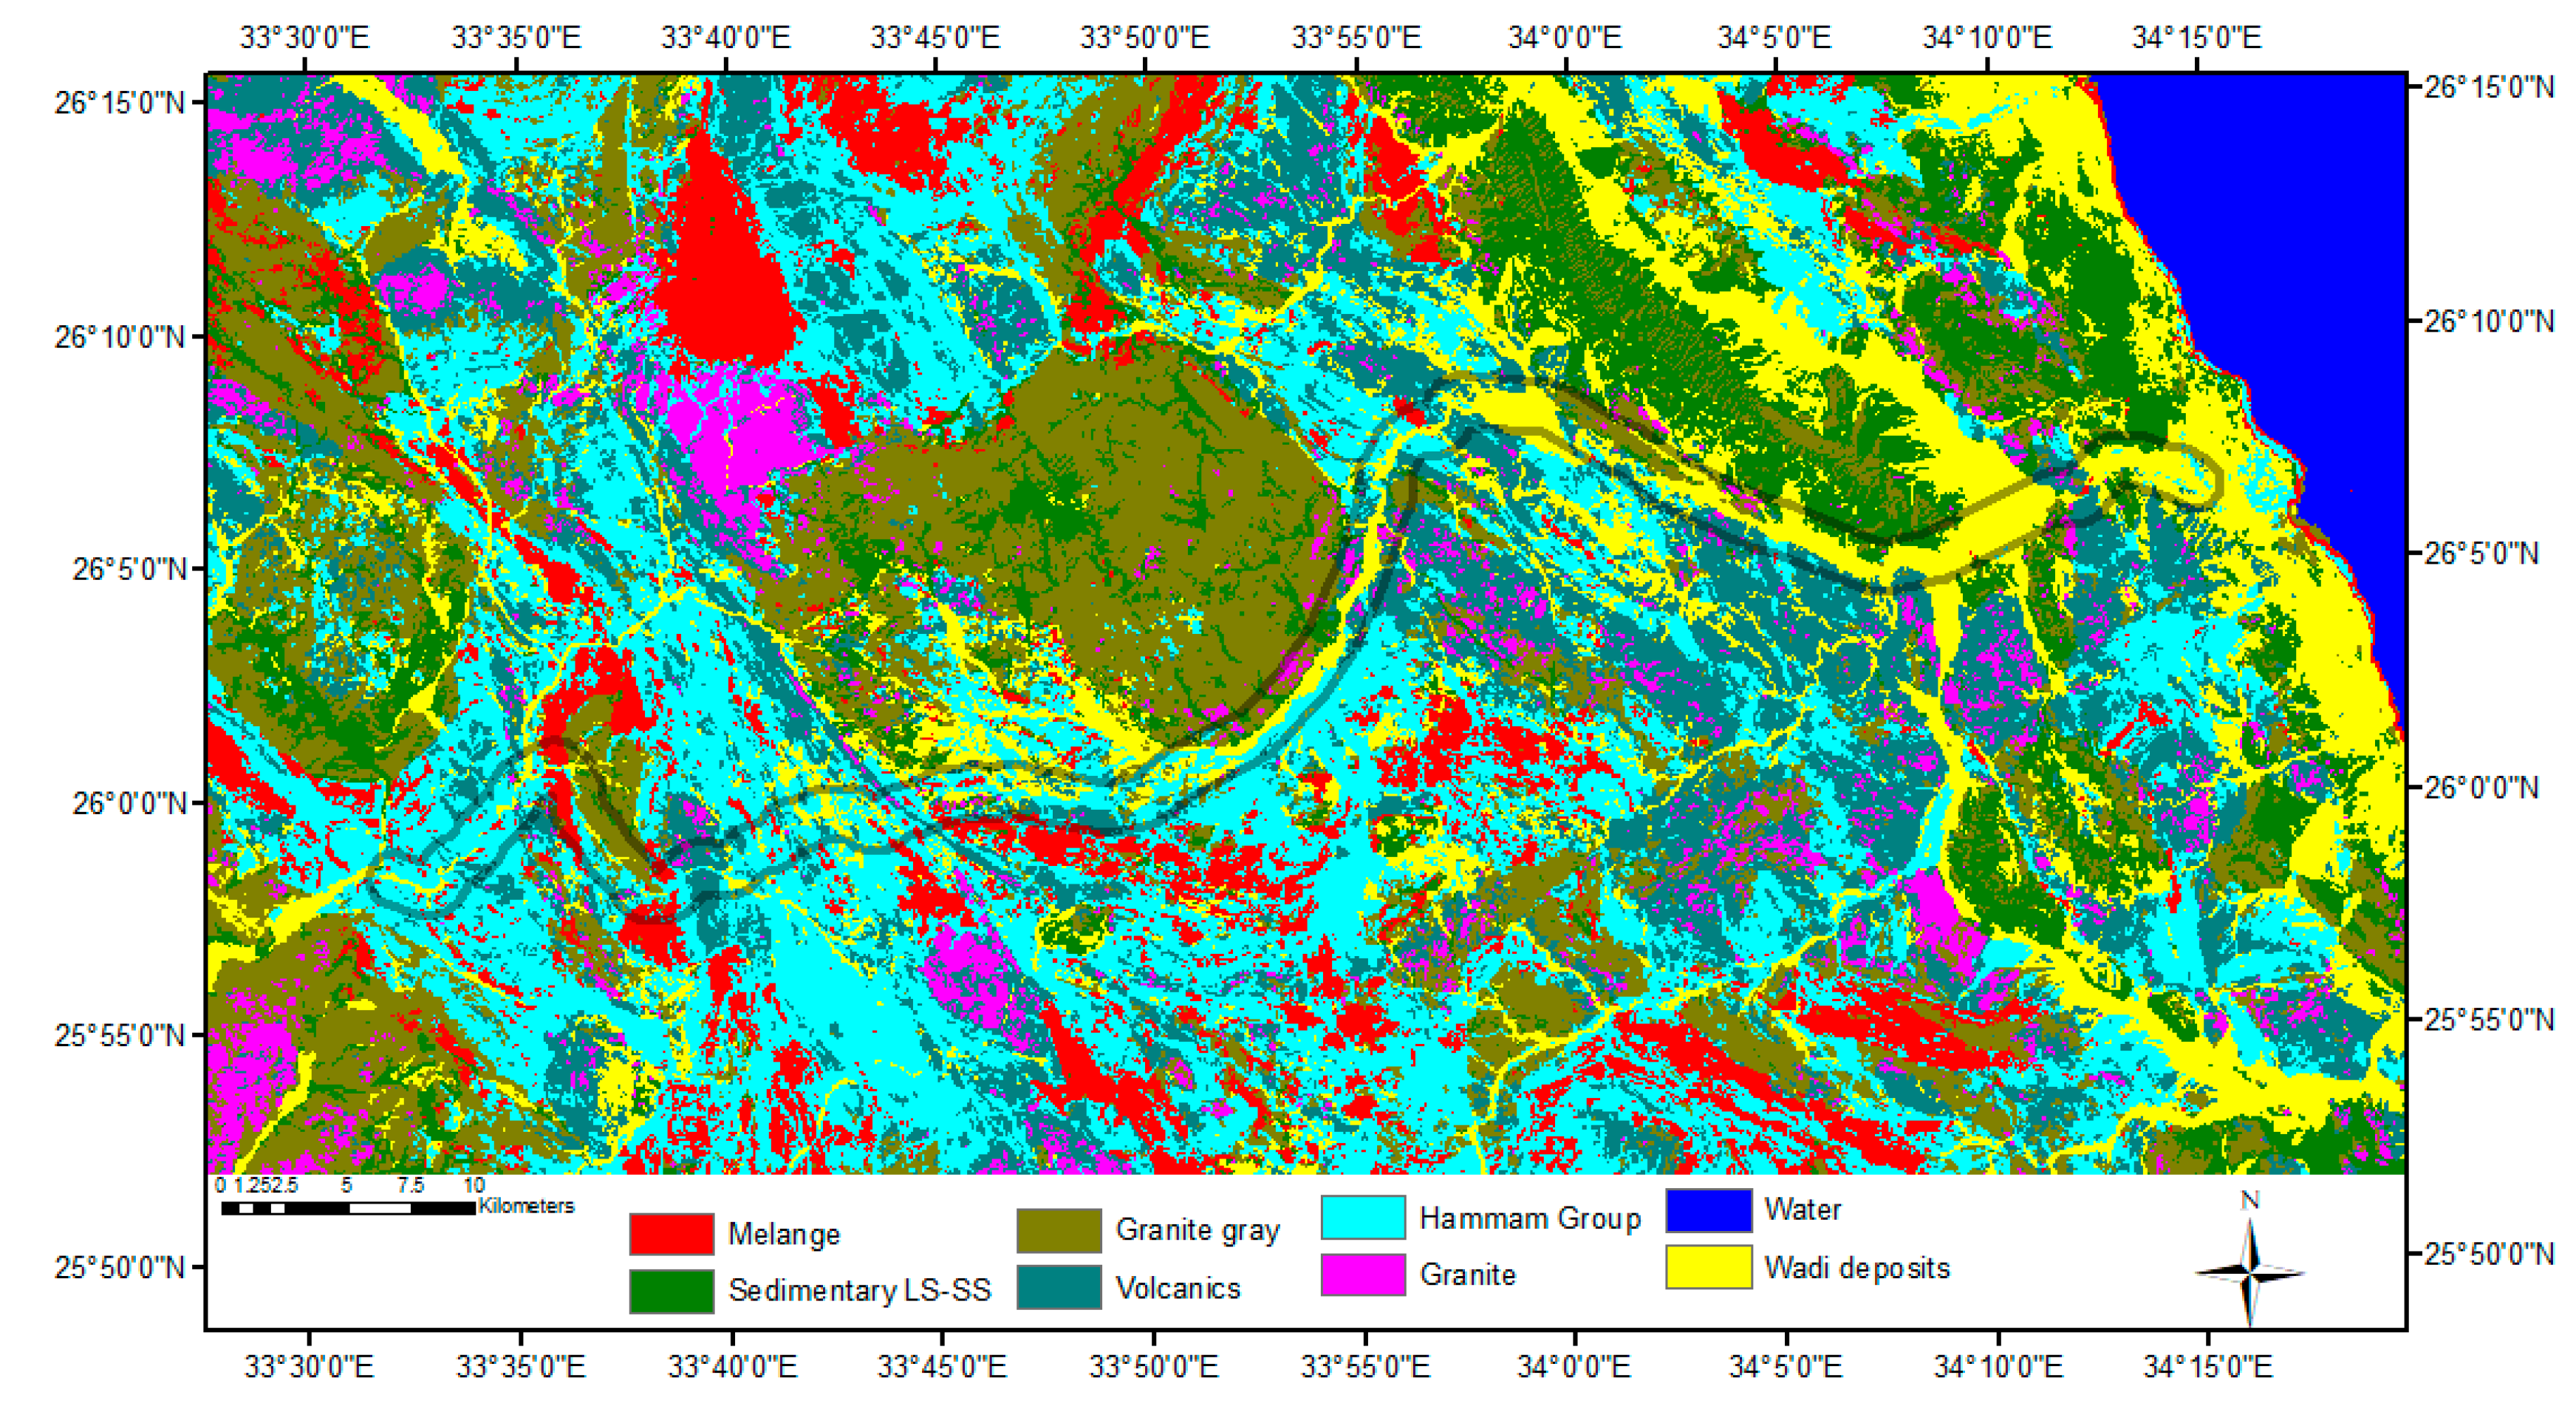
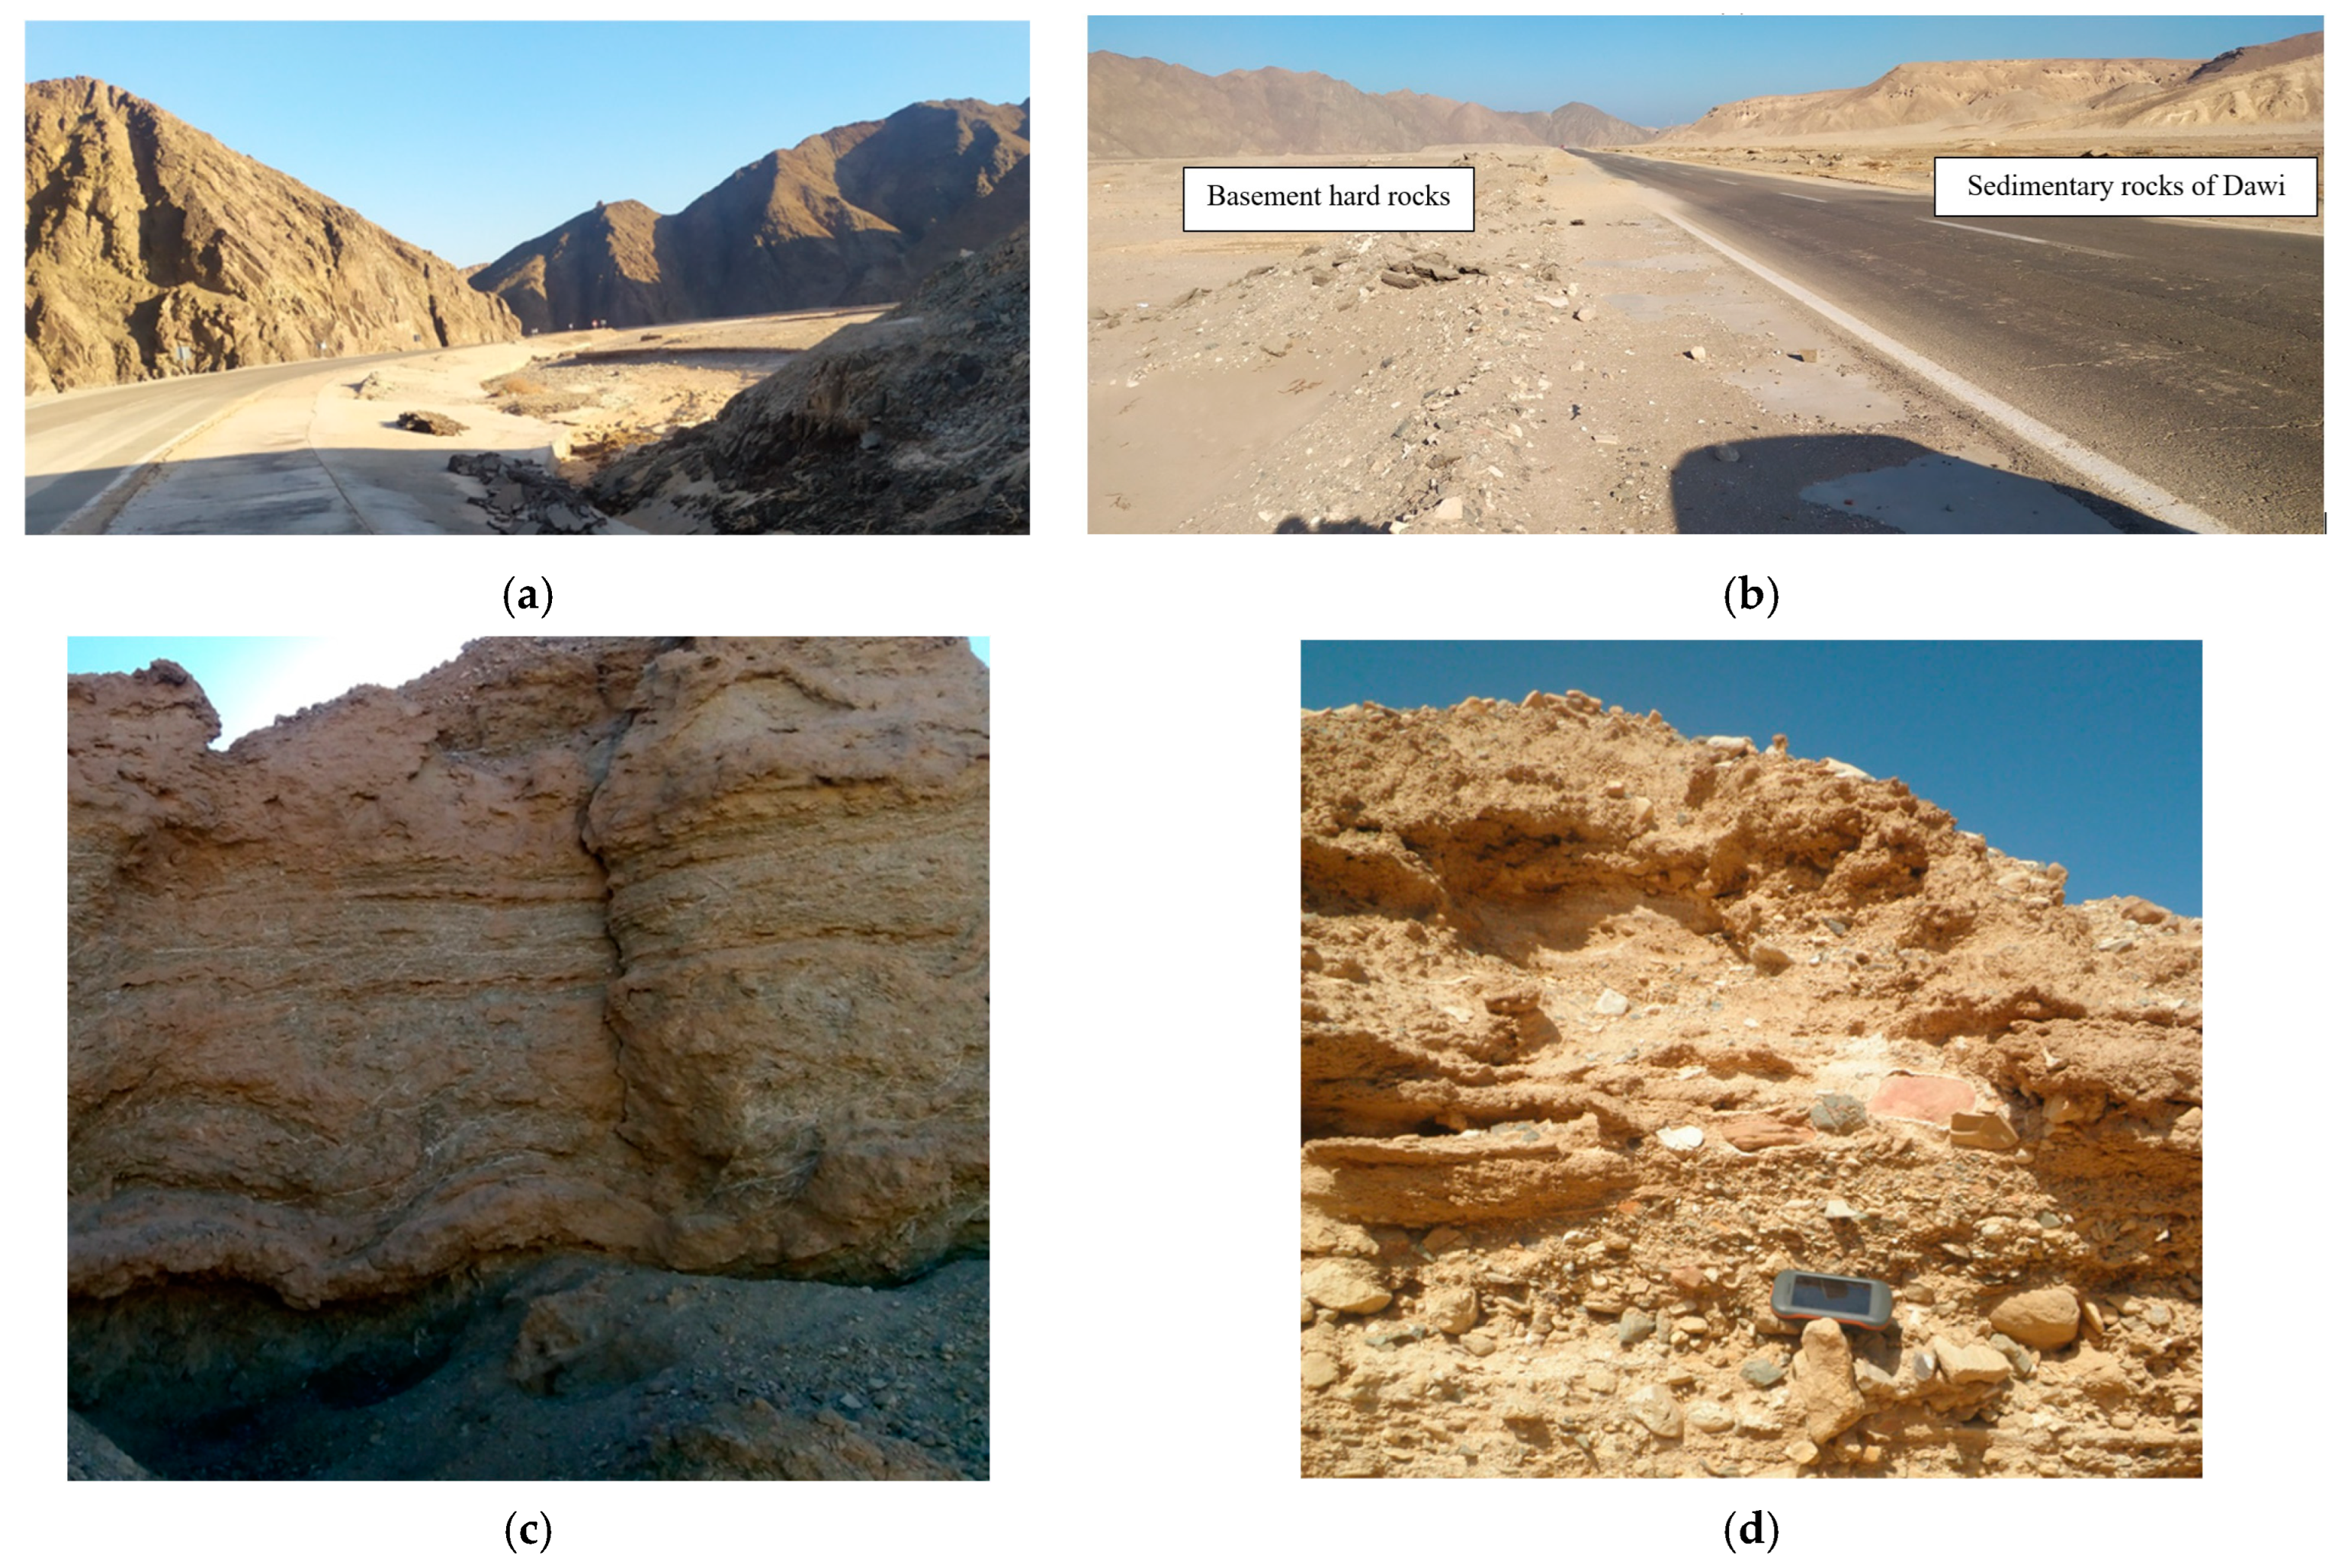
3.3. Geological Setting of Quseir Road
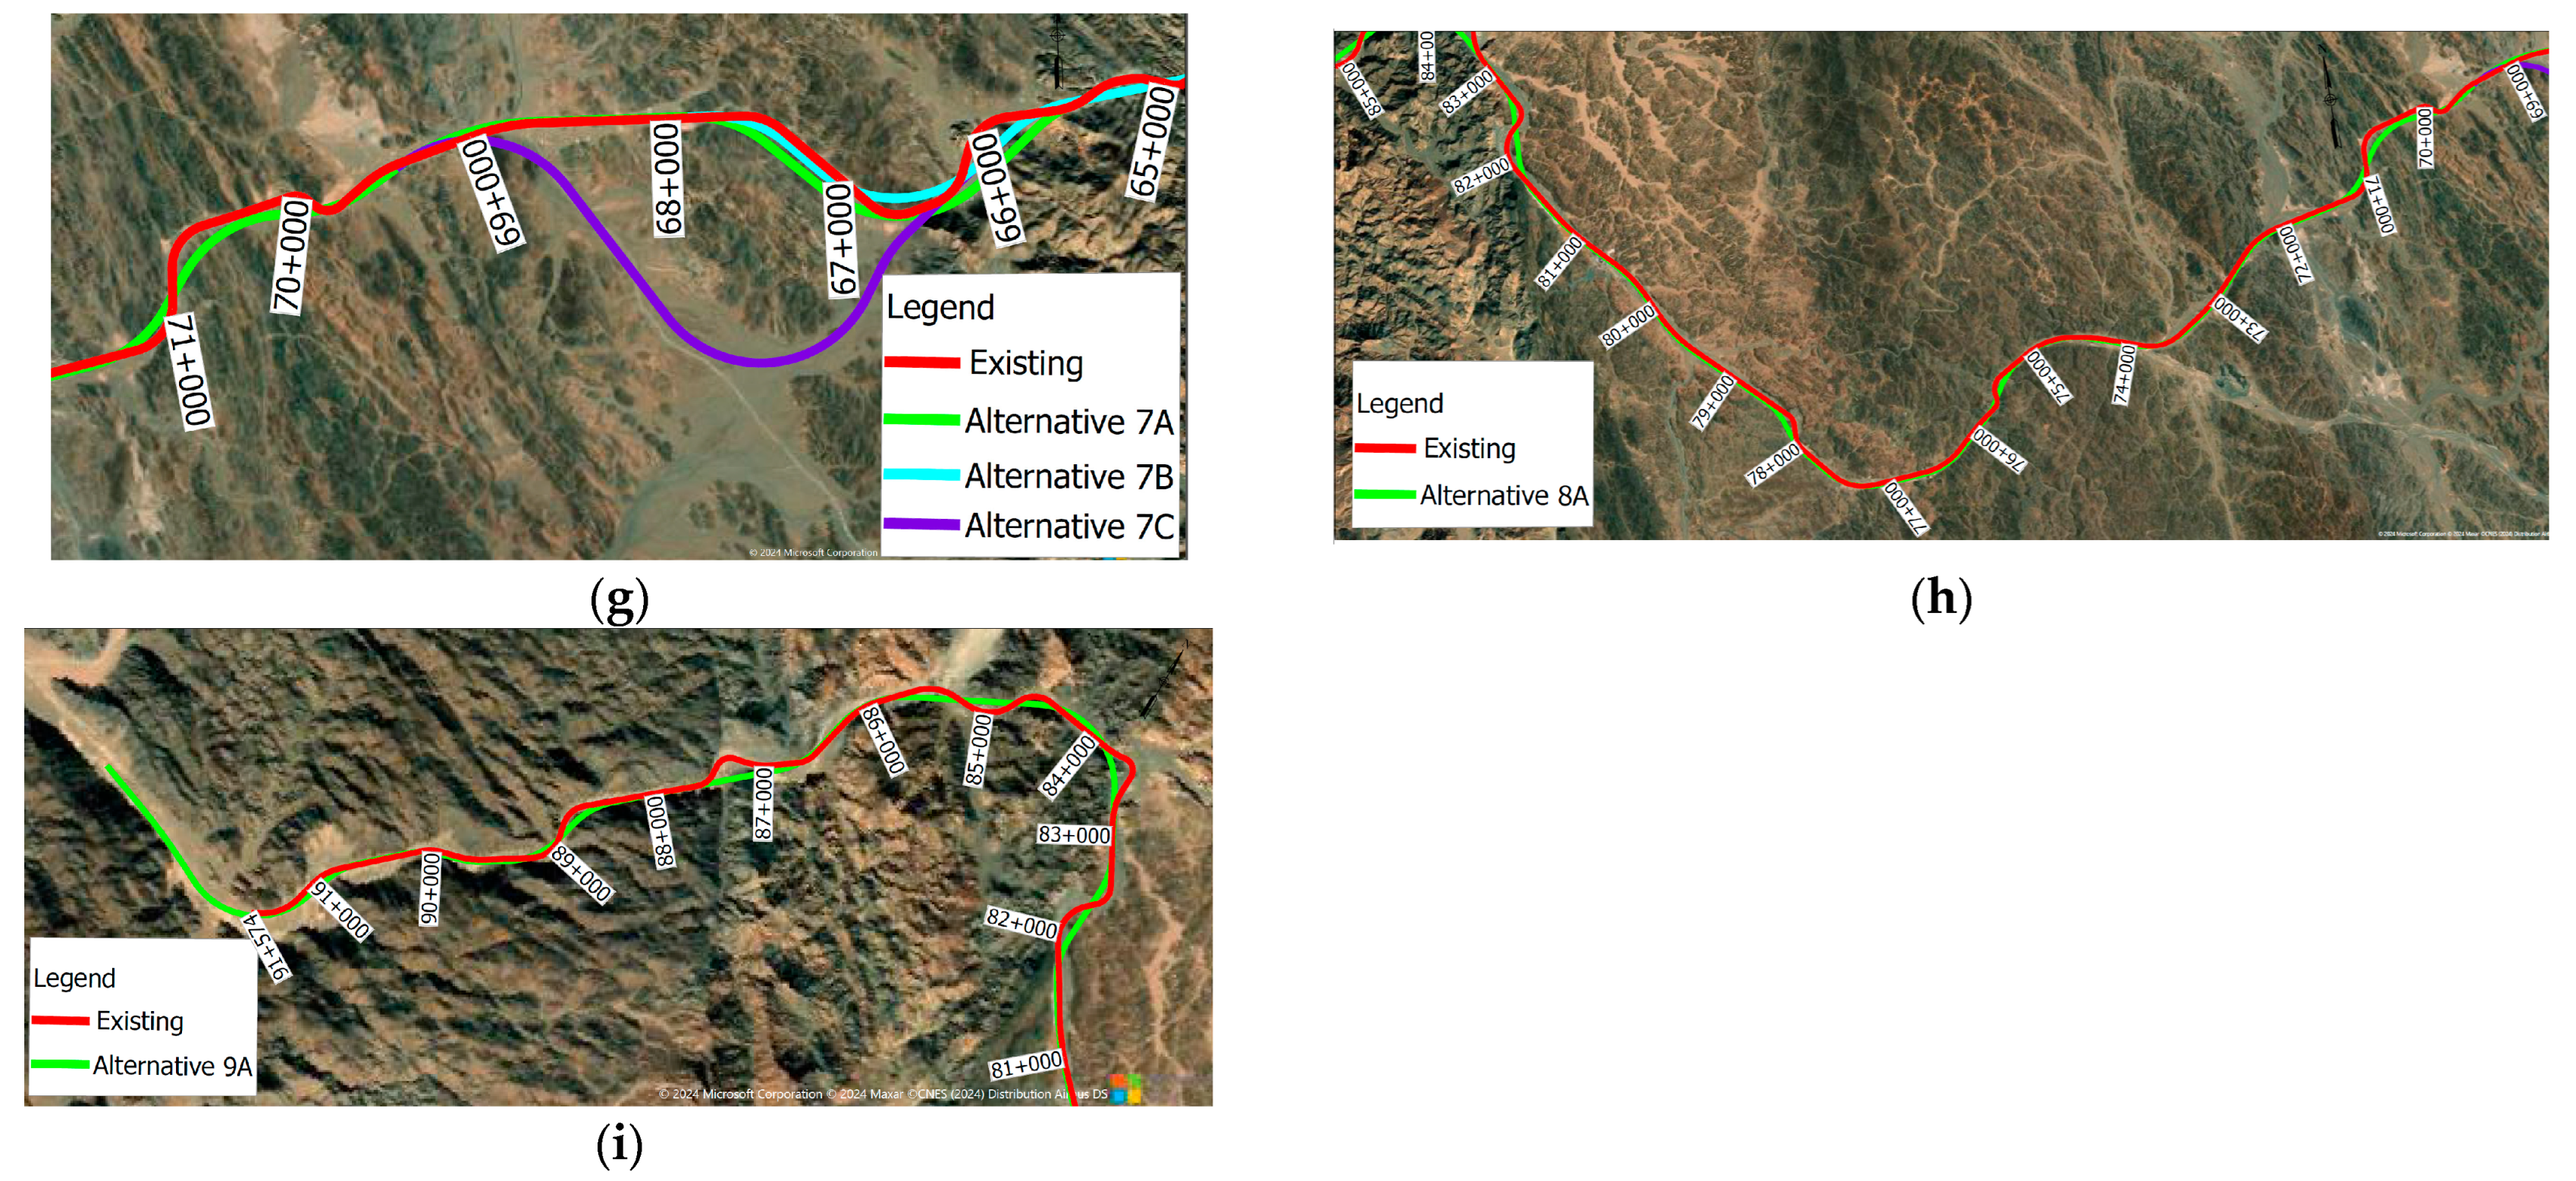
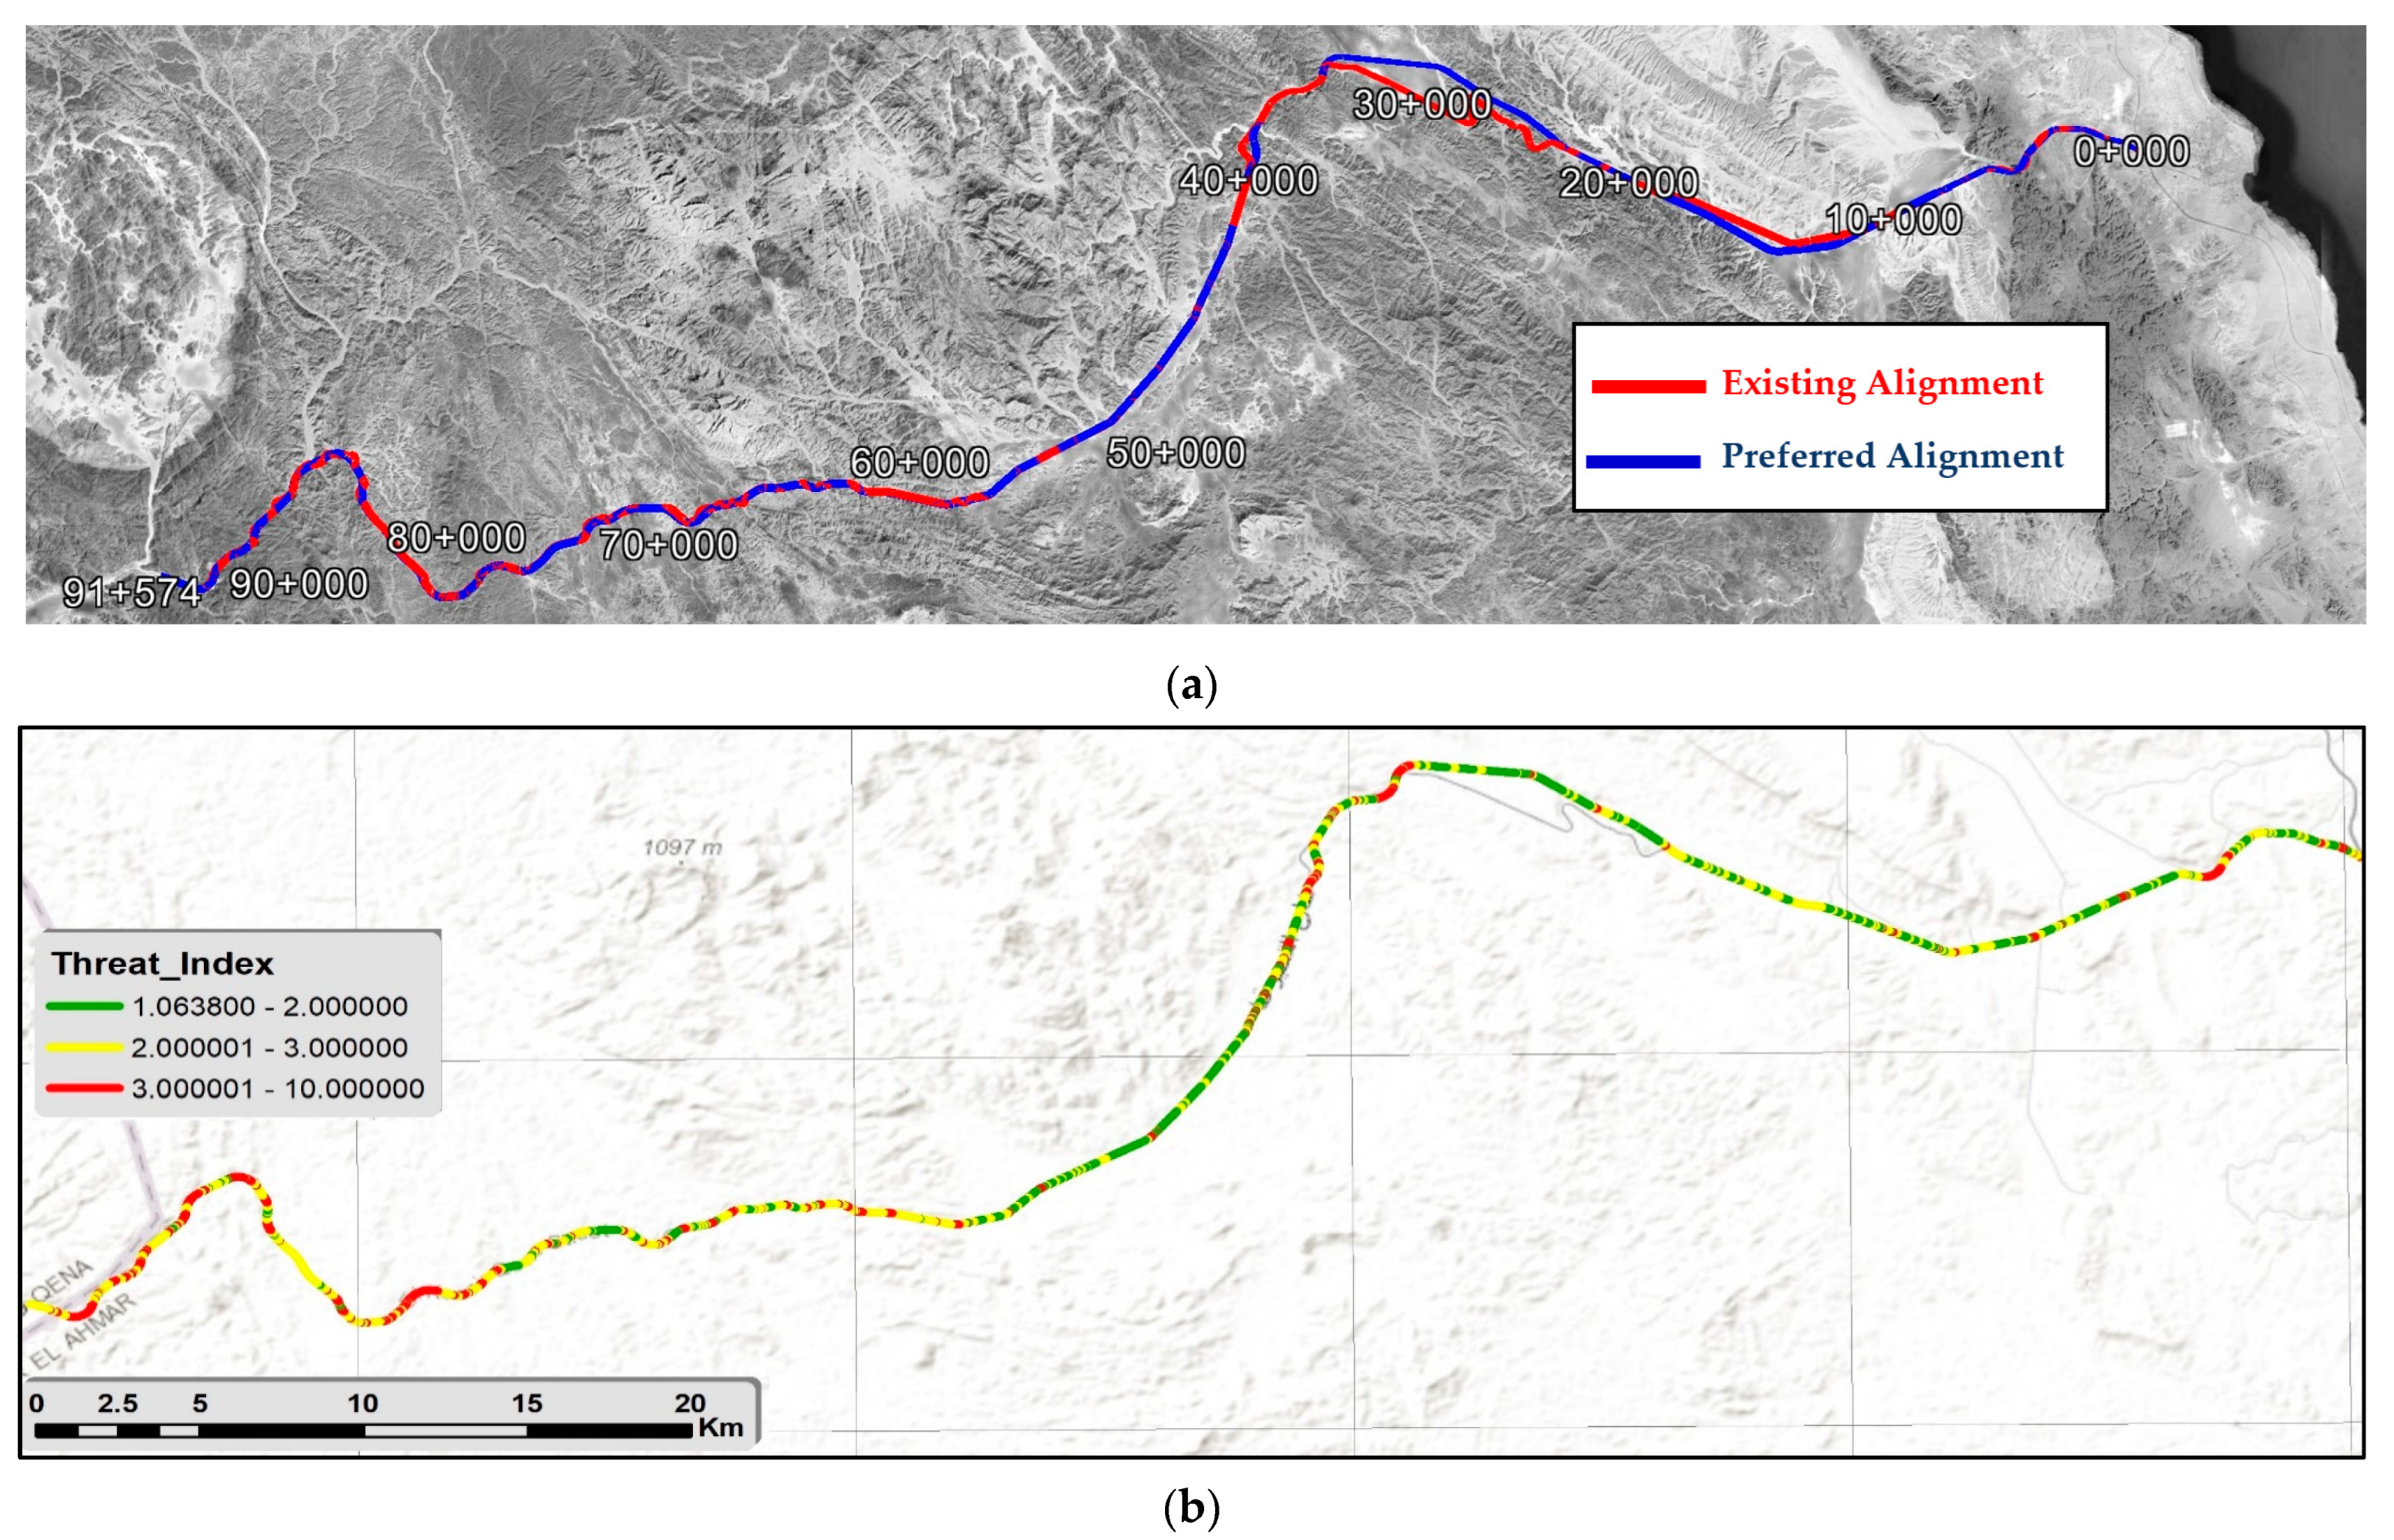
The geological setting of Quseir Road has been extensively studied by various researchers, as documented in prior studies [18,29,32]. These studies have revealed a diverse composition of rock formations, including basement rocks, sedimentary rocks, and tertiary basalts. The basement rocks, dating back to the late Proterozoic era, form part of the pan-African belt. The geological studies primarily aimed to identify and characterize the different rock units exposed in the study area and along the proposed road alignments. Fieldwork, employing base mapping, GIS, and navigation techniques, was conducted in two phases: initially to construct base geologic maps and subsequently to produce geological themes for map verification.
The current study focuses specifically on the detailed examination of lithology and lineaments along Quseir Road, with the aim of assessing their environmental potentialities for optimal route selection in the arid desert context (Figure 10). Analysis of the lithological map reveals a wide range of rock units and ages (igneous, metamorphic, and sedimentary), spanning from the Precambrian to Quaternary periods (Figure 10 and Figure 11).
The predominantly eastern side of the road area is characterized by Precambrian hard rocks, while the western side features soft sedimentary outcrops (Figure 12). Seven distinct rock units have been differentiated and assigned lithological indices to inform road weight scores.
The rock properties help in determining the preferred road weight and optimal path selection. The rock units are categorized into two groups: hard and soft rocks (Table 3). Five rocks belonging to the hard rock category are ordered from very hard to less hard, including Pink Granite, Hammam Group Sediments, Volcanics and Meta Volcanics, Mélange, and Gray Granite, as shown in Figure 11a,b. Meanwhile, the soft group comprises the Gebel Dawi Limestone with shale interbeds and Quaternary wadi deposits of gravel and loose coarse sand (Figure 11c,d).
Furthermore, a lineament density map was generated to investigate the fragility and discontinuity of alternative paths (Figure 13). Lineament density was normalized into nine categories (Table 4), with higher density indicating more favorable paths and lower density indicating less favorable ones. Each alternative path is assigned a density score, which is integrated with other parameters to determine the weight and hazard levels associated with each path. The primary cause of road damage from geohazards is extensive excavations that create steep walls. In this study, when considering geological aspects, rock hardness and fracture density were specifically considered. Alignment alternatives were chosen to minimize significant road cuts and fills, considering geological factors along with others. This approach prioritizes line density over rock softness, as denser lines indicate better excavation capabilities, thereby reducing the risk of rockfall by minimizing wall formation through excavation, which is reflected in minimizing the cost of excavation.

4. HRS Results

To facilitate the representation of safety issues in GIS and analyze the highway route selection process, the road section was divided into 20-m interval segments. For each segment, the design factors outlined in Table 1 were determined for the existing road. The descriptive summary of the geometric and environmental parameters of the road is shown in Table 5.
The process depicted in Figure 3 was followed to evaluate the existing alignment and propose a preferred alignment. Multiple segments may have more than one alternative alignment to choose from. Figure 14 shows closer views with Google Earth Maps of Quseir Road, including existing, preferred, and alternative alignments at specified distances. Each distinct part of the road was studied and compared to valid design alternatives by calculating the average threat scores of each segment.
First, at 20-m intervals, the coordinates of each station point along the road centerline and the corresponding design factors, including horizontal and vertical geometric characteristics, hydrology data, and geology data, were retrieved for the existing alignment and all investigated alternatives. Subsequently, the design parameters were normalized using the risk intensity values specified in Table 1. Design factor weights (wi) generated through the DEMATEL process were then applied to each normalized design parameter. A threat score for each segment (TSi) was calculated using Equation (10) and presented on threat raster maps using GIS. For segments with multiple alternatives, the preferred alternative is determined by the one with the least average threat score ( T S A l t ) determined from Equation (11). Figure 15 shows the threat raster maps of the studied alternatives that resulted from Step 3 of the HDO methodology.
Figure 16 and Table 6 present the resultant Threat Score for both the existing alignment and the alternative alignments studied. It includes the distance studied, the name of each alignment (existing or alternative), and the values of minimum, maximum, and T S A v g along the distance. The alternatives with the least average threat scores in each segment are then connected to form a preferred alignment, depicted in green in the figures.
The threat raster maps displayed in Figure 16 illustrate how the threat scores vary between segments. For instance, between KM 0+000 and KM 10+000, the existing alternative exhibits a minimum TS value of 1.12, a maximum of 5.44, and an average TS ( T S A v g ) of 2.69. In contrast, the preferred alignment demonstrates minimum, maximum, and T S A v g values of 0.52, 4.68, and 2.27, respectively. In this section, the alignment was enhanced by eliminating horizontal curves with large radii and small deflection angles. Additionally, consecutive reverse curves were refined by increasing radii and the length of tangents between them to achieve better risk intensities for design parameters, as outlined in Table 4. Hence, radii exceeding 1000 m (when feasible) were utilized instead of sharp curves with radii less than 1000 m. Furthermore, the alignments were selected to minimize environmental implications, such as cutting through hard rocks or areas requiring additional flood protection.
Another example occurs between KM 64 and KM 73, where three alternatives were studied and compared to the existing alignment. The values indicate that Alternative 7A, which had the least T S A v g , constituted the improved alignment. Therefore, for each distance and alternative studied, the best alternative with the least T S A v g was chosen as part of the preferred alignment. Figure 17 displays the threat raster maps of the resultant preferred alignment.

5. Contributions and Limitations

This paper presented an HRS assessment methodology for selecting a preferred alignment while reducing a calculated threat score for mountainous highways. The study developed a systematic, data-driven framework for analyzing road alignment alternatives by assessing multiple risk factors related to geometric design and environmental factors. This approach aids in designing roads with safety and environmental considerations and allows for a more quantitative assessment of safety, moving beyond the traditional qualitative “safe or unsafe” design approach.
When compared to previous studies such as Zhang et al. [6], which integrated FTA and DEMATEL to measure geometric design quality, our study incorporated a multidimensional approach that simultaneously considers geometric, hydrological, and geological factors. Therefore, the resulting design risk factors and weights were different. In addition, GIS was used to visualize and analyze the threat scores of different road alternatives and to quantifiably compare between these alternatives.
Additionally, previous studies mentioned in Section 1.2 and Section 1.3 separately address hydrology and geology aspects. Our study integrates these factors to select the most suitable or preferred alignment. From a hydrological perspective, the hazard maps generated through floodplain mapping go beyond traditional highway studies that focus solely on providing flood mitigation measures for a predetermined alignment. The approach allows for the proactive identification of flood risks and the development of alignments that minimize exposure to these hazards.
The methodology used HEC-RAS 2D to simulate flood dynamics and design roads with improved flood resilience. This data-driven approach ensures that critical infrastructure can withstand hydrological challenges in mountainous regions, leading to safer and more reliable transportation networks. The methodology incorporated rainfall analysis, topographic study, floodplain 2D hydraulic simulation, hazard map creation, and road infrastructure considerations.
From a geological perspective, this research highlighted the importance of integrating detailed geological mapping into the highway design optimization process. By characterizing rock types and properties, the methodology allows engineers to select alignments with greater stability and minimize risks associated with geological hazards, potentially lowering construction costs by avoiding unstable areas and optimizing excavation requirements.
The study identified 14 design factors, as presented in Table 1, impacting road safety through an FTA approach, with risk intensity values determined from previous literature and guidelines. The study incorporated horizontal curve length, deflection angle, vertical curve length, and longitudinal grades. Having these factors within appropriate ranges, as explained, will provide improved stability for the vehicle. The DEMATEL method was then used to weigh design factors.
Results of the process showed that the design factor with the highest importance is the curve radius (qi = 2), followed by horizontal alignment change (angle of deflection) and vertical alignment change (qi = 1.83), horizontal curve length (qi = 1.33), and longitudinal grades (qi = 1.167). The four hydrological and geological factors (H, I, Lit, and LiD) were of equal and moderate importance (qi = 0.66).
The practical application of this methodology to Quseir Road in the Golden Triangle Region demonstrated its effectiveness and relevance in a real-world scenario. Multiple alignment alternatives were generated based on geometric, hydrological, and geological considerations. Each alternative was assessed against comprehensive criteria, including horizontal and vertical geometry, flood risk, rock hardness, and fracture density. These criteria are quantified using specific design parameters and risk factors, ensuring a detailed and objective assessment of each alternative.
The threat score (TS) for each road segment was calculated using a weighted combination of design parameters, allowing normalization and comparison of the alternatives based on their overall risk and suitability. Ultimately, alternatives with the lowest average threat scores in each segment were connected to form the preferred alignment, which showed a significant reduction in safety risks and hydrological and geological impacts. The process allowed for iterative refinement, where initial evaluations can lead to adjustments and improvements in the alternatives, further enhancing the outcome.
The comparison between alternatives demonstrated that alignment enhancements included eliminating horizontal curves with large radii and small deflection angles. Additionally, consecutive reverse curves were refined by increasing radii and the length of tangents between them to achieve better risk intensities for design parameters, as outlined in Table 1. Hence, radii exceeding 1000 m (when feasible) were utilized instead of sharp curves with smaller radii less than 1000 m.
The heterogeneity of surface and subsurface rock formations, especially in mountainous areas, significantly influenced the selection of a less hazardous and safer path. The litho-properties of the terrain help in determining the optimal route. Hard basement rocks scoring between 5 and 10 and sedimentary bedding scoring between 1 and 4, characterized by being massive, compact, and homogeneous, pose very high to highly vulnerable risks to road design. The distribution and density of lineaments, such as faults, joints, and foliations, are key geoenvironmental factors considered in selecting the route with the lowest threat scores.
Overall, the methodology used in this study is considered comprehensive due to consideration of the road, the driver, and the environment (in terms of hydrological and geological aspects). The methodology can be applied to the design of any type of road and can be tailored to specific design speeds or environments. The proposed methodology provides a valuable tool for engineers and policymakers to ensure the sustainable construction of safe and resilient transportation infrastructure in challenging environments and represents the best solution from both practical and engineering perspectives.
There are, however, several limitations that need to be considered in the future enhancement of the methodology. First, route selection is not applied using an optimization formulation of a model, such as the research presented by Zhang et al. [6]. Future work in this methodology will include using a 3-D approach to automate road alignment optimization instead of comparing between feasible alternatives. In addition, a broader analysis using genetic algorithms and path optimization methods could help refine the tool. Second, restricted sight distance should be added to the risk factor parameters and analyzed when choosing alternatives. Third, a design consistency approach could be incorporated into the risk factor parameters used in the analysis. Additionally, the method proposed is limited to zones without special environmental fragility or protection. Even though the cost was considered implicitly in the type of rocks excavated, a more explicit approach would be beneficial in future work, with the cost added as a factor. Moreover, the study primarily focused on avoiding extensive excavation to mitigate rockfall hazards, as mountainous roads typically follow the natural alignment of streams. The risk of rockfalls caused by excavation through the mountains was inherently considered a threat score based on geological factors. A detailed examination of dragging cases along the crossing wades has not been included. Future research should conduct an in-depth analysis of these dragging cases, as highlighted by other studies, such as [36].

Author Contributions

Conceptualization, D.S. and M.E.; methodology, D.S. and M.E.; software, A.F. and A.A.; validation, D.S., A.F. and A.A; investigation, D.S., A.F., A.A. and M.E.; resources, D.S. and M.E.; data curation, D.S., A.F., A.A. and M.E.; writing—original draft preparation, D.S., A.F., A.A. and M.E.; writing—review and editing, D.S., A.F., A.A. and M.E.; visualization, D.S., A.F., A.A. and M.E.; supervision, D.S. and M.E.; project administration, D.S. and M.E.; All authors have read and agreed to the published version of the manuscript.

Funding

This research received no external funding.

Institutional Review Board Statement

Not applicable.

Informed Consent Statement

Not applicable.

Data Availability Statement

Data are contained within the article.

Conflicts of Interest

The authors declare no conflicts of interest.

References

  1. World Health Organization. Global Status Report on Road Safety 2018: Summary; No. Who/nmh/nvi/18.20; World Health Organization: Geneva, Switzerland, 2018. [Google Scholar]
  2. Ma, L.; Yan, X.; Qiao, W. A quasi-poisson approach on modeling accident hazard index for urban road segments. Discret. Dyn. Nat. Soc. 2014, 2014, 489052. [Google Scholar] [CrossRef]
  3. Azari, M.; Paydar, A.; Feizizadeh, B.; Hasanlou, V.G. A gis-based approach for accident hotspots mapping in mountain roads using seasonal and geometric indicators. Appl. Geomatics 2023, 15, 127–139. [Google Scholar] [CrossRef]
  4. Yu, R.; Xiong, Y.; Abdel-Aty, M. A correlated random parameter approach to investigate the effects of weather conditions on crash risk for a mountainous freeway. Transp. Res. Part C Emerg. Technol. 2015, 50, 68–77. [Google Scholar] [CrossRef]
  5. Transportation Research Board. The National Academies of Sciences, Engineering, and Medicine. In A Performance-Based Highway Geometric Design Process; The National Academies Press: Washington, DC, USA, 2016. [Google Scholar]
  6. Zhang, H.; Zhang, M.; Zhang, C.; Hou, L. Formulating a gis-based geometric design quality assessment model for mountain highways. Accid. Anal. Prev. 2021, 157, 106172. [Google Scholar] [CrossRef] [PubMed]
  7. Jha, M.K.; Schonfeld, P. A highway alignment optimization model using geographic information systems. Transp. Res. Part A Policy Pract. 2004, 38, 455–481. [Google Scholar] [CrossRef]
  8. Castro, M.; De Santos-Berbel, C. Spatial analysis of geometric design consistency and road sight distance. Int. J. Geogr. Inf. Sci. 2015, 29, 2061–2074. [Google Scholar] [CrossRef]
  9. Blanton, P.; Marcus, W.A. Railroads, roads and lateral disconnection in the river landscapes of the continental united states. Geomorphology 2009, 112, 212–227. [Google Scholar] [CrossRef]
  10. Youssef, A.M.; Pradhan, B.; Hassan, A.M. Flash flood risk estimation along the st. Katherine road, southern sinai, Egypt using gis based morphometry and satellite imagery. Environ. Earth Sci. 2011, 62, 611–623. [Google Scholar] [CrossRef]
  11. Zhang, L. Engineering Properties of Rocks; Butterworth-Heinemann: Oxford, UK, 2016. [Google Scholar]
  12. Liu, J.; Cao, Z.; Li, X.; Wang, W.; Hou, J.; Li, D.; Ma, Y. Modelling urban flooding integrated with flow and sediment transport in drainage networks. Sci. Total Environ. 2022, 850, 158027. [Google Scholar] [CrossRef] [PubMed]
  13. Yang, J.; Townsend, R.D.; Daneshfar, B. Applying the hec-ras model and gis techniques in river network floodplain delineation. Can. J. Civ. Eng. 2006, 33, 19–28. [Google Scholar] [CrossRef]
  14. Ekblaw, G.E.; Grim, R.E. Some Geological Relations between the Constitution of Soil Materials and Highway Construction; Report of Investigations, No. 042; Illinois State Geological Survey: Champaign, IL, USA, 1936. [Google Scholar]
  15. Burgat, V.A. Application of geology in kansas highway construction. Trans. Kans. Acad. Sci. (1903-) 1964, 67, 301–306. [Google Scholar] [CrossRef]
  16. Hearn, G.J.; Pettifer, G.S. The role of engineering geology in the route selection, design and construction of a road across the blue nile gorge, Ethiopia. Bull. Eng. Geol. Environ. 2016, 75, 163–191. [Google Scholar] [CrossRef]
  17. Smugala, S.; Kubečková, D.; Indra, F. The impact of changes in the geological conditions of road bedrock layers while the road was in use. Organ. Technol. Manag. Constr. Int. J. 2019, 11, 2009–2021. [Google Scholar] [CrossRef]
  18. Sadek, S.; Kaysi, I.; Bedran, M. Geotechnical and environmental considerations in highway layouts: An integrated gis assessment approach. Int. J. Appl. Earth Obs. Geoinf. 2000, 2, 190–198. [Google Scholar] [CrossRef]
  19. Li, P.; He, J. Geometric design safety estimation based on tire–road side friction. Transp. Res. Part C Emerg. Technol. 2016, 63, 114–125. [Google Scholar] [CrossRef]
  20. AASHTO. A Policy on Geometric Design of Highways and Streets, 7th ed.; American Association of State Highway and Transportation Officials: Washington, DC, USA, 2018. [Google Scholar]
  21. ECP. Egyptian Code of Practice in Urban and Rural Roads; Ministry of Housing, Utilities and Urban Communities: Cairo, Egypt, 2023. [Google Scholar]
  22. Zhao, X.; Rong, J. The relationship between driver fatigue and monotonous road environment. In Computational Intelligence for Traffic and Mobility; Springer: Berlin/Heidelberg, Germany, 2012; pp. 19–36. [Google Scholar]
  23. Rosey, F.; Auberlet, J.-M. Trajectory variability: Road geometry difficulty indicator. Saf. Sci. 2012, 50, 1818–1828. [Google Scholar] [CrossRef]
  24. Marinos, V.; Carter, T.G. Maintaining geological reality in application of gsi for design of engineering structures in rock. Eng. Geol. 2018, 239, 282–297. [Google Scholar] [CrossRef]
  25. Hoek, E.; Brown, E.T. Practical estimates of rock mass strength. Int. J. Rock Mech. Min. Sci. 1997, 34, 1165–1186. [Google Scholar] [CrossRef]
  26. Onyango, J.A.; Sasaoka, T.; Shimada, H.; Hamanaka, A.; Moses, D.; Tumelo, D. Evaluating rock mass properties of vipingo coral limestone quarry based on a modified geological strength index (gsi) and state of karstification. Open J. Geol. 2022, 12, 57–79. [Google Scholar] [CrossRef]
  27. Ogrodnik, K. The use of the dematel method to analyse cause and effect relationships between sustainable development indicators. Econ. Environ. 2018, 67, 13. [Google Scholar]
  28. Tsou, P.-H.; Hsu, H.-Y. Applications of fishbone diagram and DEMATEL technique for improving warehouse operation—A case study on YMT overseas imported components. China-USA Bus. Rev. 2022, 21, 143–154. [Google Scholar] [CrossRef]
  29. Gobashy, M.M.; Eldougdoug, A.; Abdelwahed, M.; Abdelazeem, M.; El-Rahman, Y.A.; Abdelhalim, A.; Said, S. Role of integrated magnetics and geology in tracking and exploring complex structures controlling gold mineralization. Example from the fawakheir-atalla gold prospects, eastern desert, Egypt. Pure Appl. Geophys. 2023, 180, 2775–2805. [Google Scholar] [CrossRef]
  30. Abdelhalim, A.; Aboelkhair, H.; Hamimi, Z.; Al-Gabali, M. Mapping lineament features using gis approaches: Case study of neoproterozoic basement rocks in the south-eastern desert of Egypt. Arab. J. Geosci. 2020, 13, 651. [Google Scholar] [CrossRef]
  31. Gobashy, M.M.; Eldougdoug, A.; Abdelazeem, M.; Abdelhalim, A. Future development of gold mineralization utilizing integrated geology and aeromagnetic techniques: A case study in the barramiya mining district, central eastern desert of Egypt. Nat. Resour. Res. 2021, 30, 2007–2028. [Google Scholar] [CrossRef]
  32. Eldougdoug, A.; Abdelazeem, M.; Gobashy, M.; Abdelwahed, M.; El-Rahman, Y.A.; Abdelhalim, A.; Said, S. Exploring gold mineralization in altered ultramafic rocks in south abu marawat, eastern desert, Egypt. Sci. Rep. 2023, 13, 7293. [Google Scholar] [CrossRef] [PubMed]
  33. Abdelhalim, A.; Abuelella, I.; Sakran, S.M.; Said, S.M. Implementation of space-borne optical data and field investigation for geo-structural mapping of an interior rift basin: A case study from kharit area, southeastern desert, Egypt1037. J. Min. Environ. 2023, 14, 1037–1059. [Google Scholar]
  34. Ma, X.; Chen, F.; Chen, S. Modeling crash rates for a mountainous highway by using refined-scale panel data. Transp. Res. Rec. J. Transp. Res. Board 2015, 2515, 10–16. [Google Scholar] [CrossRef]
  35. Rusli, R.; Haque, M.M.; King, M.; Voon, W.S. Single-vehicle crashes along rural mountainous highways in malaysia: An application of random parameters negative binomial model. Accid. Anal. Prev. 2017, 102, 153–164. [Google Scholar] [CrossRef]
  36. Alexander, J.; Cooker, M.J. Moving boulders in flash floods and estimating flow conditions using boulders in ancient deposits. Sedimentology 2016, 63, 1582–1595. [Google Scholar] [CrossRef]
Figure 1. Research Methodology.
Applsci 14 05844 g001
Figure 2. Fault-Tree Analysis of Mountainous Highway Crashes.
Applsci 14 05844 g002
Figure 3. GIS-Based Highway Route Selection of Preferred Alignment.
Applsci 14 05844 g003
Figure 4. Step 1: Excel-based Computation of Northing and Easting Coordinates and Geometric, Hydrology, and Geology Design Factors.
Applsci 14 05844 g004
Figure 5. Step 2: Computing Normalized Risk Intensity Value (RIN) to Standardize Geometric and Environmental Characteristics.
Applsci 14 05844 g005
Figure 6. Step 3: GIS Platform to (a) Calculate Threat Score (TS) for Each Segment and (b) Compare between Alternatives.
Applsci 14 05844 g006
Figure 7. (a) Road Location in Golden Triangle Region; (b) DEM Model showing Existing Alignment of 180-km Segment of Quseir Road and 90-km Case Study in Yellow.
Applsci 14 05844 g007
Figure 8. Existing Alignment of 90-km Segment of Quseir Road (Case Study). (a) Horizontal Alignment. (b) Vertical Alignment. (c) Typical Cross-Section.
Applsci 14 05844 g008
Figure 9. Flood Plain Analysis of Study Area. (a) Flood Water Depth Distribution. (b) Flood Velocity Distribution. (c) Flood Hazard Map.
Applsci 14 05844 g009
Figure 10. Digital Geological Map.
Applsci 14 05844 g010
Figure 11. Geological Setting Along the Road. (a) Hard Rigid Rocks. (b) Sedimentary Rocks of the Gebel Dawi. (c) Alluvium Quaternary Deposits Along Wadis. (d) Shale Interbeds within LS.
Applsci 14 05844 g011
Figure 12. Cross section of the Proposed Road Zone from East to West.
Applsci 14 05844 g012
Figure 13. Lineament Density Map of the Road Zone Characterized from 1 (Very High) to 10 (Very Low).
Applsci 14 05844 g013
Figure 14. Google Earth Maps of Quseir Road of Existing, Preferred, and Alternatives Alignments at Specified Distances (a) KM 0+000–KM 10+000. (b) KM 10+000–KM 22+000. (c) KM 22+000–KM 34+000. (d) KM 34+000–KM 40+000. (e) KM 55+000–KM 62+000. (f) KM 62+000–KM 66+000. (g) KM 66+000–KM 71+000. (h) KM 71+000–KM 81+000. (i) KM 81+000–KM 91+000.
Applsci 14 05844 g014aApplsci 14 05844 g014b
Figure 15. Threat Raster Maps of Existing, Preferred, and Alternative Alignments at Specified Distances. (a) KM 0+000–KM 10+000. (b) KM 10+000–KM 22+000. (c) KM 22+000–KM 34+000. (d) KM 34+000–KM 40+000. (e) KM 55+000–KM 62+000. (f) KM 62+000–KM 66+000. (g) KM 66+000–KM 71+000. (h) KM 71+000–KM 81+000. (i) KM 81+000–KM 91+000.
Applsci 14 05844 g015aApplsci 14 05844 g015b
Figure 16. Quseir Road (Existing and Preferred Alignments) (a) DEM Map. (b) Threat Raster Map.
Applsci 14 05844 g016
Figure 17. Threat Raster Maps of Preferred Alignment. (a) Curve Radius. (b) Deflection Angle. (c) Horizontal Curve Length. (d) Vertical Alignment Change. (e) Longitudinal Grade. (f) Slope Length. (g) Flood Hazard. (h) Lithology Type. (i) Lineament. (j) Threat Score.
Applsci 14 05844 g017
Table 1. Design Risk Factors (DFi), Risk Intensity (RIN) of Design Factors, and DEMATEL Results [20,21].
No.Design Risk Factors
(DFi)
Risk Factor RangesRisk Intensity (RIN)
(1–10)
Distributing Influence
(Di)
Receiving Influence (Rj)Relative Importance (qi)Net Effect
(ni)
Weight (wi)
1Tangent lengthLt (m)Between reverse curves0.0000.0000.0000.0000.051
Lt < 2 V6
2 V ≤ Lt < 20 V2
Between curves in same direction
Lt < 6 V6
6 V ≤ Lt < 20 V2
Lt ≥ 20 V6
2Horizontal Curve RadiusRi (m)Ri < 600101.5000.5002.0001.0000.090
600 ≤ Ri < 10008
1000 ≤ Ri < 55002
Ri ≥ 55001
3Deflection AngleD (°)Δ < 5100.0001.8331.833−1.8330.088
5 ≤ Δ < 108
10 ≤ Δ < 154
15 ≤ Δ < 252
Δ > 258
4Horizontal Curve LengthLh (m)Lh < 200100.8330.5001.3330.3330.081
200 ≤ Lh < 6008
600 ≤ Lh < 25002
Lh ≥ 25006
5Vertical alignment grade differenceA (%)A < 120.0001.8331.833−1.8330.088
1 ≤ A < 26
2 ≤ A < 38
A ≥ 310
6Longitudinal gradeG (%)0 ≤ G < 0.360.6670.5001.1670.1670.078
0.3 ≤ G < 32
G ≥ 310
7Slope lengthLp (m)Lp < 30060.0000.5000.500−0.5000.064
300 ≤ Lp < 700 2
Lp ≥ 7006
8Crest curve parameterkc (m)Rci < 7400100.3330.0000.3330.3330.060
7400 ≤ Rci < 15,0006
Rci ≥ 15,0001
9Sag curve parameterks (m)Rsi < 5500100.3330.0000.3330.3330.060
5500 ≤ Rsi < 11,0006
Rsi ≥ 11,0001
10Vertical curve lengthLv (m)Lv < 70100.0000.6670.667−0.6670.068
70 ≤ Lv < 1106
Lv ≥ 1101
11Flood HazardH (-)Table 20.6670.0000.6670.6670.068
12Road Infrastructure
Flood Hazard
I (-)I ≥ 0.5100.6670.0000.6670.6670.068
I < 0.55
13Lithology Type Lit (-)Table 30.6670.0000.6670.6670.068
14Lineament DensityLiD (%)Table 40.6670.0000.6670.6670.068
Table 2. Hydrogeological Hazard Levels.
Hazard LevelDescription
1Generally safe for people, vehicles, and buildings
2Unsafe for small vehicles
3Unsafe for vehicle and vulnerable people
4Unsafe for people and vehicle
5Unsafe for people, vehicles and some buildings
6Unsafe for people, vehicles and all buildings
Table 3. Rock Properties Index.
Rock TypeRock CategoryRisk IndexScore
Pink GraniteVery hard massiveVery High9–10
Hammam sediments groupHard High7–8
Meta volcanics HardHigh7
Gray Granite fracturedHardHigh7
Mélange Hard mixed compositeHigh5–6
SedimentsHard to soft Moderate3–4
Wadi depositsLoose and SoftLow 2–1
Table 4. Lineament Density Index.
Lineament DensityPropertiesScore
0–0.000460876Very low9–10
0.000460876–0.000938212Low8
0.000938212–0.001399088Low-Medium7
0.001399088–0.001859964Medium-Low 6
0.001859964–0.0023373Medium5
0.0023373–0.002798176Medium to High4
0.002798176–0.003259052High3
0.003259052–0.003736388High 1–2
0.003736388–0.004197264Very High1
Table 5. Descriptive Summary of the Existing Highway Design Factors of Quseir Road.
Design Risk Factors
(DFi)
No. of ElementsMinimum ValueMaximum ValueMean ValueStandard Deviation
Tangent LengthLt (m)12538.862158.5515.06518.02
Horizontal Curve RadiusRi (m)1269010,0001657.13025.36
Horizontal Curve LengthLh (m)12615.5538.34215.8057121.08
Angle of DeflectionD (°)1260.026160.6534.5842529.19
GradientsG (%)453±0.04%±4.5%0.36%0.93%
Elevations(m)45330.05546.25 m283.41140
Vertical Alignment Grade DifferenceA (%)4530.03%5.8%1%1.03%
Slope LengthLp (m)45356.312078700421
Road Length in Contact with Flood HazardH88 Km164.41.4
Table 6. Threat Score Values ( T S M i n , T S M a x , and T S A v g ) of Existing Alignment, Alternatives, and Preferred Alignment.
KP FromKP ToAlternativesThreat Scores
MinMaxAvg
0+00010+000Existing1.125.442.69
Alternative 1A0.534.682.27
10+00022+000Existing1.393.831.92
Alternative 2A0.863.161.69
Alternative 2B1.543.942.07
Alternative 2C1.062.951.88
22+00033+000Existing0.95.152.23
Alternative 3A0.924.581.86
33+00040+000Existing1.74.653.08
Alternative 4A1.273.982.95
Alternative 4B1.614.152.86
55+00061+500Existing0.994.622.75
Alternative 5A1.224.162.55
61+50064+000Existing1.125.523.41
Alternative 6A1.173.572.15
Alternative 6B1.524.752.46
64+00068+000Existing0.264.392.54
Alternative 7A1.124.062.42
Alternative 7B1.024.392.54
Alternative 7C1.113.782.42
68+00080+000Existing0.956.422.99
Alternative 8A1.314.682.9
80+00090+000Existing0.726.123.33
Alternative 9A0.534.052.64
0+00090+000Existing0.726.422.47
Preferred Alignment0.534.682.27
Disclaimer/Publisher’s Note: The statements, opinions and data contained in all publications are solely those of the individual author(s) and contributor(s) and not of MDPI and/or the editor(s). MDPI and/or the editor(s) disclaim responsibility for any injury to people or property resulting from any ideas, methods, instructions or products referred to in the content.

