Abstract
The NFC and MIFARE systems (referred to as HF-band RFID) are a special case of Radio Frequency Identification (RFID) technology using a radio frequency of 13.56 MHz for communication. The declared range of such communication is usually several cm and is characterized by the need to bring the data carrier close to the system reader. Due to the possibility of transmitting sensitive data in this type of system, an important problem seems to be the electromagnetic security of the transmitted data between the cards (tags) and the reader and within the system. In most of the available research studies, the security of RFID systems comes down to the analysis of the effectiveness of encryption of transmitted data or testing the range of communication between the reader and the identifier. In this research, however, special attention is paid to the so-called electromagnetic information security without the analysis of cryptographic protection. In some cases (e.g., data retransmission), encryption may not be an effective method of securing data (because, e.g., encrypted data might be used to open and start a car with a keyless system). In addition, the research draws attention to the fact that the data from the identifier can be accessed not only from the identifier, but also from the control system (reader, wiring, controller, etc.) from which the data can be radiated (unintentionally) at a much greater distance than the communication range between the identifier and the reader. In order to determine the security of the transmitted data in the HF-band RFID systems, a number of tests were carried out with the use of specialized equipment. During the measurements, both the data carriers themselves (cards, key fobs, stickers, tags) and exemplary systems for reading data from the media (a writable card reader, a mobile phone with NFC function, and an extensive access control system) were tested. The experiments carried out made it possible to determine the safety of NFC and MIFARE systems during their use and only storage (e.g., the ability to read data from an identification card stored in a pocket).
1. Introduction
1.1. Use and Threats of NFC Technology
The presented work is a continuation of previous research, the results of which were published in the journal Electronics in 2023 as a Cover [1].
Short-range communication systems such as NFC and MIFARE are systems with very similar operations and, consequently, have similar applications. They operate on the basis of a radio frequency of 13.56 MHz and in some cases can be used interchangeably (Mifare Desire). These systems have been used, among others, in the following areas:
- Mobile payments [2];
- Access control [3];
- Cashless payments for public transport tickets [4];
- Health care [5];
- Monitoring the strain condition of critical structures [6,7];
- Tickets to events such as concerts;
- Loyalty programs;
- Campus cards;
- Tolls (vignettes);
- Parking management
- Internet of Things (IoT).
The operation of these systems involves the transmission of data between the identifier and the individual elements of the control system. It is the data transmission process that can pose a great threat to the security of the transmitted data, which may include personal data, identification numbers, medical data, permits to enter controlled access areas, etc. Such data can then be used, for example, to forge the original identifier or directly transmit data to terminals without the cardholder’s knowledge.
Among the most important risks associated with the use of NFC or MIFARE (this applies to virtually every RFID standard) are the following [8,9]:
- Interception of transmissions and copying of data to another medium or use of such data for a specific purpose;
- Transmission of data from an identifier located at a large distance from the reader using an additional transmission channel (so-called theft by a suitcase);
- Blocking the system by generating a high-power signal in the frequency band used by the system.
The results of the research presented in the following part of the article and the conclusions resulting from them do not take into account the software security measures used, such as encryption of transmitted information. They primarily concern the aspect of electromagnetic information penetration, i.e., the possibility of receiving an electromagnetic emission correlated with the transmitted information at any point of the system used (e.g., ID, reader, controller, wiring, etc.).
1.2. Design of the HF-Band RFID System
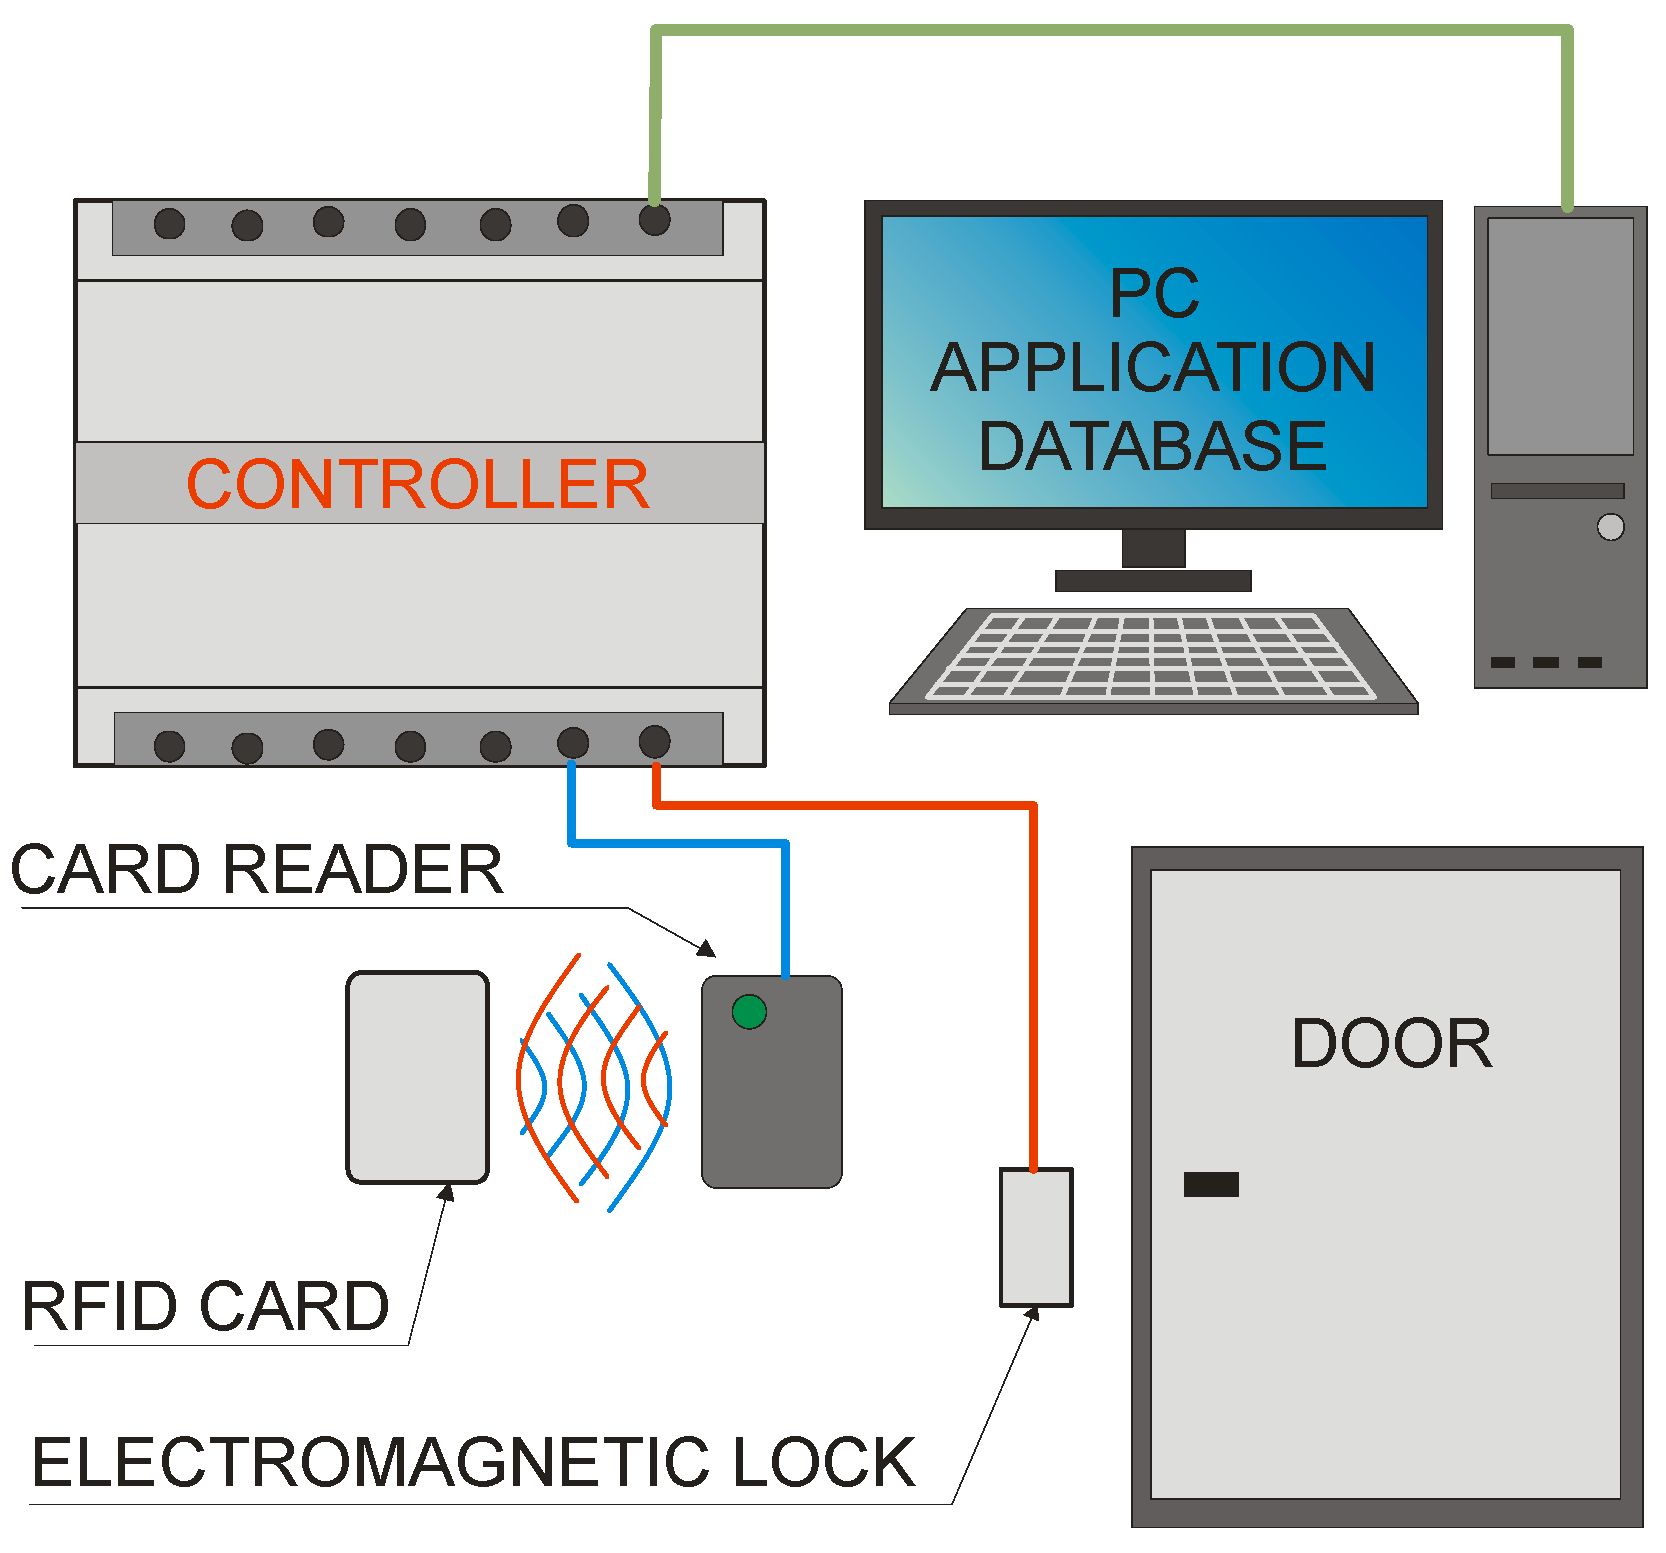
The basic elements of the NFC and MIFARE system, as in other RFID solutions, are an identifier, a reader, and a controller (in some cases it can be integrated with a reader). In addition, depending on the application, it can be supplemented with a computer, electromagnetic locks and others. A simple diagram of such a system in use as an access control system is shown in Figure 1.
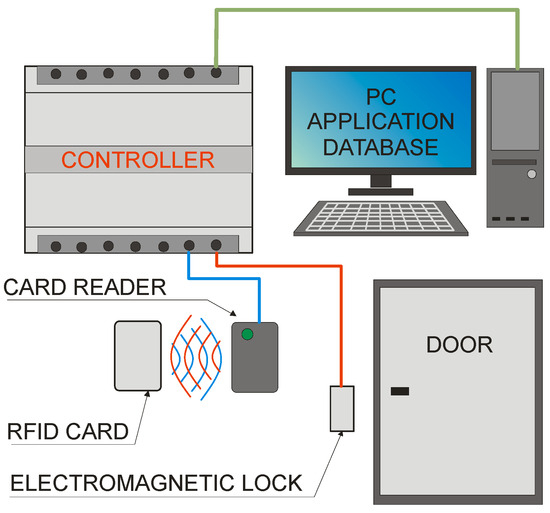
Figure 1.
Sample diagram of an access control system.
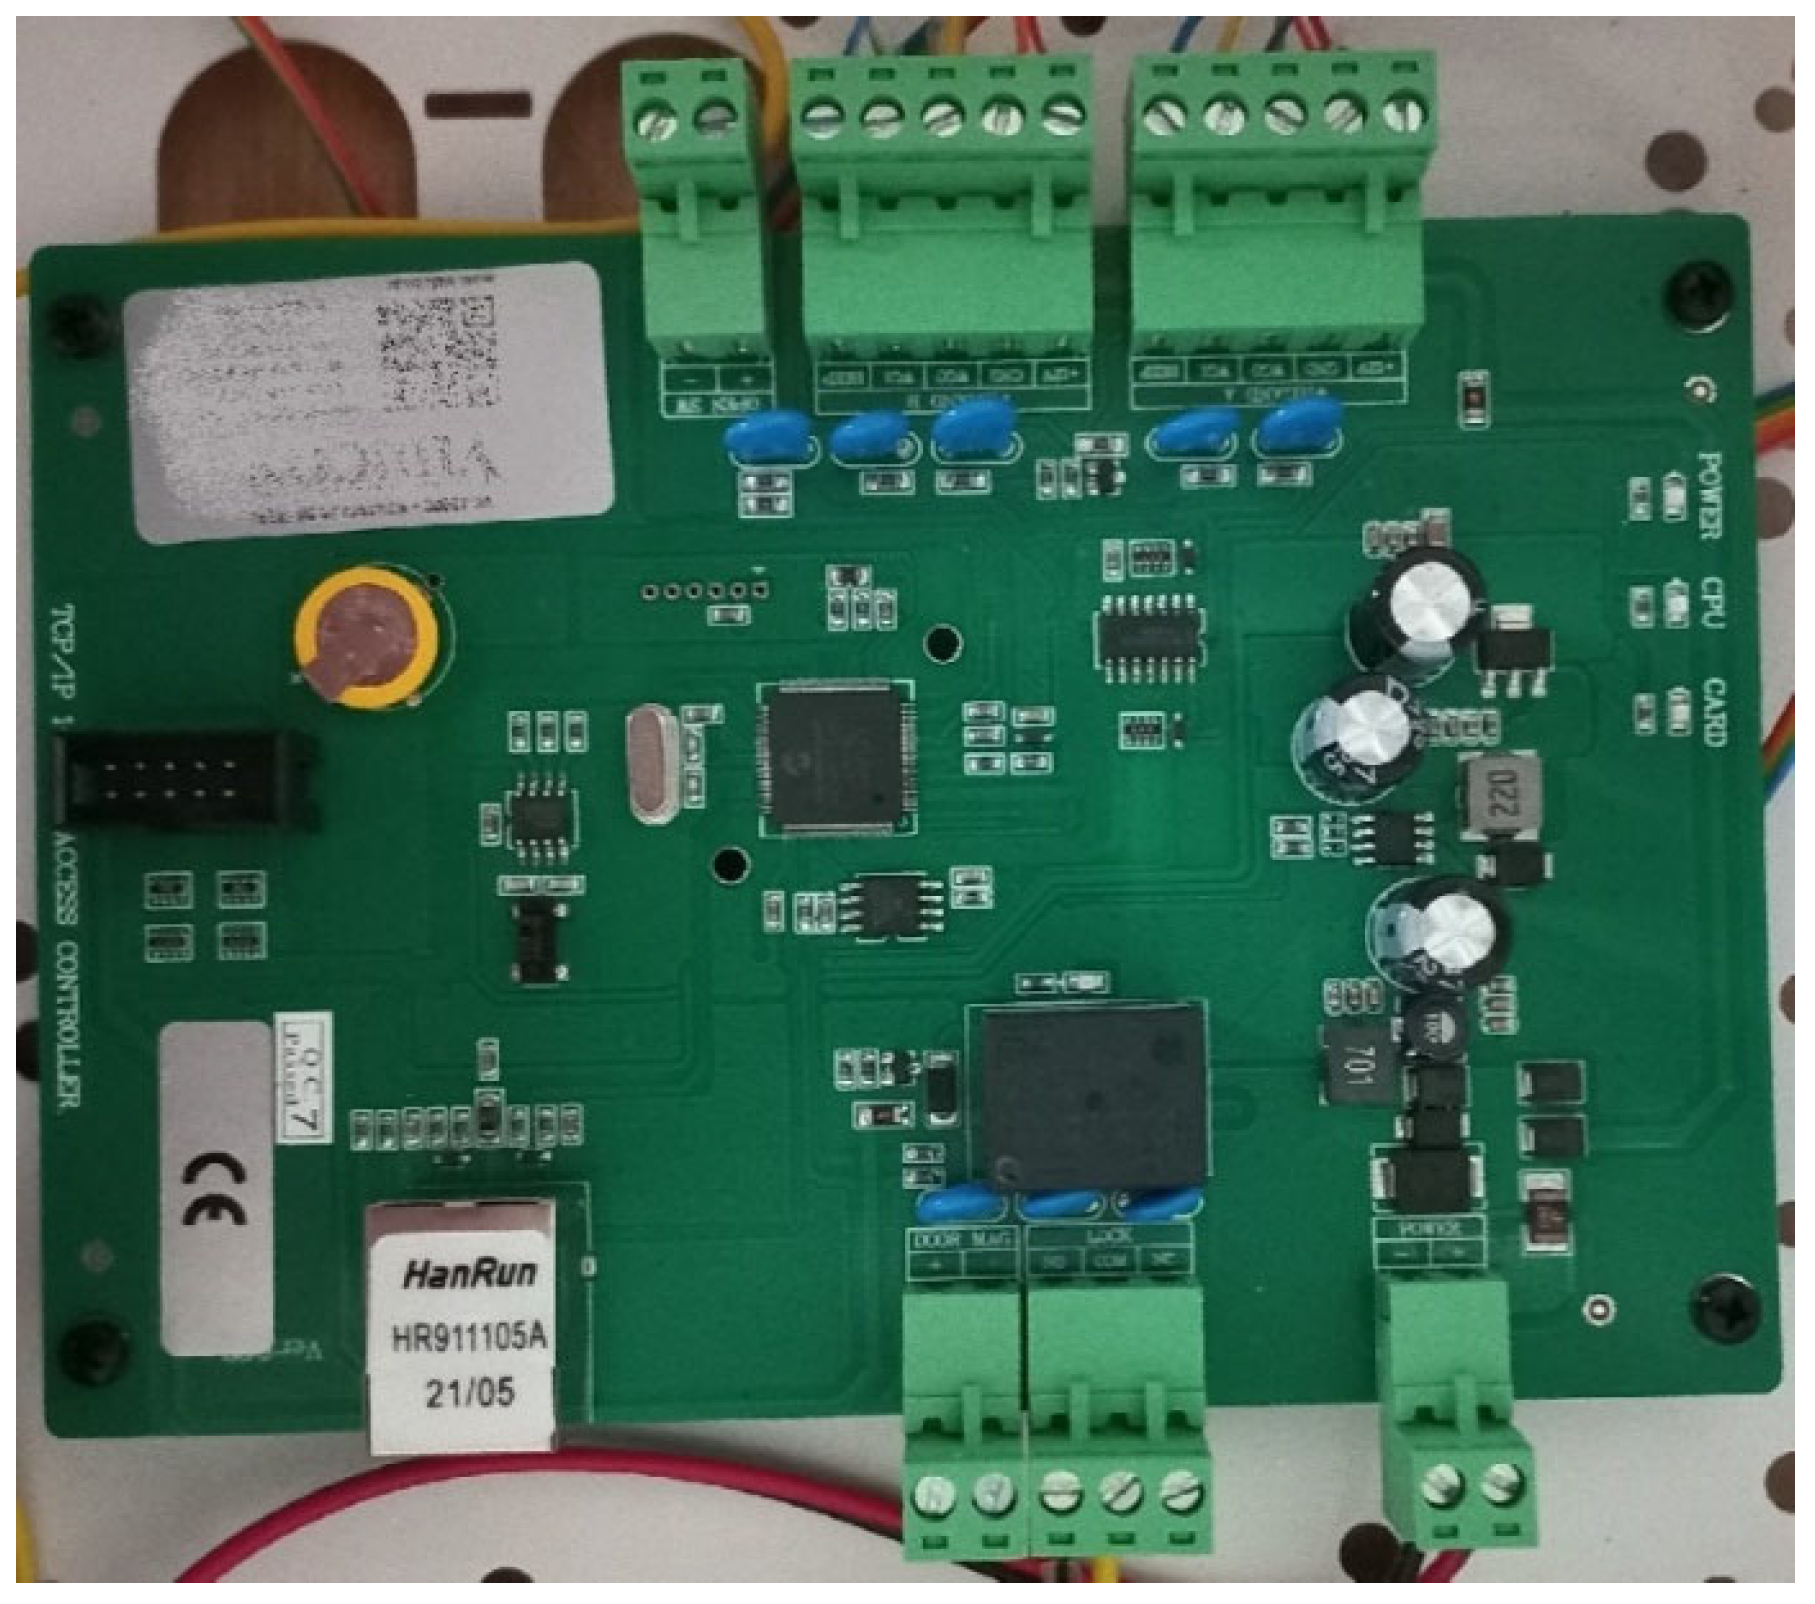
1.2.1. Controller
The most important element of the HF-band RFID system is the controller (Figure 2). It is responsible for controlling the actuators of the system, such as barriers (bars), gates, and electromagnetic locks, based on the data on accepted identifiers programmed and stored in it. In addition, it controls the badge readers by supplying power to them and activating or blocking the badge reading function. In complex systems (e.g., time and attendance control), the controller cooperates with the computer, sending to it information about the read identifier data, along with information about the reading time and the access zone. The controllers can operate one door zone (entrance and exit) as well as several door zones (also entry and exit).

Figure 2.
Single-zone controller—one door, entrance and exit.
1.2.2. Computer
A computer cooperating with the controller, together with a dedicated application, is used to program the controller—entering identifier data along with access to individual zones and storing data on the input/exit request to/from the zone. By using the NFC card programmer, it can also save the necessary data on it for later use in the system.
1.2.3. Reader
The task of the card reader (identifiers, Figure 3) is to generate an electromagnetic field of the appropriate frequency (13.56 MHz and, in the case of readers supporting two RFID standards, additionally 125 kHz) and the current sufficient to power the identifier. In addition, in the case of readers in NFC (or MIFARE) systems, it is necessary to have an appropriate time course of the generated signal, which will initiate the exchange of data between the reader and the identifier. At the same time, the reader decodes and demodulates the identifier signal and sends the signal via the bus to the controller.
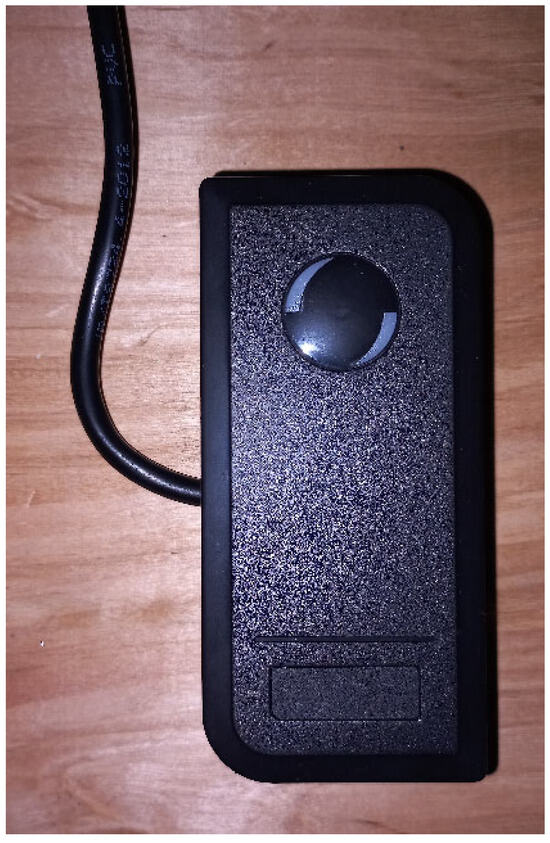
Figure 3.
Universal reader—LF-band RFID and HF-band RFID.
1.2.4. Electromagnetic Lock
The electromagnetic lock (deadbolt, gate) has an executive function. Controlled by the voltage supplied from the controller, it unlocks the door, the bolt, or allows the gate to rotate. The lock itself usually does not send a return signal to the controller. Information about opening or closing the door is usually provided to the controller by an additional element, such as a magnetic sensor.
1.2.5. Identifier
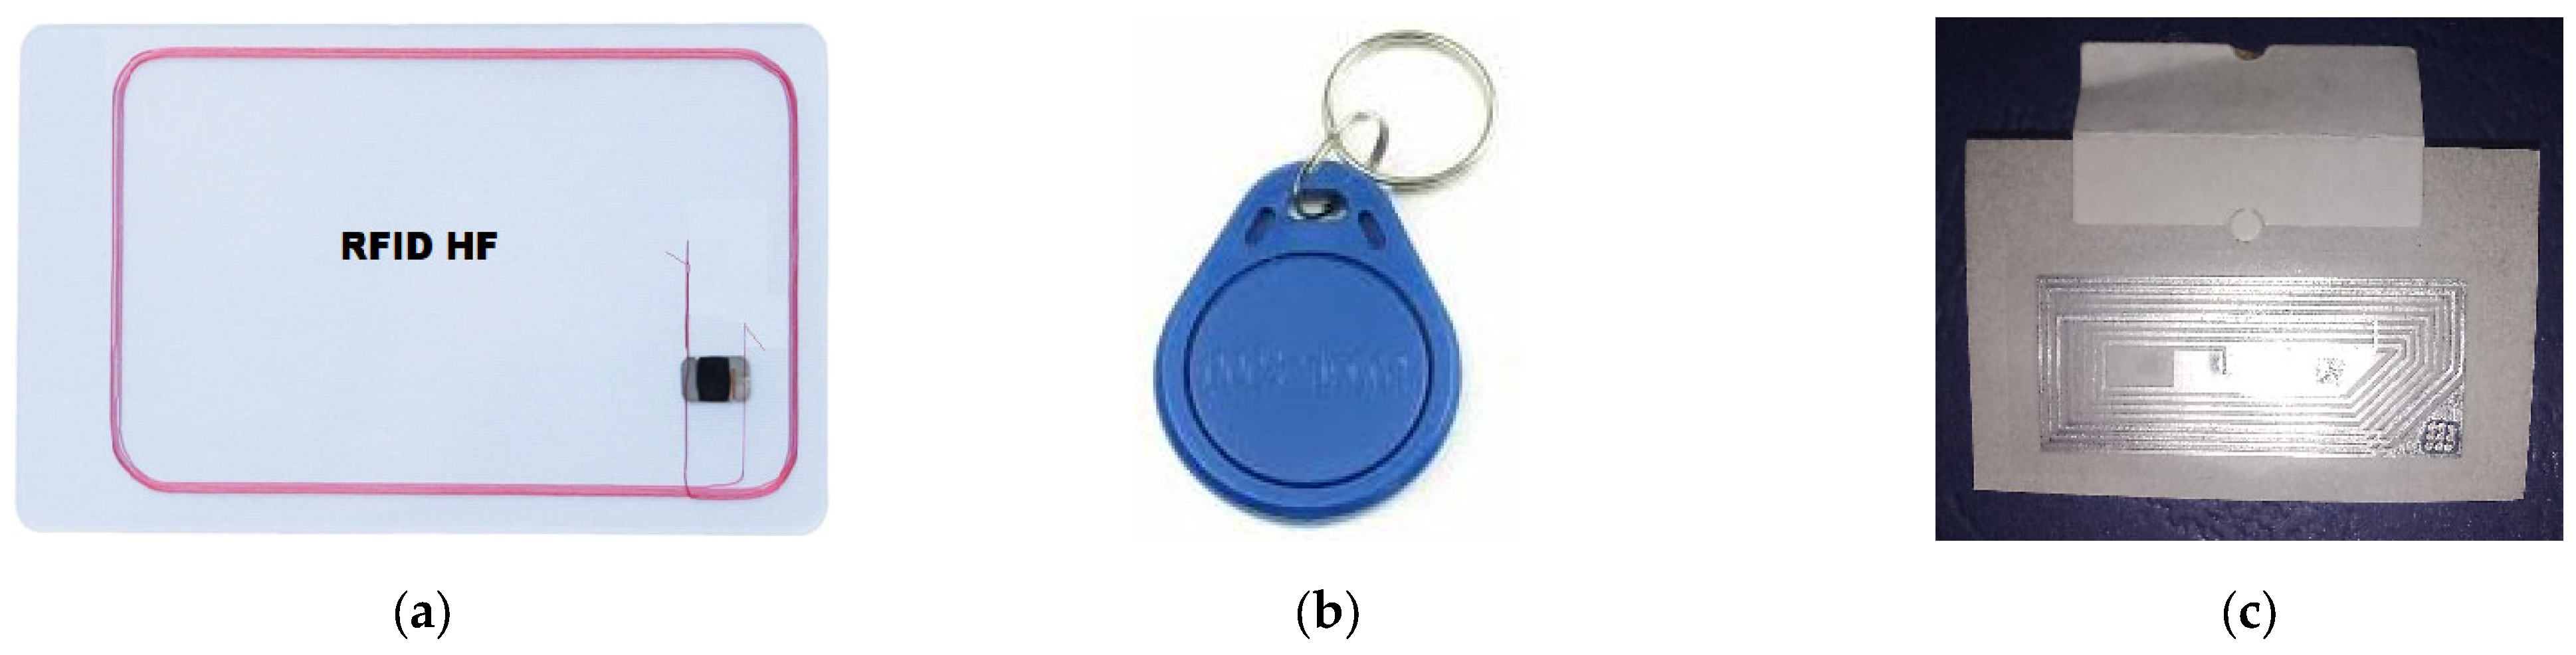
The most common form of ID is a plastic card or key ring (Figure 4).

Figure 4.
Example TAGS identifiers: (a) RFID card, (b) key ring, (c) sticker.
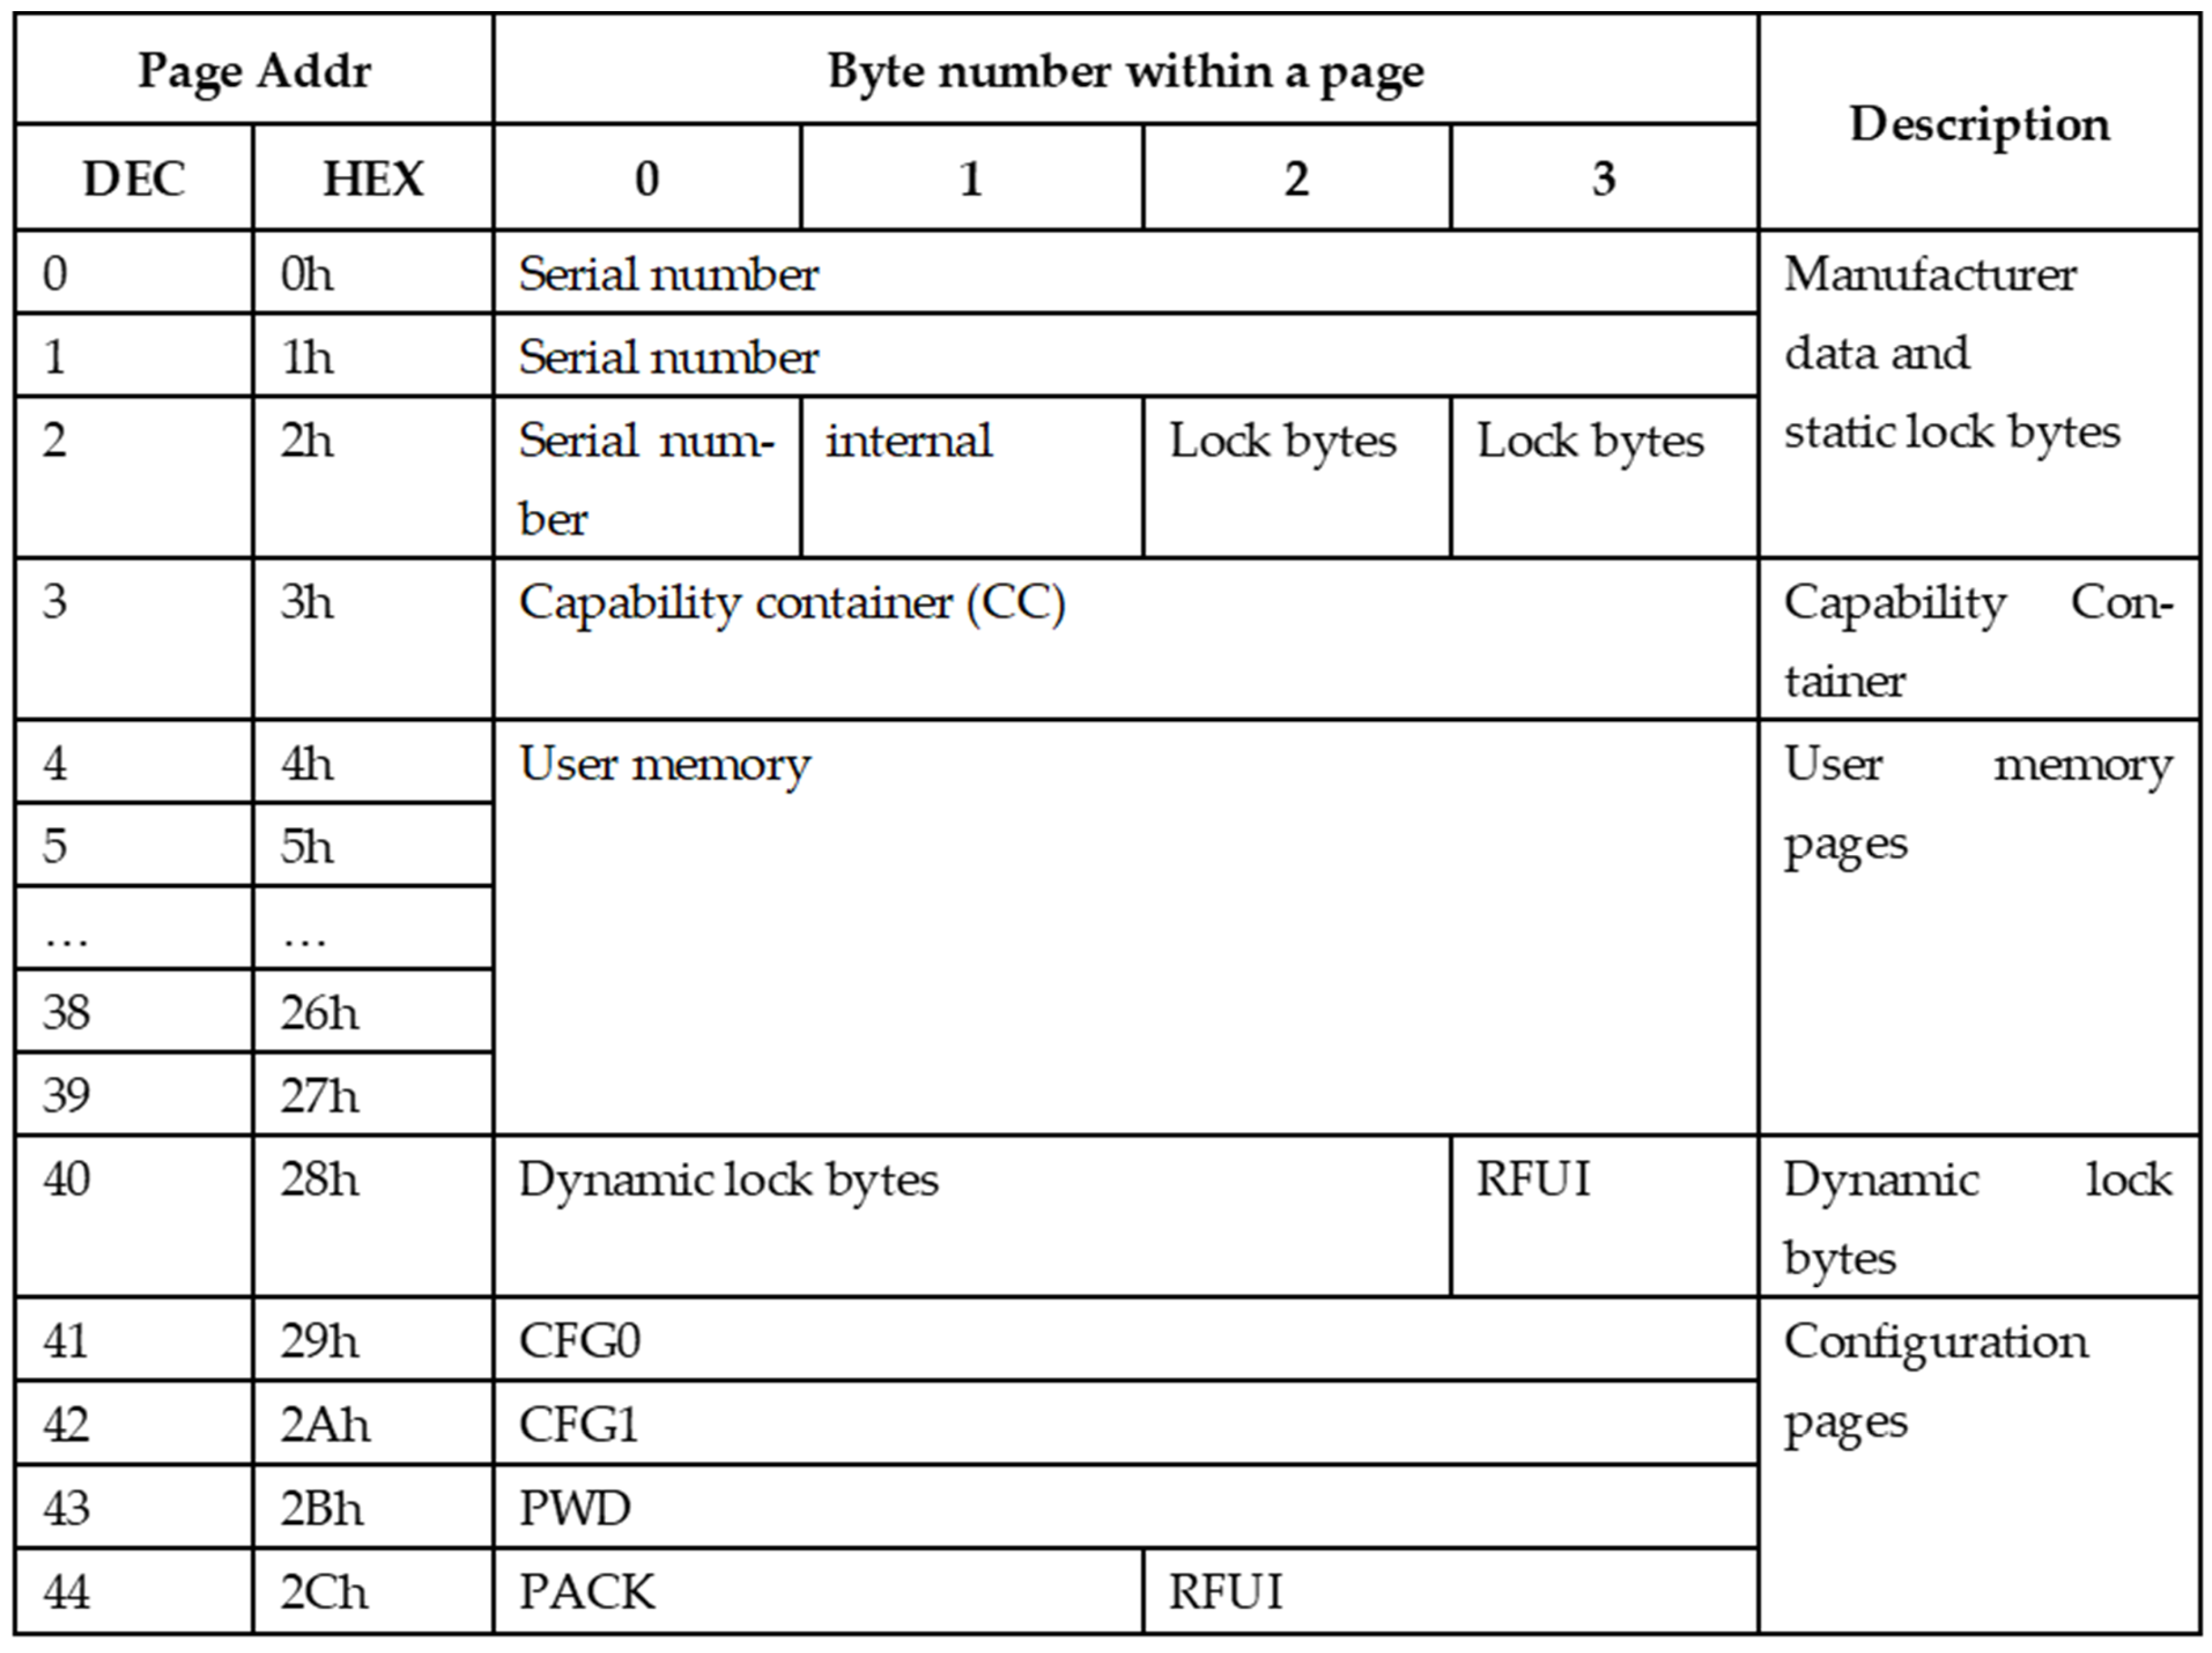
It consists of a coil embedded in plastic and an electronic circuit (chip), the task of which is to encode the data stored in its memory and keying the coil based on it. Identifiers in the HF-band RFID system usually do not have their own power source. They are powered by an electromagnetic field generated by the reader [10,11,12]. The most common integrated circuits are the NTAG213, NTAG215 or NTAG 216 family with a total memory of 180 to 924 bytes [13,14,15]. The memory structure of this chip is shown in Figure 5.
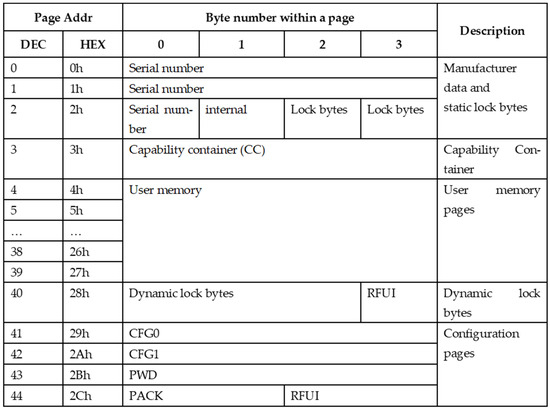
Figure 5.
Structure of data stored in the identifier layout (NTAG213).
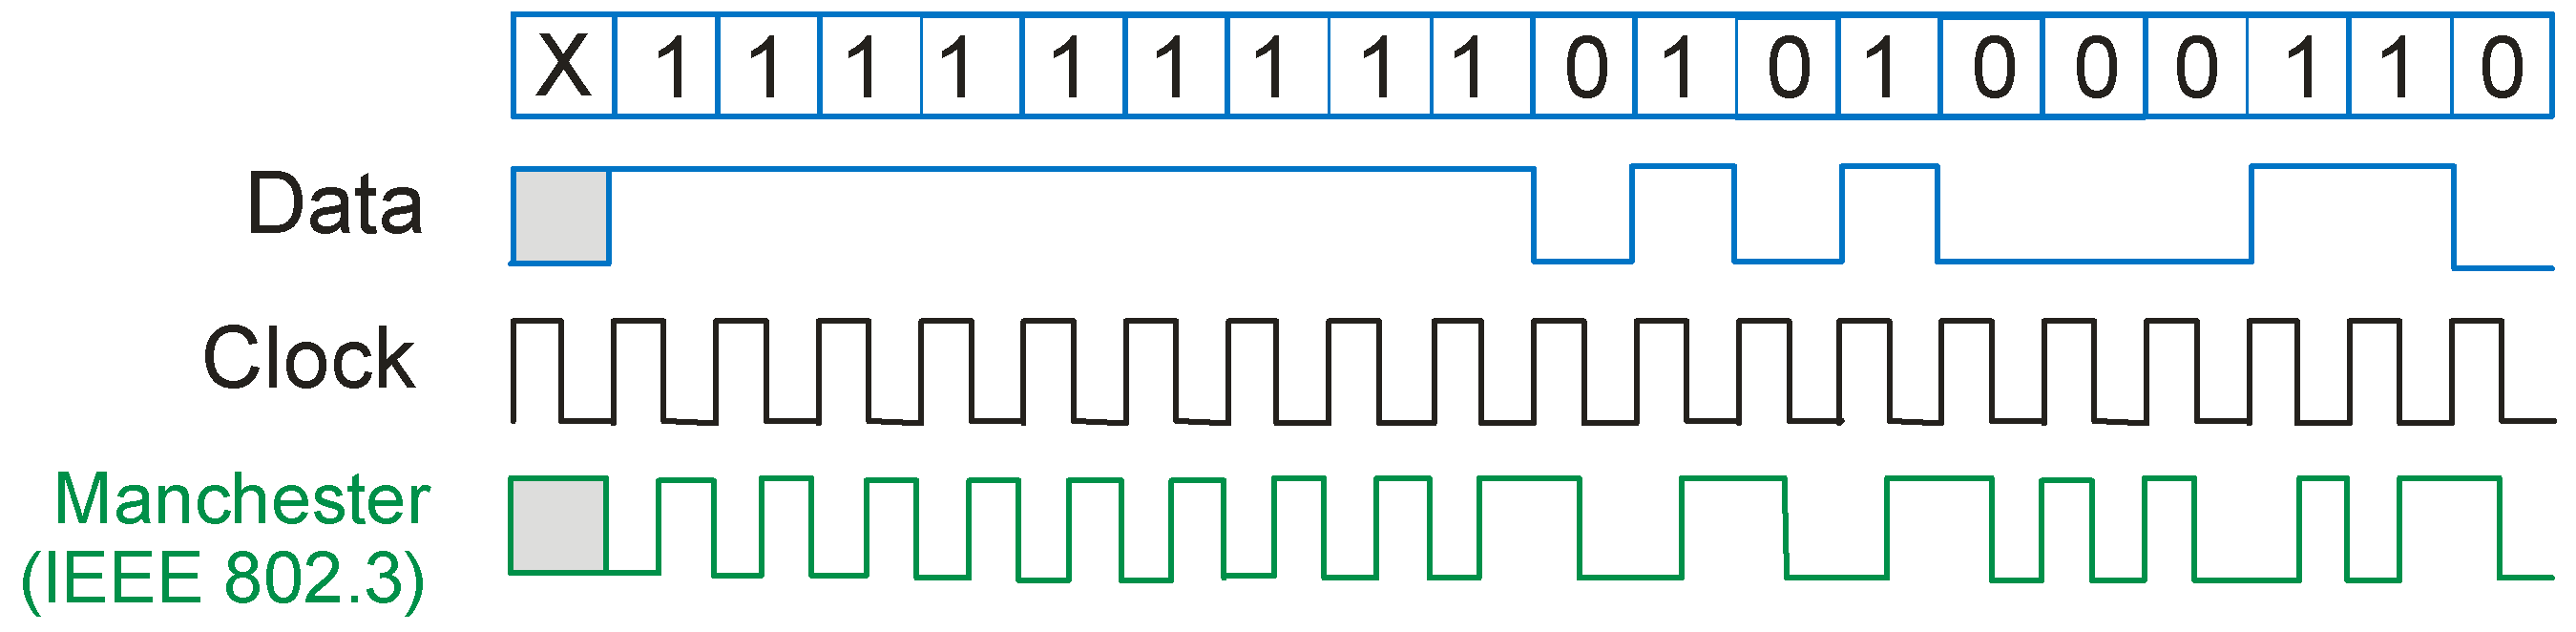
The data from the system are output serially, but unlike LF-band RFID systems, the identifier is waiting for the reader to send a query. Before sending, the data are usually encoded in the Manchester system [16] shown in Figure 6.
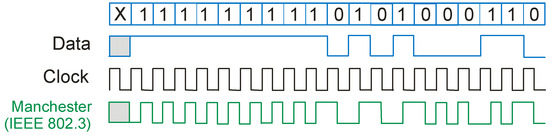
Figure 6.
Manchester coding.
2. Electromagnetic Safety of Identifier
2.1. Determination of the Threshold Magnetic Field Strength
In the case of electromagnetic information security of passive data carriers, a very important parameter is the threshold strength of the electromagnetic (magnetic) field, at which the identifier is able to accumulate the energy necessary for operation and at the same time start communication with the reader. In order to determine this parameter, the measurement system (Table 1) is presented in the Figure 7.

Table 1.
List of apparatus used to carry out the measurements.
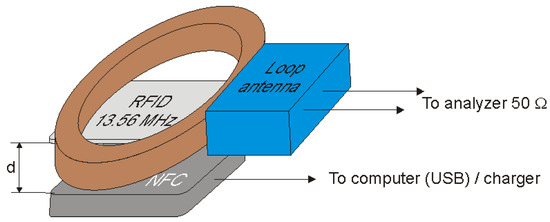
Figure 7.
Measuring system for determining the minimum value of the magnetic field strength necessary for the ID to operate.
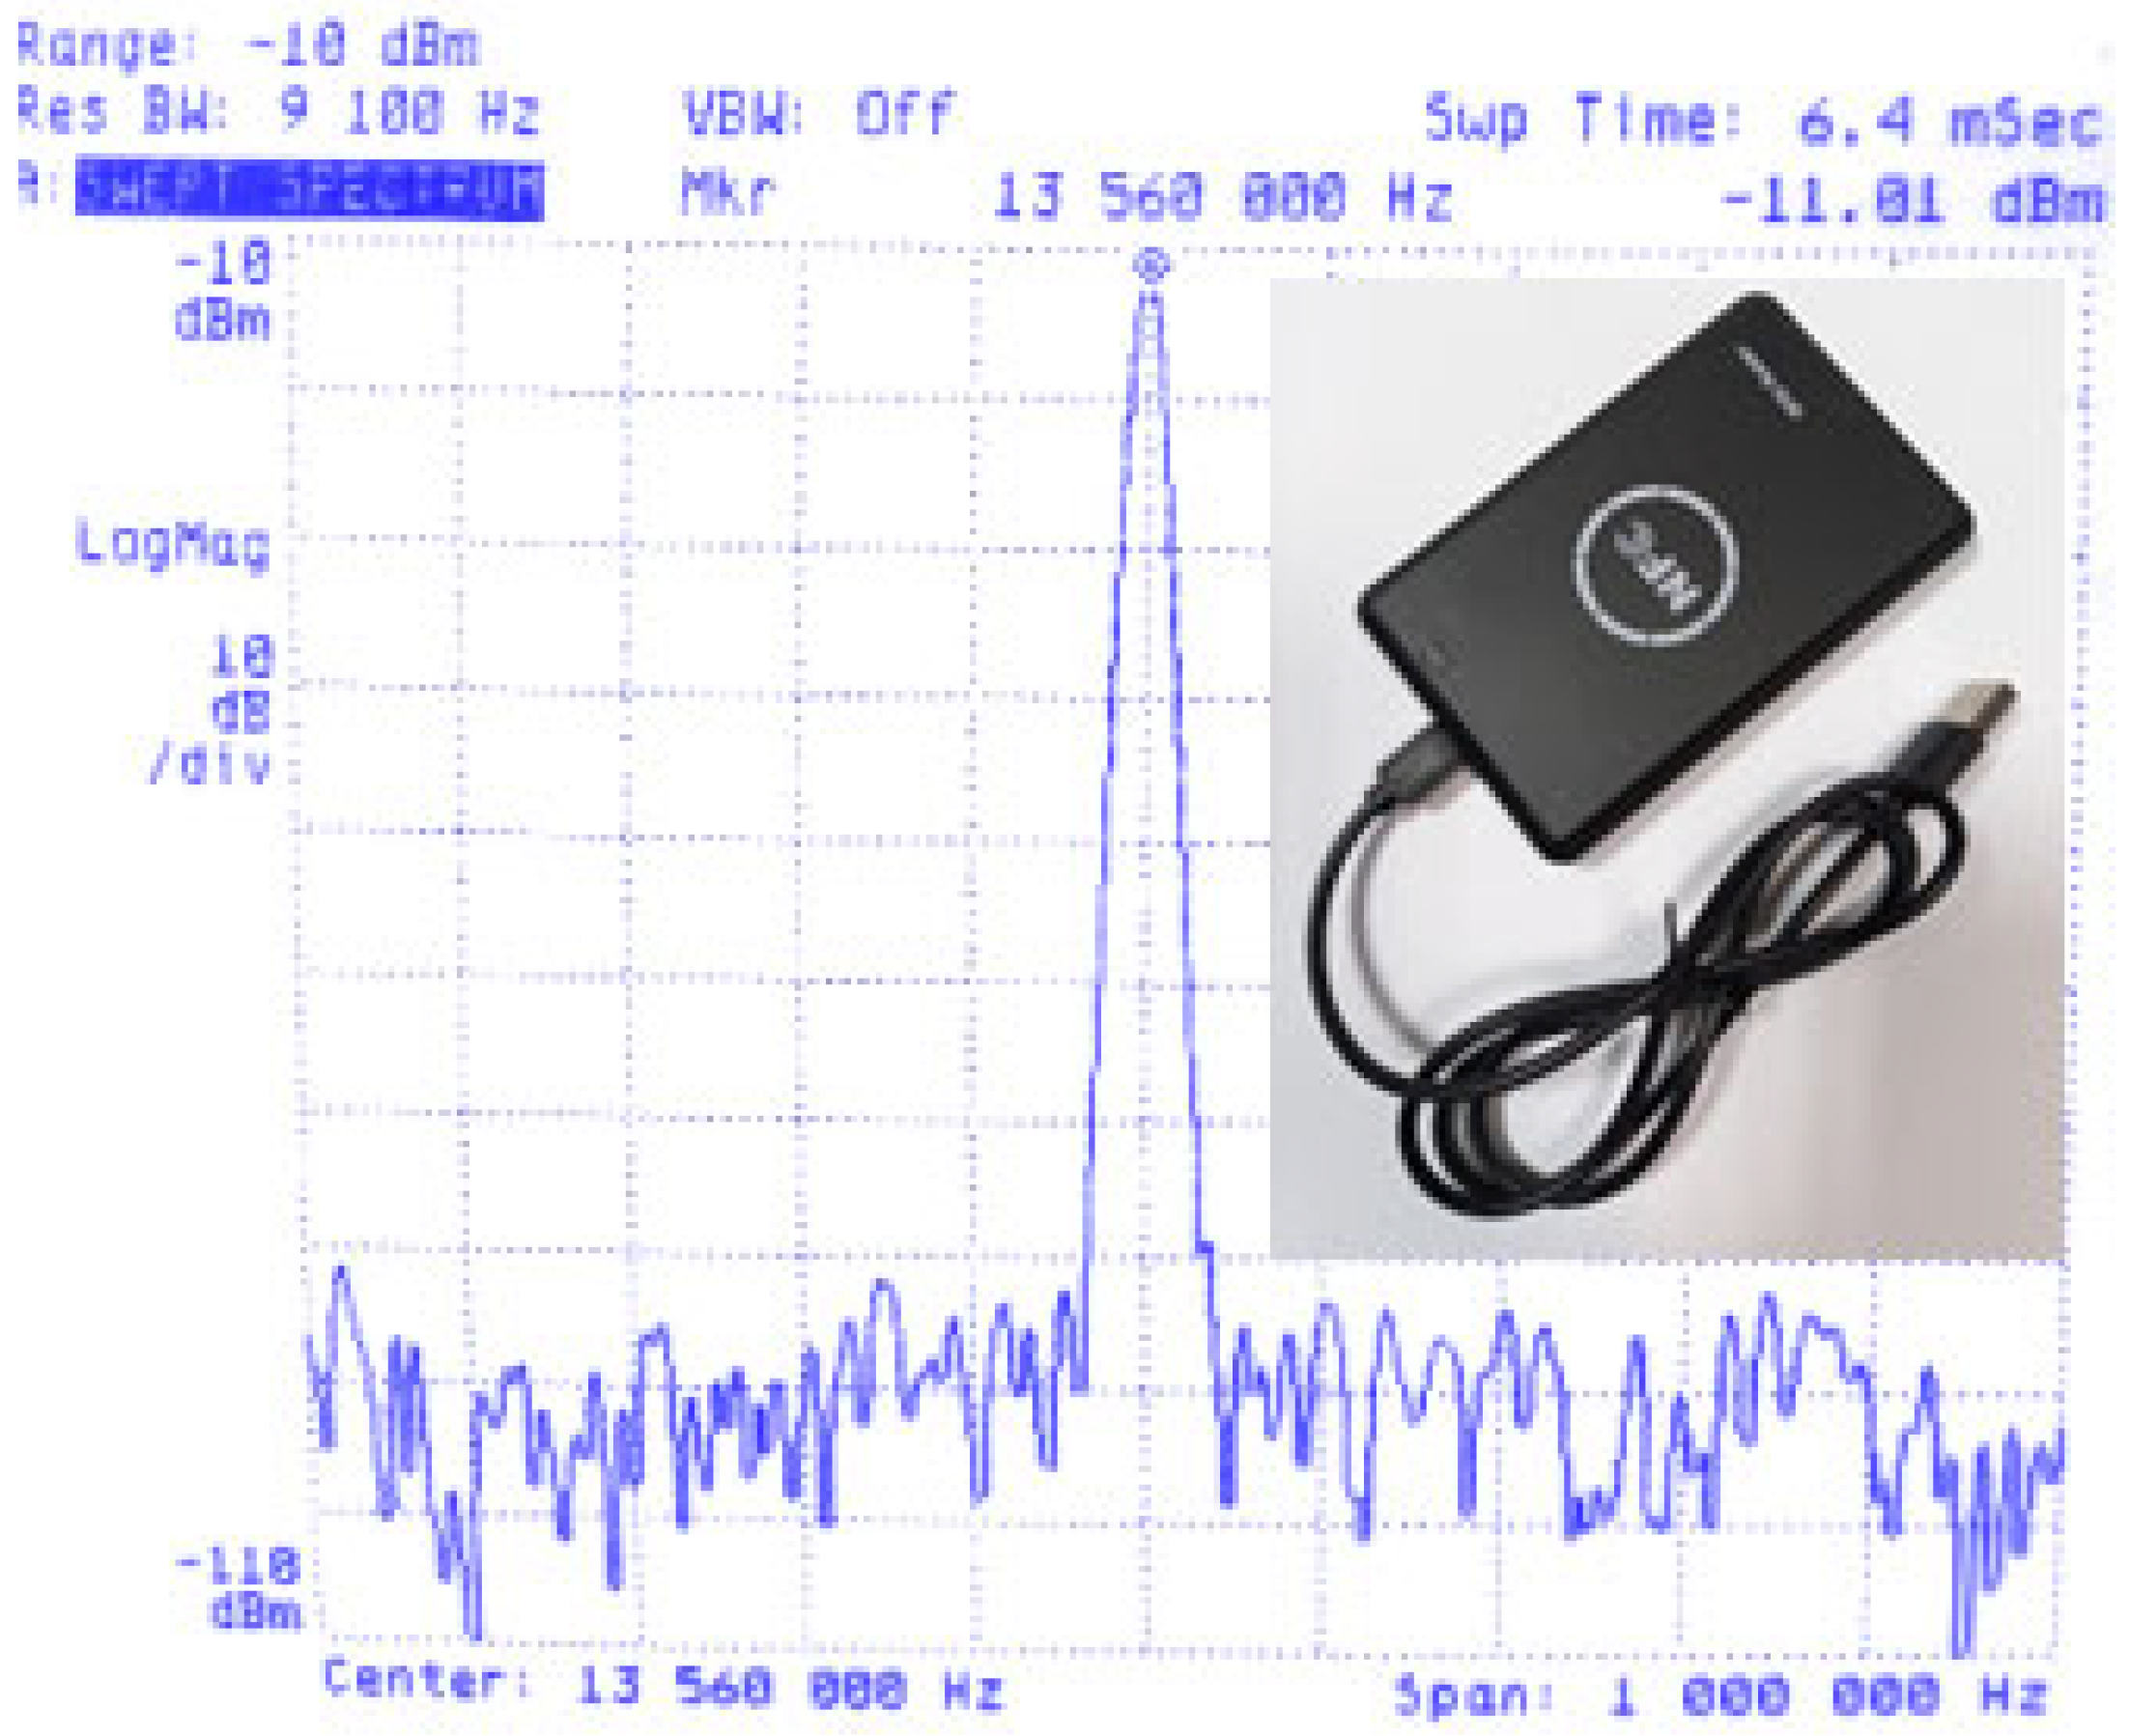
In the case of NFC and MIFARE identifiers, a harmonic magnetic field of a certain intensity is not sufficient to start data transmission through the identifier, as is the case with LF (125 kHz) RFID systems. In order to start the transmission, it is necessary for the reader to send an appropriate request. This feature of the system made it necessary to use a ready-made NFC reader in the measurements instead of a simple coil (magnetic antenna) connected to a signal generator. The NFC reader used, and the characteristics of its radiation are shown in Figure 8.
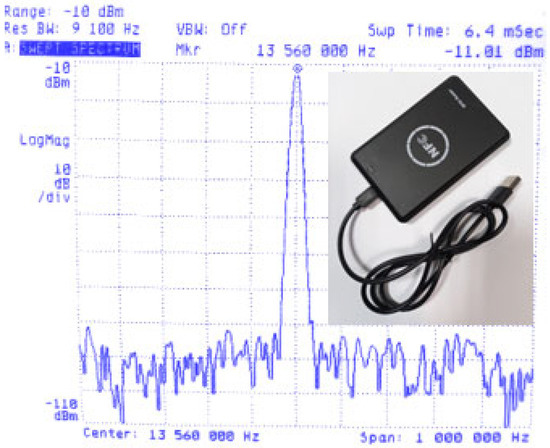
Figure 8.
Universal LF-band RFID and HF-band RFID ID reader–programmer and frequency characteristics of its radiation.
During the measurement, the ID card was held close to the reader until the communication was established (which was signaled by a diode and a sound by the reader). Then, a magnetic antenna connected to a spectrum analyzer was placed at the same distance and the level of magnetic field strength was read (after taking into account the values of the antenna’s correction factors).
The measured level of the magnetic field necessary for the ID to operate (threshold level) is similar to that of LF-band RFID and amounted to approx. 85 dBμA/m.
2.2. Modulation Depth Factor as a Function of Distance of Receiving Coil from ID Card
The modulation depth factor (Figure 9) is one of the most important parameters of a signal that determines its readability. It is defined by two signal parameters— and and its value is calculated according to the relationship (1). The modulation depth factor is often expressed as a percentage (2).
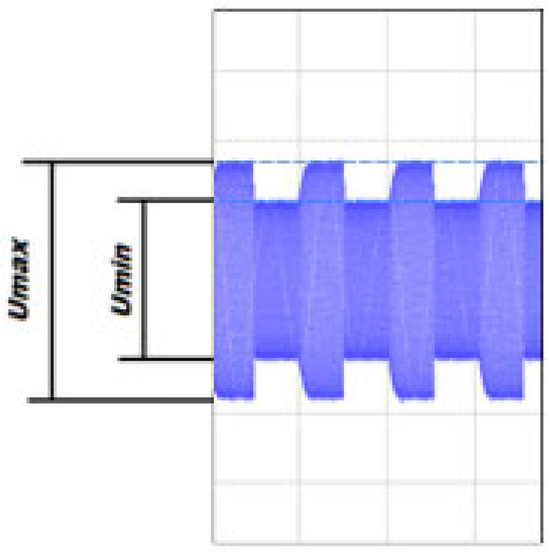
Figure 9.
Parameters defining the modulation depth factor.
Signals with a modulation depth factor of less than 2% are usually difficult to identify on the one hand and susceptible to electromagnetic disturbances occurring in the environment on the other. Examples of NFC signal waveforms corresponding to modulation depth for and were presented in Figure 10.
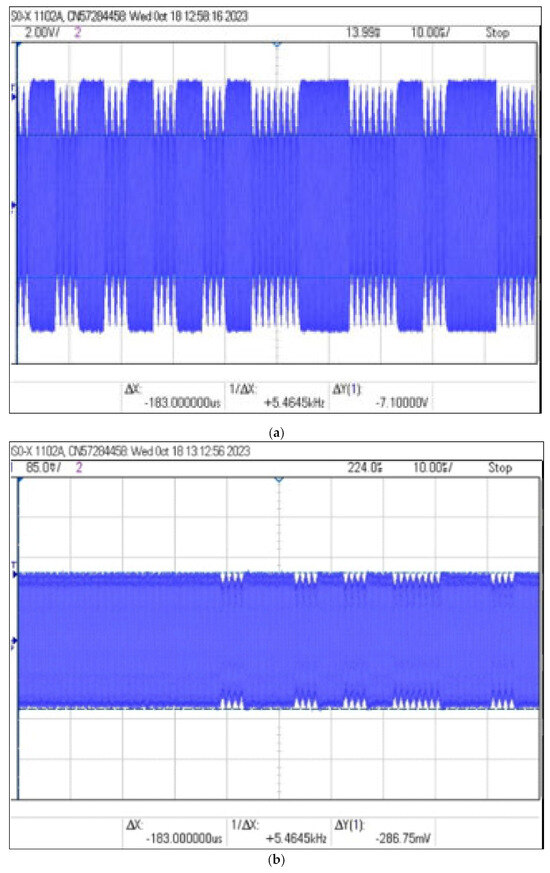
Figure 10.
Examples of NFC signal waveforms corresponding to modulation depth: (a) , (b) .
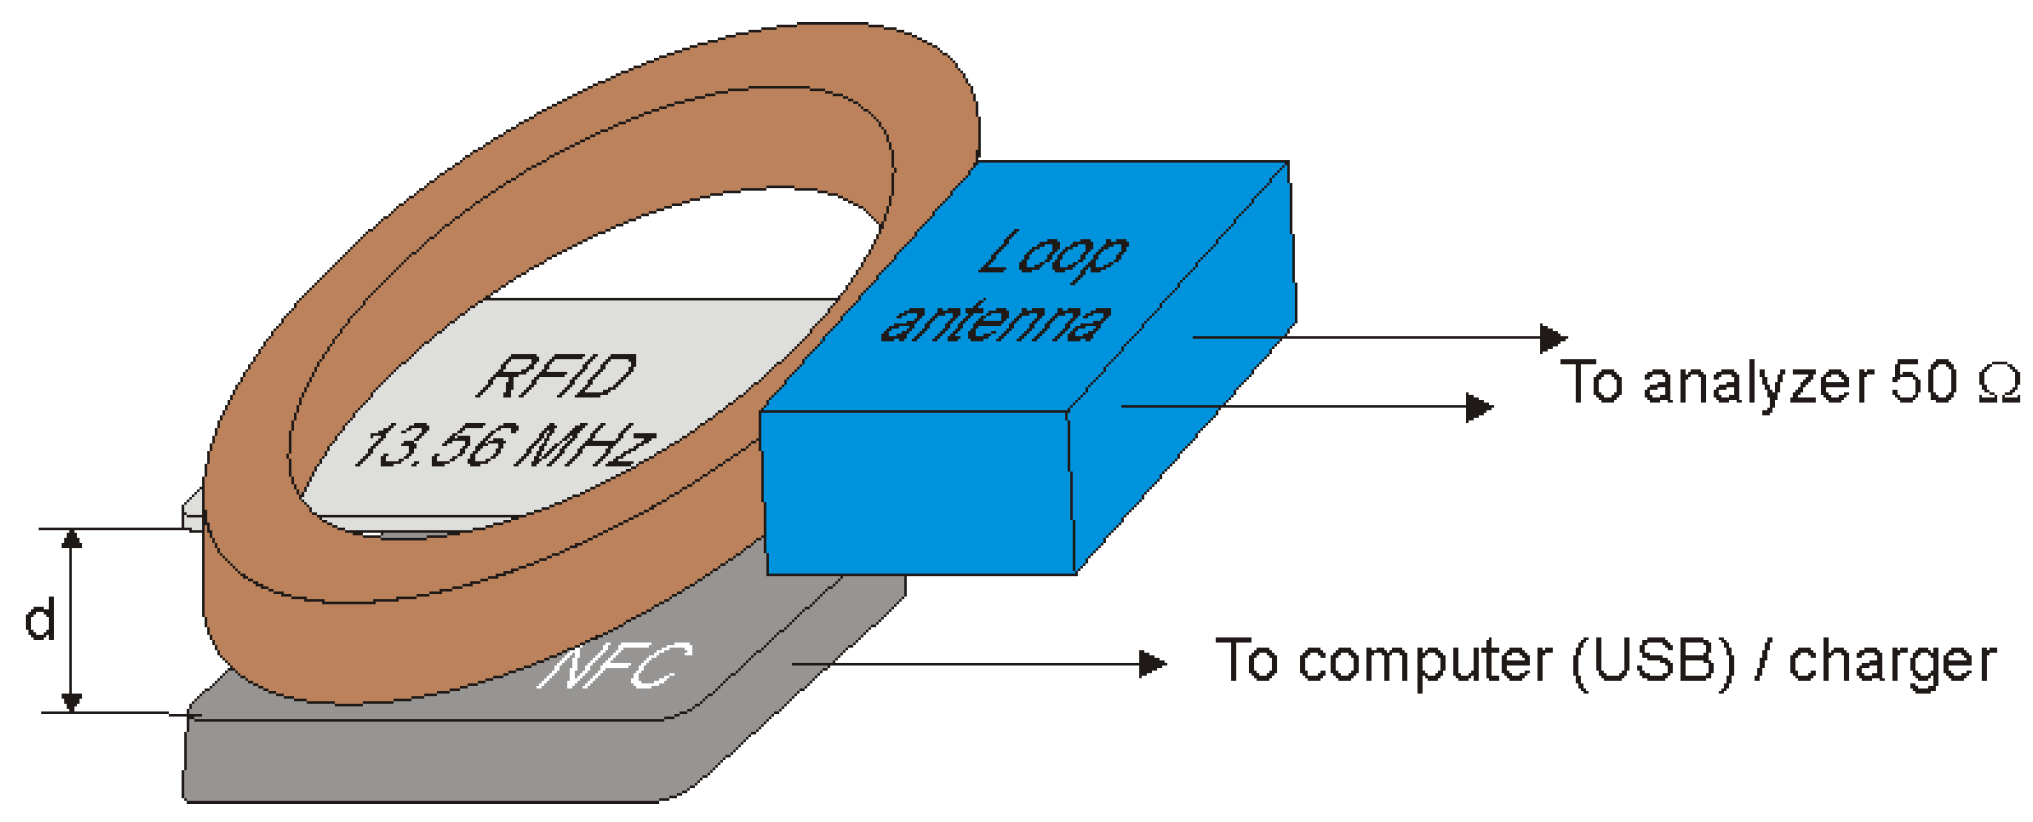
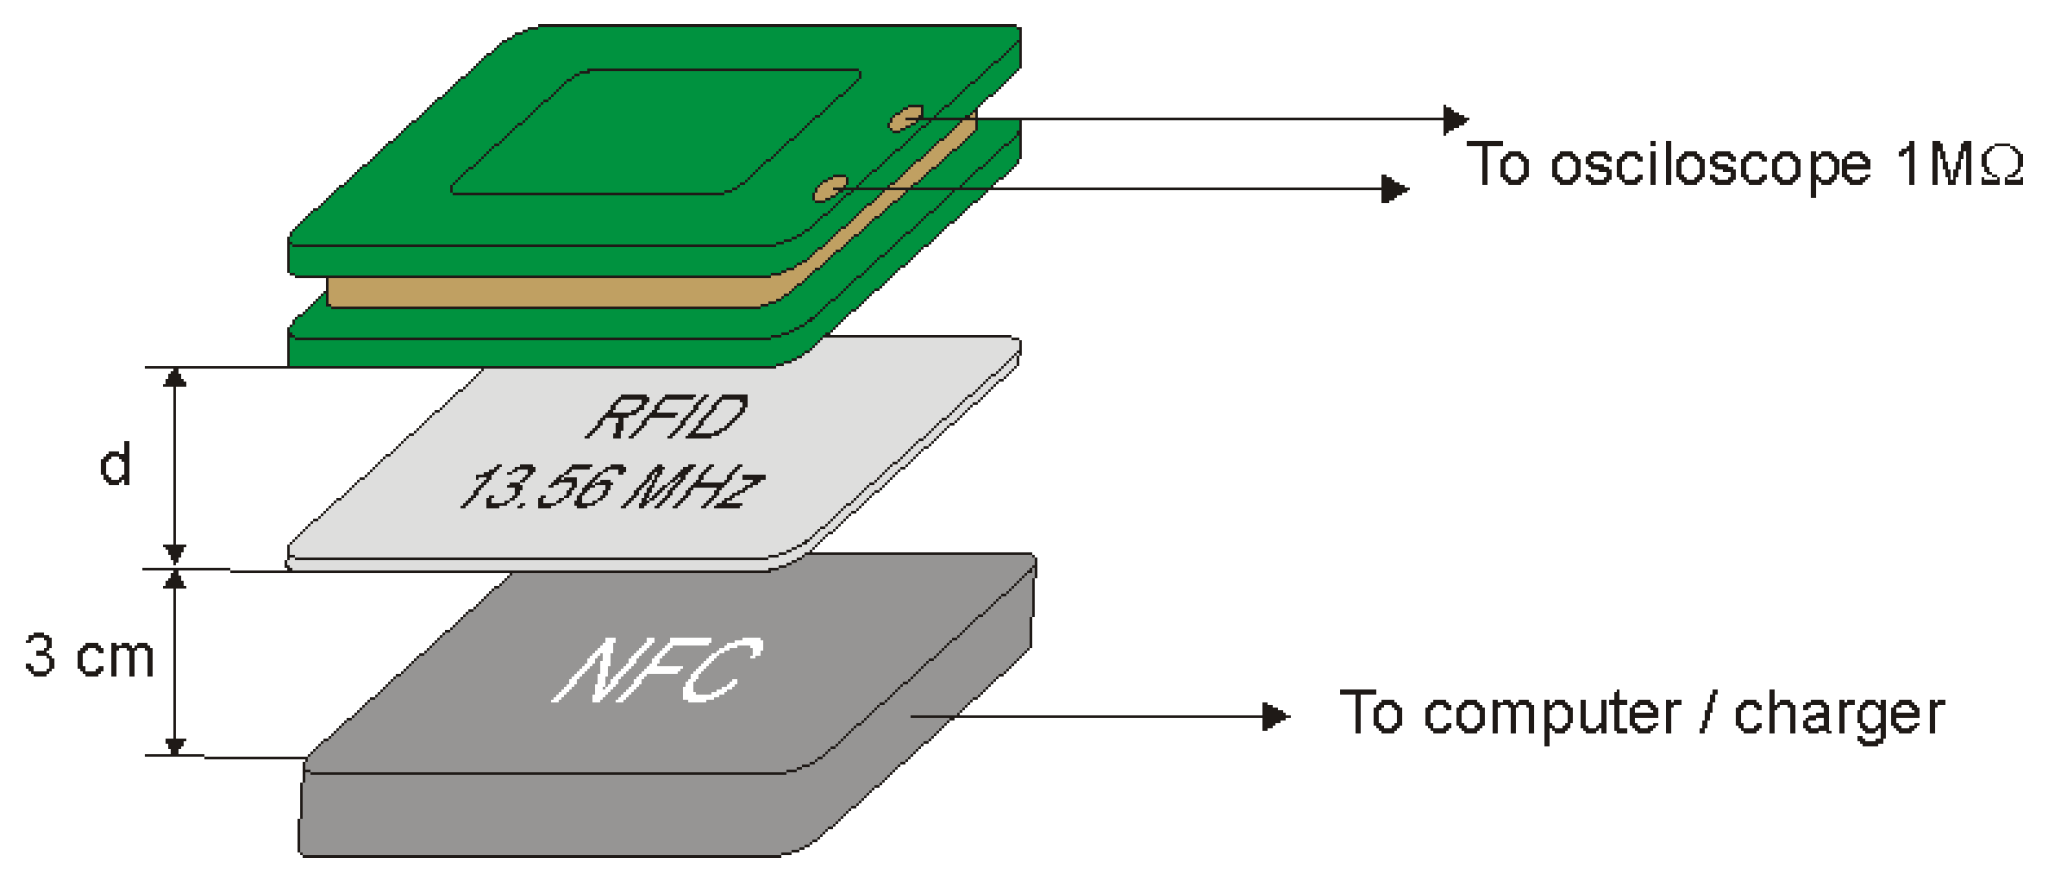
Measurements of the modulation depth factor as a function of the distance of the receiving coil from the identifier card were carried out in the measurement system shown in Figure 11. The ID card was placed at a distance of 3 cm from the reader. The reader was characterized by a constant level of emitted electromagnetic field with a frequency of 13.56 MHz. The receiving coil was set at distances of 1.5, 3, 5, 10 and 15 cm from the ID card and the parameters of the signal received by the coil were read. The measuring equipment listed in Table 2 was used to carry out the measurements.
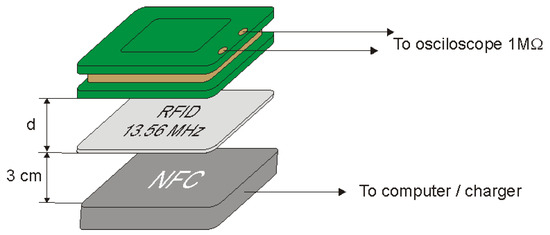
Figure 11.
Measuring system for determining the modulation depth factor.
Table 2.
List of apparatus used to carry out the measurements.
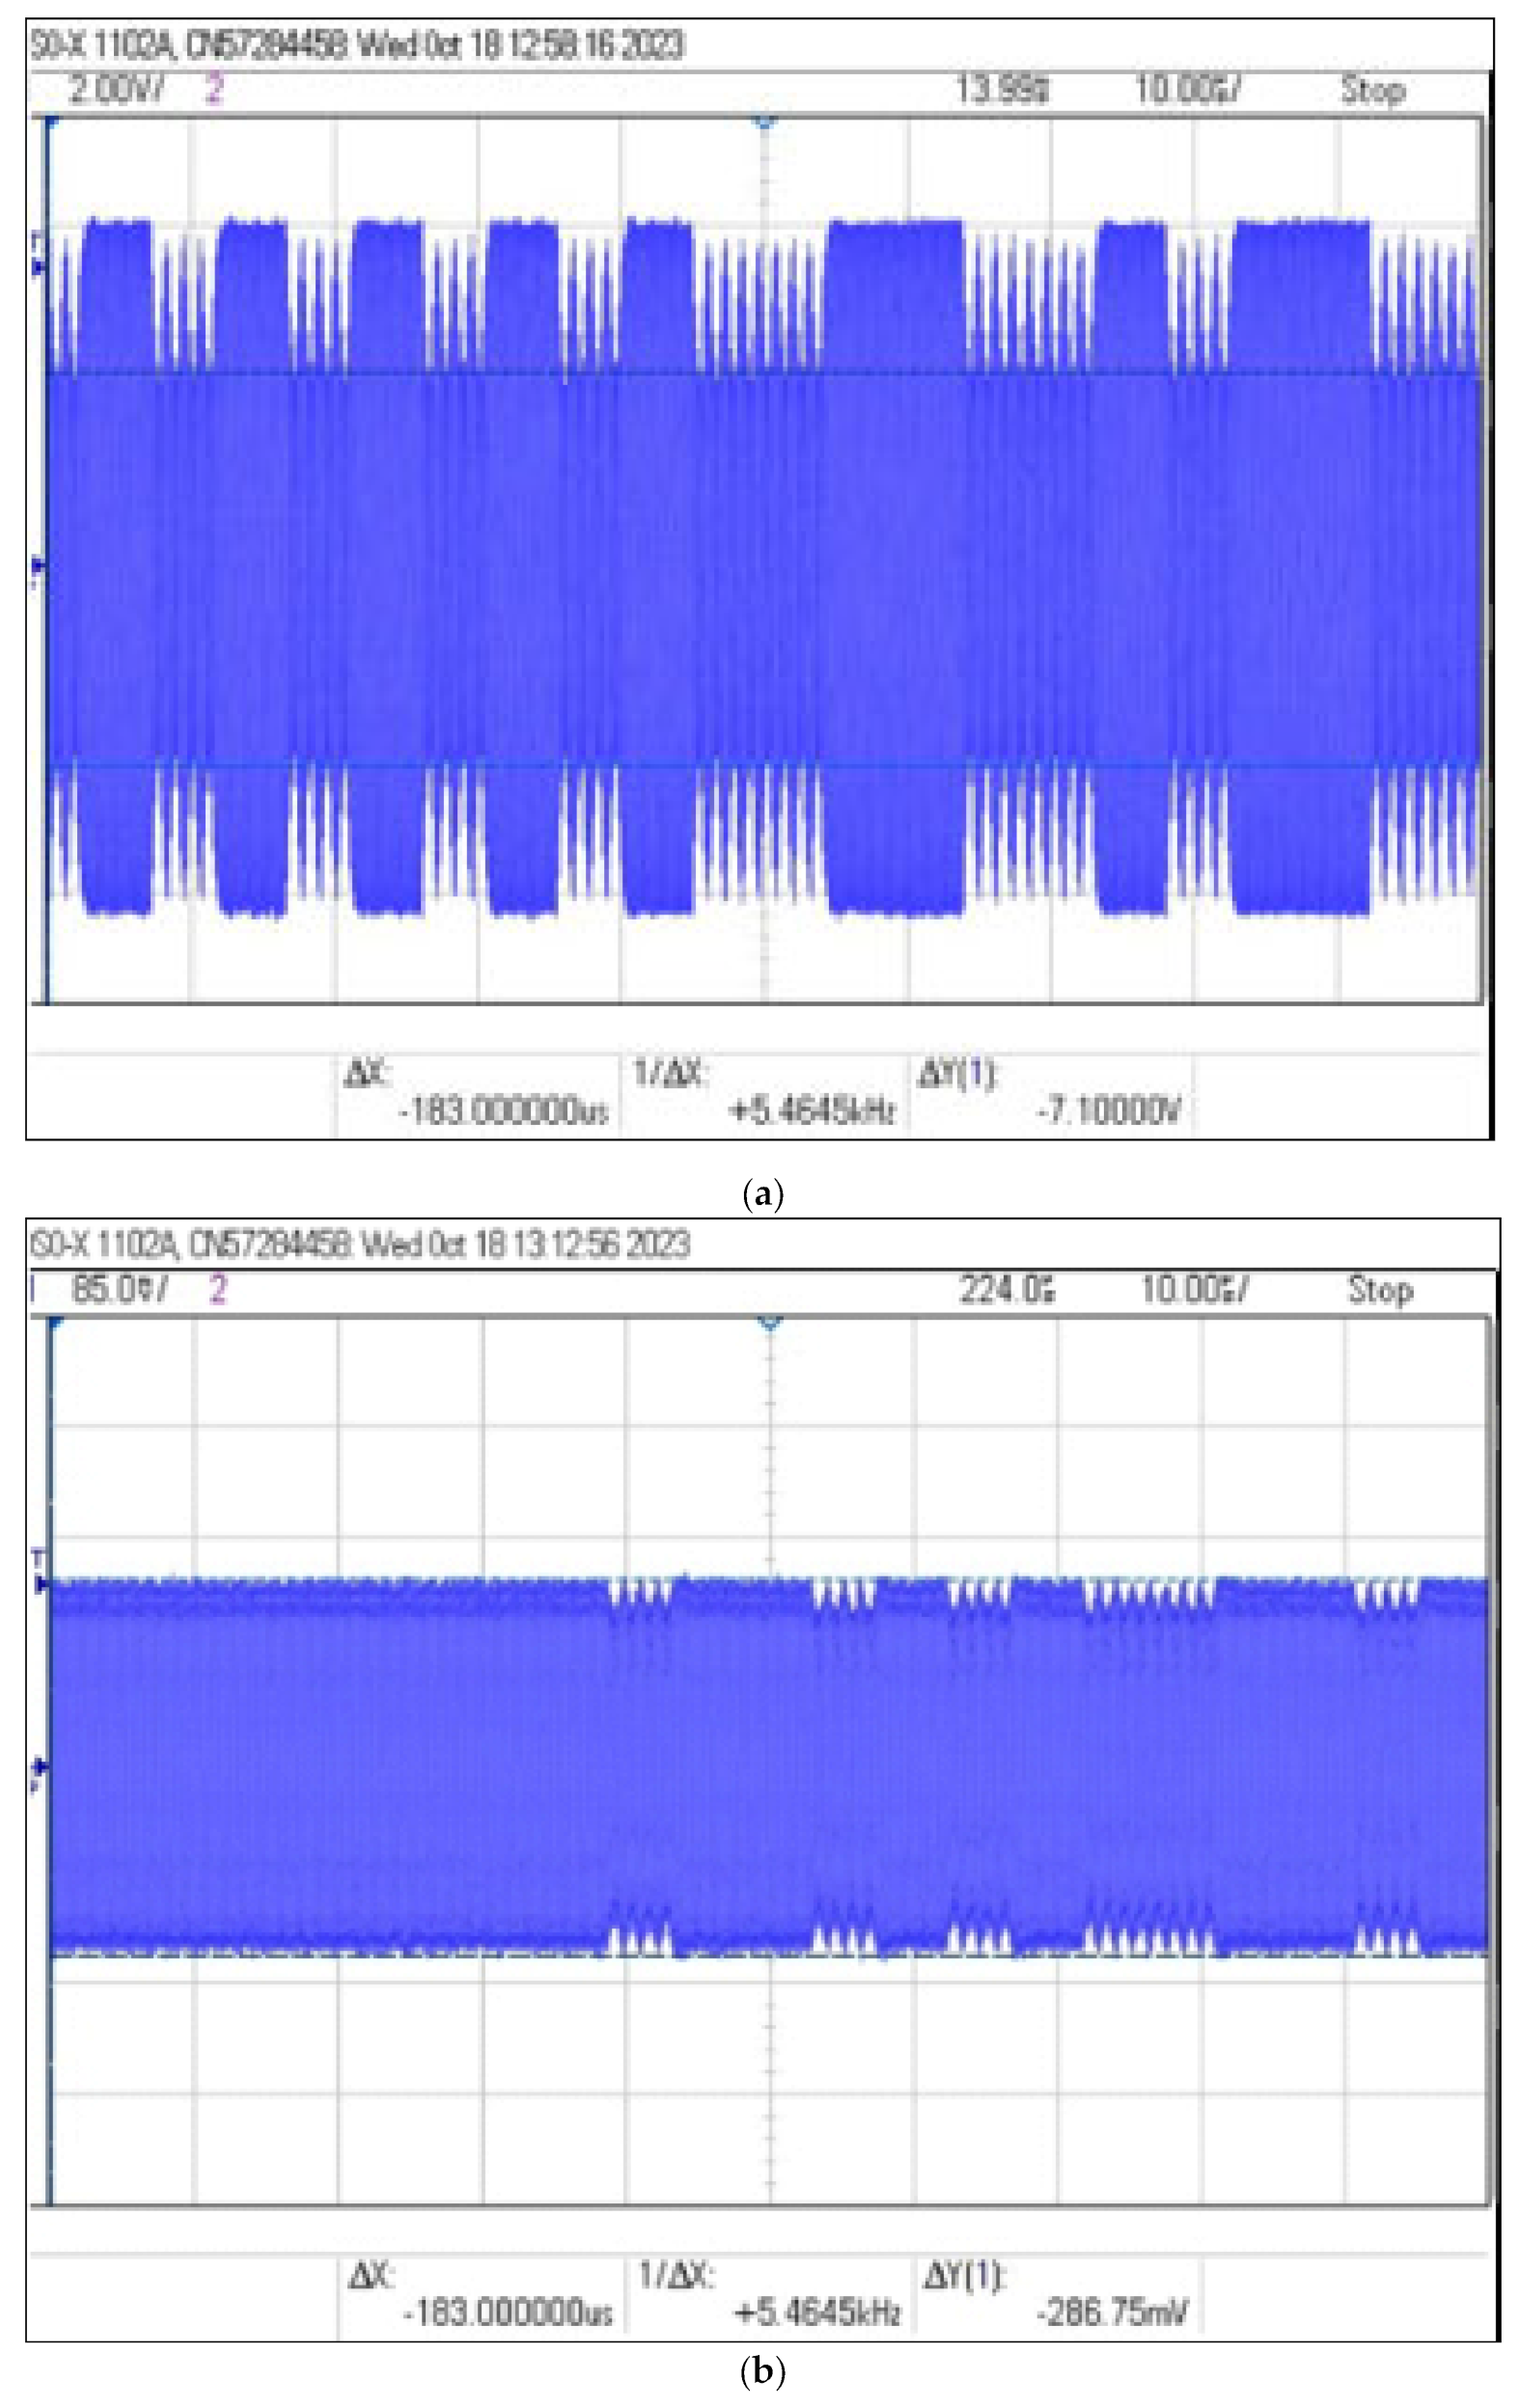
The obtained values of and and the values of the modulation depth factor determined on their basis are presented in Table 3, while exemplary images recorded by the oscilloscope are shown in Figure 12.
Table 3.
Recorded signal parameters and calculated value of modulation depth factor for selected receiver coil distances from the identifier.
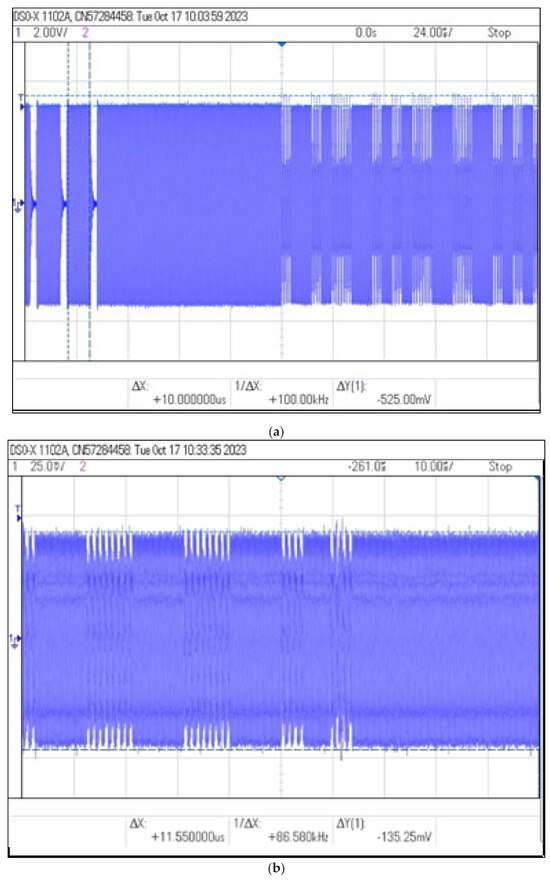
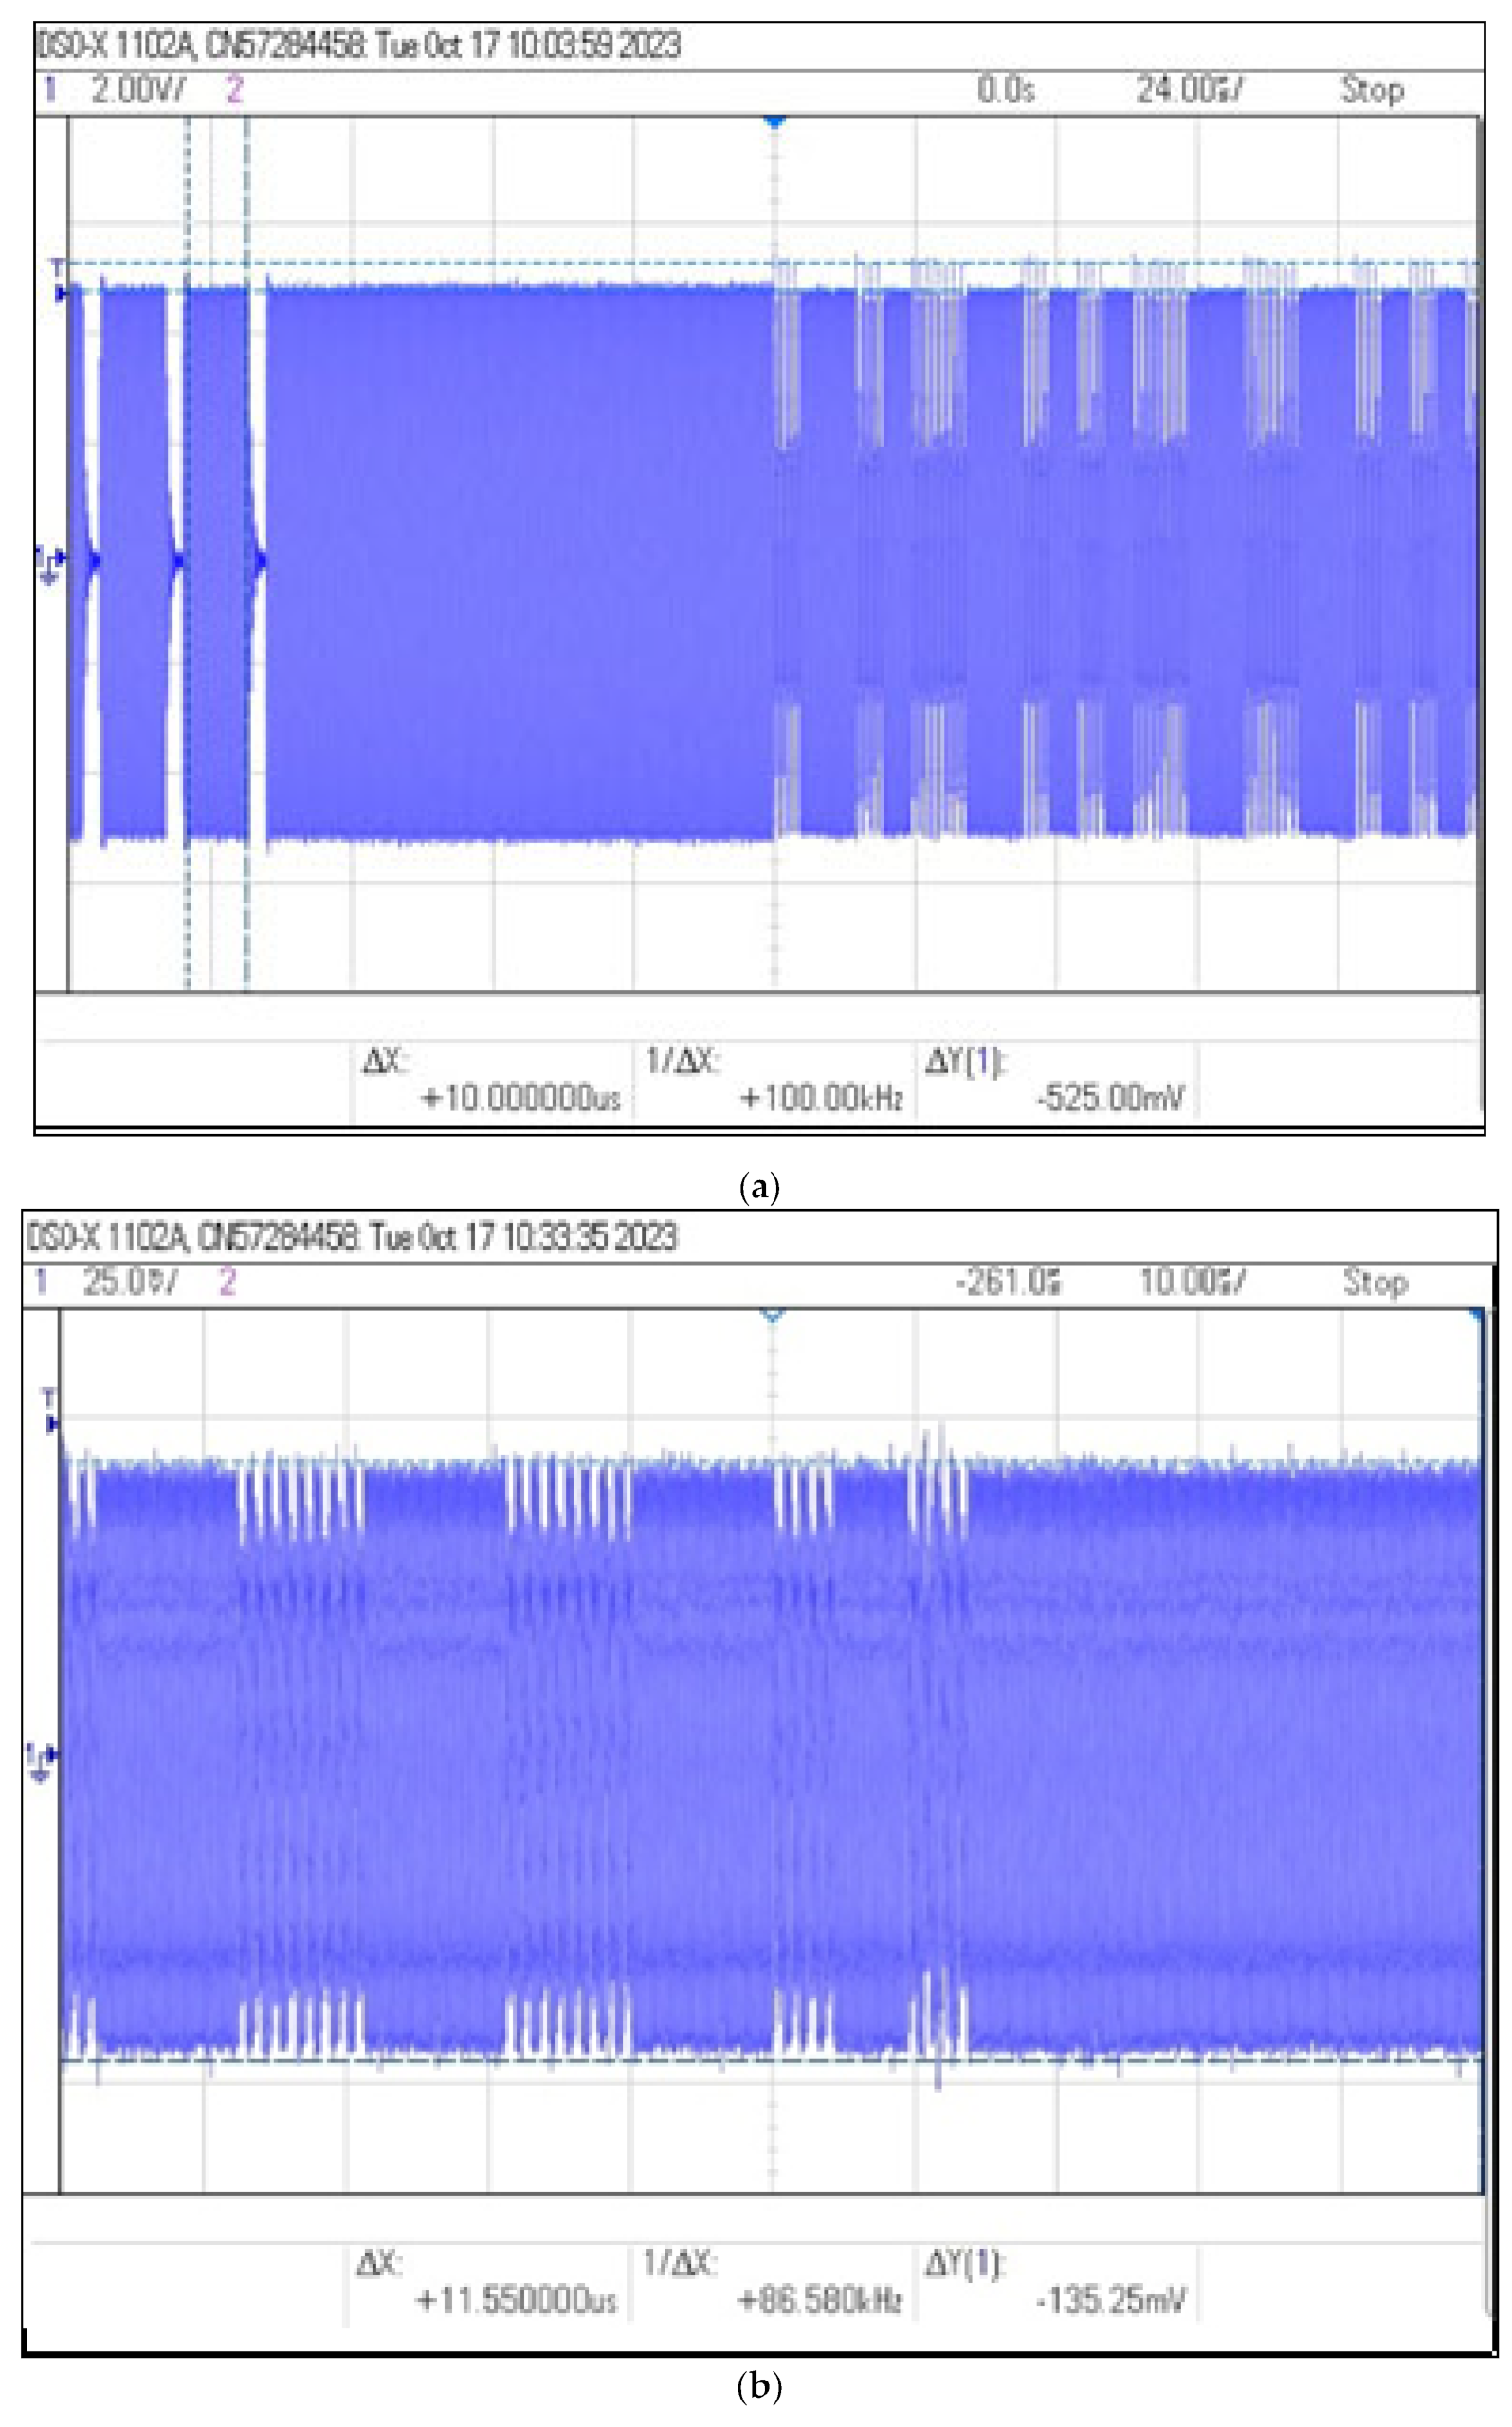
Figure 12.
Recorded signal waveforms corresponding to distance measurements: (a) , (b) .
Measurements carried out at distances greater than 15 cm were characterized by low signal levels and were practically unreadable due to the almost zero modulation depth factor m.
2.3. Use of a Resonant Circuit to Increase the Range of Reading Data from the Identifier
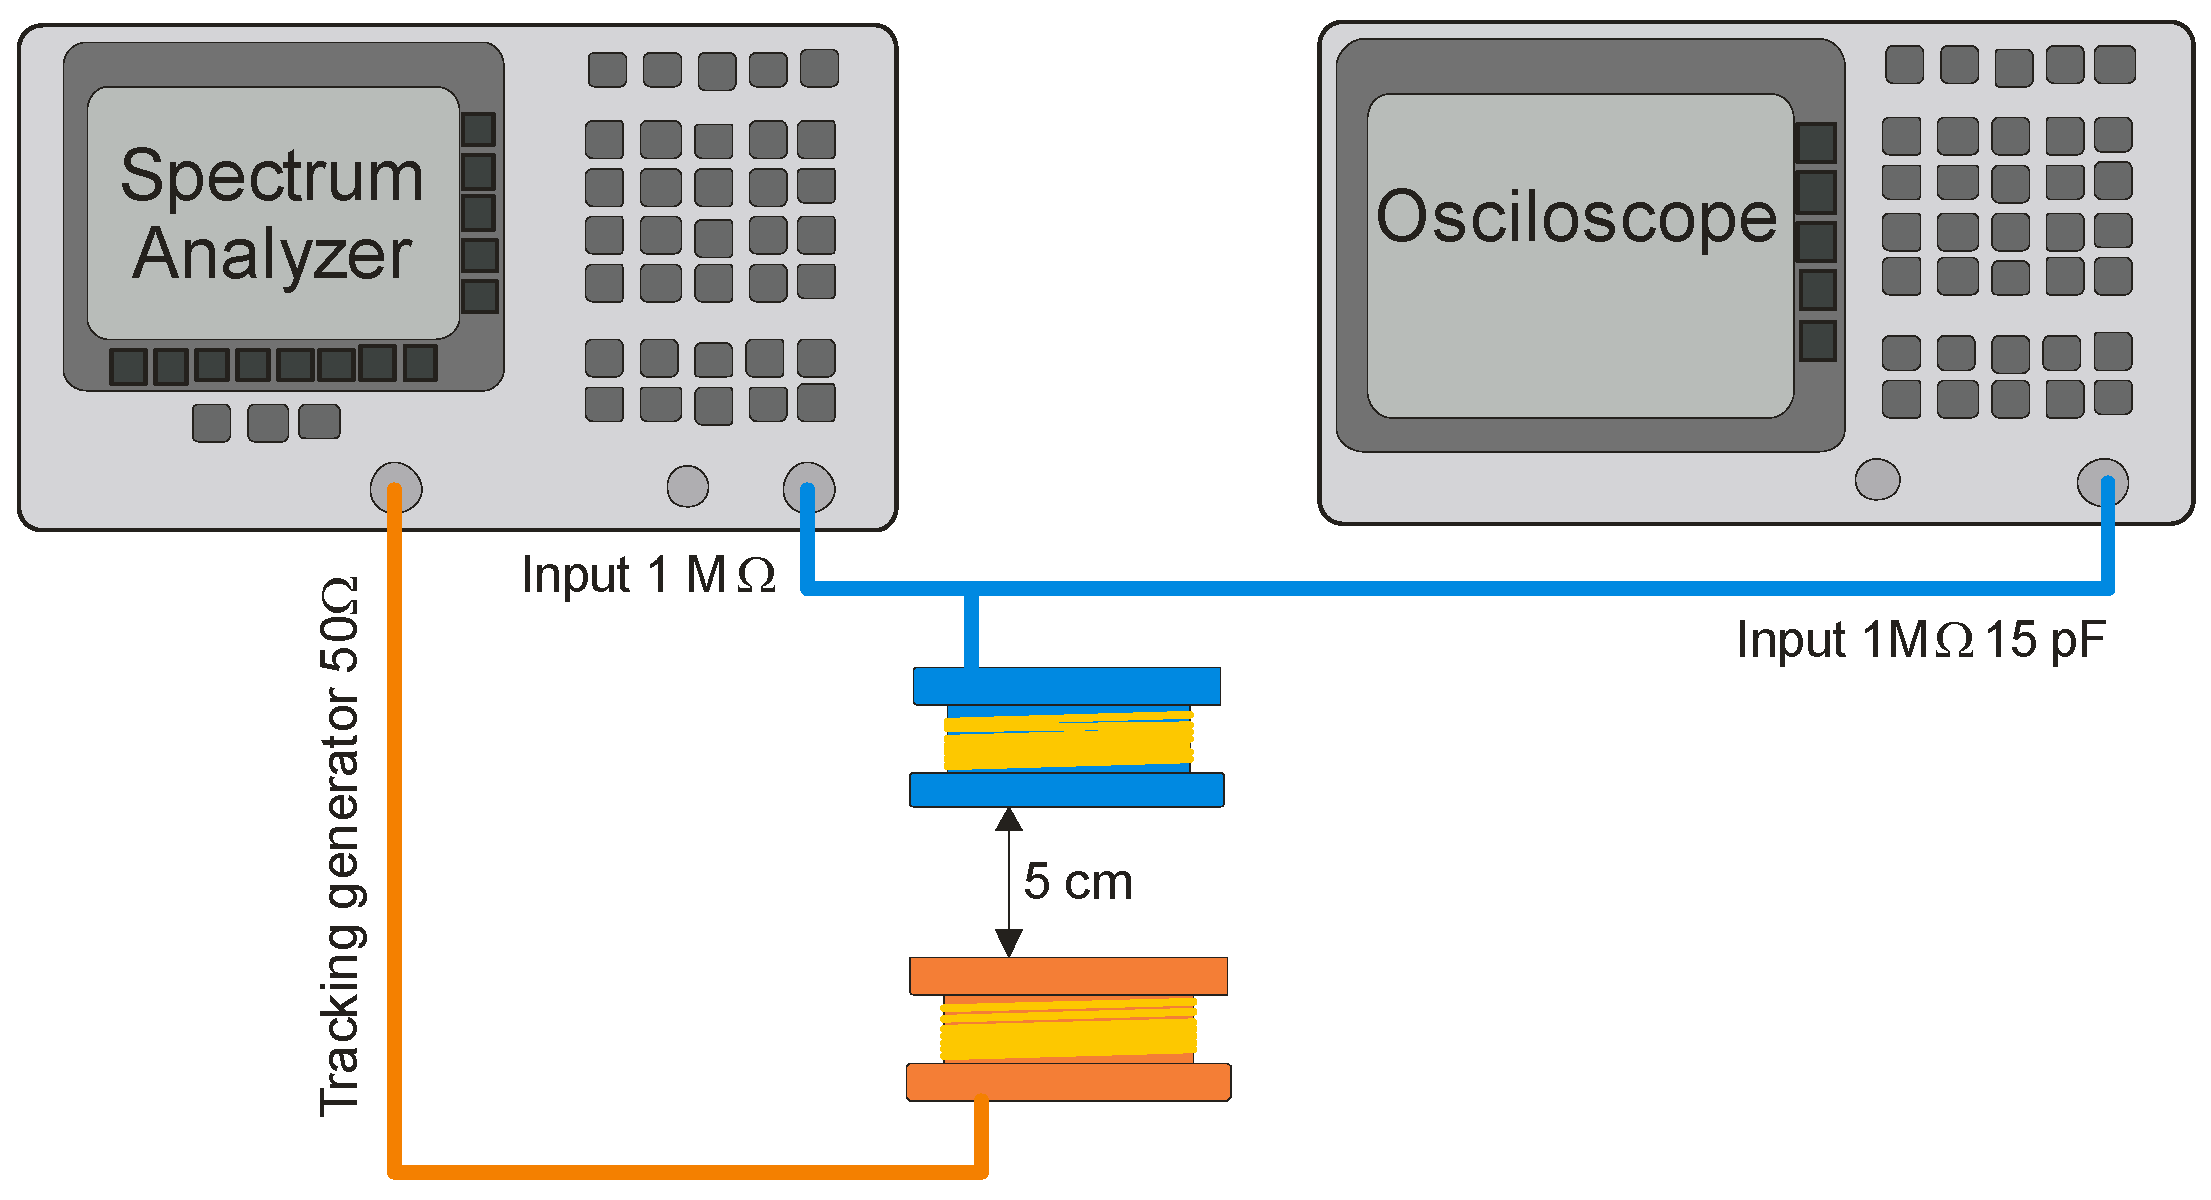
One of the simplest solutions to increase the level of the measured signal is to use a resonance system tuned to the frequency of the carrier wave used in the HF-band RFID system, i.e., 13.56 MHz. Due to the high frequencies used in the system, the additional capacitance in the system must take into account the impedances of the spectrum analyzer and oscilloscope used in the research. The actual circuit for determining the frequency response of the resonant circuit consisted of a spectrum analyzer with a high-impedance input and its tracking generator, an oscilloscope, a transmitting coil with an inductance of approx. 10 μH (12 coils, 6.5 × 3.5 cm), and a receiving coil with an inductance of 5 μH with a 22 pF capacitor [17,18,19,20]. The diagram of this circuit is shown in Figure 13 and the circuit for simulation in the LTspice program is shown in Figure 14. During the simulations carried out using the LTspice program, the parasitic parameters of individual elements were not taken into account. In the case of the analyzed frequencies, this did not significantly affect the obtained results (Figure 15).

Figure 13.
The real circuit for measuring the frequency characteristic of a resonant system.
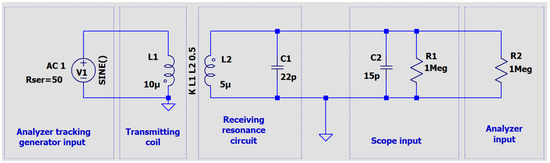
Figure 14.
The electrical diagram of a circuit for testing the frequency characteristic of a resonant system using the LTspice application.
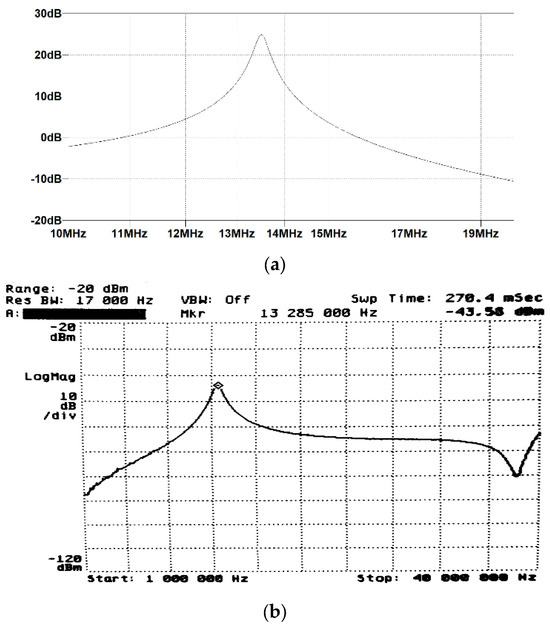
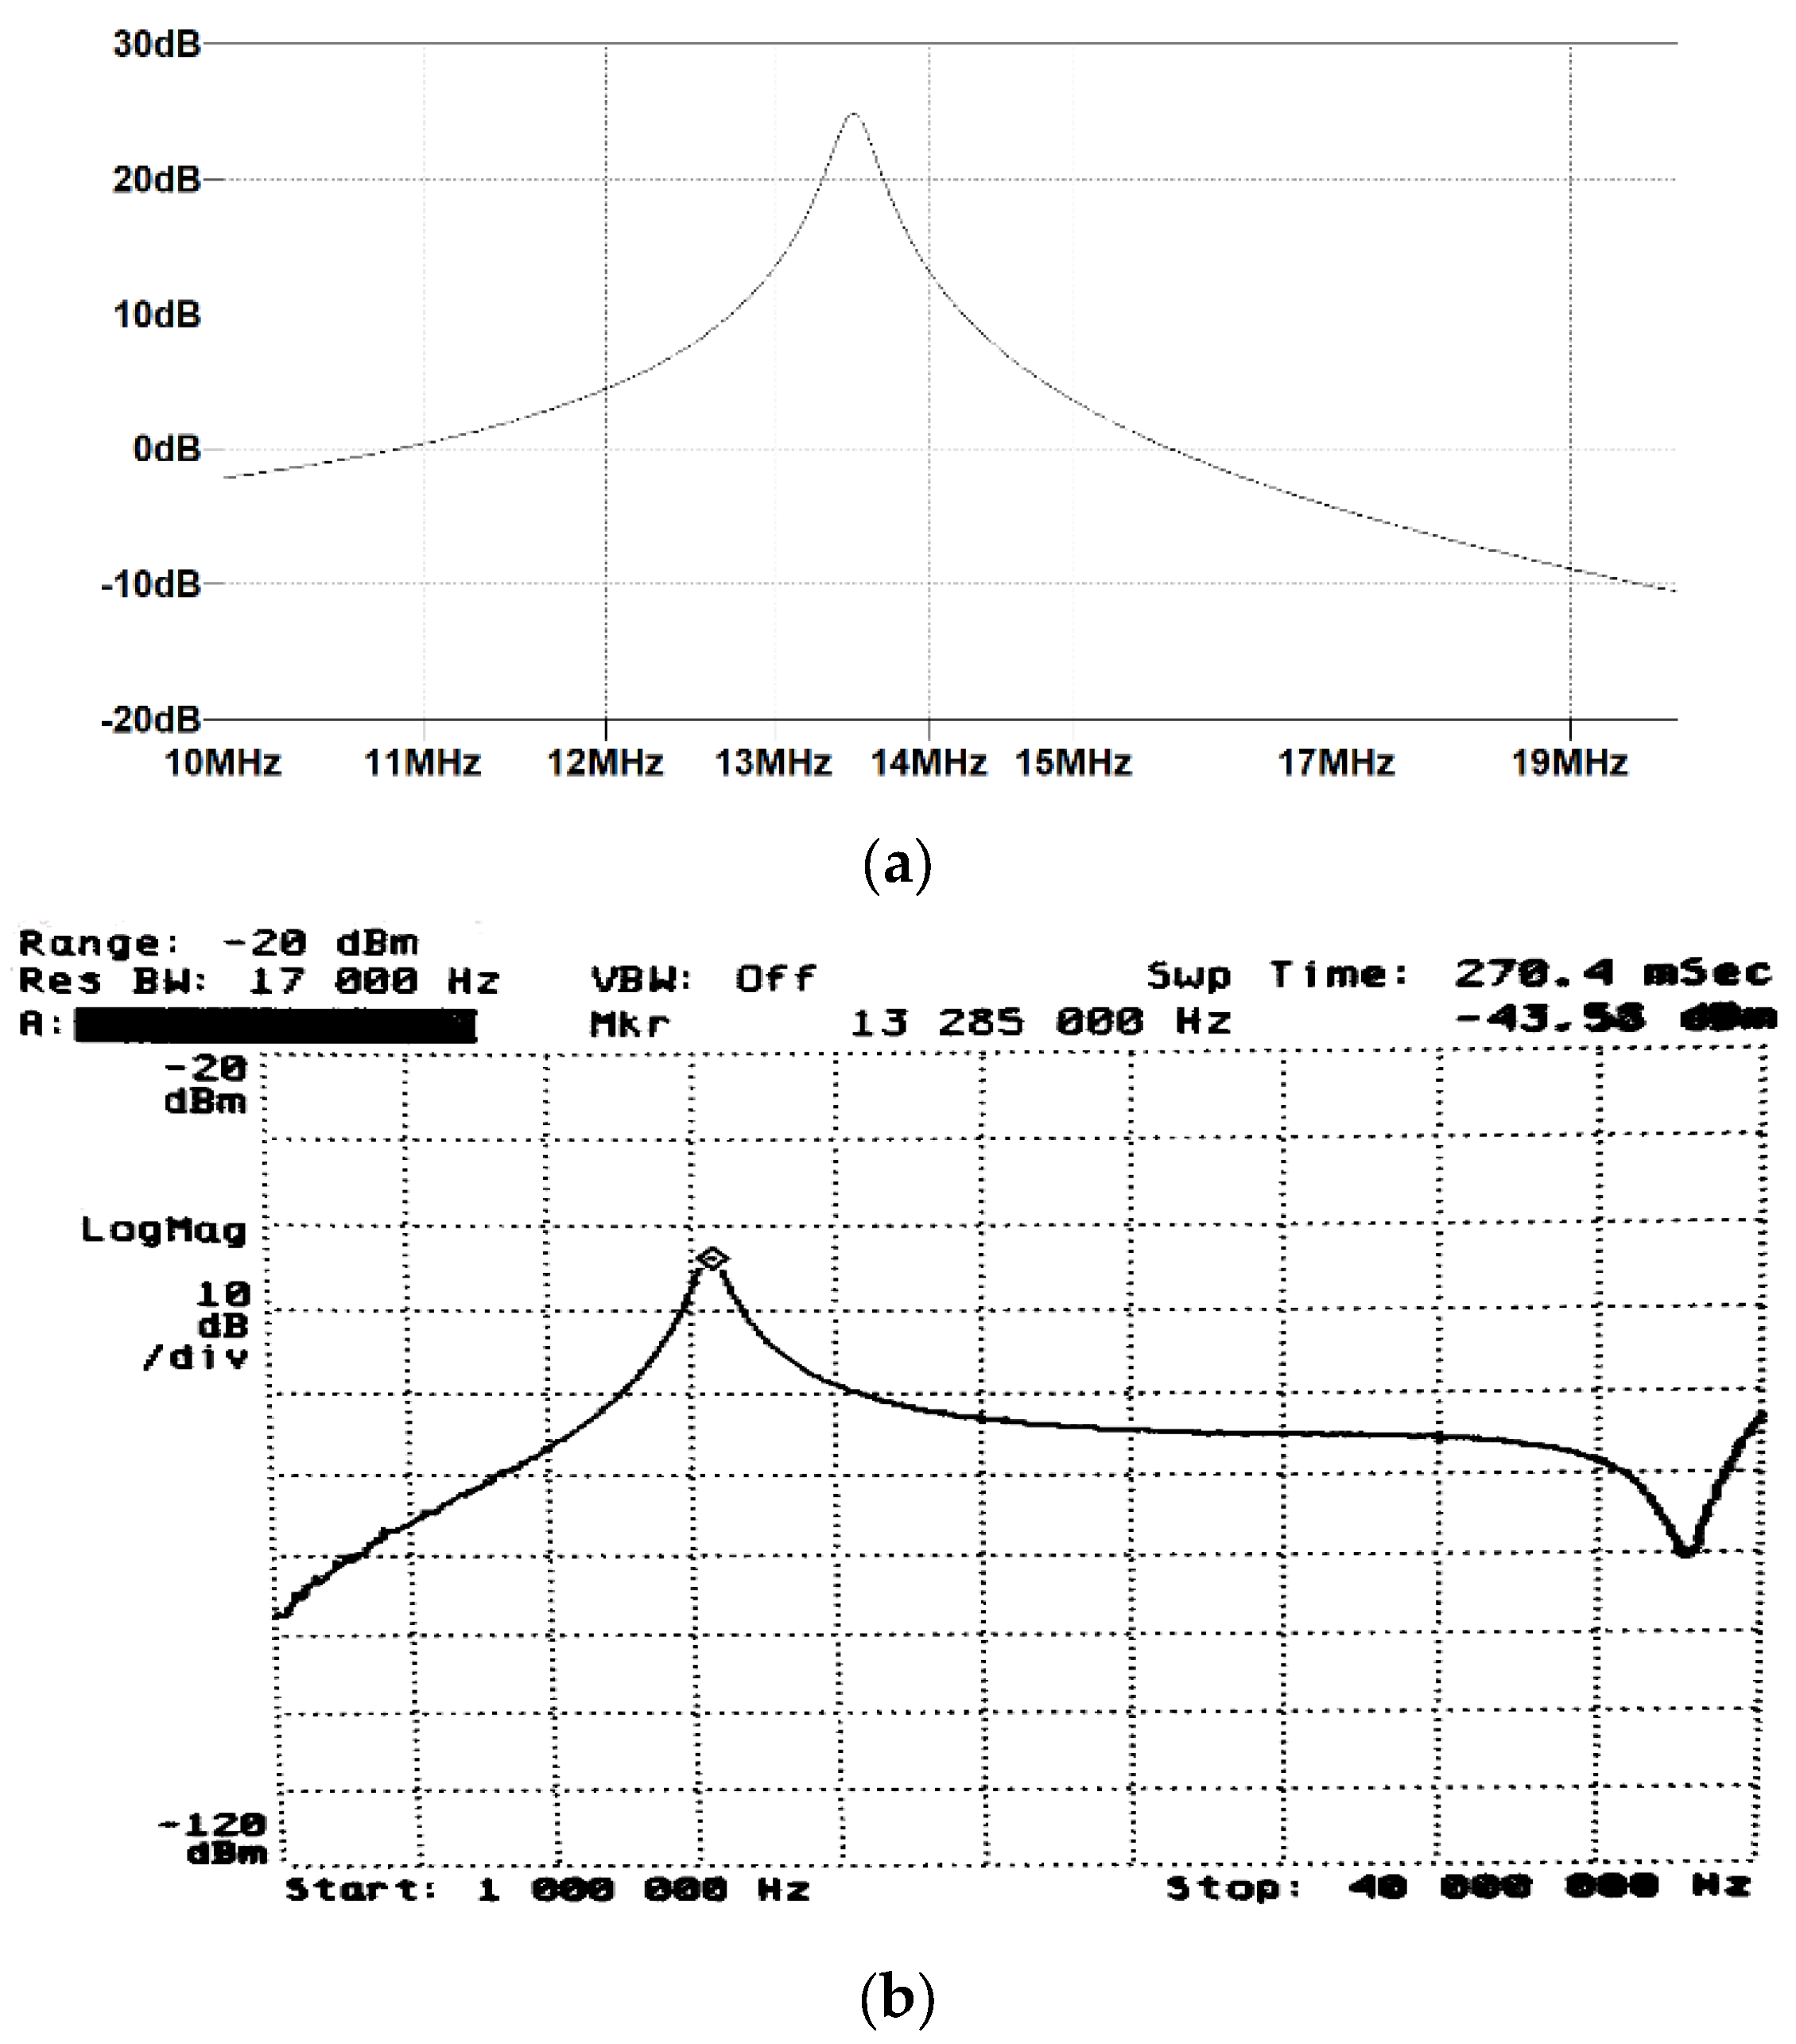
Figure 15.
Results of tests of the frequency characteristics of the resonant system: (a) in the frequency range of 10 MHz to 20 MHz—simulation in LTSpice application, (b) result of the measurement of the characteristics with a spectrum analyzer in the frequency range from 1 MHz to 40 MHz—actual measurement.
Elements with determined capacitance and inductance values during the measurements and simulations were used in the next stage of measurements, the purpose of which was to determine whether the applied solution would allow to increase the range of emission from the NFC system identification card (MIFARE).
For this purpose, the measurement system shown in Figure 16 was implemented. Instead of a regular magnetic coil, it was necessary to use a computer NFC reader. This was due to the need to send appropriate queries to force the transmission of the identifier. The continuous carrier wave, which could be used in the LF-band RFID system, in the case of HF-band RFID systems, did not force the start of transmission between the badge and the reader.
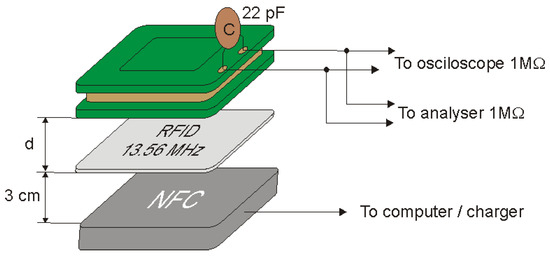
Figure 16.
Measuring system for determining the modulation depth factor using a resonant system.
The measuring equipment listed in Table 4 was used to carry out the measurements.
Table 4.
List of apparatus used to carry out the measurements.
During the tests, the ID card was placed at a distance of 3 cm from the reader. The coil and capacitor were placed at different distances from the identifier and on the basis of the obtained oscillograms the modulation depth factor and the signal level were determined as a function of the distance of the coil from the identifier. The values of and read using the oscilloscope and the calculated values of the modulation depth factor m are shown in Table 5, while examples of images recorded by the oscilloscope are shown in Figure 17.
Table 5.
Recorded signal parameters and calculated value of modulation depth factor for selected receiver coil distances from the identifier for the resonant circuit use case.
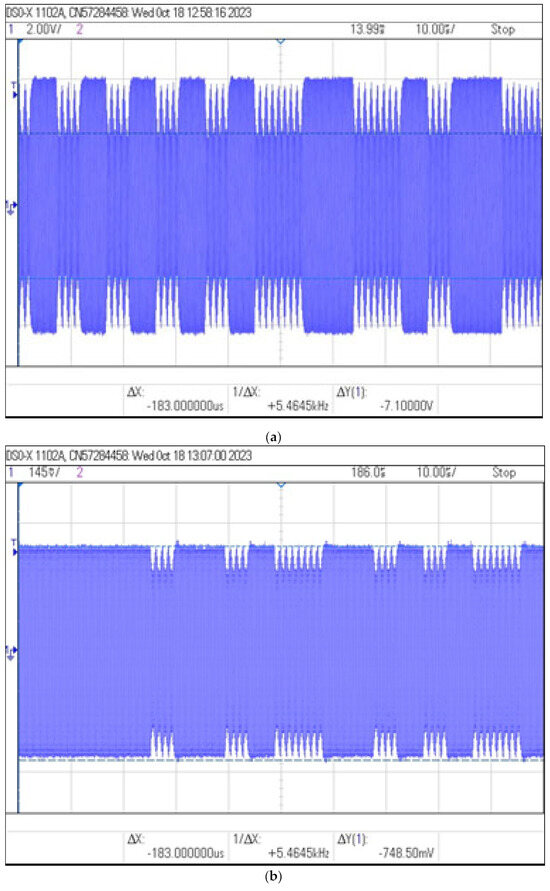
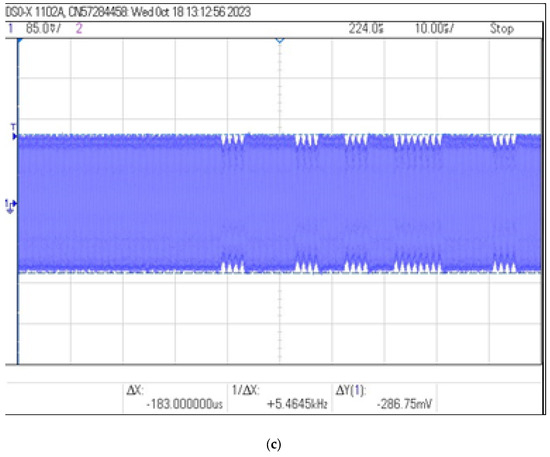
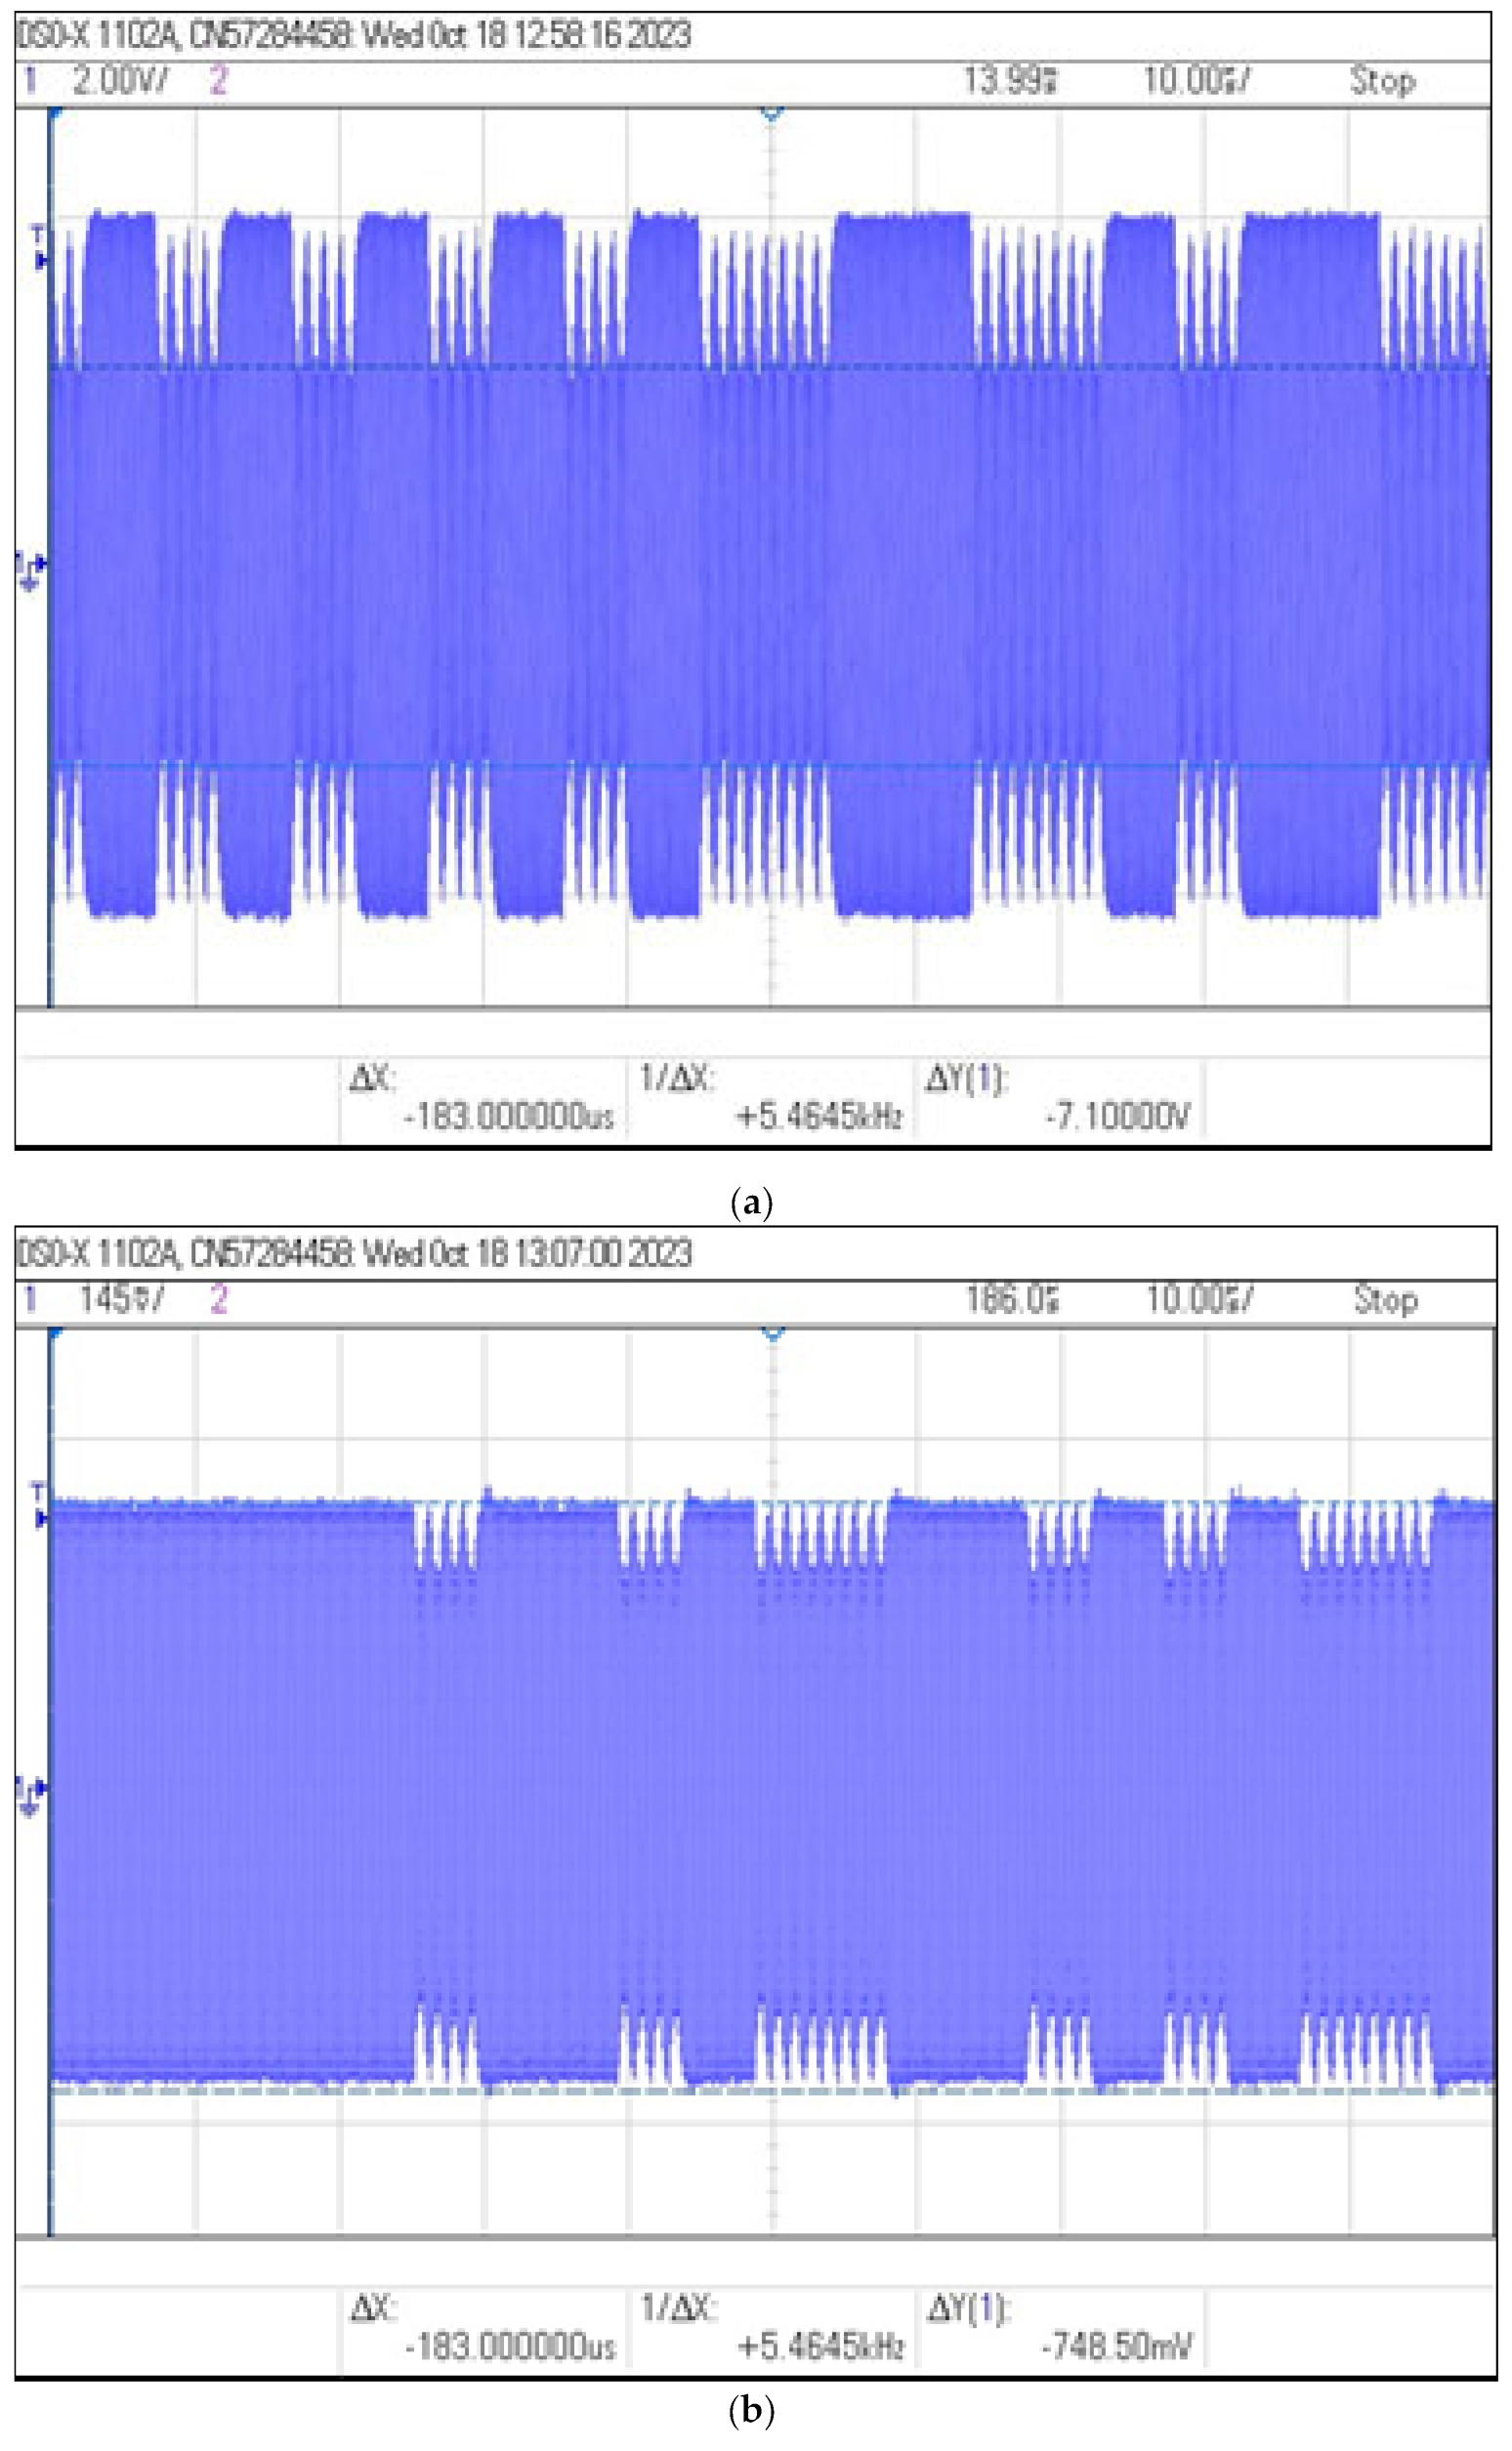
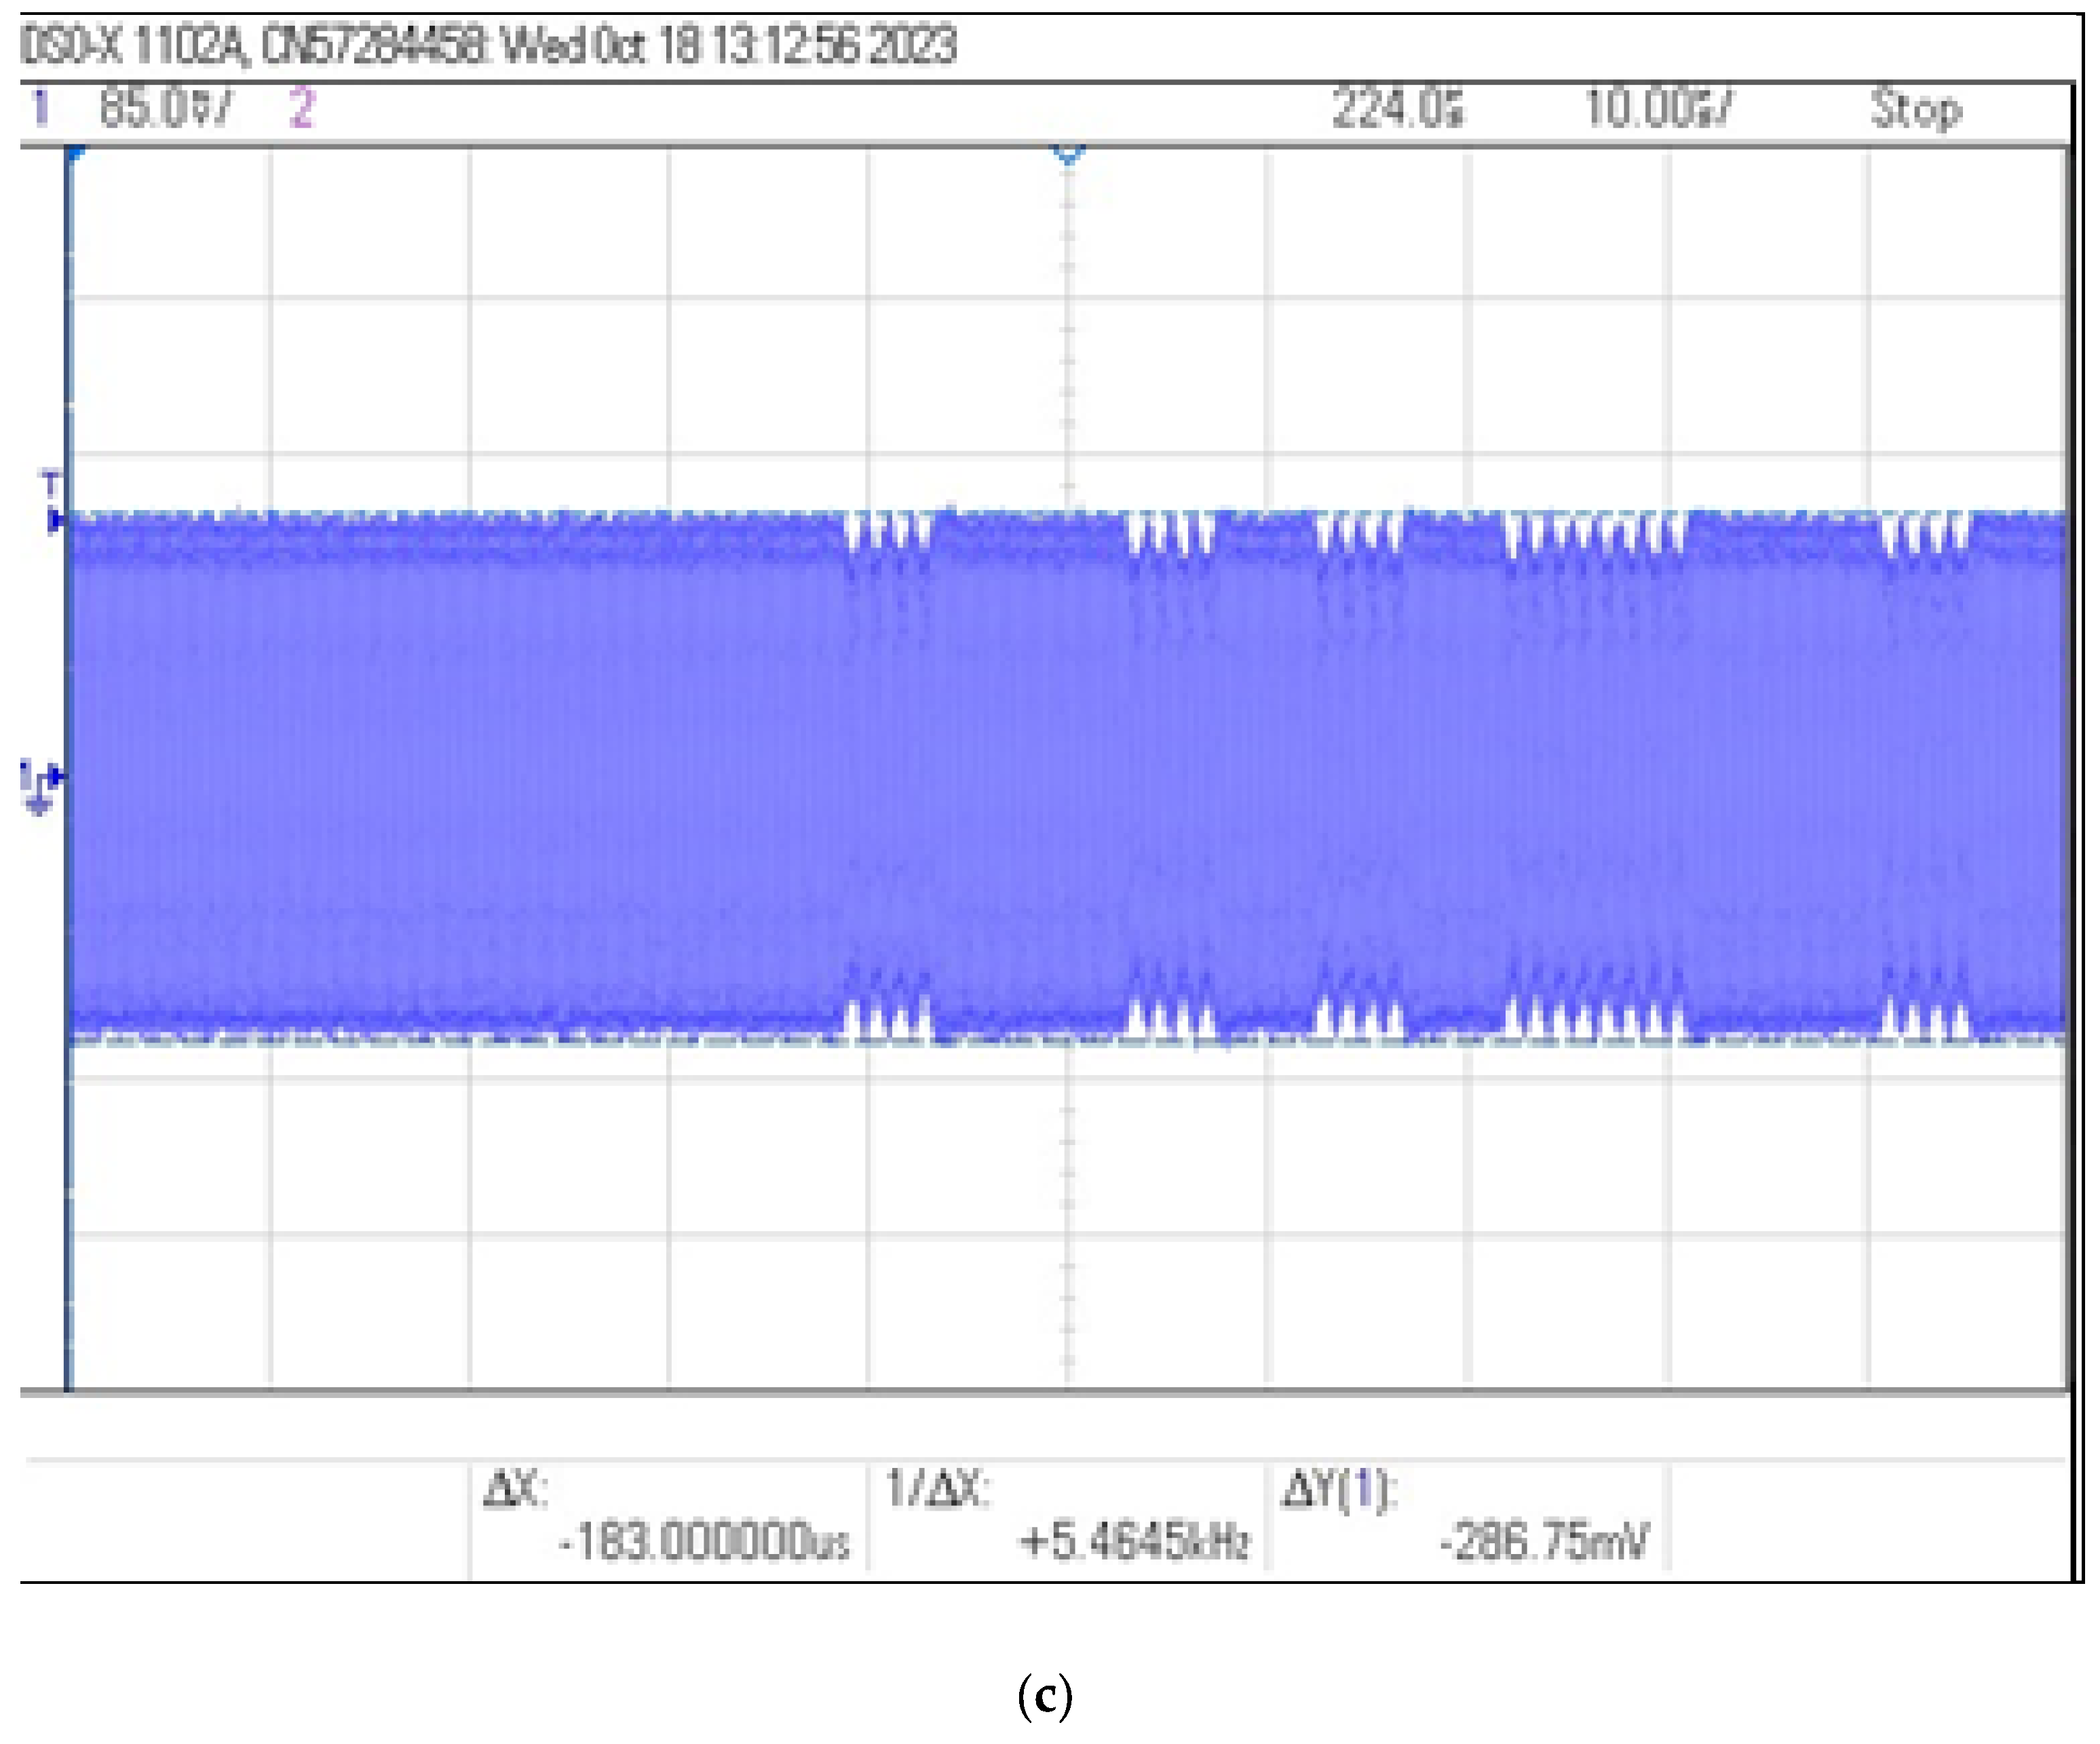
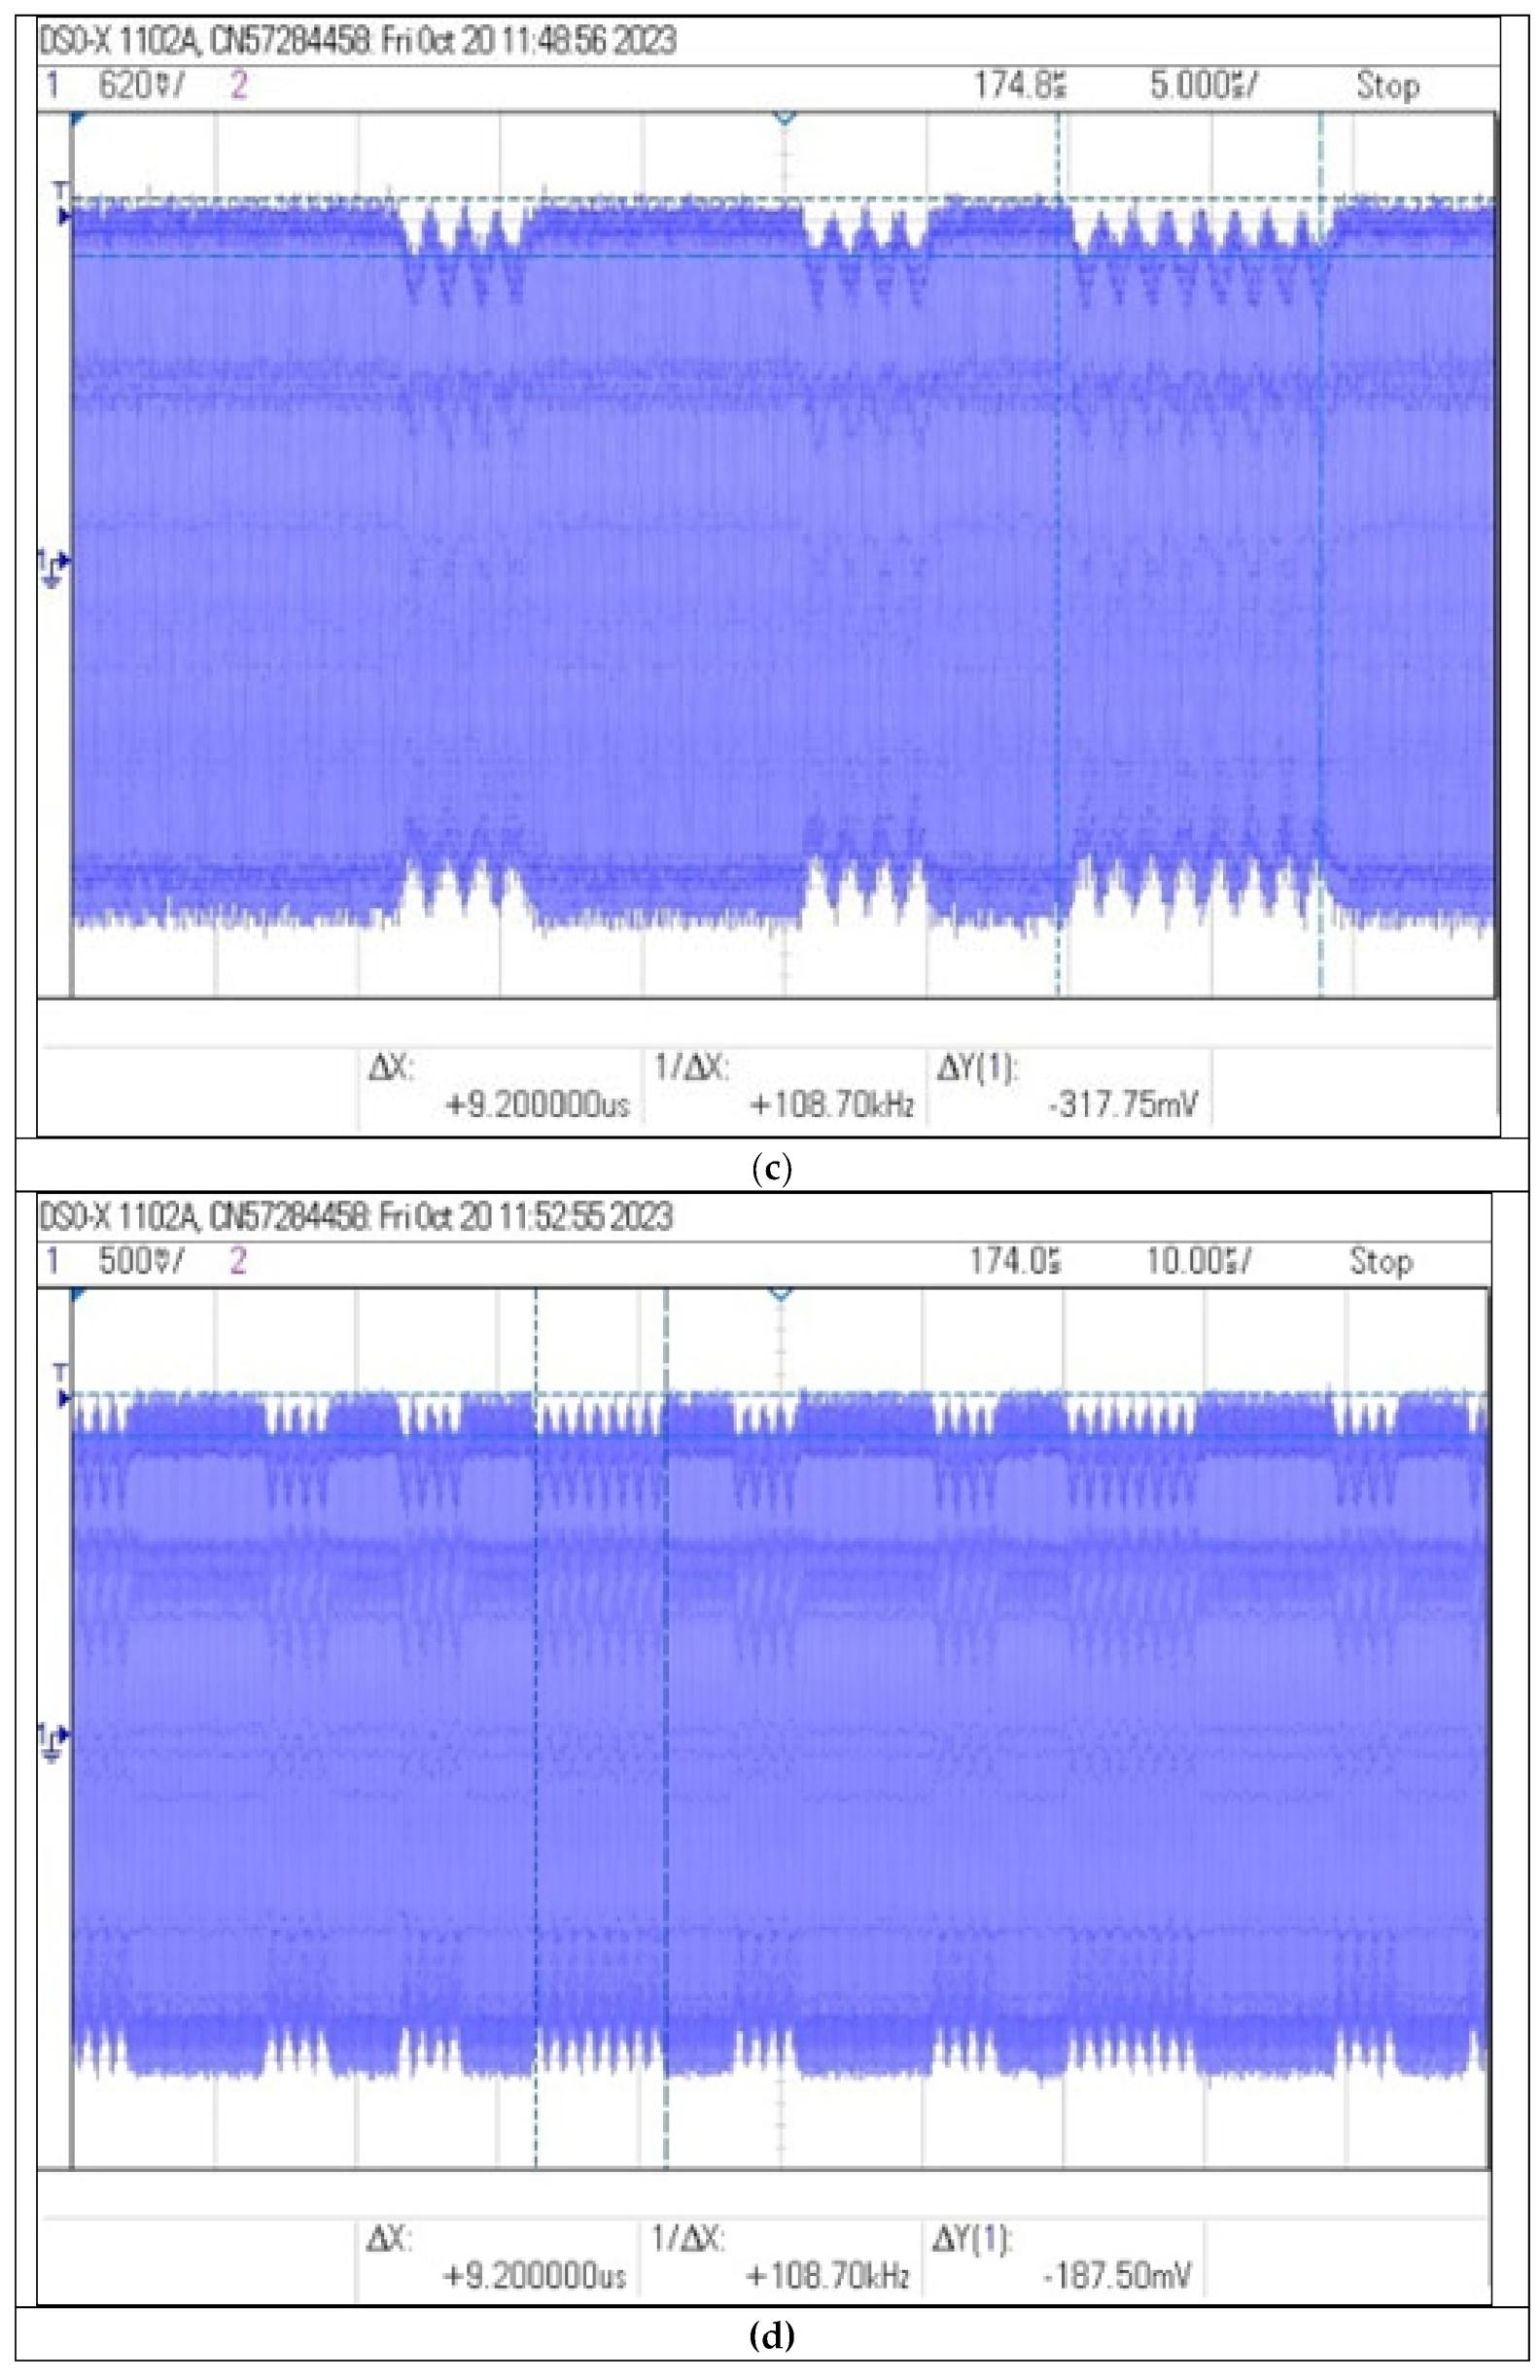
Figure 17.
Recorded signal waveforms corresponding to distance measurements: (a) , (b) and (c) .
The results show that the use of the resonance system allows the information from the identifier to be read even from a distance of 25 cm. For this case, the calculated modulation depth m is 7% and the signal amplitude is two times greater than in a non-resonant system at a distance of 15 cm.
2.4. Use of a RF Amplifier to Increase the Range of Reading Data from the Identifier
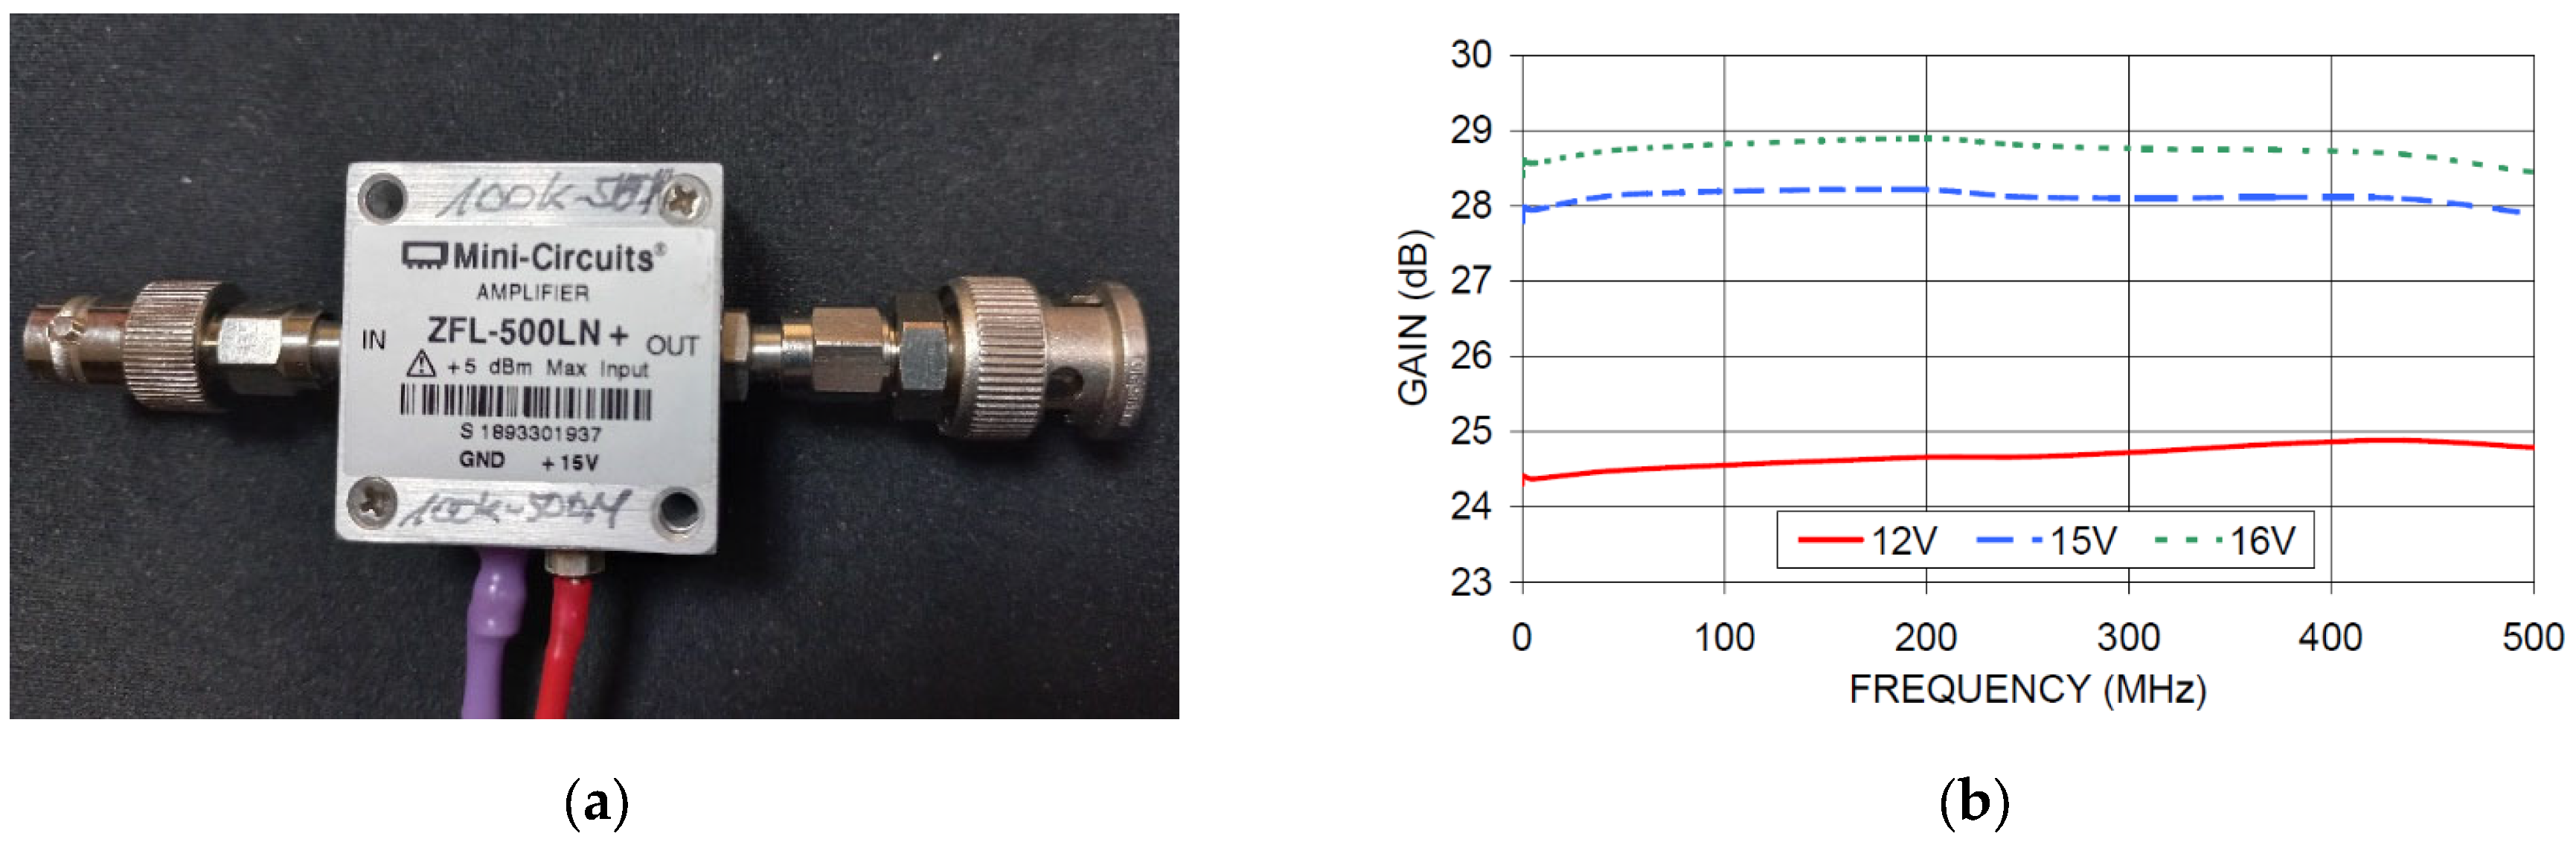
Another method of testing to increase the range of information penetration was the use of the ZFL-500LN+ signal amplifier from Mini-Circuit for the frequency range from 0.1 MHz to 500 MHz. The supply voltage of the amplifier during the tests was approx. 12 V DC. Its view and the characteristics of the gain as a function of frequency are shown in Figure 18.
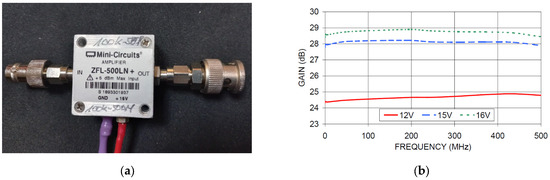
Figure 18.
(a) The ZFL-500LN+ amplifier and (b) its frequency gain characteristic—according to the amplifier manufacturer’s data [21].
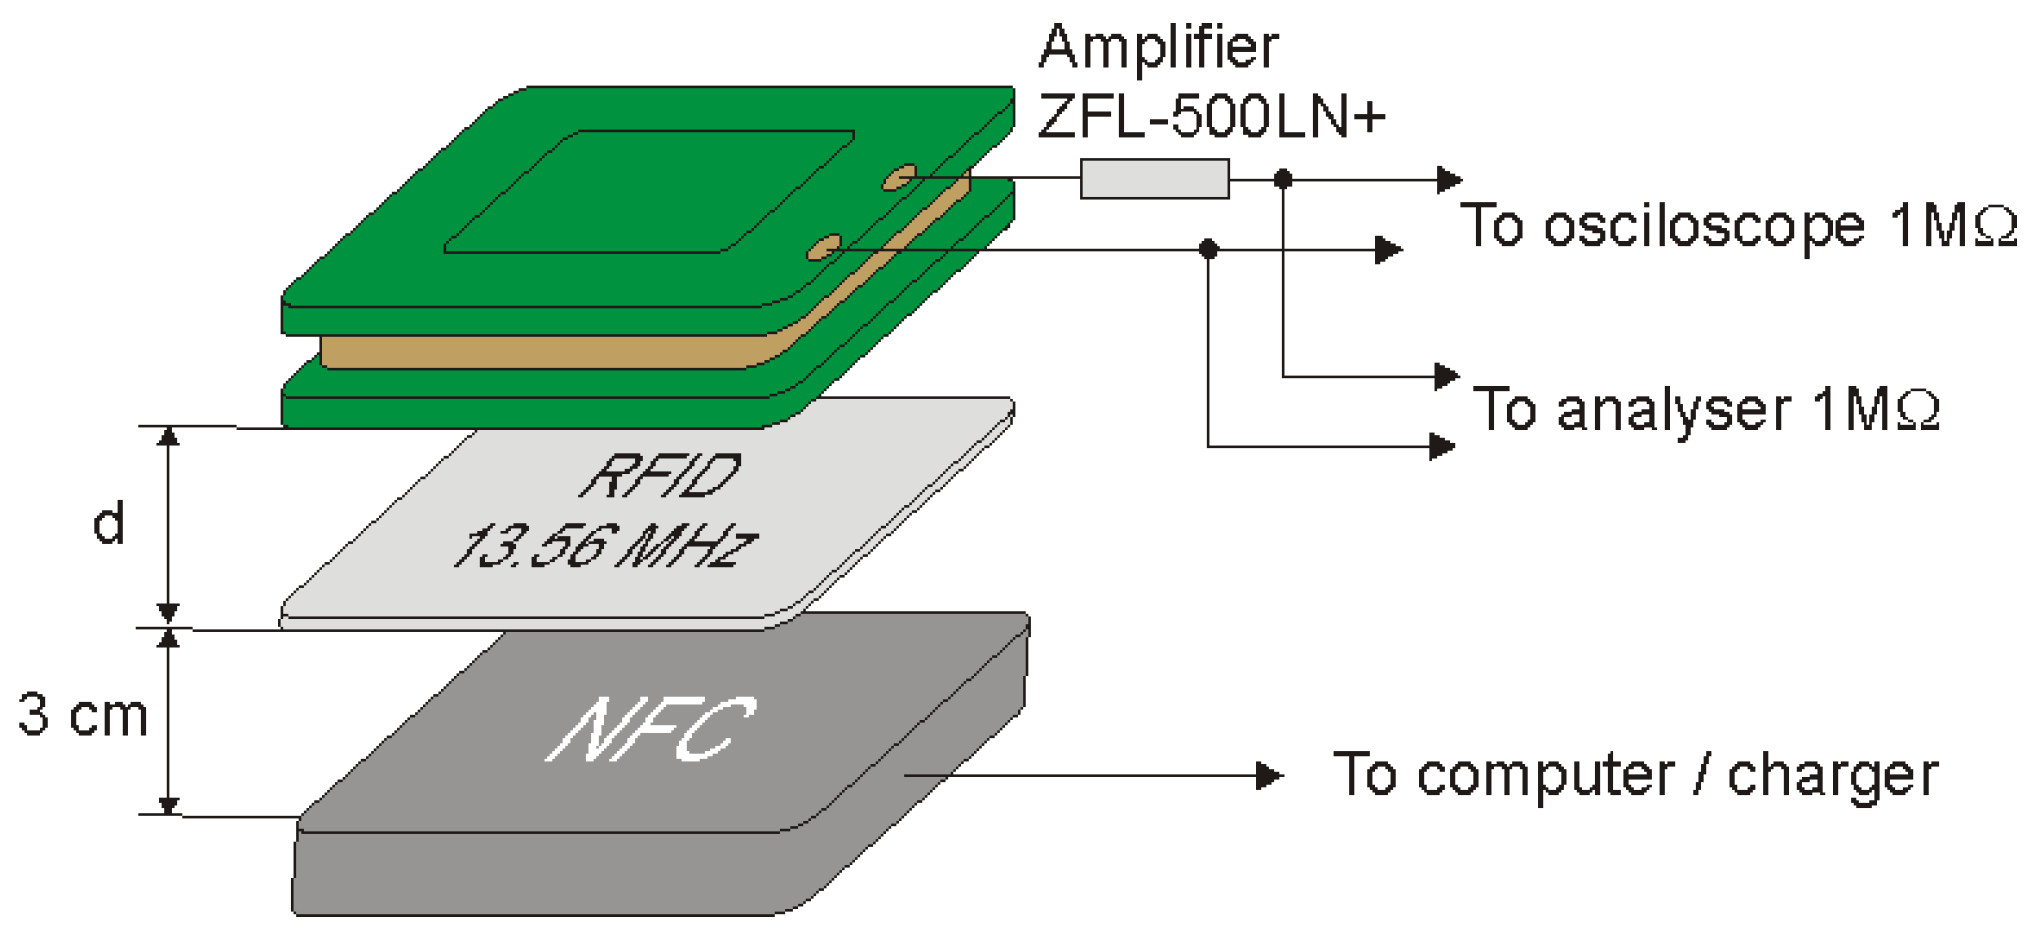
The measuring equipment listed in Table 6 was used to carry out the measurements. The measuring system used in the measurements is shown in Figure 19.
Table 6.
List of apparatus used to carry out the measurements.
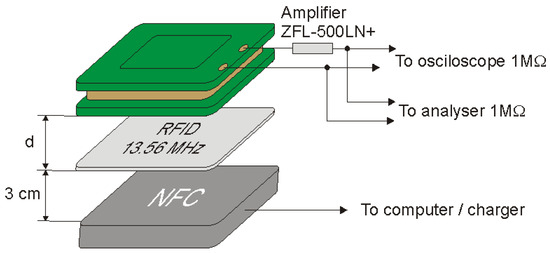
Figure 19.
Measuring system for determining the modulation depth factor using a signal amplifier.
During the tests, the ID card was placed at a distance of 3 cm from the reader. The coil was placed at different distances from the identifier and on the basis of the obtained oscillograms the depth factor and signal level were determined as a function of the distance of the coil from the identifier. The values of and read with the use of an oscilloscope and the calculated values of the modulation depth factor m are presented in Table 7, while examples of images recorded by the oscilloscope are shown in Figure 20.
Table 7.
Recorded signal parameters and calculated modulation depth factor value for selected receiver coil-to-ID distances for ZFL-500LN+ use case.
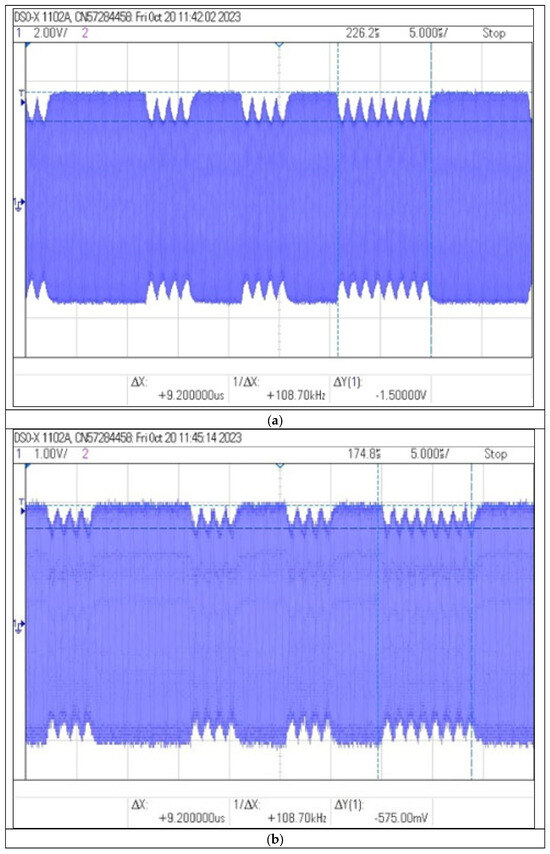
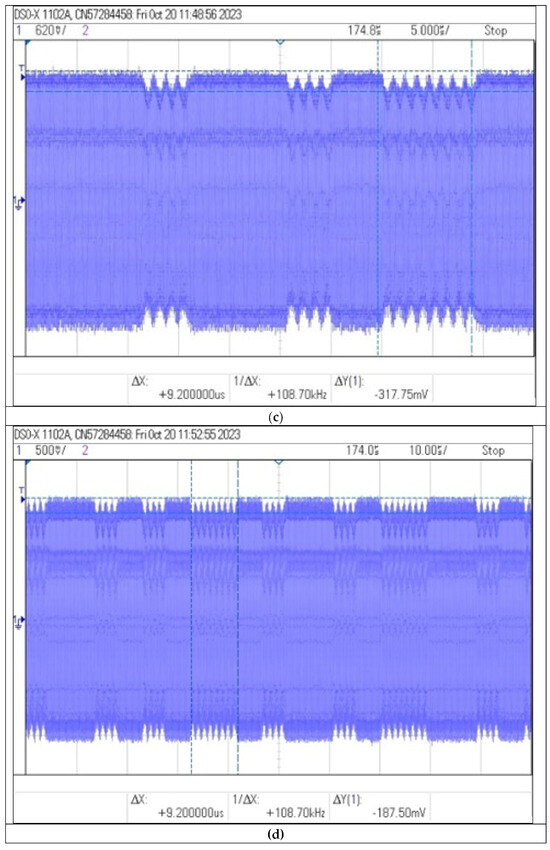
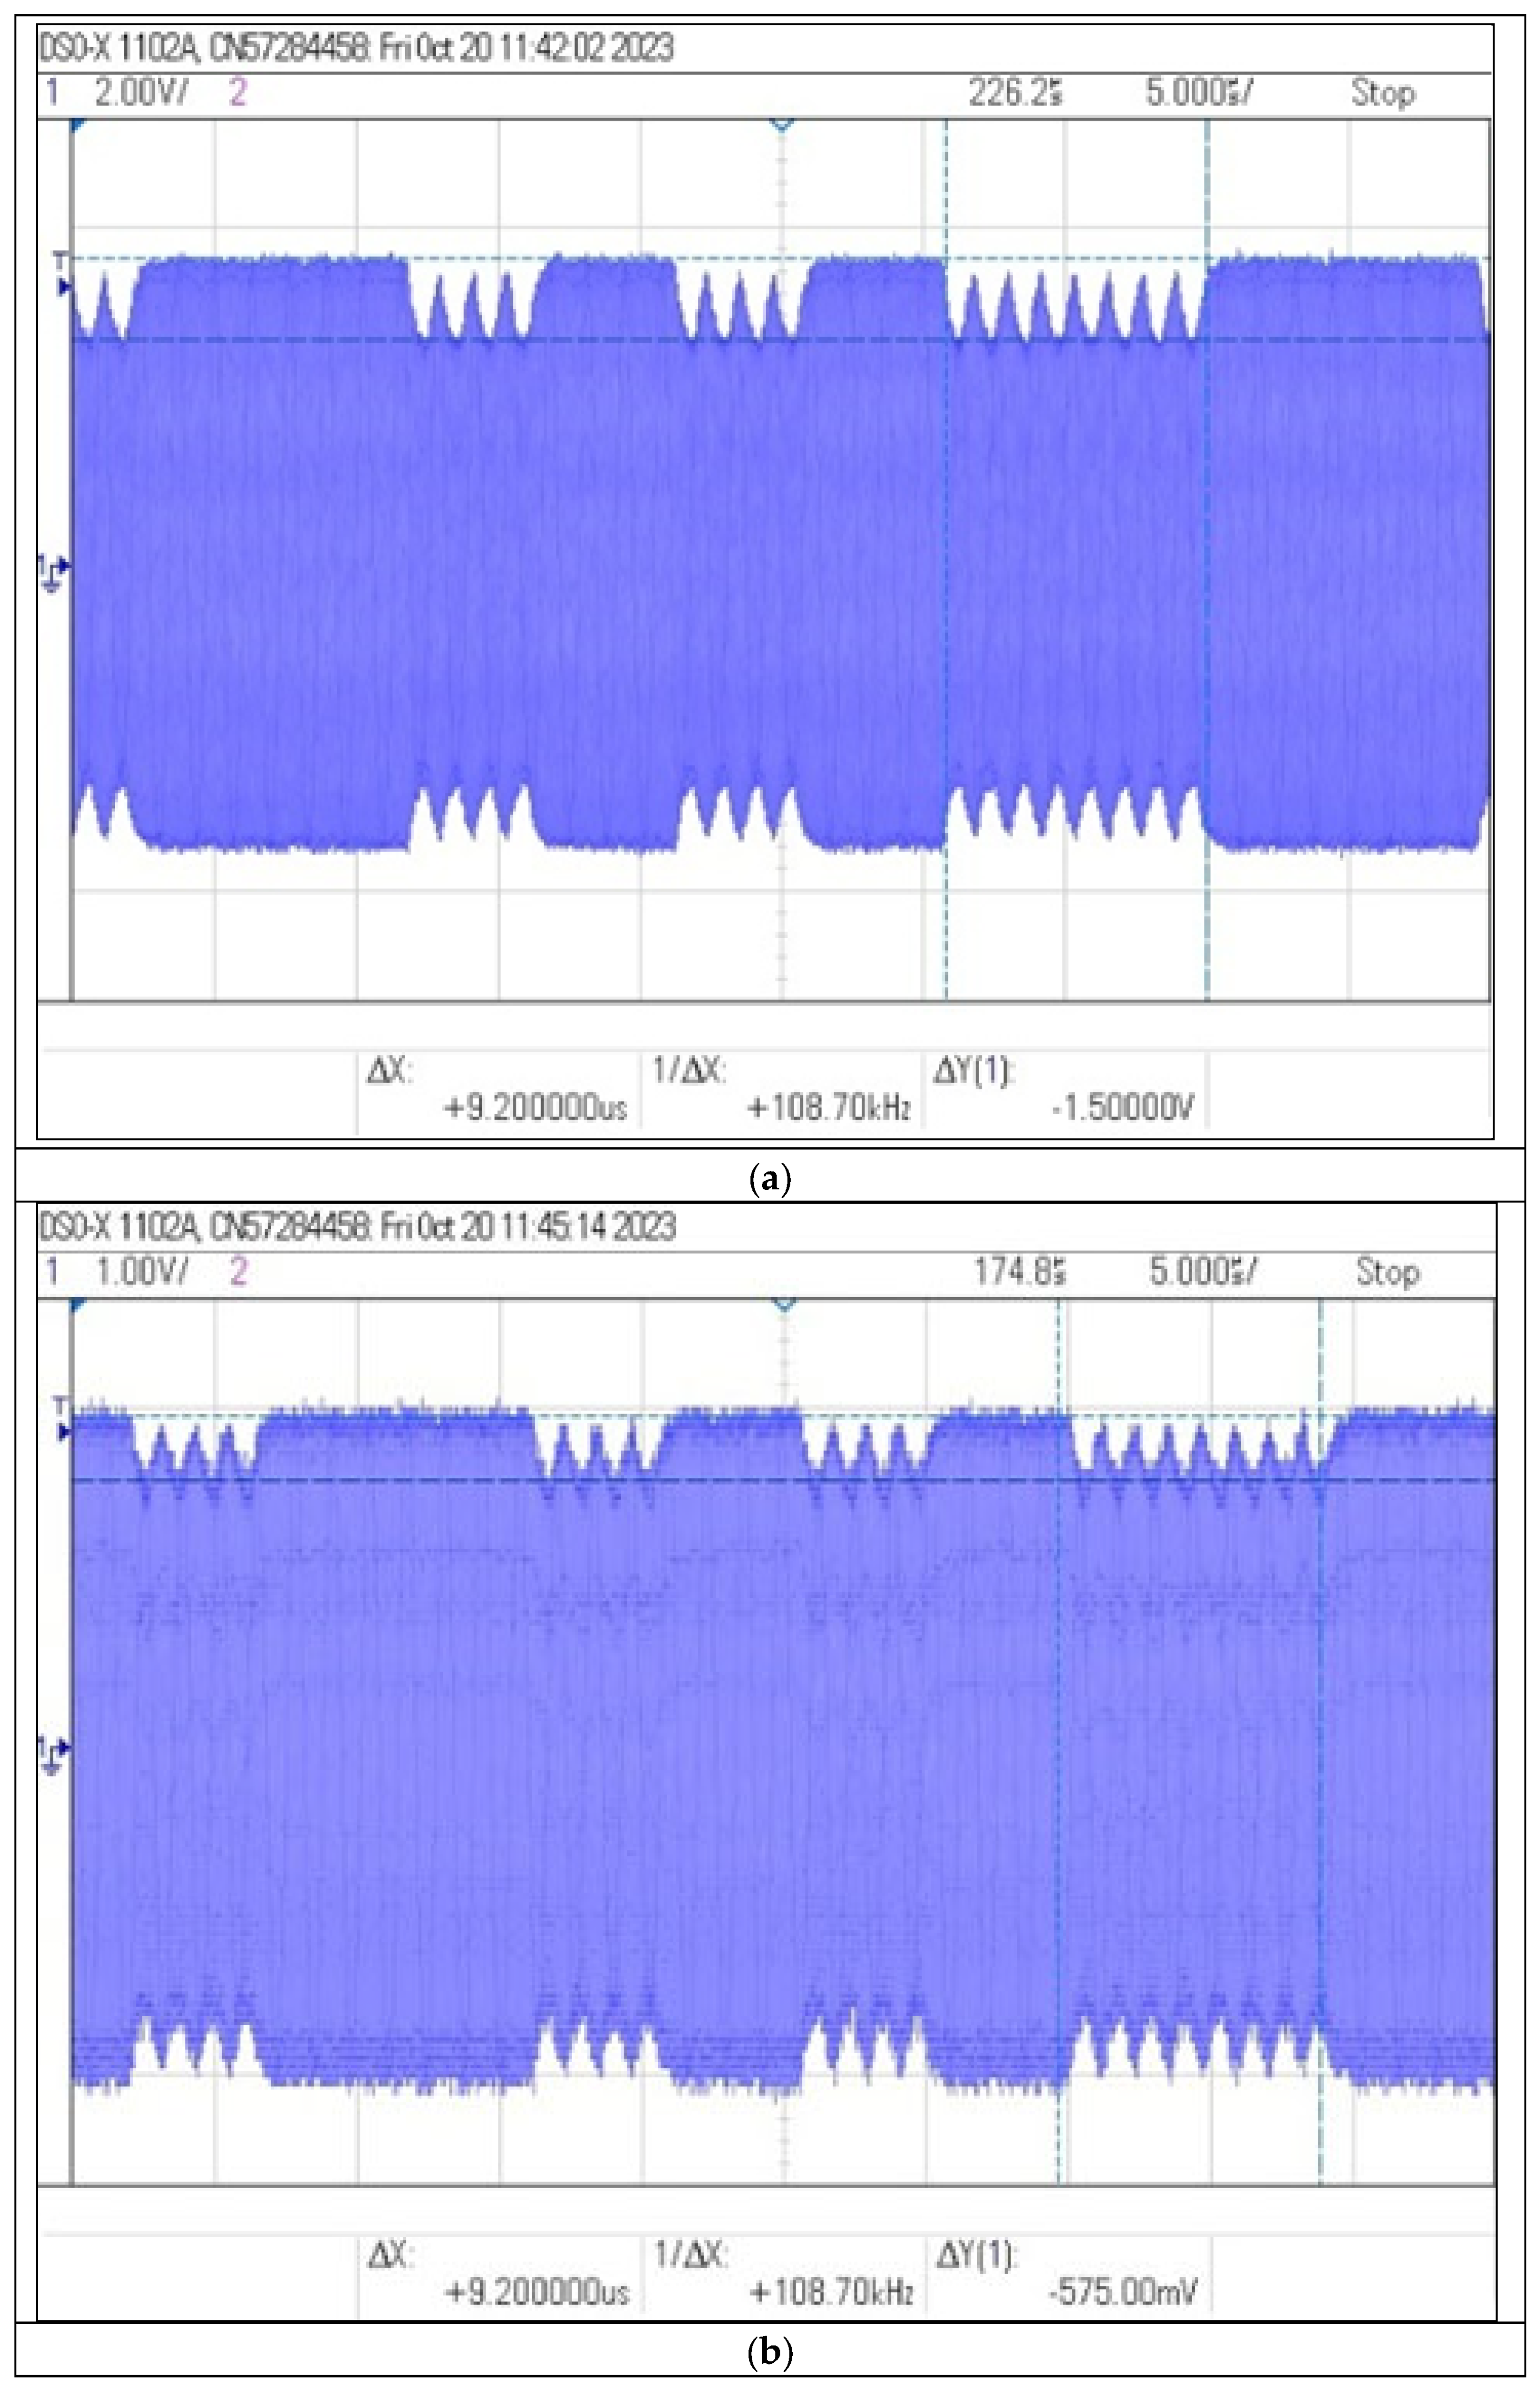
Figure 20.
Recorded signal waveforms corresponding to distance measurements: (a) , (b) 20 (c) and (d) 30 .
The use of the amplifier in the receiver circuit allowed to increase the communication range to 30 cm. The shape of the time waveform of the signal allows for the identification of distinctive features important from the point of view of the possibility of non-invasive information acquisition. Receiving the signal from the identifier from such a distance, in order to copy or retransmit it, may already pose a significant threat to the data contained in the identifier.
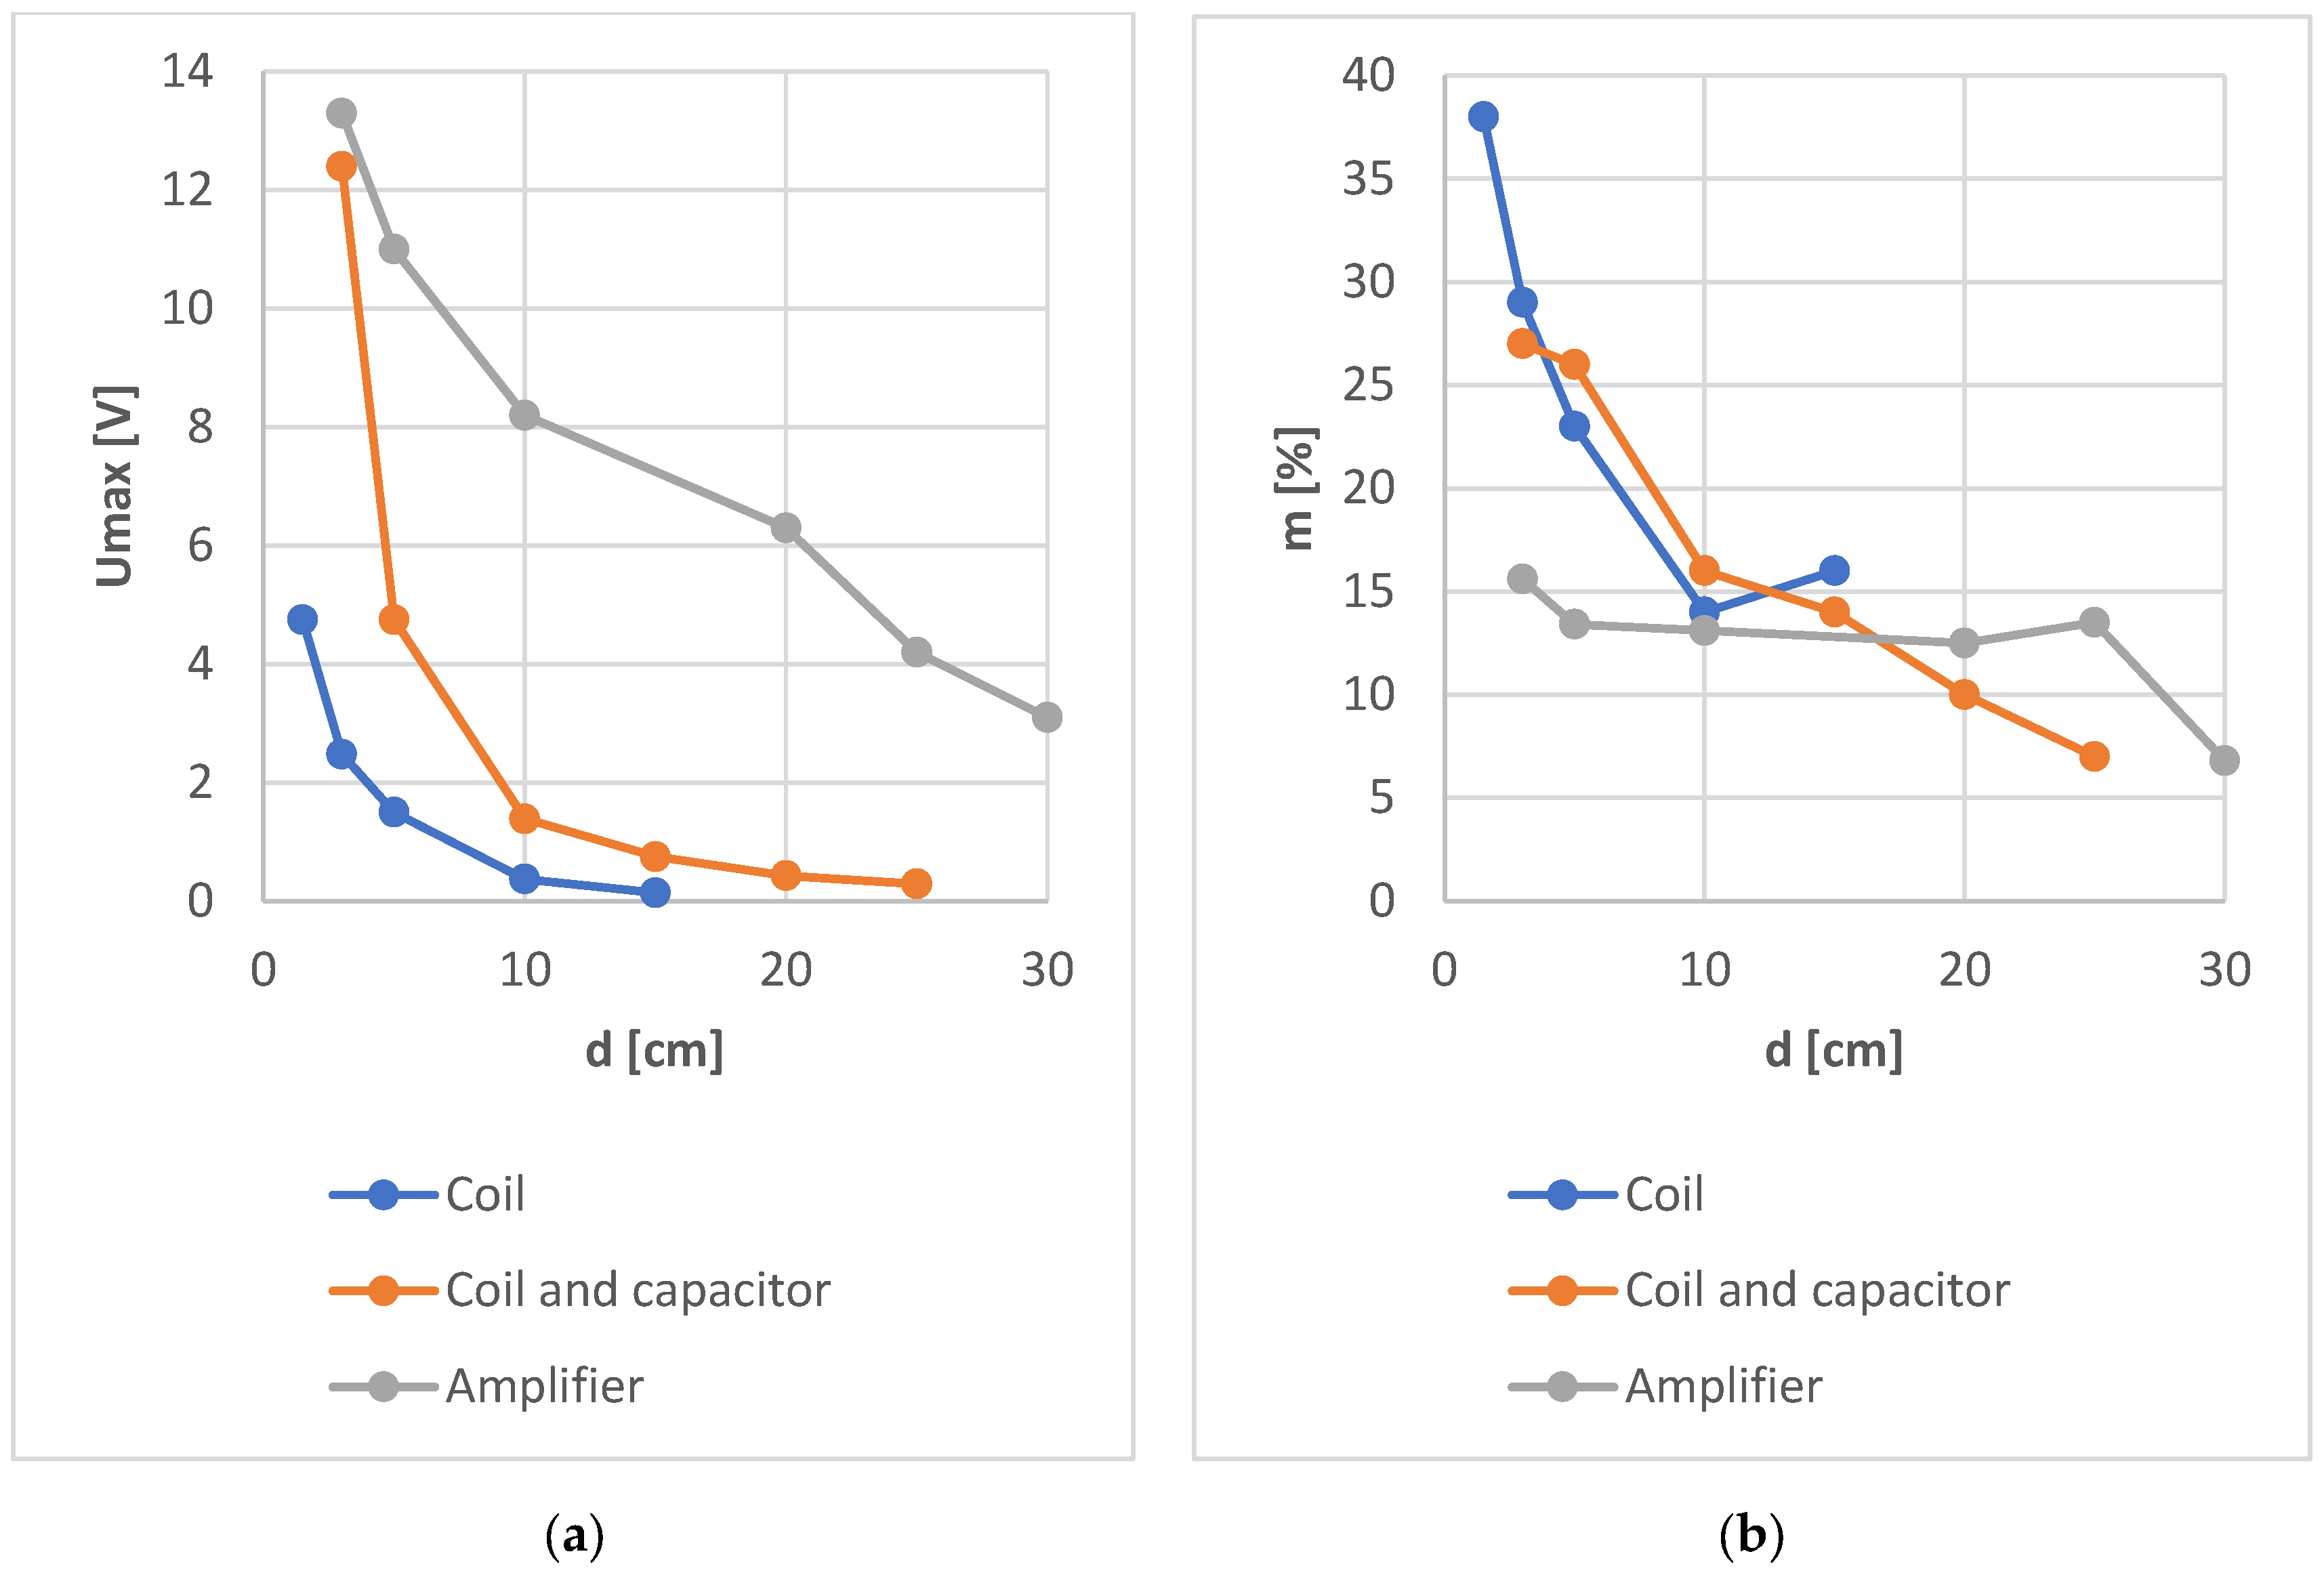
Of the three methods of reading data from the NFC identifier presented, the method using an amplifier seems to be the most effective. However, a much simpler and cheaper solution, and comparable in terms of effectiveness, is the use of a resonance system. The benefits resulting from the use of the resonant system are observed especially for distances d not exceeding 20 cm, when the signal readability (modulation depth factor) is comparable or even greater than in the case of using an amplifier. At the same time, the amplitude of the read signal is sufficient to receive it without the need to use expensive specialized receivers. A comparison of the level of signals measured by each of the three methods presented above and the modulation depth factors is shown in Figure 21.

Figure 21.
Comparison of the measured maximum signal levels (a) and the determined modulation depths (b) using the three methods discussed.
3. Electromagnetic Security of Selected HF-Band RFID Card Readers and Access Control Systems
3.1. Reader Systems
The experiments described so far, aimed at increasing the range of communication between the RFID card and the receiver, did not allow for a significant increase in the distance between the receiver and the card. Even with the use of an amplifier, the range of communication is still close to that declared by the manufacturers of RFID systems.
Therefore, in the next step, research was carried out for three cases of different ways of reading identifiers [22,23,24,25,26]:
- (a)
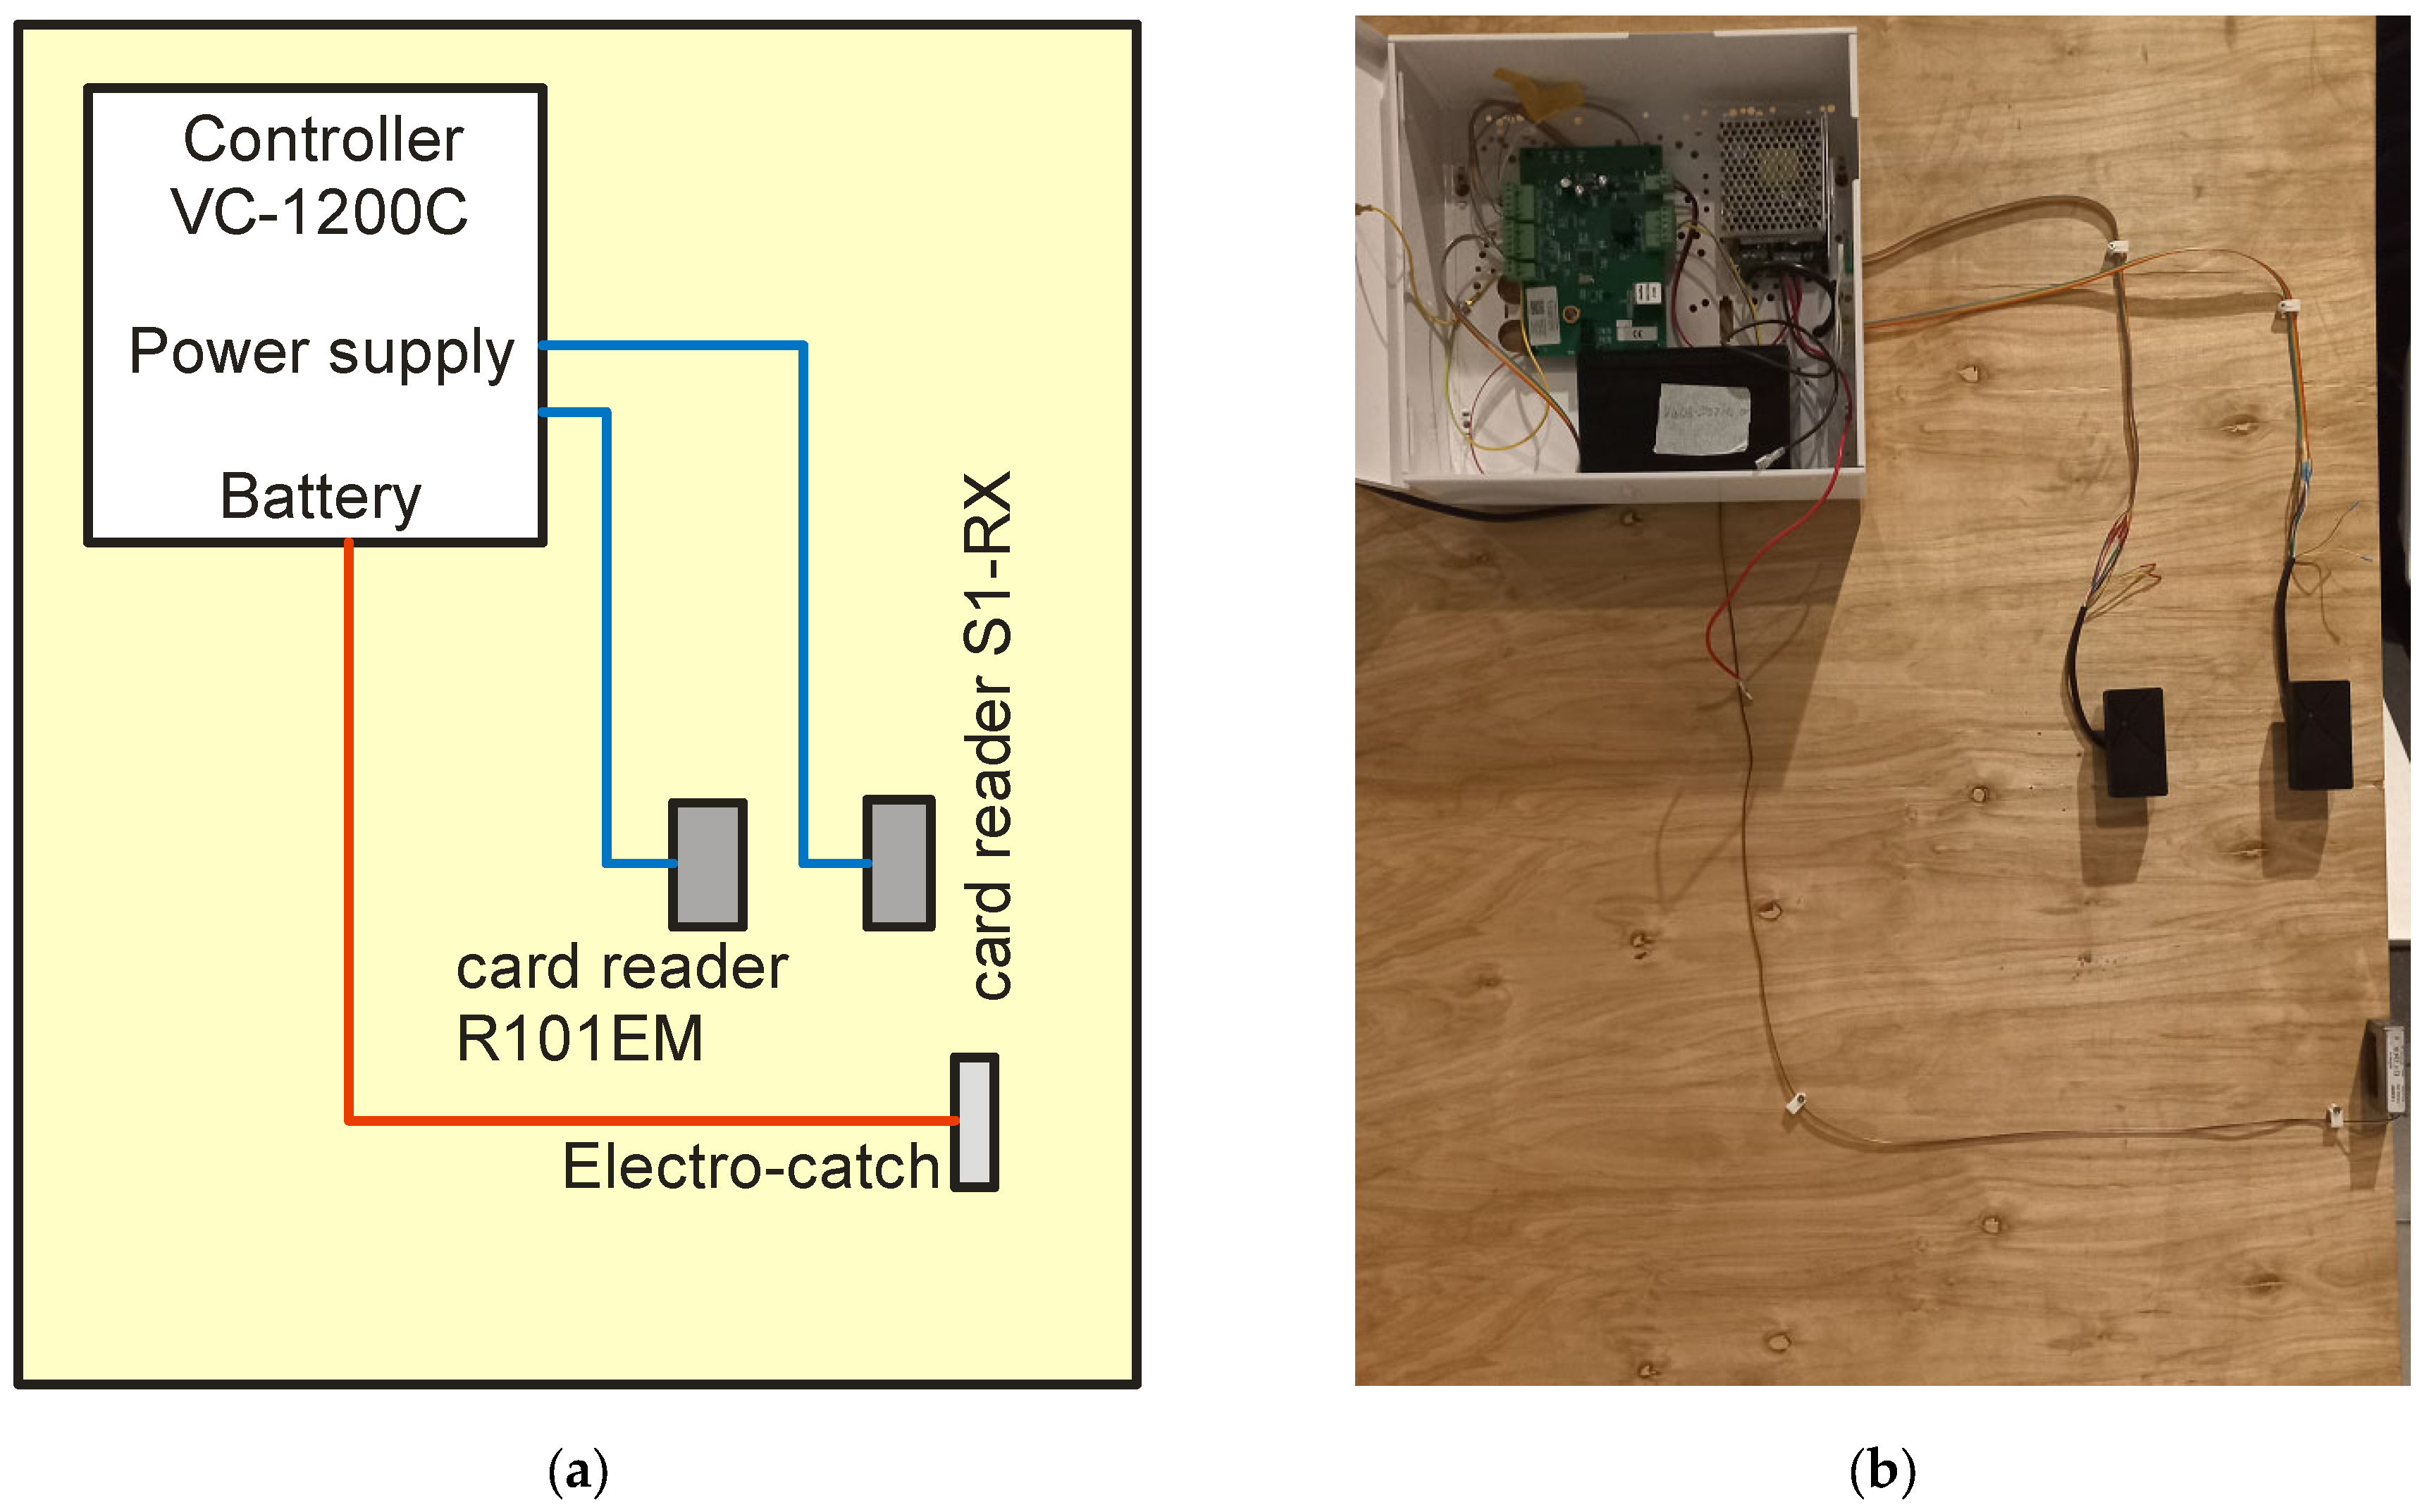
- A complete access control system consisting of the following:
- VC-1200C controller;
- Power supply;
- Battery (backup system);
- 1 RFID Card Readers R101EM;
- 1 RFID card readers S1-RX;
- Electric door strike.
- (b)
- Reader/programmer connected to the USB connector of the computer.
- (c)
- NFC-enabled phone as a reader.
The measuring equipment listed in Table 8 was used to carry out the measurements. Measurements for each of these cases were carried inside an anechoic shielding chamber. This was to avoid the influence (jamming) of external disturbances on the obtained results.
Table 8.
List of equipment used to carry out measurements of selected HF-band RFID readers.
3.1.1. Access Control System
The diagram of the complete access control system and its practical implementation is presented in Figure 22.
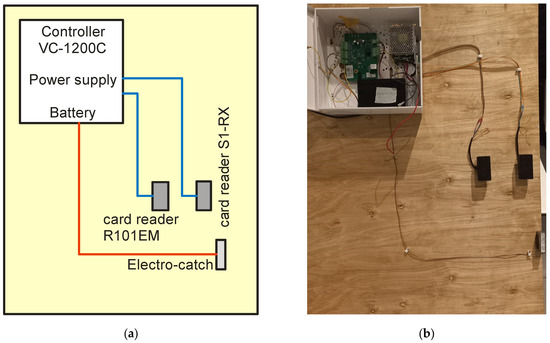
Figure 22.
(a) Diagram of the access control system and (b) its practical implementation.
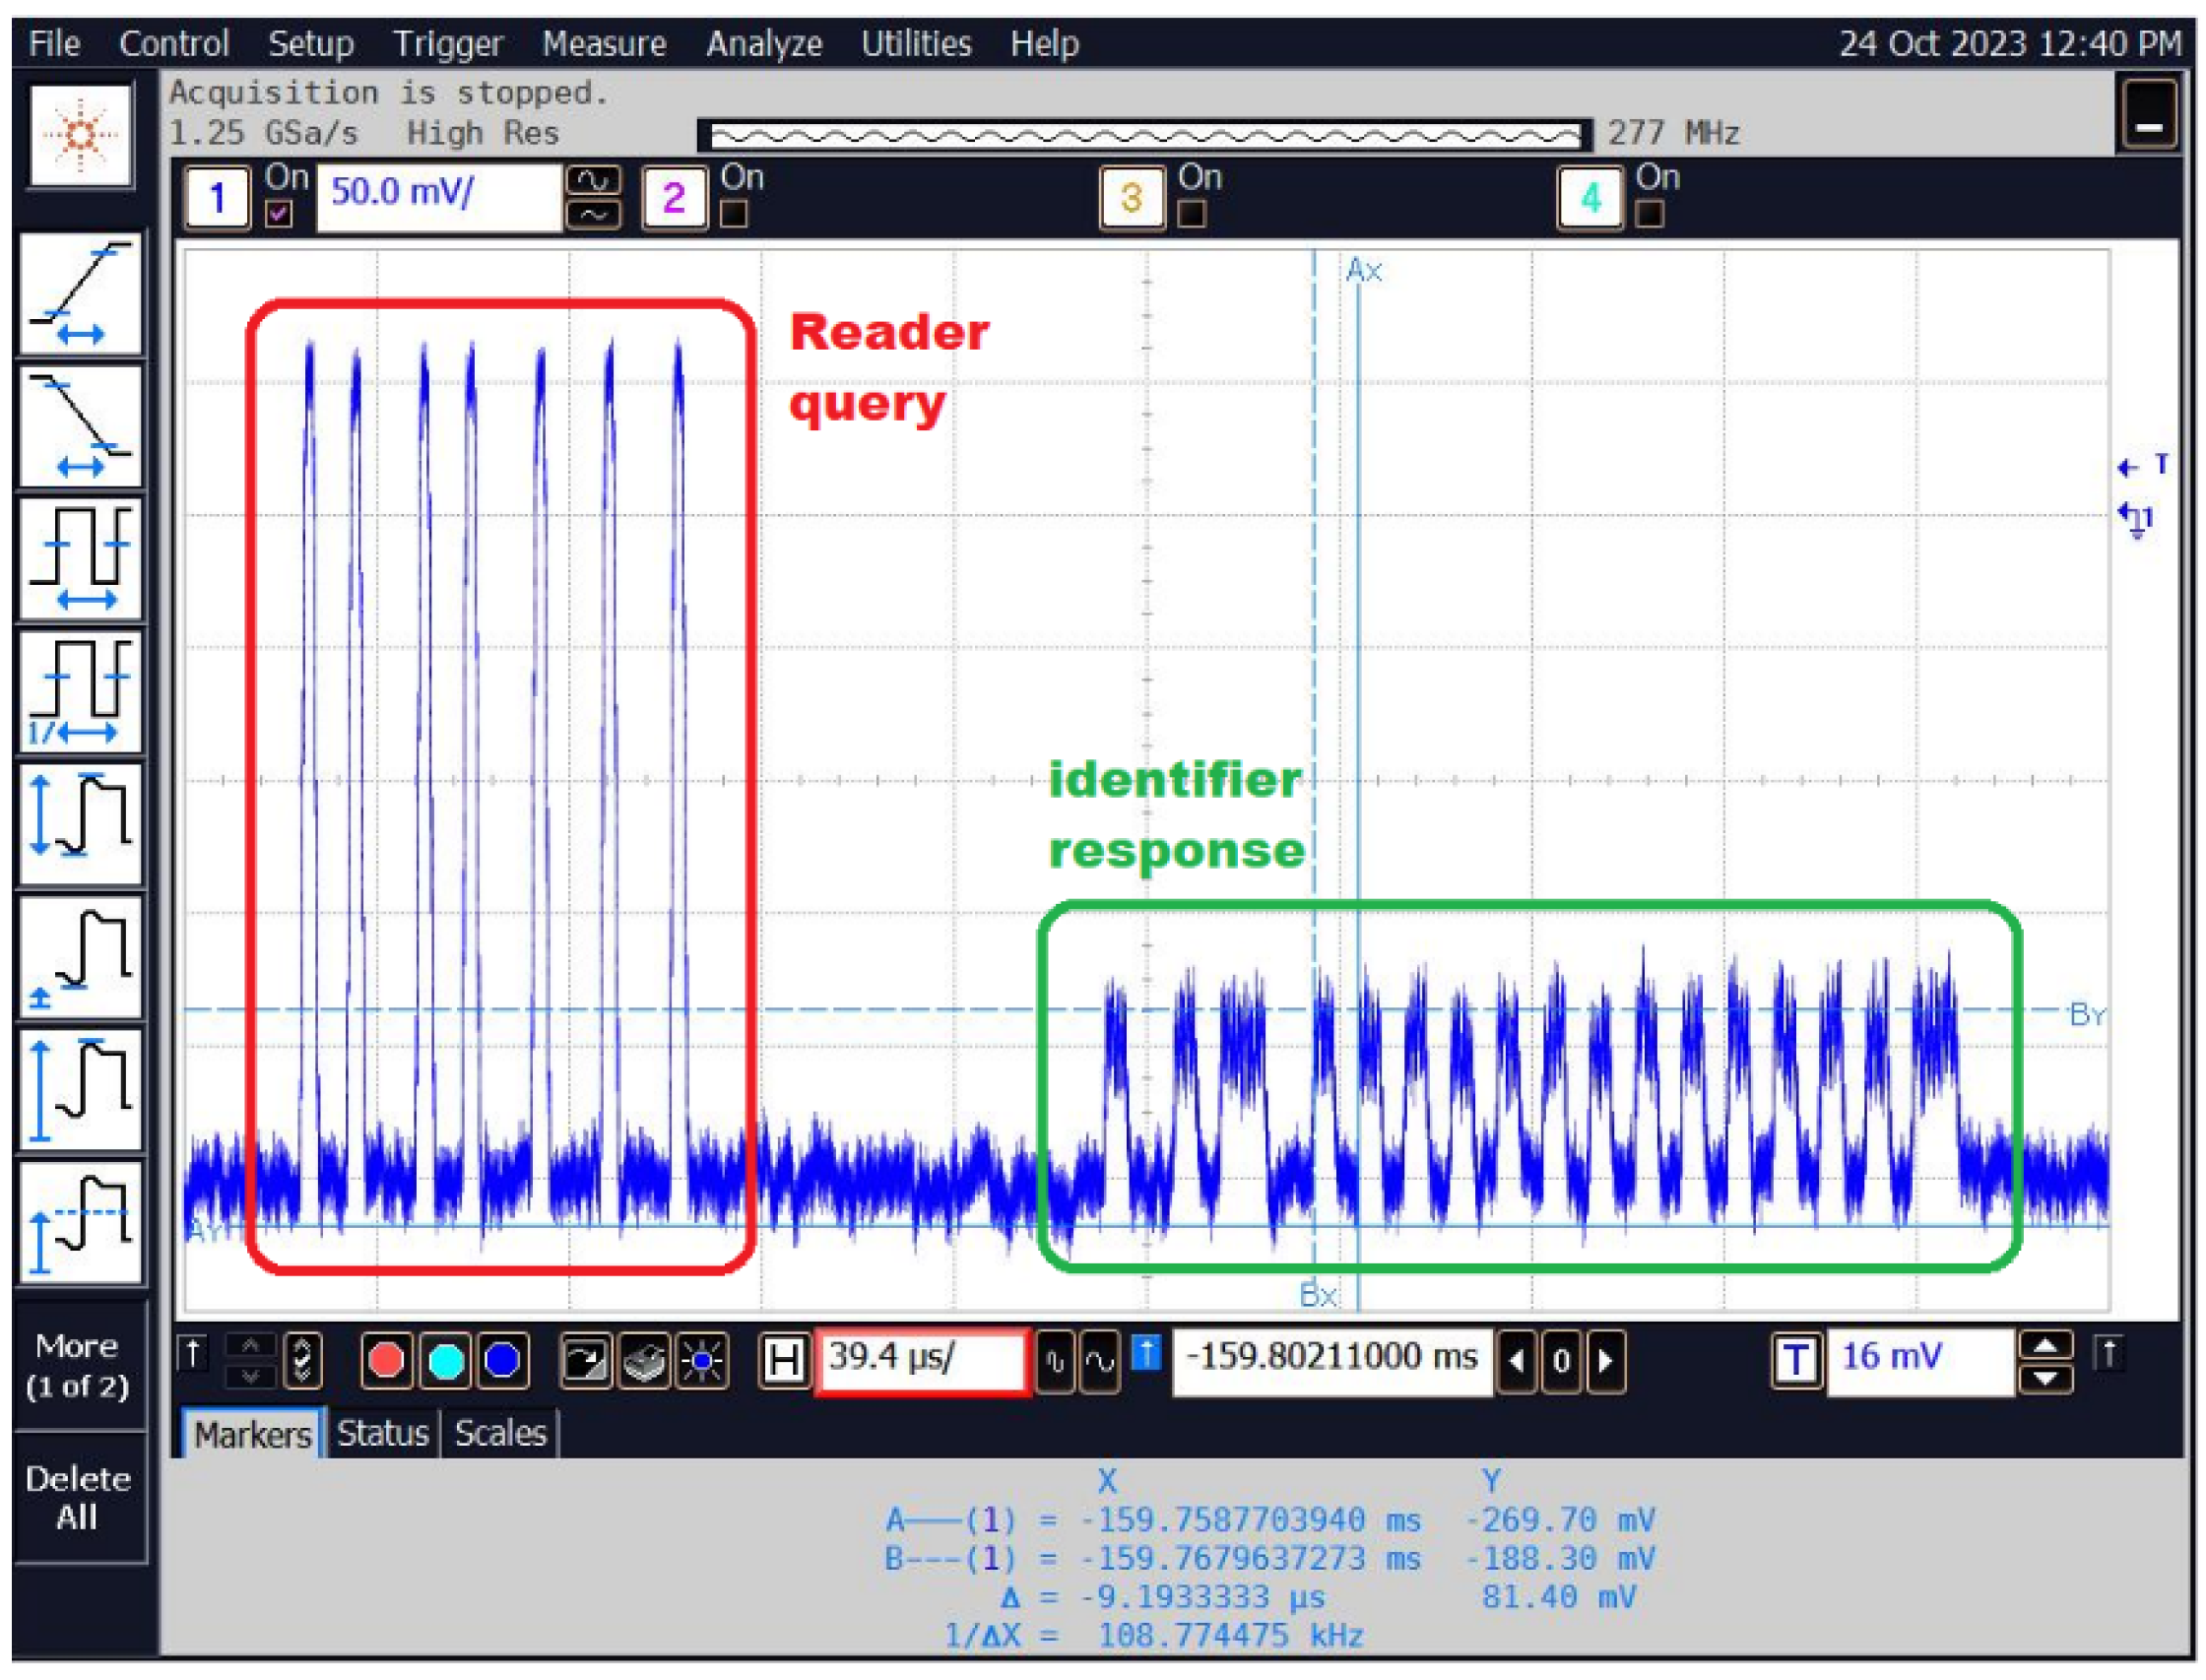
The recorded signals from the tested system include both signals from the reader queries and signals from the identifier responses, which are shown in Figure 23.
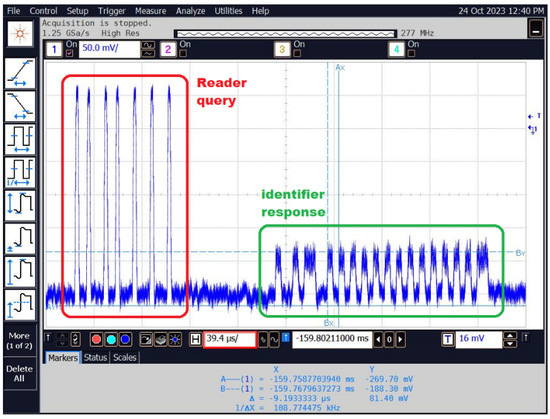
Figure 23.
An example of a signal waveform recorded from the reader–identification system.
If no identifier is in the immediate vicinity of the reader (within its range), then the reader continuously sends queries (in the case of the access control system reader it is approx. every 10 ms, and approx. every 1 ms in the case of the used reader–programmer). This is shown in Figure 24.
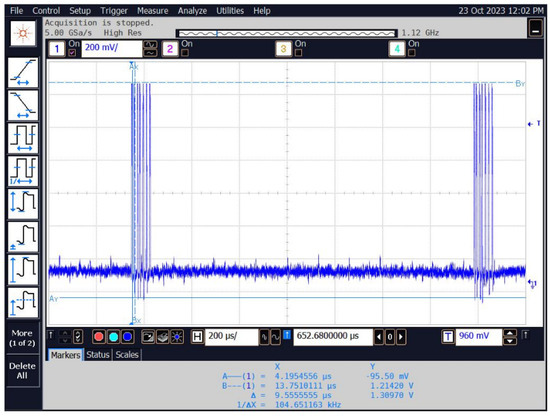
Figure 24.
The time waveform of the signal corresponding to the queries sent by the reader when there is no identifier in range.
When the identifier is brought closer, a signal with a lower amplitude appears in response to the query, which is the response of the identifier. The lower amplitude of the response is related to the identifier’s method of functioning, which does not have its own power source and “takes” the necessary energy from the reader’s signal. However, it does not introduce additional electromagnetic energy into the environment, but only affects the signal sent by the reader, modulating it to a depth usually not exceeding 40%.
The time waveform of an example of a recorded signal containing a number of questions and answers, as shown in Figure 25.
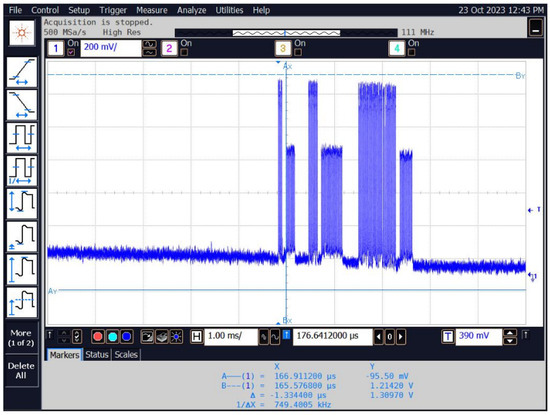
Figure 25.
Time waveform of the signal corresponding to the reader’s queries and ID responses.
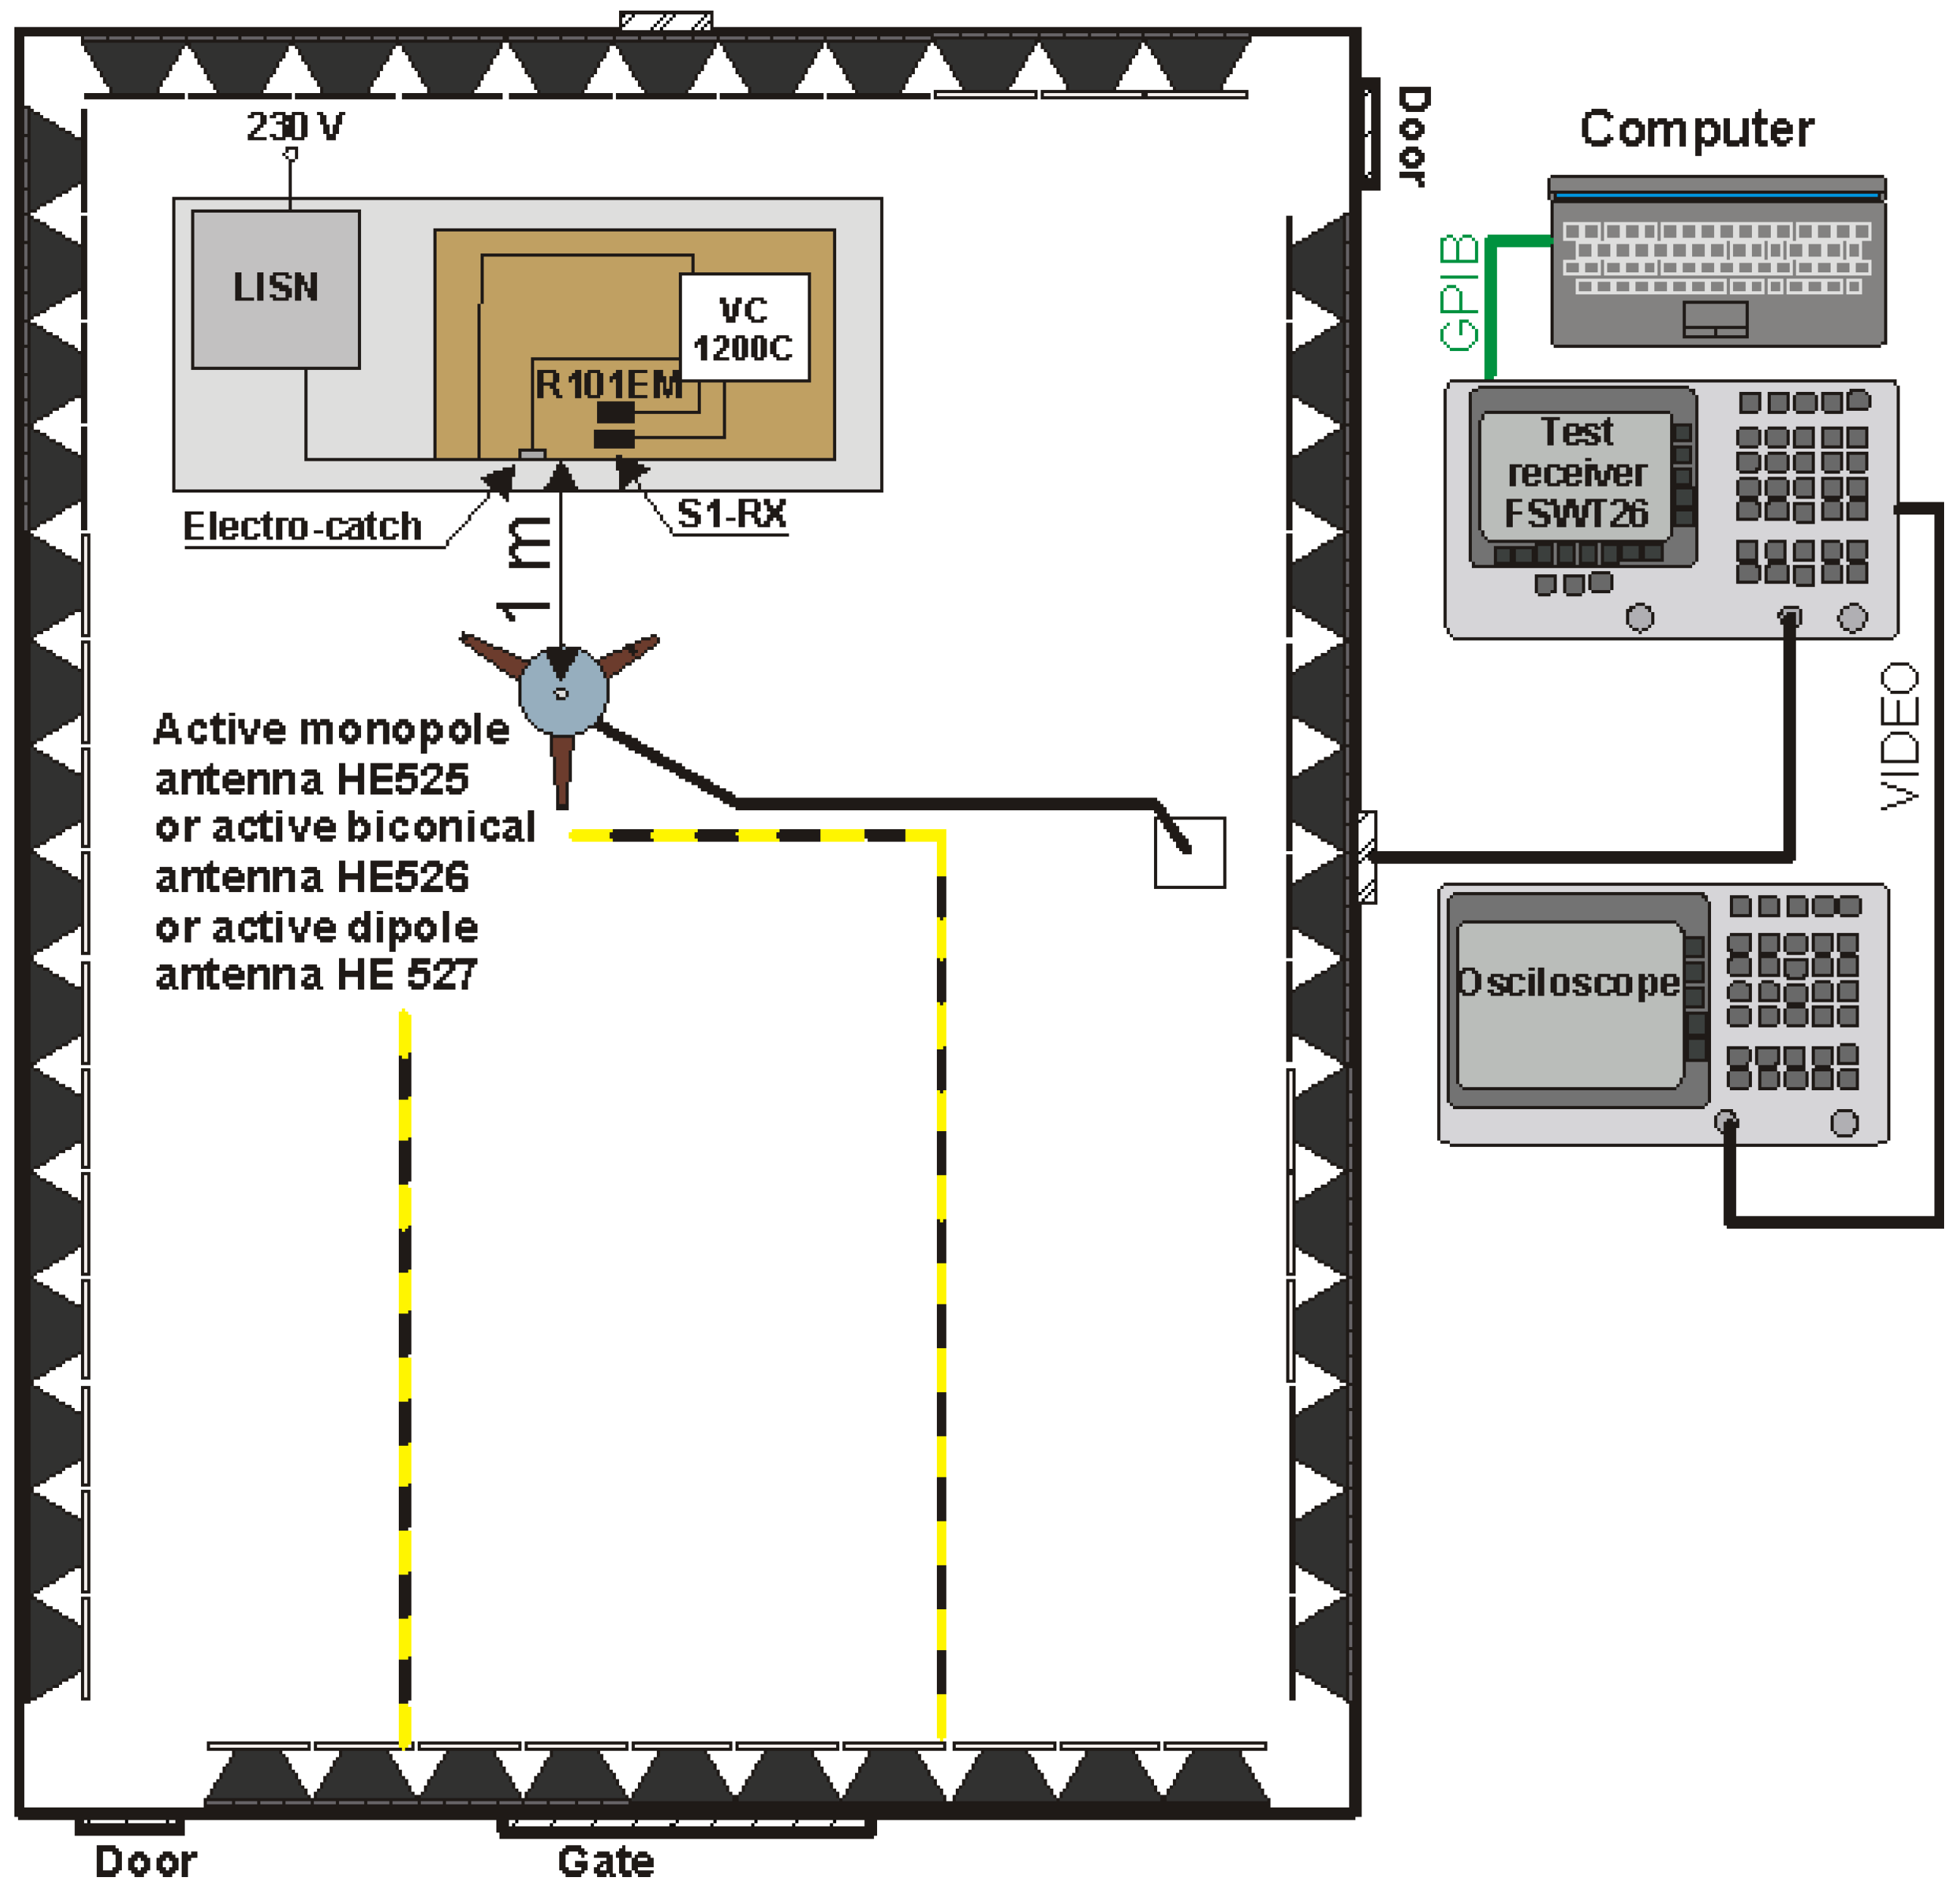
The measuring system in which the measurements were carried out is presented in Figure 26. The measurements for this case were carried out in the frequency range from 1 MHz to 1 GHz. Potentially dangerous frequencies may be, for example, the basic frequency of the reader’s operation (13.56 MHz) and its harmonics.

Figure 26.
Measuring system for testing revealing emissions from the access control system under test.
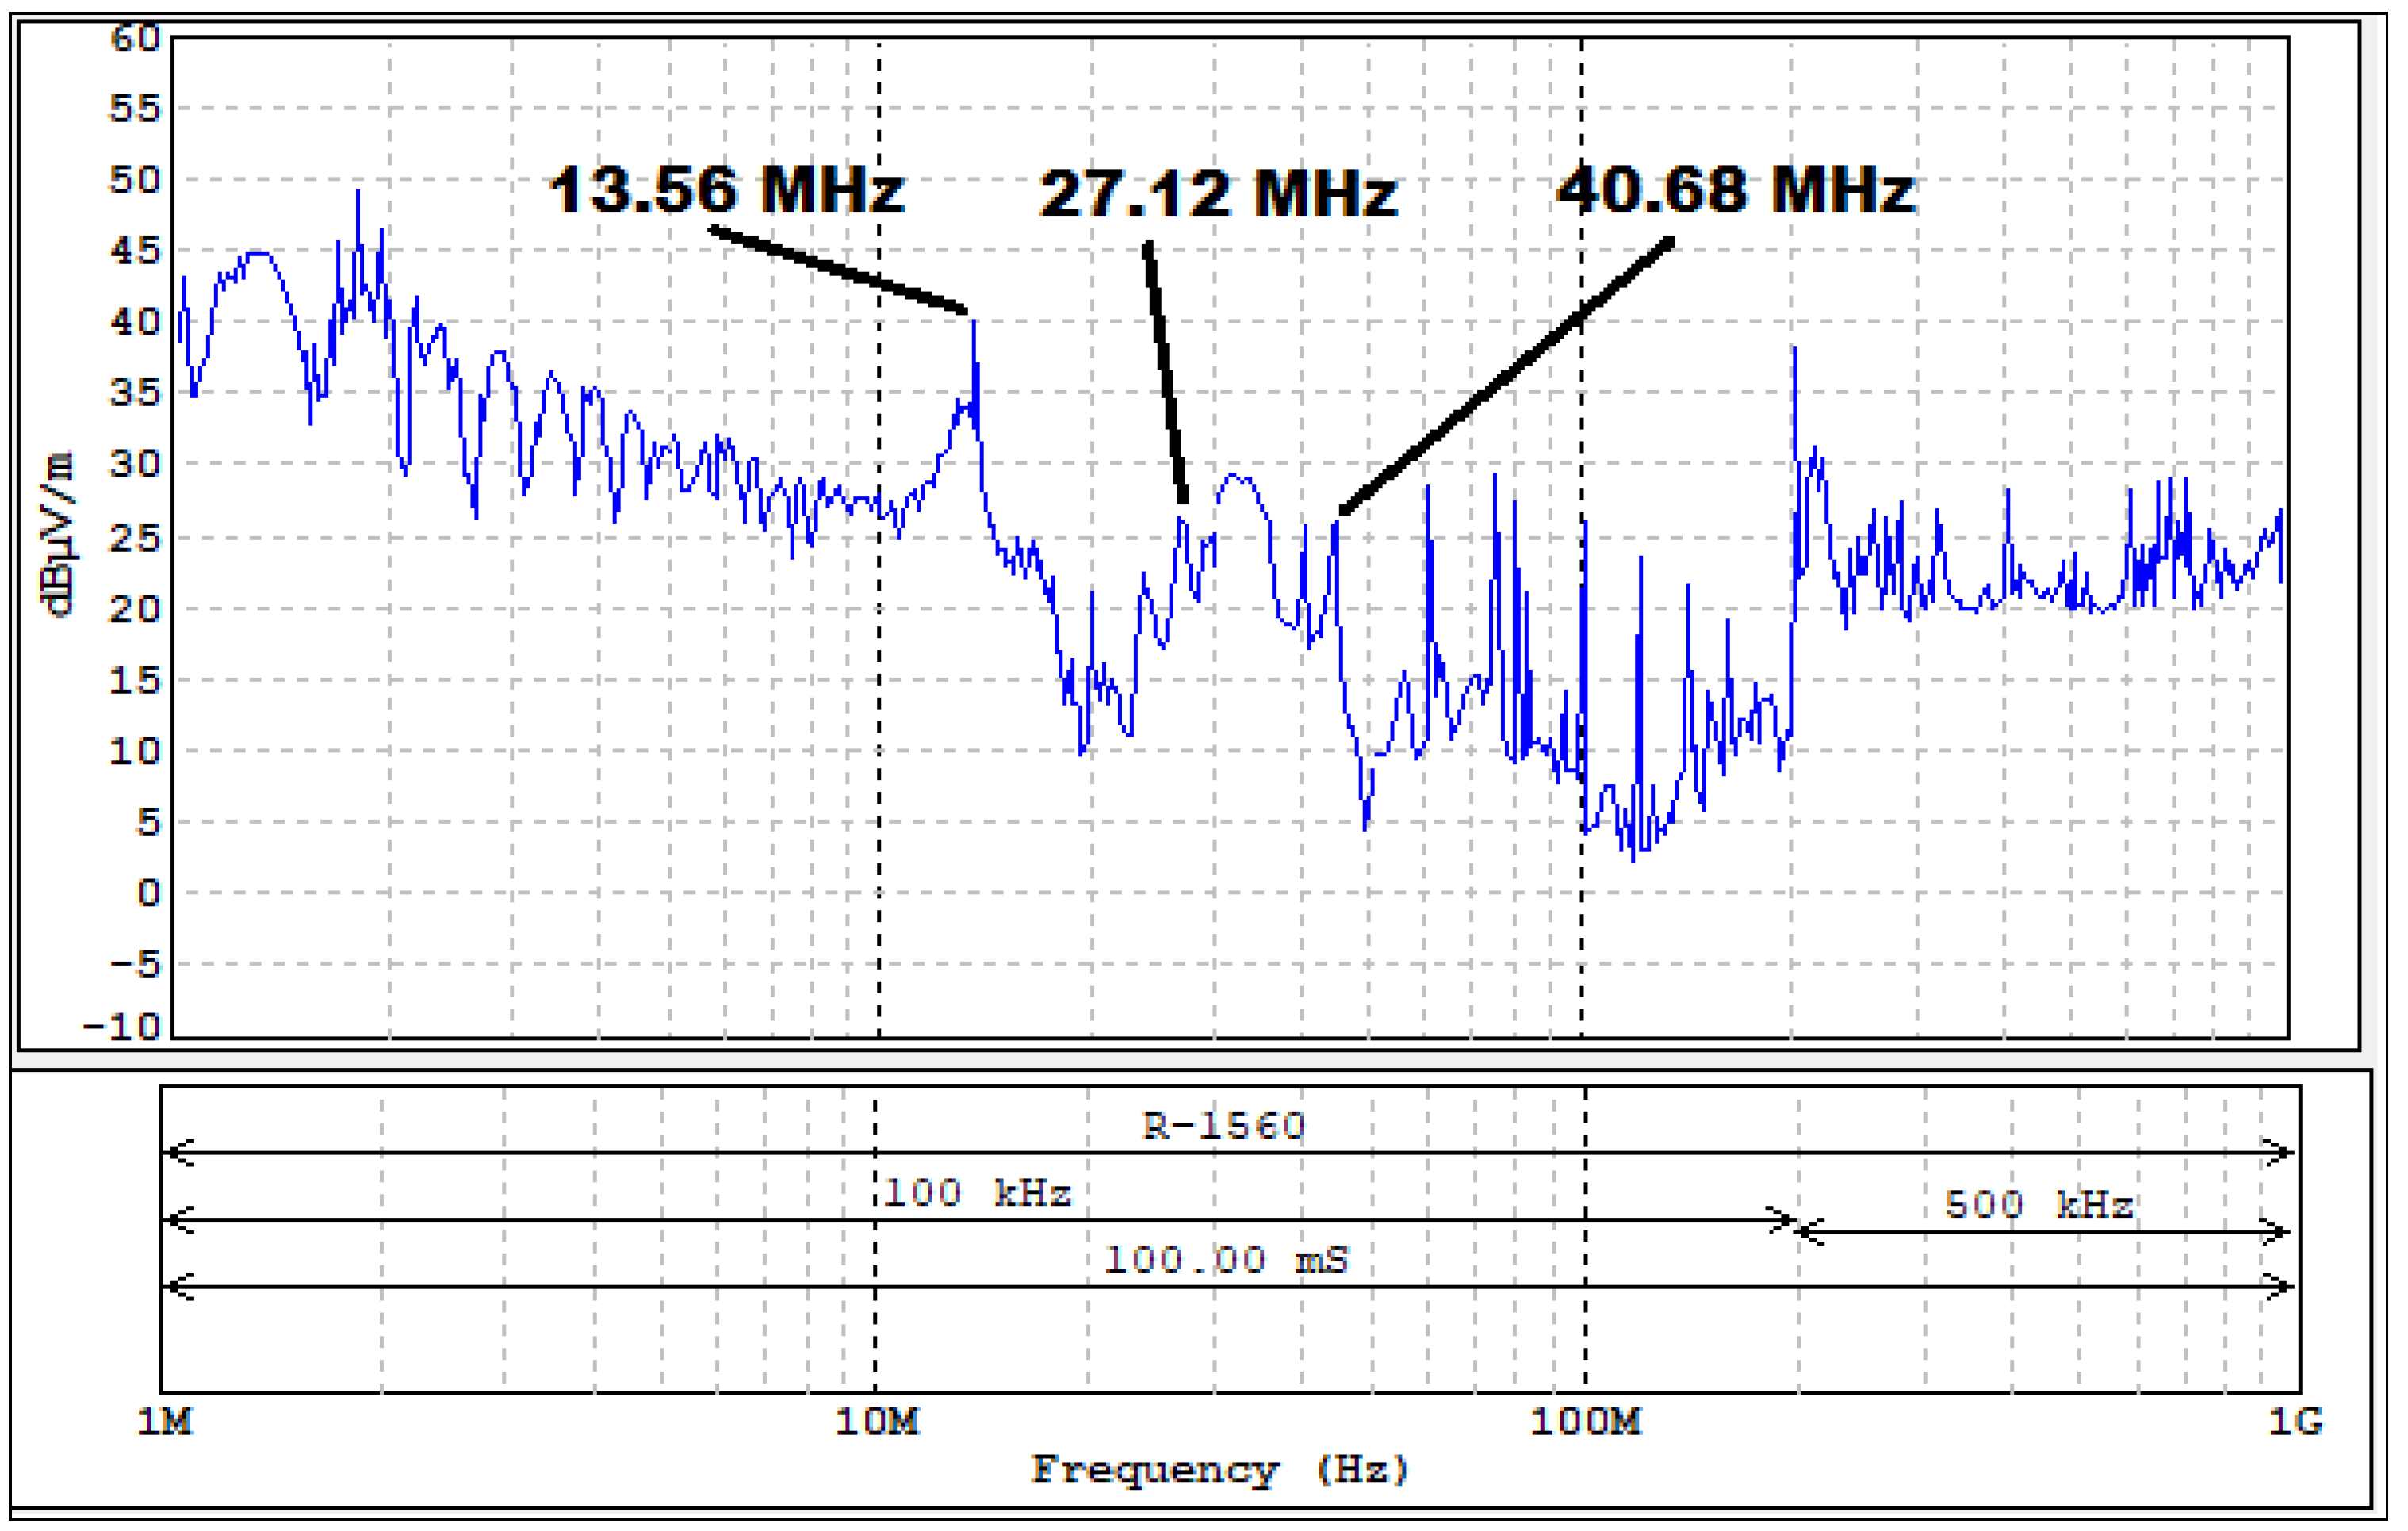
A graph showing the signal level at individual frequencies is presented in Figure 27.
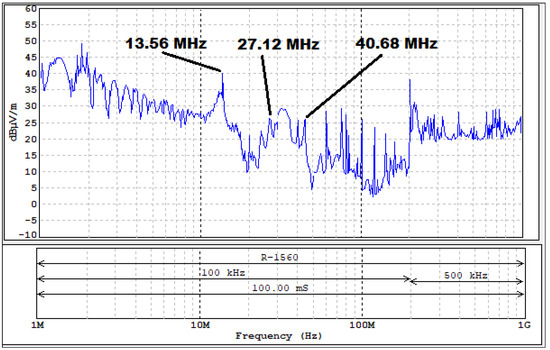
Figure 27.
Level of electromagnetic disturbances from the tested set of access control.
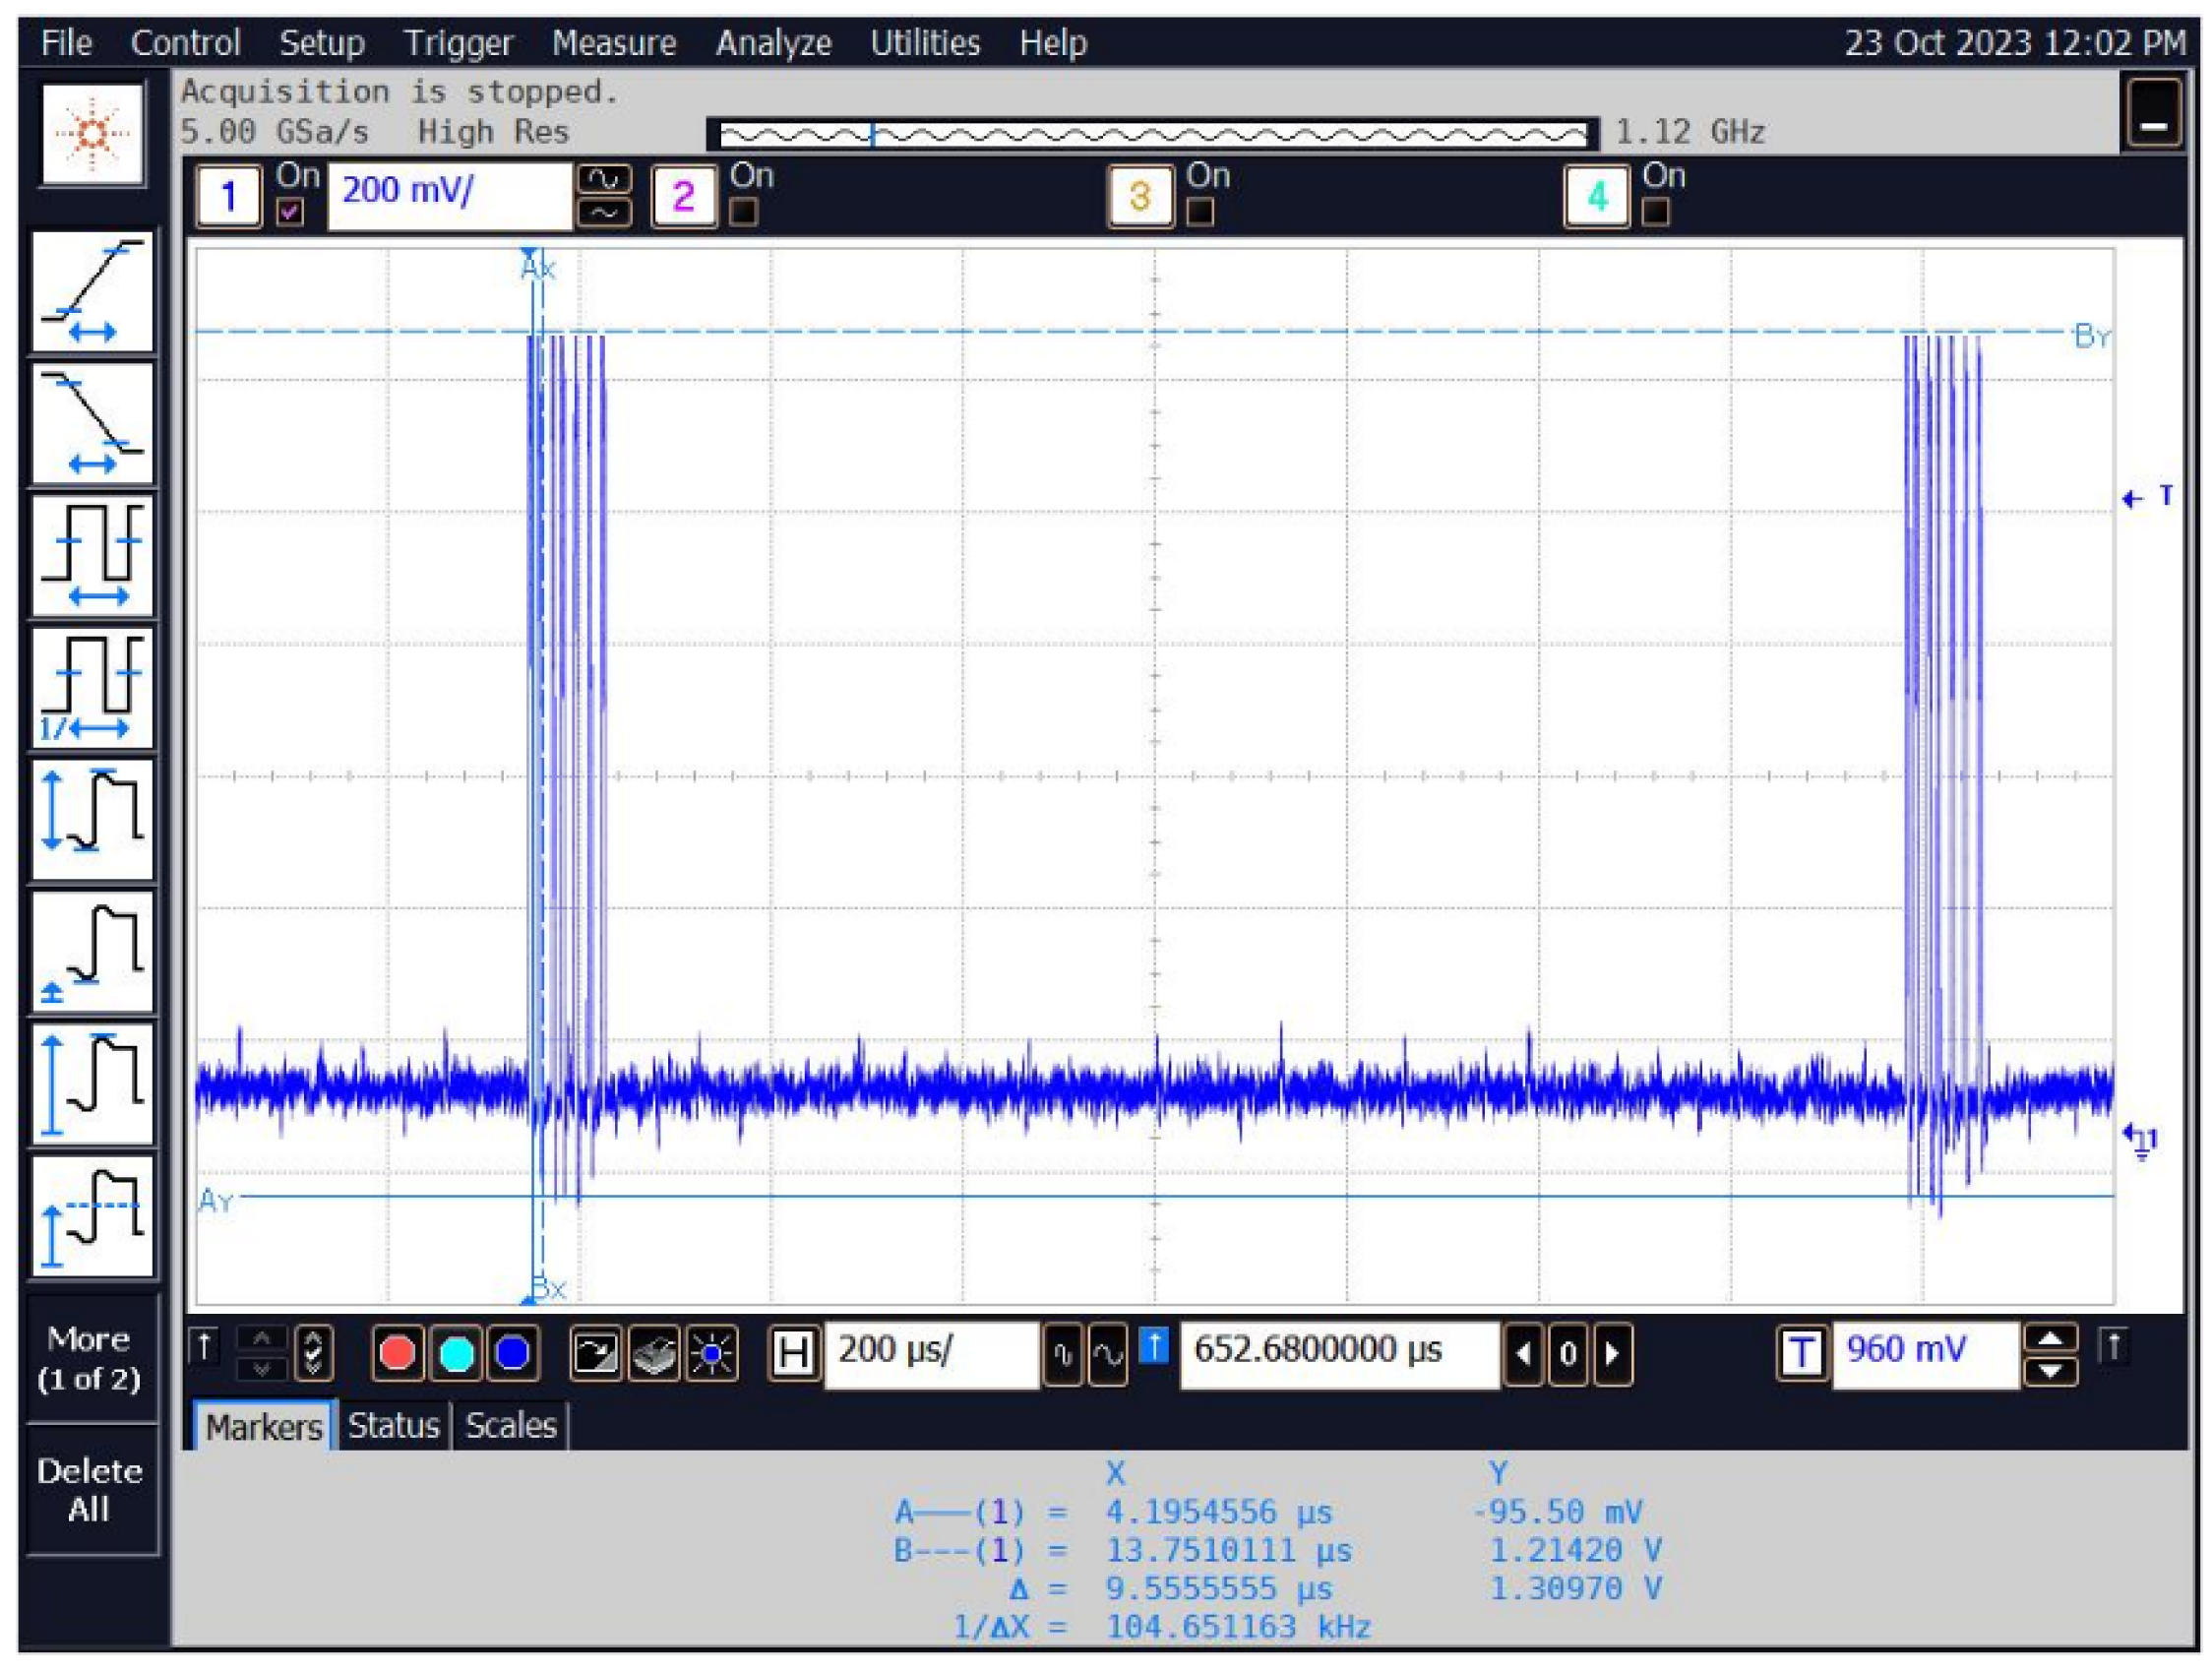
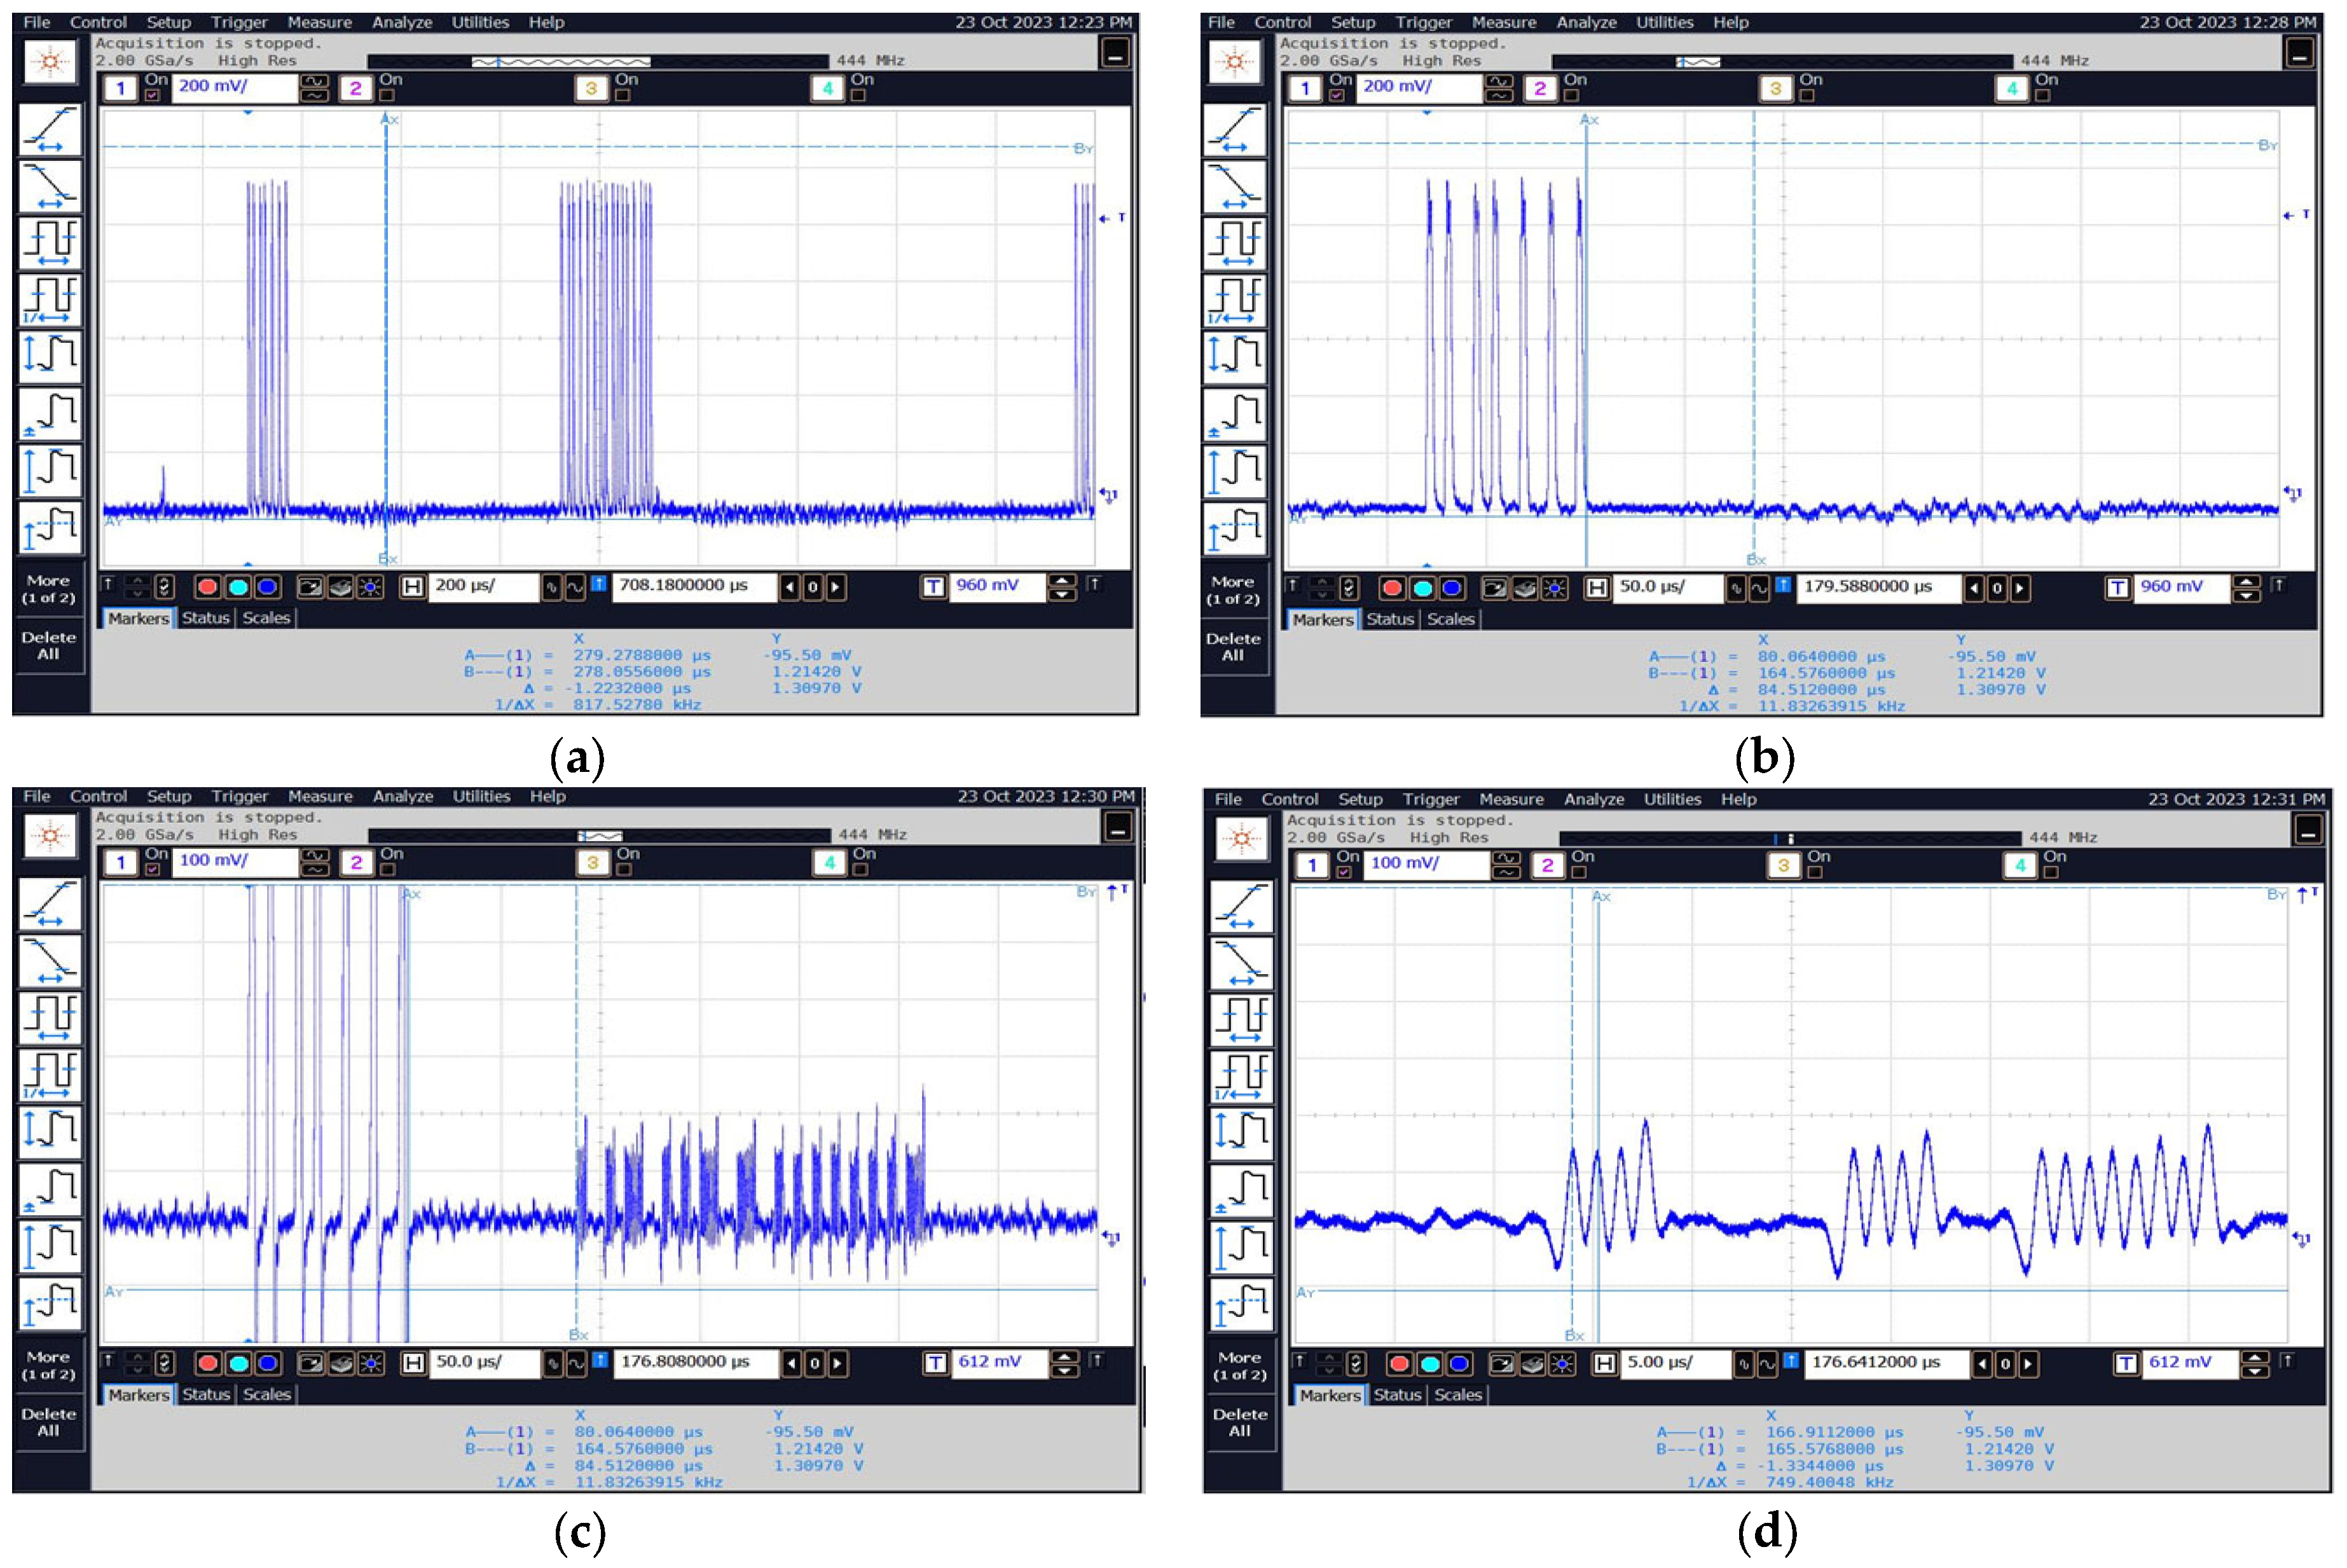
Figure 28 shows waveforms recorded with an oscilloscope connected to the “VIDEO” output of the measurement receiver after tuning to selected frequencies. The used FSWT26 receiver has two programmable outputs. Measured VIDEO signal can be redirected to any of these outputs. For our tests, the oscilloscope connected to one of these outputs was used. The oscilloscope allows recording of binary and text files. This function was used during the conducted tests.
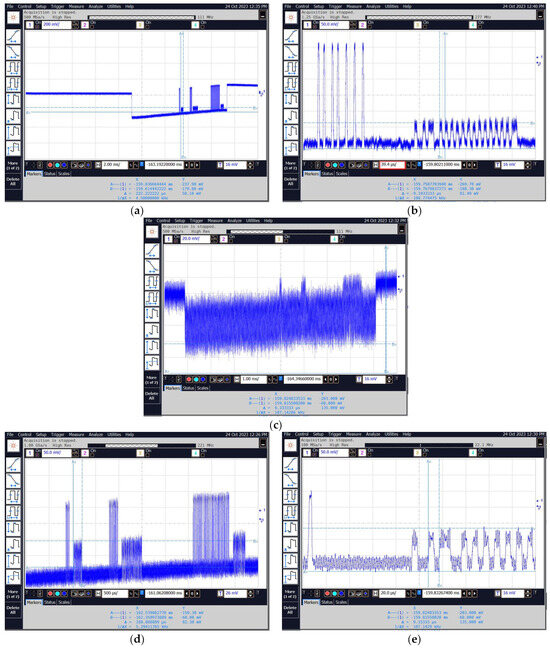
Figure 28.
Sample images of the obtained waveforms for frequencies equal to (a,b) 13.56 MHz; (c) 27.12 MHz; and (d,e) 40.68 MHz.
3.1.2. NS106 Reader–Programmer
An identical scope of tests was carried out in relation to the NS106 reader–programmer connected to a computer with a reduced level of electromagnetic emissions (TEMPEST). The relevant measurements were carried out in the layout presented in Figure 29.
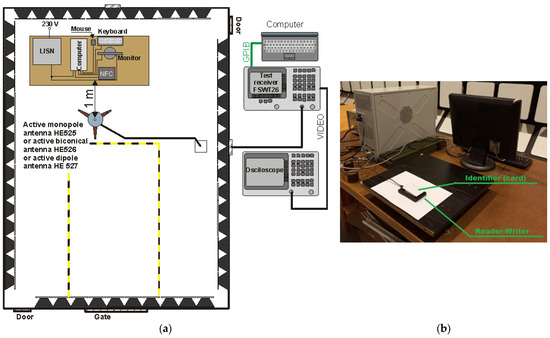
Figure 29.
Measuring system for testing revealing emissions from the tested NFC reader–programmer: (a) diagram of the measuring system, (b) photo of the measuring system.
The measurements for this case were carried out in the frequency range from 1 MHz to 1 GHz. They were aimed (as in the previous example) to detect possible frequencies at which it would be possible to receive a signal from the identifier. Potentially dangerous frequencies may be, for example, the basic frequency of the reader’s operation (13.56 MHz) and its harmonics. For the duration of the measurement, the monitor, keyboard and mouse were switched off to reduce electromagnetic disturbances in the measurement environment.
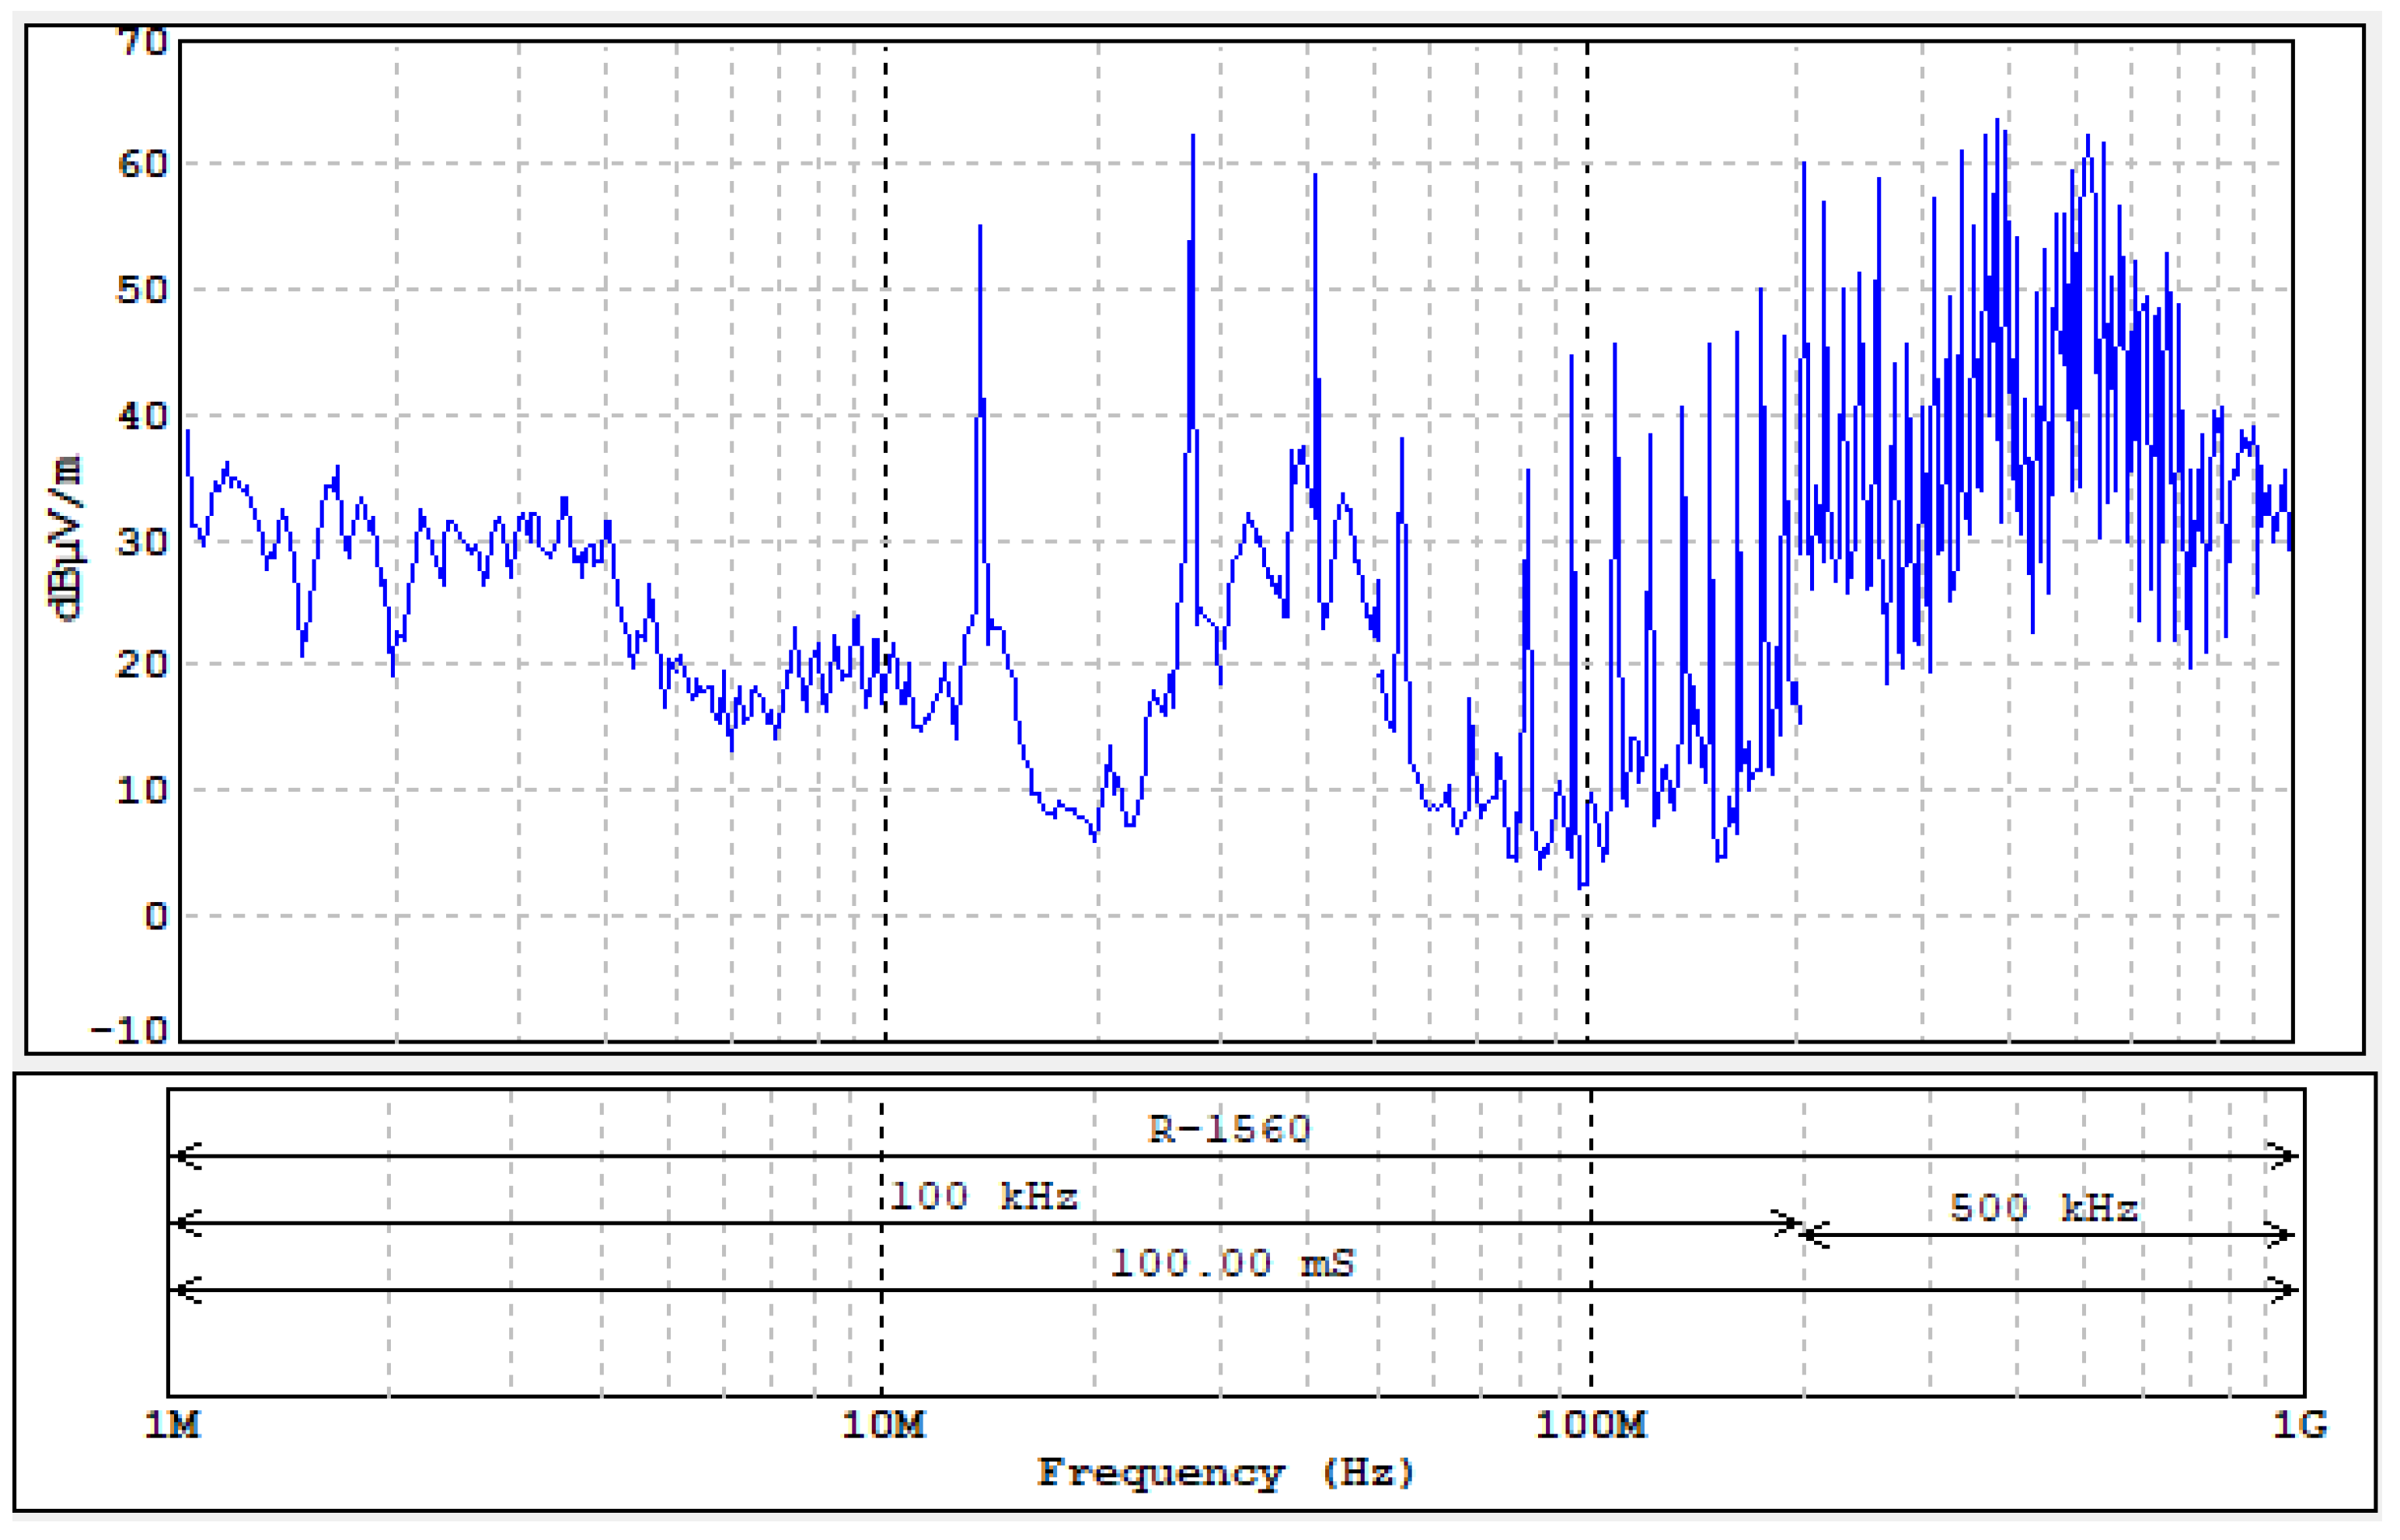
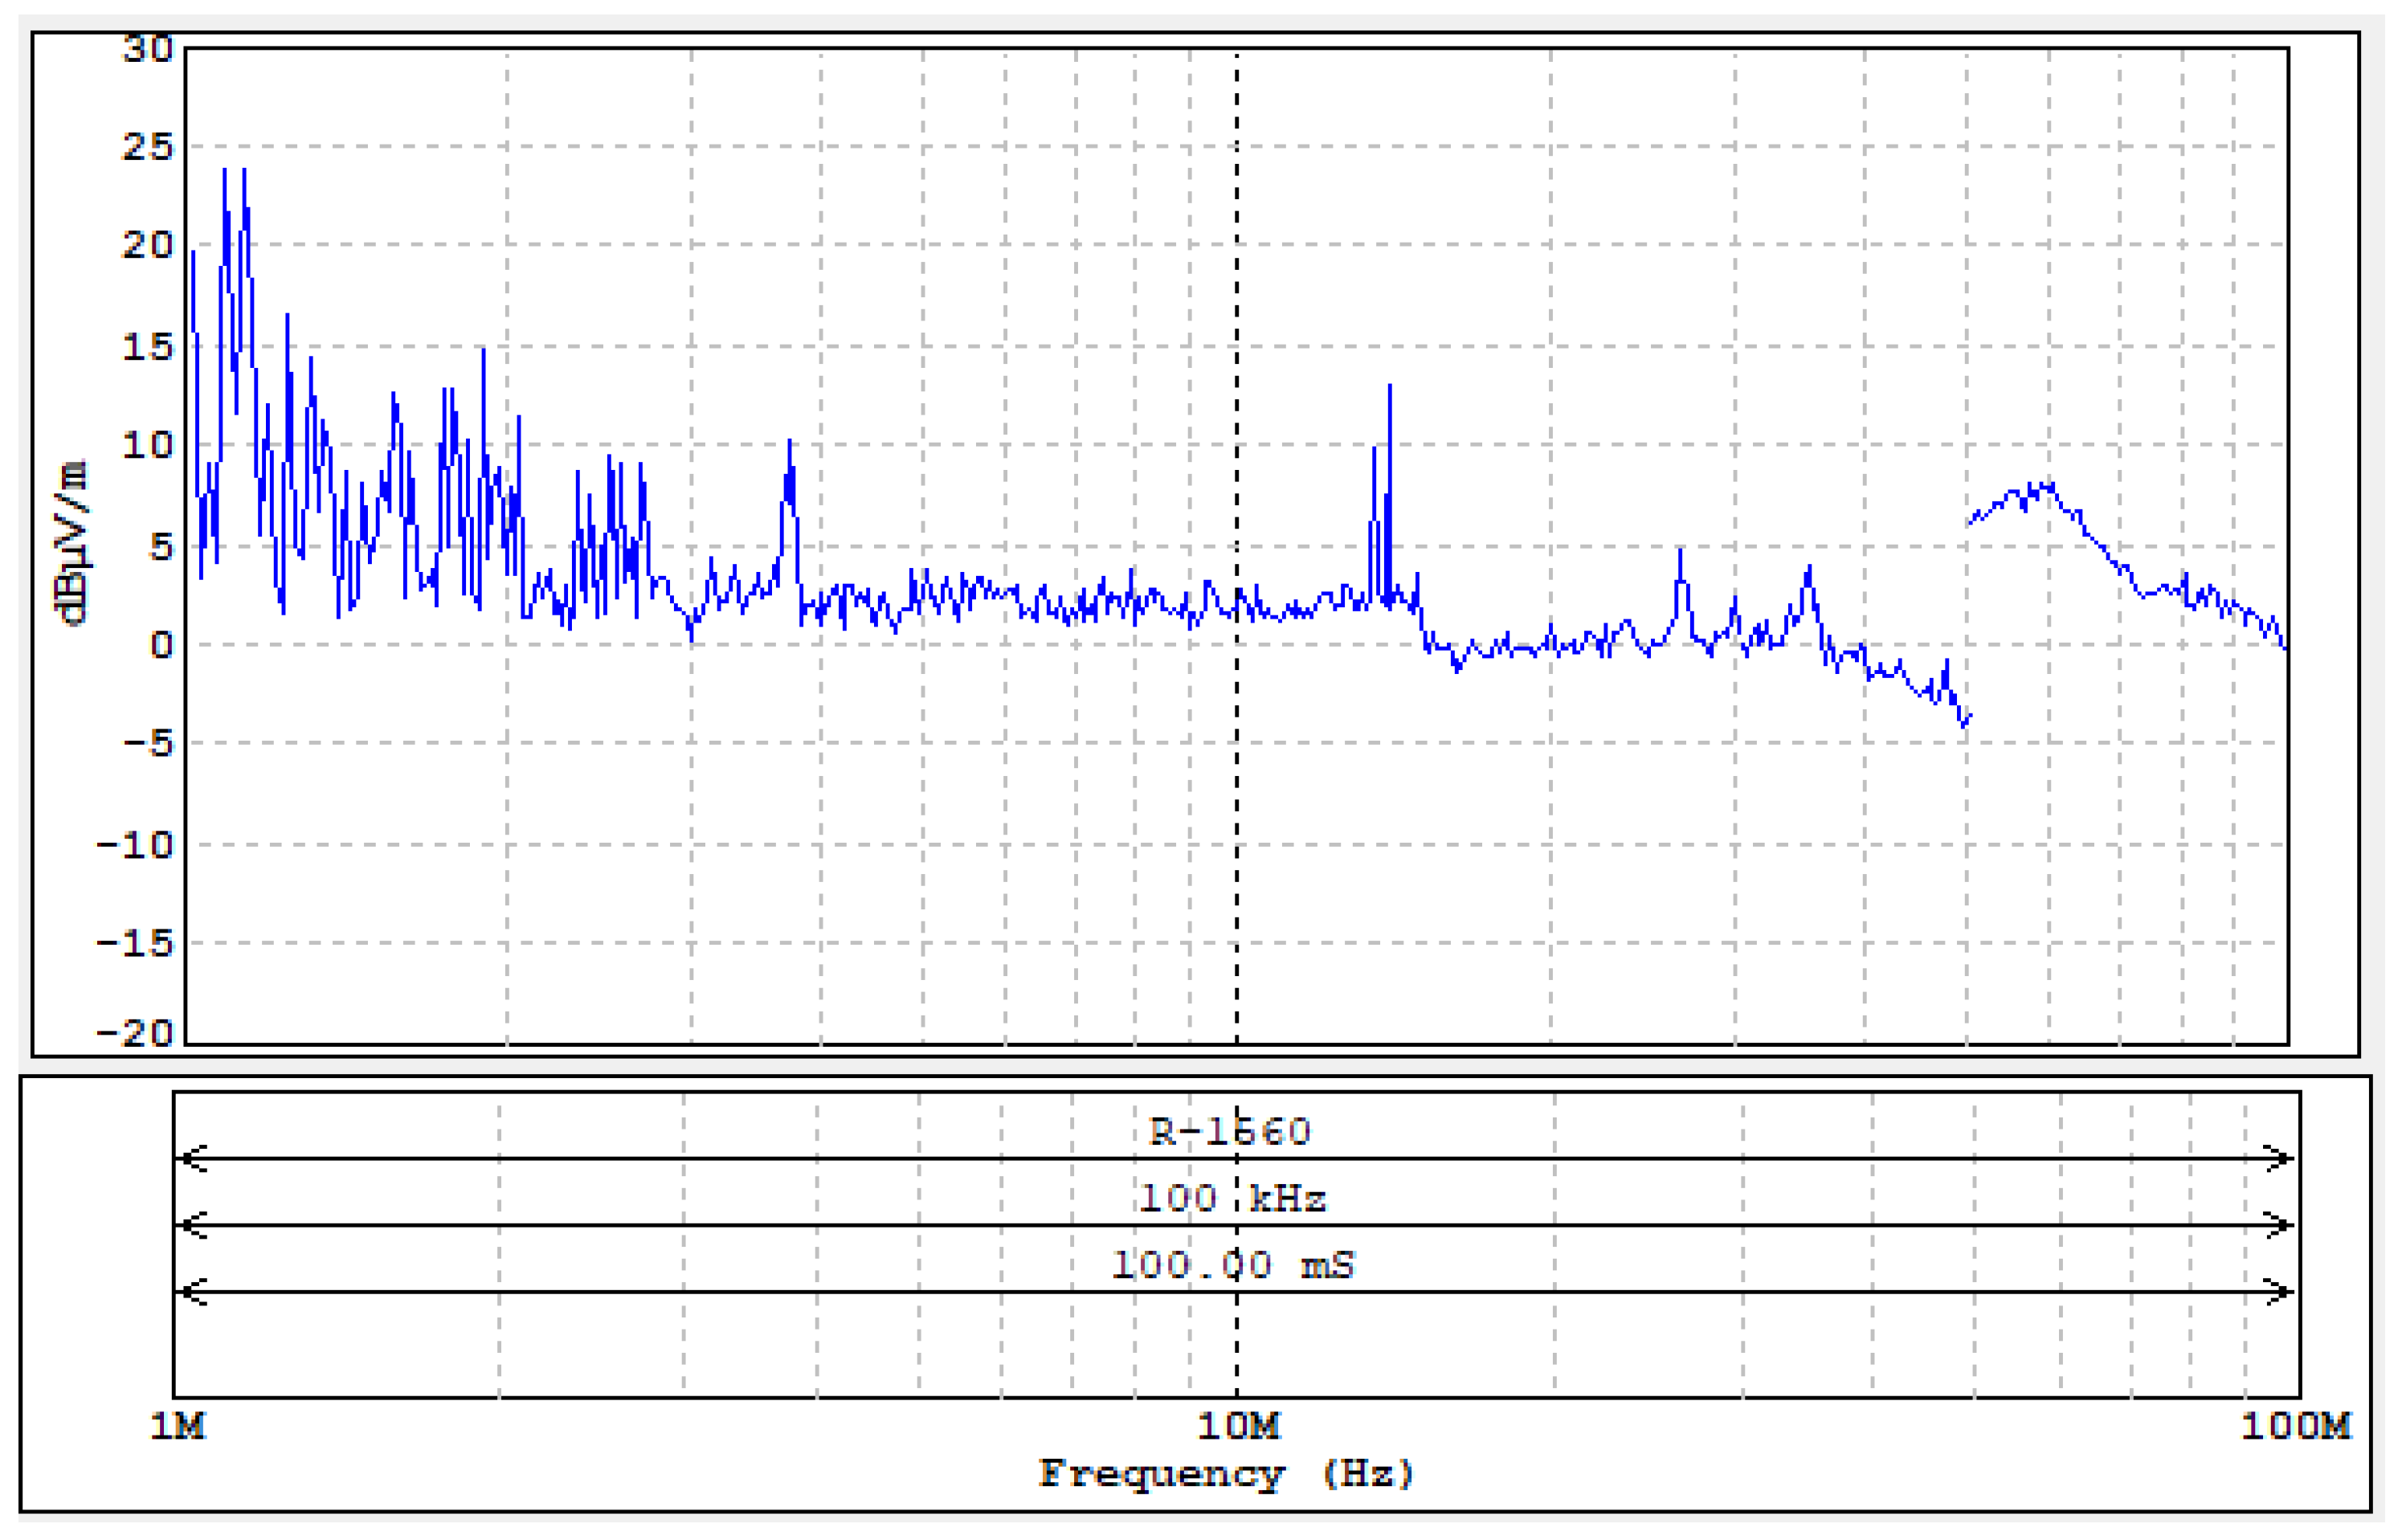
A graph showing the signal level at individual frequencies is presented in Figure 30.
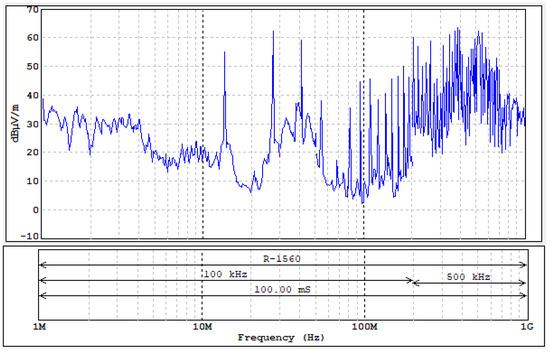
Figure 30.
Level of electromagnetic disturbances from the tested reader/programmer (harmonics observed up to 700 MHz).
In this case, a number of harmonic emissions (relative to 13.56 MHz) were observed, on which it was possible to receive data related to the transmission between the reader and the identifier.
Figure 31 shows several selected waveforms recorded with an oscilloscope connected to the “VIDEO” output of the measurement receiver after tuning to selected frequencies.
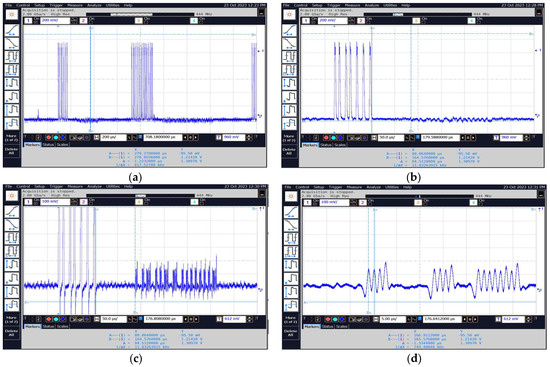
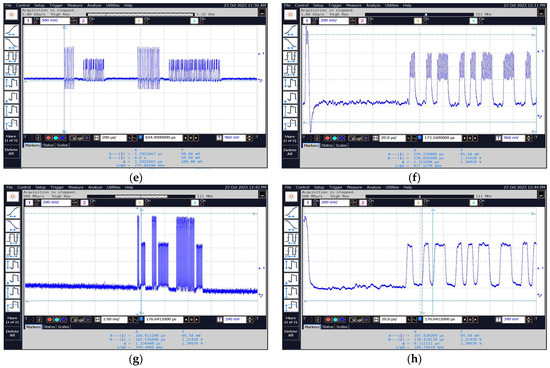
Figure 31.
Sample images of the obtained waveforms for frequencies (a,b) 13.56 MHz, (c,d) 27.12 MHz, (e,f) 189.94 MHz, and (g,h) 691.56 MHz.
3.1.3. Galaxy A34 as an HF-Band RFID Reader
The last of the analyzed cases was the use of a mobile phone equipped with an NFC module to read identifiers. A SAMSUNG phone marked as GALAXY A32 was used for the research. The measuring system in which the tests were carried out is shown in Figure 32.
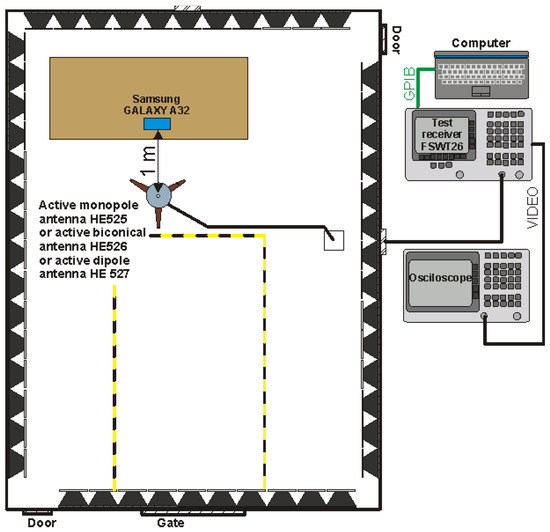
Figure 32.
Measuring system for testing the revealing emissions from the tested mobile phone.
The measurements for this case were carried out in the frequency range from 1 MHz to 100 MHz (the measurement range is limited due to the lack of visible disturbances of the revealing emission nature). They were aimed (as in the previous example) to detect possible frequencies at which it would be possible to receive a signal from the identifier. Potentially dangerous frequencies may be the basic frequency of the reader’s operation (13.56 MHz) and its harmonics.
A graph showing the signal level at individual frequencies is shown in Figure 33.
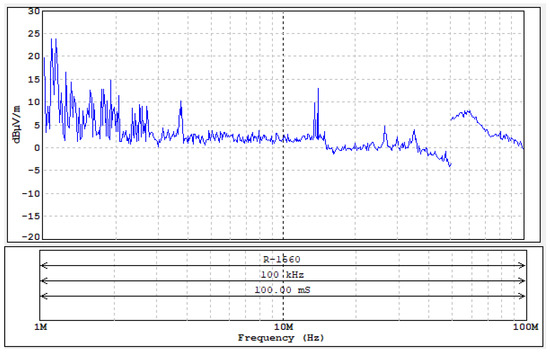
Figure 33.
Level of electromagnetic disturbances from the tested mobile phone.
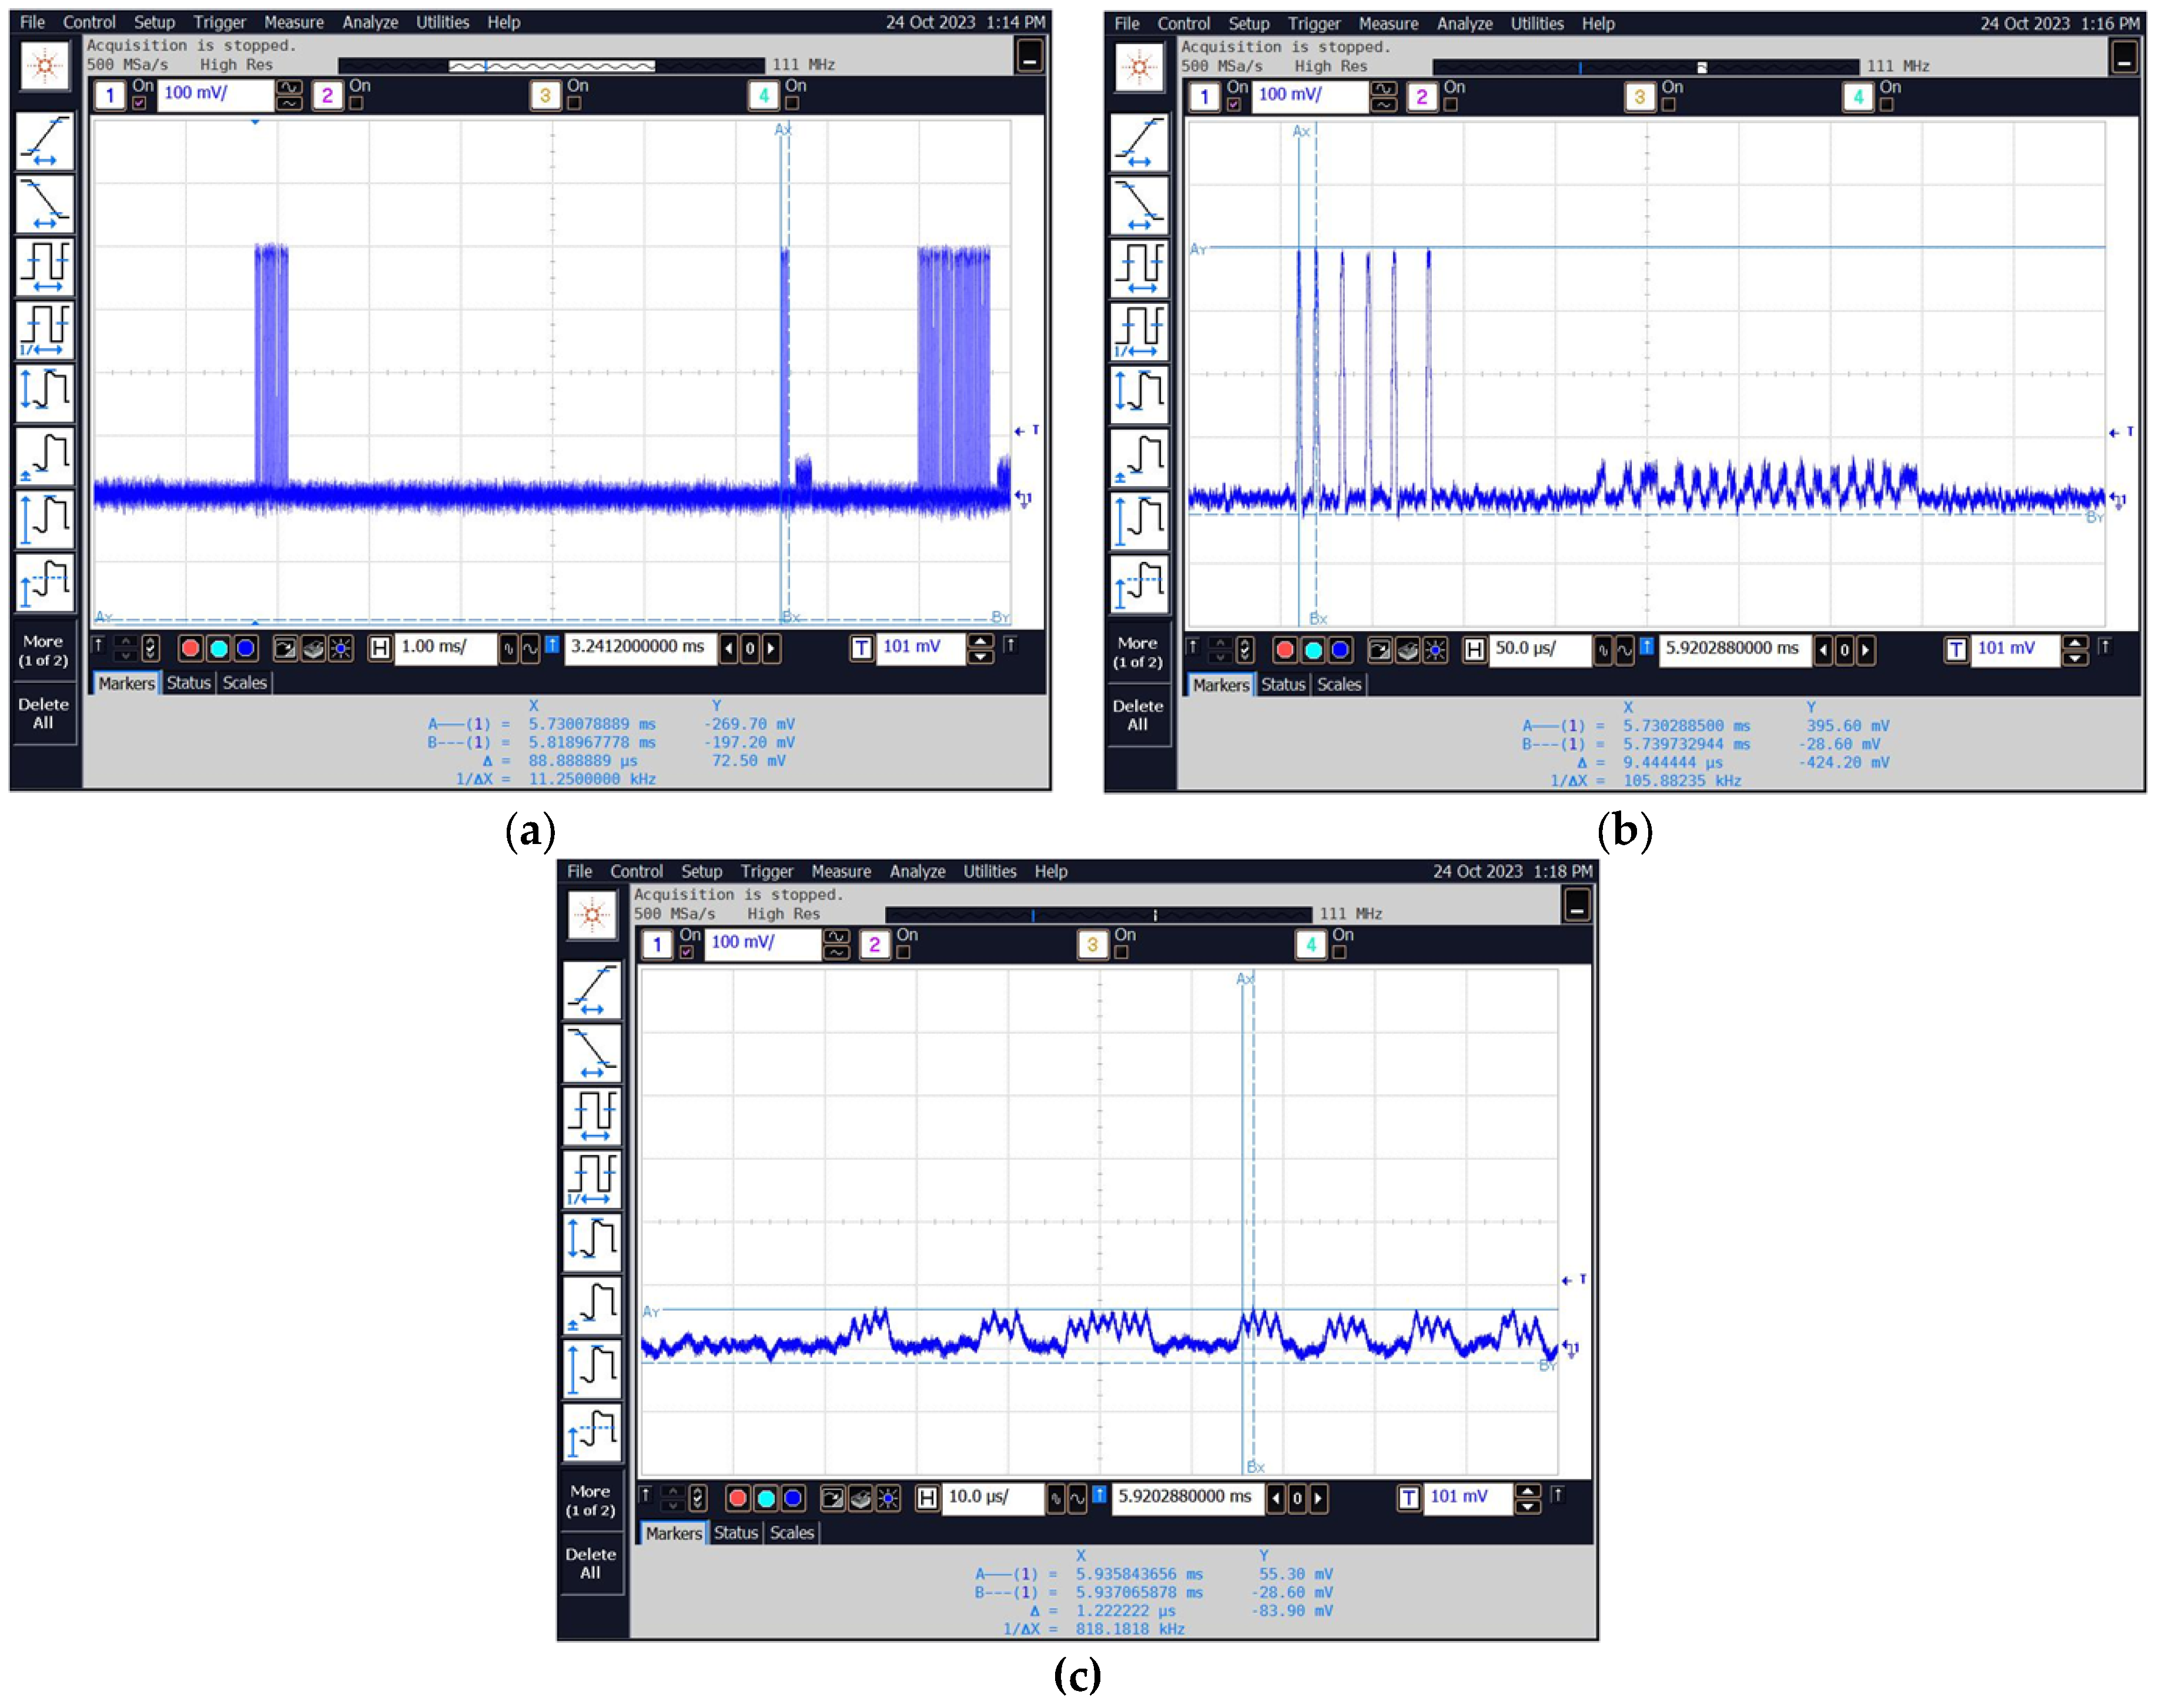
Figure 34 shows waveforms recorded with an oscilloscope connected to the “VIDEO” output of the measurement receiver after tuning to selected frequencies.

Figure 34.
Examples of obtained waveforms for a frequency of 13.56 MHz: (a–c).
As can be seen in the presented measurement results (Figure 30 and Figure 31 and Table 9) the least secure of the tested RFID HF systems is, in our opinion, the NFC card reader/programmer NS-106 because of the following reasons:
Table 9.
List of basic parameters visible at the oscillograms Figure 31.
- Very clear revealing emission signals were observed up to the frequency of 691.56 MHz (Figure 30);
- These signals were characterized by a high level of field strength of up to 60 dBμV/m (Figure 30);
- The level of waveforms observed on the oscilloscope corresponding to the data sent from the identifier is comparable to the level of the signal corresponding to the queries;
- The range of the occurrence of revealing emissions was estimated at about 10–20 m (depending on the frequency);
- The possibility of identifying the reader’s signal at about 50 m;
- It is, in our opinion, a great threat in relation to both the possibility of intercepting the transmission and tracking the card reader.
As can be seen in the presented measurement results (Figure 23, Figure 24 and Figure 25, Figure 27 and Figure 28 and Table 10) the second tested RFID HF system that is not fully secure is, in our opinion, the ACS-Access Control system, because of the following reasons:
Table 10.
List of basic parameters visible at the oscillograms Figure 28.
- For this system, it was possible to recreate information for the frequencies of 13.56 and 40.68 MHz.
- The estimated range of information penetration (i.e., the distance from which it is possible to read the data transmitted by the identifier) is about 2–3 m.
- On the other frequencies, only queries sent by the system reader were received, and their estimated range should not exceed 10 m.
- The most secure system tested was the NFC built into the Samsung Galaxy A32 see results (Figure 33 and Figure 34 and Table 11) because of the following:
Table 11. List of basic parameters visible at the oscillograms Figure 34.
- For this system, the measurements were carried out in the frequency range from 1 MHz to 100 MHz (the measurement range was limited due to the lack of visible disturbances of the revealing emission nature).
- Potentially dangerous frequencies may be the basic frequency of the reader’s operation (13.56 MHz) and its harmonic.
4. Conclusions
As a result of the analysis of the obtained measurement results and the experiments carried out, it can be concluded that the range of communication between the card and the reader declared by the manufacturers of LF-band RFID systems is correct and the other reception methods described in the article do not significantly affect it. The maximum distances from which it is possible to read the data do not exceed a dozen or so cm. Therefore, the communication between the card and the reader can be considered safe. Unauthorized persons cannot restore the data stored on the card and possibly copy such a card without direct access to it.
The weakest links in the entire access control system are the card readers. In this case, with the appropriate equipment, it is possible to restore the data stored on RFID cards. Identification of such data is possible from a distance not exceeding 2 m.
In the case of HF-band RFID (NFC) communication, it is possible to receive a signal from the identifier from a distance of approx. 30 cm using simple and inexpensive solutions. This can be a potential danger with regard to the possibility of copying or transferring data from the identifier. Information and Communication Technologies (ICT) security measures such as encryption of sent data were not taken into account.
As in the case of LF-band RFID solutions, for HF-band RFID the weakest link seems to be the systems used to read information. For example, in the case of an access control system, the estimated range of information penetration (i.e., the distance from which it is possible to read the data transmitted by the identifier) is about 2–3 m. For this system, it was possible to recreate information for the frequencies of 13.56 and 40.68 MHz. On the other frequencies, only queries sent by the system reader were received, and their estimated range should not exceed 10 m.
The worst variant turned out to be the use of an NFC card reader/programmer to read the identifier. In this case, very clear revealing emission signals were observed up to the frequency of 691.56 MHz. These signals were characterized by a high level of field strength of up to 60 dBμV/m. In addition, the level of waveforms observed on the oscilloscope corresponding to the data sent from the identifier is comparable to the level of the signal corresponding to the queries. On the basis of these data, the range of the occurrence of revealing emissions was estimated at about 10–20 m (depending on the frequency) and the possibility of identifying the reader’s signal at about 50 m, which is a great threat in relation to both the possibility of intercepting the transmission and tracking the card reader.
As already mentioned in the summary, this research is the continuation of previous research studies on the electromagnetic security of RFID systems using low frequencies for communication. The continuation of the current research will be focused, on one hand, on another type of radio communication in UHF RFID systems and, on the other hand, on the electromagnetic security of RFID systems in terms of the use of the method of data retransmission from the identifier or system over much longer distances. This phenomenon can be particularly dangerous in cases of contactless payments, keyless entry and starting vehicles, and are already being exploited by criminal groups.
Author Contributions
Conceptualization, S.M. and A.F.; methodology, S.M. and A.F.; validation, S.M., A.F. and I.K.; formal analysis, S.M. and I.K.; investigation, S.M. and A.F.; resources, I.K. and S.M.; data curation, S.M. and A.F.; writing—original draft preparation, S.M.; writing—review and editing, A.F.; visualization, S.M.; supervision, I.K.; project administration, S.M.; funding acquisition, I.K. All authors have read and agreed to the published version of the manuscript.
Funding
This research received no external funding.
Institutional Review Board Statement
Not applicable.
Informed Consent Statement
Not applicable.
Data Availability Statement
Data is contained within the article.
Conflicts of Interest
The authors declare no conflicts of interest.
References
- Musial, S.; Firlej, A.; Kubiak, I.; Dalecki, T. Electromagnetic Safety of Short-Range Radio Frequency Identification Systems. Electronics 2023, 12, 4391. [Google Scholar] [CrossRef]
- Yu, W.W.; Fang, C.Y. The Role of Near-Field Communication Mobile Payments in Sustainable Restaurant Operations: A Restaurateur’s Perspective. Sustainability 2023, 15, 12471. [Google Scholar] [CrossRef]
- JosephNg, P.S.; BrandonChan, P.S.; Phan, K.Y. Implementation of Smart NFC Door Access System for Hotel Room. Appl. Syst. Innow. 2023, 6, 67. [Google Scholar] [CrossRef]
- Rodrigues, H.; Jose, R.; Coelho, A.; Melro, A.; Ferreira, M.C.; Cunha, J.F.; Monteiro, M.P.; Ribeiro, C. MobiPag: Integrated Mobile Payment, Ticketing and Couponing Solution Based on NFC. Sensors 2014, 14, 13389–13415. [Google Scholar] [CrossRef]
- Bedriova, N.; Smetana, M.; Gombarska, D. Design and Development of Technical Solution for NFC-Based Self-Management Therapy in Actual Oncology Treatment. Appl. Sci. 2023, 13, 2397. [Google Scholar] [CrossRef]
- Liu, G.; Wang, Q.A.; Jiao, G.; Dang, P.; Nie, G.; Liu, Z.; Sun, J. Review of Wireless RFID Strain Sensing Technology in Structural Health Monitoring. Sensors 2023, 23, 6925. [Google Scholar] [CrossRef] [PubMed]
- Wang, Q.A.; Zhang, C.; Ma, Z.G.; Jiao, G.Y.; Jiang, X.W.; Ni, Y.Q.; Wang, Y.C.; Du, Y.T.; Qu, G.B.; Huang, J. Towards Long-Transmission-Distance and Semi-Active Wireless Strain Sensing Enabled by Dual-Interrogation-Mode RFID Technology; Wiley Online Library: Hoboken, NJ, USA, 2022. [Google Scholar] [CrossRef]
- Yang, M.H.; Luo, J.N.; Vijayalakshmi, M.; Shalinie, S.M. Contactless Credit Cards Payment Fraud Protection by Ambient Authentication. Sensors 2022, 22, 1989. [Google Scholar] [CrossRef] [PubMed]
- Chabbi, S.; Araar, C. RFID and NFC Authentication Protocol for Securing a Payment Transaction. In Proceedings of the 4th International Conference on Pattern Analysis and Intelligent Systems (PAIS) 2022, Oum El Bouaghi, Algeria, 12–13 October 2022. [Google Scholar] [CrossRef]
- Hong, K.; Cho, J.; Shin, G. Stretchable, Multi-Layered Stack Antenna for Smart/Wearable Electronic Applications. Materials 2022, 15, 3275. [Google Scholar] [CrossRef] [PubMed]
- Buchmeier, G.G.; Takacs, A.; Dragomirescu, D. Juvenal Alarcon Ramos and all, Optimized NFC Circuit and Coil Design for Wireless Power Transfer with 2D Free-Positioning and Low Load Sensibility. Sensors 2021, 21, 8074. [Google Scholar] [CrossRef] [PubMed]
- Rabén, H.; Borg, J.; Johansson, J. A discrete model of the DC charge-up phase in RFID rectifiers. In Proceedings of the 20th International Conference Mixed Design of Integrated Circuits and Systems—MIXDES 2013, Gdynia, Poland, 20–22 June 2013. [Google Scholar]
- Bhattacharyya, M.; Gruenwald, W.; Jansen, D.; Reindl, L.; Aghassi-Hagmann, J. An Ultra-Low-Power RFID/NFC Frontend IC Using 0.18 μm CMOS Technology for Passive Tag Applications. Sensors 2018, 18, 1452. [Google Scholar] [CrossRef] [PubMed]
- Cao, Z.; Chen, P.; Ma, Z.; Li, S.; Gao, X.; Wu, R.; Pan, L.; Shi, Y. Near-Field Communication Sensors. Sensors 2019, 19, 3947. [Google Scholar] [CrossRef] [PubMed]
- NTAG213/215/216—NFC Forum Type 2 Tag Compliant IC with 144/504/888 Bytes User Memory—Rev. 3.2—2 June 2015, NXP Semiconductors, N.V. 2015. Available online: https://www.nxp.com/docs/en/data-sheet/NTAG213_215_216.pdf (accessed on 23 February 2024).
- Chung, H.; Jeon, S.B.; Lee, D.W.; Park, H.J.; Kim, J.H.; Sohn, S.H. Clock and data recovery of an Extended Manchester Code for PAM-n. In Proceedings of the 2012 International Conference on ICT Convergence (ICTC) 2012, Jeju, Republic of Korea, 15–17 October 2012. [Google Scholar] [CrossRef]
- Xu, L.; Chen, X.; Tan, S.; Hu, Z.; Ying, B.; Ye, T.T.; Li, Y. Characterization and Modeling of Embroidered NFC Coil Antennas for Wearable Applications. IEEE Sens. J. 2020, 20, 1558–1748. [Google Scholar] [CrossRef]
- Wang, K.; Diet, A.; Chakra, S.A.; Conessa, C.; Grzeskowiak, M.; Bouaziz, T.; Protat, S.; Delcroix, D.; Rousseau, L.; Lissorgues, G.; et al. Detecting range and coupling coefficient tradeoff with a multiple loops reader antenna for small size RFID LF tags. In Proceedings of the 2012 IEEE International Conference on RFID-Technologies and Applications (RFID-TA), Nice, France, 5–7 November 2012. [Google Scholar] [CrossRef]
- Chen, Z.N.; Qing, X. Antennas for RFID applications. In Proceedings of the 2010 International Workshop on Antenna Technology (iWAT), Lisbon, Portugal, 1–3 March 2010. [Google Scholar] [CrossRef]
- Vestenický, M.; Vestenický, P. Mathematical Analysis of Parasitic Elements Influence in Resonant Circuit of RFID Antenna. In Proceedings of the 2019 29th International Conference Radioelektronika, Pardubice, Czech Republic, 16–18 April 2019. [Google Scholar] [CrossRef]
- Coaxial Low Noise Amplifier ZFL-500LN+. Available online: https://www.minicircuits.com/pdfs/ZFL-500LN+.pdf (accessed on 23 February 2024).
- Mareli, M.; Rimer, S.; Paul, B.; Ouahada, K.; Pitsillides, A. Experimental evaluation of NFC reliability between an RFID tag and a smartphone. In Proceedings of the 2013 Africon, Pointe aux Piments, Mauritius, 9–12 September 2013. [Google Scholar] [CrossRef]
- Zradziński, P. Modelling and Evaluating Electromagnetic Field Exposure in the Multiple-Source Scenario of Using IoT HF RFID Readers. Int. J. Environ. Res. Public Health 2022, 19, 3274. [Google Scholar] [CrossRef]
- Mattei, E.; Lucano, E.; Censi, F.; Triventi, M.; Calcagnini, G. Provocative Testing for the Assessment of the Electromagnetic Interference of RFID and NFC Readers on Implantable Pacemaker. IEEE Trans. Electromagn. Compat. 2016, 58, 314–322. [Google Scholar] [CrossRef]
- Auinger, B.; Deutschmann, B.; Winkler, G. Elimination of electromagnetic interference in communication channels by using spread spectrum techniques. In Proceedings of the 2017 International Symposium on Electromagnetic Compatibility—EMC Europe 2017, Angers, France, 4–7 September 2017. [Google Scholar] [CrossRef]
- Tabet, N.E.; Ayu, M.A. Analysing the Security of NFC Based Payment Systems. In Proceedings of the International Conference on Informatics and Computing (ICIC), Mataram, Indonesia, 28–29 October 2016. [Google Scholar] [CrossRef]


Disclaimer/Publisher’s Note: The statements, opinions and data contained in all publications are solely those of the individual author(s) and contributor(s) and not of MDPI and/or the editor(s). MDPI and/or the editor(s) disclaim responsibility for any injury to people or property resulting from any ideas, methods, instructions or products referred to in the content. |
© 2024 by the authors. Licensee MDPI, Basel, Switzerland. This article is an open access article distributed under the terms and conditions of the Creative Commons Attribution (CC BY) license (https://creativecommons.org/licenses/by/4.0/).