Article

Influence of Apparatus Scale on Geogrid Monotonic and Cyclic/Post-Cyclic Pullout Behavior in Cohesive Soils

by
Sergio Rincón Barajas
1,
Gabriel Orquizas Mattielo Pedroso
2,*,
Fernanda Bessa Ferreira
3,* and
Jefferson Lins da Silva
1
1
São Carlos School of Engineering, University of São Paulo (USP), São Carlos 13563-120, Brazil
2
Faculty of Engineering and Sciences of Guaratinguetá, São Paulo State University (UNESP), Guaratinguetá 12516-410, Brazil
3
CONSTRUCT, Faculty of Engineering, University of Porto, R. Dr. Roberto Frias, 4200-465 Porto, Portugal
*
Authors to whom correspondence should be addressed.
Appl. Sci. 2024, 14(13), 5861; https://doi.org/10.3390/app14135861
Submission received: 29 April 2024 / Revised: 25 June 2024 / Accepted: 2 July 2024 / Published: 4 July 2024
(This article belongs to the Special Issue Sustainability in Geotechnics)

Abstract

:
Geosynthetics have increasingly been applied to geotechnical engineering works due to their numerous advantages, including cost-effectiveness and their significant role in sustainable development. When geosynthetics are used as reinforcement in earth structures, such as embankments, retaining walls and bridge abutments, soil–geosynthetic interface shear behavior is a critical parameter involved in the design. This paper presents a series of monotonic and cyclic/post-cyclic pullout tests carried out to examine the apparatus scale effect on the pullout response of a geogrid embedded in two different soils. To assess the small-scale equipment feasibility, comparisons were made between pullout test parameters derived from small- and large-scale equipment. The test results indicate that, under a low confining stress of 25 kPa, using a smaller-sized apparatus results in lower values of geogrid pullout resistance and maximum mobilized shear stress, but higher values of confined tensile stiffness at low strains. On the other hand, as the confining stress increases (i.e., 50 kPa and 100 kPa), the difference between the results becomes less significant and similar trends are observed regardless of the equipment type. Adopting small-scale equipment enables obtaining soil–reinforcement interaction parameters using test procedures that are less time-consuming than those associated with large-scale pullout tests. However, proper scale effect correction factors may be considered for more consistent estimates of the interface strength parameters under low normal stress values.

1. Introduction

Geosynthetics have been widely used as a reinforcement material in geotechnical structures, such as roadways, railways, steep slopes, embankments and retaining walls, with the function of improving the mechanical behavior of the surrounding soils or aggregates [1,2,3]. Several benefits, including the reliability, cost-effectiveness and contribution towards sustainability have led to the increasing use of geosynthetics in civil infrastructure projects worldwide. In particular, the role of geosynthetics in sustainable infrastructure development and circular economy has been well recognized and highlighted in recent years. For instance, these materials facilitate energy and resource savings by accelerating the construction process, minimizing on-site excavation, reducing the need to transport bulky materials, extending infrastructure longevity and decreasing maintenance requirements. They can replace or reduce the use of other construction materials, such as sand and aggregates, thus attenuating the adverse environmental impacts from natural resource extraction. In addition, they often enable the use of locally available low-quality soils (such as cohesive soils) or recycled aggregates (e.g., construction and demolition waste) as alternative fill materials, in which case they significantly contribute towards reducing the amount of waste directed to landfills [4].
The geosynthetic reinforcement mechanism is mainly dependent upon the interaction developed at the soil–geosynthetic interfaces. The interaction between the soil and reinforcement redistributes stresses within the soil mass, increasing the stability of the reinforced structure, and decreasing horizontal deformations.
These redistributions of stress within the reinforced soil depend on the soil properties, the reinforcement characteristics, and the interaction between components. It is essential to identify the interaction mechanism and the most suitable test for its characterization [5]. Various experimental techniques have been developed to enhance the comprehension of the interaction between soils and geosynthetics. Among these methods are the direct shear test, pullout test, in-soil tensile test and ramp test. From these, the direct shear and pullout tests stand out as the most frequently used. The direct shear test assesses the interaction at the interface when the soil mass slides on the surface of the reinforcement. In contrast, the pullout test is applicable when the reinforcement is pulled out from the soil mass [6].
In the past several decades, different researchers have analyzed the interface mechanism between the geosynthetic and surrounding soil. Direct shear interface tests have been investigated by the authors of [5,7,8]. The pullout response has been studied experimentally by considering various influential factors such as box and specimen size, sleeve length, active length, test speed, soil characteristics and geosynthetic properties [9,10,11,12,13,14,15,16,17,18,19], as well as using analytical and numerical methods [20,21,22,23]. Apart from high-quality (i.e., granular) soils, the pullout behavior of geosynthetics in alternative backfill materials, such as cohesive and residual soils or recycled aggregates, has also been the subject of significant research [23,24,25,26].
In some structures, the geosynthetic reinforced soil is exposed to repeated or cyclic loads, which may be induced by compaction, road or railway traffic, wave loading and earthquakes. The understanding of the cyclic behavior of such reinforced soil structures is crucial for the design and performance. Reports of soil–geosynthetic interaction under cyclic loading conditions are available in [27,28,29,30,31,32,33,34,35].
The pullout resistance of geosynthetic reinforcements in granular soils can be evaluated by a theoretical relationship proposed by [36] and represented by Equation (1), where (PR) is the geosynthetic pullout resistance per unit width, (LR) is the geosynthetic length in the anchorage zone, (σn) is the effective normal stress at the reinforcement level, (fb) is the soil–reinforcement pullout interaction coefficient and (ϕ) is the soil friction angle.
P R = 2 L R σ n f b tan ϕ
In the absence of information concerning the soil friction angle to be considered in Equation (1), the pullout resistance of geosynthetics can be expressed in terms of the pullout interface’s apparent coefficient of friction, μS/GSY (Equation (2)) [14]:
P R = 2 L R σ n μ S / G S Y
To account for the non-linearity of the pullout force along the length of extensible reinforcements, a scale effect correction factor (α) was introduced by Berg et al. [2] (Equation (3)):
P R = 2 L R σ n F * α
where F* is the pullout resistance factor.
In fact, the interface shear strength is not uniformly mobilized over the length of extensible geosynthetic reinforcements. The scale effect correction factor (α) accounts for the non-linear stress decrease throughout the reinforcement length and the development of progressive failure and depends mainly on the strain-softening of the soil and the reinforcement extensibility and length [2]. In the experimental data, which are lacking, the recommended values are 1.0 for metallic reinforcements, 0.8 for geogrids and 0.6 for geotextiles.
The pullout resistance factor (F*) may be determined through laboratory or field pullout tests using the backfill material intended for the project. However, if such data are unavailable, a conservative estimate of F* for geosynthetic materials can be obtained considering F* = 2/3 tan ϕ [2].
Pullout tests have been extensively used to assess the interface mechanism and analyze the reinforced soil structure parameters. However, several factors can influence the results of pullout tests. The experimental and numerical data on the apparatus scale effect suggest that the apparatus size is susceptible to influencing the results of pullout tests [9,10,11]. Palmeira and Milligan [9] and Palmeira [6] verified that pullout test results are influenced by boundary conditions and friction coefficients between soil and geogrid can be overestimated in small-scale tests. This effect can be minimized by the lubrication of the internal face of the box frontal wall. Lopes and Ladeira [11] observed that pullout apparatus with lower height resulted in stiffer interface response and higher maximum pullout load. Moreover, they noted a minimal impact of box height for heights exceeding the geosynthetic length. The authors recommended that the soil sample height should exceed 0.6 m.
A small pullout box was developed by Teixeira et al. [15] to evaluate the strength of individual geogrid ribs (i.e., longitudinal and transverse ribs). Moreover, the same equipment was used to evaluate the unsaturated soil conditions by Portelinha et al. [37] and Marques and Lins da Silva [38]. Kakuda [39] compared the results from monotonic tests using small- and large-scale equipment and concluded that the shear stress and interaction coefficient values were practically concomitant. Kakuda [39] and Sugimoto et al. [13] evaluated the effect of the size of the geogrid and the internal width of the equipment and concluded that as the specimen width approaches the internal dimensions of the box, the pullout force tends to a constant value. Therefore, for the analyzed geogrids, the authors recommended using twelve longitudinal elements.
The test method described in the ASTM D6706 [40] standard considers using large-scale equipment and is intended to be a performance test simulating design or as-built conditions [40]. Large-scale tests are considered to yield more reliable results compared to small-scale tests, because they better replicate the physical structure of a reinforced soil mass, while allowing for a better distribution of stresses and strains on the geosynthetic, potentially due to a scale effect [6]. On the other hand, the reduced dimensions of small-scale test boxes may interfere with the soil–reinforcement interaction, thus potentially casting doubt on the reliability of the results. However, as reported by Kakuda [39], adopting measures to minimize boundary effects of the small-scale equipment has led to obtaining pullout shear resistance and interface coefficients close to those from monotonic large-scale pullout tests when fine soils are used. Nevertheless, limited studies have previously compared the pullout behavior of geosynthetics derived from small- and large-scale equipment and further research is still required for a better understanding of the apparatus scale effect under different experimental conditions. In such earlier studies, geosynthetic specimens with distinct length/width ratios have generally been used, which may have jeopardized the comparison of results. Additionally, to the best of the authors’ knowledge, no previous study has evaluated the influence of apparatus scale on the geogrid pullout behavior under both monotonic and cyclic/post-cyclic loading conditions.
Considering that the conventional pullout tests using large-scale devices have several inconveniences, such as the high cost, long execution time and complexity of the assembly, it is important to assess the feasibility of using small-scale equipment for geosynthetic pullout testing. Given this, a series of pullout tests have been carried out to evaluate the influence of apparatus scale on the pullout response of a geogrid subjected to different confining stresses and varying loading conditions (i.e., monotonic, cyclic and post-cyclic). The use of small-scale equipment to estimate soil–geosynthetic interface strength parameters would represent significant benefits, including the easier and faster test assembly, as well as the possibility of obtaining a larger amount of data using less resources.

2. Materials and Methods
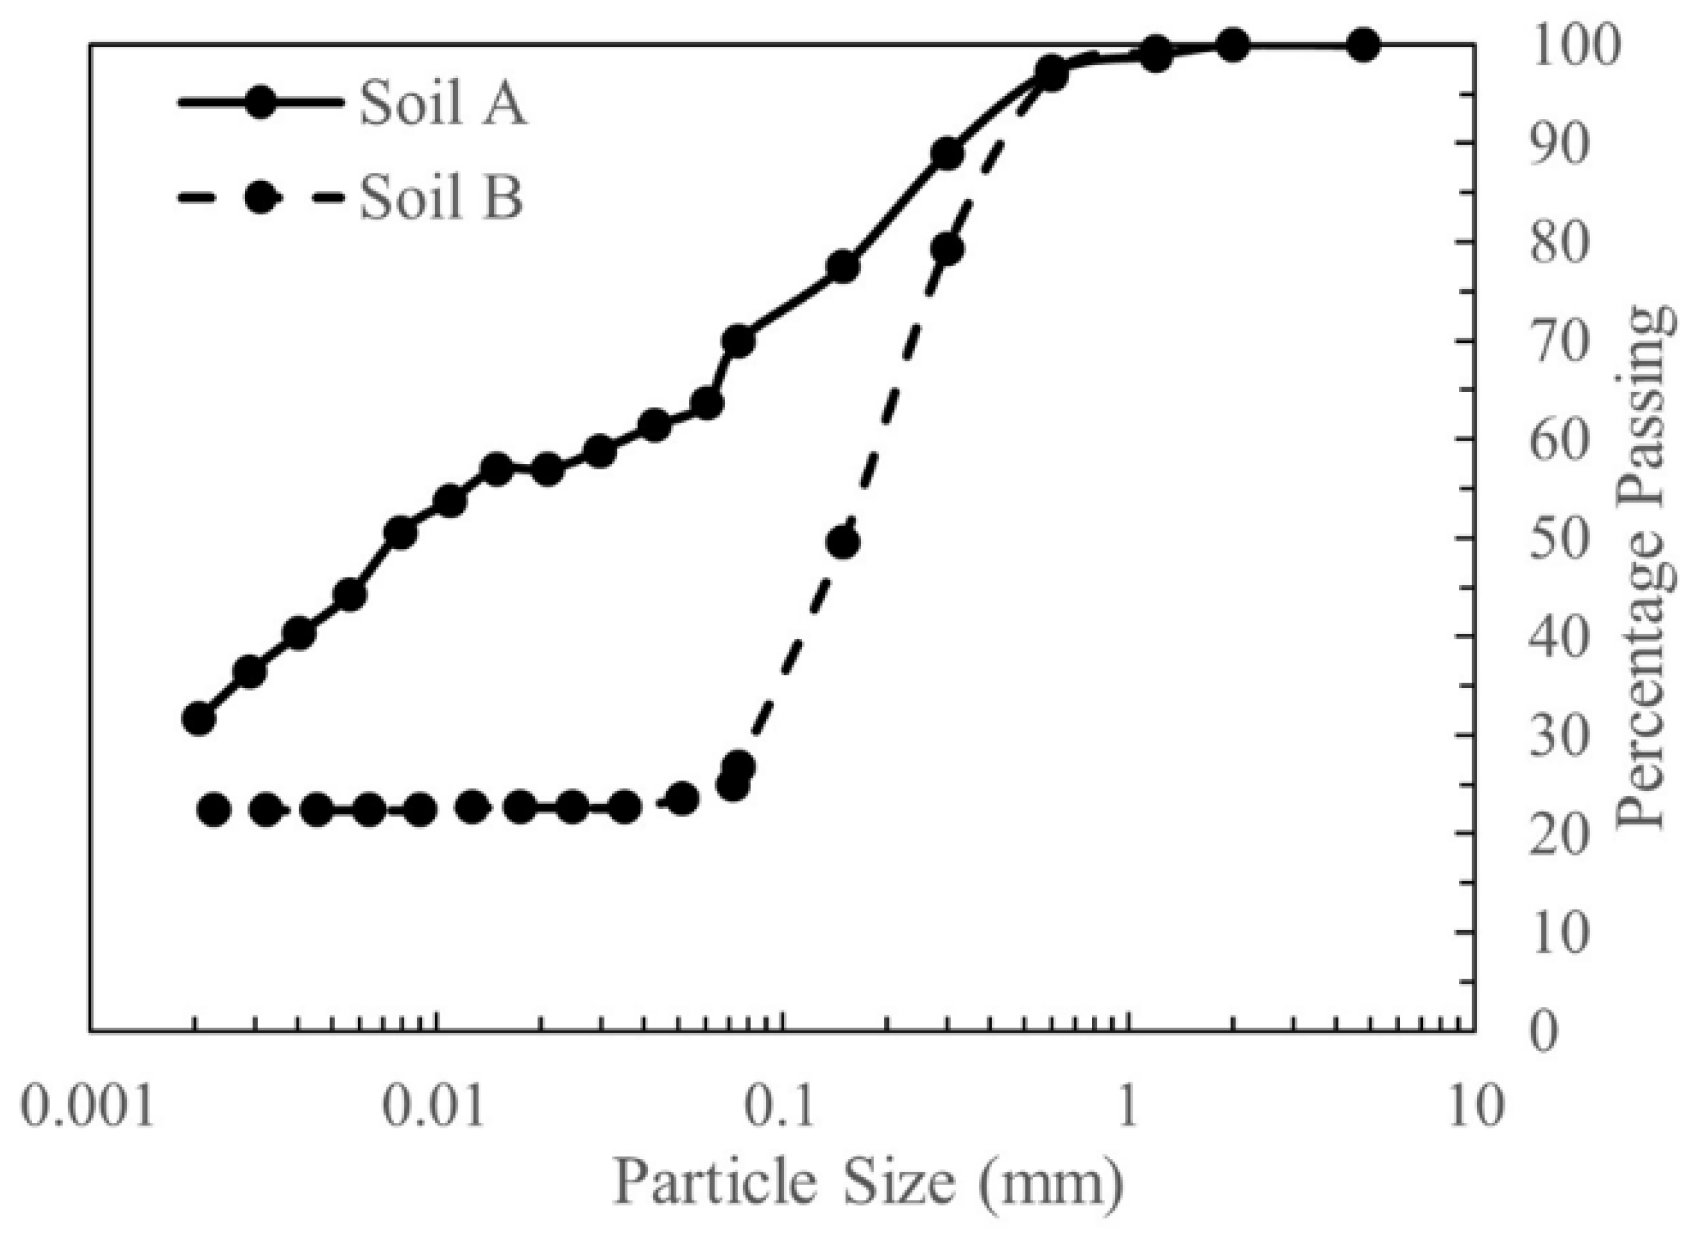
2.1. Test Materials

Two soils (A and B) were used in the current pullout testing program. Both materials were collected close to São Carlos (São Paulo, Brazil). Soil A consists of tropical soil, classified as high-plasticity silt (MH), as per the Unified Soil Classification System (USCS). This material was used in the first three layers of compacted material inside each pullout box. The other soil (soil B) consists of a clayey sand (SC) and was used above the geogrid in the top layers. The particle size distribution of these soils is presented in Figure 1. It is noteworthy that soil A includes about 65% fines, with D50 = 0.007 mm and D85 = 0.25 mm. On the other hand, soil B has less fines (20%), with D50 = 0.15 mm and D85 = 0.4 mm.
The shear strength parameters of soils A and B were determined using triaxial load tests conducted at identical relative compaction and moisture conditions as the specimens used for the pullout tests. Consolidated drained (CD) triaxial tests were performed to characterize soil B, whereas consolidated undrained (CU) triaxial tests were conducted on soil A. These tests followed the recommendations of the ASTM D4767 and ASTM D7181 standards [41,42]. Table 1 summarizes the main physical properties of these soils.
The choice of different materials was made taking into account the distribution of induced interfacial shear stresses in the soil mass around the geosynthetic, and the study presented by Abdi et al. [43] and Abdi et al. [44], which reported that the inclusion of high-quality sand around the reinforcement can effectively improve the strength and deformative response of reinforced clay. With this in mind, while the bottom layer (soil A) has low mobilization of interface shearing resistance, the upper layer (soil B) provides a layer of frictional material above the geosynthetic reinforcement, potentially contributing to enhanced interface shear strength.
The reinforcement tested was an extruded flexible biaxial polypropylene (PP) geogrid (GGR) coated with polyvinyl chloride (PVC). Table 2 summarizes the main properties of the geogrid. The aperture size of this particular geogrid takes into account the size of the small pullout box.

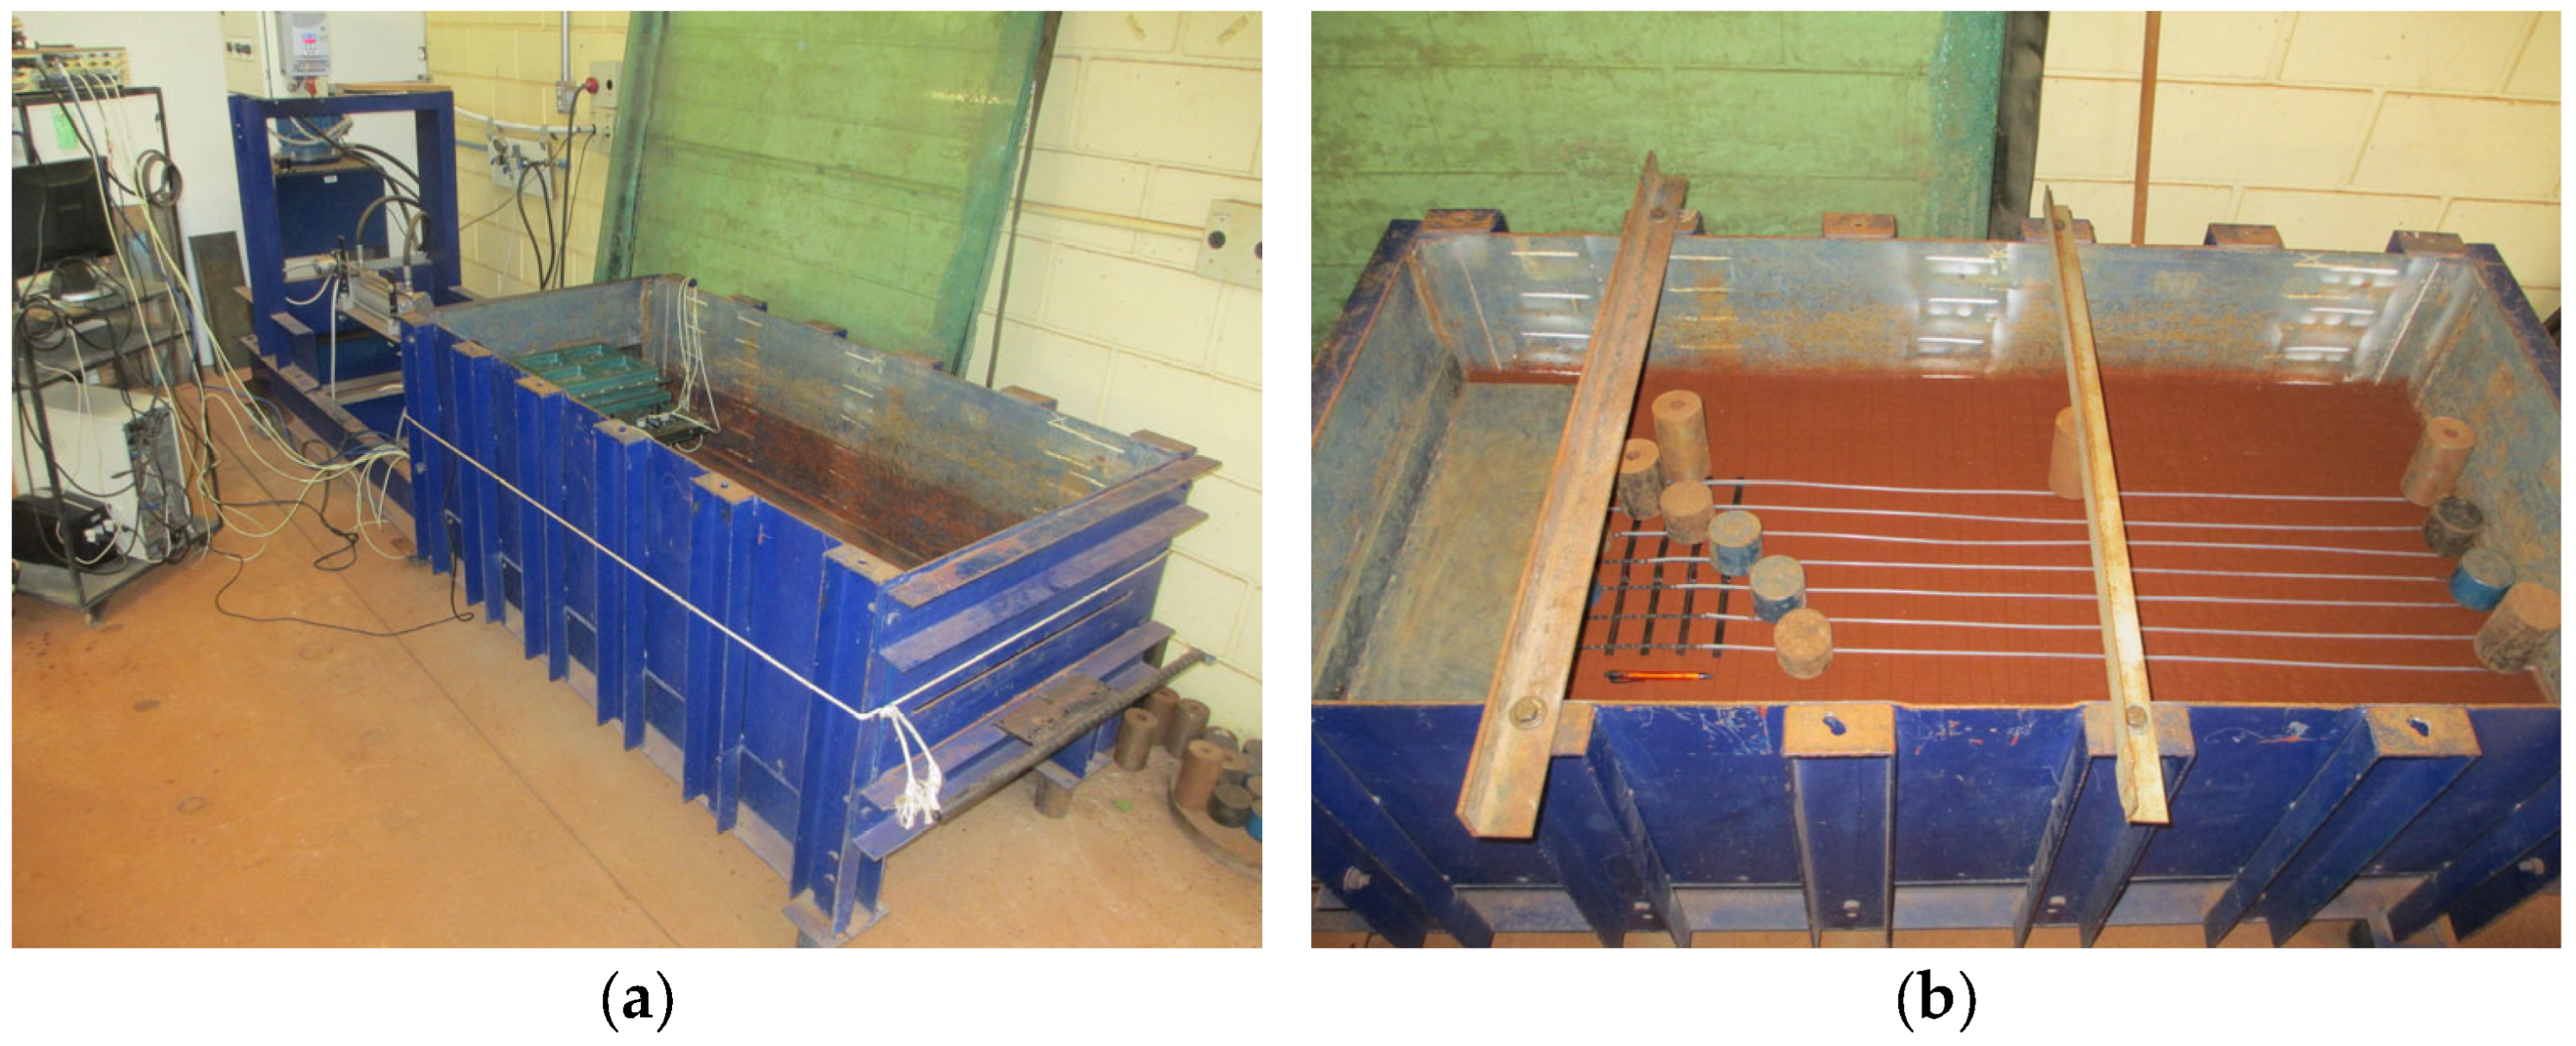
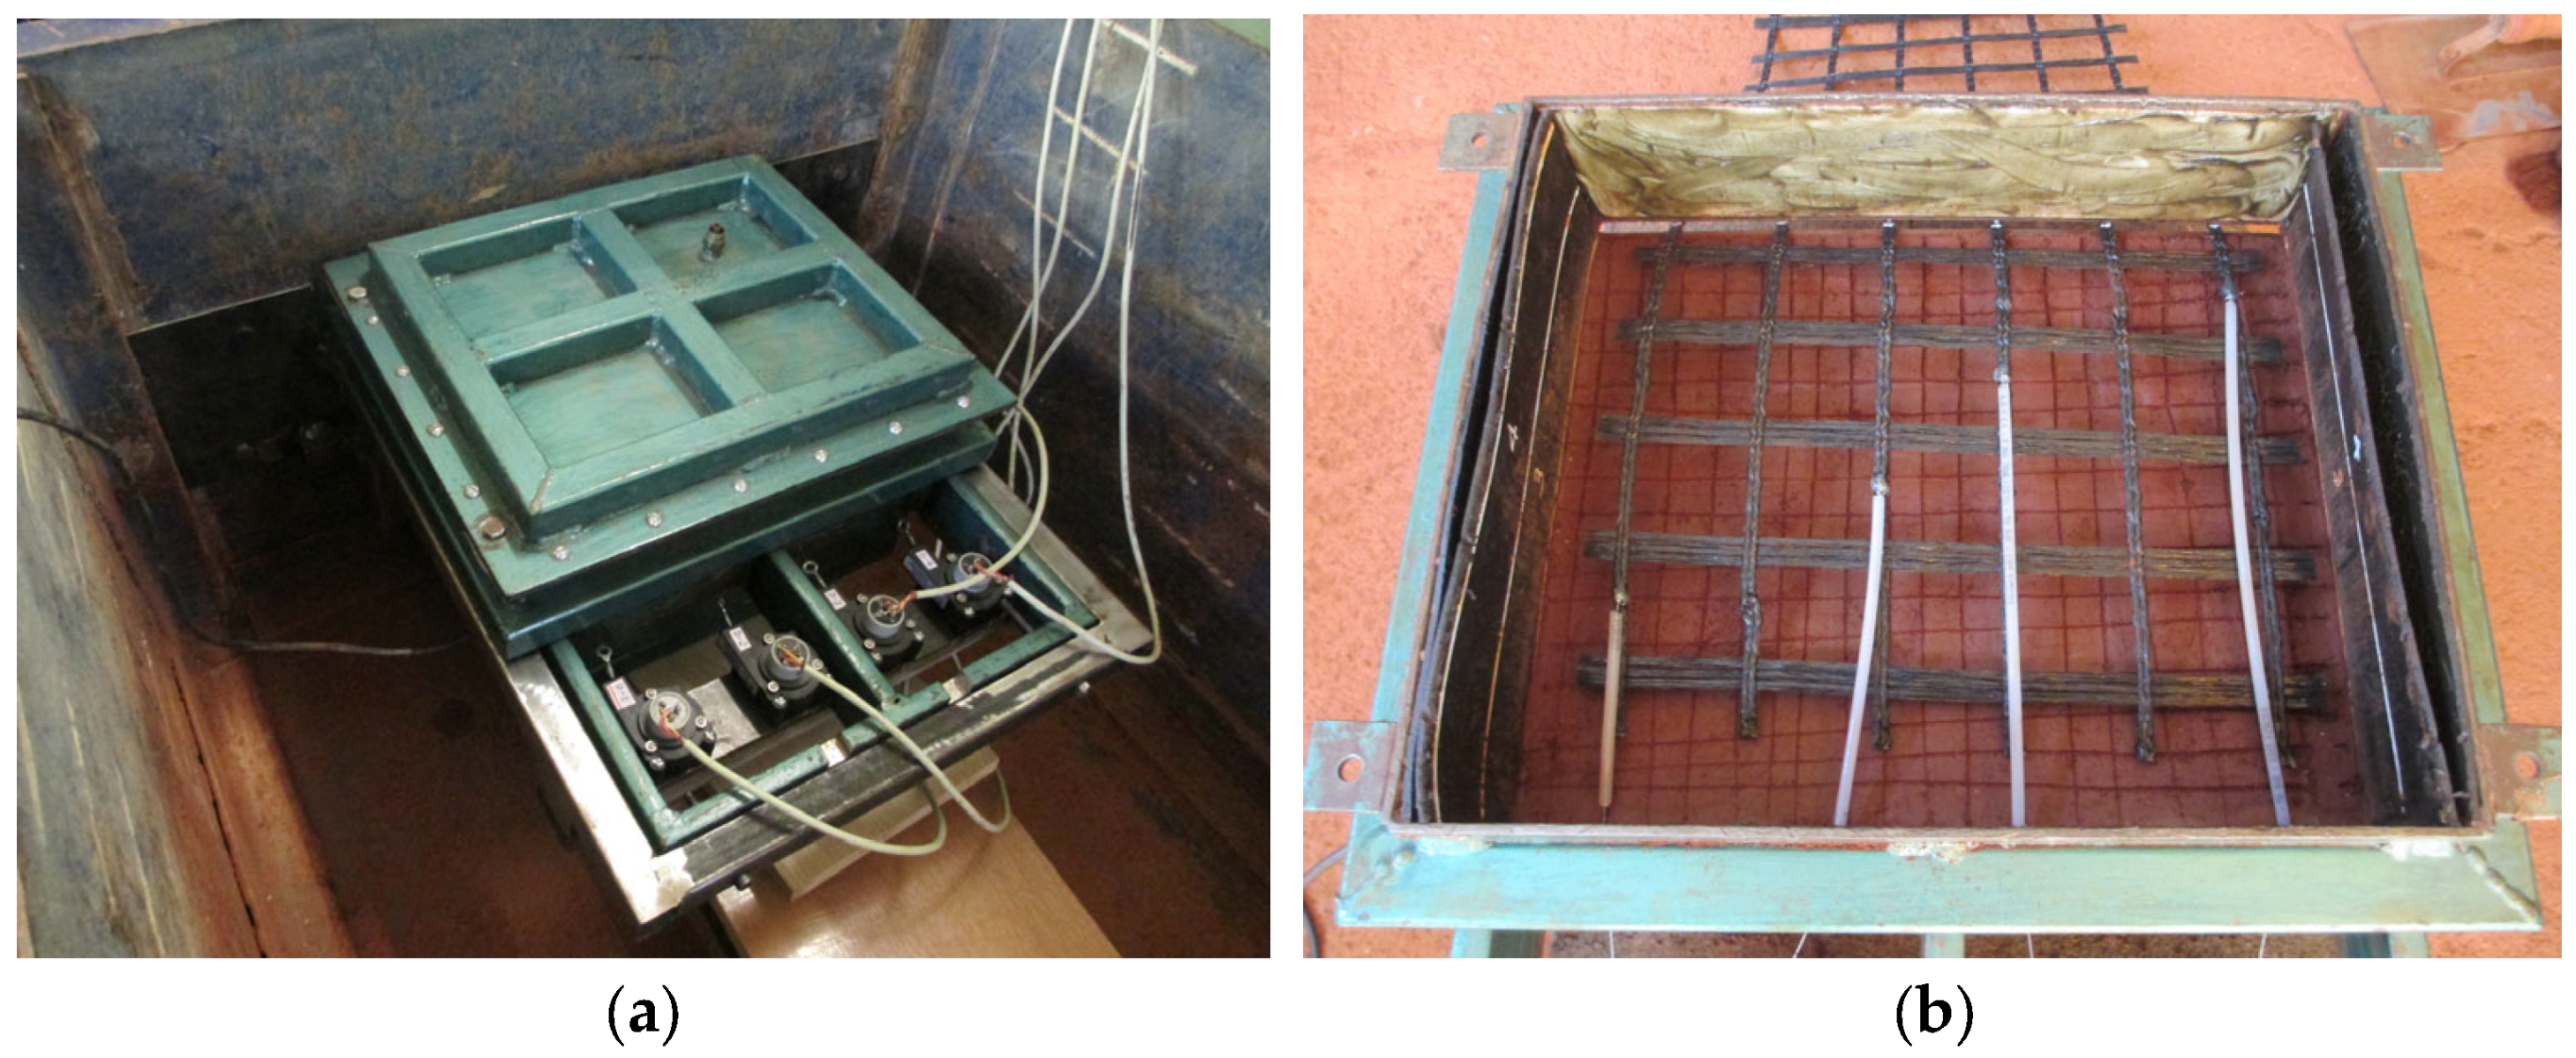
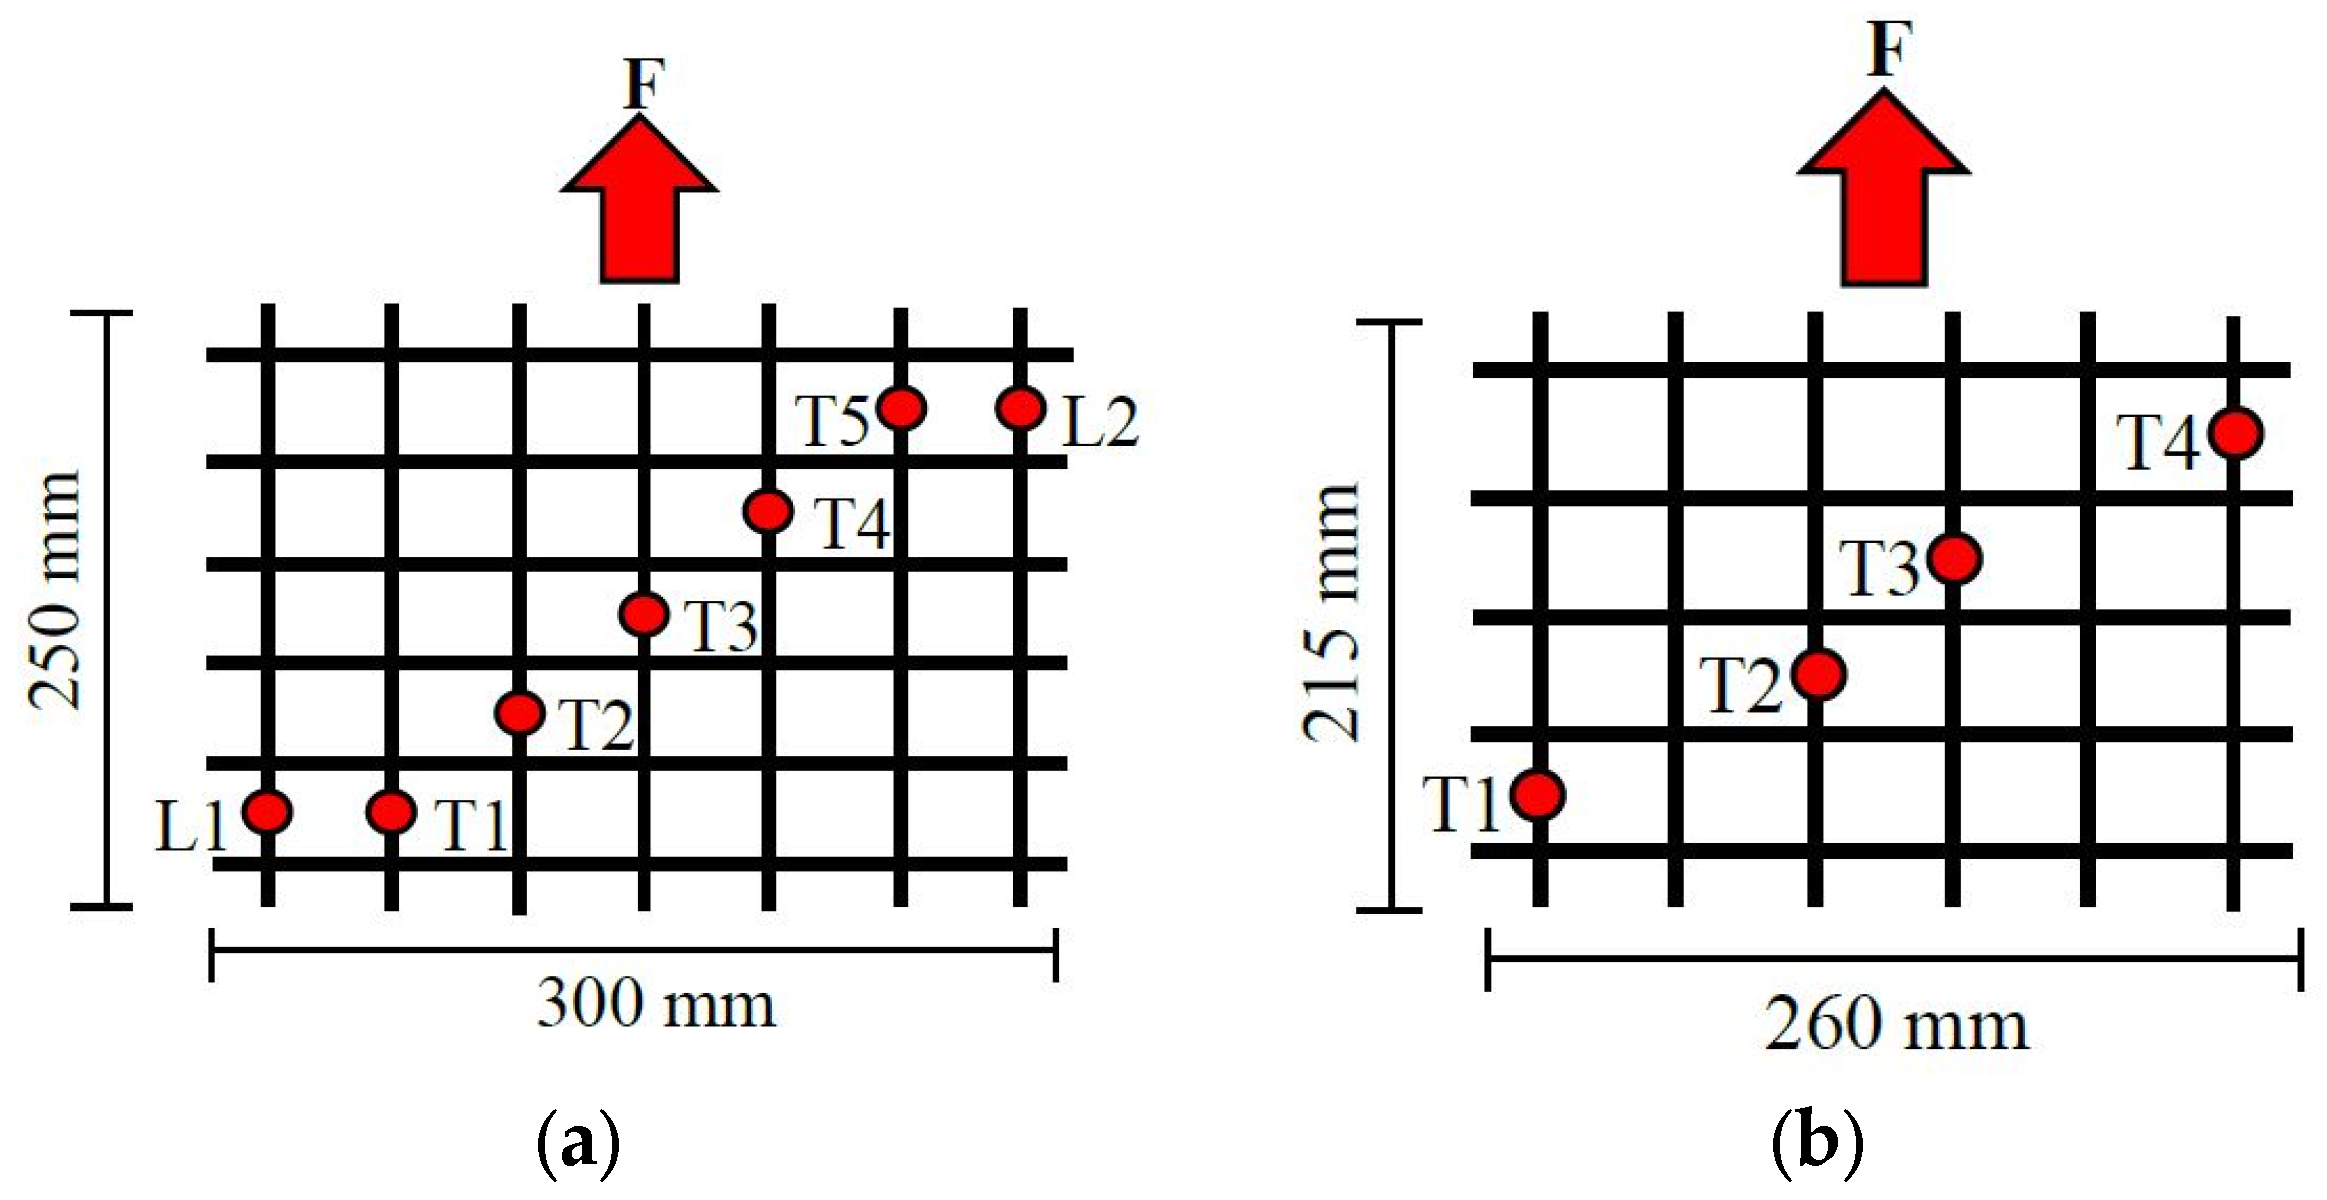
2.2. Pullout Test Devices

According to the ASTM pullout test standard [40], the large-scale pullout test box should have minimum dimensions of 610 mm in length, 460 mm in width and 305 mm in height. Additionally, the width of the box should be determined as the greater of 20 times the D85 of the soil or 6 times its maximum particle diameter, while ensuring the length is greater than 5 times the maximum aperture size of the geosynthetic. The box must provide a minimum depth of 150 mm above and below the geosynthetic, whereby the soil depth above and below the geosynthetic is at least 6 times the D85 of the soil and 3 times its maximum particle diameter. Finally, the box should allow for a minimum embedment length of 610 mm beyond the sleeve, as well as a geosynthetic length-to-width ratio not lower than 2.0.
The large pullout box (LB) utilized herein (Figure 2) consists of a rigid steel box, reinforced with U-shaped steel beams, which was first developed by Teixeira [45]. Its dimensions are 1500 mm long, 700 mm wide and 480 mm high. As can be observed, the box exceeds the dimensions prescribed by ASTM D6706 [40]. The system can apply a tensile force of up to 60 kN to the reinforcement. For normal load application, an airbag is used, providing a uniform surcharge that replicates field conditions [45].
The boundary effects generated by the inner walls of the box can affect the measured pullout resistance value. As mentioned by Palmeira and Milligan [9], one of the options to reduce such effects consists of leaving a minimum distance of 150 mm between the geosynthetic and each pullout box wall. Additionally, Palmeira and Milligan [9] recommended using a metallic sleeve at the level of the reinforcement to mitigate the frictional effects at the front wall, as its implementation causes the point of application of the pullout force to be transferred inside the soil mass, as illustrated in Figure 2.
The small pullout box (SB) consists of a rigid steel box with inner dimensions of 245 mm in length, 300 mm in width and 145 mm in height, as shown in Figure 3. These dimensions closely resemble those of a large-scale direct shear test apparatus and are approximately half of the minimum dimensions indicated by ASTM D6706 [40]. The upper surface of the box features a reaction cap attached to a pressure-controlled air bag used for applying the normal load. Positioned in the rear region is a support for the attachment of four tell-tales, which are linked to the geosynthetic by inextensible wires. The small box was originally developed by Teixeira et al. [15] to investigate the individual geogrid ribs. However, a comparison between the results from both devices considering the monotonic and cyclic pullout response of geosynthetic reinforcements to evaluate the associated scale effects had not yet been performed.
In the case of the small-scale equipment, keeping a significant distance between the sidewalls of the box and the reinforcement or the inclusion of a metallic sleeve is not possible due to the limited dimensions of the box. Therefore, to reduce the sidewall friction, a different solution proposed by Palmeira and Milligan [9] was adopted, which consisted of installing two geomembranes on each wall, lubricated with graphite calcium grease, as shown in Figure 3. In order to use the same load application system in both pieces of equipment and to be able to establish the respective comparisons, an adaptation support for the small equipment in the large box was designed.
The displacements of the geogrid were measured using inextensible wires fixed to the geogrid. To reduce friction, the wires were protected by nylon tubes with an internal diameter of 2 mm, which were placed along the reinforcement length. Furthermore, two total pressure cells were installed 10 mm above the geogrid to evaluate the development of localized normal stresses.
For the large-scale equipment, the displacements were recorded by five different tell-tales nominated T1, T2, T3, T4 and T5 and two linear variable differential transformers (LVDT) with a maximum capacity of 50 mm and denominated L1 and L2 (Figure 4a). All points T1 to T5 were spaced 45 mm longitudinally. On the other hand, for the small box, the geogrid displacements were measured by four different tell-tales nominated T1, T2, T3 and T4 (Figure 4b). For consistency, all points were spaced 45 mm in the longitudinal direction, similar to the large-scale equipment.
Regarding the size of the geogrid specimens, a constant relationship was considered between the width and length of the specimens in the confined region for each piece of equipment. The ratio between the width and length in the confined region was limited by the size of the small-scale equipment. The dimensions were defined considering a distance of 20 mm between the side walls of the box and the geogrid, as well as a distance of 30 mm between the back wall and the reinforcement. Thus, the size of the geogrid specimen inside the small-scale equipment was defined as 215 mm × 260 mm, resulting in a ratio of 1.21, as shown in Figure 4. Considering the same ratio of 1.21 for the large-scale equipment and following the ASTM D6706 [46] recommendation of a 150 mm minimum distance between the geosynthetic and the box sidewalls, a length of 250 mm and a width of 300 mm were adopted, resulting in a similar confined length in both types of equipment.

2.3. Test Procedures

The large-scale pullout testing program was conducted in accordance with recommendations of the ASTM D6706 standard [46] and procedures adopted by Teixeira et al. [15]. The soils used were initially homogenized at their optimum moisture content. Then, the appropriate mass of soil for each layer was separated, considering both the target dry unit weight and the desired thickness of each layer. The compaction was carried out by utilizing a manual hammer with a 120 mm square base and 40 N weight. The hammer was dropped from a height of 450 mm to ensure proper compaction. The soil was compacted in six layers, each with a thickness of 80 mm. After the initial three layers were compacted, the geogrid specimen was attached to the clamp and placed at mid-height. As mentioned earlier, the initial three layers consisted of soil A. Once the geogrid was positioned, soil B was compacted in the upper portion of the box, following the same procedures used for the initial layers. An airbag was then fixed over the soil surface at the top plate, and a uniform distribution pressure was administered via a pneumatic system, regulated by a controlled compressor, as shown in Figure 5.
For the small-scale equipment, the soil was mixed with the required water to attain the desired moisture content. Subsequently, it was compacted in the pullout box to the prescribed density in four layers, each with a thickness of 35 mm. The compaction was performed using a manual hammer with a 20 mm square base and 10 N weight, dropped from a height of 100 mm. The compaction procedures resulted in a consistent soil density for both types of equipment. Furthermore, the relative compaction varied from 96% to 102% of the standard proctor maximum dry unit weight.
A servo-hydraulic control system, powered by an electric pump, was used to apply the pullout force to the reinforcement. Programmable software controls the system speed, displacement and applied load throughout the test. The pullout clamp has reinforcement ribs along their sides, and the tightening is performed by clamping the screws, which immobilizes the specimen throughout its width and minimizes the differential slips, as shown in Figure 6. The clamping system can be placed inside or outside the test box, as reported by Moraci and Recalcati [14].
Initially, monotonic pullout tests were performed at a constant displacement rate of 4.0 mm/min until pullout or rupture of the geogrid was achieved. The displacement rate used in this study for geosynthetic pullout testing is different from that recommended by ASTM D6706 [40]. However, as reported by the authors of [39], the use of displacement rates of 1.0, 2.0 and 4.6 mm/min in this equipment did not lead to a high variability of results. A displacement rate of 4.0 mm/min was adopted herein to enable the comparison of the test results with those from other studies carried out using the same equipment, in which this particular rate of displacement has commonly been used.
After the monotonic pullout evaluation, the cyclic load limits were estimated, and the load amplitude was defined as 20% of the monotonic maximum pullout resistance value. This load amplitude was defined based on Razzazan et al. [47] and Garcia and Lodi [34], which concluded that for high amplitude values (80%), the geogrid breakage tends to occur before the end of cycles, and amplitude values ranging from 20% to 40% seem to lead to similar results.
In the cyclic/post-cyclic test procedure, the system was first loaded at a lower limit estimated according to ASTM D7499 [46], corresponding to 0.9 kPa for a confinement stress of 25 kPa and 3.6 kPa for a confinement stress of 100 kPa. Then, 10,000 loading cycles were applied to the reinforcement. The cyclic pullout load followed a haversine shape with a 0.5 s applied load period followed by a 0.5 s rest period in each load cycle, thus resulting in a frequency of 1 Hz. The number of load cycles was selected based on Razzazan et al.’s work [47], which showed that the increment in the number of cycles from 30 to 250 caused only slight changes in the peak pullout resistance. Therefore, a higher number of loading cycles were imposed herein. After the cyclic loading stage, the pullout test proceeded under monotonic loading conditions (post-cyclic loading stage) until pullout or tensile failure of the geogrid was reached.

3. Results

As mentioned previously, the test program consisted of assessing the equipment scale effect on the pullout response of the geosynthetics. First, the results of monotonic tests are presented. These tests were performed under applied vertical pressures of 25, 50 and 100 kPa, for both small- and large-scale equipment. Afterwards, the analyses were presented for the cyclic/post-cyclic tests. The post-cyclic tests were performed under 25 and 100 kPa applied vertical pressures for both types of equipment.
It is noteworthy that the vertical pressure was monitored by total pressure cells installed 10 mm above the reinforcement level. Prior to the beginning of the test, the vertical pressure was increased until it reached the prescribed value (25, 50 or 100 kPa), and then kept constant for 8 min. Observations indicated that immediately after the start of the test, there was a deconfinement of the soil due to the dilatancy effect, followed by an increase in the vertical pressure due to the rearrangement of soil particles. Throughout the test, the total pressure cells reached an equilibrium state, with values stabilizing close to the required vertical pressure.

3.1. Monotonic Loading Conditions

In this study, the geogrid pullout resistance (PR) was evaluated considering the effective area of the geogrid and the average force values, as recommended by Ochiai et al. [12]. The influence of the pullout test apparatus scale was verified through monotonic tests at three applied normal stresses (σn). Table 3 presents a summary of these test results, displaying the maximum pullout resistance (PR), the corresponding frontal geogrid displacement (uPR), the confined stiffness at 2% strain (JC2%), the maximum shear stress (τi) and the pullout interface apparent coefficient of friction (μs/GSY).
Figure 7 presents the comparison between the pullout force versus geogrid displacement from the small box (Figure 7a) and large box (Figure 7b) at 50 kPa applied normal stress. From Figure 7a, it is observed that the displacement values from tell-tales T1 to T3 were similar for the small-scale equipment, even though they were installed at different locations along the geogrid length. Conversely, the displacements recorded in the large-scale tests varied considerably throughout the whole reinforcement length. The longer the distance from the rear edge, the higher the displacement values, as shown in Figure 7b. Although different instruments (tell-tales and LVDTs) were used in the large-scale equipment, the results of pairs L1–T1 and L2–T5 were quite consistent.
Figure 8 illustrates the influence of equipment scale on the pullout resistance of the geogrid for different applied normal stresses. When comparing the measured pullout resistance at lower applied normal stresses (25 and 50 kPa), it becomes apparent that the use of the large box led to significant increases in the maximum pullout resistance of 33.29% and 20.32%, respectively. However, for the tests performed under 100 kPa, the pullout resistance obtained from the large box exceeded that from the small box by only 4.9%. These results suggest that increasing the applied normal stress leads to a convergence of the values of pullout resistance estimated from both types of equipment.
In pullout tests involving extensible geosynthetic reinforcements, the shear stress mobilized along the interface is non-uniform. It is dependent upon the reinforcement confined stiffness (extensibility) and the mobilized shear stresses over the active length of the reinforcement [14,16,48]. The active length corresponds to the confined geosynthetic length over which the mobilization of interaction mechanisms takes place, which can be determined based on the displacements recorded in discrete locations over the specimen length during the test. The experimental interpretation can be simplified by using Equation (4), as proposed by Cardile et al. [16]. This equation replaces the actual shear stress mobilized along the interface by an equivalent uniform average shear stress distribution (τAL) that can be expressed as the ratio between the applied pullout force (PR) and the double active length of the geosynthetic (LA):
τ A L = P R 2 L A
Figure 9 illustrates the maximum shear stress mobilized in the pullout tests (i.e., at the moment of achieving maximum pullout resistance), as determined by Equation (4), plotted against the applied normal stress, as well as the respective linear best-fit lines. By adopting the Mohr–Coulomb failure criteria, the interface strength parameters, specifically the friction angle (δ) and apparent cohesion (ca), were determined. Comparing the parameters derived from both types of equipment, it can be observed that the friction angle increases (from 13° to 19°), while the apparent cohesion decreases (from 38.6 to 30.2 kPa) when the small pullout box is used. Additionally, it is noted that the maximum pullout shear stress values are relatively similar, particularly under 50 kPa confining stress, indicating a different trend from that observed for the pullout resistance results.
The geogrid stiffness is an important parameter for several reinforcement applications, including reinforced soil structures and pavement design. The design methods of reinforced pavement base, such as that developed by Giroud and Han [49], for example, use the unconfined stiffness (JN) for designing the base layer. As the reinforcement is under confined conditions in the field, the confined tensile stiffness (JC) that can better represent the actual geogrid stiffness under field conditions was obtained in this study from the pullout test results.
While the pullout test may not be the optimal method for this purpose, the criterion for assessing the confined stiffness was established as the ratio of the pullout force to the deformation of the geosynthetic between two designated measurement points, as defined in Equation (5):
J C = P R X i X i + 1 d
where d represents the original distance between two adjacent measurement points, and Xi denotes the displacement of the ith geogrid measurement point starting from the geogrid front end. For the purpose of this study, as shown in Table 3, analyses of confined tensile stiffness were conducted at 2% strain, considering the intermediate tell-tales (tell-tales T2–T3) for both types of equipment. Additionally, Figure 10 depicts the evolution of confined stiffness with increasing geogrid strain values.
The same method and test apparatus were previously used by Marques and Lins da Silva [38] to determine the confined stiffness. Similarly, refs. [14,16] adopted a comparable approach. Despite variations in equipment and materials, the stiffness curves presented in this study exhibited the same order of magnitude as those obtained by Cardile et al. [16].
Figure 10 indicates that, under lower normal stresses, the smaller box resulted in higher confined stiffness values, particularly for small strains (<2%). However, at a 2% strain, both types of equipment showed similar results. Specifically, for confining stresses of 25 and 50 kPa, the confined tensile stiffness decreased by 12.8% and 11.9%, respectively, when the larger box was utilized. However, a different behavior was observed under higher confining stress (100 kPa), where the influence of equipment scale was less significant, and both types of equipment presented relatively similar confined tensile stiffness values. Additionally, the confined tensile stiffness tended to increase with the confining stress, as also shown in Table 3.

3.2. Cyclic/Post-Cyclic Loading Conditions

The cyclic/post-cyclic pullout behavior of the geogrid was evaluated through tests conducted under 25 kPa and 100 kPa confining pressures. Figure 11 shows the variation of PR as a function of the geogrid frontal displacement based on the monotonic and cyclic/post-cyclic tests. As expected, at the commencement of cyclic loads, large frontal displacement occurs, leading to the mobilization of a significant portion of friction and bearing resistance; therefore, for high normal stress, during the post-cyclic loading stage, the pullout resistance is lower than that achieved under monotonic loading. This degradation of pullout capacity after cyclic loading is consistent with the findings of previously related research [28,29,31,35].
The cumulative frontal displacement of the geogrid during cyclic loading was similar for both types of equipment (Figure 11). Higher cumulative cyclic displacement was measured for the lower normal stress of σn = 25 kPa (Figure 11a). Under higher normal stress (Figure 11b), a premature failure of the geogrid in tension (tensile failure) occurred in the small-scale test in the post-cyclic stage. Conversely, when the large-scale equipment was used, the failure was attributed to sliding along the interface. It can also be observed that the displacement of the geogrid at maximum pullout force generally increased in the post-cyclic test, in comparison to that measured under monotonic loading conditions. This trend held true except for when the geogrid underwent tensile failure in the test under σn = 100 kPa (Figure 10b).
Table 4 indicates the values of maximum pullout resistance (PR), the ratio of the maximum post-cyclic shear stress to the maximum shear stress attained in the comparable monotonic pullout test (τcycmon), and the peak pullout interface apparent coefficient of friction (μs/GSY) for the post-cyclic tests. It can be observed that, under the lower normal stress, no degradation of pullout resistance upon cyclic loading (reflected by the τcycmon ratio) was observed; rather, the mobilized shear stress increased slightly. Conversely, under the higher normal stress, lower values of pullout resistance and mobilized shear stress were obtained under post-cyclic conditions.
Figure 12 shows the variation in μs/GSY as a function of the applied normal stress. The results refer to the two pieces of equipment used, and the different loading conditions adopted (monotonic or cyclic/post-cyclic). For all the test conditions examined, it can be observed that the μs/GSY decreases as the applied normal stress increases. This behavior can be explained due to the soil dilatancy effects at the interface [14]. Moreover, for σn = 25 kPa, the μs/GSY values obtained from the small pullout box exceeded those from the large box, regardless of the loading conditions. However, for higher normal stresses (σn = 50 and 100 kPa), the differences between the μs/GSY values associated with distinct equipment types were less significant. Except for the small box test under σn = 25 kPa, the μs/GSY values attained under monotonic loading conditions exceeded those reached under post-cyclic loading.

4. Discussion

As previously mentioned, the evolution of displacements recorded by tell-tales T1 to T3 in the small box equipment for σn = 50 kPa was rather similar, as shown in Figure 6a. This indicates that only the front geogrid section underwent significant elongation during the load transfer phase of the pullout test and sliding occurred without significant deformation over the back half of the reinforcement. As shown in Figure 7b, for the large box, the instrumentation data revealed a non-linear distribution of shear stress over the whole geogrid length, where displacement values decreased with the distance from the loaded edge. These findings are in agreement with the studies of Cardile et al. [16] and Ferreira et al. [25], in which the geosynthetic deformation in the confined region was found to be more significant in the frontal zone and less significant towards the rear end. However, as mentioned, significant deformation occurred over the whole geogrid length in the large-scale test prior to the pullout phase, as opposed to the small-scale test. This occurrence may be associated with the fact that the specimen width was considerably lower than the pullout box width in the case of the large-scale tests. Previous studies have shown that when the reinforcement specimens are narrower than the pullout box, the non-dilating zone in the soil surrounding the specimen behaves as a restrain against soil dilation in the dilating zone (i.e., above and below the reinforcement), which generates shear stresses at the border between the two zones leading to an increase in the effective normal stress at the soil–reinforcement interface [14]. In turn, higher normal stresses induce a progressive mobilization of the interaction mechanisms at the interface, resulting in a more significant non-linear displacement distribution along the reinforcement length [16], as well as higher pullout resistance values (Figure 8).
As reported before, for lower applied normal stresses, when comparing the confined tensile stiffness at low strain values (less than 2%) for different types of equipment, a significant variability was identified (Figure 10a,b). This may be due to the different reinforcement mobilization (i.e., active length) in the distinct testing boxes. Despite this variability under lower strains, the confined stiffness values at 2% strain (or higher) showed reasonable agreement. Conversely, under a higher normal stress of 100 kPa, the confined stiffness values were similar for both types of equipment over the whole range of available strain values. This is likely associated with the fact that, under the higher normal stress, the deformation of the geogrid specimen tested in the small box extends to sections located further away from the clamp, resulting in similar deformations on the central section of the reinforcement (between tell-tales T2 and T3) in both tests, and hence similar confined stiffness values.
Table 5 presents the ratios between the results obtained from small and large equipment (SB/LB), expressed in terms of the maximum pullout resistance (PR), maximum shear stress (τi) and pullout interface apparent coefficient of friction (μs/GSY) for both monotonic and cyclic/post-cyclic loading conditions.
In Table 5, it can be concluded that for lower applied normal stress (σn = 25 kPa) and regardless of the loading conditions, the apparatus scale influences the measured pullout resistance, which is in accordance with the results reported by Palmeira and Milligan [9]. Higher values of pullout resistance are reached when the large box is used. However, as the normal stress increases, the ratio between the results from different equipment becomes closer to unity, such that a satisfactory agreement is attained for σn = 100 kPa. This corroborates that the increase in normal stress diminishes the scale effect, and consistent results are obtained from both test devices under higher confining pressures. The results in Table 5 also show that, under post-cyclic loading conditions, the effect of apparatus scale on the pullout resistance values follows the same trend as that observed under monotonic loading.
Compared to the pullout resistance, the values of maximum shear stress and apparent coefficient of friction were less influenced by the size of equipment and loading conditions. This can be justified by using the same specimen width-to-length ratio (1.21) for all the tests. Moreover, considering the ASTM pullout test standard guidelines regarding the equipment dimensions in relation to soil particle size, it becomes evident that the use of relatively fine soils in this study contributed to attenuating the apparatus scale effect. Kakuda [39] performed monotonic tests comparing both types of equipment with different boundary conditions, geogrids, specimen size ratio and soil properties, and a similar pattern for the shear stress was also verified. Nevertheless, additional studies involving different geosynthetics and fill materials would be useful to determine whether the obtained conclusions can be generalized.

5. Conclusions

This study evaluated the apparatus scale effect on the pullout response of a geogrid in cohesive soils through monotonic and cyclic/post-cyclic pullout tests subjected to different applied normal stresses. Based on the obtained results, the following conclusions can be highlighted:
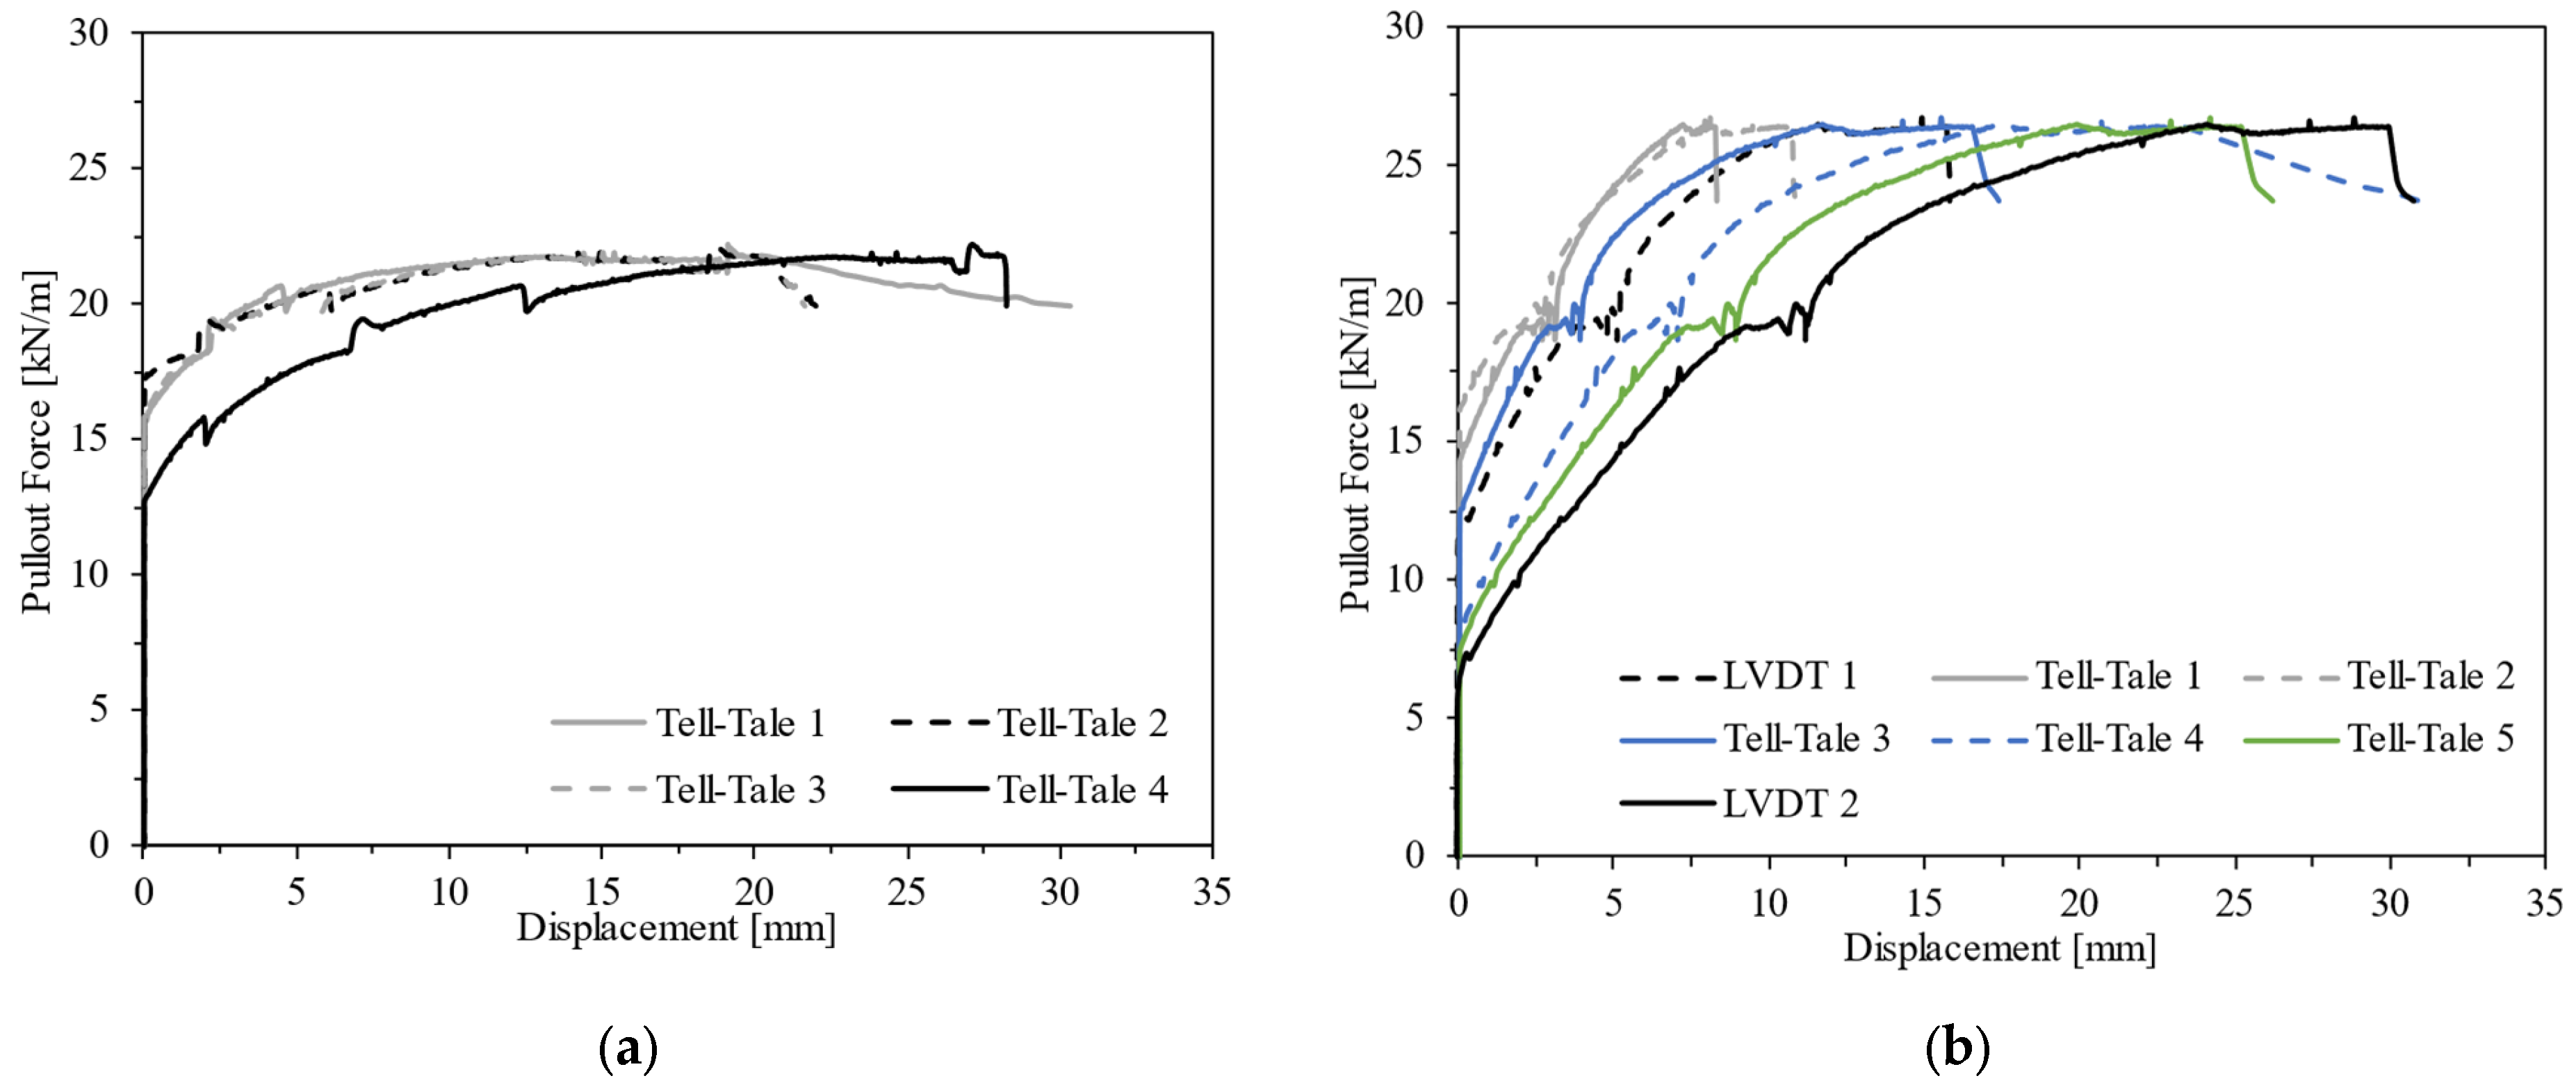
  • In general, in the small-scale tests, no significant deformation occurred over the back half of the reinforcement, as opposed to the large-scale tests, where the geogrid displacements decreased progressively with the distance to the front end, showing a progressive mobilization of the interaction mechanisms at the interface.
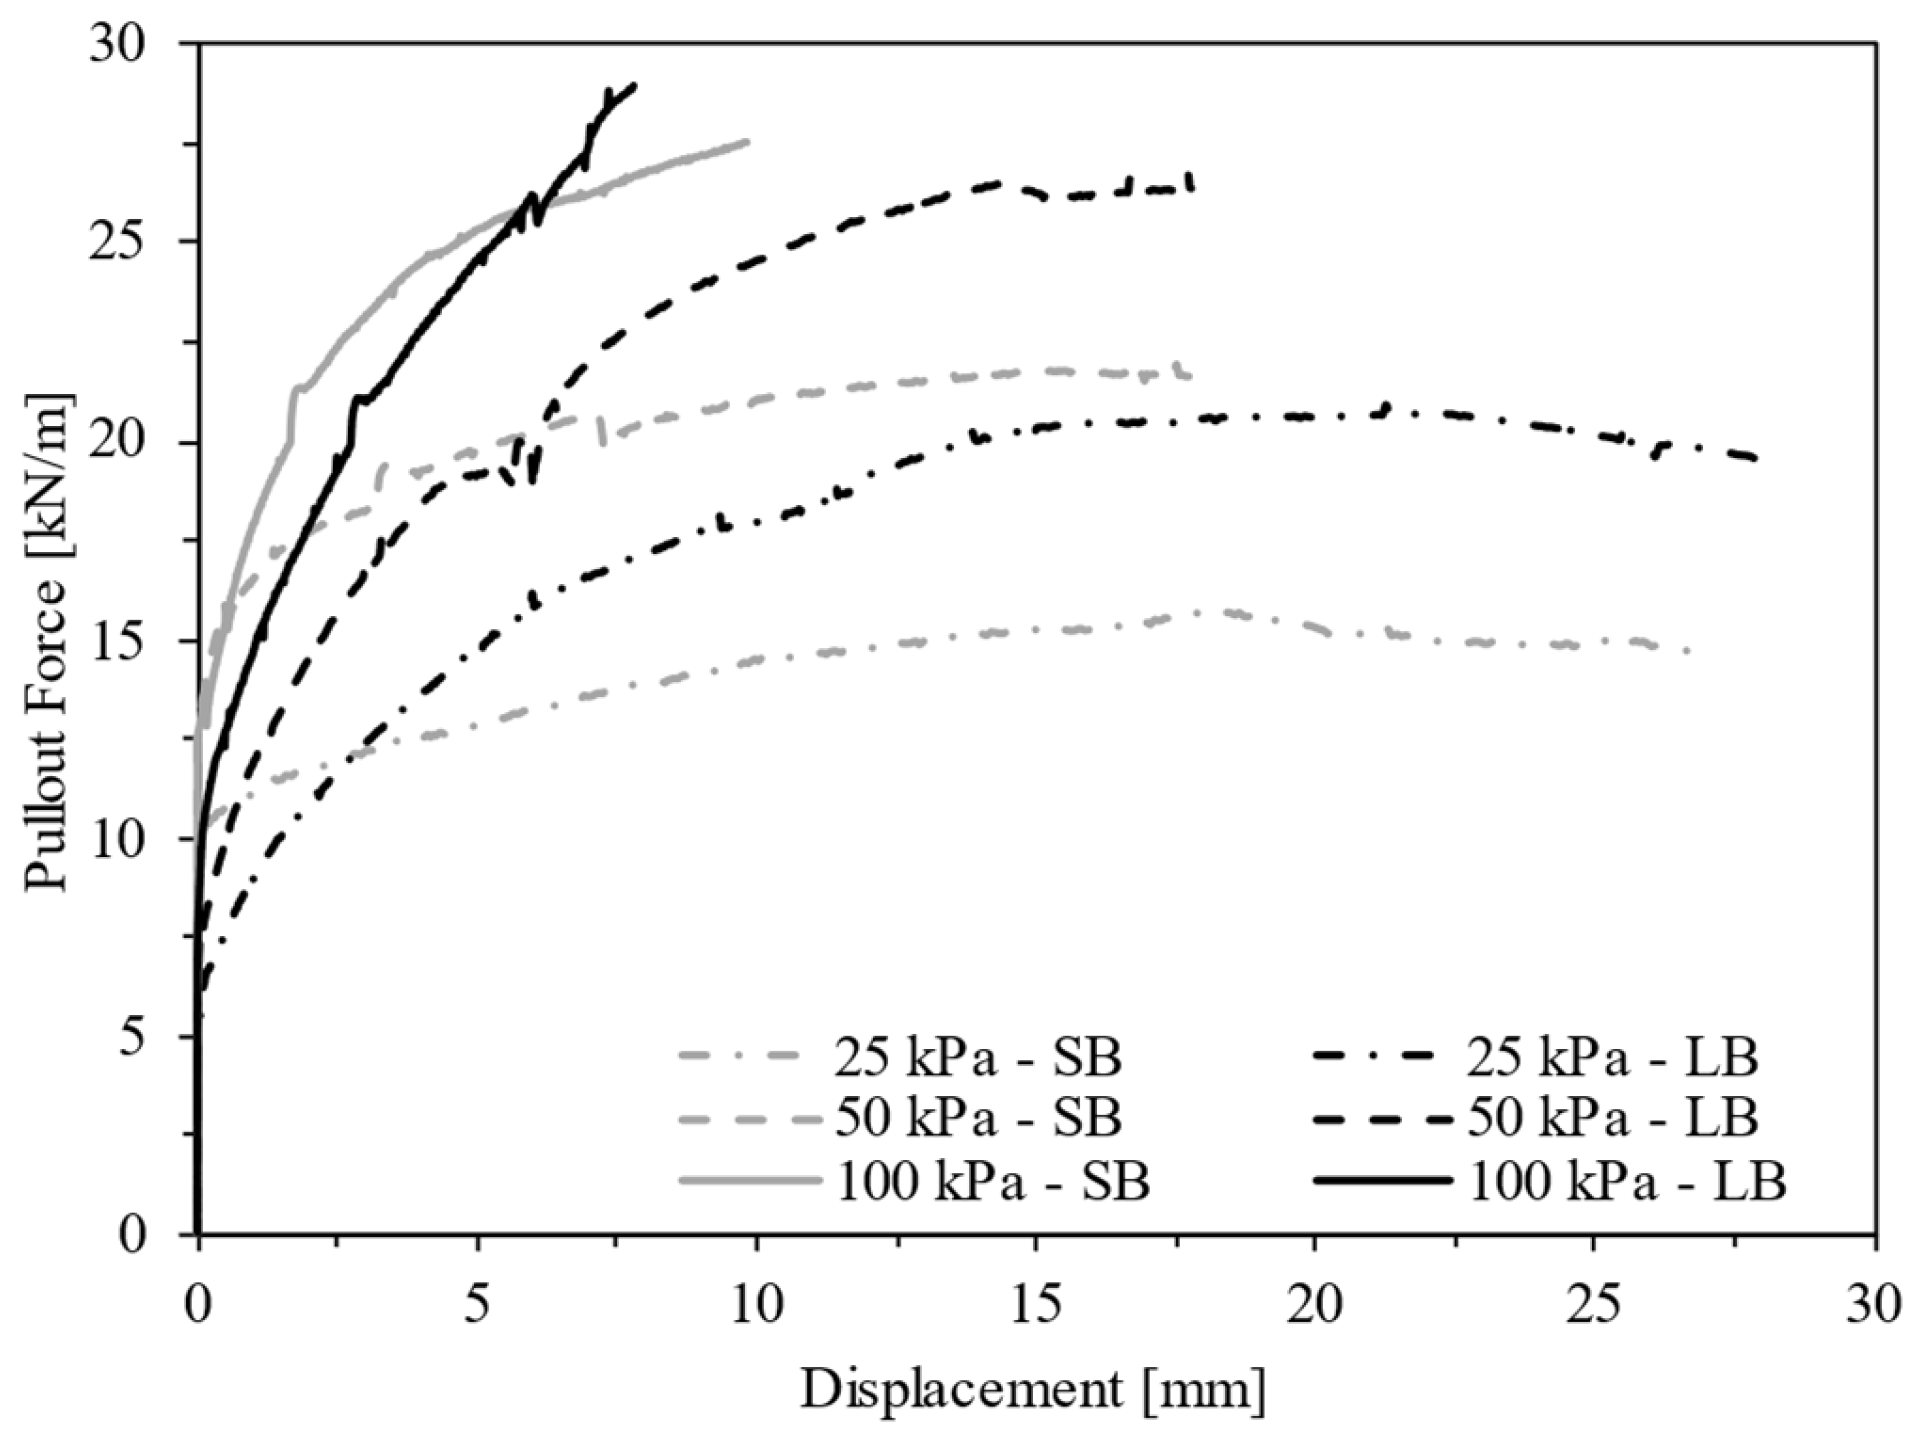
  • Particularly under lower applied normal stresses, the geogrid pullout resistance was considerably influenced by the apparatus scale and higher values were reached in the large-scale tests. However, the scale effect became less prominent when the applied normal pressure increased. Under post-cyclic loading conditions, the effect of apparatus scale on the pullout resistance values followed the same trend as that observed under monotonic loading.
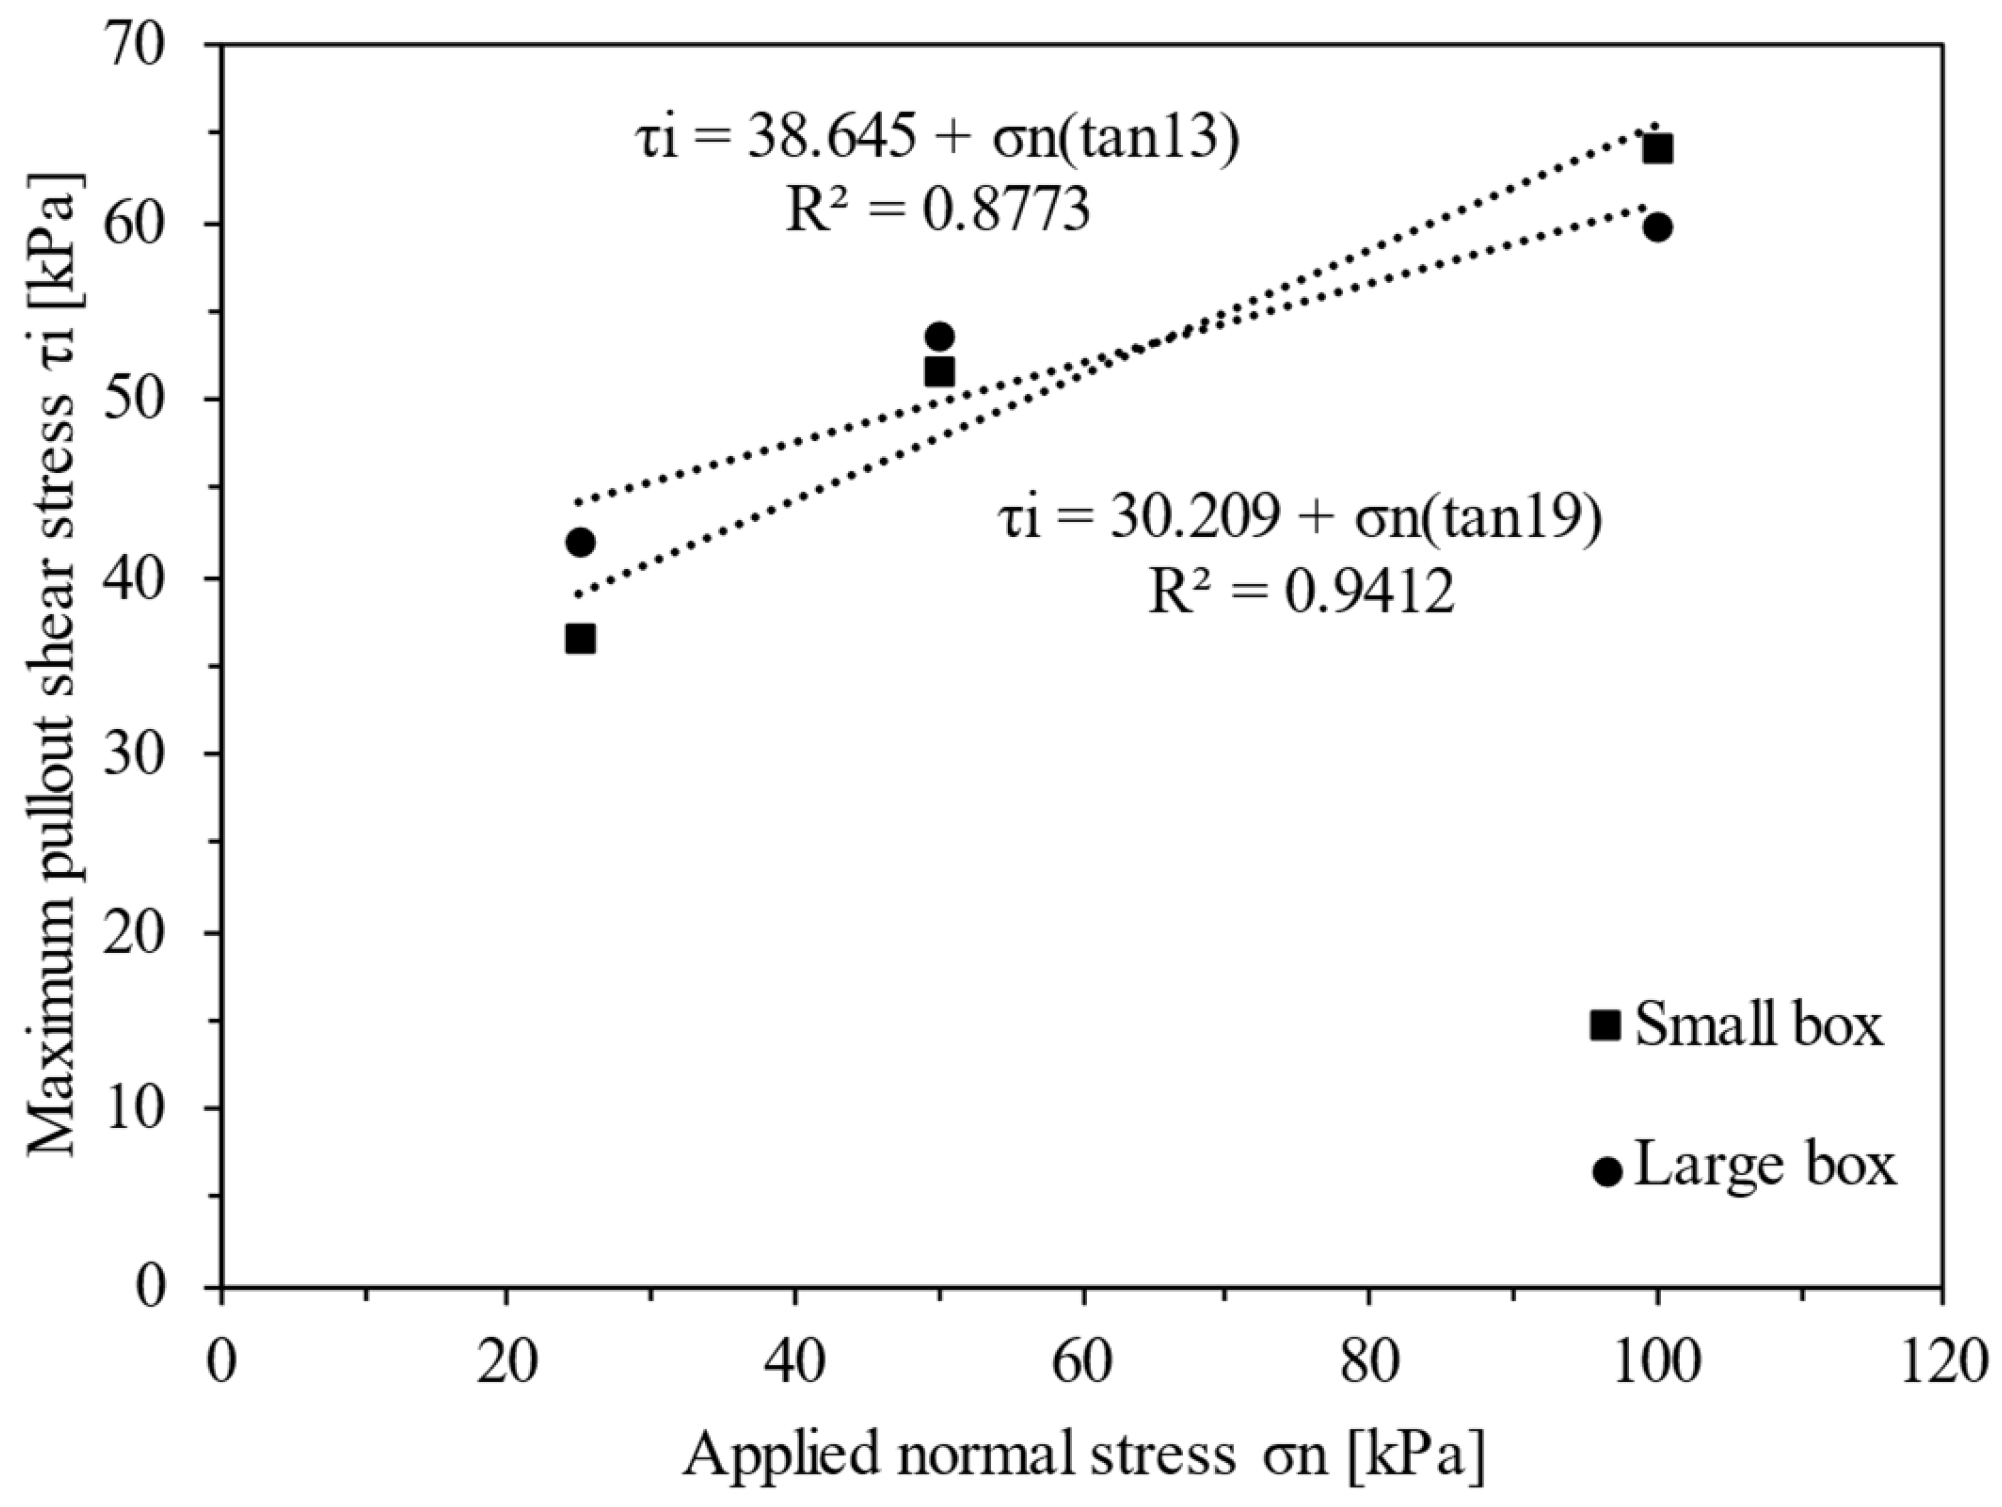
  • Despite the variability for the pullout resistance, the maximum shear stresses obtained from both types of equipment showed reasonable agreement.
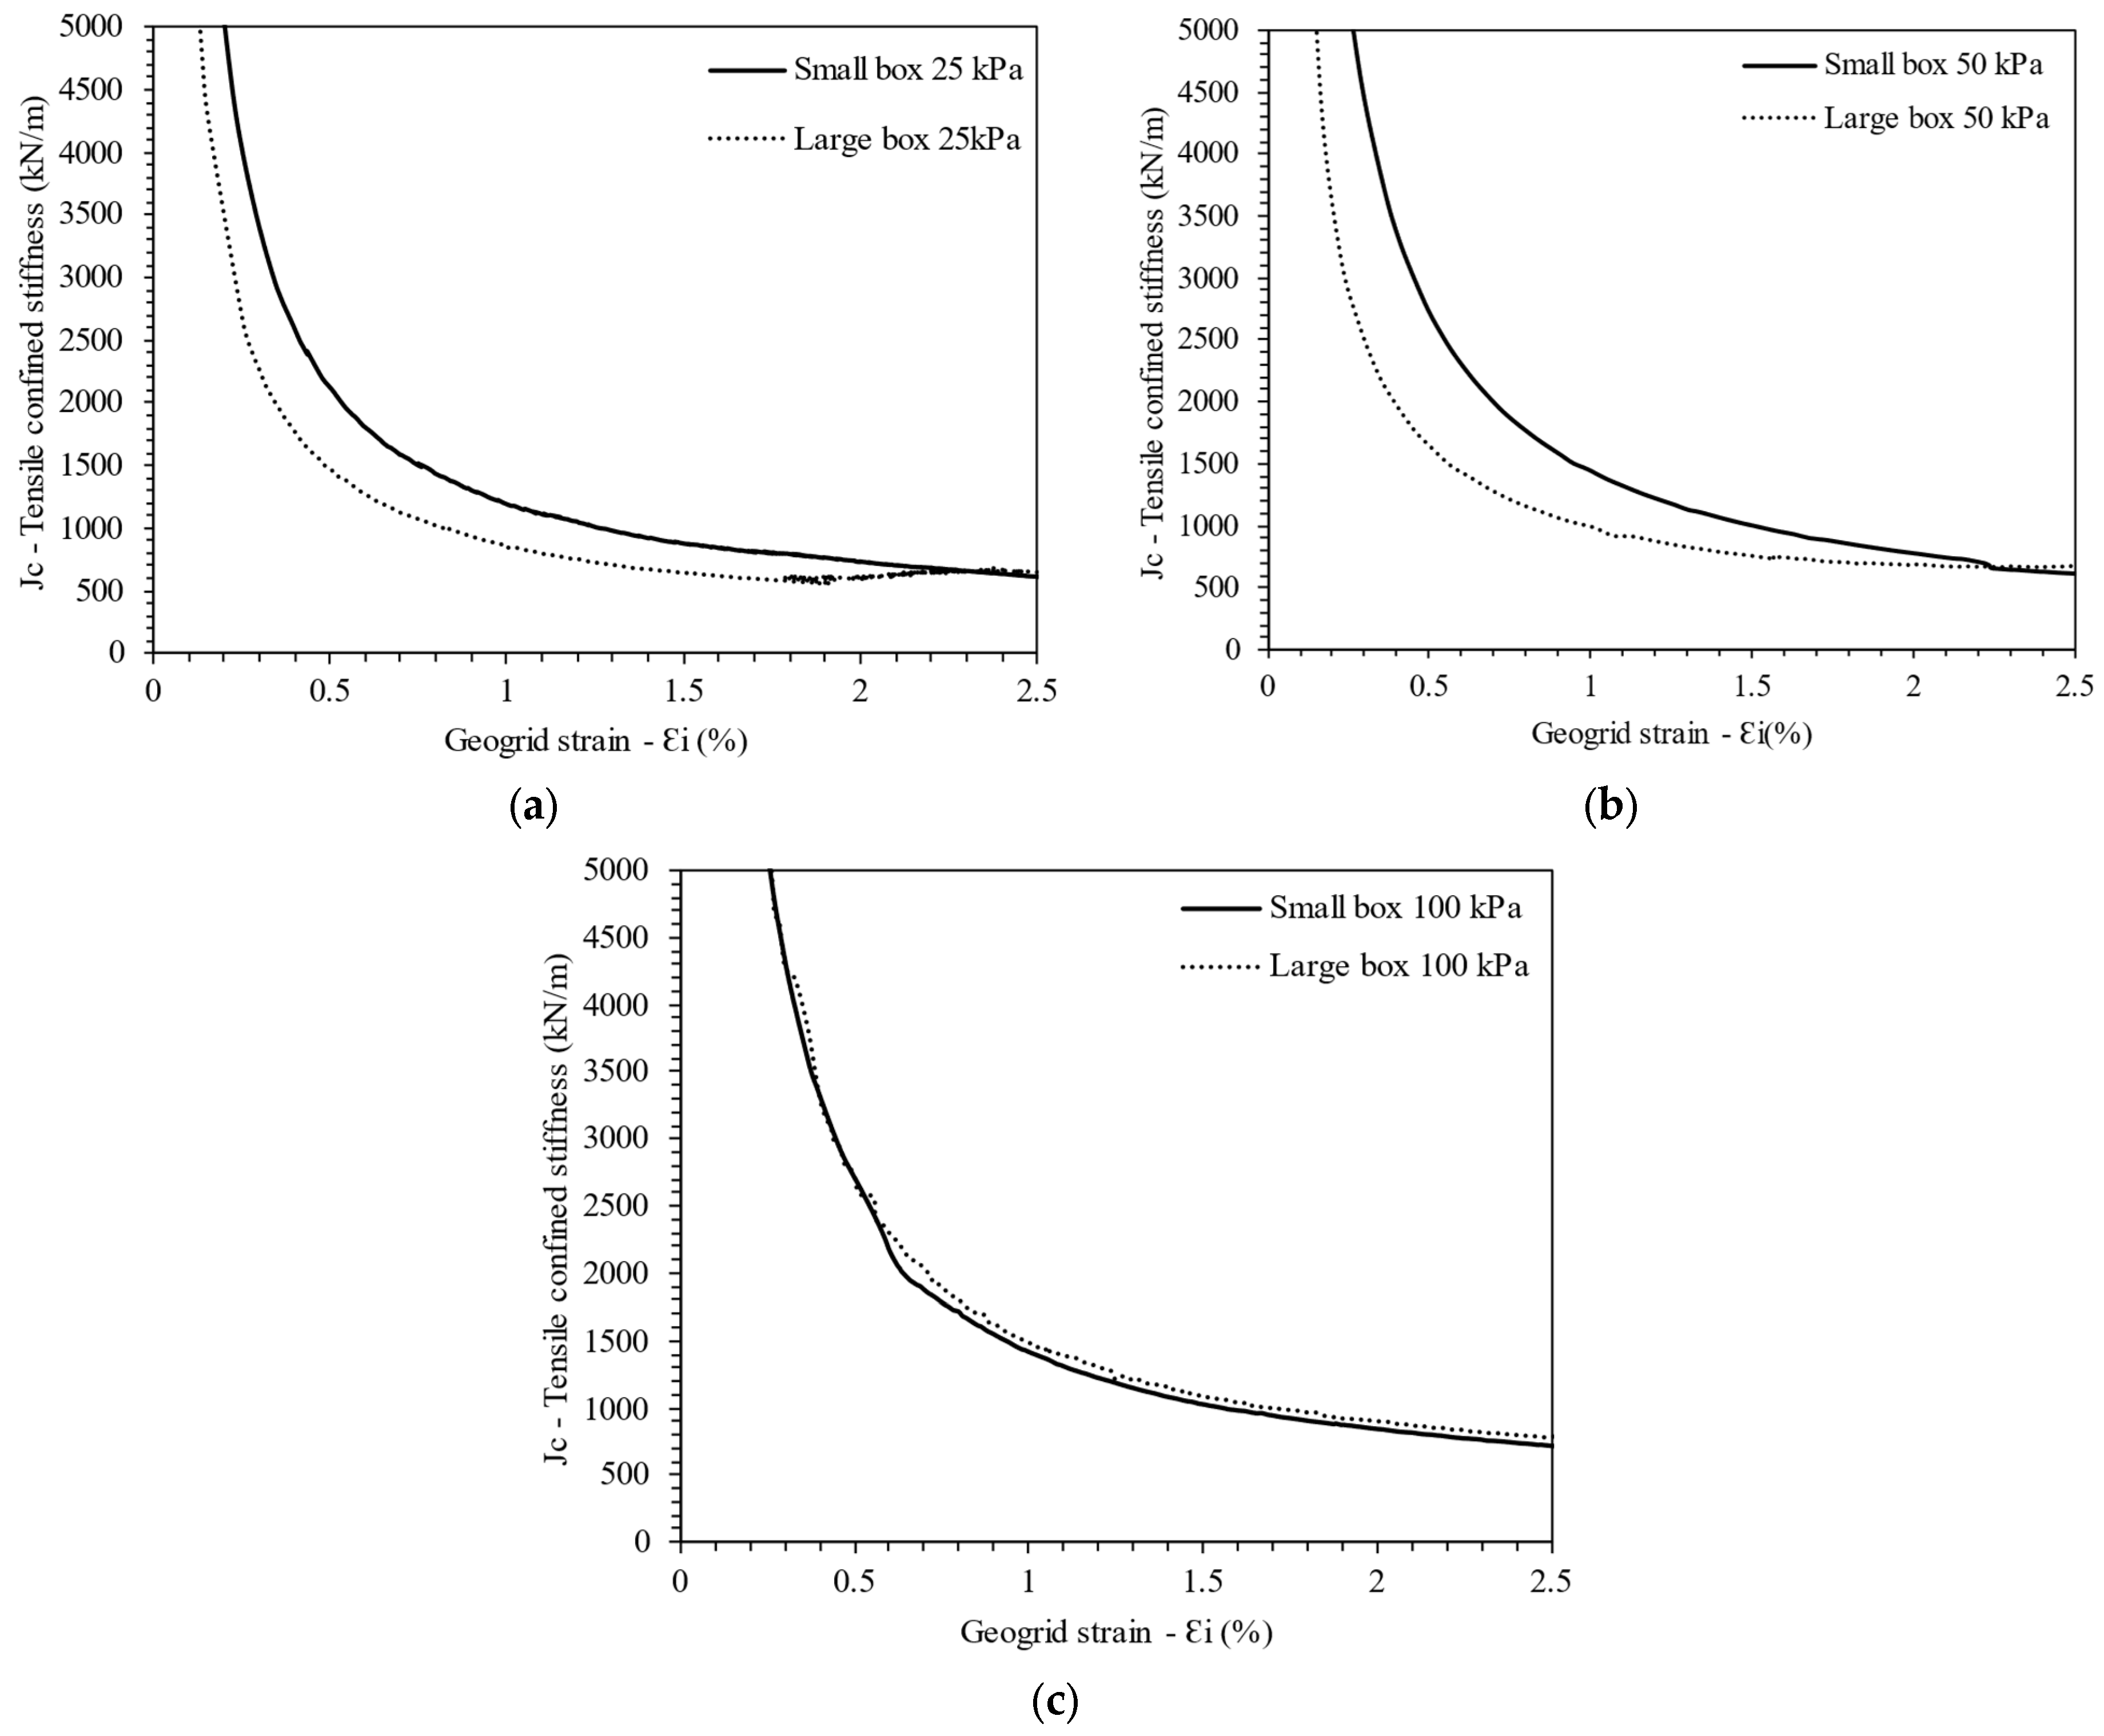
  • Under normal stresses of 25 and 50 kPa, the geogrid’s confined stiffness at low strains (<2%) derived from the small-scale tests exceeded that from the large-scale equipment. However, under a higher normal stress (100 kPa), the values of confined tensile stiffness obtained from both equipment types were consistent.
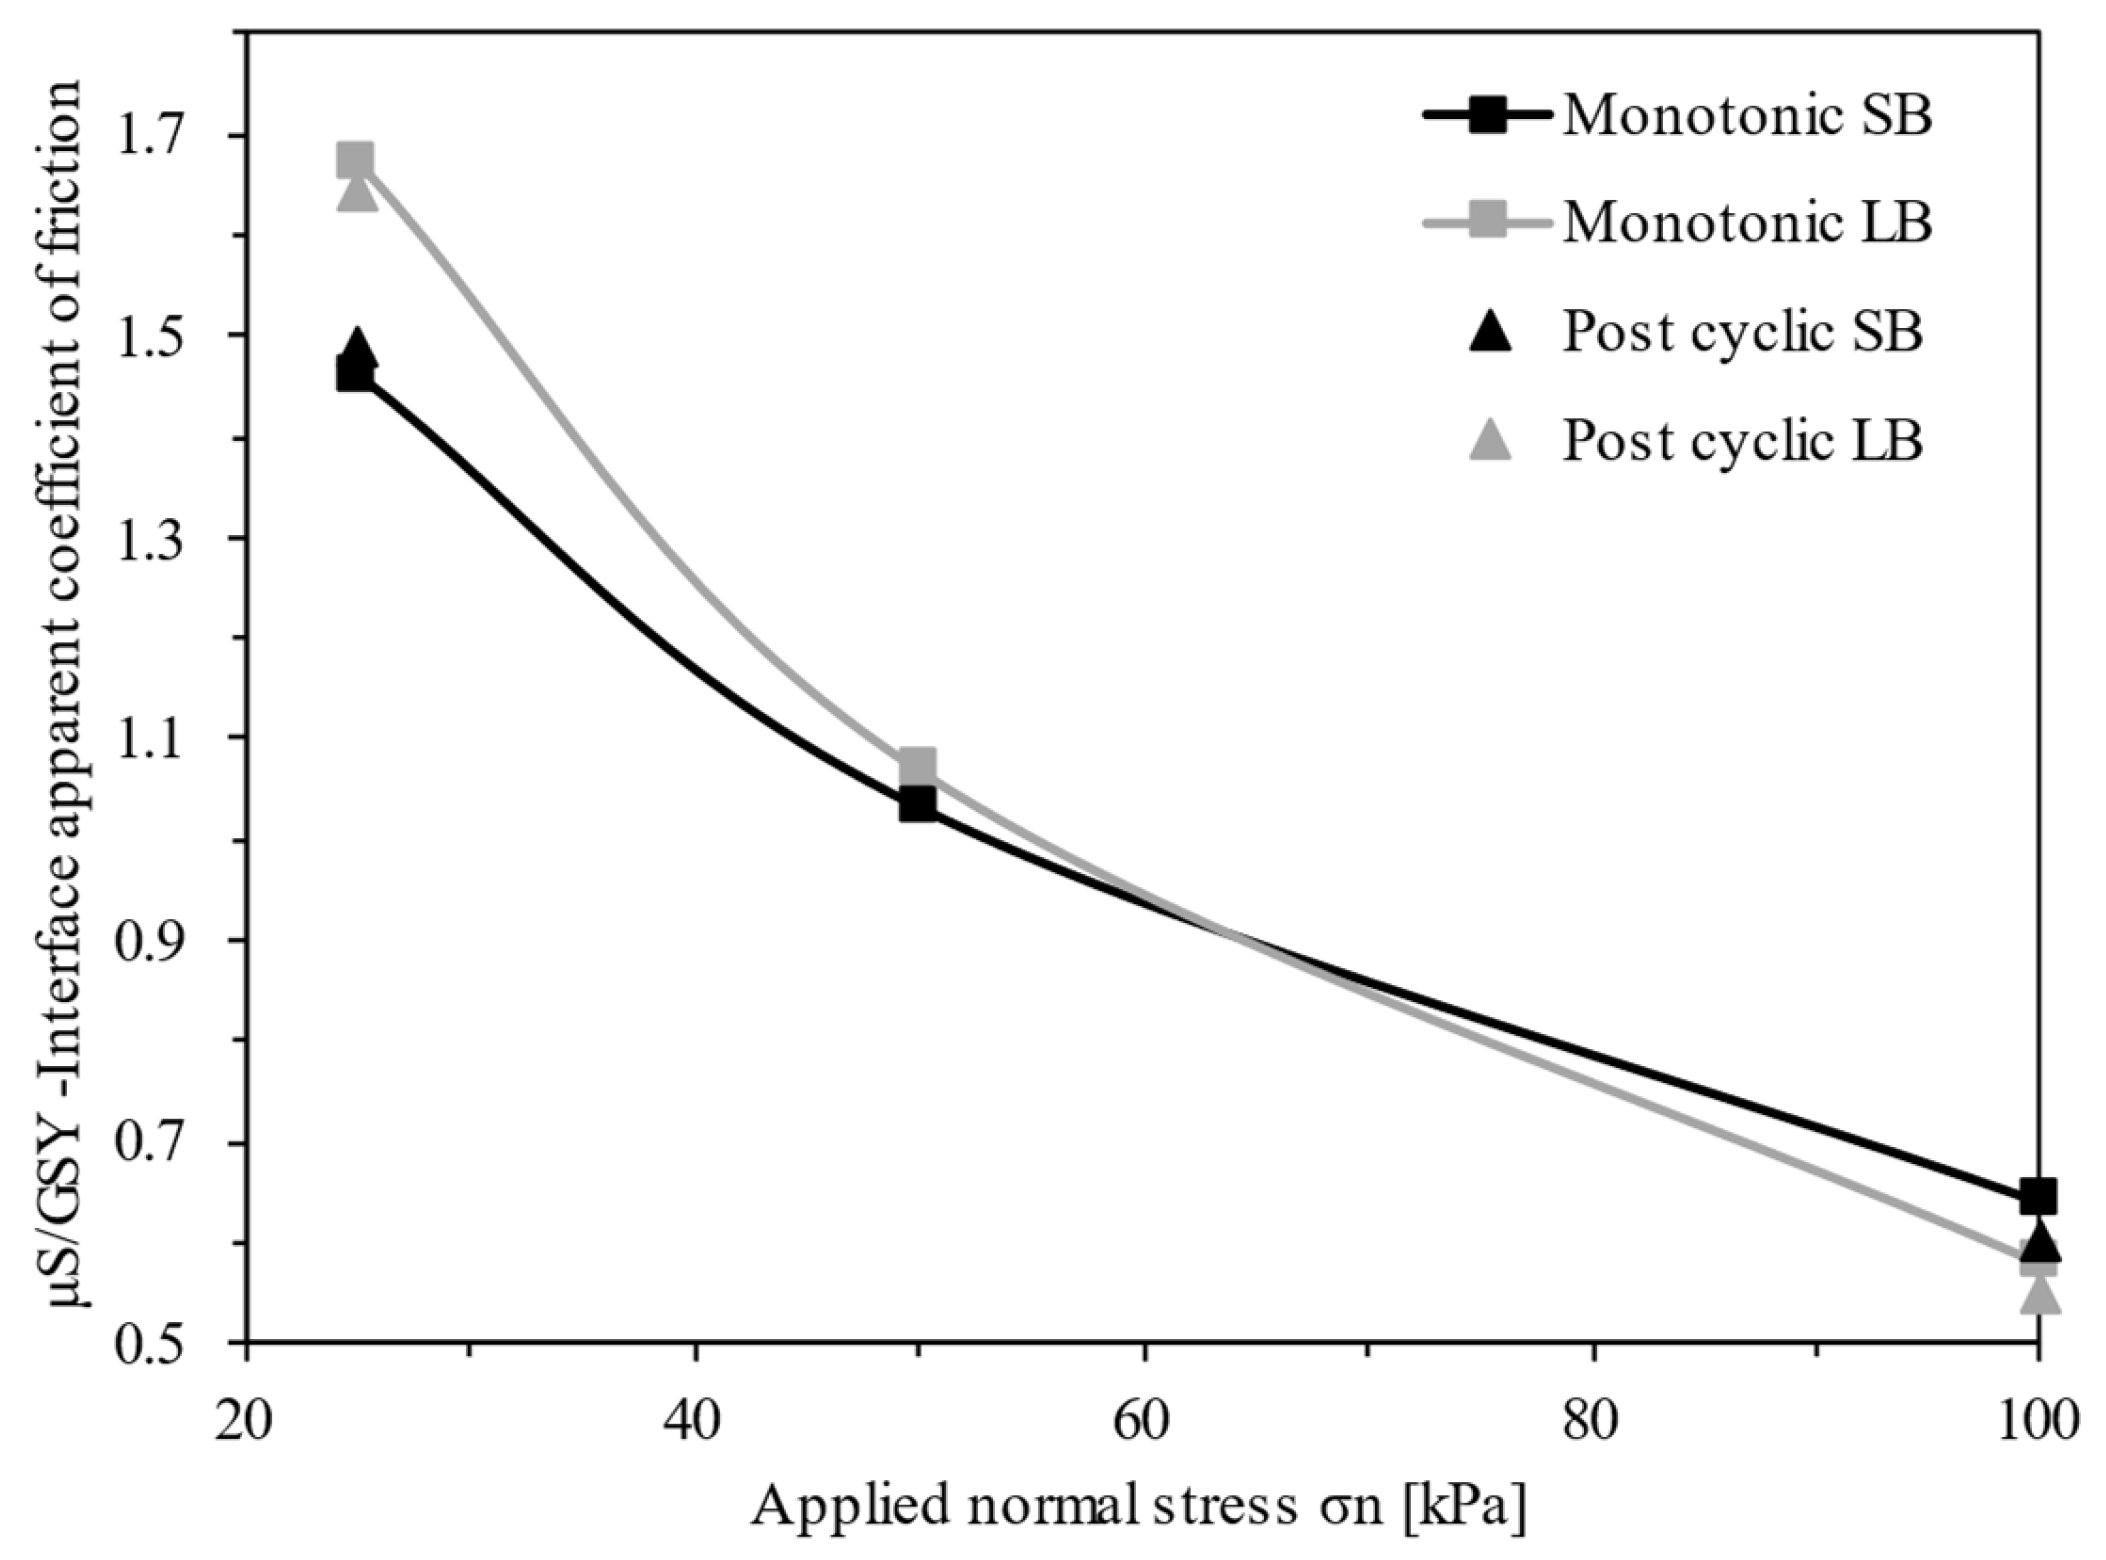
  • The pullout interface’s apparent coefficient of friction (μs/GSY) decreased with increasing normal stress. While for σn = 25 kPa, the μs/GSY values obtained from the small-scale tests exceeded those from the large pullout box, under higher normal stresses, the differences between the μs/GSY values associated with different test devices were not significant.
The inclusion of geosynthetics in civil infrastructure projects enables significant energy and natural resource savings, thus addressing the global sustainability requirements. Furthermore, the assessment of soil–geosynthetic interaction parameters using small-scale pullout test equipment represents significant benefits, including a reduced consumption of resources, reduced cost, and an easier and faster test assembly, in comparison to conventional large-scale tests. The presented results highlight the importance of the scale effect in pullout tests, while also considering the influence of the applied normal stress. When the pullout resistance is estimated on the basis of small-scale pullout tests, proper scale effect correction factors may be considered for more consistent estimates of the soil–geosynthetic interface strength parameters.

Author Contributions

S.R.B.: Data curation, writing—original draft preparation, methodology, resources and conceptualization; G.O.M.P.: conceptualization, writing—original draft preparation, review and editing; F.B.F.: formal analysis, writing—original draft preparation, review and editing; J.L.d.S.: resources, project administration, supervision and writing—review and editing. All authors have read and agreed to the published version of the manuscript.

Funding

This research was funded by: Process 405594/2022-4. CNPq/FNDCT/MCTI 15/2022—Desempenho de pavimentos estabilizados com geossintéticos: uma abordagem experimental e numérica; Grant No. 2021.03625.CEECIND/CP1679/CT0002 with DOI 10.54499/2021.03625 accessed on 3 August 2024. CEECIND/CP1679/CT0002 from the Stimulus of Scientific Employment, Individual Support (CEECIND)—4th Edition, provided to F.B.F. by Fundação para a Ciência e Tecnologia (FCT); and Base Funding—UIDB/04708/2020 with DOI 10.54499/UIDB/04708/2020 (https://doi.org/10.54499/UIDB/04708/2020) accessed on 3 August 2024 of the CONSTRUCT—Instituto de I&D em Estruturas e Construções—funded by national funds through the FCT/MCTES (PIDDAC).

Data Availability Statement

The datasets generated for this study are available on request to the corresponding author.

Acknowledgments

The authors are indebted to the following institutions that supported the research activities reported in this paper in different ways: National Council for Scientific and Technological Development (CNPq), the University of São Paulo (USP) and CAPES—Brazilian Ministry of Education.

Conflicts of Interest

The authors declare no conflicts of interest. The funders had no role in the design of the study; in the collection, analyses, or interpretation of data; in the writing of the manuscript; or in the decision to publish the results.

References

  1. Göbel, C.H.; Weisemann, U.C.; Kirschner, R.A. Effectiveness of a Reinforcing Geogrid in a Railway Subbase under Dynamic Loads. Geotext. Geomembr. 1994, 13, 91–99. [Google Scholar] [CrossRef]
  2. Berg, R.; Christopher, B.; Samtani, N. Design and Construction of Mechanically Stabilized Earth Walls and Reinforced Soil Slopes—Volume I; Fhwa: Washington, DC, USA, 2009. [Google Scholar]
  3. Byun, Y.H.; Tutumluer, E. Local Stiffness Characteristic of Geogrid-Stabilized Aggregate in Relation to Accumulated Permanent Deformation Behavior. Geotext. Geomembr. 2019, 47, 402–407. [Google Scholar] [CrossRef]
  4. Touze, N. Healing the World: A Geosynthetics Solution. Geosynth. Int. 2021, 28, 1–31. [Google Scholar] [CrossRef]
  5. Vieira, C.S.; Lopes, M.L.; Caldeira, L.M. Sand-Geotextile Interface Characterisation through Monotonic and Cyclic Direct Shear Tests. Geosynth. Int. 2013, 20, 26–38. [Google Scholar] [CrossRef]
  6. Palmeira, E.M. Soil-Geosynthetic Interaction: Modelling and Analysis. Geotext. Geomembr. 2009, 27, 368–390. [Google Scholar] [CrossRef]
  7. Fox, P.J.; Kim, R.H. Effect of Progressive Failure on Measured Shear Strength of Geomembrane/GCL Interface. J. Geotech. Geoenviron. Eng. 2008, 134, 459–469. [Google Scholar] [CrossRef]
  8. Hsieh, C.W.; Chen, G.H.; Wu, J.H. The Shear Behavior Obtained from the Direct Shear and Pullout Tests for Different Poor Graded Soil-Geosynthetic Systems. J. GeoEngin. 2011, 6, 15–26. [Google Scholar] [CrossRef]
  9. Palmeira, E.M.; Milligan, G.W.E. Scale and Other Factors Affecting the Results of Pull out Tests of Grids Buried in Sand. Geotechnique 1989, 39, 511–524. [Google Scholar] [CrossRef]
  10. Farrag, K.; Acar, Y.B.; Juran, I. Pull-Out Resistance of Geogrid Reinforcements. Geotext. Geomembr. 1993, 12, 133–159. [Google Scholar] [CrossRef]
  11. Lopes, M.L.; Ladeira, M. Influence of the Confinement, Soil Density and Displacement Rate on Soil-Geogrid Interaction. Geotext. Geomembr. 1996, 14, 543–554. [Google Scholar] [CrossRef]
  12. Ochiaif, H.; Otani, J.; Hayashic, S.; Hirai, T. The Pull-Out Resistance of Geogrids in Reinforced Soil. Geotext. Geomembr. 1996, 14, 19–42. [Google Scholar] [CrossRef]
  13. Sugimoto, M.; Alagiyawanna, A.M.N.; Kadoguchi, K. Influence of Rigid and Flexible Face on Geogrid Pullout Tests. Geotext. Geomembr. 2001, 19, 257–277. [Google Scholar] [CrossRef]
  14. Moraci, N.; Recalcati, P. Factors Affecting the Pullout Behaviour of Extruded Geogrids Embedded in a Compacted Granular Soil. Geotext. Geomembr. 2006, 24, 220–242. [Google Scholar] [CrossRef]
  15. Teixeira, S.H.C.; Bueno, B.S.; Zornberg, J.G.; Asce, M. Pullout Resistance of Individual Longitudinal and Transverse Geogrid Ribs. J. Geotech. Geoenviron. Eng. 2007, 133, 37–50. [Google Scholar] [CrossRef]
  16. Cardile, G.; Moraci, N.; Calvarano, L.S. Geogrid Pullout Behaviour According to the Experimental Evaluation of the Active Length. Geosynth. Int. 2016, 23, 194–205. [Google Scholar] [CrossRef]
  17. Mirzaalimohammadi, A.; Ghazavi, M.; Roustaei, M.; Lajevardi, S.H. Pullout Response of Strengthened Geosynthetic Interacting with Fine Sand. Geotext. Geomembr. 2019, 47, 530–541. [Google Scholar] [CrossRef]
  18. Ferreira, F.B.; Vieira, C.S.; Lopes, M.D.L. Pullout Behavior of Different Geosynthetics—Influence of Soil Density and Moisture Content. Front. Built Environ. 2020, 6, 12. [Google Scholar] [CrossRef]
  19. Vieira, C.S.; Ferreira, F.B.; Pereira, P.M.; Lopes, M.D.L. Pullout Behaviour of Geosynthetics in a Recycled Construction and Demolition Material—Effects of Cyclic Loading. Transp. Geotech. 2020, 23, 100346. [Google Scholar] [CrossRef]
  20. Perkins, S.W.; Cuelho, E.V. Soil-Geosynthetic Interface Strength and Stiffness Relationships from Pullout Tests. Geosynth. Int. 1999, 6, 321–346. [Google Scholar] [CrossRef]
  21. Palmeira, E.M. Bearing Force Mobilisation in Pull-out Tests on Geogrids. Geotext. Geomembr. 2004, 22, 481–509. [Google Scholar] [CrossRef]
  22. Chen, C.; McDowell, G.R.; Thom, N.H. Investigating Geogrid-Reinforced Ballast: Experimental Pull-out Tests and Discrete Element Modelling. Soils Found. 2014, 54, 1–11. [Google Scholar] [CrossRef]
  23. Abdi, M.R.; Zandieh, A.R. Experimental and Numerical Analysis of Large Scale Pull out Tests Conducted on Clays Reinforced with Geogrids Encapsulated with Coarse Material. Geotext. Geomembr. 2014, 42, 494–504. [Google Scholar] [CrossRef]
  24. Sukmak, K.; Sukmak, P.; Horpibulsuk, S.; Chinkulkijniwat, A.; Arulrajah, A.; Shen, S.L. Pullout Resistance of Bearing Reinforcement Embedded in Marginal Lateritic Soil at Molding Water Contents. Geotext. Geomembr. 2016, 44, 475–483. [Google Scholar] [CrossRef]
  25. Ferreira, F.B.; Vieira, C.S.; Lopes, M.L.; Carlos, D.M. Experimental Investigation on the Pullout Behaviour of Geosynthetics Embedded in a Granite Residual Soil. Eur. J. Environ. Civ. Eng. 2016, 20, 1147–1180. [Google Scholar] [CrossRef]
  26. Vieira, C.S.; Pereira, P.; Ferreira, F.; de Lurdes Lopes, M. Pullout Behaviour of Geogrids Embedded in a Recycled Construction and Demolition Material. Effects of Specimen Size and Displacement Rate. Sustainability 2020, 12, 3825. [Google Scholar] [CrossRef]
  27. Raju, D.M.; Fannin, R.J. Monotonic and Cyclic Pull-out Resistance of Geogrids. Geotechnique 1997, 47, 331–337. [Google Scholar] [CrossRef]
  28. Moraci, N.; Cardile, G. Influence of Cyclic Tensile Loading on Pullout Resistance of Geogrids Embedded in a Compacted Granular Soil. Geotext. Geomembr. 2009, 27, 475–487. [Google Scholar] [CrossRef]
  29. Cardile, G.; Pisano, M.; Moraci, N. The Influence of a Cyclic Loading History on Soil-Geogrid Interaction under Pullout Condition. Geotext. Geomembr. 2019, 47, 552–565. [Google Scholar] [CrossRef]
  30. Nayeri, A.; Fakharian, K. Study on Pullout Behavior of Uniaxial HDPE Geogrids Under Monotonic and Cyclic Loads. Int. J. Civ. Eng. 2009, 7, 211–223. [Google Scholar]
  31. Moraci, N.; Cardile, G. Deformative Behaviour of Different Geogrids Embedded in a Granular Soil under Monotonic and Cyclic Pullout Loads. Geotext. Geomembr. 2012, 32, 104–110. [Google Scholar] [CrossRef]
  32. Ferreira, F.; Vieira, C.; De Lurdes Lopes, M. Cyclic and Post-Cyclic Shear Behaviour of a Granite Residual Soil—Geogrid Interface. Procedia Eng. 2016, 143, 379–386. [Google Scholar] [CrossRef]
  33. Koshy, N.; Unnikrishnan, N. Geosynthetics Under Cyclic Pullout and Post-Cyclic Monotonic Loading. Int. J. Geosynth. Ground Eng. 2016, 2, 13. [Google Scholar] [CrossRef]
  34. Garcia, G.F.N.; Lodi, P.C. Post-Cycling Interface Strength Test of Geogrids. Int. J. Civ. Eng. 2020, 18, 827–834. [Google Scholar] [CrossRef]
  35. Ferreira, F.B.; Vieira, C.S.; Lopes, M.L.; Ferreira, P.G. HDPE Geogrid-Residual Soil Interaction under Monotonic and Cyclic Pullout Loading. Geosynth. Int. 2020, 27, 79–96. [Google Scholar] [CrossRef]
  36. Jewell, R.A. Reinforcement Bond Capacity. Geotechnique 1990, 40, 513–518. [Google Scholar] [CrossRef]
  37. Portelinha, F.H.M.; Pereira, V.R.G.; Correia, N.S. Small-Scale Pullout Test of a Geogrid-Reinforced Unsaturated Soil with Suction Monitoring. Geotech. Test. J. 2018, 41, 787–804. [Google Scholar] [CrossRef]
  38. Marques, G.S.; Lins da Silva, J. Interaction Between a Lateritic Soil and a Non-Woven Geotextile in Different Moisture Conditions. Front. Built Environ. 2020, 6, 116. [Google Scholar] [CrossRef]
  39. Kakuda, F.M. Geogrid Pullout Tests Using Reduced Scale Equipment. Master’s Thesis, University of São Paulo, São Carlos, SP, Brazil, 2006. (In Portuguese). [Google Scholar]
  40. ASTM D6706-01; Standard Test Method for Measuring Geosynthetic Pullout Resistance in Soil. ASTM International: West Conshehawken, PA, USA, 2021.
  41. ASTM D4767-11; Standard Test Method for Consolidated Undrained Triaxial Compression Test for Cohesive Soils. ASTM International: West Conshehawken, PA, USA, 2020.
  42. ASTM D7181-20; Standard Test Method for Consolidated Drained Triaxial Compression Test for Soils. ASTM International: West Conshehawken, PA, USA, 2020.
  43. Abdi, M.R.; Sadrnejad, A.; Arjomand, M.A. Strength Enhancement of Clay by Encapsulating Geogrids in Thin Layers of Sand. Geotext. Geomembr. 2009, 27, 447–455. [Google Scholar] [CrossRef]
  44. Abdi, M.R.; Arjomand, M.A. Pullout Tests Conducted on Clay Reinforced with Geogrid Encapsulated in Thin Layers of Sand. Geotext. Geomembr. 2011, 29, 588–595. [Google Scholar] [CrossRef]
  45. Teixeira, H.S.C. Construction and Calibration of a Large Pullout Test Device. Master’s Thesis, University of São Paulo, São Carlos, SP, Brazil, 1999. (In Portuguese). [Google Scholar]
  46. ASTM D7499/D7499M-09; Standard Test Method for Measuring Geosynthetic-Soil Resilient Interface Shear Stiffness. ASTM International: West Conshehawken, PA, USA, 2014.
  47. Razzazan, S.; Keshavarz, A.; Mosallanezhad, M. Pullout Behavior of Polymeric Strip in Compacted Dry Granular Soil under Cyclic Tensile Load Conditions. J. Rock Mech. Geotech. Eng. 2018, 10, 968–976. [Google Scholar] [CrossRef]
  48. Wang, Z.; Jacobs, F.; Ziegler, M. Visualization of Load Transfer Behaviour between Geogrid and Sand Using PFC2D. Geotext. Geomembr. 2014, 42, 83–90. [Google Scholar] [CrossRef]
  49. Giroud, J.P.; Asce, M.; Han, J. Design Method for Geogrid-Reinforced Unpaved Roads. I. Development of Design Method. J. Geotech. Geoenv. Eng. 2004, 130, 775–786. [Google Scholar] [CrossRef]
Figure 1. Particle size distribution curves of soils A and B.
Applsci 14 05861 g001
Figure 2. Large-scale pullout test apparatus: (a) overall view; (b) inextensible wires fixed along the GGR.
Applsci 14 05861 g002
Figure 3. Small-scale pullout test apparatus: (a) overall view; (b) inextensible wires over the GGR length.
Applsci 14 05861 g003
Figure 4. Measured points of GGR displacement: (a) large equipment; (b) small equipment.
Applsci 14 05861 g004
Figure 5. Schematic profile view: (a) small equipment; (b) large equipment.
Applsci 14 05861 g005
Figure 6. Clamping system: (a) clamp apparatus; (b) installed clamp system.
Applsci 14 05861 g006
Figure 7. Displacement instrumentation response: (a) small box (σn = 50 kPa); (b) large box (σn = 50 kPa).
Applsci 14 05861 g007
Figure 8. Monotonic pullout force versus frontal displacement of geogrid in small (SB) and large (LB) pullout boxes.
Applsci 14 05861 g008
Figure 9. Evolution of maximum pullout shear stress with applied normal stress.
Applsci 14 05861 g009
Figure 10. Confined tensile stiffness as a function of geogrid strain: (a) σn = 25 kPa; (b) σn = 50 kPa; and (c) σn = 100 kPa.
Applsci 14 05861 g010
Figure 11. Post-cyclic pullout resistance: (a) σn = 25 kPa; (b) σn = 100 kPa.
Applsci 14 05861 g011
Figure 12. Comparison of interface apparent coefficient of friction (μs/GSY) under monotonic and post-cyclic loading conditions.
Applsci 14 05861 g012
Table 1. Soil characteristics.
PropertyUnitSoil ASoil B
Classification (USCS)-MHSC
Specific gravity, GS-2.9132.646
Liquid limit, wL%5516
Plastic limit, wP%32-
Maximum dry unit weight, γd,máxg/cm31.6261.983
Optimum water content, wop%22.759.24
Friction angle, ϕº2731
Cohesion, ckPa66.2734.64
Table 2. Geogrid properties.
PropertyUnitValue
Polymer-PP
Thicknessmm1.05
Mean grid sizemm45 × 45
Short-term tensile strengthkN/m43.24
Elongation at maximum load%5.75
Secant stiffness at 5% strainkN/m523
Table 3. Summary of monotonic test results.
TestPR (kN/m)uPR (mm)JC2% (kN/m)τi (kPa)μs/GSYσn (kPa)Equipment
115.6827.1672536.471.4625SB
222.1925.5577951.611.0350SB
327.5715.8283864.120.64100SB
420.9028.0763241.811.6725LB
526.7020.0568653.401.0650LB
628.938.1985259.730.58100LB
Table 4. Summary of cyclic/post-cyclic test results.
TestPR (kN/m)τcycmon (kPa)μs/GSYσn (kPa)Equipment
115.981.121.4825SB
220.501.061.6425LB
322.390.950.60100SB
427.350.970.55100LB
Table 5. Ratios between the results from small and large equipment (SB/LB).
Monotonicσn = 25 kPaσn = 50 kPaσn = 100 kPa
PR0.750.830.95
τi0.870.971.07
μs/GSY0.870.971.11
Cyclic/post-cyclicσn = 25 kPa σn = 100 kPa
PR0.78 0.94
τi0.92 1.06
μs/GSY0.91 1.10
Disclaimer/Publisher’s Note: The statements, opinions and data contained in all publications are solely those of the individual author(s) and contributor(s) and not of MDPI and/or the editor(s). MDPI and/or the editor(s) disclaim responsibility for any injury to people or property resulting from any ideas, methods, instructions or products referred to in the content.

