Article

Influence of Improved Particle Breakage Index on Deformation Strength Characteristics of Soil-Rock Mixtures

State Key Laboratory of Eco-Hydraulics in Northwest Arid Region, Xi’an University of Technology, Xi’an 710048, China
*
Author to whom correspondence should be addressed.
Appl. Sci. 2024, 14(13), 5899; https://doi.org/10.3390/app14135899
Submission received: 15 May 2024 / Revised: 30 June 2024 / Accepted: 3 July 2024 / Published: 5 July 2024

Abstract

:
A large-scale triaxial shear test was performed on a waste slag dam created from the accumulation of waste slag during the construction of a pumped-storage power station. By integrating previous experience, the particle breakage index was refined to study the relationship between particle breakage and the deformation strength characteristics of the soil-rock mixture under different dry densities and stress states. The results show that as the confining pressure increases, various dry densities enhance particle breakage, leading to a transition from initial dilatancy to shear shrinkage in the soil-rock mixture. This change results in a decrease in the nonlinear internal friction angle and a decrease in the shear strength. This research explores the shear failure mechanism caused by the breakage of soil-rock mixtures. Examination of the particle grade before and after shearing shows that the extent of particle breakage expands with higher confining pressure, especially within the 20~60 mm grain size range. The fractal dimension is calculated concurrently, showing a strong correlation with the breakage index. The concepts of the phase transition stress ratio and failure dilatancy ratio were applied to describe the deformation characteristics. Experimental results demonstrate that the influence of the phase transition stress ratio on the dilatancy becomes more significant with increased dry density, yet this effect diminishes with higher confining pressure. As the breakage index increases, the failure dilatancy rate decreases following a power function, resulting in a gradual reduction in the dilatancy phenomenon. Considering the substantial influence of clay particles on the cohesion of the soil-rock mixture and the negligible effect of breakage on fine particles, it is proposed that the cohesion remains unchanged for determining the friction parameter. With increasing breakage index, the internal friction angle decreases nonlinearly, weakening the shear strength. This analysis shows that the refined particle breakage index effectively captures the particle breakage characteristics of soil-rock mixtures, providing valuable insights into the deformation and strength characteristics of engineering structures affected by particle breakage.

1. Introduction

In the construction of pumped-storage power stations, a significant quantity of waste slag is generated, forming a loose structure that is prone to particle breakage under load. This can lead to changes in the slag’s gradation and structure, ultimately affecting overall stability. Hazardous conditions such as strong rains and floods can trigger landslides, mud/rock flows, and other geological disasters, posing serious threats to both property and safety. Therefore, an experimental study is currently underway to analyze the characteristics of particle breakage and the development of soil-rock mixtures under load. The aim is to gain insights that can be used to address the safety and stability concerns associated with waste slag dams.
An accurate characterization of the extent of particle breakage is essential for analyzing the patterns of particle breakage. The particle breakage index serves as an effective tool for assessing the degree of particle breakage. Marsal [1] proposed the breakage index Bg as a measure of overall particle breakage. Bg is a fundamental, easily accessible, and widely applicable metric. However, it does not accurately represent the specific changes occurring within each particle group. Hardin [2] introduced the concept of the relative breakage rate Br, which takes into account the overall variations in the particle size distribution during breakage. Hardin’s relative breakage rate Br offers a more direct quantification of particle breakage compared to the breakage index Bg. Nevertheless, it should be noted that not all particles undergo breakage, which deviates from real-world conditions. Einav [3] introduced the notion of a limit grading curve, defining the particle breakage potential Sg as the area between the limit grading curve and the initial grading curve [4]. The limit grading index BE, ranging from 0 to 1, is suitable for comparing and evaluating the degree of particle breakage in different soils. However, determining the ultimate grading curve of the soil sample requires additional testing, which can be challenging. Guo et al. [5] examined the equation for the ultimate grading breakage index BE and proposed a new breakage index, BW. This new index, which captures the characteristics of the original grading curve, reduces the need for extensive experimental calculations of the ultimate grading curve, offering a simpler and more practical solution. The value range of the breakage index, from 0 to infinity, is not suitable for comparing the degree of particle breakage. By summarizing the advantages and disadvantages of the above breakage indexes, the latest breakage index, BW, can be modified to better express the degree of particle breakage and used for particle breakage comparison.
Scholars [6,7,8,9] have recently conducted comprehensive tests to describe the mechanical characteristics and parameters that influence soil-rock mixtures. In one study, Tu et al. [7] performed extensive direct shear testing on soil-rock mixtures with varying stone percentages. They were able to establish a correlation between the relative breakage rate, normal stress, and stone content. The results indicate that particle breakage increases with increasing normal stress and stone content. Another study by Lei et al. [8] utilized laboratory testing to develop a direct shear numerical model for analyzing the strength parameters of soil-rock mixtures. They also quantified particle breakage and demonstrated a hyperbolic connection with normal stress. Microscopic analysis revealed that the soil-rock mixture experiences both tensile and shear failure under shear stress.
Despite compositional differences, previous academic studies [10,11,12,13,14,15] on soil-rock mixtures and similar materials have shown consistent mechanical characteristics. These findings offer valuable insights for further research on soil-rock mixtures. SUITS et al. [10] and Jiang et al. [11] studied the effect of scaling on the shear strength of coarse-grained soil and reported that the shear strength index is strongly influenced by the particle size. Cai et al. [12] investigated the particle breakage of rockfill during triaxial shear testing under varying conditions of gradation, relative density, and confining pressure. Their findings demonstrated that particle breakage is significantly affected by gradation and confining pressure. They developed a relationship function based on fractal dimension to analyze the strength and dilatancy characteristics of the gradation and confining pressure. Additionally, Guo et al. [13] developed a relationship between the breakage index and the gradation equation using the concept of the gradation equation. They established an evolution model of gradation with stress–strain by establishing a relationship function between the breakage index and stress–strain state. This model can be used to predict the change in the particle breakage process during the shear stage. Liang et al. [15] established the repeated compaction characteristic curve of graded macadam through repeated compaction and screening of graded macadam. The correlation between fractal dimension of particle size distribution and repeated compaction times, water content, and dry density were analyzed.
Particle breakage in granular soil-rock mixtures is a critical engineering parameter that significantly influences their strength and deformation characteristics [16,17,18]. A precise characterization of this parameter is essential for analyzing the engineering strength and stability of such mixtures. To gain a better understanding of the particle breakage law during triaxial shearing of soil-rock mixtures, the breakage index BW, introduced by Guo et al. [5], is enhanced to more accurately measure the particle breakage characteristics. This improvement aims to simplify the particle breakage index test and facilitate a comparative evaluation of the degree of particle breakage. Furthermore, a fractal dimension will be employed to validate the test’s validity. The dilatancy characteristics will be elucidated by examining the phase transition stress ratio under different dry density and confining pressure conditions. The gradations before and after shear will also be analyzed. This paper investigates the deformation strength characteristics of soil-rock mixtures using an improved breakage index, BC. The concept of the failure dilatancy rate is introduced, demonstrating the correlation between the breakage index and failure dilatancy rate and explaining its dilatancy behavior. This study establishes a link between the breakage index and the nonlinear internal friction angle to demonstrate the shear strength of the sample.

2. Introduced the Improved Particle Breakage Index BC

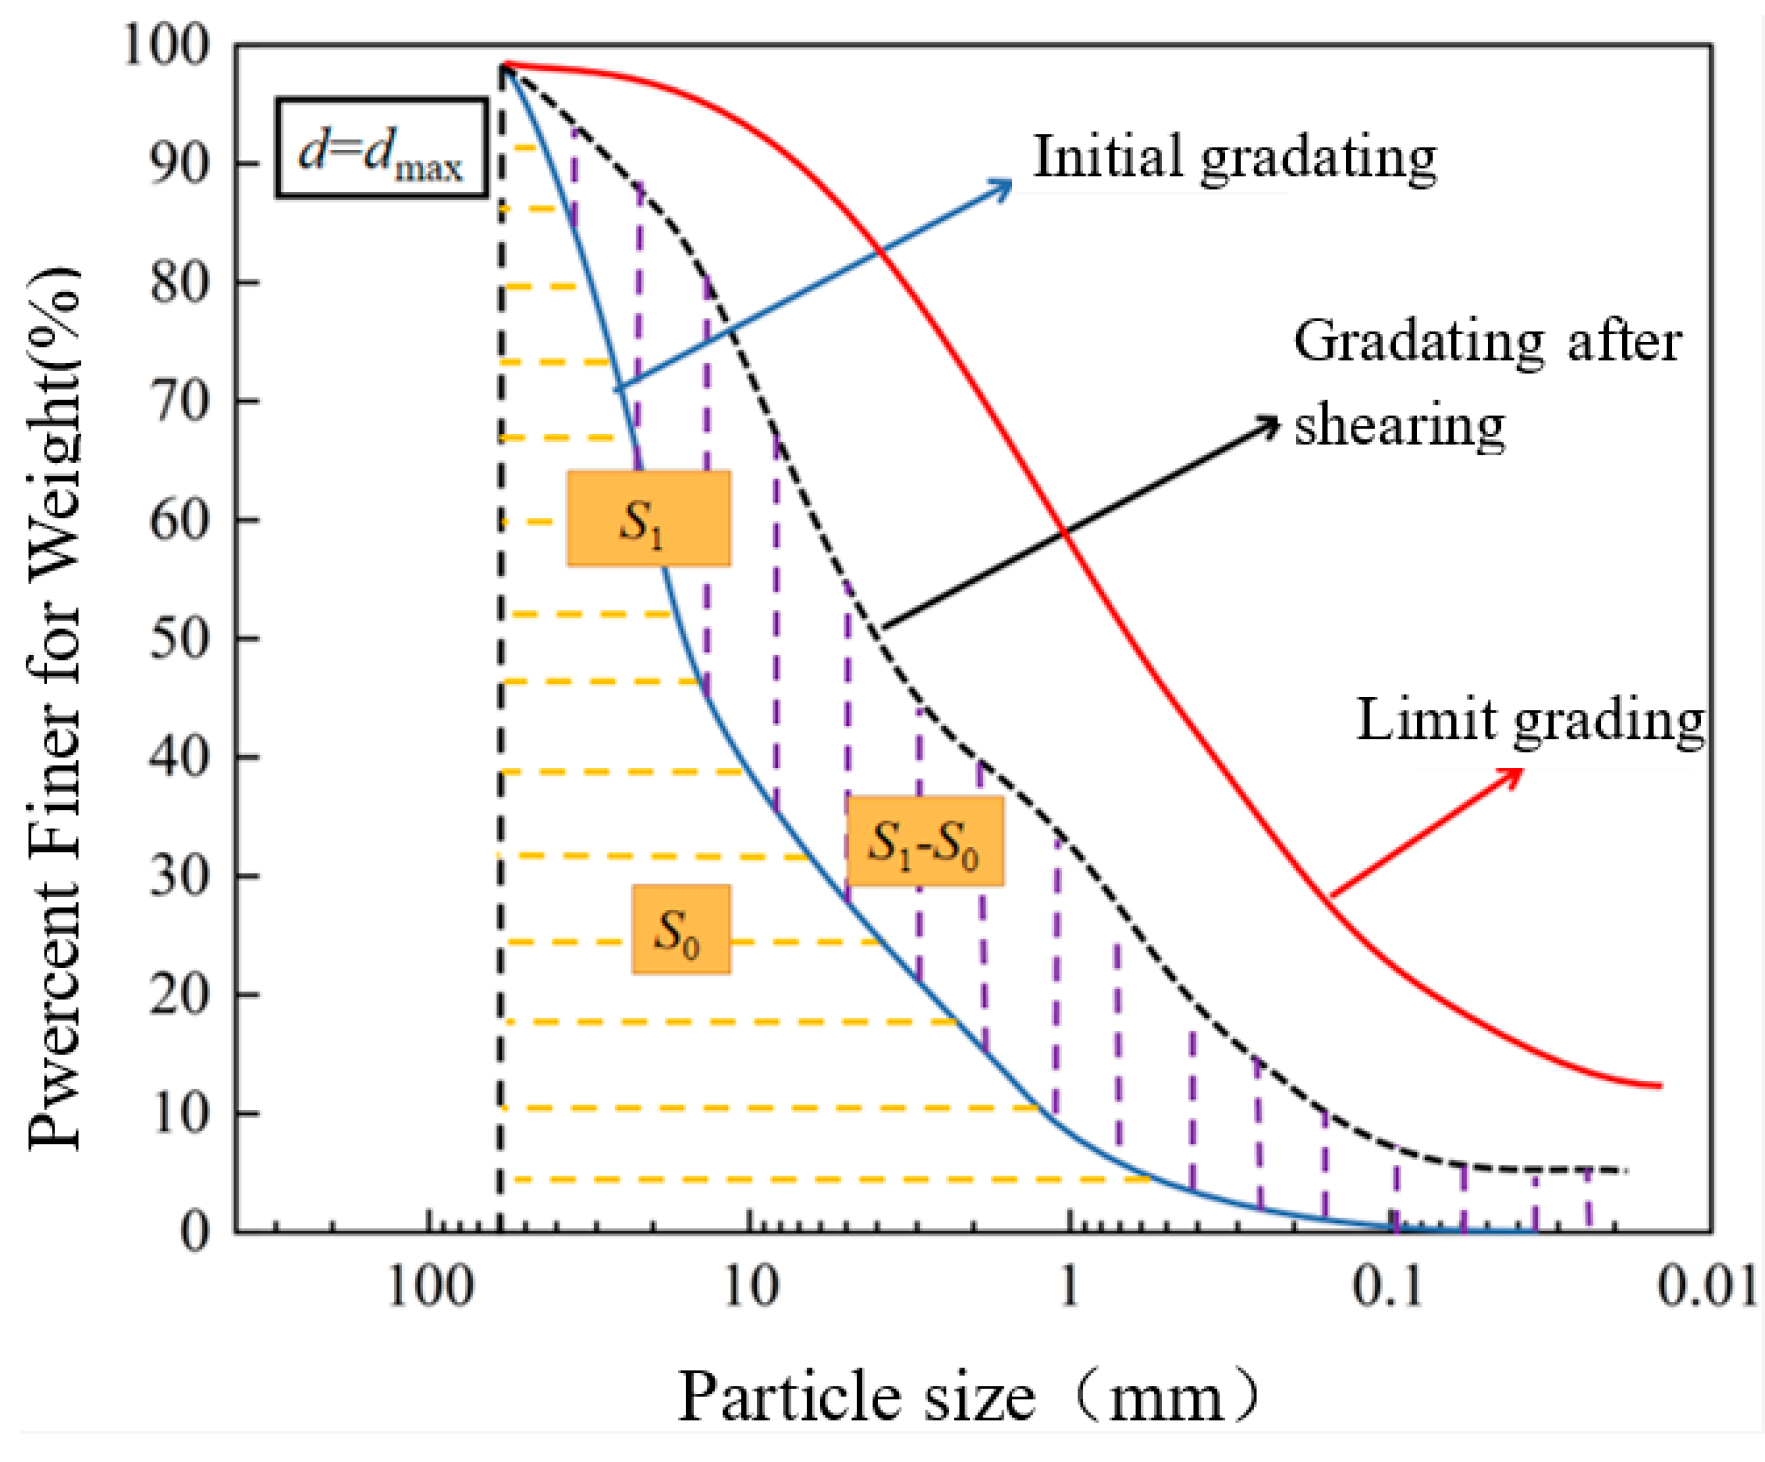
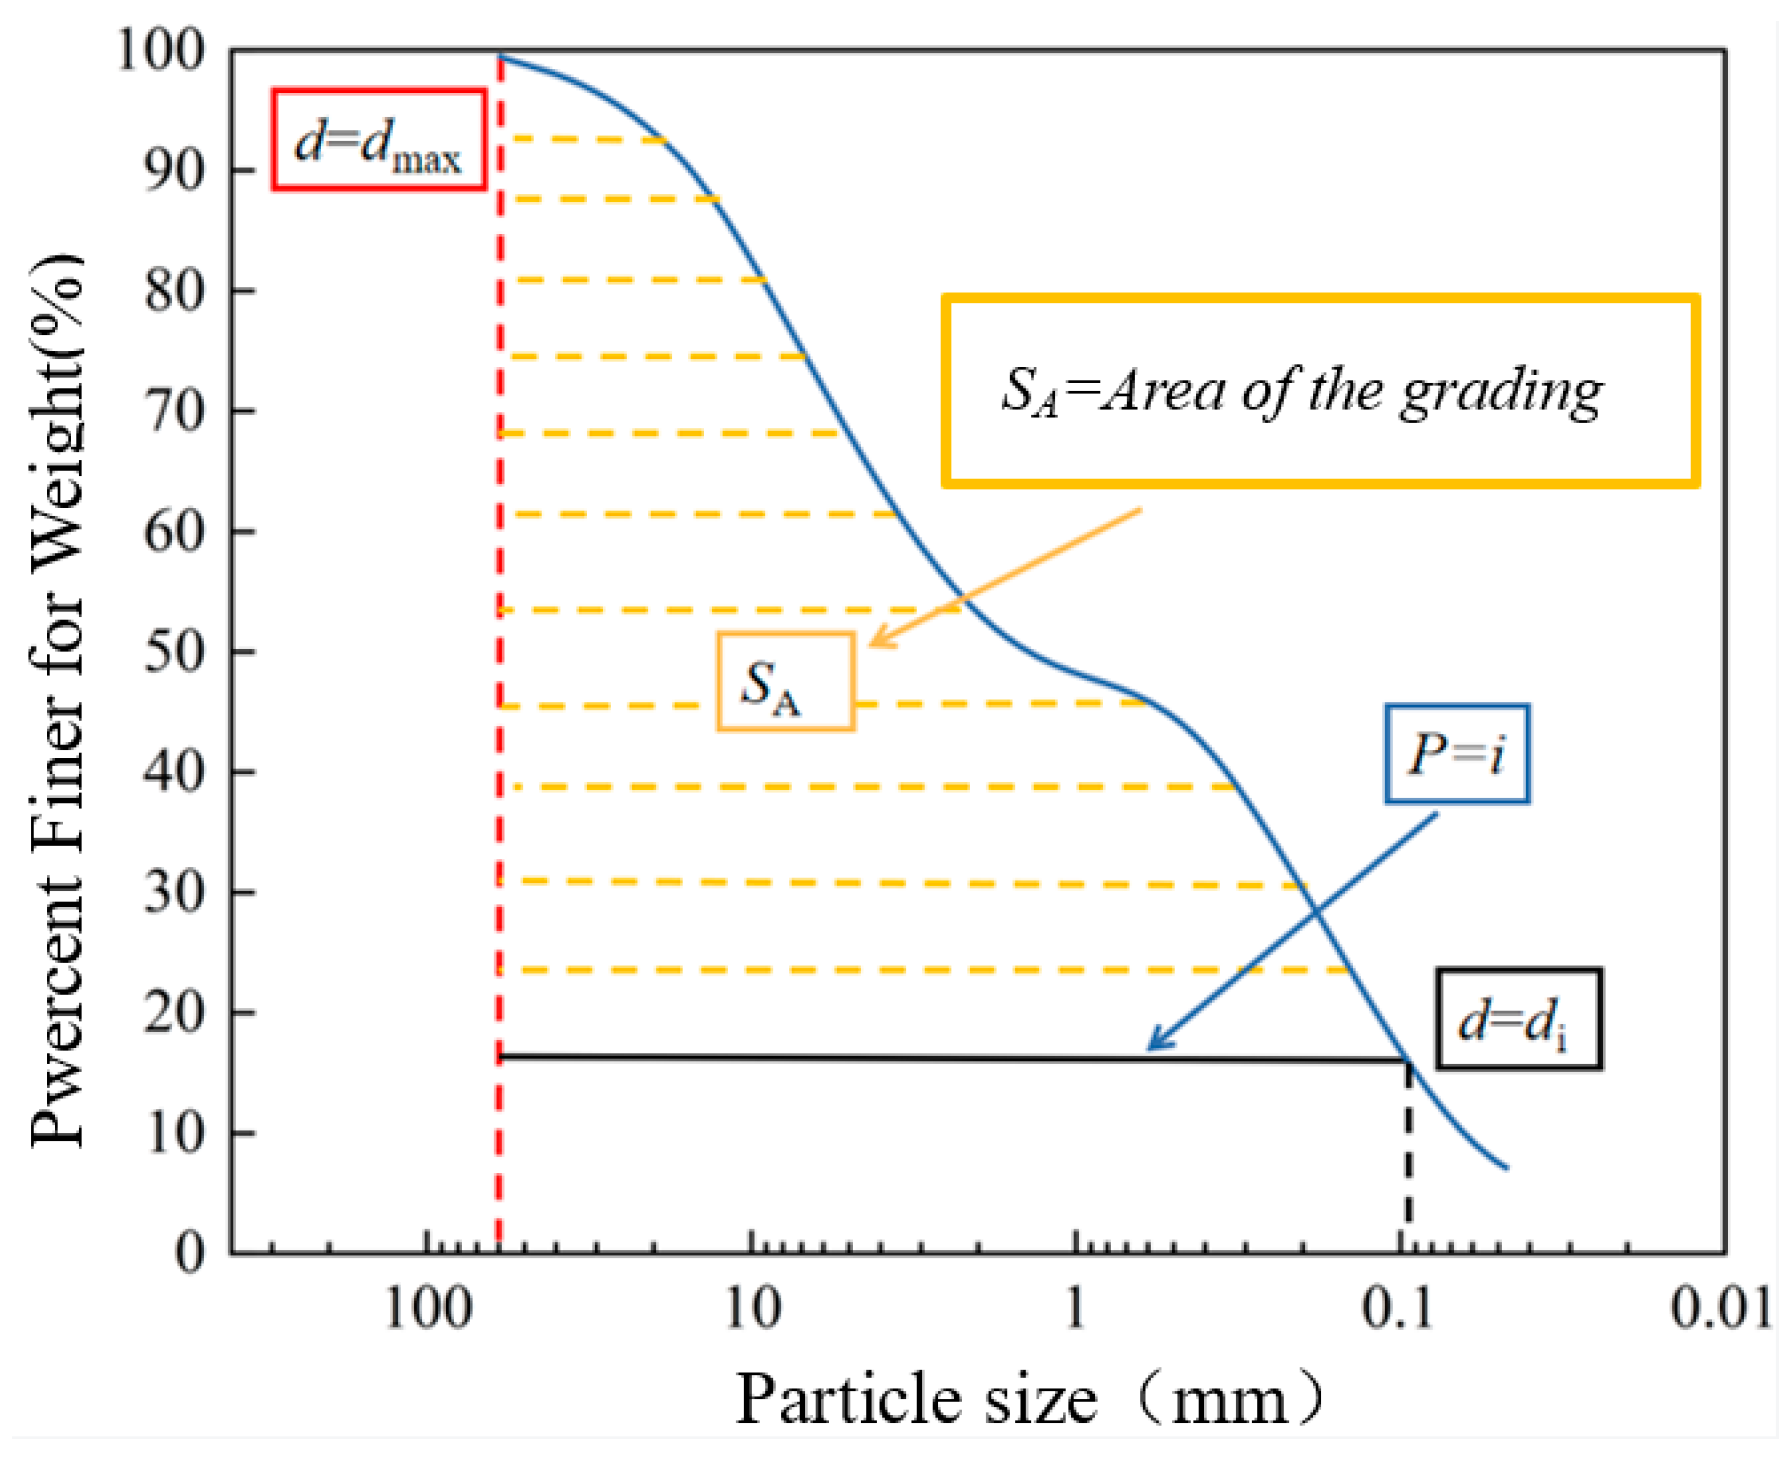
2.1. Improved the Definition of the Breakage Index

The particle breakage index is a quantitative measure used to characterize the degree and properties of particle breakage. With regard to the breakage index BW suggested by Guo et al. [5]:
B W = S 1 S 0 S 0
The modified curve captures the characteristics of the original grading curve and minimizes the need for additional experimental calculations of the limit grading curve, making it a simple and practical solution. However, because the breakage index BW ranges from 0 to infinity, it is not suitable for comparing or evaluating the degree of particle breakage. To address this limitation, the following improvements are made to the BW suggested by Guo et al. [5]. Based on this, the breakage index BC is proposed:
B C = S 1 S 0 S 1
where the starting grading curve is S0, the grading curve after the test is S1, and the area enclosed by the maximum particle size is d = dmax. As shown in Figure 1.
The theoretical value range of BC is defined as between 0 and 1. A value of BC = 0 indicates an unbroken state, while BC = 1 signifies full breakage and reflects the complete shift in gradation. This revised index is straightforward and practical. Muir Wood et al. [19] introduced the breakage index IG, which is calculated as the ratio of the area between the shear particle-grading curve and the maximum particle size line to the area between the limit particle-grading curve and the maximum particle size line. Although the forms of BC and IG may differ, their underlying cores are identical.

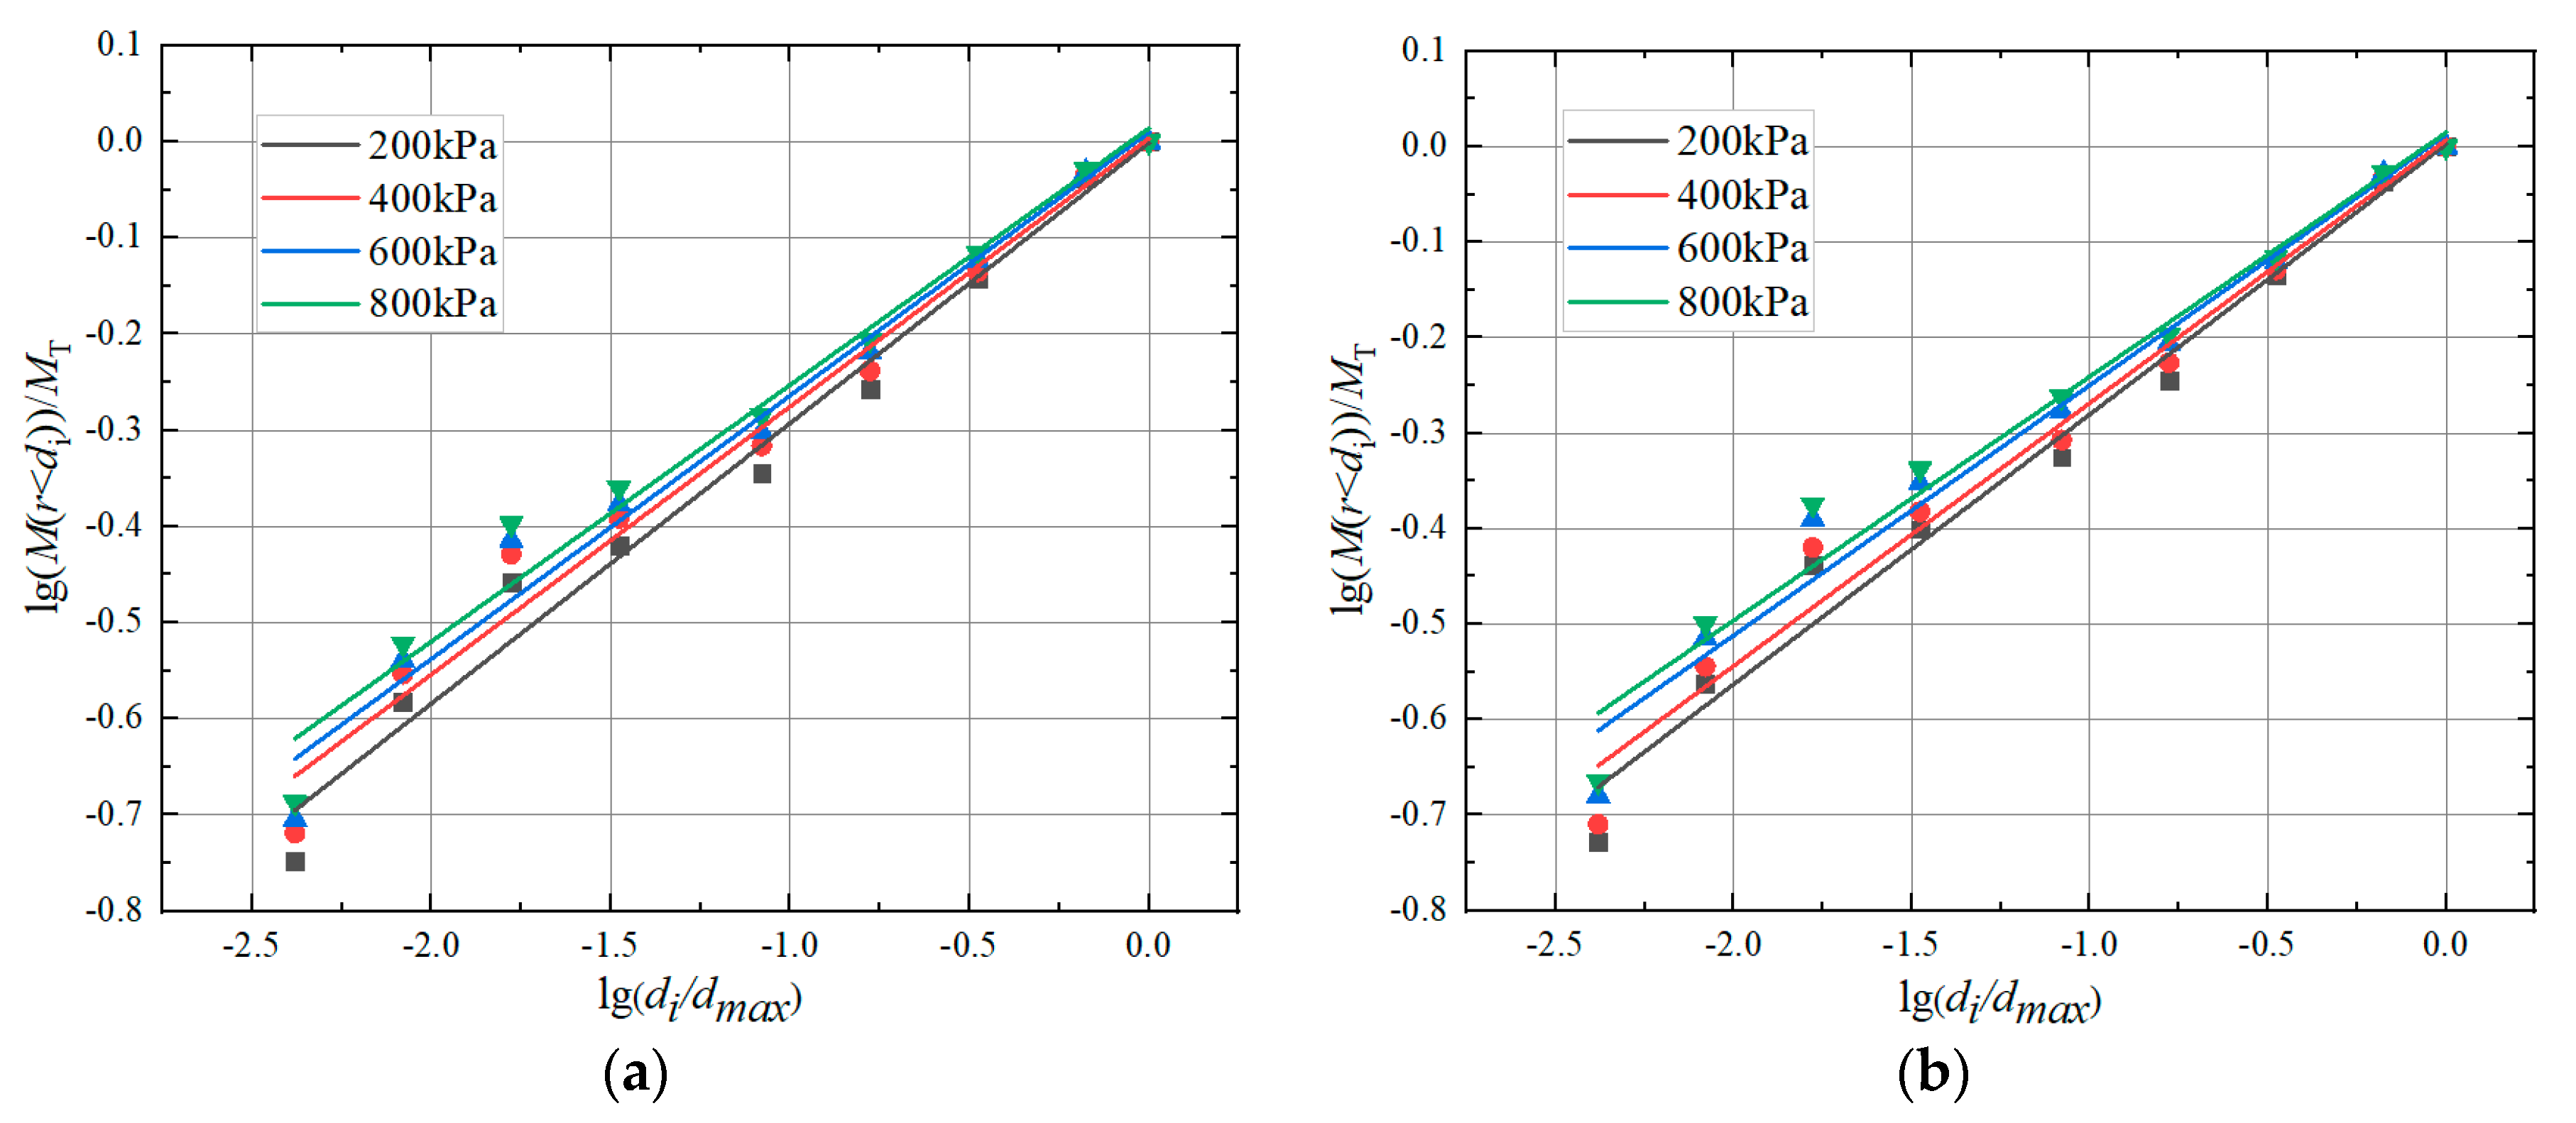
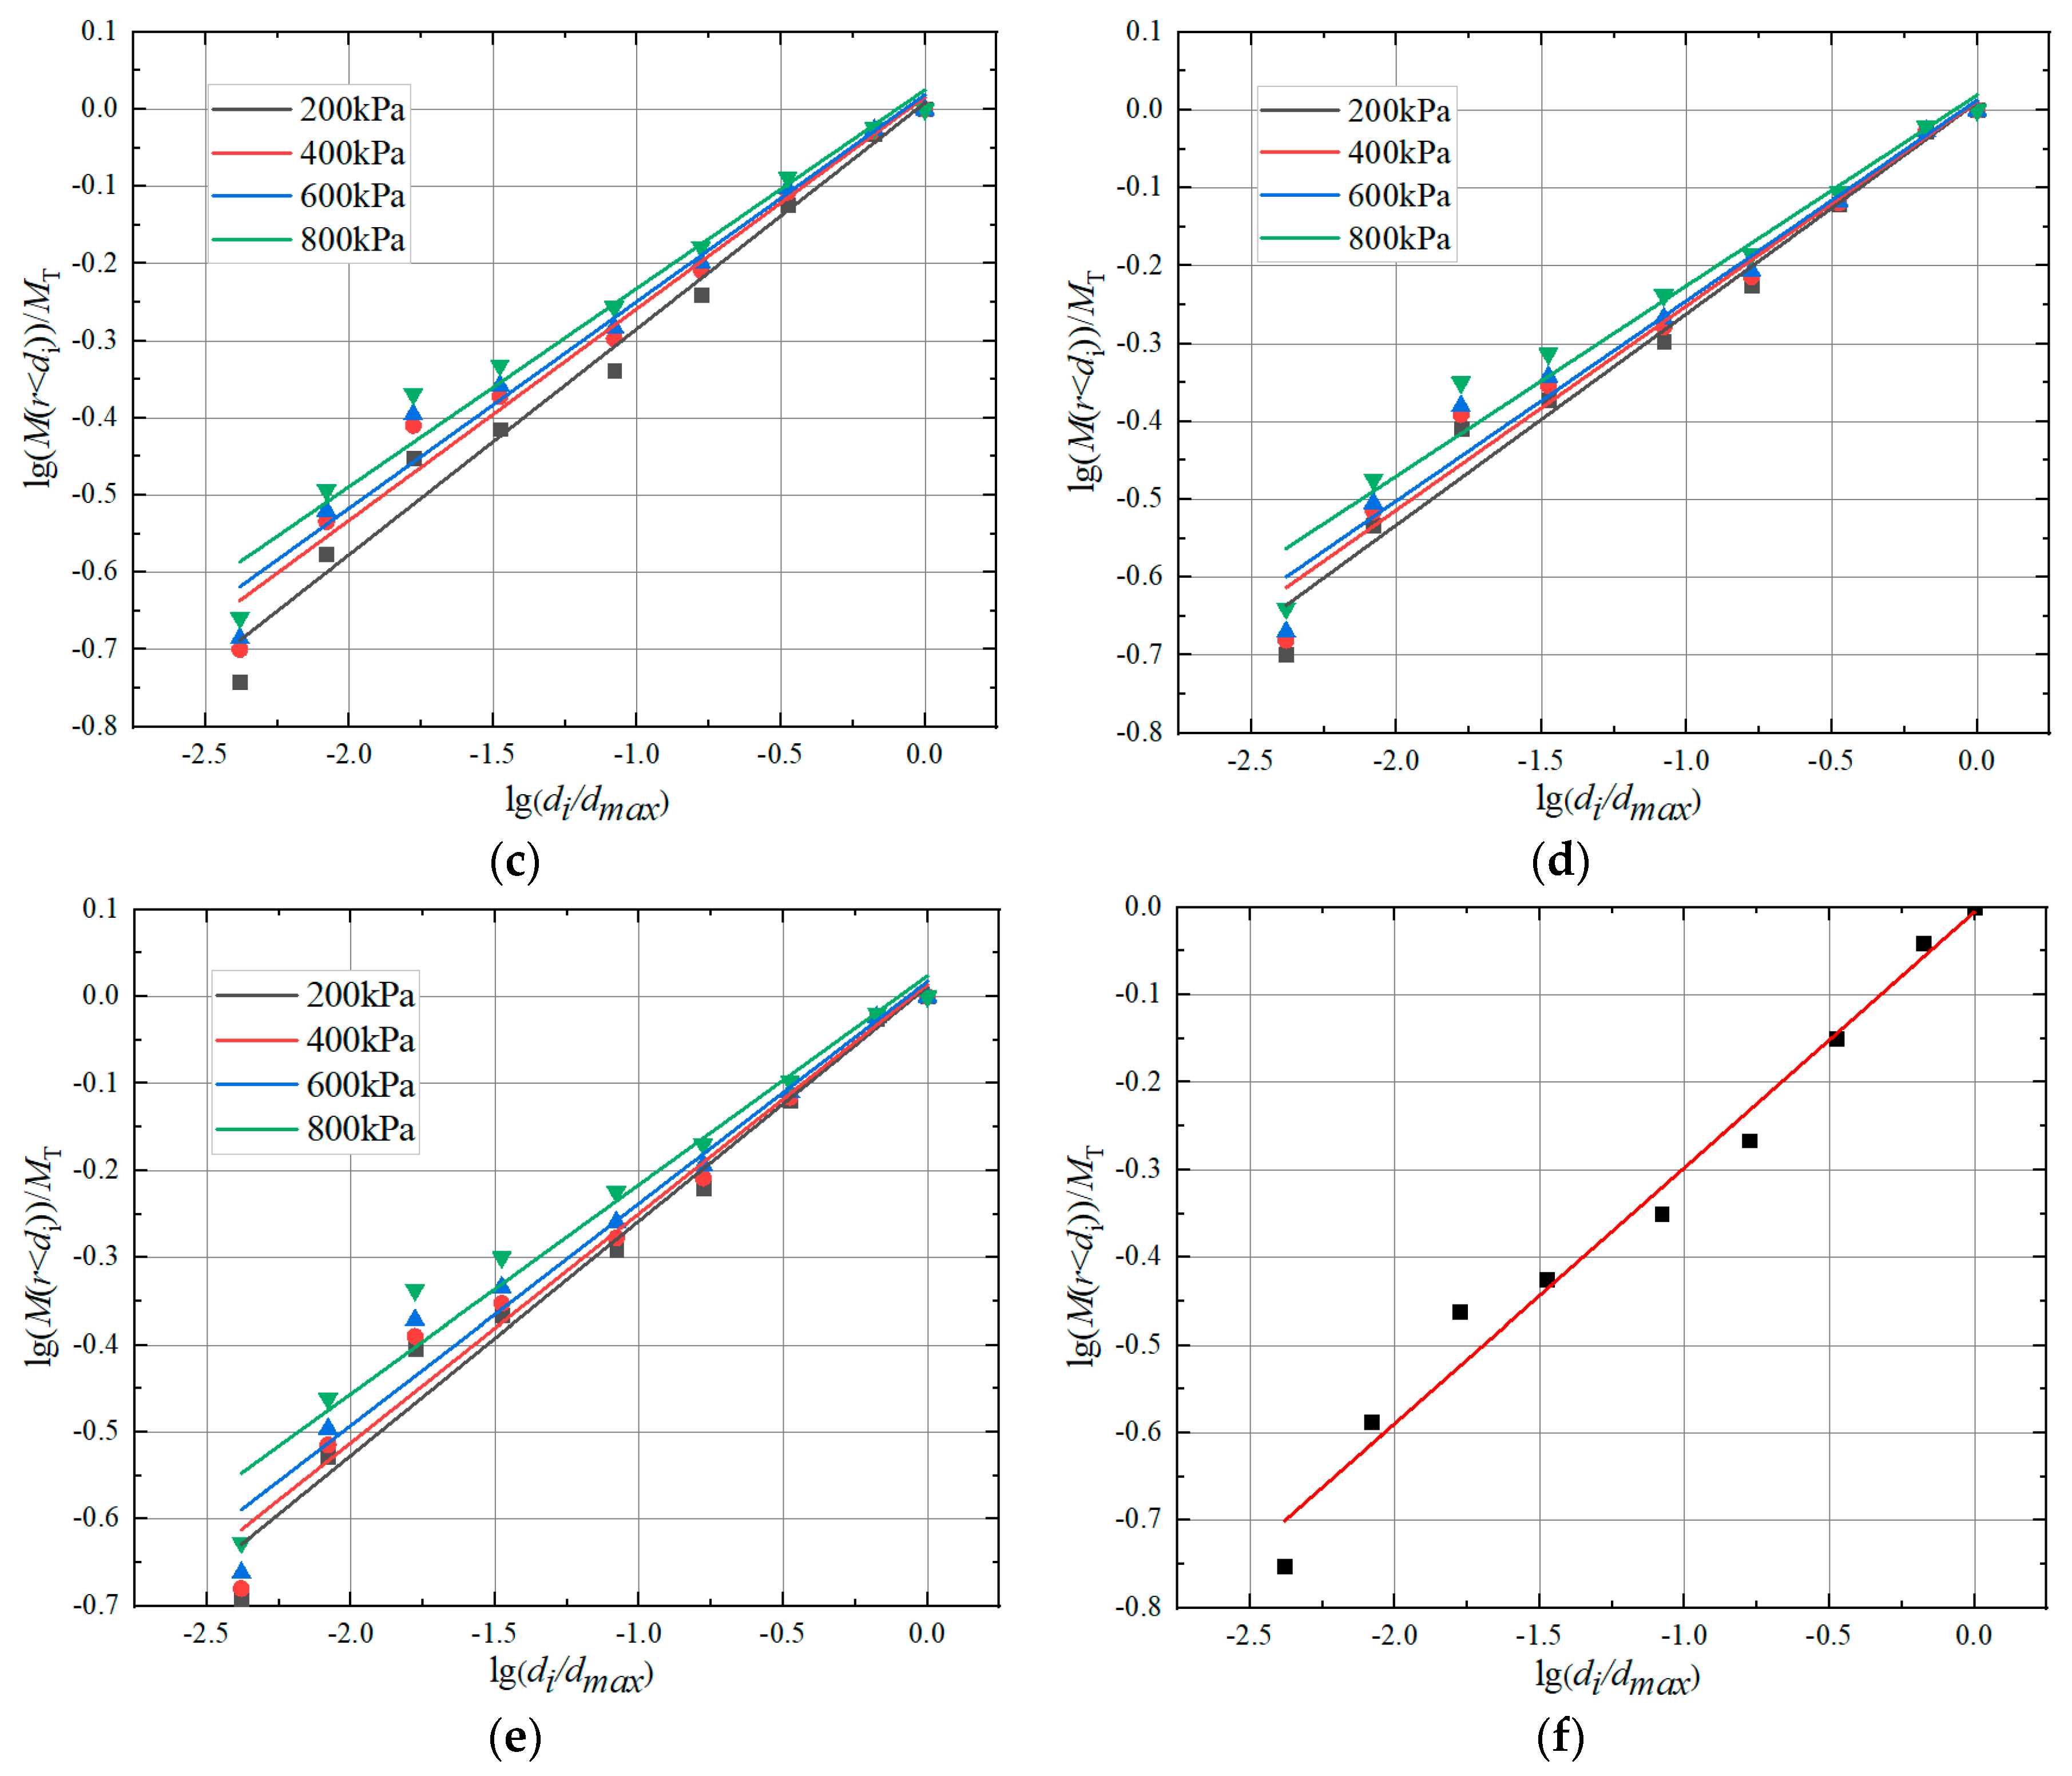
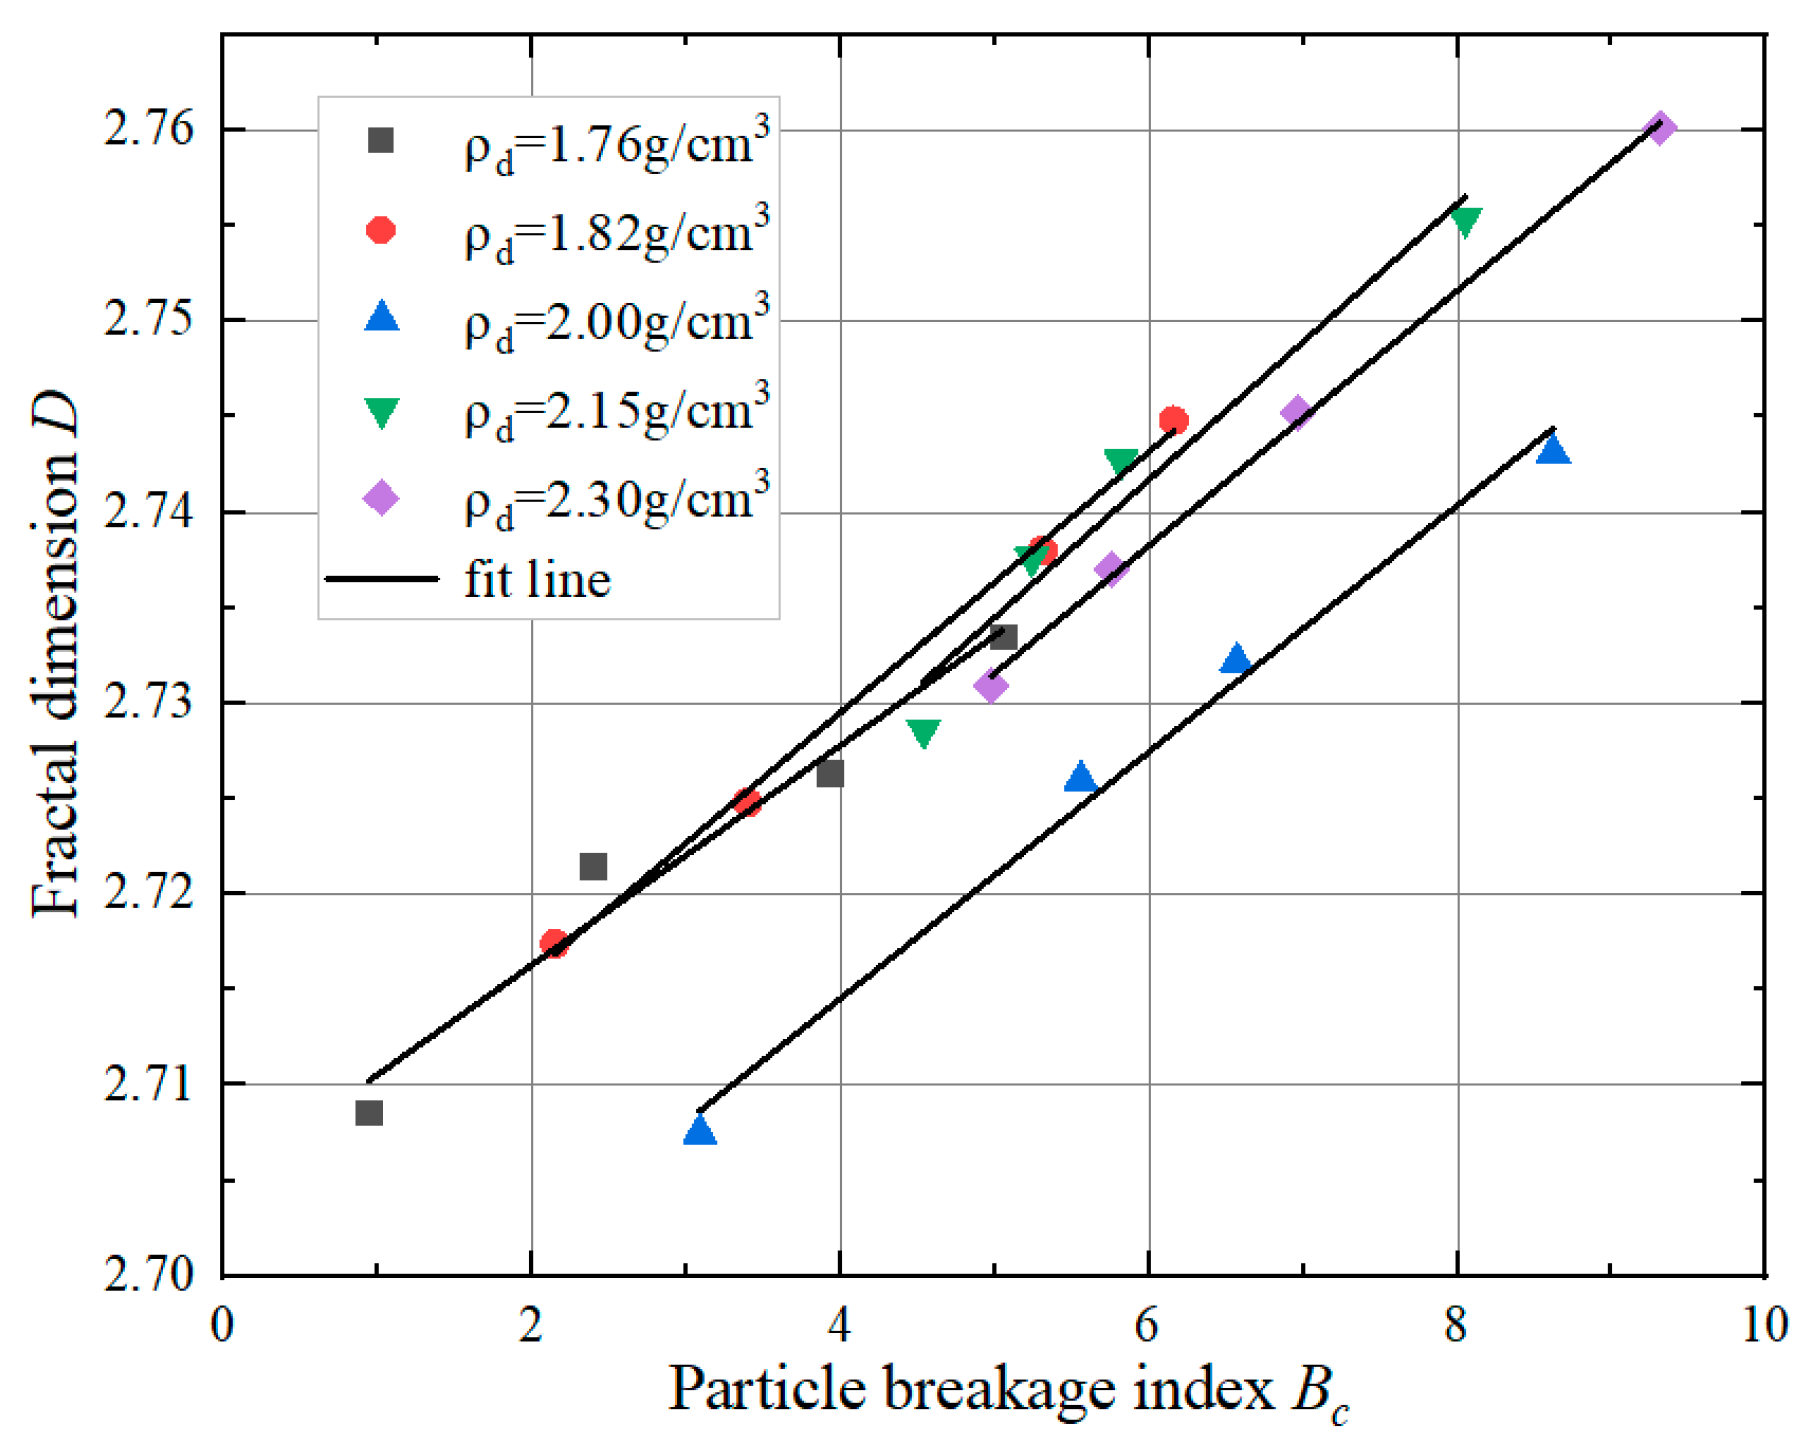
2.2. Improve the Quantitative Correlation between the Breakage Index BC and Fractal Dimension D

The concept of fractals was introduced by Mandelbrot [20] to explain the complex geometric patterns observed in nature. In the context of a mixture of earth and rock, internal particles experience uneven breakage when subjected to external loads. As a result, fractal dimension, a measure of complexity within fractal geometry, is used to objectively characterize particle breakage and determine the relationship between breakage and strength [21]. Tyler et al. [22] assumed that particle groups of varying sizes shared the same density and developed a mathematical model for particle fractal dimension.
lg M ρ   <   d i M T = 3 D lg ( d i d max )
where M ( ρ   <   d i ) represents the particle mass below a specific scale; M T is the total mass of particles in the sample; and d max is the largest particle size in the sample.
lg ( d i d max ) is plotted on the x-axis, and lg M ρ < d i M T is plotted on the y-axis, based on linear regression fitting a straight line with slope k in a type 3 − D graph. The slope k is determined to calculate the score dimension D [23].
The particle size di ranges from a minimum value of 0 mm to a maximum value that represents 100% soil content. When calculating the area using integration, the integral of P is taken over the interval [i, 1]. Then, let k approach 0 and find the limit, as shown in Figure 2. The grading curve area is represented in P-lgd coordinates:
S = lim i 0 S A = i 1 l g d m a x l g d i d P
where di is the particle size that corresponds to P = i.
By manipulating Equation (3) for the fractal dimension, we can derive:
l g d m a x l g d i = 1 3 D l g P
Replacing Equation (5) with Equation (4):
S = lim i 0 S A = i 1 1 3 D l g P d P
S = lim i 0 S A = 1 3 D i 1 ln P ln 10 d P
S = lim i 0 S A = 1 3 D 1 ln 10 i 1 ln P d P
By performing integration by parts as i approaches 0, we observe:
lim i 0 P = i 1 ( ln P ) d P = 1
Replacing Equation (9) with Equation (8) results in:
S = 1 ln 10 3 D
Replacing Equation (10) with Equation (2) results in:
B C = 1 ln 10 1 3 D c 1 3 D 0 1 ln 10 1 3 D c
Condense to:
B C = D c D 0 3 D 0
where DC represents the fractal dimension of the current gradation, D0 represents the fractal dimension of the beginning gradation, and DC and D0 can be determined using the fractal dimension of the test.
Equation (12) [24] establishes the relationship between the breakage index BC and the fractal dimension DC of the current gradation, serving as a transformation link.

3. Large-Scale Triaxial Test on the Shear Failure Characteristics of a Soil-Rock Mixture

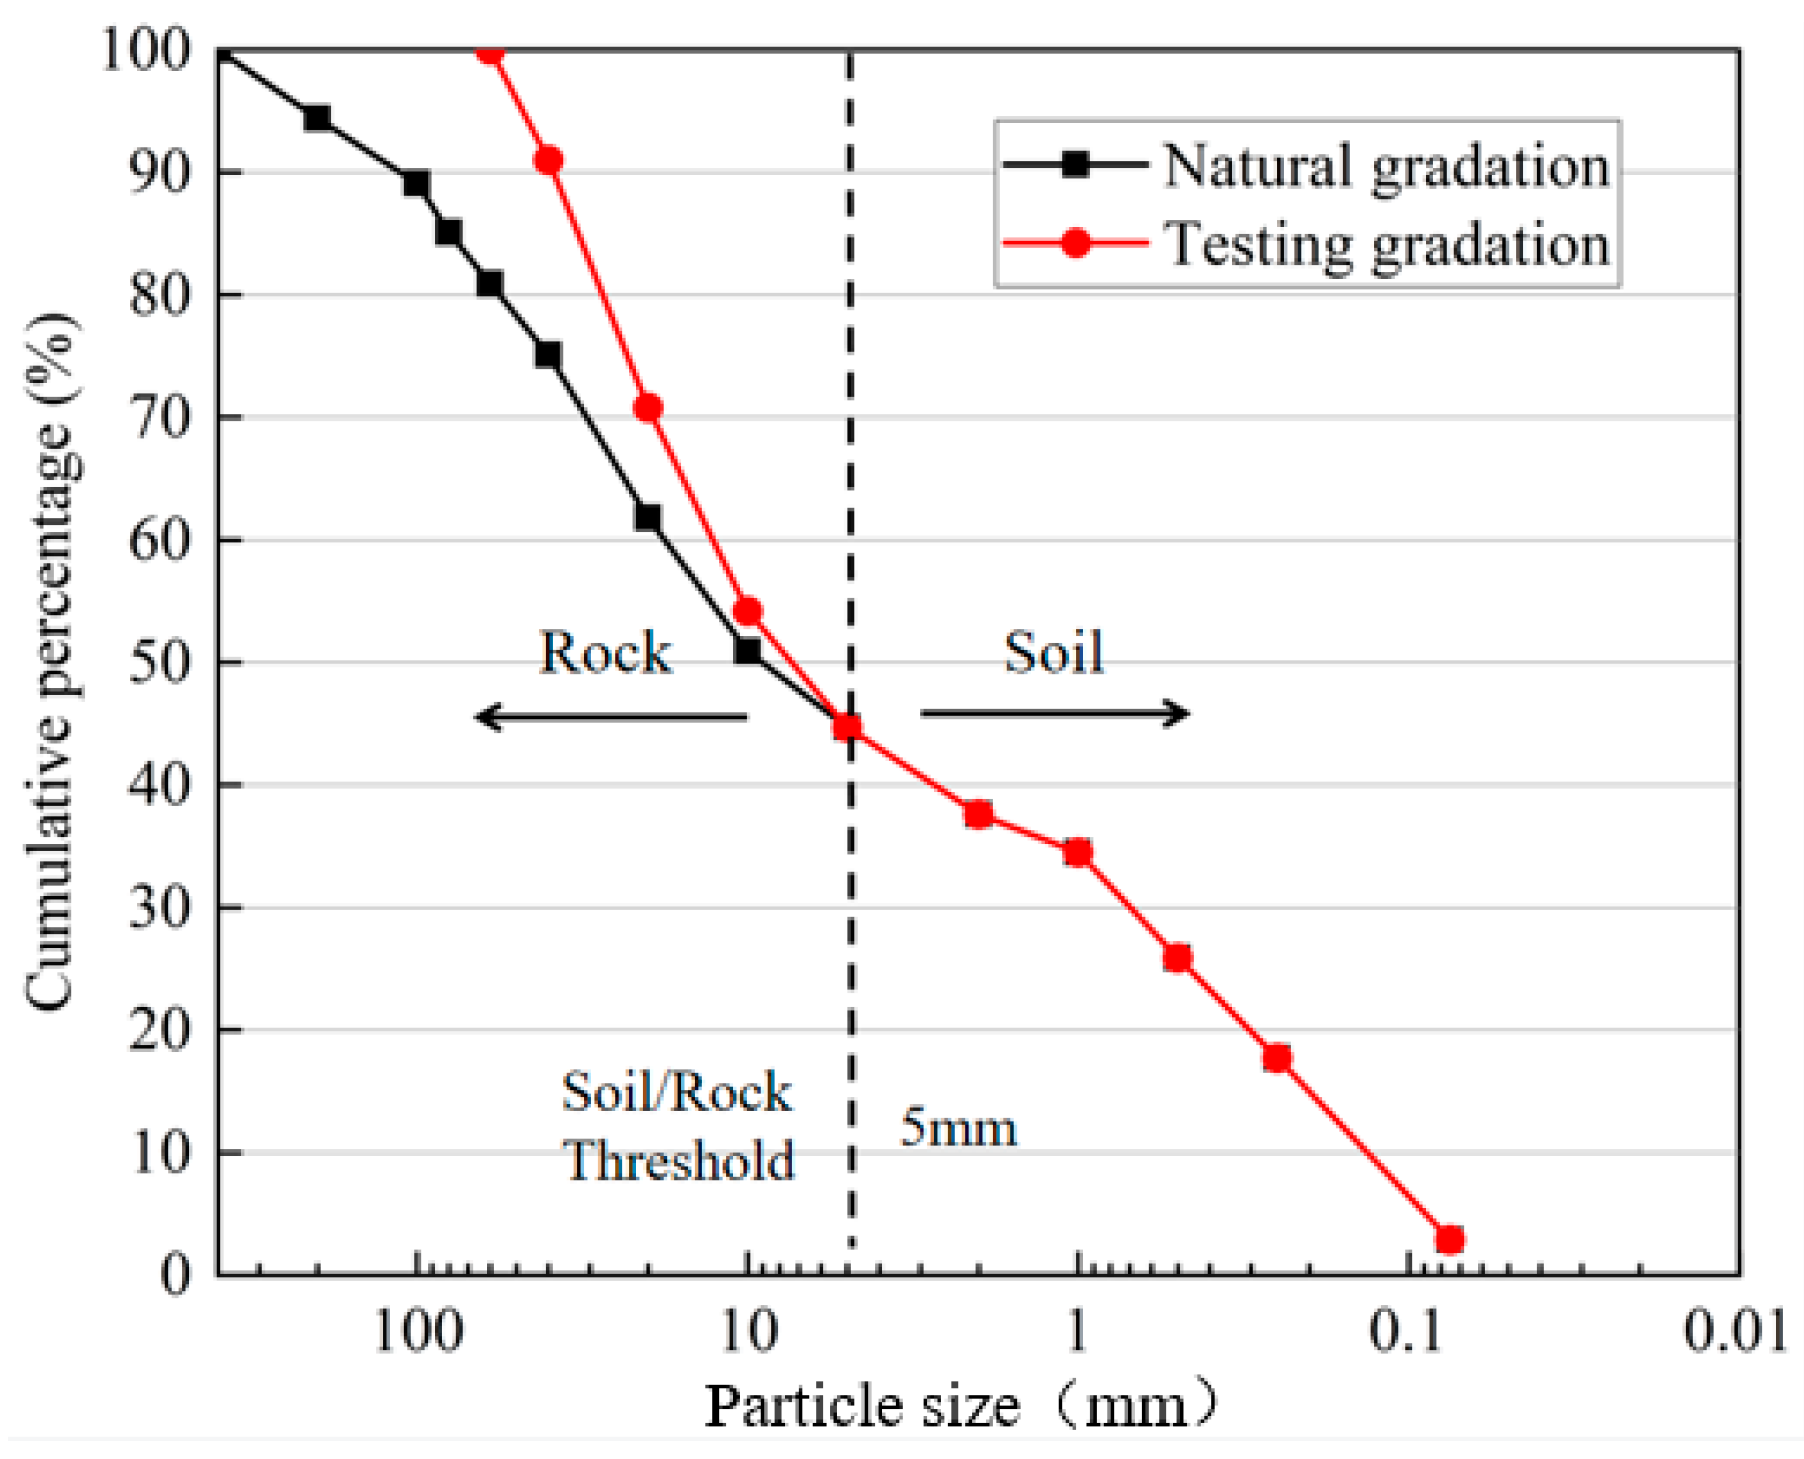
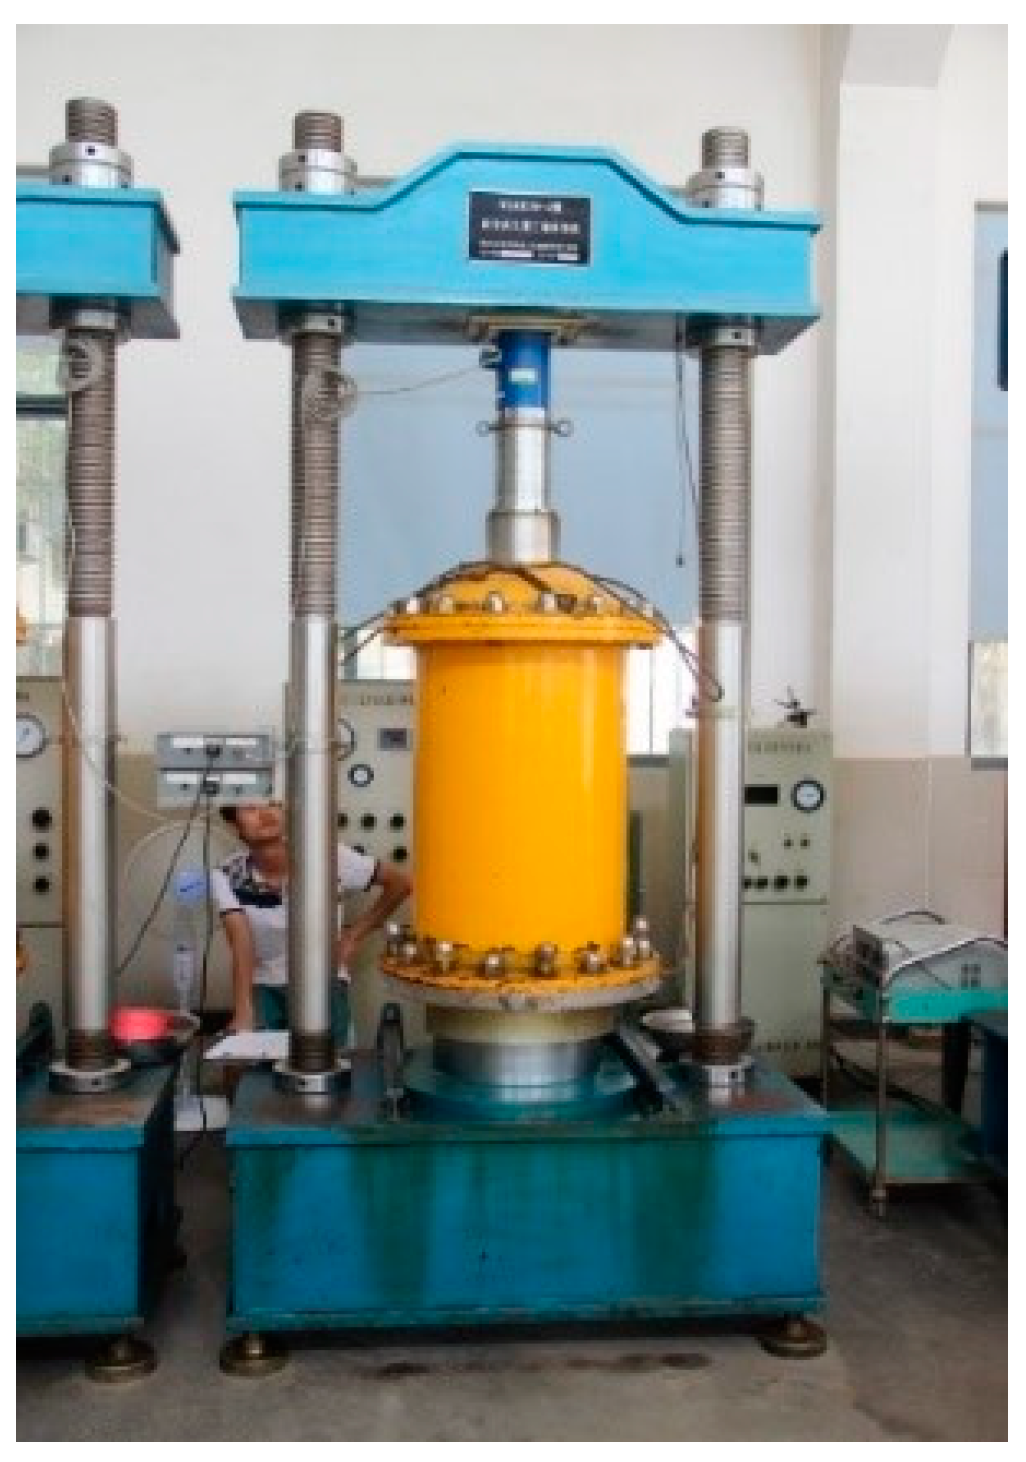
3.1. Experimental Procedures

The soil-rock mixture material is extracted from the waste slag dam filling material generated during the construction of a pumped-storage power station in Northwest China, as depicted in Figure 3. The garbage disposal area utilizes this material. The slag dump site is a perennial ditch with a discharge of 0.5 m3/s. The width of the ditch bottom is generally 8~13 m. The lithology on both sides is granodiorite and the width of the valley bottom is generally more than 20 m. The lithology on both sides is Sinian Dengying Formation striated marble. Due to the limitation of topographic conditions, the construction slag forms several small-scale spoil yards, the maximum height difference is less than 100 m, and the actual confining pressure is less than 1 MPa. In order to study the accuracy of its mechanical properties, the sample is analyzed with large size and small confining pressure in this triaxial test. Figure 4 shows the test materials. The sample has a stone composition of 52%, a measured natural water content of 10%, and an average specific gravity (GS) of 2.83. Representative samples were obtained using the quartering method, and the grading curve was plotted. The obtained sample exhibits discontinuous gradation. Due to the limitation of the test size, the original gradation is adjusted using the equivalent replacement approach.
The equivalent replacement approach involves substituting large particles with soil particles that are smaller than the maximum allowable particle size of the instrument but larger than 5 mm in proportion and with equal mass. The objective is to closely preserve the mechanical characteristics of the scaled material to the original grading constituents by controlling the amount of fine material present. The equipment can accommodate particles up to 60 mm in size. The scaled grading curve is shown in Figure 5.
The minimum dry density of the sample was determined using the fixed-volume method to fill the sample cylinder. The sample height was measured using a shaking table, and the sample volume was calculated to obtain the maximum dry density. The design code points out that “the filling standard of gravel and sand should take the relative density as the design control index”. Referring to the actual design standard of the project, this paper chooses the relative density of 0.6 as the sample preparation control. Different sample dry densities are generated based on the maximum dry density and the minimum dry density. The initial void ratio e0 of the sample was determined through conversion. The test and calculation results are displayed in Table 1.
The triaxial test employs a large triaxial compression tester with a sample size of Ф300 × H600 mm, a maximum confining pressure of 3.0 MPa, a maximum axial stress of 21 MPa, a maximum stroke of 300 mm, and a shear rate of 0.4 mm/min, as illustrated in Figure 6.
Five groups of unsaturated isotropic consolidated drainage (CD) shear tests with different dry densities (ρd = 1.76, 1.82, 2.00, 2.15, and 2.30 g/cm3) were conducted, and the confining pressures were 100, 200, 400, and 800 kPa, respectively. Sample preparation was carried out according to the grain gradation after scaling down the soil-rock mixture as described in Figure 5, and the sample mass is calculated according to the dry density and the size of the sample cylinder. The prepared sample is mixed until the coarse and fine particles are uniform, packed into a molding cylinder covered with rubber film in layers, and vibrated for compaction to prevent the separation of coarse and fine particles, and the interface between layers is chiseled to reduce the influence of the interlayer effect on shearing. After the sample loading is completed, the test device applied a constant vertical stress, and the drainage system was used to remove water from the soil sample to achieve isotropic consolidation. Shear stress was then applied when the required degree of consolidation was reached. After the test, the sample was air-dried and screened, and a postshear grading curve was drawn. The laboratory tests yielded stress‒axial strain curves, volumetric strain‒axial strain curves, and shear strength parameters of the soil-rock mixture. These tests were conducted to explore the changing law of particle breakage through grading changes before and after shearing.

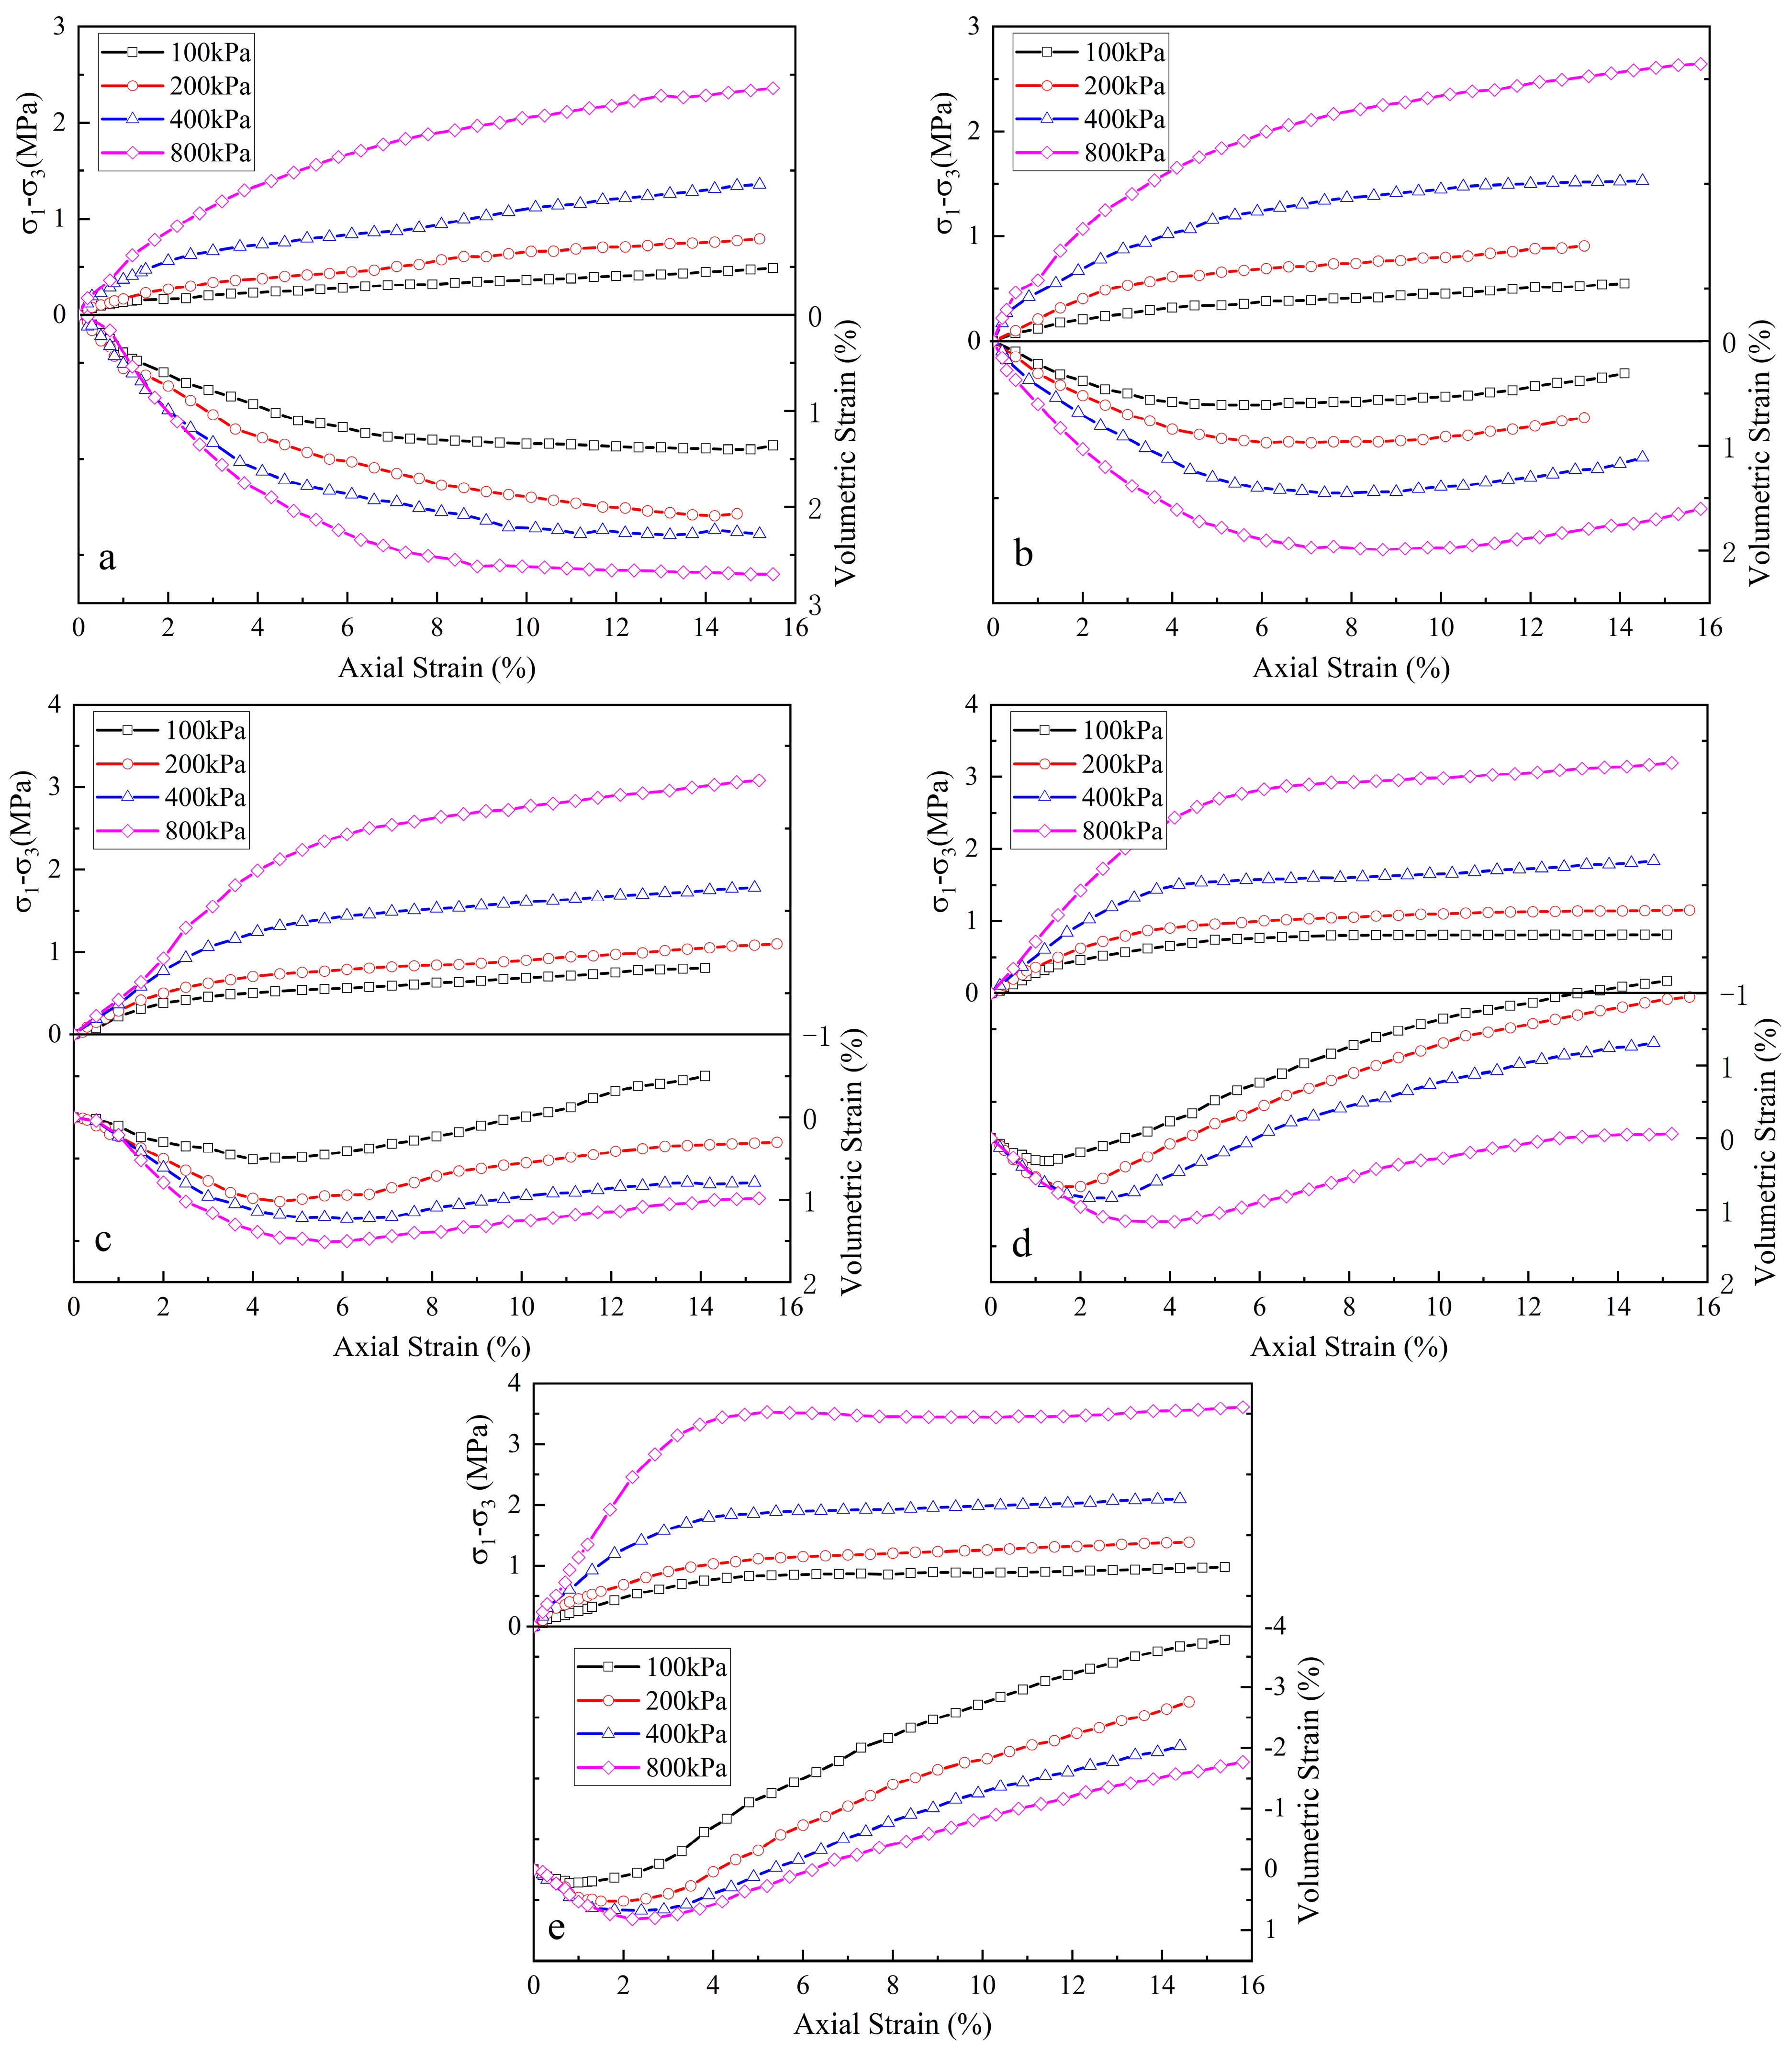
3.2. Analysis of the Stress‒Strain Relationship Curve

Figure 7 displays the stress‒axial strain curves and volumetric strain‒axial strain curves of the soil-rock mixture at various confining pressures during a triaxial test. According to the Standard for Geotechnical Test Methods (GB/T 50123-2019) [25], the stress corresponding to the axial strain of 15–20% is usually taken as the failure stress in the hardening curve. The axial strain corresponding to the failure stress is 15% in this test. As the dry density remains constant, the failure stress increases with increasing confining pressure. Moreover, as the dry density increases, the failure stress tends to increase as well. During the initial phase of the test, the specimen undergoes shrinkage followed by dilatancy, resulting in an increase in the volume as the dry density increases. As the confining pressure increases, the specimen’s dilatancy exhibits hysteresis, transitioning from shear dilatation to shear shrinkage, ultimately leading to a decrease in the volume variable. Manzari et al. [26] suggested that this behavior can be explained by the state-dependent dilatancy characteristics of bulk particles, specifically the phase transition stress ratio M p t = q / p (where q represents the critical dilatancy stress and p is the average primary stress). Figure 8 displays the phase transition stress for various dry densities at varying confining pressures. It is evident from Figure 8 that the phase transition stress ratio increases with increasing dry density under a specific confining pressure, resulting in an increase in the volume. Conversely, as the confining pressure increases, the phase transition stress ratio gradually decreases at a constant dry density, indicating a steady decrease in the volume variable. This finding corroborates the previously stated conclusion.

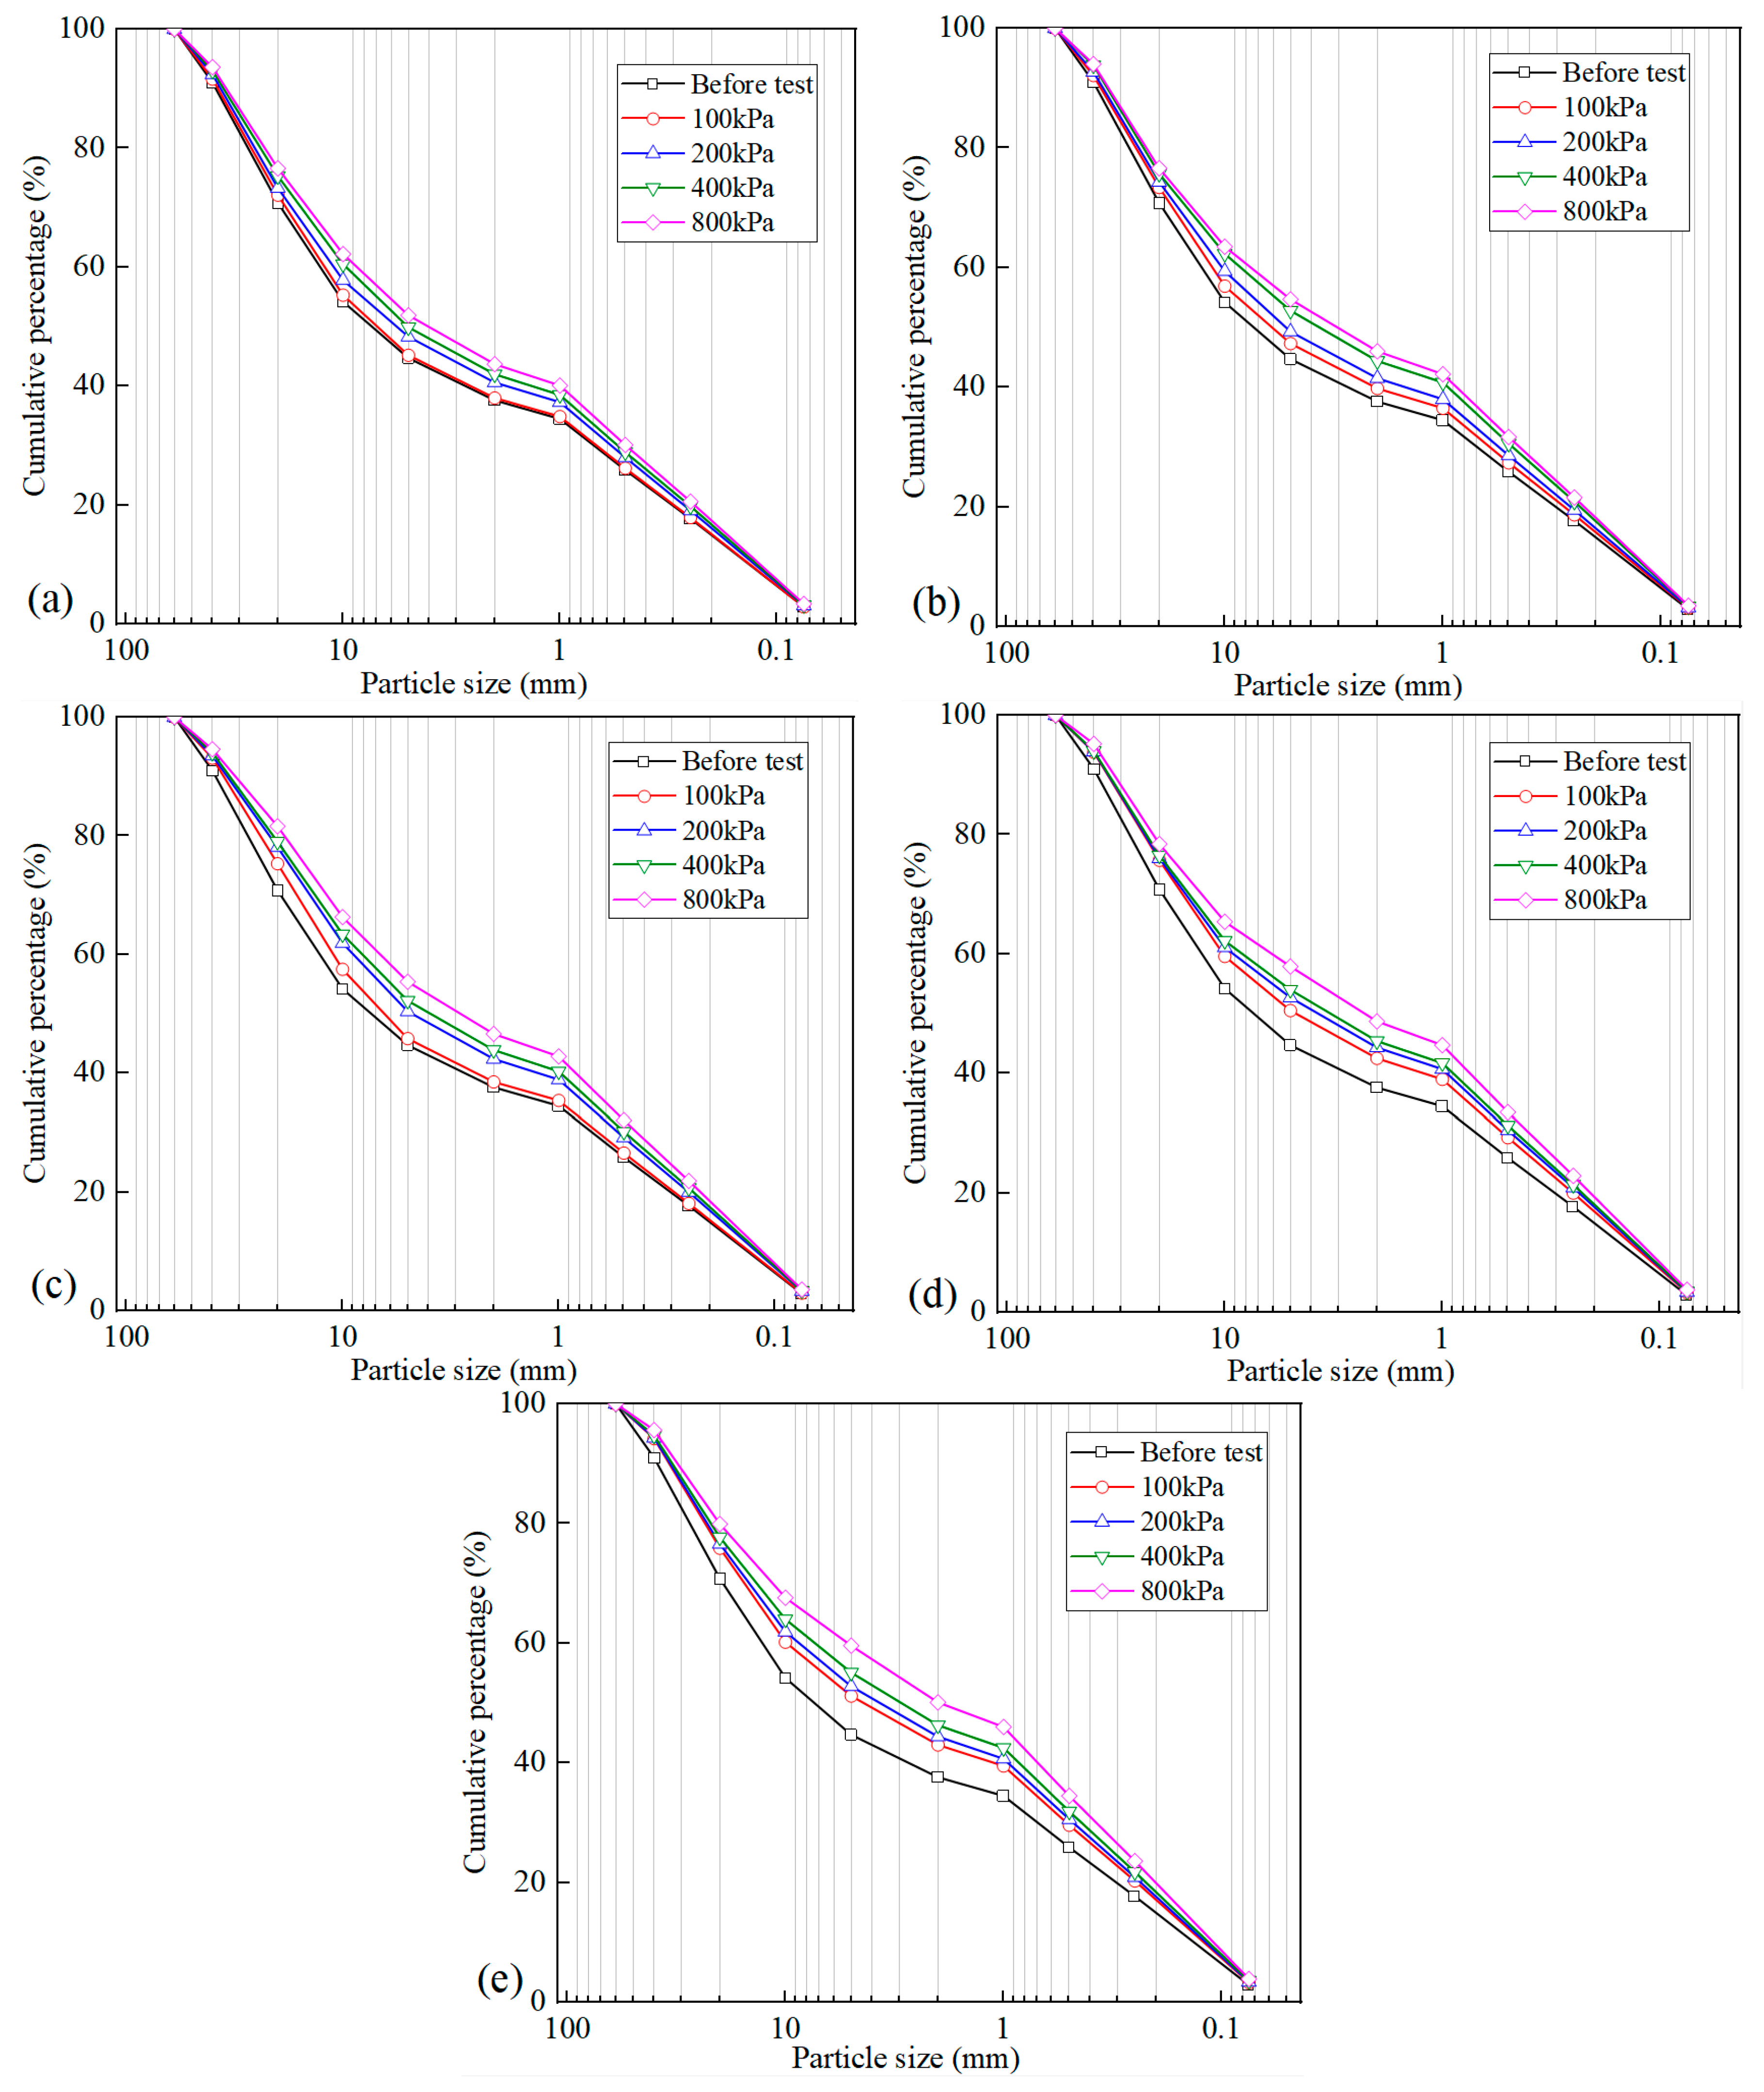
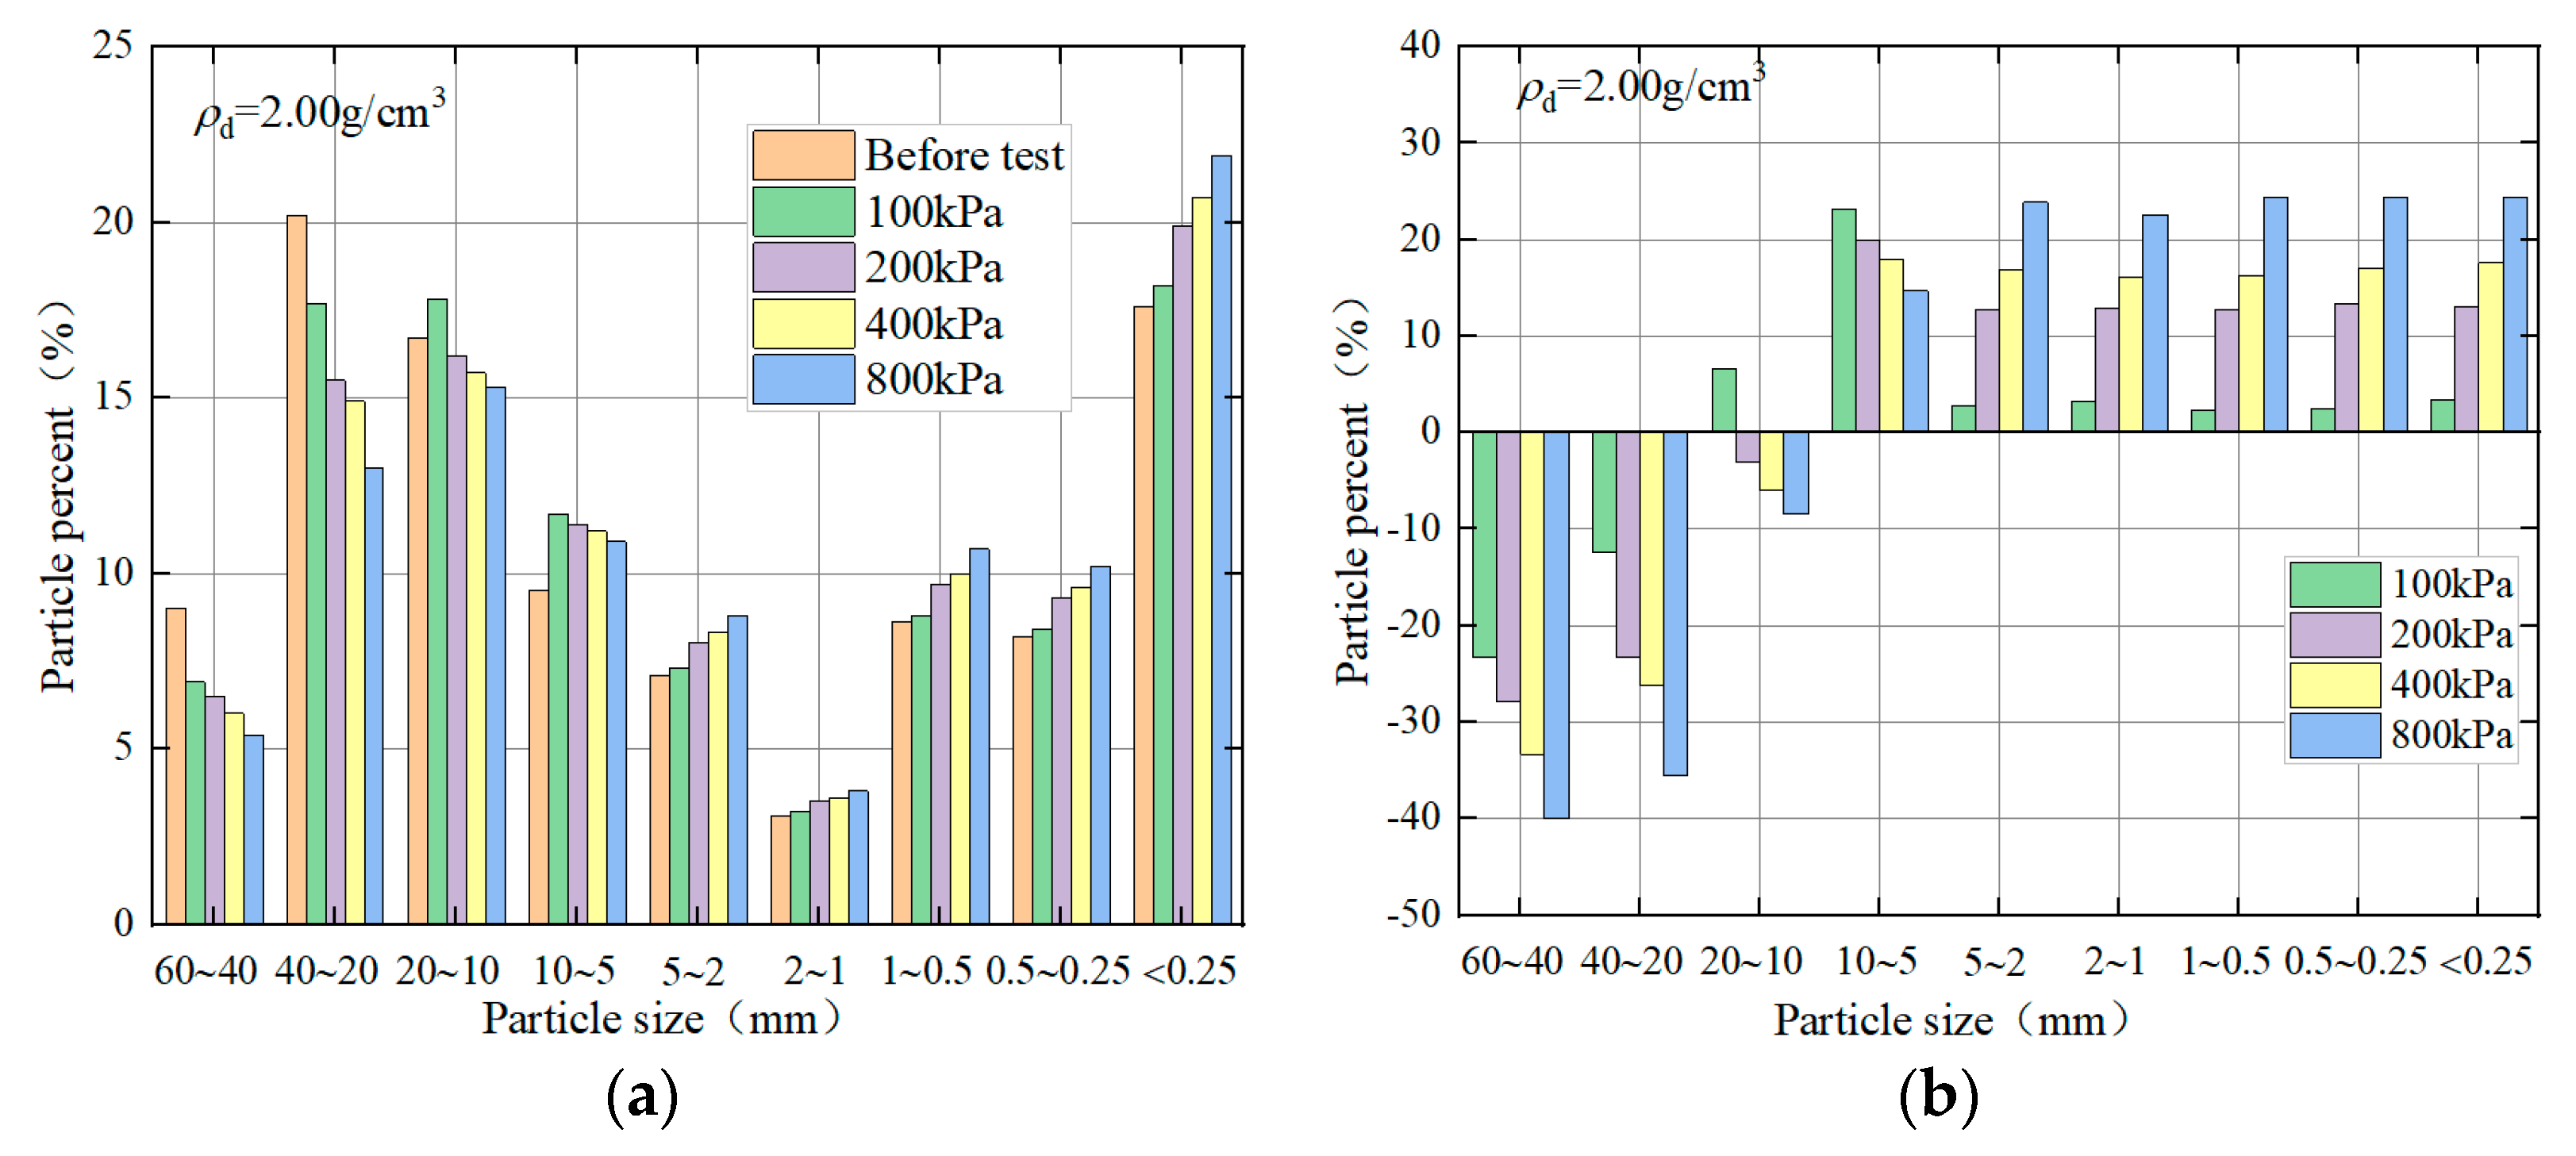
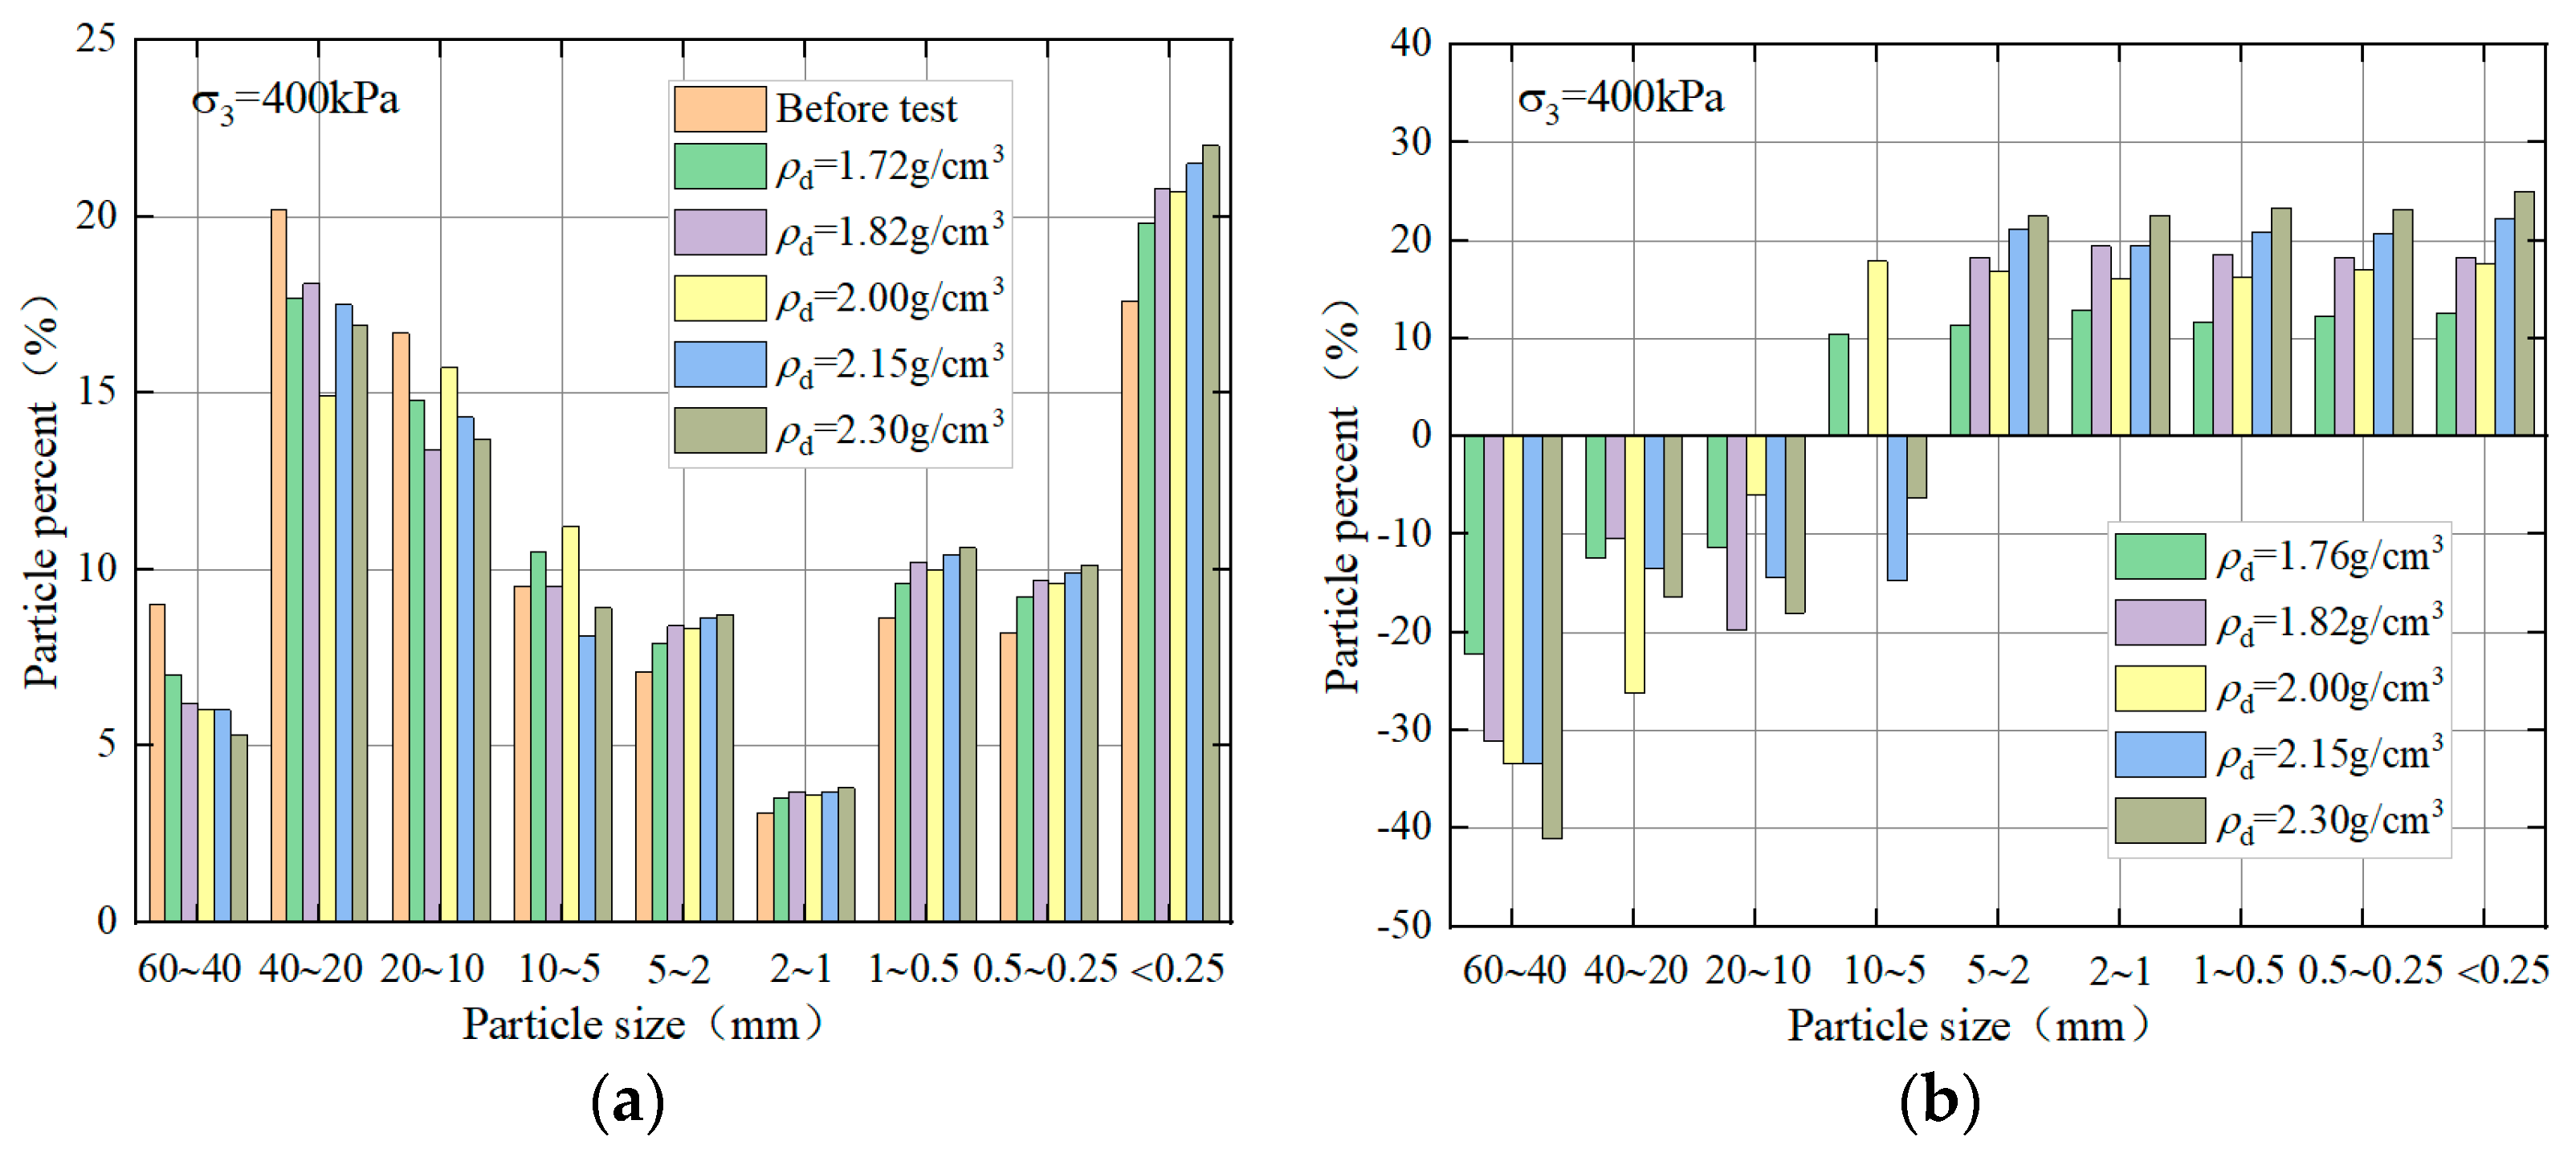
3.3. Analyzing the Particle-Grading Curves before and after Shearing at Various Dry Densities

The waste slag dam filling material primarily consists of marble and granodiorite, which are known for their high strength and complex composition. To examine the failure mechanism, the sheared sample was air-dried and sifted. Figure 9 presents the grading curves before and after shearing at different dry densities, while Table 2 provides the grading findings of the soil-rock mixture after shearing. The results clearly indicate particle breakage during the triaxial shear process. With increasing confining pressure, the grading curve shifts upward, indicating an increase in particle breakage [27,28]. The “dilatation” among the particle groups on the grading curve becomes more pronounced as the dry density increases. Notably, the sample with a dry density of 2.30 g/cm3 exhibited a more significant change in the particle size distribution than did the sample with a dry density of 1.76 g/cm3. This suggests that particle breakage becomes more pronounced as the dry density increases. That is, with increasing dry density, the sample becomes denser, the contact between particles increases, the occlusal arrangement increases, and it rolls and breaks under the action of shear [29].
For analysis, a single dry density of 2.00 g/cm3 is taken into consideration. Figure 10 shows the content histogram of each particle group under various confining pressures. The range of particle size variation increases with increasing confining pressure, except for particles between 5 and 20 mm. The particle content is significantly affected by high confining pressure, particularly for particles with a size of 20–60 mm, which shows a change range of approximately 40% and a more pronounced impact on larger particle sizes.
To illustrate the impact of dry density on particle breakage, a histogram is created. The figure shows the composition of each particle group at a confining pressure of 400 kPa and varying dry densities. Figure 11 shows how particle breakage increases as the dry density increases during the test at a confining pressure of 400 kPa. This is because the sample becomes denser at higher dry densities, making relative movement between particles more difficult and increasing the likelihood of breakage [30]. The degree of change in the particle breakage is consistent regardless of the confining pressure, with a more pronounced change ranging as the dry density increases.

3.4. Analyzing the Particle Breakage Characteristics of Soi-Rock Mixtures Using an Improved Particle Breakage Index, BC

Figure 9 displays the grading curves before and after shearing for five groups with varying dry densities under different confining pressures. The curves for each confining pressure at various dry densities were integrated, and the breakage index BC for each confining pressure was determined using Equation (2). The breakage index BC can be found in Table 3.
Table 2 provides the grading of each particle size after shearing, and the fractal dimension D can be determined using Equation (3). Figure 12 shows a diagram of the fractal dimension results for the five groups at the various dry densities. The fitting plots of the fractal dimensions D of the five groups with different dry densities showed consistent trends, and the results of the fractal dimensions D are listed in Table 3.
Table 3 shows the computed values of sample fractal dimension D and particle breakage index BC at various dry densities. Table 3 clearly shows that both the fractal dimension D and the breakage index BC increase as the confining pressure increases.
The improved breakage index BC and fractal dimension D were utilized to describe the particle breakage degree based on the area of the gradation curve and fractal characteristics, respectively, according to the particle size distribution characteristics. The fractal dimension D and the breakage index BC were fitted. A strong linear regression link between the fractal dimension D and the breakage index BC is demonstrated in Figure 13, with a correlation coefficient R2 of 0.96. The improved breakage index BC and fractal dimension D can indicate the particle distribution features inside the soil-rock mixture at varying degrees of breakage. Both methods are effective in describing and measuring the degree of particle breakage, aligning with the findings of previous studies [5,23].

4. Analyzing the Impact of the Particle Breakage Index BC on the Deformation Strength Characteristics

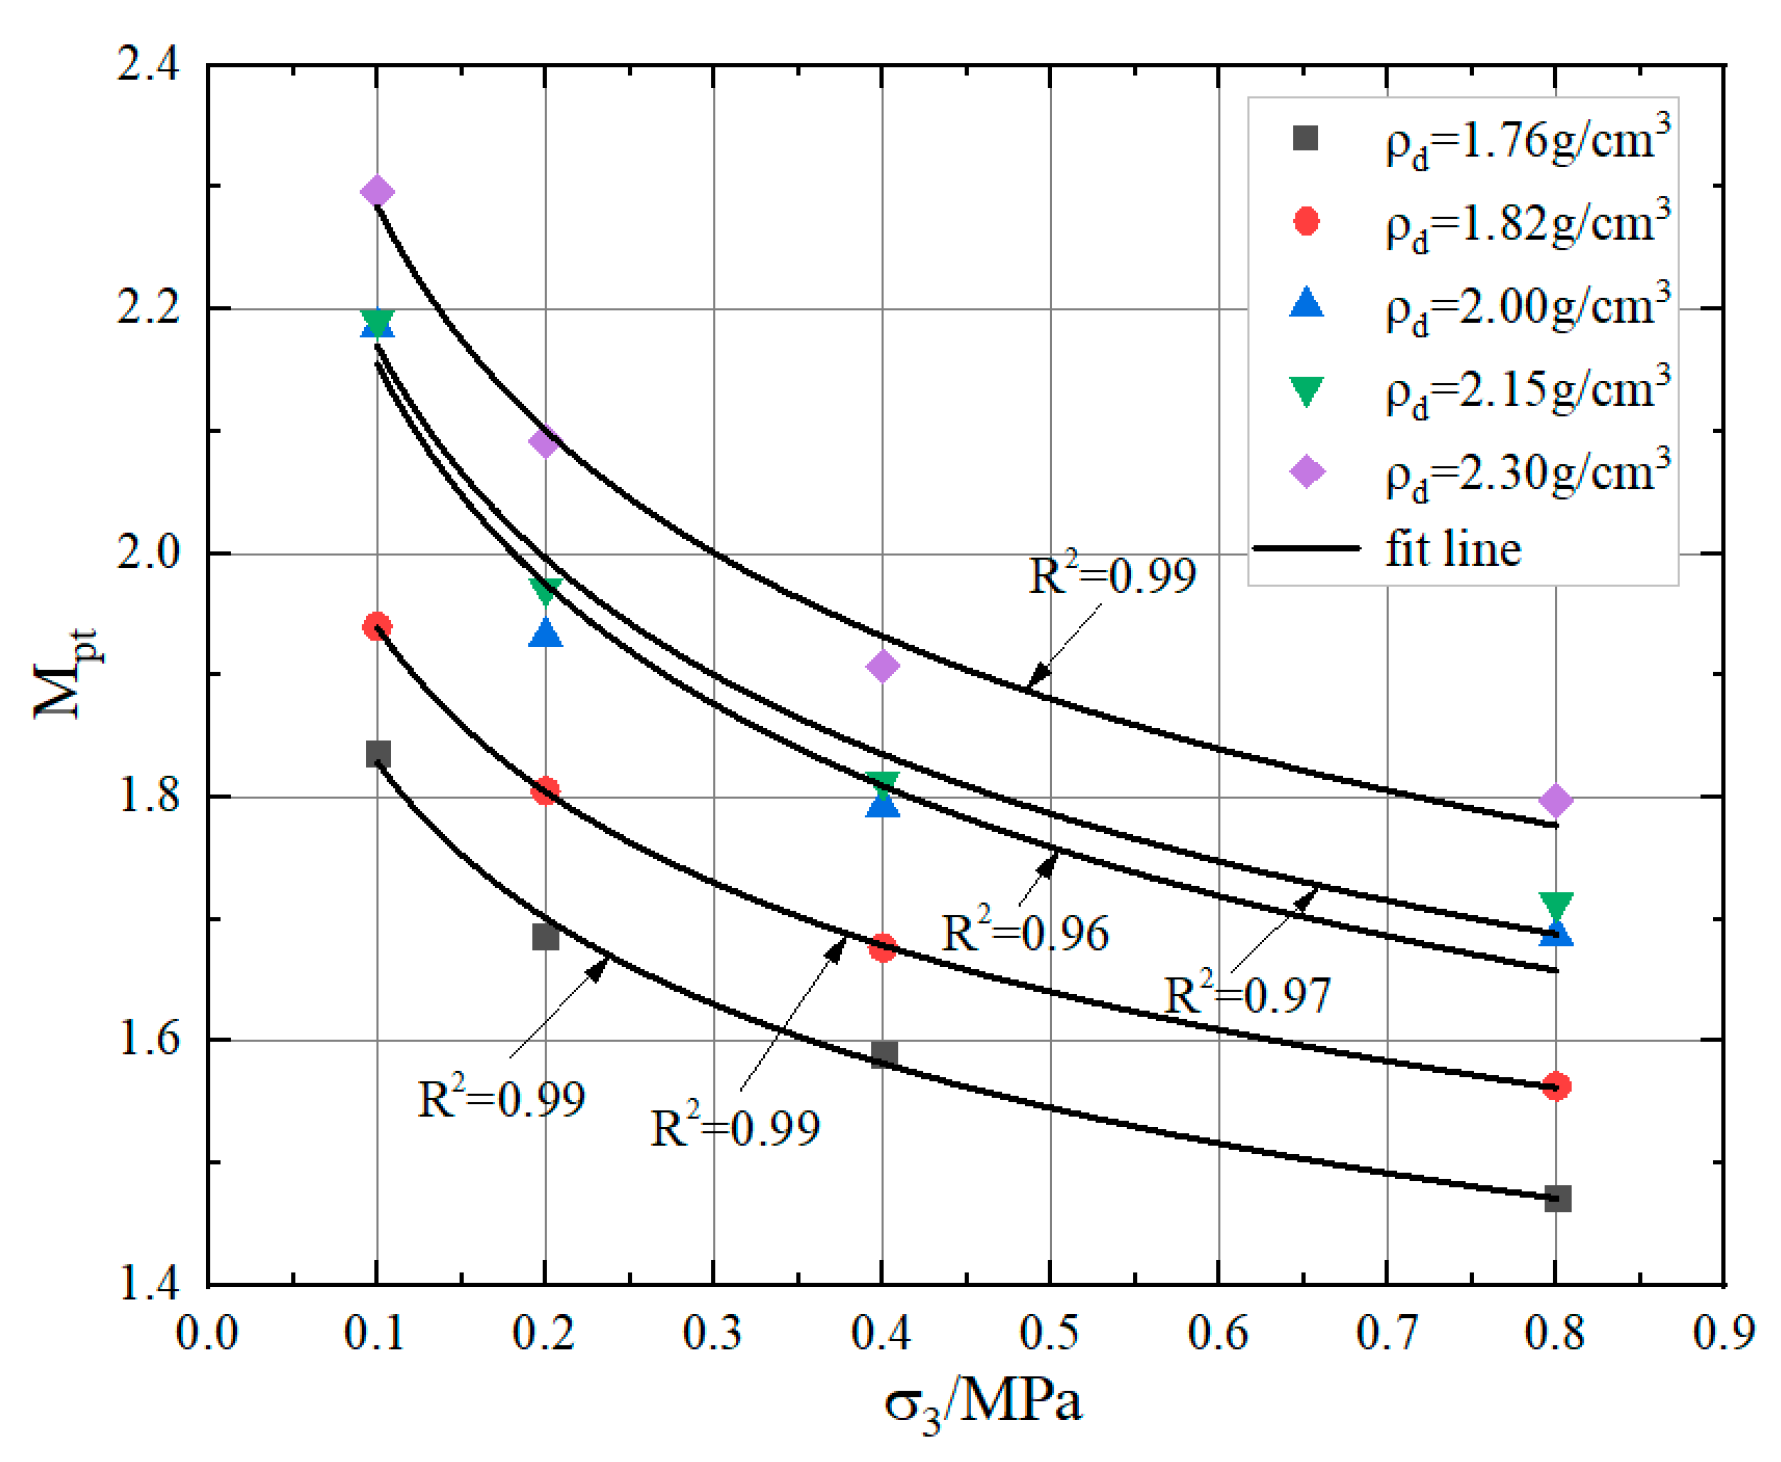
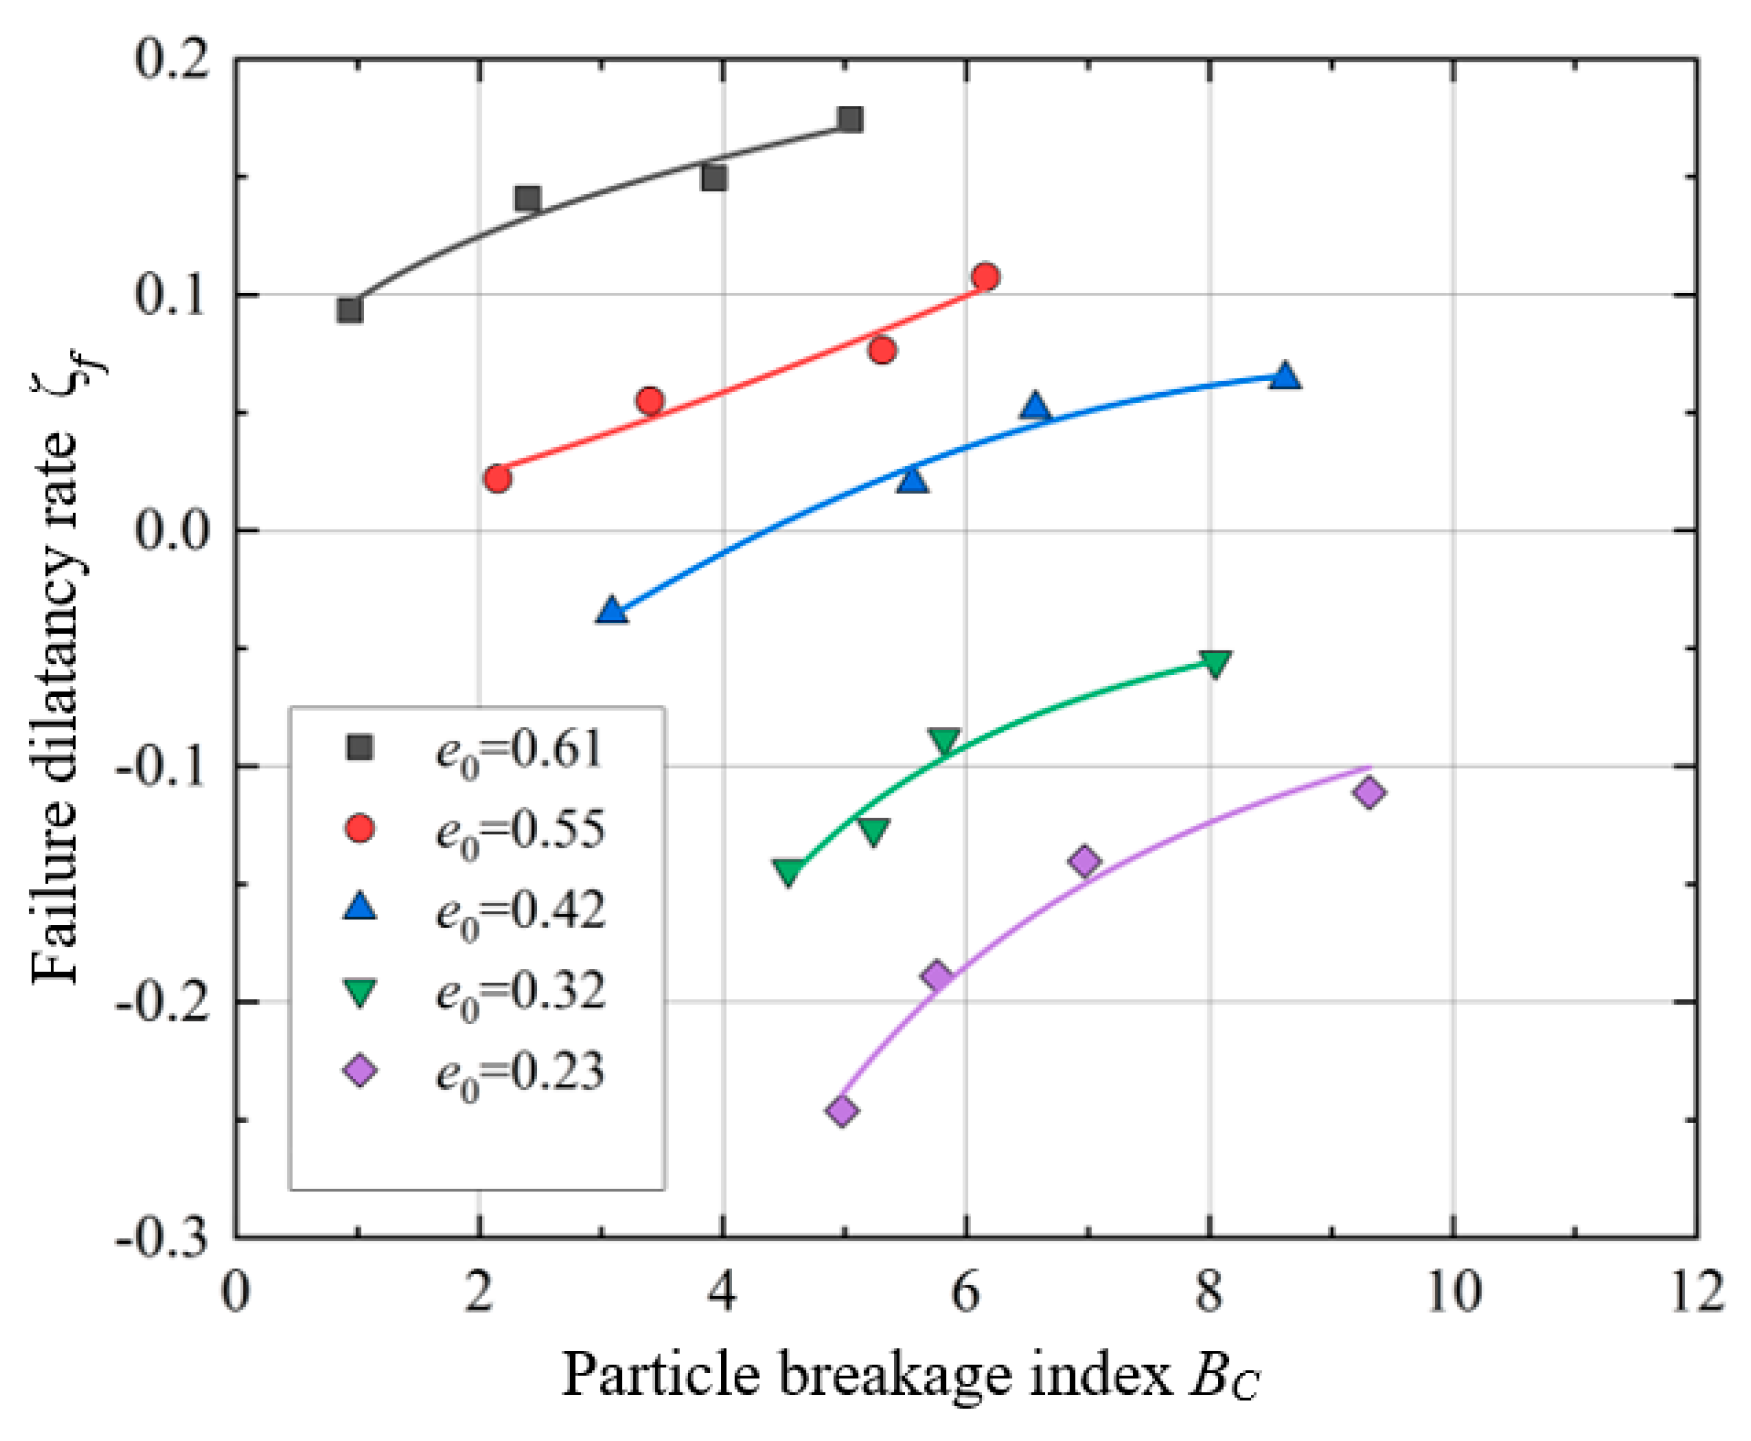
4.1. Analyzing the Impact of the Breakage Index BC on the Deformation Characteristics

The dilatancy of a soil-rock mixture is described by the dilatancy rate, which is defined as, ζ = d ε v p / d ε a p , representing the ratio of the plastic volumetric strain increment to the plastic partial strain increment. The sample’s volume exhibits a relative dilatation deformation trend (dilatancy rate d ε v p / d ε s p < 0 ) during the shear process, known as dilatancy, as per the definition provided above. Guo et al. [31] analyzed the triaxial CD test results of coarse-grained soil to compare the plastic strain increase ratio with the total strain increase ratio. They discovered that the dilatation ratio was minimally affected by elastic strain. Hence, the dilatation ratio of d ε v p / d ε s p can be represented as d ε v / d ε s , and the general form of the dilatation equation was derived. d ε v / d ε s is utilized to characterize the dilatancy of soil-rock mixtures in this paper.
The dilatancy of soil material is influenced by its initial physical and mechanical state, which refers to the change in soil volume due to shear [32]. The main focus of this paper is to study the impact of various dry densities on particle breakage characteristics. The dry density and initial void ratio exhibit a negative correlation. By transforming dry density into the initial void ratio, relevant data on dry density can be indirectly acquired. The failure dilatancy rate ζ f and particle breakage index BC were plotted on a two-dimensional plane under various initial void ratios. As shown in Figure 14, under the same initial void ratio, the failure dilatancy rate gradually increases with increasing breakage index BC. This study indicates that the size of the soil-rock mixture decreases as the number of particle breakages increases. During shearing, the staggered tumbling amplitude of the particles decreases, resulting in a decrease in shear volume dilatation and a transition from shear dilatation to shear shrinkage.
After fitting the scattered points, it was found that there is a strong power function correlation between the failure dilatancy rate and the particle breakage index [33], expressed as:
ζ f = m B c n
where m and n are parameters that are adjusted to fit the data.

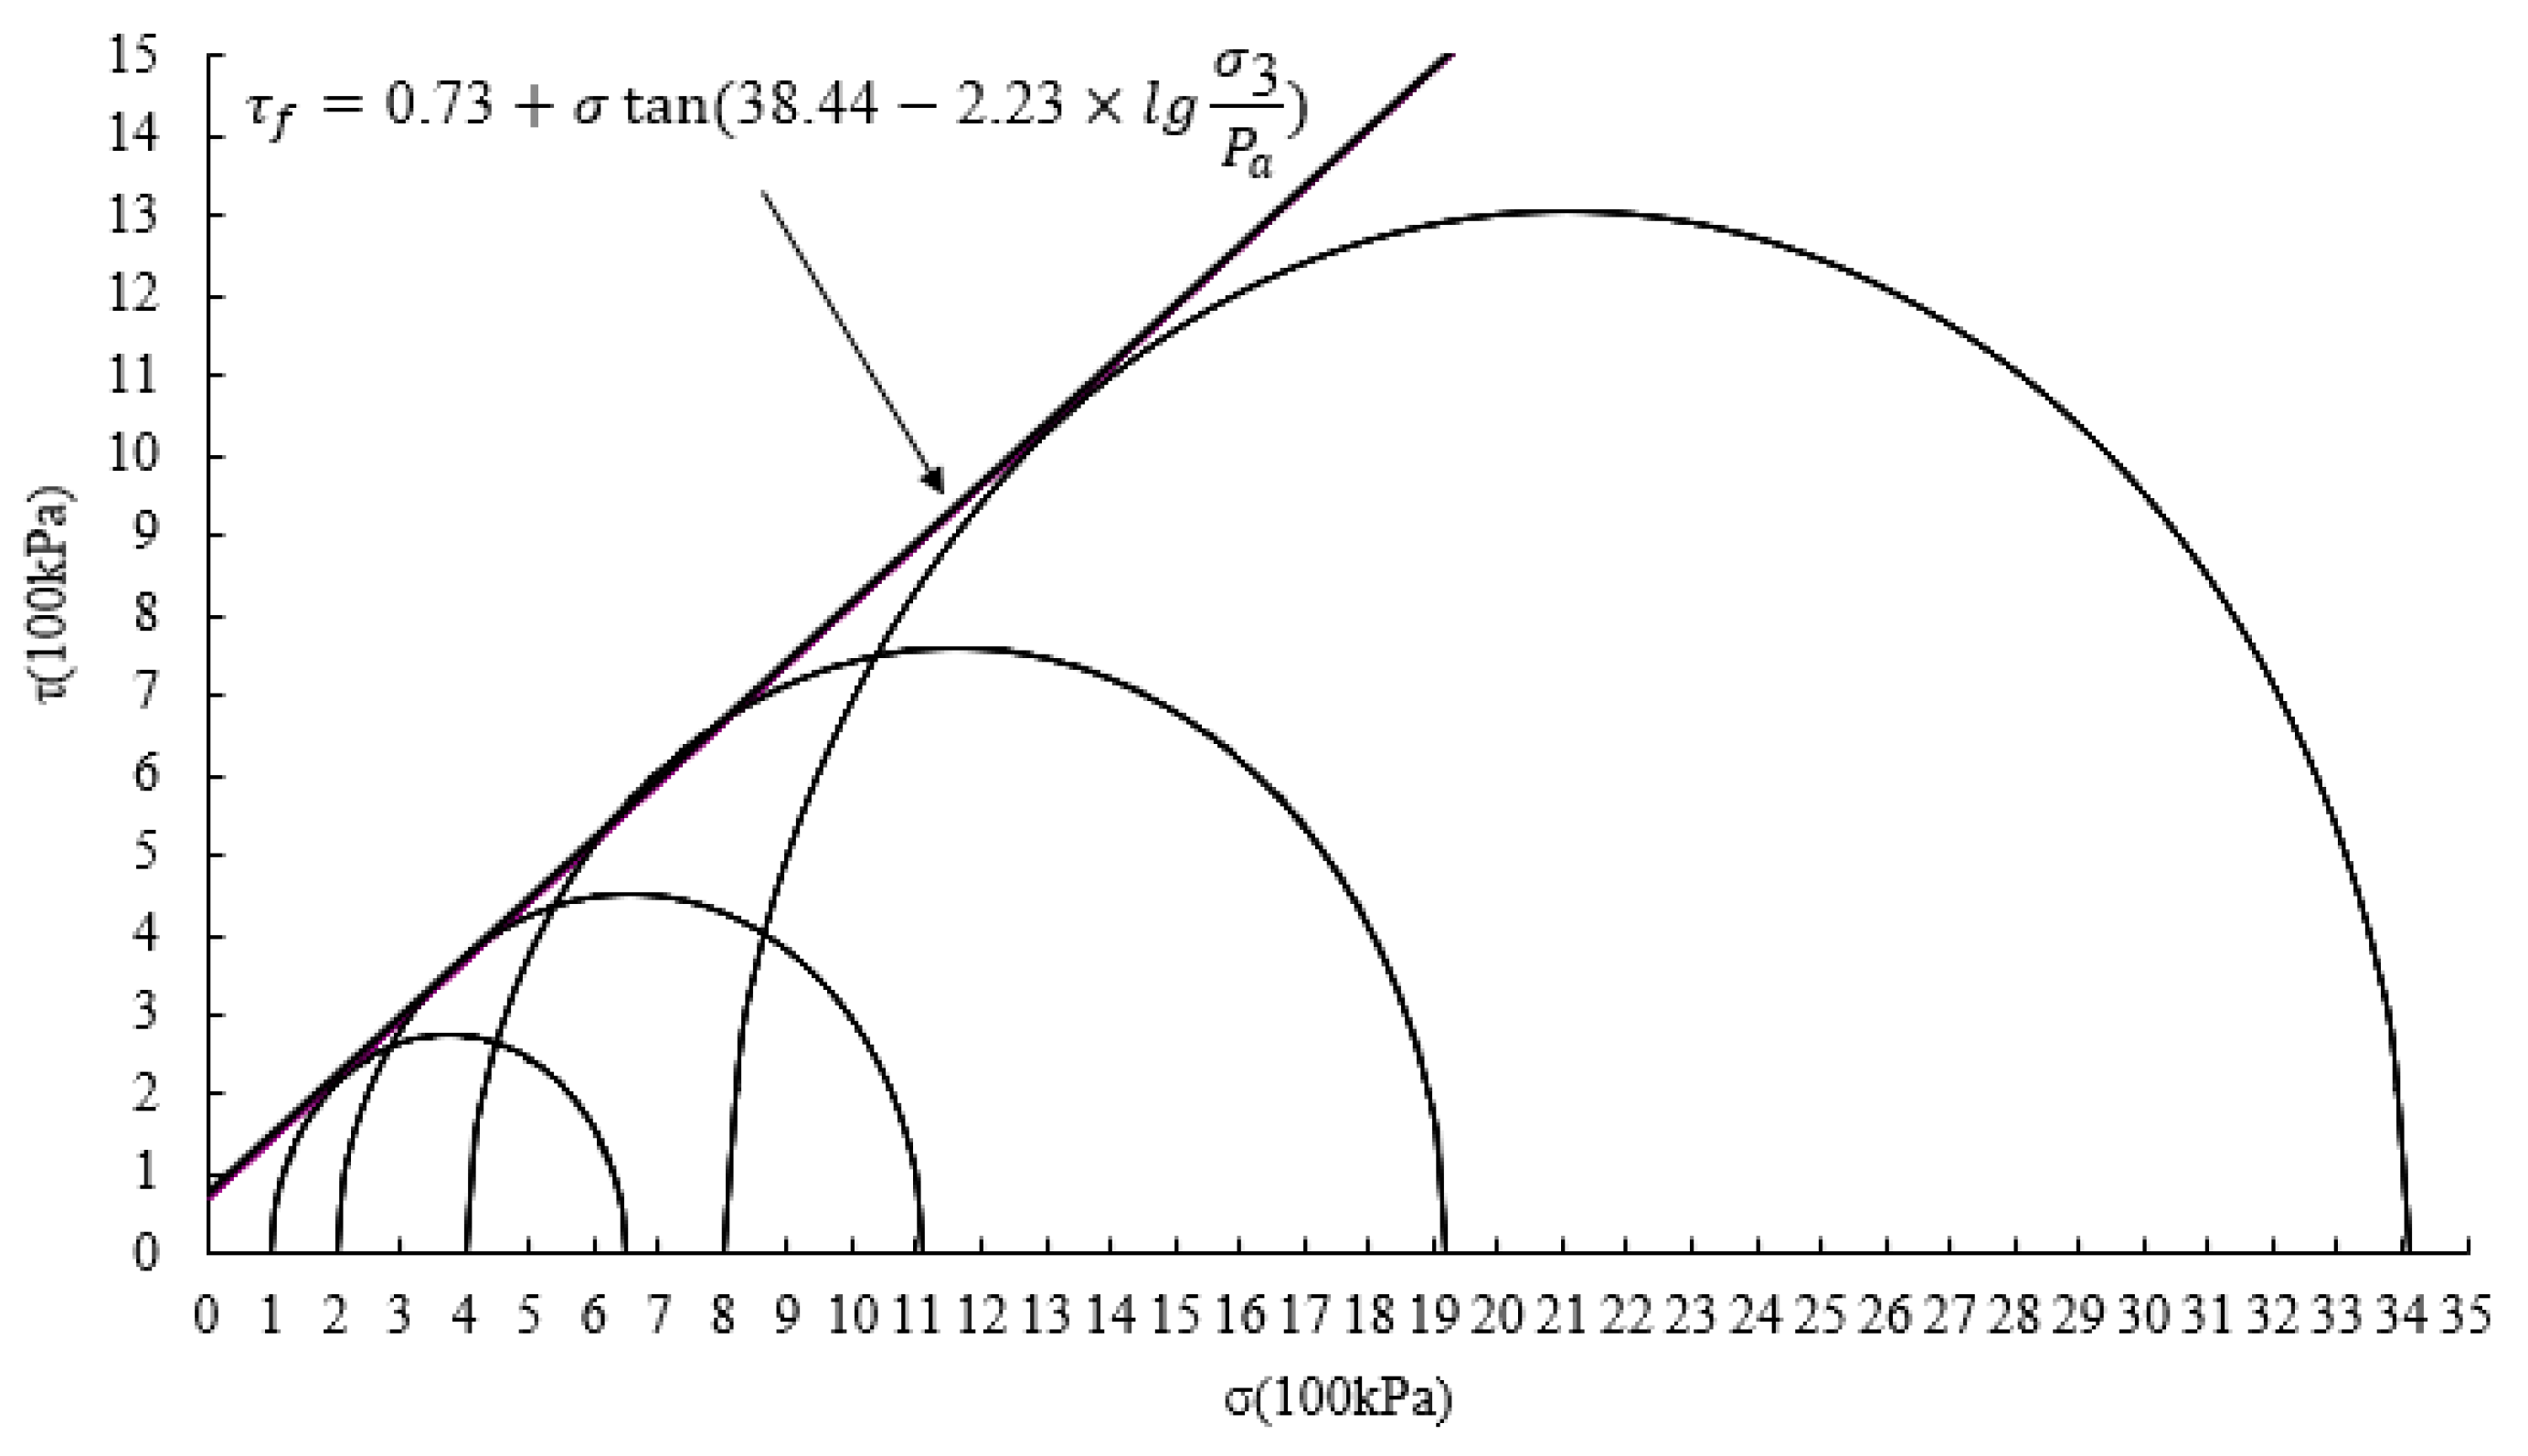
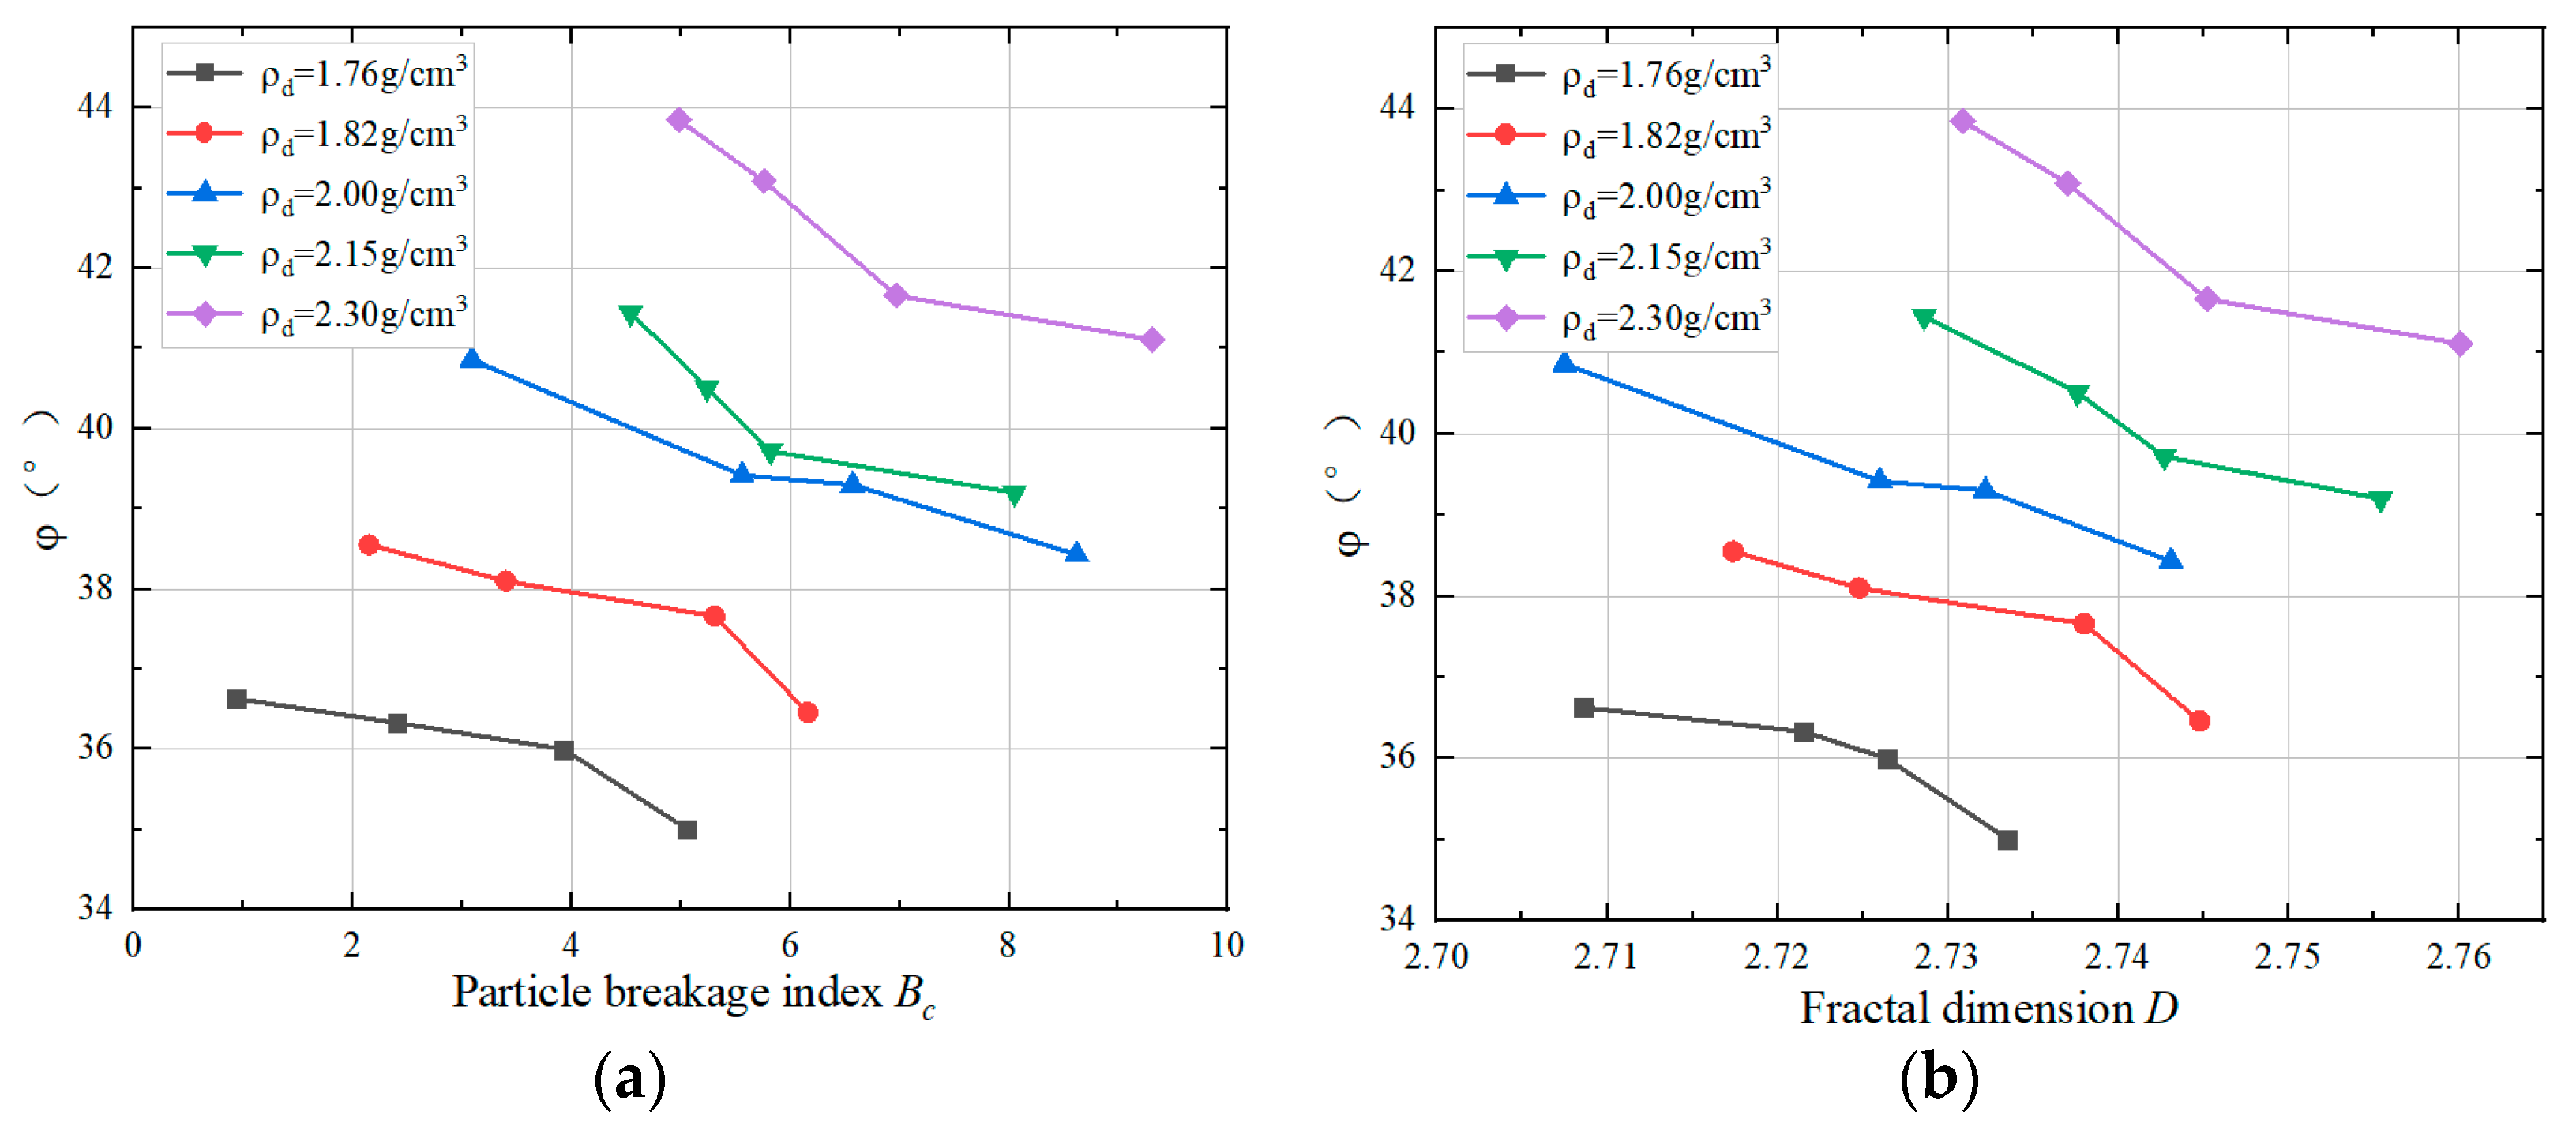
4.2. Analyzing the Impact of the Breakage Index BC on the Strength Characteristics

By studying the phenomena and laws of particle breakage, it is evident that particle breakage, density, and confining pressure significantly influence the strength characteristics of soil-rock mixtures. The linear Mohr-Coulomb strength criterion is commonly used for stability analysis. When dealing with soil-rock mixtures, it is important to consider cohesion when determining the internal friction angle.
The Mohr-Coulomb strength criterion is employed to determine the cohesion in a linear manner. Soil materials typically fail through shear failure, and Coulomb suggested the following equation for shear strength:
τ f = c + σ tan φ
where τ f represents the shear strength, σ represents the normal stress, c represents the cohesion, and φ represents the internal friction angle. According to the data in Table 4, the Mohr circle and strength envelope under different dry densities are drawn.
The internal friction angle estimates for large particles or rockfill made of weak minerals or weathered rocks clearly show a nonlinear strength envelope. When analyzing the stability of a waste slag rockfill dam, it is important to consider the nonlinear characteristics of the strength envelope of the soil-rock mixture under high confining pressure [34]. Assuming that the cohesion of the same dry density is constant, the internal friction angle is calculated using the nonlinear equation of the strength envelope. The nonlinear equation of the strength envelope [35,36] is as follows:
τ f = c + σ tan ( φ 0 Δ φ l g σ 3 p a )
where φ represents the angle of internal friction when the continuous cohesion is extended in reverse to the point where the axis intersects the Mohr circle. represents the angle of internal friction under a pressure of one atmosphere. Δ φ is a nonlinear parameter that signifies the reduction in φ over a logarithmic period as σ 3 increases. p a represents the atmospheric pressure, with a value of 101.3 kPa, which has the same unit as σ 3 . The values for φ , φ 0 , Δ φ and c can be found in Table 5. At the same time, draw the Mohr circle and strength envelope of the sample with dry density of 1.82 g/cm3, as shown in Figure 15.
Figure 16 displays the relationship curves between the confining pressure σ 3 and internal friction angle φ at different densities, based on the data in Table 5. At a constant confining pressure σ 3 , increasing the dry density results in a greater internal friction angle φ , more pronounced interparticle occlusion, and greater shear strength. The internal friction angle of the soil-rock mixture mostly originates from the sliding friction of particle surfaces and the occlusion friction between particles. As the confining pressure σ 3 increases in this process, the binding force also increases, making it harder for particles to move across, leading to more severe particle breakage and increased particle breakage. As the bite force between particles diminishes, the internal friction angle φ and shear strength also decrease. At the same time, increasing the dry density results in a higher nonlinear parameter Δ φ and leads to a greater nonlinear shear strength of the sample.
The analysis presented in Figure 16 demonstrates that as the confining pressure increases, particle breakage intensifies, resulting in a slower reduction in the internal friction angle φ . Overall, the internal friction angle exhibits a nonlinear trend. This is because with a further increase in the confining pressure, particle breakage or deformation occurs, leading to changes in the surface shape and structure of some particles. Consequently, the magnitude and distribution of the friction force also change. The contact region between soil particles tends to become saturated, and further increasing the confining pressure has little effect on the soil. Therefore, particle breakage is a significant contributing factor to the nonlinear trend of the internal friction angle.
Figure 17 displays the correlation between the breakage index BC, fractal dimension D, and internal friction angle φ at various dry densities. Figure 17a illustrates a clear correlation between the particle breakage and internal friction angle φ . At the same dry density, with increasing breakage index BC, the internal friction angle φ gradually decreases, and the internal friction angle φ exhibits a nonlinear trend, which is consistent with the conclusion of the above relationship curve between the confining pressure σ 3 and the internal friction angle φ . For fractal dimension D, the larger the fractal dimension D, the higher the degree of breakage [15]. As can be seen from Figure 17b, with the increase in fractal dimension d, the internal friction angle also shows a decreasing trend. Comparing the two relationship curves shows that the decreasing trend of the internal friction angle φ is similar under different dry densities in both panels of Figure 17a,b, indicating the rationality of using the improved breakage index BC to analyze the strength characteristics.

5. Conclusions

Based on the previous breakage index, the improved breakage index BC was established in this paper. Through the quantitative relationship with the fractal dimension, the rationality of the improved breakage index BC was explained. Based on large-scale triaxial shear test results of soil-rock mixtures under different dry densities, the following conclusions were drawn:
(1) Combined with the phase transformation stress ratio M p t , when the dry density increases, the phase transformation stress ratio M p t also increases, leading to an increase in the volume variable. As the confining pressure increases, M p t decreases progressively, suggesting a decrease in the volume variable, and the specimen exhibits dilatancy hysteresis.
(2) The particle breakage increases with increasing confining pressure before and after particle-grading shear. The largest changes in particle breakage occur in the particle group ranging from 20 to 60 mm. A higher dry density leads to more noticeable particle breakage. The breakage index BC and fractal dimension D are fitted, resulting in well-fitting parameters that effectively describe and quantify the overall degree of particle breakage.
(3) In the study of deformation characteristics, the failure dilatancy rate ζ f shows a strong power function correlation with the particle breakage index BC. The absolute value of the failure dilatancy rate ζ f decreases with increasing crushing index BC, transitioning gradually from dilatancy to shear shrinkage.
(4) When investigating the strength characteristics, increasing the confining pressure also increases the breakage index BC. This leads to a decrease in the internal friction angle and a decrease in the shear strength, exhibiting a nonlinear trend. Particle breakage is the direct cause that affects the nonlinearity of the internal friction angle.

Author Contributions

Supervision, Funding acquisition, Writing—review and editing: P.X.; Investigation, Methodology, Writing—original draft: Z.C.; Conceptualization, data curation: L.F.; Funding acquisition, Investigation, Revision: Z.X.; Supervision, Revision, Conceptualization: Q.L.; Supervision, Revision, Conceptualization: Z.L. All authors have read and agreed to the published version of the manuscript.

Funding

National Natural Science Foundation of China (52179143); Natural Science Basic Research Program of Shaanxi Province (2023-JC-YB-383); Key Industry Innovation Chain of Shaanxi (2022ZDLNY02-04).

Institutional Review Board Statement

Not applicable.

Informed Consent Statement

Not applicable.

Data Availability Statement

The data presented in this study are openly available in China National Knowledge Infrastructure at https://doi.org/10.27398/d.cnki.gxalu.2023.001199 (accessed on 2 July 2024).

Conflicts of Interest

The authors declare no conflicts of interest.

References

  1. Marsal, R.J. Mechanical properties of rockfill. In Embankment Dam Engineering Casagrande Volume; Wiley: New York, NY, USA, 1973. [Google Scholar]
  2. Hardin, B.O. Breakage of soil particles. J. Geotech. Eng. 1985, 111, 1177–1192. [Google Scholar] [CrossRef]
  3. Einav, I. Breakage mechanics—Part i: Theory. J. Mech. Phys. Solids 2007, 55, 1274–1297. [Google Scholar] [CrossRef]
  4. Wu, E.L.; Zhu, J.G.; Huang, W.; Liu, Z. Evolution law of particle breakage of coarse-grained soil during triaxial shearing. Chin. J. Geotech. Eng. 2020, 42, 2330–2335. [Google Scholar]
  5. Guo, W.L.; Zhu, J.G.; Wang, Q.L.; Yu, T. Mathematical model based on the gradation equation for predicting gradation evolution of coarse-grained soils. J. Cent. South Univ. (Sci. Technol.) 2018, 49, 2076–2082. [Google Scholar]
  6. Tao, Q.D.; He, Z.Y.; Jia, Y. Strength Characteristics and Influencing Factors of Soil-rock Mixture Based on Large Triaxial Test. Sci. Technol. Eng. 2019, 19, 310–318. [Google Scholar]
  7. Tu, Y.L.; Liu, X.R.; Ren, Q.Y.; Chai, H.J.; Wang, J.B.; Yu, J.Y. Effects of rock contents and particle breakage on strength characteristics of soil-rock aggregate. Rock Soil Mech. 2020, 41, 3919–3928. [Google Scholar]
  8. Lei, X.D.; Yang, Z.P.; Zhang, X.J.; Tu, Y.L.; Liu, S.L.; Hu, Y.X. Shear properties and rock block breakage characteristics of soil-rock mixtures. Rock Soil Mech. 2018, 39, 899–908+916. [Google Scholar]
  9. Yang, S.; Li, X.Q. Simulation Analysis of Large Direct Shear Test of Soil and Rock Mixture Based on PFC3D. Adv. Eng. Sci. 2020, 52, 78–85. [Google Scholar]
  10. Hu, W.; Dano, C.; Hicher, P.-Y.; Le Touzo, J.-Y.; Derkx, F.; Merliot, E. Effect of sample size on the behavior of granular materials. Geotech. Test. J. 2011, 34, 103095. [Google Scholar] [CrossRef]
  11. Jiang, M.J.; Ji, E.Y.; Wang, T.C.; Li, S.; Zhu, J.; Mei, G. Experimental study on laws of scale effects of shear strength of coarse-grained soils. Chin. J. Geotech. Eng. 2023, 45, 855–861. [Google Scholar]
  12. Cai, Z.Y.; Li, X.M.; Guan, Y.F.; Huang, Y.H. Particle breakage rules of rockfill materials. Chin. J. Geotech. Eng. 2016, 38, 923–929. [Google Scholar]
  13. Guo, W.L.; Zhu, J.G.; Qian, B.; Zhang, D. Particle breakage evolution model of coarse-grained soil and its experimental verification. Rock Soil Mech. 2019, 40, 1023–1029. [Google Scholar]
  14. Wu, X.L.; Shi, B.X.; Liu, S.C.; Xu, W.W.; Chang, W.K. Large-scale Triaxial Test of Rockfill Material Considering Particle Breakage. Sci. Technol. Eng. 2022, 22, 749–756. [Google Scholar]
  15. Liang, P.; Yang, Y.; Huang, H.; Liu, J.; Guo, N. Experimental Study on Fractal Characteristics of Particle Size Distribution by Repeated Compaction of Road Recycling Crushed Stone. Appl. Sci. 2022, 12, 10303. [Google Scholar] [CrossRef]
  16. Shi, Z.M.; Zhao, X.W.; Peng, M. Review of Studies on Large Scale Triaxial Tests of Coarse-Grained Soils. J. Eng. Geol. 2014, 22, 792–796. [Google Scholar]
  17. Liu, M.C.; Meng, F.; Wang, Y.Y. Evolution of particle crushing of coarse-grained materials in large-scale triaxial tests. Chin. J. Geotech. Eng. 2020, 42, 561–567. [Google Scholar]
  18. Yu, F. Particle breakage in granular soils: A review. Part. Sci. Technol. 2021, 39, 91–100. [Google Scholar] [CrossRef]
  19. Muir Wood, D.; Maeda, K. Changing grading of soil: Effect on critical state. Acta Geotech. 2008, 3, 3–14. [Google Scholar] [CrossRef]
  20. Mandelbrot, B.B.; Wheeler, J.A. The fractal geometry of nature. Am. J. Phys. 1983, 51, 286–287. [Google Scholar] [CrossRef]
  21. Du, J.; Hou, K.P.; Liang, W.; Peng, G.C. Experimental study of compaction characteristics and fractal feature in breakage of coarse-grained soils. Rock Soil Mech. 2013, 34, 155–161. [Google Scholar]
  22. Tyler, S.W.; Wheatcraft, S.W. Fractal scaling of soil particle-size distributions: Analysis and limitations. Soil Sci. Soc. Am. J. 1992, 56, 362–369. [Google Scholar] [CrossRef]
  23. Shi, X.S.; Cheng, Z.L. fractal behavior in crushing of rockfill material. Chin. J. Rock Mech. Eng. 2010, 29, 3852–3857. [Google Scholar]
  24. Ding, L.N.; Li, G.Y. SBG model for particle breakage of rockfills based on fractal gradation equation. Chin. J. Geotech. Eng. 2022, 44, 264–270. [Google Scholar]
  25. GB/T 50123-2019; Standard for Geotechnical Testing Method. Chinese Standard: Beijing, China, 2019. (In Chinese)
  26. Manzari, M.T.; Dafalias, Y.F. A critical state two-surface plasticity model for sand. Géotechnique 1997, 47, 255–272. [Google Scholar] [CrossRef]
  27. Liu, H.L.; Qin, H.Y.; Gao, Y.F.; Zhou, Y.D. Experimental study on particle breakage of rockfill and coarse aggregates. Rock Soil Mech. 2005, 26, 562–566. [Google Scholar]
  28. Guo, Y.; Zhang, J.; Li, M.; Timms, W.; Shen, L.; Li, P. Effects of Loading Stress and Velocity on Compression and Particle Breakage Behaviour of Waste Rocks in Backfill Coal Mining. Appl. Sci. 2022, 12, 11175. [Google Scholar] [CrossRef]
  29. Liu, Y.; Yu, P.Q.; Zhang, D.; Wang, X.X. Micromechanics-based stress-dilatancy relationship for granular materials. Chin. J. Geotech. Eng. 2021, 43, 1816–1824. [Google Scholar]
  30. Cai, Z.Y.; Hou, H.Y.; Zhang, J.X.; Zhang, F.; Guan, Y.; Cao, Y. Experimental study on the influence of density and stress level on particle breakage of coral sand. Shuili Xuebao 2019, 50, 184–192. [Google Scholar]
  31. Guo, W.L.; Zhu, J.G.; Peng, W.M. Dilatancy equation and generalized plastic constitutive model for coarse-grained soils. Chin. J. Geotech. Eng. 2018, 40, 1103–1110. [Google Scholar]
  32. Cai, Z.Y.; Zhong, Q.M.; He, N.; Xia, Y.F.; Zhu, J.G. Research Framework of the State-dependent Dilatancy Theory and Breach Evolution Law of Landslide Dam. Adv. Eng. Sci. 2021, 53, 21–32. [Google Scholar]
  33. Shi, B.X.; Liu, S.C.; Wu, X.L.; Chang, W.K. Dilatancy behaviors of rockfill materials considering particle breakage. Chin. J. Geotech. Eng. 2021, 43, 1360–1366. [Google Scholar]
  34. Zhang, Z.P.; Fu, X.D.; Sheng, Q.; Yin, D.; Song, D.; Du, Y. A non-linear ultimate strength criterion for soil-rock mixture based on rock block proportion. Chin. J. Rock Mech. Eng. 2021, 40, 1672–1686. [Google Scholar]
  35. Duncan, J.M.; Byrne, P.; Wong, K.S.; Mabry, P. Strength, stress-strain and bulk modulus parameters for finite element analyses of stresses and movements in soil masses. J. Consult. Clin. Psychol. 1980, 49, 554–567. [Google Scholar]
  36. Liu, X.R.; Tu, Y.L.; Wang, P.; Zhong, Z.L.; Tang, W.B.; Du, L.B. Particle breakage of soil-rock aggregate based on large-scale direct shear tests. Chin. J. Geotech. Eng. 2017, 39, 1425–1434. [Google Scholar]
Figure 1. Schematic diagram of the definition of the current breakage, BW and BC.
Applsci 14 05899 g001
Figure 2. Schematic diagram of calculation area of gradation equation.
Applsci 14 05899 g002
Figure 3. Construction site drawing of the slag dump.
Applsci 14 05899 g003
Figure 4. Test material.
Applsci 14 05899 g004
Figure 5. Grading curve of the S-RM before shearing.
Applsci 14 05899 g005
Figure 6. Triaxial testing machine.
Applsci 14 05899 g006
Figure 7. Stress–strain relations of different types of samples in the triaxial tests: (a) dry density of 1.76 g/cm3, (b) dry density of 1.82 g/cm3, (c) dry density of 2.00 g/cm3, (d) dry density of 2.15 g/cm3, and (e) dry density of 2.30 g/cm3.
Applsci 14 05899 g007
Figure 8. Relationship between M p t and σ 3 .
Applsci 14 05899 g008
Figure 9. Grading curve of the soil-rock mixture before and after shearing: (a) dry density of 1.76 g/cm3, (b) dry density of 1.82 g/cm3, (c) dry density of 2.00 g/cm3, (d) dry density of 2.15 g/cm3, and (e) dry density of 2.30 g/cm3.
Applsci 14 05899 g009
Figure 10. Histogram of the content of each granule with a density of 2.00 g/cm3. (a) Histogram of the content of each grain group. (b) Histogram of the content change of each grain group.
Applsci 14 05899 g010
Figure 11. Histogram of the content of each granule at a confining pressure of 400 kPa. (a) Histogram of the content of each grain group. (b) Histogram of the content change of each grain group.
Applsci 14 05899 g011
Figure 12. Fractal dimension D fitting diagram: (a) dry density of 1.76 g/cm3, (b) dry density of 1.82 g/cm3, (c) dry density of 2.00 g/cm3, (d) dry density of 2.15 g/cm3, (e) dry density of 2.30 g/cm3, and (f) before test.
Applsci 14 05899 g012aApplsci 14 05899 g012b
Figure 13. The relationship between fractal dimension D and fragmentation index BC.
Applsci 14 05899 g013
Figure 14. Relationship curve between the breakage index and failure dilatancy rate.
Applsci 14 05899 g014
Figure 15. Mohr circle and strength envelope diagram of sample with dry density of 1.82 g/cm3.
Applsci 14 05899 g015
Figure 16. Relationships between the confining pressure σ 3 and internal friction angle φ .
Applsci 14 05899 g016
Figure 17. Relationship between the internal friction angle and the particle breakage index. (a) Relationship curve between the breakage index and internal friction angle. (b) Relationship curve between the fractal dimension and the internal friction angle.
Applsci 14 05899 g017
Table 1. Relative density test results.
Test Number Minimum Dry Density g/cm3Maximum Dry Density g/cm3Sample Dry Density g/cm3Initial Void Ratio e0
11.651.851.760.61
21.711.911.820.55
31.822.152.000.42
41.982.282.150.32
52.162.392.300.23
Table 2. Screening results of S-RMS after shearing.
ρd
(g/cm3)
σ3
(kPa)
Different Particle Size of Each Particle Group Content (%)
60~40 mm40~20 mm20~10 mm10~5 mm5~2 mm2~1 mm1~0.5 mm0.5~0.25 mm<0.25 mm
Before test 9.00 20.20 16.60 9.50 7.10 3.10 8.60 8.20 17.70
1.761008.40 19.50 16.70 10.20 7.20 3.10 8.70 8.30 17.90
2007.60 19.10 15.50 9.50 7.70 3.30 9.30 8.90 19.10
4007.00 17.70 14.80 10.50 7.90 3.50 9.60 9.20 19.80
8006.40 17.00 14.40 10.30 8.20 3.60 10.00 9.50 20.60
1.821007.90 18.70 16.40 9.60 7.50 3.30 9.10 8.70 18.80
2007.30 18.40 14.90 10.10 7.80 3.40 9.50 9.00 19.60
4006.20 18.10 13.40 9.50 8.40 3.70 10.20 9.70 20.80
8006.00 17.40 13.10 8.90 8.70 3.80 10.50 10.00 21.60
2.001006.90 17.70 17.80 11.70 7.30 3.20 8.80 8.40 18.20
2006.50 15.50 16.20 11.40 8.00 3.50 9.70 9.30 19.90
4006.00 14.90 15.70 11.20 8.30 3.60 10.00 9.60 20.70
8005.40 13.00 15.30 10.90 8.80 3.80 10.70 10.20 21.90
2.151006.20 18.20 16.00 9.10 8.00 3.50 9.70 9.30 20.00
2006.10 17.90 14.90 8.40 8.40 3.70 10.10 9.80 20.70
4006.00 17.50 14.30 8.10 8.60 3.70 10.40 9.90 21.50
8004.80 16.80 13.10 7.50 9.20 4.00 11.10 10.60 22.90
2.301005.80 18.30 15.70 9.10 8.10 3.50 9.80 9.40 20.30
2005.70 17.70 14.70 9.10 8.40 3.70 10.20 9.70 20.80
4005.30 16.90 13.70 8.90 8.70 3.80 10.60 10.10 22.00
8004.40 15.70 12.30 8.00 9.50 4.10 11.50 10.90 23.60
Table 3. Calculation results of the particle breakage index.
ρd
(g/cm3)
σ3
(kPa)
DBC (%)
Before test/2.7080/
1.761002.70860.94
2002.72152.40
4002.72643.93
8002.73355.05
1.821002.71742.15
2002.72483.40
4002.73805.31
8002.74486.16
2.001002.70753.09
2002.72605.56
4002.73226.57
8002.74318.62
2.151002.72864.54
2002.73765.24
4002.74275.82
8002.75548.05
2.301002.73094.98
2002.73705.76
4002.74526.97
8002.76019.31
Table 4. Peak shear stress and shear strength index under different dry densities.
Numberρd
g/cm3
(σ1σ3)f kPa
100200400800
11.76473.2770.11350.82311.8
21.82548.8906.51520.82610.8
32.00805.21085.61782.23083.1
42.15812.71150.31832.93196.0
52.30978.71383.92095.63587.4
Table 5. Shear strength parameters of samples with different dry densities.
ρd (g/cm3) σ 3 (kPa)φφ0φ c /kPa
1.7610036.6336.551.7257
20036.33
40036.00
80035.01
1.8210038.5538.442.2373
20038.10
40037.66
80036.46
2.0010040.8640.602.46109
20039.42
40039.30
80038.43
2.1510041.4541.342.71112
20040.51
40039.72
80039.20
2.3010043.8543.763.14127
20043.09
40041.66
80041.11
Disclaimer/Publisher’s Note: The statements, opinions and data contained in all publications are solely those of the individual author(s) and contributor(s) and not of MDPI and/or the editor(s). MDPI and/or the editor(s) disclaim responsibility for any injury to people or property resulting from any ideas, methods, instructions or products referred to in the content.

