Article

A Blockchain-Driven Smart Broker for Data Quality Assurance of the Tagged Periodic IoT Data in Publisher-Subscriber Model

1
School of ICT, University of Tasmania, Sandy Bay, TAS 7005, Australia
2
School of Information Technology, Deakin University, Geelong, VIC 3221, Australia
*
Author to whom correspondence should be addressed.
Appl. Sci. 2024, 14(13), 5907; https://doi.org/10.3390/app14135907 (registering DOI)
Submission received: 12 May 2024 / Revised: 19 June 2024 / Accepted: 28 June 2024 / Published: 5 July 2024

Abstract

:
The Publisher-Subscriber model of data exchange has been a popular method for many Internet-based applications, including the Internet of Things (IoT). A traditional PS system consists of publishers, subscribers, and a broker. The publishers create new data for a registered topic, and the data broker relays the data to the corresponding subscribers. This paper introduces a blockchain-based smart broker for the publisher-subscriber (PS) framework for the IoT network. As IoT data comes from devices operating in various environments, it may suffer from multiple challenges, such as hardware failures, connectivity issues, and external vulnerabilities, thereby impacting data quality in terms of accuracy and timeliness. It is important to monitor this data and inform subscribers about its quality. The proposed smart broker is composed of multiple smart contracts that continuously monitor the quality of the topic data by assessing its relationship with other related topics and its drift or delay in publishing intervals. It assigns a reputation score to each topic computed based on its quality and drifts, and it passes both the original data and the reputation score as a measure of quality to the subscriber. Furthermore, the smart broker can suggest substitute topics to subscribers when the requested topic data are unavailable or of very poor quality. The evaluation shows that a smart broker efficiently monitors the reputation of the topic data, and its efficiency increases notably when the data quality is worse. As the broker is run inside the blockchain, it automatically inherits the advantages of the blockchain, and the quality scoring is indisputable based on immutable data.

1. Introduction

The growing use of Internet of Things (IoT) data has brought the issue of data quality to the forefront of discussions surrounding IoT [1,2]. IoT applications, which rely on data generated by a multitude of sensors and devices, often contend with challenges related to the quality of this data [3,4]. IoT systems often use the Publisher-Subscriber model to exchange data between different stakeholders in the system [5]. In the current architecture [6,7], the data broker that manages the communication between IoT publishers and subscribers in the application network performs a dumb role as a relay. It gathers and organizes data coming from the IoT devices and passes them to the subscribers. However, IoT devices operate in challenging environments, making them susceptible to hardware failures, connectivity issues, and external vulnerabilities [8], which contribute to a drop in the quality of the data. Hardware failures and connectivity issues can disrupt the timely publishing of data, resulting in intervals that are delayed or irregular, ultimately affecting the trustworthiness of the information presented [9]. When the broker collects the data from devices that lack reliability, the quality of the data is compromised right from the initial stages [10]. Traditional data brokers focus on relaying the data between registered nodes—subscribers and publishers [11]. They have limited visibility, that is, understanding of the individual publishers’ (devices) performances at a given time.
Such brokers also do not have the analytical capabilities to compare the data streams with each other by design. The subscribers determine the quality or trust of the data upon receiving them at their end. In our proposed approach, the smart broker is given more power—monitoring and comparison. The smart broker already receives a range of data from various sources as real-time streams.
Obviously, there are no guaranteed relationships between such streams; however, over time, the smart broker can learn the bigger picture of an IoT system’s situation based on all the sensor data associated with it. Based on this, the smart broker can pass on a comment to the subscriber about the quality of the data. This avoids revealing actual data from unauthorized streams to a particular subscriber but still provides additional information.
In this paper, we deal with the quality of the data in terms of individual device performance. The quality issue may result from either the IoT end device’s own failures or due to an actual environmental change. It is assumed that an IoT sensor network is deployed in close proximity, monitoring the same target objects/space, and should agree with those other related devices [12]. This relationship of the devices due to deployment means one can make a group of devices that are closely related (directly or inversely), and this is exploited to characterize the quality of the data coming into a PS topic from a single device.
Usually, data brokers in the IoT do not recognize unreliable devices or publishers and detect the generation of unreliable data. This paper introduces a smart broker with a new blockchain-driven architecture designed to ensure acceptable data quality for subscribers. The new contributions are with regard to components of the smart broker, as follows:
(a)
An innovative topic drift monitoring module that keeps track of data publishing schedules.
(b)
A data quality assessment module. This module evaluates the quality of the data on the publisher’s topics. The smart broker identifies and flags unreliable topics through a peer assessment with other similar data streams in the same time frame. The blockchain guarantees that the quality assessment is impartial and timely.
We have chosen linear covariance calculations as a measure of the relationship between a predefined group of topics. This satisfies the needs of a smart broker; however, we have designed a flexible smart broker that can use better mechanisms for quality measurement.
(c)
A topic reputation scoring mechanism continuously assigns a score to each topic as a function of the quality and drift score of the topic data. This real-time score provides subscribers with current information on the topic, enabling them to make informed decisions based on the topic’s current reputation status.
(d)
The smart broker also acts as a recommender system for subscribers when the requested data are unavailable. Based on the subscriber’s original request, it offers the most reliable, relevant, and relatable data.
It is to be noted that the smart broker may be implemented without the blockchain, like a normal MQTT broker. But, without the blockchain, it loses the purpose of ensuring data integrity and impartiality in quality calculations. Hence, we propose an architecture that is suitable for blockchain. However, for the remainder of the paper, we assume that a publisher-subscriber broker can be deployed with blockchain as the back end [13,14] just like any traditional database.
The remainder of this article is organized as follows: Section 2 describes the related studies and limitations of the existing blockchain-based publisher subscriber, particularly in terms of providing quality-based data that subscribers can trust. Section 3 presents a new blockchain-based PS model with a smart broker. The detailed design of the smart broker is given in Section 4. The implementation details and the performance evaluation are discussed in Section 5. Section 6 highlights the advantages of the smart broker, along with its limitations and the additional study needed to further improve its efficiency. Finally, Section 7 concludes the article.

2. Related Works

This section discusses the related study regarding limitations in the existing PS models and the blockchain-based PS models in terms of guaranteeing the delivery of high-quality data that subscribers can fully trust.

2.1. Existing Publisher-Subscriber Approach

2.1.1. Centralized Architecture

The quality of IoT data is significantly influenced by the centralized ownership of data brokers [15]. Centralized nature poses inherent risks, as unauthorized access could compromise data integrity [16]. Tampering incidents pose a significant threat [17], as any alterations to the collected data can result in the dissemination of poor-quality data to the subscribers [18]. A decentralized architecture would provide enhanced security, making it more challenging to tamper with the data before it is sent to the subscriber [19].
The centralized architecture of the data broker preceding data transmission to the IoT platform is susceptible to various vulnerabilities, including data tampering, which can compromise data quality [20]. Past studies have sought to enhance the security of this storage by integrating it with blockchain networks [21,22,23,24,25,26,27,28]. The smart broker is the best alternative solution to this, as it already receives all the data in real time and can make opinions about the data relative to other data in real time without worrying about storing any information for a long period of time.

2.1.2. Scalability and Efficiency Issues

PS brokers for IoT data can face significant scalability issues, primarily due to the huge volume and velocity of data generated by numerous connected devices. These models often struggle to process and transmit data in real time, creating performance bottlenecks as the number of devices increases [21,29]. Blockchain’s decentralized and immutable ledger has been shown to efficiently handle large-scale IoT data by distributing the workload across a network of nodes, thus preventing bottlenecks and enhancing system resilience and performance. For example, the REEDS system (Revocable End-to-End Encrypted Message Distribution System) proposed in [30] utilizes blockchain’s decentralized nature to provide secure and efficient data storage and processing, ensuring data integrity and reducing latency through automated transactions and data verification via smart contracts. Other works mentioned [31] focus on implementing blockchain technology for various IoT-based applications to improve the security and scalability issues of IoT. Although we do not focus on the scalability issues in this paper, previous studies suggest that the scalability-related challenges are the same whether blockchain is used or not.

2.1.3. Quality Issue

The data quality can be measured from various points of view in the IoT [32], but the most fundamental of those is the intrinsic data quality, which measures the accuracy and trustworthiness [33]. Our proposed smart broker measures data quality by considering only the incoming publisher data as a big data set. This incorporates various aspects of ISO 8000 specifications, such as timeliness and reducing redundancies [34]. However, it also ignores the subscriber’s characteristics and desires. This is due to the basic nature of publisher-subscriber architecture, which only focuses on the fast distribution of incoming publisher data.

2.2. Blockchain-Based Publisher Subscribers

The study presented in [5] introduces ‘Pub-SubMCS’, a privacy-preserving decentralized framework for MCS systems. Using a publish-subscribe model enables data sharing, allowing subscribers to match existing data requests or create new tasks with specific requirements. While the pub–sub-model conserves resources, it exacerbates sensing issues, addressed by Pub-SubMCS through smart contract-based access control. This ensures the early identification and penalization of malicious workers. Data privacy and validation are ensured through blockchain by employing data transformation techniques, such as normalization, and utilizing the Pearson correlation coefficient measure to assess similarity in collected sensor data. However, the Pearson correlation alone may not suffice for assessing similarity in collected sensor network data, particularly in real-world scenarios where identical data types may be unavailable. In such cases, the inclusion of sensor associations become crucial for selecting alternative data sources. This approach ensures a more comprehensive measure of similarity, accommodating situations where the exact data sought may not be present.
Trinity [15] pioneered the integration of the Publisher-Subscriber model with blockchain. However, it presumed data accuracy without addressing the challenge of storing substantial volumes on the blockchain. Unlike Trinity’s decentralized approach, which uses multiple brokers, this research sets the broker directly on blockchain technology, offering a more streamlined and integrated solution.
Other recent blockchain-based publisher-subscriber models presented in [35,36], [13,37,38], and [14,39,40] mainly focused on authentication, data privacy, and improving the quality of service. However, the quality assessment of the data itself remains unaddressed. Another critical aspect of the smart broker with blockchain is that the blockchain needs to be permissioned. It does not need currency, and the consensus mechanism can be proof-of-work or similar. To be most effective, permissioned peer publishers’ static information, for example, identification details, can be verified in the real world, at least initially.

2.3. Trust vs. Quality

Establishing trust between IoT users and data brokers relies significantly on data quality, which is a crucial factor often overlooked in current research. Quality is assumed to be a subset of trust, implying that if the data are of good quality, a certain degree of trust builds between the IoT users [41,42]. IoT end-users, lacking the means to independently verify data quality, must rely on the trustworthiness of brokers. While existing studies prioritize privacy and security concerns [43], as demonstrated in the study proposed by [44,45], the importance of data quality in building trust between IoT users and brokers is often neglected.

2.4. Recommendation Strategies

In the IoT environment, IoT devices often face resource limitations and increased vulnerability to malicious attacks. Therefore, many trust-based recommendation systems, such as TRec [46], have also been introduced. It is a lightweight trust inference model for service-centric IoT that enhances trust-based recommendation in the SIoT by employing a weighted centrality metric and trust path section algorithm to establish trust. It integrates factors like rating, direct trust, and indirect trust into a matrix factorization model to enhance the accuracy of predicting ratings. Another technique presented in [47], integrates collaborative and content-based filtering along with AI technology to enhance cyber-physical system security. This approach captures interaction data between Mashup and Web services, extracting semantic similarities. Implemented in a deep neural network, it predicts Mashup service ratings, improving security and service quality in CPSs.
The recommendation strategy proposed in [48] is COSS, the first Content-based Subscription Service designed specifically for IoT. With inherent multitenant support and accessible REST APIs, COSS tackles the challenge of Balanced Rule Engine Partitioning. It addresses the NP hardness of dynamically adapting message distribution based on workload history, ensuring scalability and high performance for content-based subscriptions in IoT applications. The recommendation strategy proposed in [49] involves deploying a blockchain-IoT-based model to enhance the logistic process. Other strategies proposed in [50,51,52] are efficient in providing recommendations based on similarity or user preference.

3. Proposed Architecture Overview

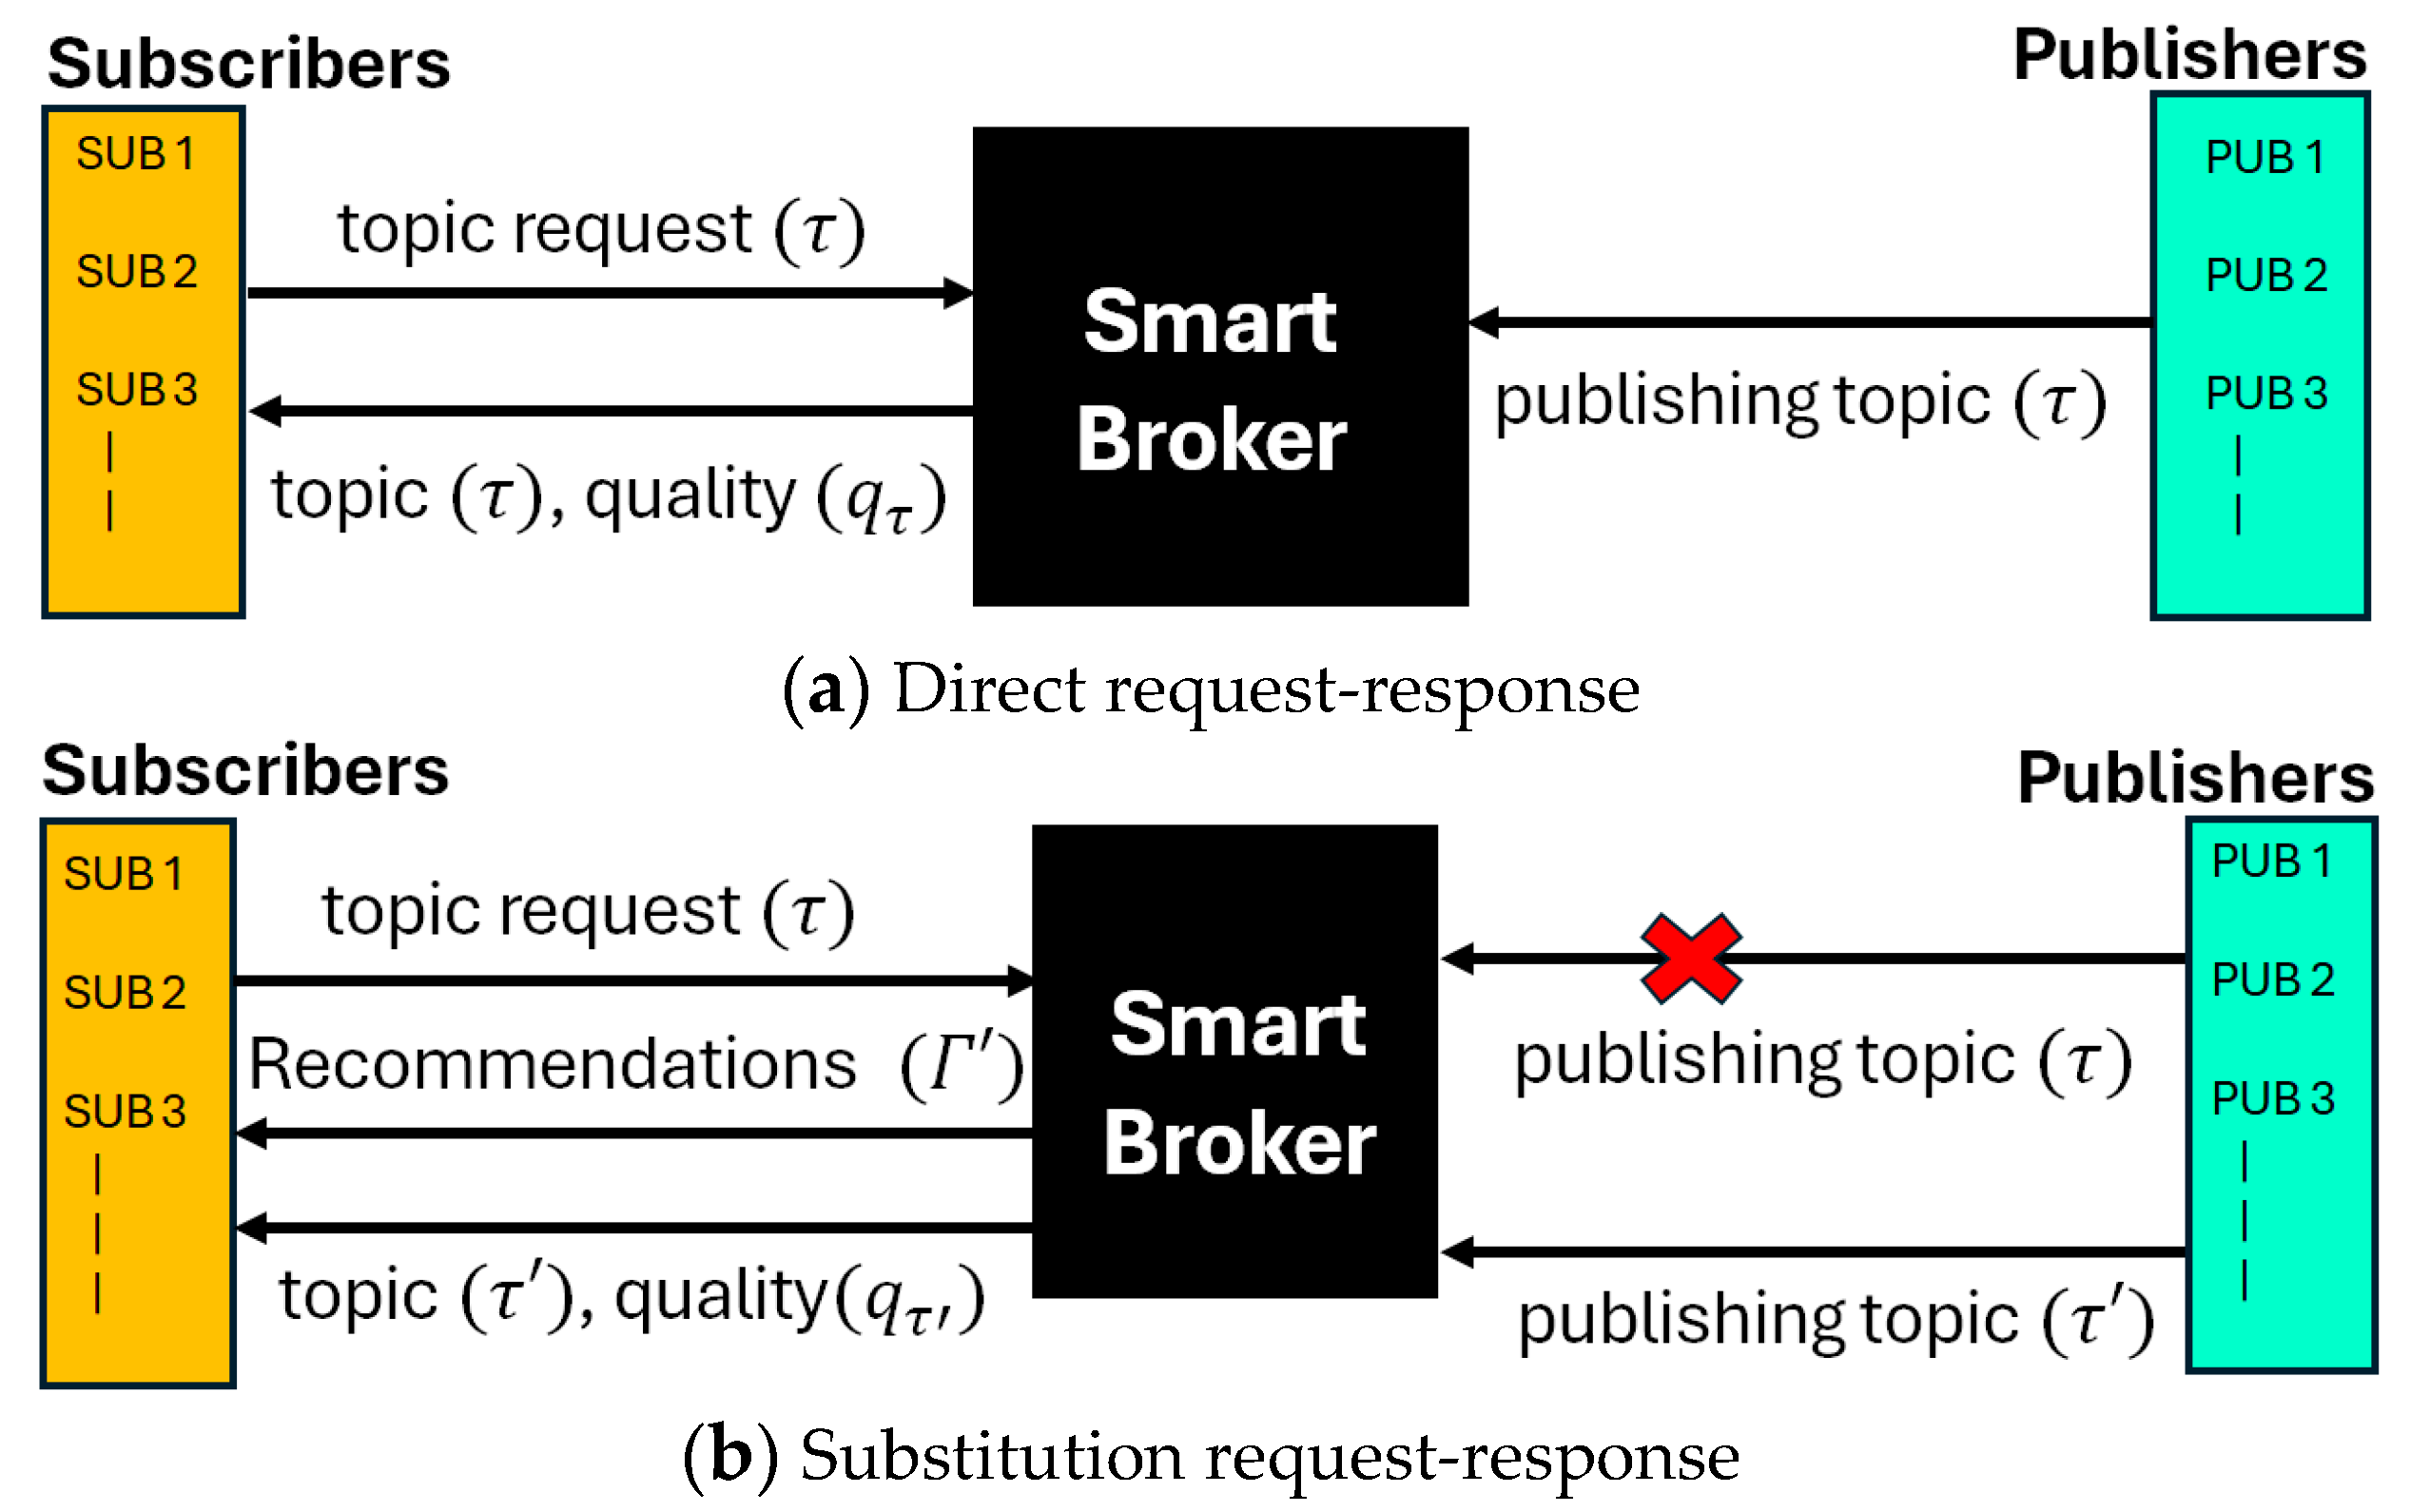
3.1. Request–Response Model

In this study, we define a new request–response model that consists of a smart broker designed to manage subscriber requests for topics and deliver them with a quality score (see Figure 1). There are two types of requests in this model, as follows:
  • Direct Request–Response: Like traditional PS models, the subscriber asks for data for a topic (τ), and the smart broker responds with the data. Along with the data, the broker also sends a quality score qτ [0, 1]. It is expected that the broker, if based on a blockchain, will provide reliable, unbiased, and quality information.
  • Substitution Request–Response: A special case arises in this model when the requested data are not present at the current time. As the broker is smart and based on blockchain, it can recommend some other topics to the subscriber that are similar to the topic originally requested. These substitution recommendations may also be given if the quality of the data for the qτ drops dramatically. It is then up to the subscriber to decide on a recommended topic. Once the subscriber chooses a substitute topic τ′, further communication follows the direct request–response as before.
Figure 1. The request–response model consists of a smart broker, publishers, and subscribers.
Applsci 14 05907 g001
To achieve this model in a PS application, several new procedures have been developed, including protocols for publishers to join the PS system, assessment of the data quality, and running the processes from within a blockchain.

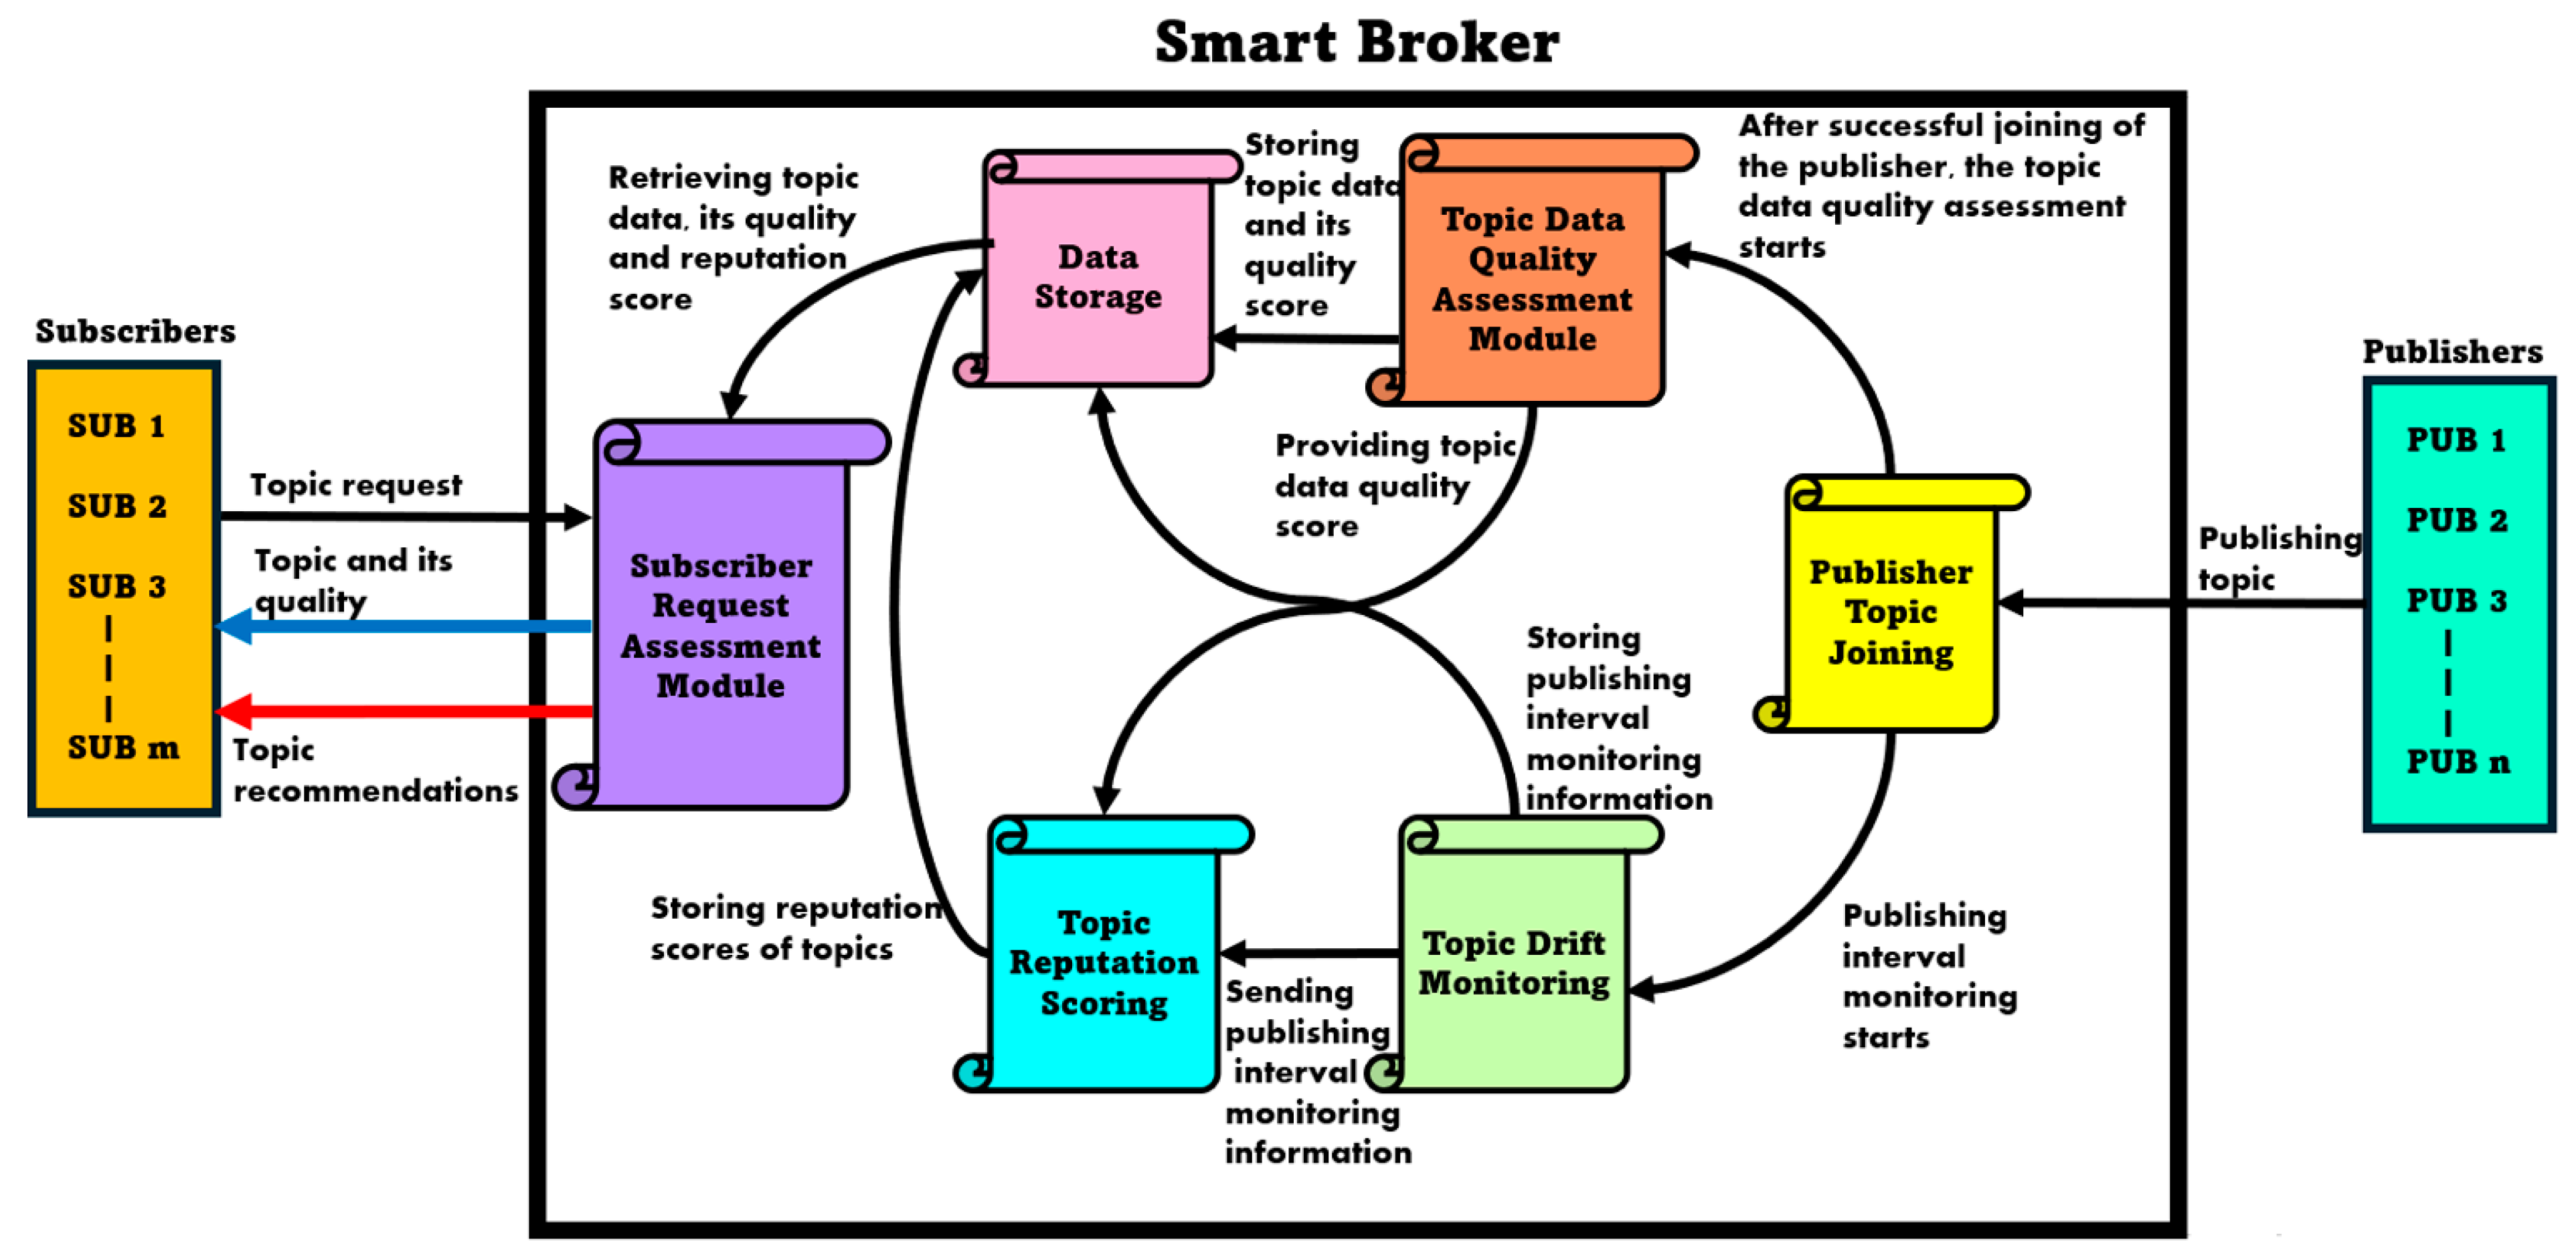
3.2. Proposed System Architecture: Smart Broker

In this new blockchain-driven PS architecture, the smart broker has the following new capabilities compared to a traditional PS broker:
  • Calculating the quality of data for the publishers. This is typically performed for individual topics based on various parameters, such as relationship with other topics and timeliness.
  • Preparing a list of recommended topics based on the metadata of the topics in case a particular topic is not available.
The blockchain-driven model consists of several modules communicating with each other as depicted in Figure 2:
(1)
Publisher-topic registration serves as the first step for any new incoming publisher (IoT device) data within the smart broker. It enables the registration of topics by analyzing the presence of essential tags. Additionally, topics are manually grouped based on their correlation to one another.
(2)
The Topic Data Quality Assessment Module (TDQAM) assesses the reliability of registered publisher IoT data by checking its quality and promptly acting to flag publishers providing poor-quality data. The publisher’s data that has gone through reliability checks is granted access to the blockchain-based storage.
(3)
The blockchain-based Data Storage Module (DSM) is designed to store data from all the modules, including data that have passed the assessment checks, accompanied by its corresponding quality score.
(4)
Topic Drift Monitoring (TDM) monitors the publishing intervals of the publishers by detecting changes in the patterns of these intervals over time. It then transmits this information to the blockchain-based Topic Reputation Scoring (TRS) model.
(5)
The TRS continuously monitors the publisher’s reputation by using assessments from both TDQAM and TDM, providing reputation scores to each publisher. The Subscriber Request Assessment Module (SRAM) uses these reputation scores to prepare and send a publisher’s reputation score when a subscriber requests data from that publisher.
(6)
The SRAM manages IoT data requests from subscribers. It accepts incoming requests and delivers the requested data, along with its quality score, to the subscriber. It may also recommend substitute topics.
TDQAM, TDM, and TRS operate at regular time gaps of λ and w.
Figure 2. A detailed overview of the smart broker.
Applsci 14 05907 g002

3.3. Assumptions

This paper’s contributions make the assumptions as follows:
  • Tagged Data: It is assumed that publishers create a limited number of alphanumeric tags accurately for each topic they publish. This framework relies on these tags to identify potential substitutes.
  • Periodic Data: The data streams are periodic, that is, they are expected to send data at regular intervals. Periodicity assists in identifying delays in publishing intervals by establishing the expected timing for publication data and identifying deviations from these intervals.
  • Manual data stream grouping: To establish quality, the proposed methods rely on sensor associations based on their own proximity and the proximity of the observed environment. It is assumed that this association is performed manually as part of the topic registration, and a group has a minimum of three topics. Under normal circumstances, the blockchain can keep track of and confirm this relationship continuously.
For this paper, we consider that there is a fixed window of time wij, for which the time series in a group would follow a relationship (direct or inverse) at a degree of vij. This is a common feature in many IoT application data that track a periodic system. In this paper, a weather data set is used that exhibits this property [53]. However, in other practical applications, the windows themselves could vary over a period of time, and the expected relationship scores would also be different for those time periods. Such possibilities are not the focus of this paper, where we emphasize the smart broker’s structure and ability to detect quality and recommend substitutions.
  • Fixed Location: The IoT devices are assumed to be in fixed positions. These positions may be geographic or referential, such as in a building or factory. In other words, they are non-mobile by nature. Any change in the location needs to be updated in the blockchain and the pairings.

4. Design

The proposed architecture consists of two parallel running sections—mostly publisher-end modules that run according to data arriving at the broker from publishers and subscriber-end modules that accept and respond to subscribers’ requests. The most common and recurring system parameters considered in this paper are listed in Table 1.

4.1. Publisher-Topic Joining

4.1.1. Overview

The publisher establishes a connection with the blockchain network (smart broker) and then starts to register new topics. Each topic τ corresponds to a sensor that the publisher p is responsible for. The whole set of topics in the smart broker belonging to all publishers is as follows:
Γ = { τ 1 , τ 1 , , τ m }
where τi = {yi, Gi}. Equation (1) defines Γ as the sets of topics in the blockchain. Each τi contains tags that provide static information about the topic data. The set of tags is denoted as follows:
G = l , δ     g 1 ,   g 2 , , g n
Every G contains two specific tags required for the acceptance of the topic registration, along with other generic tags:
  • Location Tag (l): The location of the sensors collecting data related to τi is essential for SRAM to provide recommendations to subscribers. SRAM can recommend topics based on data from sensors that are closely related to each other.
  • Publishing interval Tag ( δ ) :The publishing interval of the data related to the τi denotes the frequency or timing at which the data are published. The publishing interval is used by the TDM to calculate the publishing interval monitoring score, which will ultimately be used to calculate the topic’s reputation score in the smart broker.
  • Other generic tags, such as sensor type, key timestamps, keywords, and measurement units, provide additional information and descriptions about the topic. There is both an upper and lower limit to the number of tags for a topic. This is to ensure that the recommendation process has sufficient data and, at the same time, is not biased toward any topic. Tags must also be chosen from a preset list of tags.

4.1.2. Topic Registration Process

The exact topic registration process will be different for smart brokers, depending on the data required for the specific quality assessment and recommendation technique used. But they would largely follow the following steps:
  • Upon receiving the publisher’s topic joining request, the smart broker first verifies the presence of essential tags in the topic.
  • Then, the manual data grouping of the topics takes place. It relies on the actual relationship that exists among the data streams. The correlation matrix (shown in Equation (3)) represents the actual relationship between the paired topics { τ i ,   τ j } . Each pair of correlated topics has a predefined expected correlation value ( v i j ) indicating the nature of their relationship within a range of −1 to 1, where 1 signifies a perfectly direct relationship, 0 denotes no relationship, and −1 represents a perfectly inverse relationship. These values are mapped to a range of 0 and 1 before storage in the database, where 1 indicates a perfect direct or indirect relationship, and 0 indicates no relationship. By default, v i j = 0 , indicating that there is no relation at all. Typically, the smart broker will ignore such values and only consider topic pairs where v i j 0 . This correlation matrix is used by the TDQAM to conduct quality checks on the topic data.
    C = τ 1 τ 2 τ m τ 1 λ 1 , 1 W 12 , V 12 W 1 m , V 1 m τ 2 W 21 , V 21 λ 2 , 1 W 2 m , V 2 m τ m W m 1 , V m 1 W m 2 , V m 2 λ m , 1
    where W i j = W j i = w i j 0 , w i j 1 , w i j 2     w i j k is the reputation time window set corresponding to the topics τi and τj. Each w i j k W i j has a corresponding v i j k , which is the expected correlation value in that window. As the time series is periodic, the set of windows W 21 will keep repeating infinitely. Additionally, λ is stored for the topic itself, which is another window for resetting drift scores. Typically, λ τ min i ϵ Γ w i τ to ensure that the drift score is calculated quickly enough for reputation scoring.
  • Finally, upon successful registration, the smart broker assigns a unique identity to the publisher topic and stores the identity in the blockchain. Upon successful registration, the publisher can start sending IoT data related to the topic.

4.2. Topic Drift Monitoring

This module penalizes the reputation of a topic for delays in data arrival. The TDM keeps track of how well data publishing stays on schedule. Initially, publishers specify their intended publication intervals ( δ ) for each topic. The TDM then monitors when each registered topic’s data are published to ensure that it aligns with the intended interval ( δ ) . Let us assume that t u λ is the time at which the uth data point has arrived, t 0 λ denotes the reference time from when the drift is measured, which is the beginning of the drift time window λ > δ. The uth data for τ must arrive at t 0 λ + u δ time, that is,
t u λ = t 0 λ + u δ
where λ = λ τ , from C in Equation (3). Based on this, the drifting score ( D τ ) is created as shown in Equation (12).
D τ = t u λ ( t 0 λ + u δ ) > μ 0 t u λ ( t 0 λ + u δ ) = 0 1 O t h e r w i s e 1 t u λ ( t 0 λ + u δ ) μ
where tolerance μ δ . If in Equation (12), both sides are equal, that is, the data are arriving at the correct time, the D τ = 1 , that is, when everything is perfect since t 0 λ . If the delay in the data is more than μ , then the D τ = 0 , which means that the data are no longer there and reliability with respect to time is zero. If 0 < t u λ ( t 0 λ + u δ ) < μ , then, the last part returns a score between 0 and 1. This drifting score, D τ , is used by the TRS further to calculate the overall topic reputation score. D is calculated at every interval of δ.
The drift in the topic can cause some unwanted problems, as it could occur that in a particular window, there is not enough data to calculate the quality. In such cases, the D would already become 0, and the quality calculations would be impacted. The value of µ should be set in a way such that the system quickly recognizes that excessive drift is occurring, resulting in difficulties with quality calculations as discussed below.

4.3. Topic Data Quality Assessment Module

The quality assessment method can be both supervised and unsupervised and relies on sensor association, requiring IoT data from at least three correlated time series. The TQDAM must satisfy the following characteristics at the minimum:
  • It needs to establish a reference mechanism to measure the correctness of the currently incoming data. This can be performed in two ways:
    • Absolute reference is where the user creates a set of static reference values, and quality is a measurement of deviation from these reference points. This can take the form of self-assessment with its own historical reference value. However, many sensor data may have randomness, meaning matching with its own history or fixed reference may be difficult.
    • Relative reference is peer assessment at the current time. If the IoT systems generate a continuous stream of data, then we get a multivariate time series. This mechanism would aim to establish the deviation of one topic’s data compared to other topics. In this paper, we focus on peer assessment using unsupervised methods.
  • A mechanism that only considers some of the latest incoming data points, that is, upgrading the quality score whenever the latest window of data are available. In the case of supervised mechanisms, methods of determining time windows may be different from those used in the paper.
  • The quality score should be on the same scale. In this paper, we aim to calculate everything as a real number between 0 (worst quality) and 1 (best quality). The scoring should also be uniform across all the topics.
  • The most important factor is to ensure that each data stream is evaluated in isolation while being compared to others, that is, the quality score calculation for each data stream must be calculated to reflect its own quality only.

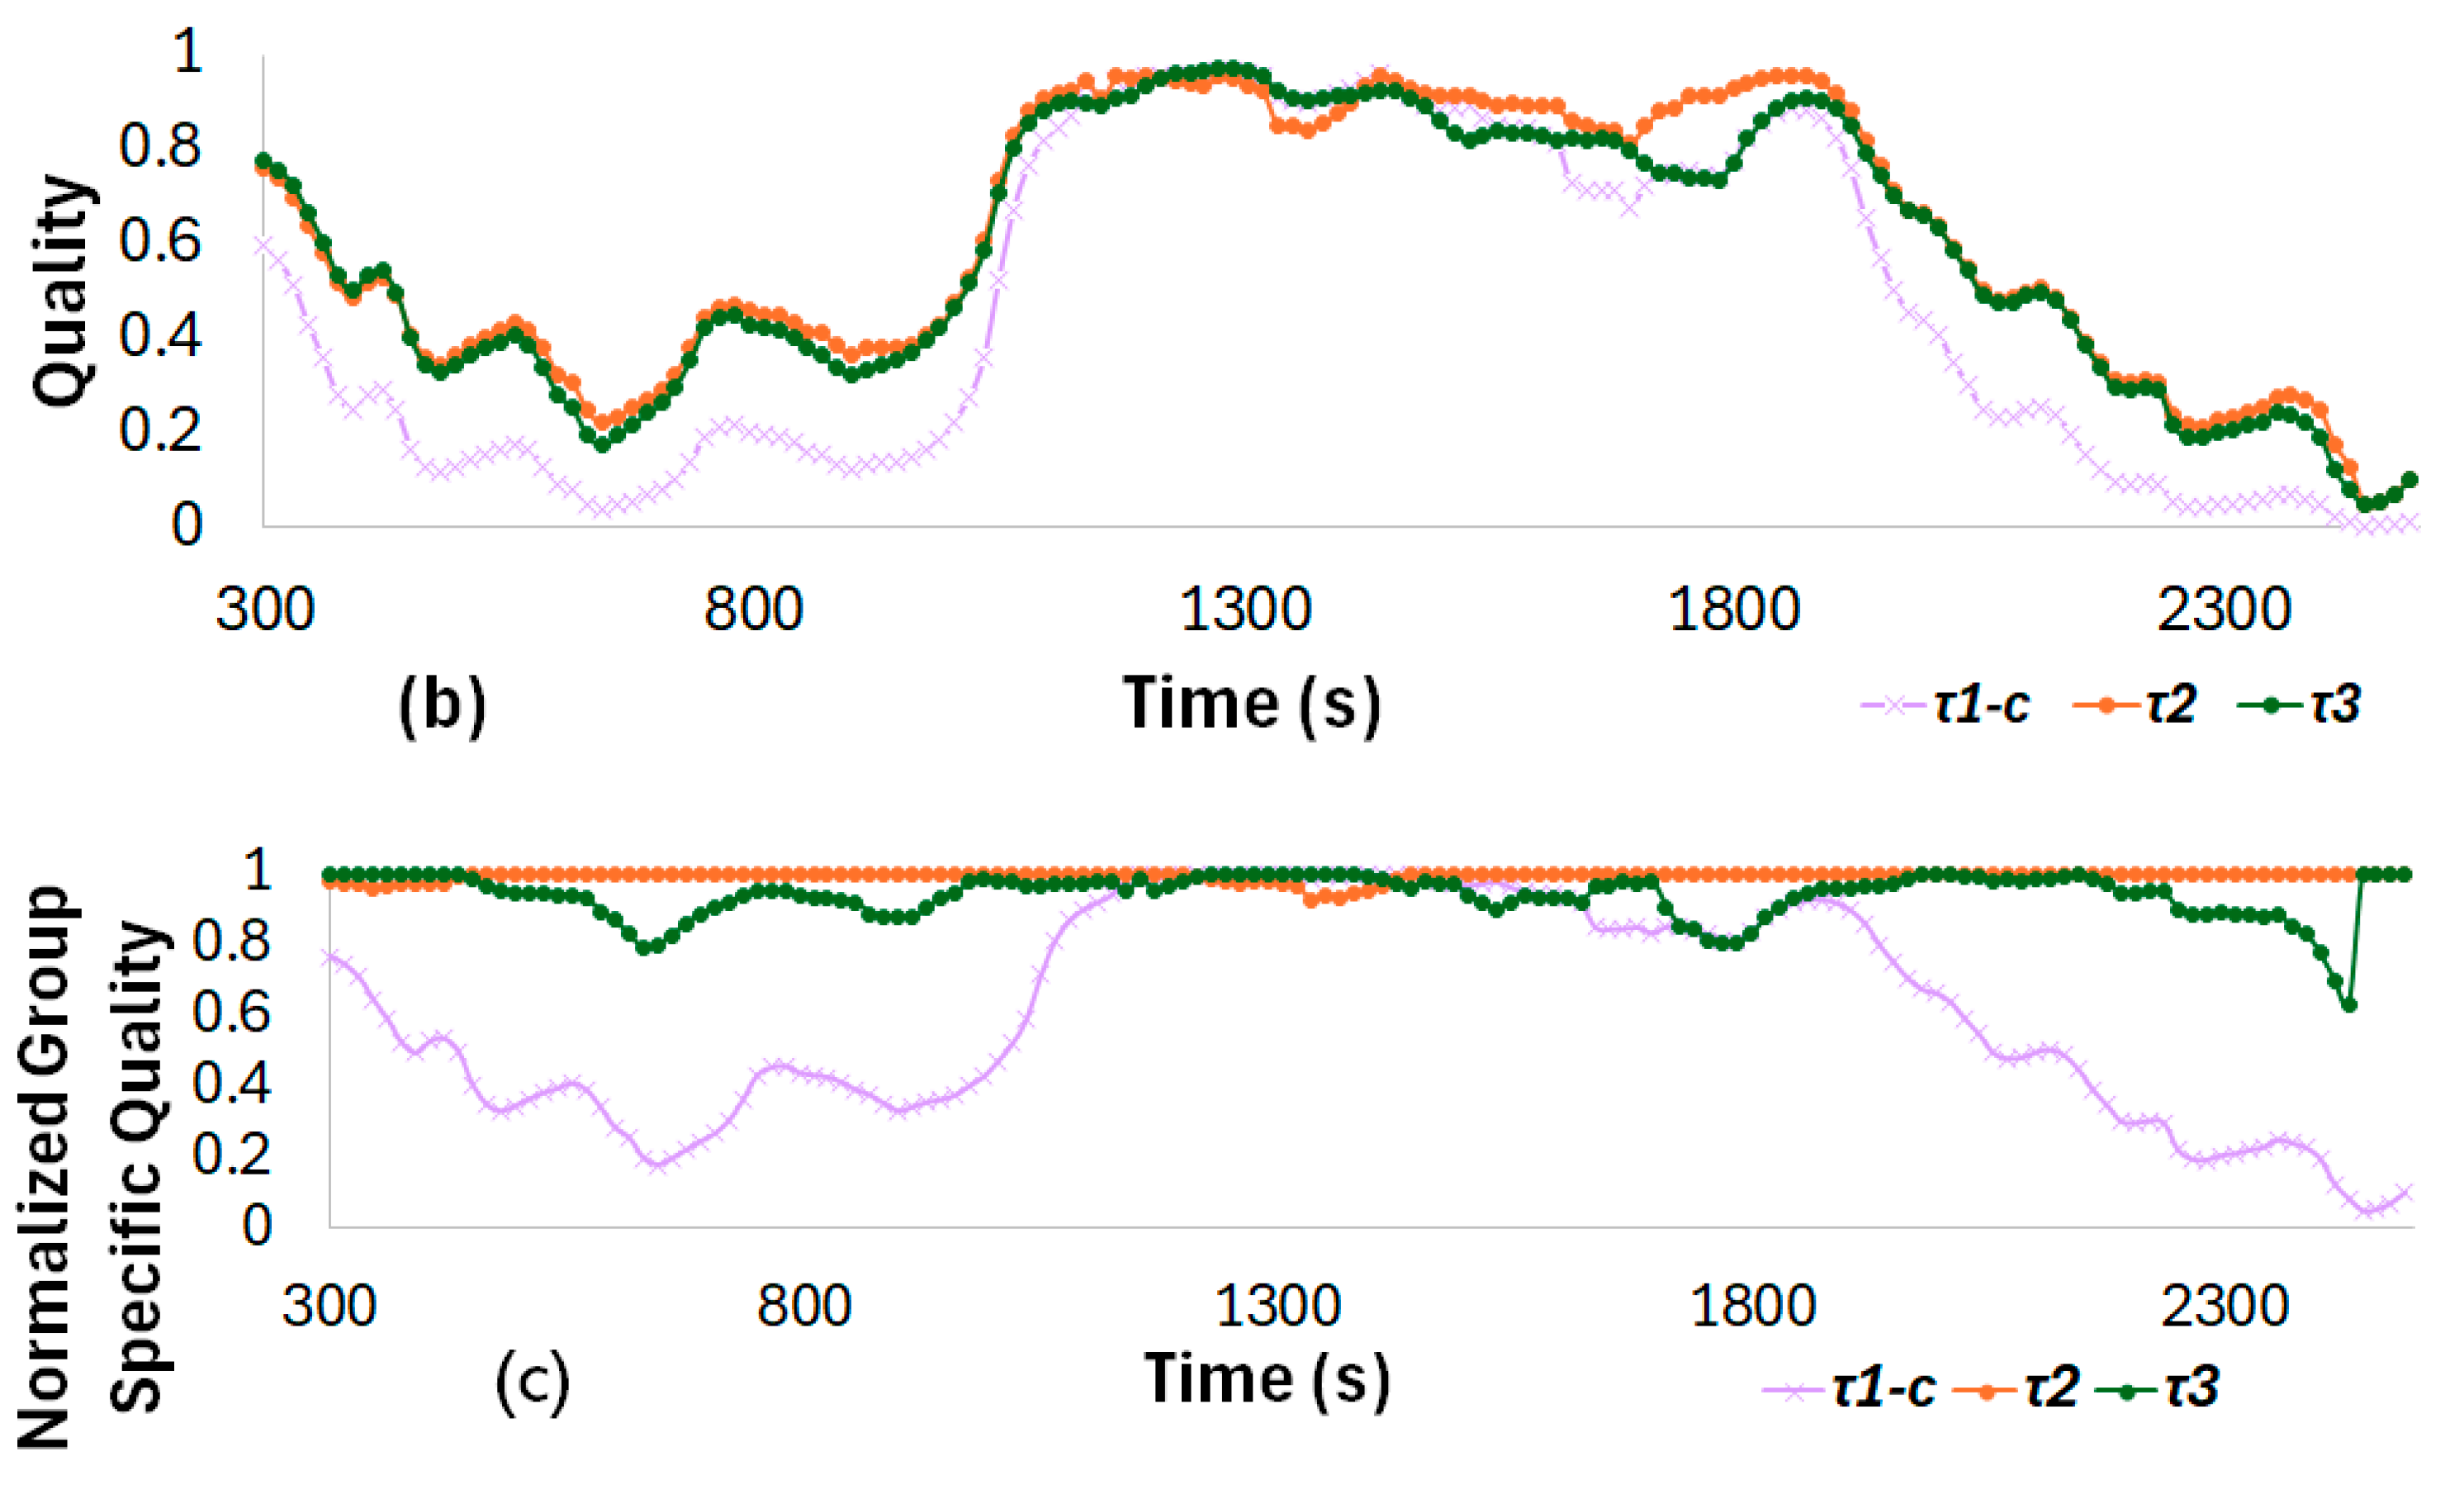
Normalized Group-Specific Quality Assessment

In this paper, we consider a covariance and co-relation-based peer assessment method to obtain a Normalized Group Specific Quality Assessment, that is, an assessment of the reliability of a topic with respect to other topics in the same group. Let us consider three correlated topics, namely, τ1 = { y 1 , G}, τ2 = { y 2 , G}, and τ3 = { y 3 , G}, and R = {τ1, τ2, τ3} obtained from the correlation matrix (C), which are grouped together, where y 1 , y 2 , and y 3 represent the data associated with each respective topic.
If the publishing intervals δ of y 1 , y 2 , and y 3 are not the same, interpolation in data is required for each pair in the group. This ensures that all data streams in R are synchronized or have the same number of points, especially if there is more data in one stream compared to the others. The quality assessment begins by applying covariance analysis on y 1 , y 2 , and y 3 for a corresponding window w (see Equations (4)–(6)).
c o v ( y 1 , y 2 , w 12 ) = 1 w 1 d = 1 w 12 ( y 1 d y ¯ 1 )   ( y 2 d y 2 ¯ )
c o v ( y 1 , y 3 , w 13 ) = 1 w 1 d = 1 w 13 ( y 1 d y 1 ¯ )   ( y 3 d y 3 ¯ )
c o v ( y 2 , y 3 , w 23 ) = 1 w 1 d = 1 w 23 ( y 2 d y 2 ¯ )   ( y 3 d y 3 ¯ )
As the smart broker is only interested in relationship nature, that is, direct or inverse, the correlation is calculated and normalized as follows:
a τ 1 , τ 2 , w 12 = 1 + c o v y 1 , y 2 , w 12 σ y 1 · σ y 2 / 2
a τ 1 , τ 3 , w 13 = 1 + c o v y 1 , y 3 , w 13 σ y 1 · σ y 3 / 2
τ 2 , τ 3 , w 23 = 1 + c o v y 2 , y 3 , w 23 σ y 2 · σ y 3 / 2
Equations (7)–(9) provide the association coefficients a τ 1 , τ 2 , a τ 1 , τ 3 , and a τ 2 , τ 3 , respectively, within a range of 0 to 1 for the grouped topics R = { τ 1 , τ 2 , τ 3 }, respectively. These coefficients measure the strength of the association between the respective pairs of topics. The actual association coefficients a τ i , τ j and the expected association v i j are used to calculate the quality of the topic τ 1 as follows:
q τ i = i j i , j R 1 a τ i , τ j v i j max 1 a τ 1 , τ 2 v 12 , 1 a τ 2 , τ 3 v 23 , 1 a τ 1 , τ 3 v 13 2
Equation (12) defines the quality of a given topic, for example, q τ 1 , by examining its relationship with other topics, for example, τ 2 and τ 3 using their expected correlation ( v i j ) and the calculated association coefficients ( a i j ) . Figure 3 shows the topic relationships R = { τ 1 , τ 2 , τ 3 } . For a group of three topics, the relationship is expected to be at v i j for window w i j for the respective pairs of topics. The quality calculated is the product of the ratio of the correlation difference for the relationships 1 a τ i , τ j v i j that contain the topic and the lowest correlation difference in the group R. It is expected that the lowest correlation difference signifies the relationship of topics that still holds steady, that is, τ 2 and τ 3 . The other two relationships change as τ 1 are getting corrupted values, which throws the correlation off track. Note that the quality is calculated based on the difference between the expected and current correlations 1 a τ i , τ j v i j and not the correlations themselves.
The resulting value of q τ i falls within the range of (0, 1), where 1 denotes perfect quality, indicating high accuracy in the data, while 0 signifies poor quality. This can be generalized to:
q τ i = i j i , j ϵ R 1 a τ i , τ j v i j max k , j R k j 1 a τ k , τ j v k j R 1
The denominator is raised to R 1 , where the R is the number of topics in the group R. However, making a large group could negatively impact the quality score for its constituent topics compared to a smaller group. Hence, the smart broker should aim to use a static group size. In this paper, for τ 1 considers only two additional topics τ 2 and τ 3 calculating topic using Equation (12), where a τ 1 , τ 2 v 12 and a τ 1 , τ 3 v 13 are the minimum in the group, keeping its size to 3.
For every w i j , the TDQAM calculates the new association coefficients based on the last completed window of all wR and stores them in the ledger. At any point in time for a group, the corresponding quality can be calculated based on the last available association scores, that is, Q = {q1, q2, q3}. The final score for quality is then normalized within the group to obtain the Normalized Group Specific Quality for each quality score in Q.

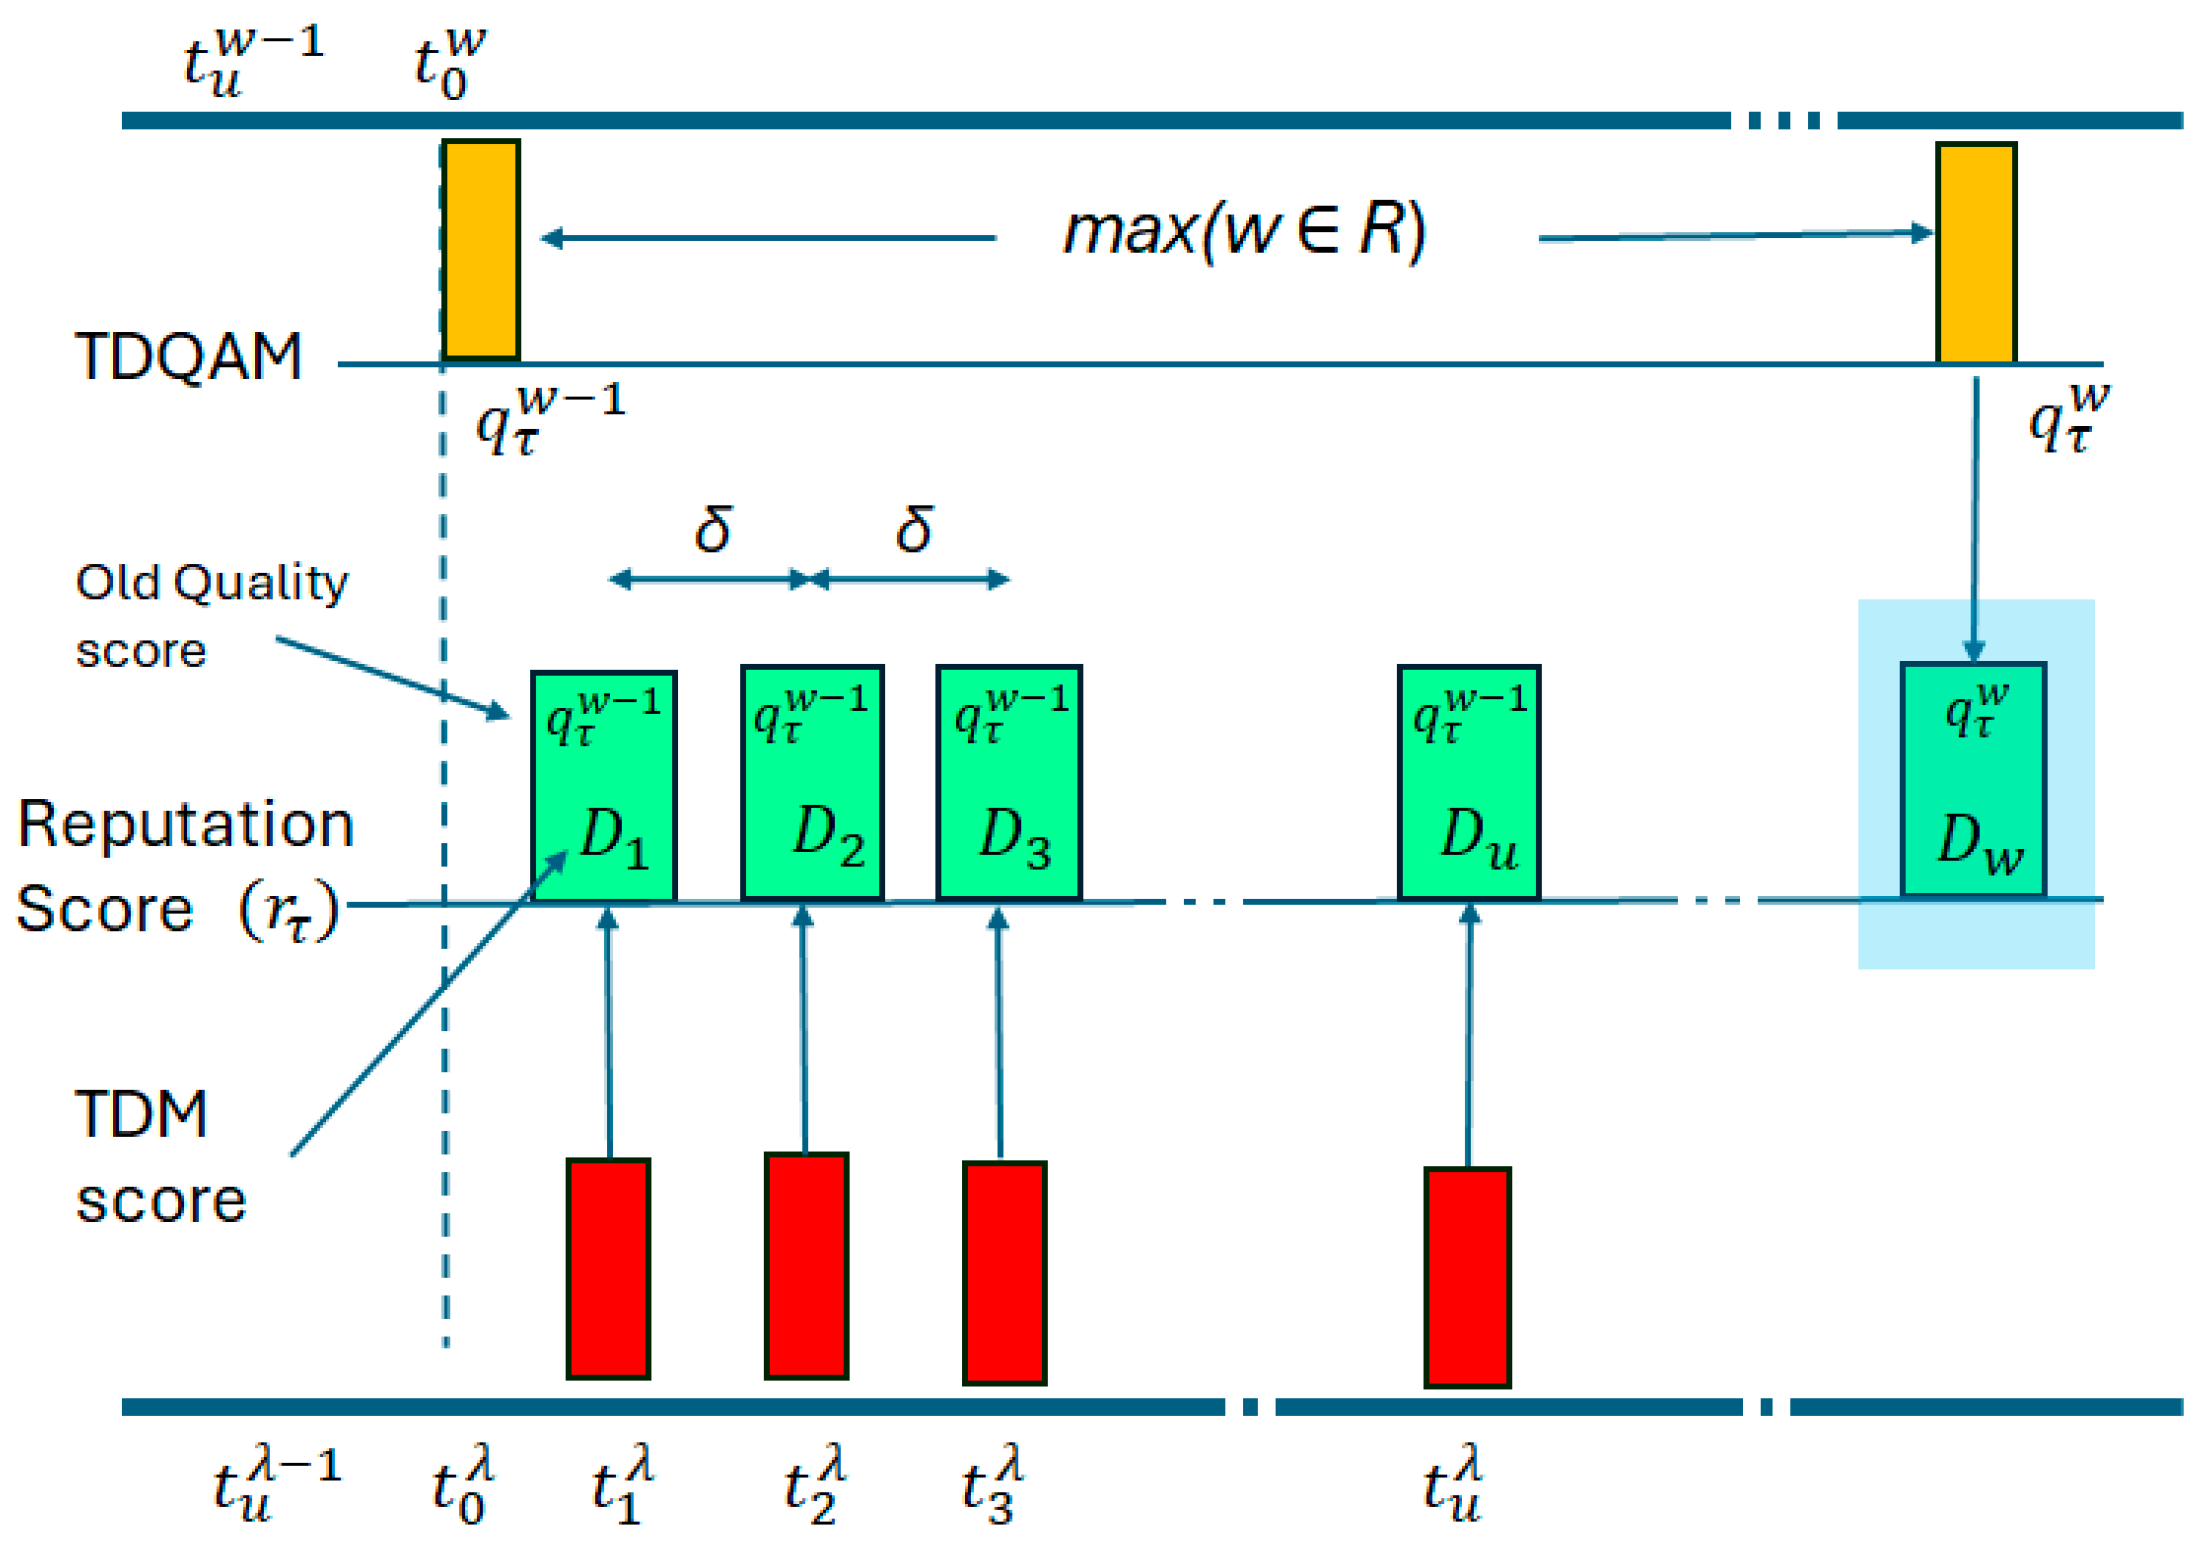
4.4. Topic Reputation Scoring

The TRS keeps monitoring the reputation score of the topic by using Equations (10) and (12). To calculate the reputation score, a combination of the TDM score and the TDQAM score of the topic is used (see Equation (14)). Both metrics are normalized to the range of 0 to 1.
Let r τ denote the reputation score of the topic τ, as shown in Equation (13), and the α and β are the weights assigned to D τ and q τ respectively. The scoring formula can be expressed as follows:
r τ = α . D τ + β · q τ
The weights α   a n d   β assigned to D τ and q τ adjust their importance or priority under different IoT scenarios. Equation (15) further normalizes the reputation score r τ in the range of 0 to 1.
r τ = α . D τ + β . q τ α + β
where α , β > 0 . The topic reputation score is built on both the performance indicator D τ and the data quality index q τ , and the result is scaled to the range of 0 to 1.

4.5. Execution of the Smart Broker System

4.5.1. The Continuous Execution

The last quality value q τ w 1 of the data, streams is determined at any point in time t u . This value can be different for each topic or group of topics. Parallelly, during each interval λ, TDQAM collects an amount of data up to the equivalent of λ / δ , where δ is the intended publishing interval. Meanwhile, the TDM continuously monitors the arrival time of data with respect to δ within the interval λ and the D τ scores are available to the TRS after every sub-interval of δ . The TRS (Algorithm 1 and Figure 4) calculates the reputation score of the topic after every sub-interval using the previous quality score ( q τ w 1 ) . When the largest of the windows in the groups of topics elapses, TRS receives the new quality score ( q τ w ) from TDQAM and calculates the reputation score by using current scores ( D u and q τ ).
Algorithm 1. Reputation Scoring at Time  t u  for ith Topic  τ i  in  R = { τ 1 , τ 2 , τ 3 }
w 12 l a s t   c o m p l e t e d   t i m e   w i n d o w   i n   W 12 , v 12 e x p e c t e d   c o r r e l a t i o n   f o r   w 12   i n   V 12 .
w 23 l a s t   c o m p l e t e d   t i m e   w i n d o w   i n   W 23 , v 23 e x p e c t e d   c o r r e l a t i o n   f o r   w 23   i n   V 23 .
w 13 l a s t   c o m p l e t e d   t i m e   w i n d o w   i n   W 13 , v 13 e x p e c t e d   c o r r e l a t i o n   f o r   w 13   i n   V 13 .
Calculate a τ 1 , τ 2 , w 12 , a τ 1 , τ 3 , w 13 and a τ 2 , τ 3 , w 23 .
Calculate Q = { q τ 1 ,   q τ 2 ,   q τ 3 } using Equation (12).
Normalize Q, that is, for each q Q ,   q q / m a x ( Q )
D u i c u r r e n t   d r i f t   s c o r e   u s i n g   E q u a t i o n   ( 5 )   f o r   i t h   t o p i c   a t   t u   s i n c e   l a s t   d r i f t   s c o r e   r e s e t   a t   t 0 λ .
r i = α . D u i + β . q i   α + β
Reset t 0 λ = t u if t 0 λ t u = λ .
Send r i to subscribers.
It is expected that the data will arrive at regular intervals of δ, but if there are delays, then the Dτ will gradually start dropping until it reaches µ, after which this drift score will hit 0. At the start of the window λ, the drift time reference ( t 0 λ ) is reset. If the data arrives back on track, this could help recover the score in a new window. Figure 4 illustrates the execution of the smart broker modules for a specific window and topic.
It is possible that due to the drift in time, the data for the quality calculation may be affected as not enough data may be available in the corresponding window w for peer data streams. In this case, the drift score will become 0, and the quality score cannot be calculated. If the group that contains the affected topic has more than three topics, then the affected topics are not accounted for in Equations (12) and (13). If it is just three topics, then it is not possible at all, and the smart broker will keep using the last successfully calculated quality score.
As with any conventional data broker, the smart broker too does not need to consider data that is older than the oldest running window across all topic pairs. Thus, while the smart broker needs to use a little more data, it can still be as fast as the conventional broker.

4.5.2. Computational Complexity of the Proposed Smart Broker

The smart broker, although working continuously in real time, deals with data that comes at regular intervals of δ, which is typically at least a few seconds. This means all the association scores are calculated periodically. The TDM and reputation scoring calculations are performed in O(1) and are computationally insignificant. For TQDAM, if the smart broker uses the 3-topic limit, the quality calculation for a single topic can be performed in O(|R|). Assuming that the total number of topics is m | R | , calculating the quality of all topics is in O(m). In each topic pair, the window size is fixed, and there are no huge data points possible in the window. Thus, the calculation of quality can be performed without impacting performance.

4.6. Subscriber Request Assessment Module

If the requested data for a specific topic is available in the blockchain, SRAM will skip the recommendation step and return the requested topic’s data and its quality score.
But if the subscriber has requested data on the topic, which is currently unavailable or too poor in quality, then the SRAM performs a recommendation. A recommendation is different from a paired data stream. While paired or grouped data streams are expected to hold a steady relationship, they may not be a direct substitute, for example, sunlight and temperature are related but cannot be substituted for each other. The substitution aims to identify another topic that measures the same thing as the original stream.
The recommendation is performed by comparing the tags of the requested topic τ with the tags of each available topic τ Γ in the blockchain. A generic content-based filtering is used to measure the similarity between tags. It generates a similarity score between multiple documents. In this case, the “document” is composed of tags in the form of a short string. A minimum similarity score threshold is fixed system-wide to consider two strings as similar. Using this, the smart broker can create ( Γ ) containing similarity scores of maximum m topics, as shown in Equation (16), as follows:
Γ = τ 1 ,     s 1 , τ 2 ,     s 2 , , τ m 1 ,     s m 1
where s 1 s 2 s 3 s m 1 .
Then, SRAM retrieves all the corresponding reputation scores. With all the reputation scores, it will append these reputation scores for each recommended topic as follows:
Γ = τ 1 ,     s 1 · r 1 ,     , τ m 1 ,     s m 1 · r m 1
where s 1 · r 1 s 2 · r 2 s 3 · r 3 s m 1 · r m 1 .
Before recommending Γ to the subscriber, the SRAM checks the correlation matrix (see Equation (3)), obtains the relationship between the recommended and the requested topic, and incorporates it into the recommendation score, as shown in Equations (18) and (19) as follows:
Γ = τ 1 ,     s 1 · r 1 · a 1 ,     , τ k ,     s k · r k , · a k
where, s 1 · r 1 · a 1 s 2 · r 2 · a 2 s k · r k · a k .
Finally, the SRAM will send the updated set Γ to the subscriber. This list of recommended topics can be large without filtering the location tags appropriately. Even after filtering the number of recommended substitute topics, it could still slow down the PS model. Hence, the SRAM can specifically restrict the number of recommended topics to k. An alternative strategy could be to set a lower limit on the recommendation score as follows:
f s , r , a = s · r · a
The exact formula for this may vary between smart brokers. If the subscriber accepts some recommendations from the set, Γ , then SRAM responds with the new topic and its quality score.

5. Implementation and Evaluation

5.1. Setup Overview

This proposed smart broker is suitable for permissioned blockchain, where the identity of the publishers can be established, ensuring that the initial registration information is correct. We implement Smart Broker on the Hyperledger fabric with the modules implemented as chaincodes. We use a single node with Ubuntu 22 to deploy the Hyperledger Fabric blockchain platform, version v2.5.3, which runs on Go version go1.20.5 in Linux/amd64.
We have implemented a NodeJS client application. With this client application, publishers and subscribers can connect to the smart broker for data exchange. The client application is equipped with the identity provided by the smart broker. This identity authentication mechanism ensures secure interaction with the blockchain network, guaranteeing authorized access exchanged within the Hyperledger Fabric environment. The client application connects to the Hyperledger Fabric via the Fabric Gateway Client API.

5.2. Testing of Smart Broker Components

The implementation view of the smart broker is presented in Figure 5. The smart broker operates through two parallel running components: the Publisher End Module and the Subscriber End Module. The smart contracts within each module operate based on the following network conditions:
  • Good communication: The blockchain network mainly operates at the application layer, so network delays do not hamper the application’s outcome. The IoT sensors would be sending data at an interval of at least 10 s, making any network-level latency variations and jitters insignificant to the drift score calculations.
    Figure 5. Implementation view of the smart broker.
    Figure 5. Implementation view of the smart broker.
    Applsci 14 05907 g005
  • Distributed functionalities: The smart contracts all study fail-safe features. Due to their distributed nature, the functionalities will always be studied as long as there is at least one node. Multiple peer nodes are expected for a practical application, but for this paper, we tested the performance with one peer node.
The functionality of the smart contracts is as follows:
(1)
Publisher End Module:
The smart contracts within the publisher end module are working as follows:
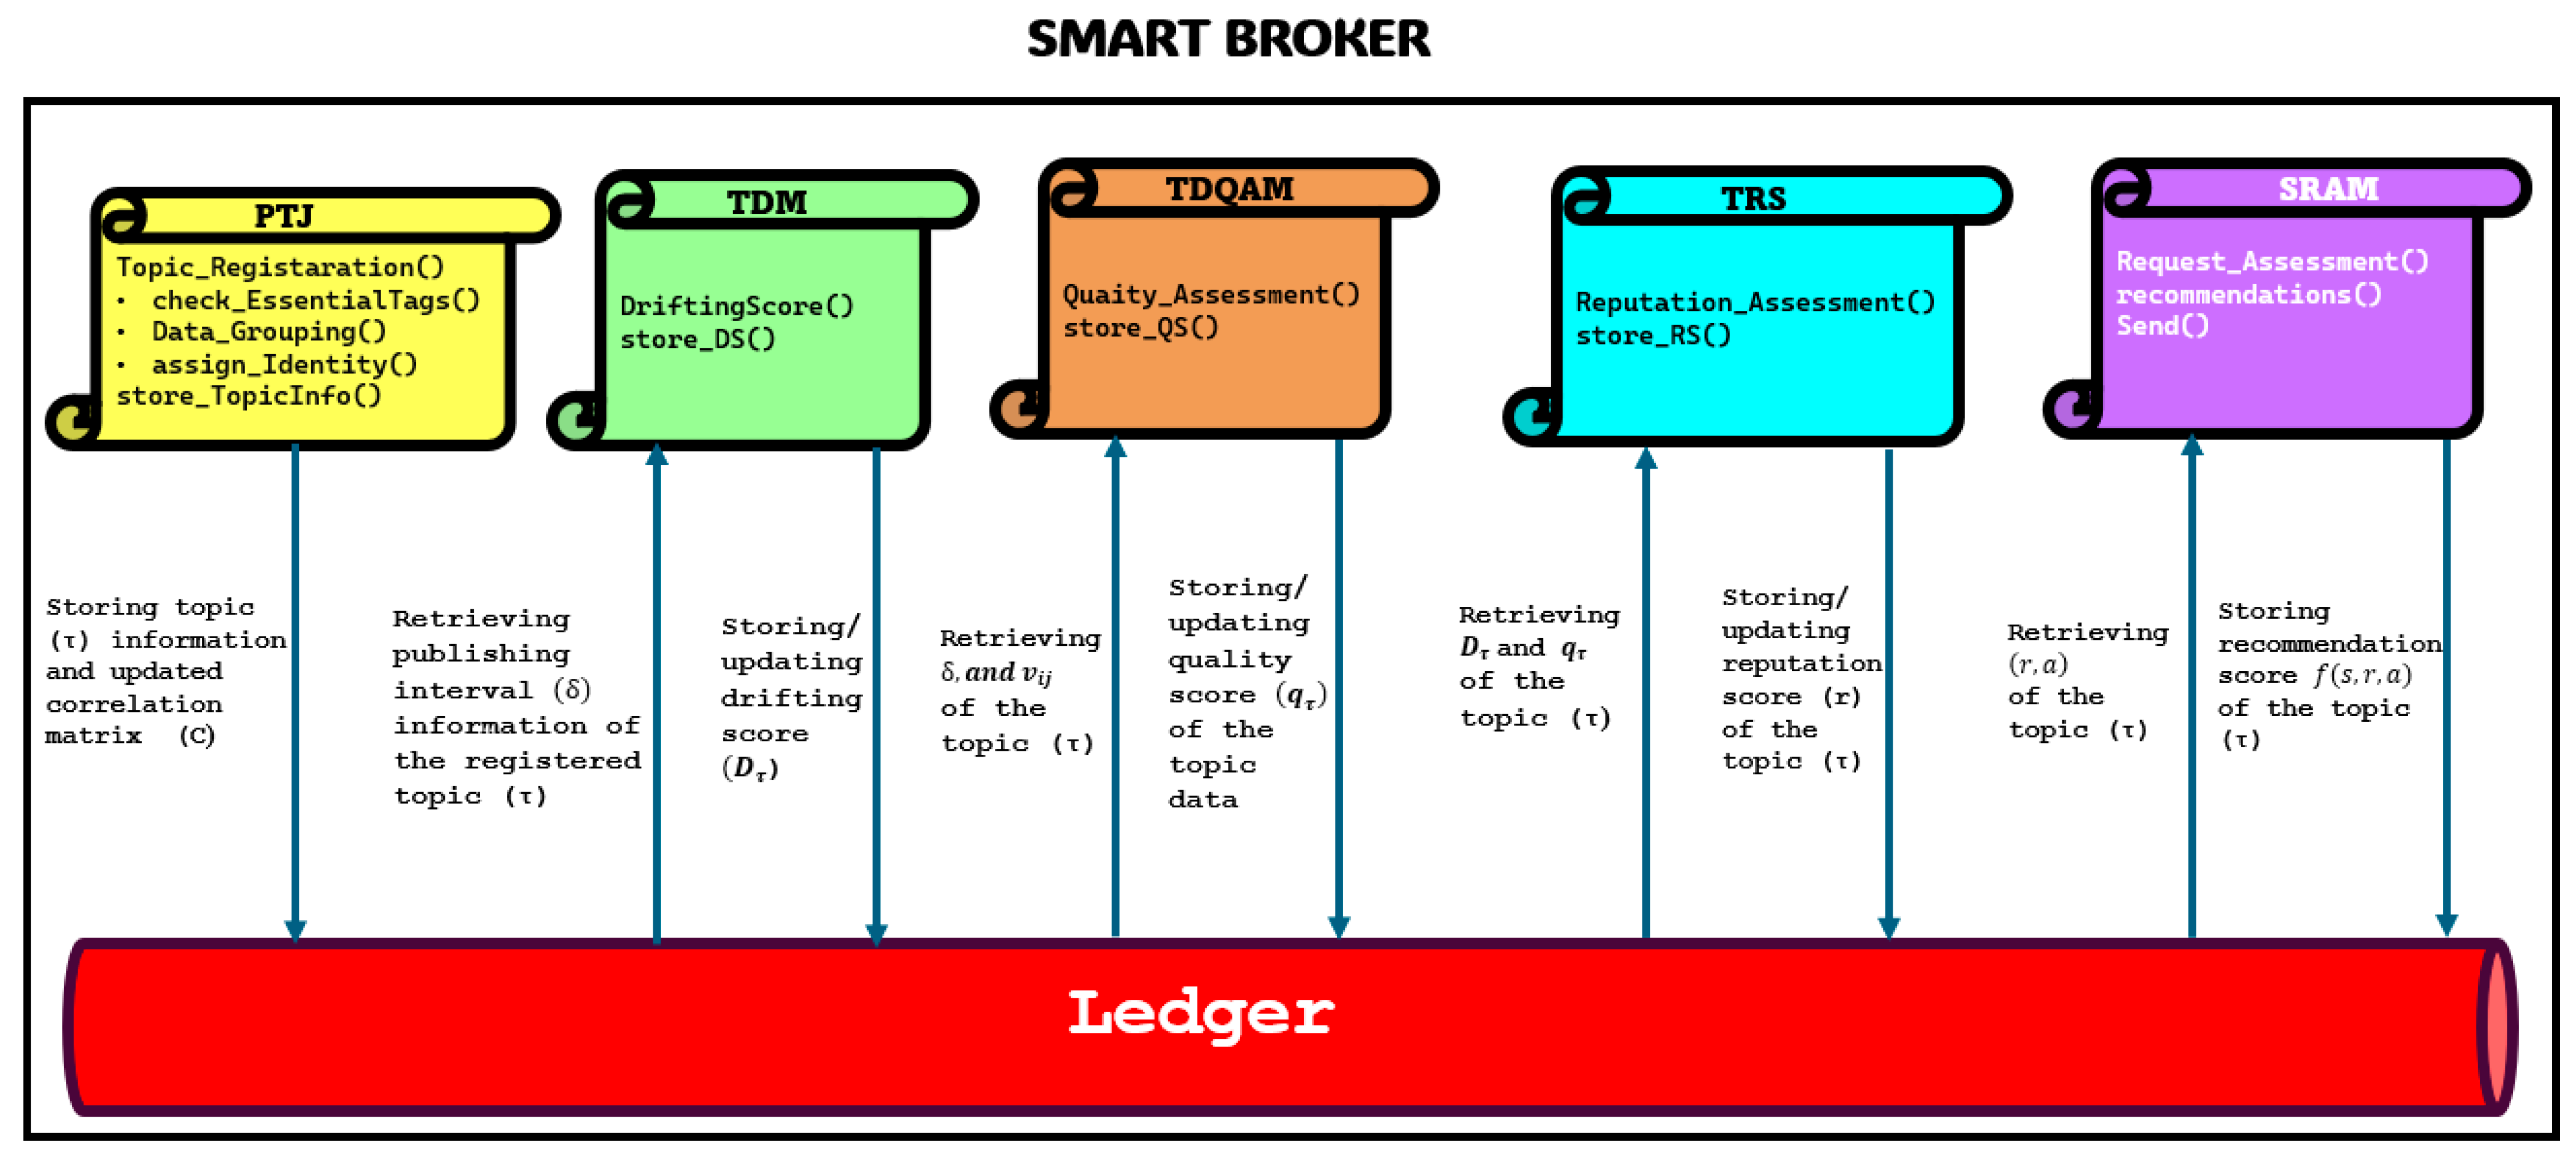
  • PTJ: This smart contract performs a topic registration process, which involves verifying essential tags and topic pairing. It updates the correlation matrix accordingly. The contract also stores topic details, including tag information, along with the updated correlation matrix. It also communicates with TDM, TDQAM, and TRS about the newly registered topic and its details so that TDM, TDQAM, and TRS can initiate their assessment of the topic.
  • TDM: This smart contract retrieves publishing interval information for topics and continuously monitors the drifting score. It stores the drifting score after each interval, ensuring real-time tracking and analysis.
  • TDQAM: This smart contract conducts quality assessments on topic data. It retrieves topic pairing data streams, correlation information, and publishing interval details from the ledger. Using this data, the topic’s quality is calculated, and the real-time quality score is stored in the ledger.
  • TRS: The smart contract on the publisher side retrieves the topics’ assessment scores, quality scores, and drifting scores from the ledger. It then calculates the topic’s reputation score and stores it in the ledger.
(2)
Subscriber End Module:
  • SRAM: This smart contract handles subscriber requests, providing data along with its quality score to the subscriber. It also prepares recommendation topics, if required, by calculating the similarity score, retrieving correlation information, and calculating the reputation score. Then, it prepares the recommendation score for the topics and sends it to the subscriber.
The components within the smart broker begin to assess the topic and its data based on configurations predefined and specified by the publisher (e.g., publishing interval) at the time of registration. The parameters for the experiment are shown in Table 2.

5.2.1. Preparation of a Correlation Matrix

We used real-world IoT datasets from Kaggle, for which the description can be found at [53]. This dataset is mainly prepared to predict air quality. It consists of five sensors recording different air parameters along with temperature and humidity sensors. It records the date and time of each sensor reading. The date and time of sensor readings start on 10 March 2010, at 6 p.m., and continue until 31 December 2010, spanning 10 months of recording. All records from the sensors are from the same type of machine (meaning from the same publisher). Moreover, the specified publishing interval is 1 h between readings.
However, for testing purposes only, the speed of feeding these data to the smart contracts is increased to a 15 s interval, which becomes the δ. The original dataset does not contain any noise or drift from the 15 s. We introduced the noise and delays for experimental purposes. The correlation matrix for testing TDQAM is prepared based on the data from this dataset and stored in the ledger.

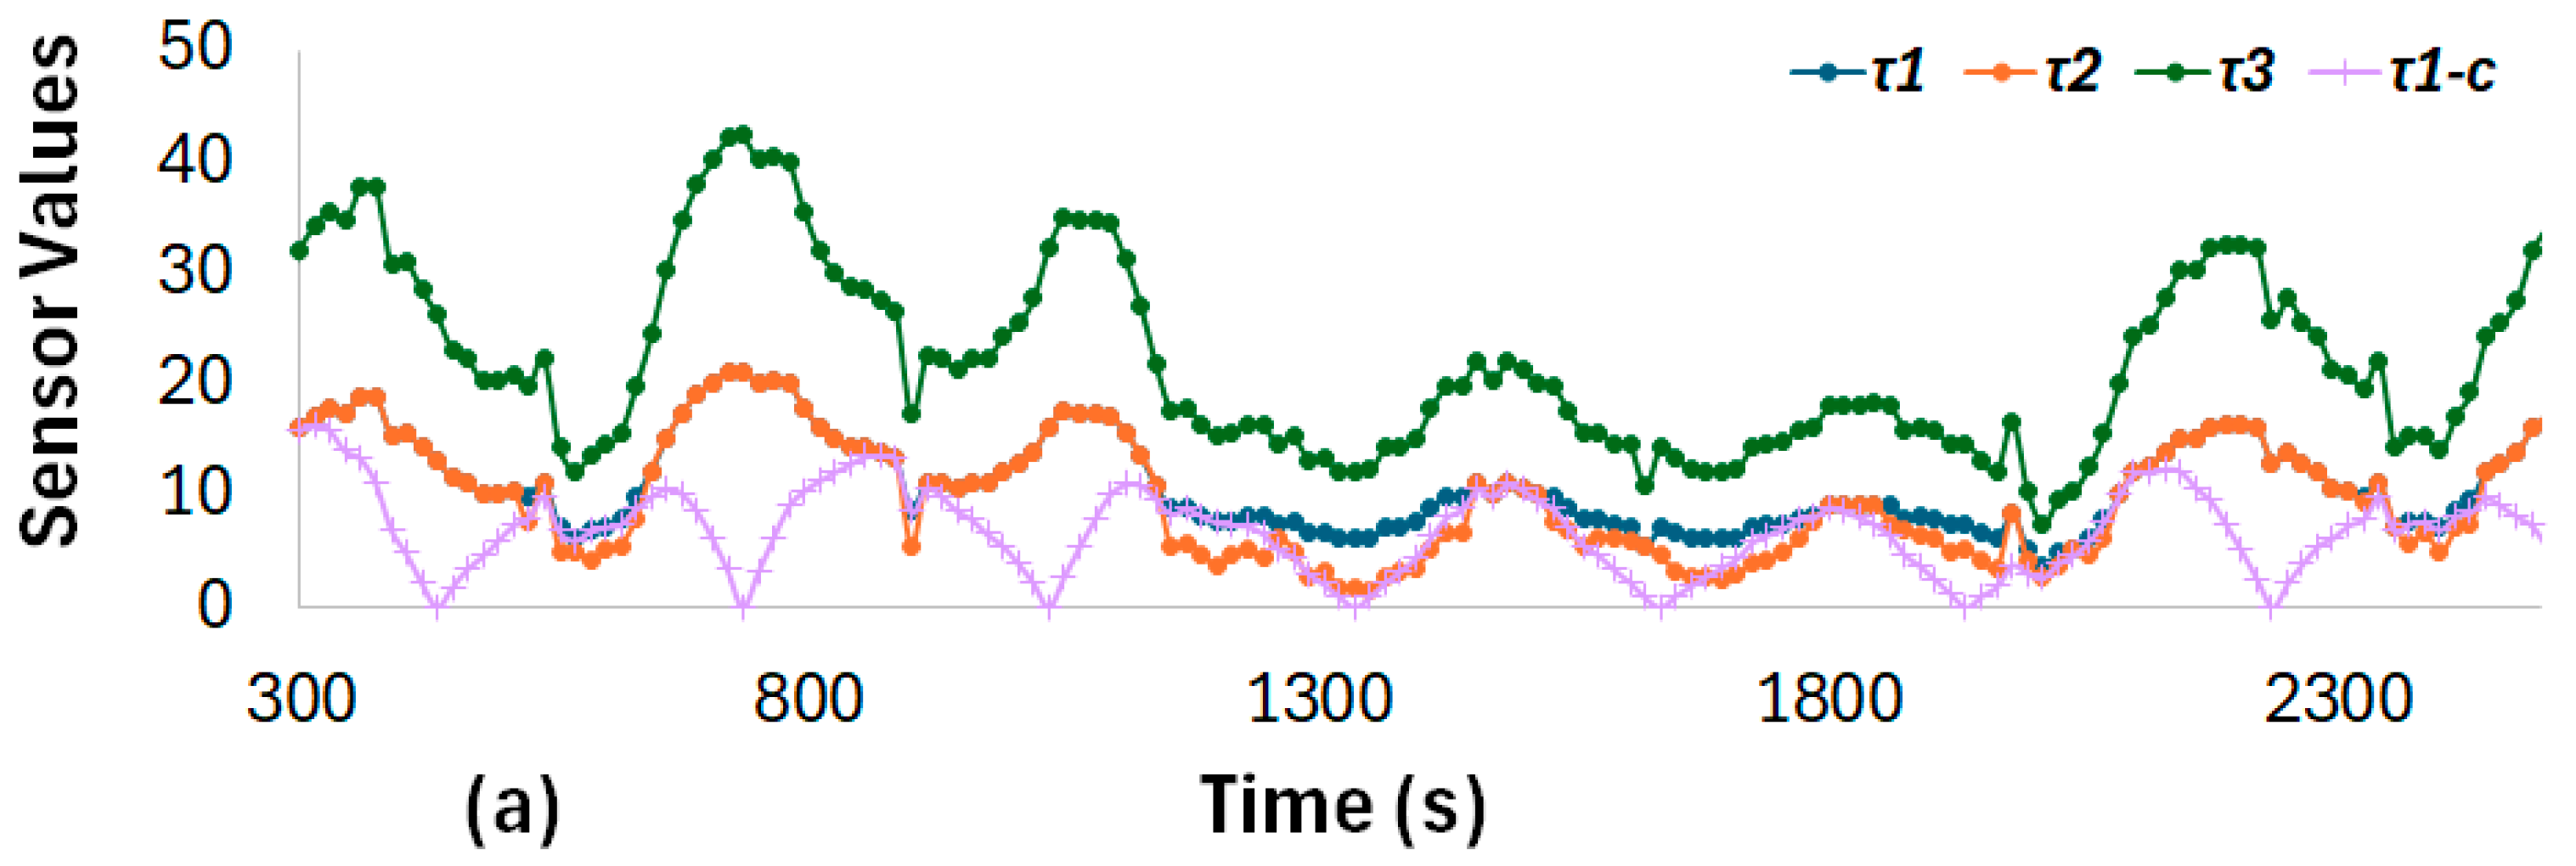
5.2.2. Preparation of Correlated Topics for Testing

From the correlation matrix, we have prepared a set of correlated topics ( τ 1 (sensor_1), τ 2 (sensor_2), and τ 3 (sensor_5)). This set will be used to test the TDQAM and assess the quality of Sensor 1’s data. Table 3 lists the details of the topics.

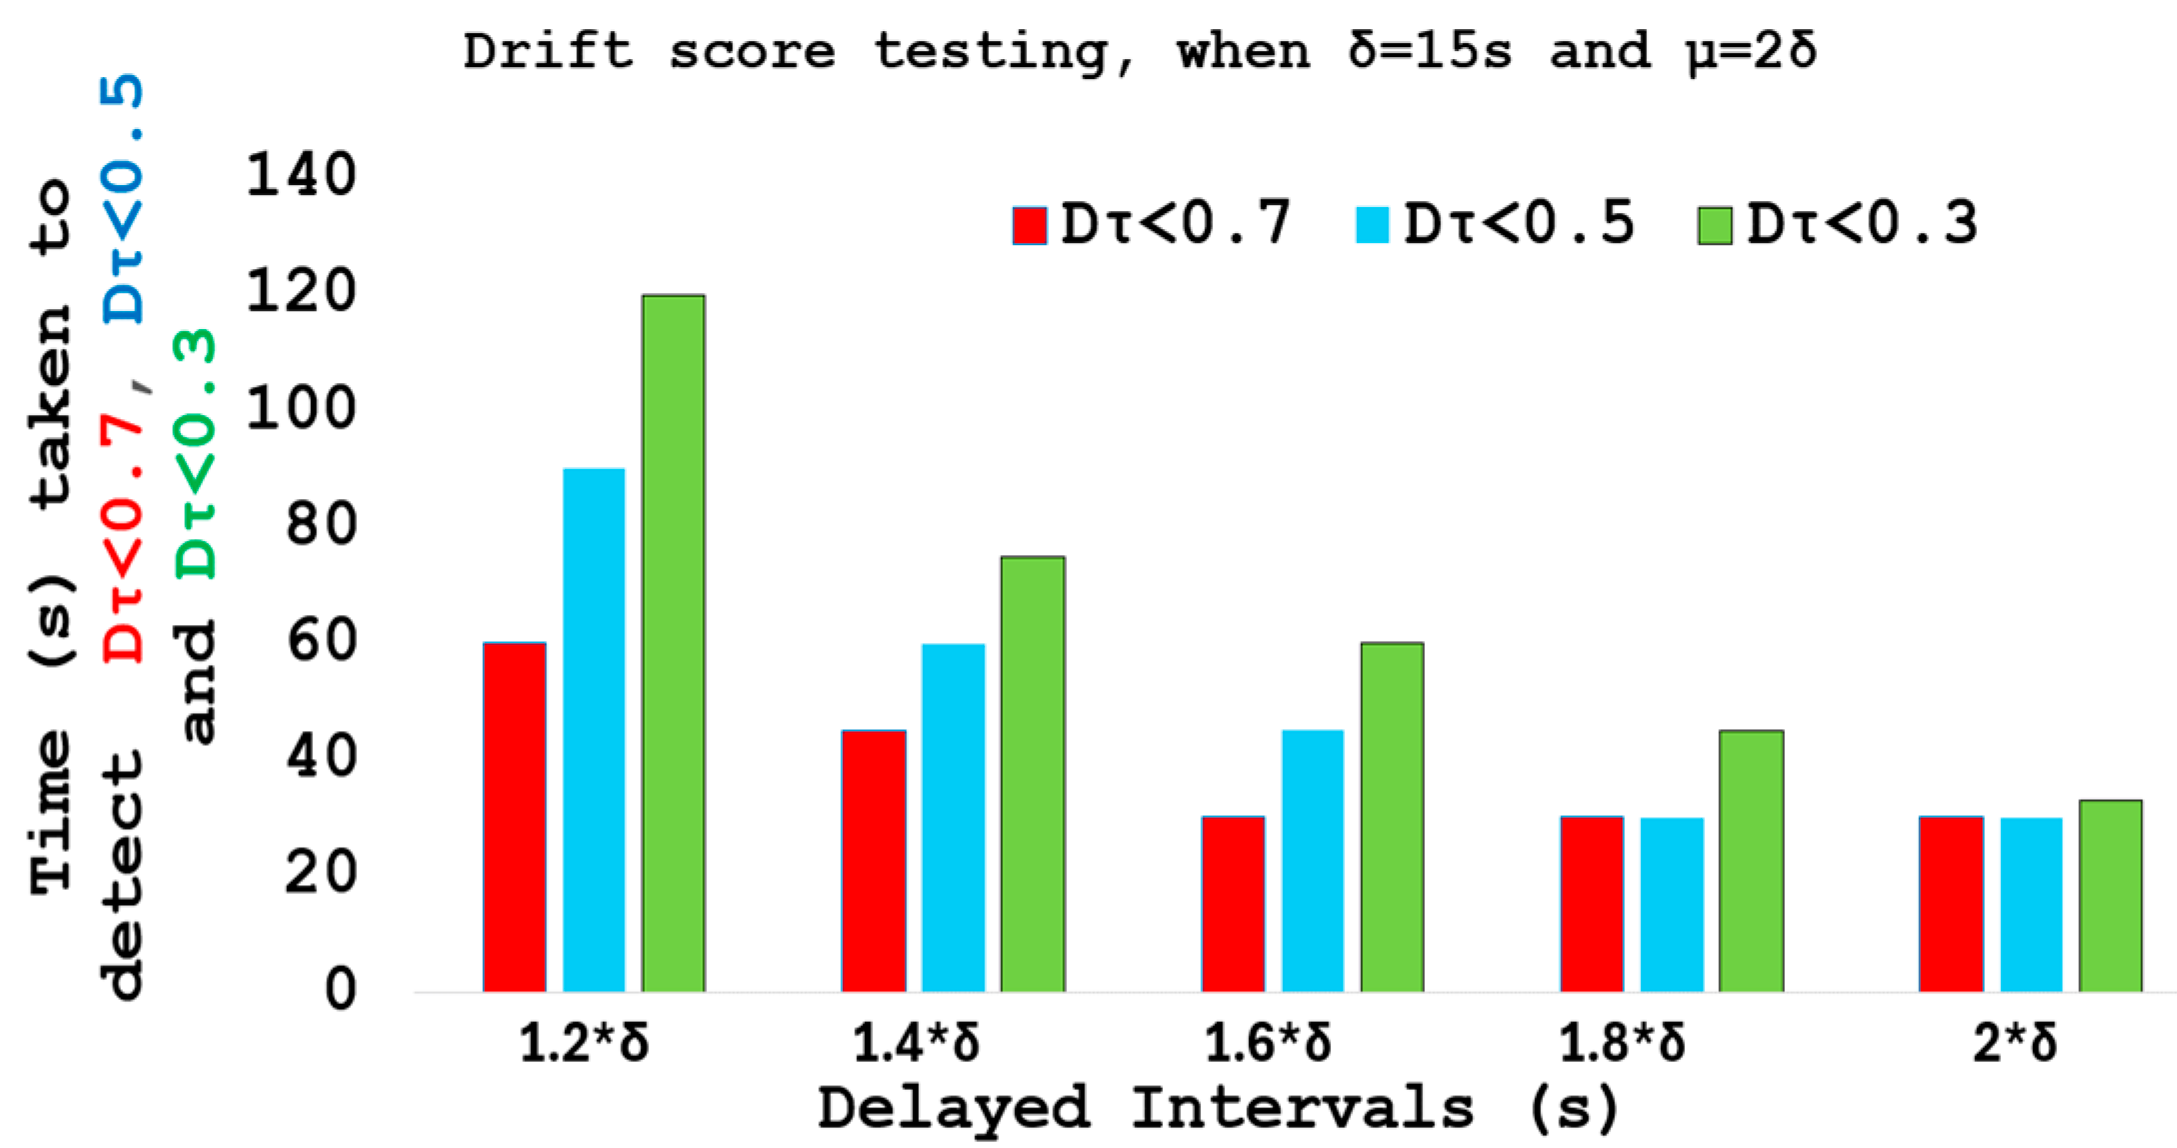
5.3. Drift Score Testing and Results

To test TDM, we introduce delays in the intended publishing interval (δ) of τ 1 to manipulate the timing of the data transmission. Our objective is to observe the time when TDM detects a 50%, 70%, or 90% drop in the transmitted data’s drifting score and determine the relationship between λ and δ.
We begin testing with 0 additional delay on δ, serving as a baseline for the initial data points (to establish normal system behavior). Then, we introduce delays, starting with a 1.2δ delayed interval and progressing in increments of 0.2% until reaching a 2δ delayed interval.
Drift scores are calculated at each publishing interval (δ). For the testing, we set the publishing interval (δ) to 15 s, meaning that normal data transmission occurs every 15 s.
When the data are sent with a delay of 3 s (delayed interval = 1.2δ), the smart broker takes around 60 s to detect a drifting score drop below 0.7, as shown in Figure 6. Doubling the data transmission delay to twice δ reduces the detection time to only around 30 s for detecting the same drop. Additionally, the smart broker can capture a 0.5 drop in drifting score in approximately 90 s when the delayed interval is 1.2δ. Conversely, it takes around 30 s to capture the same 0.5 drop when the delayed interval is doubled (2δ). Furthermore, a significant decrease in the detection time was observed for detecting a drop to a score of 0.3 with increasing delayed intervals.
The smart broker demonstrates quicker detection of score drops below 0.1, 0.3, and 0.5 as data transmission delays increase.
The results show that the higher the delays in the arrival of data, the quicker the drift score drops. A smart broker’s parameters have to be set properly to watch for a drop to a desired level and set the values for λ. For example, if the above data indicate that the typical delay in data arrival is 20% on 15s, then the λ should be set to 60 s (4δ) to watch out for a 0.7 quality score. To watch out for a 0.3 score, the λ should be 120 s (8δ). Note that this also acts as a net for greater delays as well.

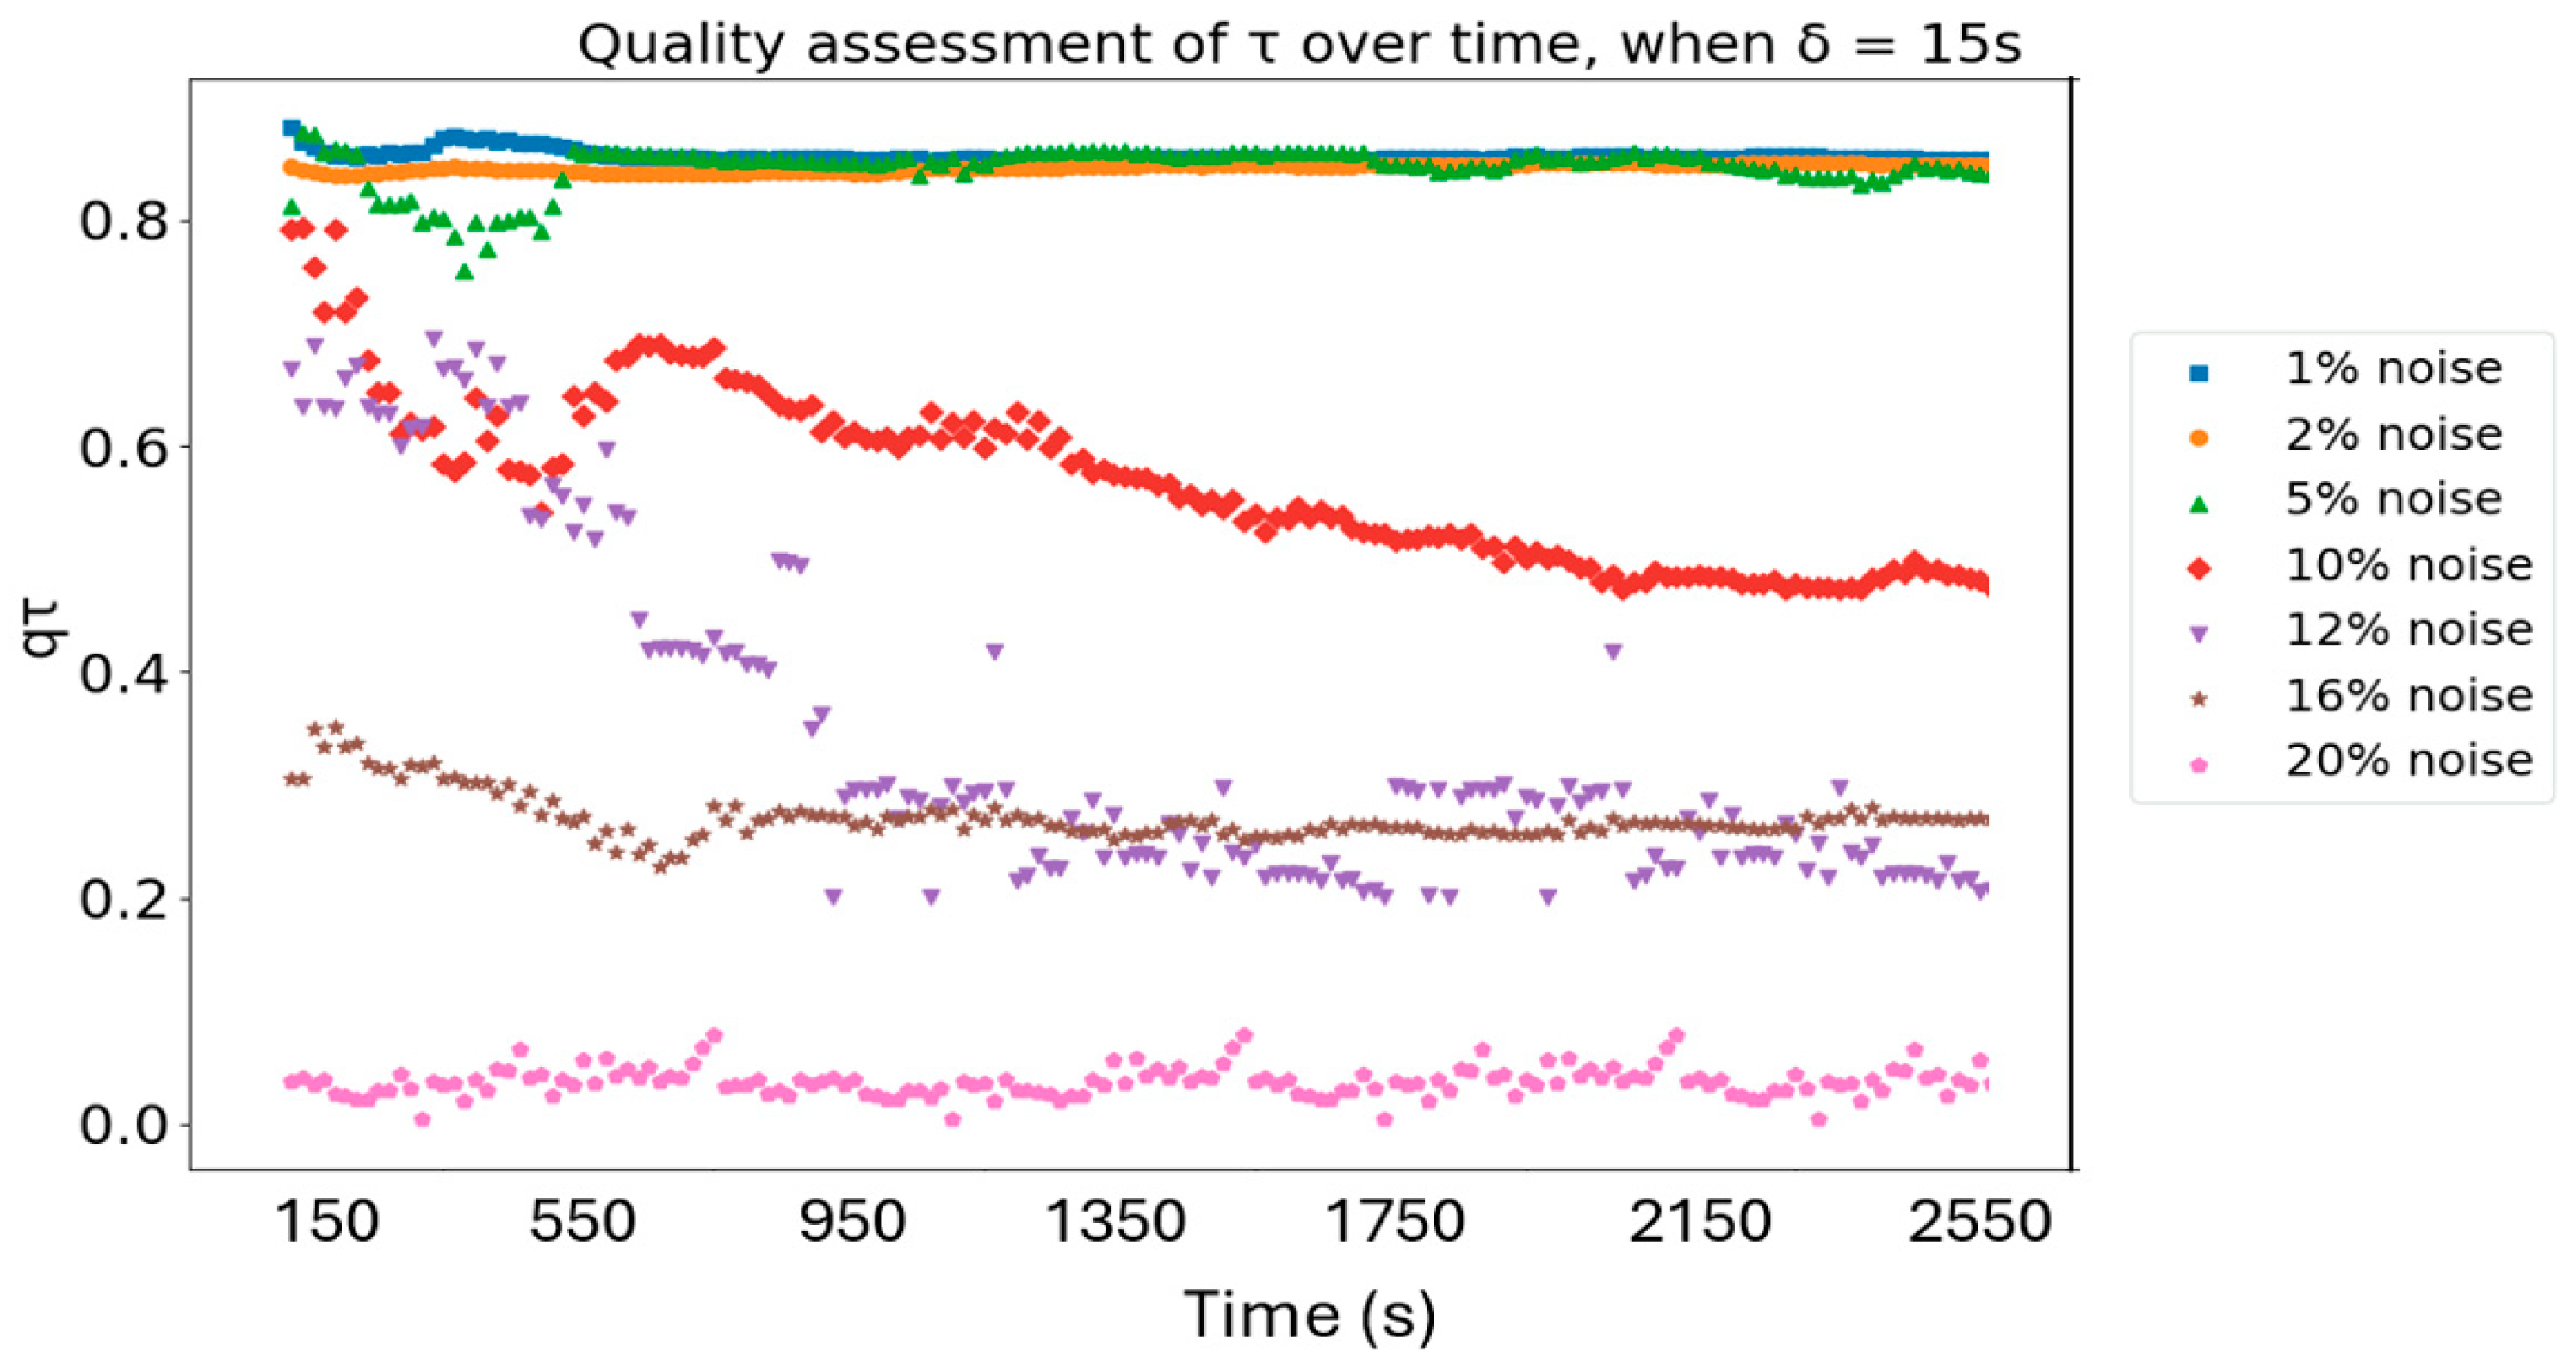
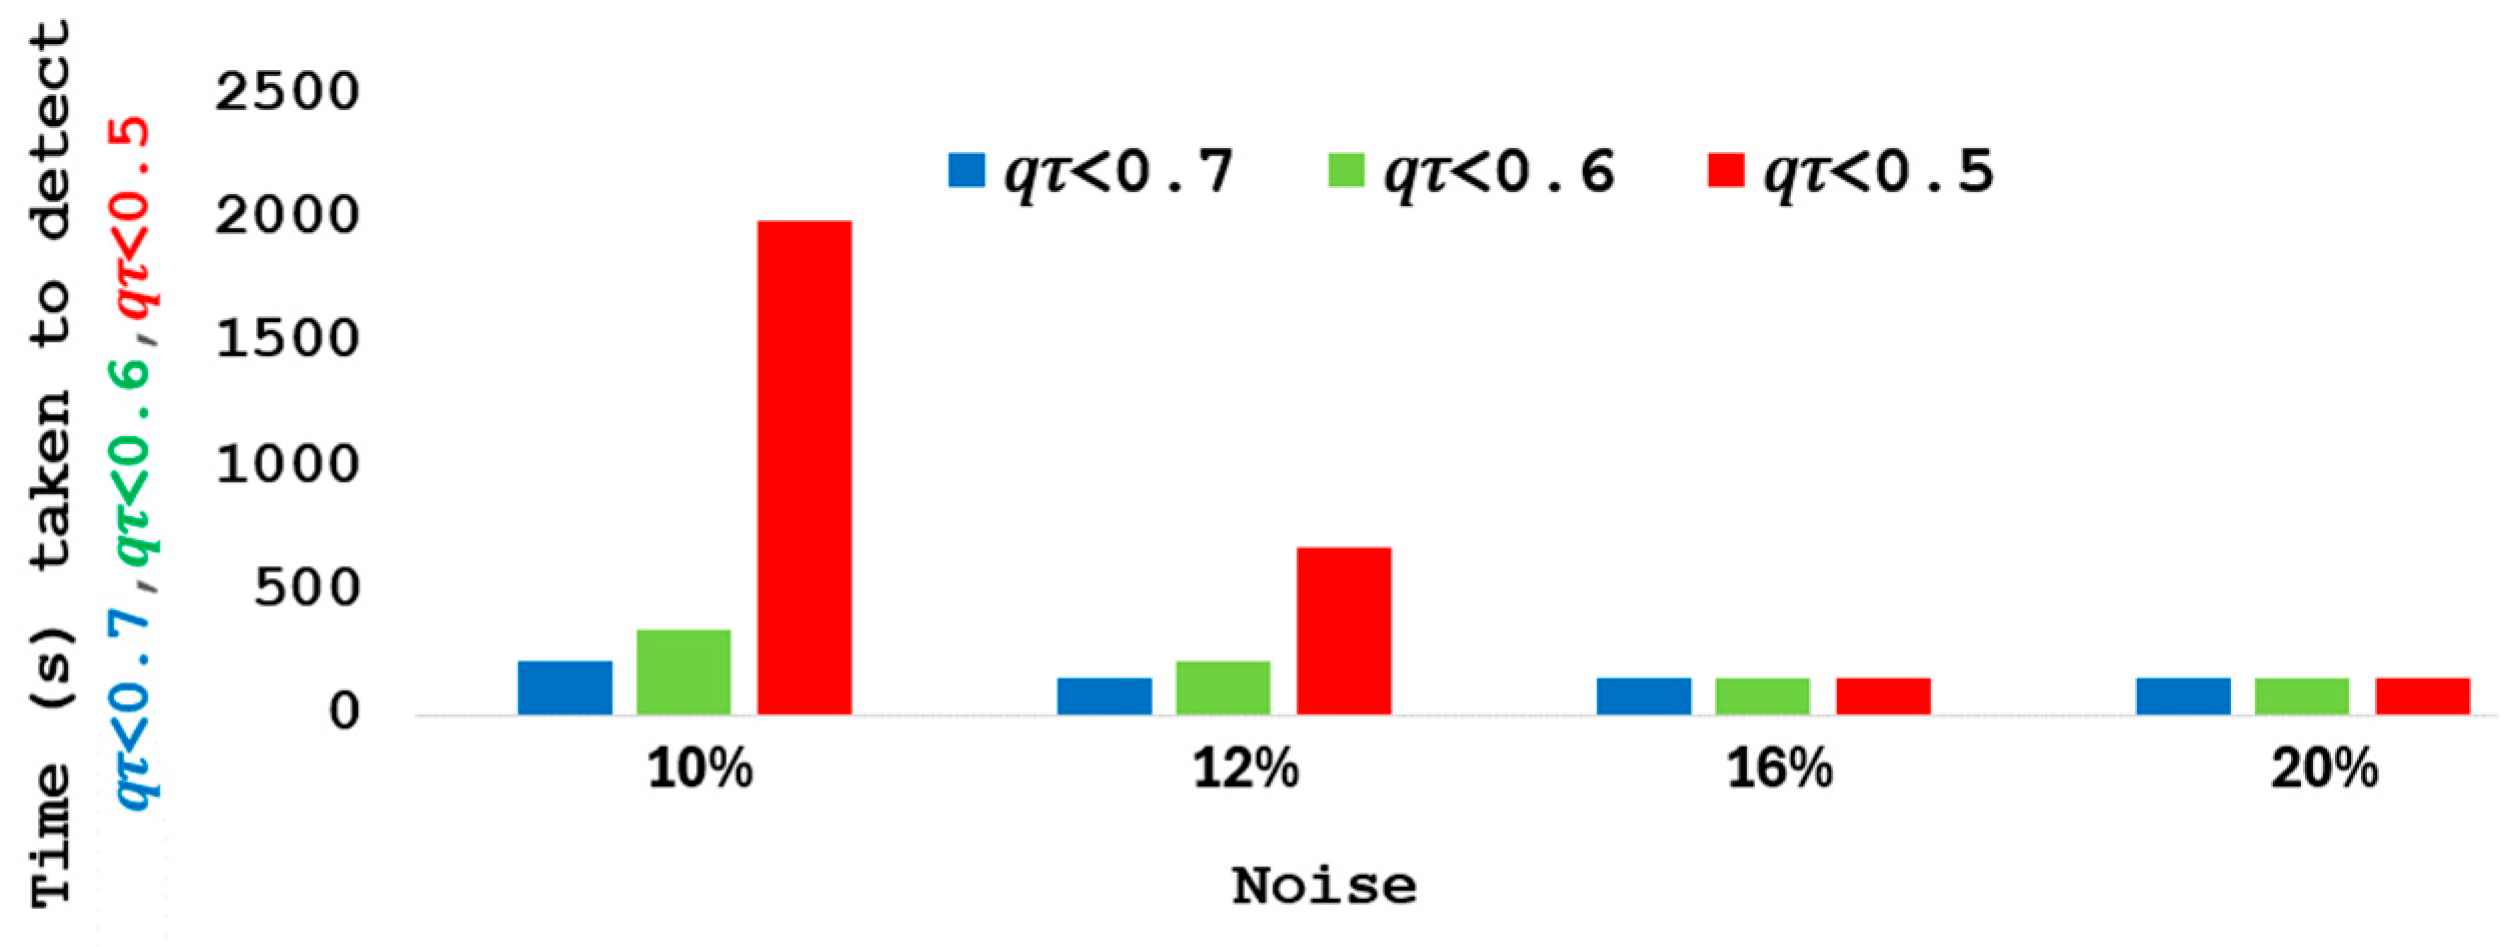
5.4. Quality Testing with Different Levels of Noise

5.4.1. Quality Calculations with Noise and Fixed Windows Size

To test the quality performance, we test the continuous quality calculations given a fixed window. We set a window size of 300 s (i.e., 20 data points) for all w i j     W i j , where i , j     R = { τ 1 , τ 2 , τ 3 } . We consider the v i j as the normal expected correlation value for each w i j for corresponding pair of topics. This is shown in Figure 7a. We then introduce a topic τ 1 c which is the noisy version of the topic τ 1 and simulate the running quality calculations as if the noisy topic τ 1 c was received along with the τ 2 and τ 3 . This is shown in Figure 7b. The setting of proper v i j for each w i j is very important, and the ability to detect deviations is used for quality calculations. Both figures plot the actual quality calculations at all intervals of δ = 15 s, based on the last 300 s. But for a practical smart broker, the actual quality calculations will happen at the end of the window.
The results in Figure 7c indicate that between 300–1200 s and 1900–2300 s, the quality of the τ 1 c is significantly lower than the other two for the Normalized Group Specific Quality of τ 1 c . Both τ 2 and τ 3 remaining close to 1. As the three-time series come closer to each other during 1200–1900 s, the quality for all of them goes closer to 1 before the τ 1 c dropping again. This shows that the smart broker is able to identify a rouge sensor in a group of three. However, if two sensors behave unexpectedly, the broker may not be able to identify a problem, in which case it will need a larger group.
However, in any case, the smart broker can at least accurately characterize unreliable sensors in a group and accurately measure the closeness of the sensor relationship within that group.

5.4.2. Understanding the Impact of Large Windows Size

For quality testing, we aim to establish the impact of the window size on the ability to detect quality drops. It is imperative that the proper window size be set so that higher levels of drops can be detected in quality before new data improve the quality. This is, however, dependent on the application goals of the IoT systems.
We calculated the quality of τ 1 by corrupting its data by adding different levels of noise. We started corrupting the data with 1% noise and gradually increased it to 5%, 10%, 12%, 16%, and 20%. It is assumed that the window sizes are w12 = w13 = w23 for this test. Figure 8 shows the quality assessment of TDQAM over time under different levels of noise. We increased the window size from 150s to 3000s and calculated the quality in the dataset for τ 1 . The actual smart broker will use a fixed window; this experiment shows the impact of the window size on the calculation of the quality. Each data series represents the quality calculations under different noise levels induced in the original data stream.
In Figure 8, it can be seen that for 1–5% noise, the quality score consistently remains higher than 0.8, while for 16% and 20%, the quality is consistently below 0.3. This is because the window size does not have any impact on whether the data is consistently poor or good. For middle-level noises, the quality keeps fluctuating with increasing window size.
As shown in Figure 9, when the data contains 10% noise, the smart broker requires approximately 220 s to identify a 30% decrease in quality. Detecting a 50% drop takes even longer, around the 1890s, under such low-noise conditions. However, with a 12% noise level, the smart broker can identify a 50% quality drop in just around 680 s. Moreover, it takes w = 151 s to detect a 30% drop and w = 360 s for a 40% drop, with the lowest w at 150 s. As the noise level increases, the time needed to detect these quality drops decreases. For instance, between noise levels of 16% and 20%, the smart broker can swiftly detect 70%, 60%, and 50% drops in quality, all within around w = 151 s.
The smart broker determines noise-induced drops in data quality, with detection times varying inversely with noise levels. As the noise level in the data increases, the smart broker becomes more efficient at detecting significant drops in quality, with detection times decreasing notably.

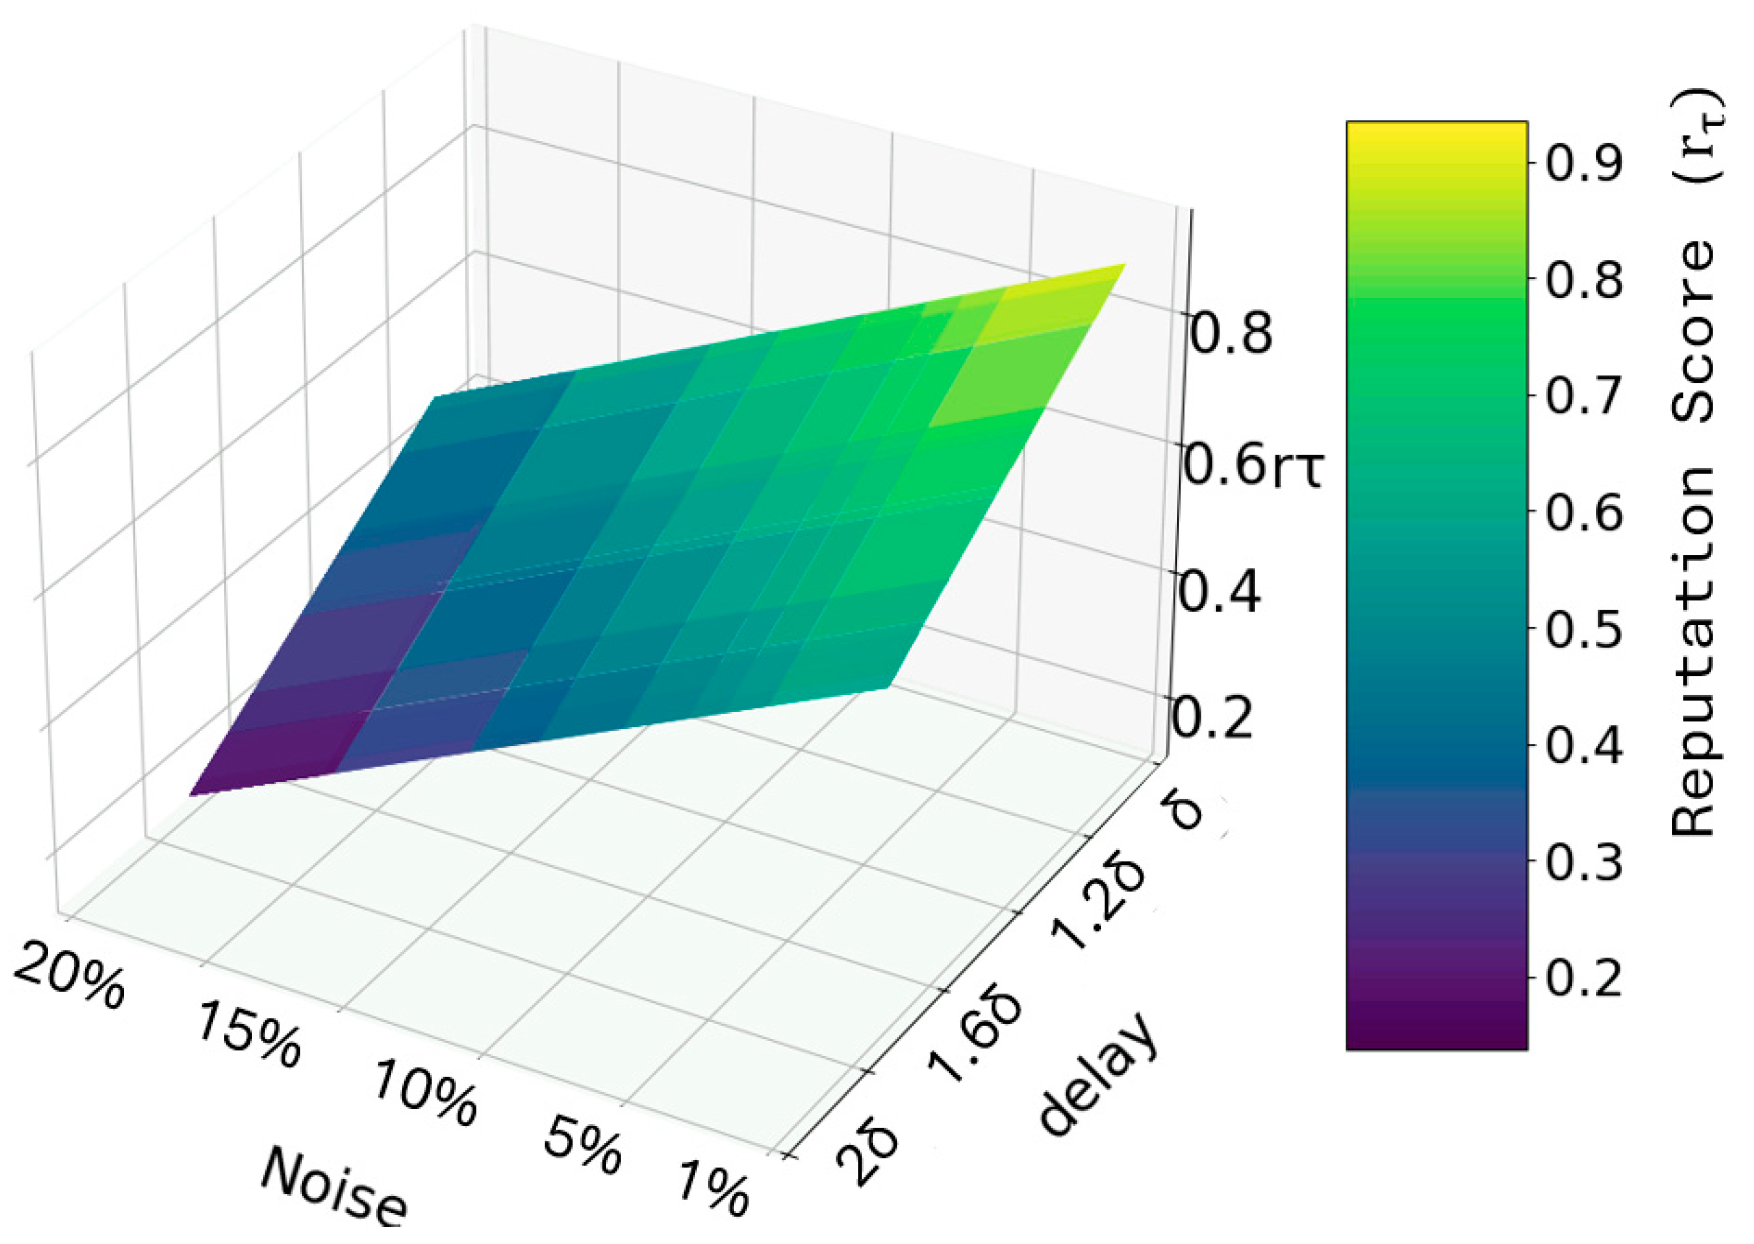
5.5. Reputation Scoring Patterns

We examine the patterns of the reputation scores of the topic by using the results of the quality assessment and the drifting scores obtained by introducing noise and delays in δ and analyze how they can impact the reputation score of the topic. The reputation score of the topic becomes closer to 1.0 under ideal conditions where there is no delay and the noise in the data is very low (around 1%). In the worst-case scenario, when there is very high noise in the data, such as 20%, and the maximum delay is double the δ, the reputation score drops to 0. Figure 10 shows the patterns of reputation scores under different noise and delay conditions.

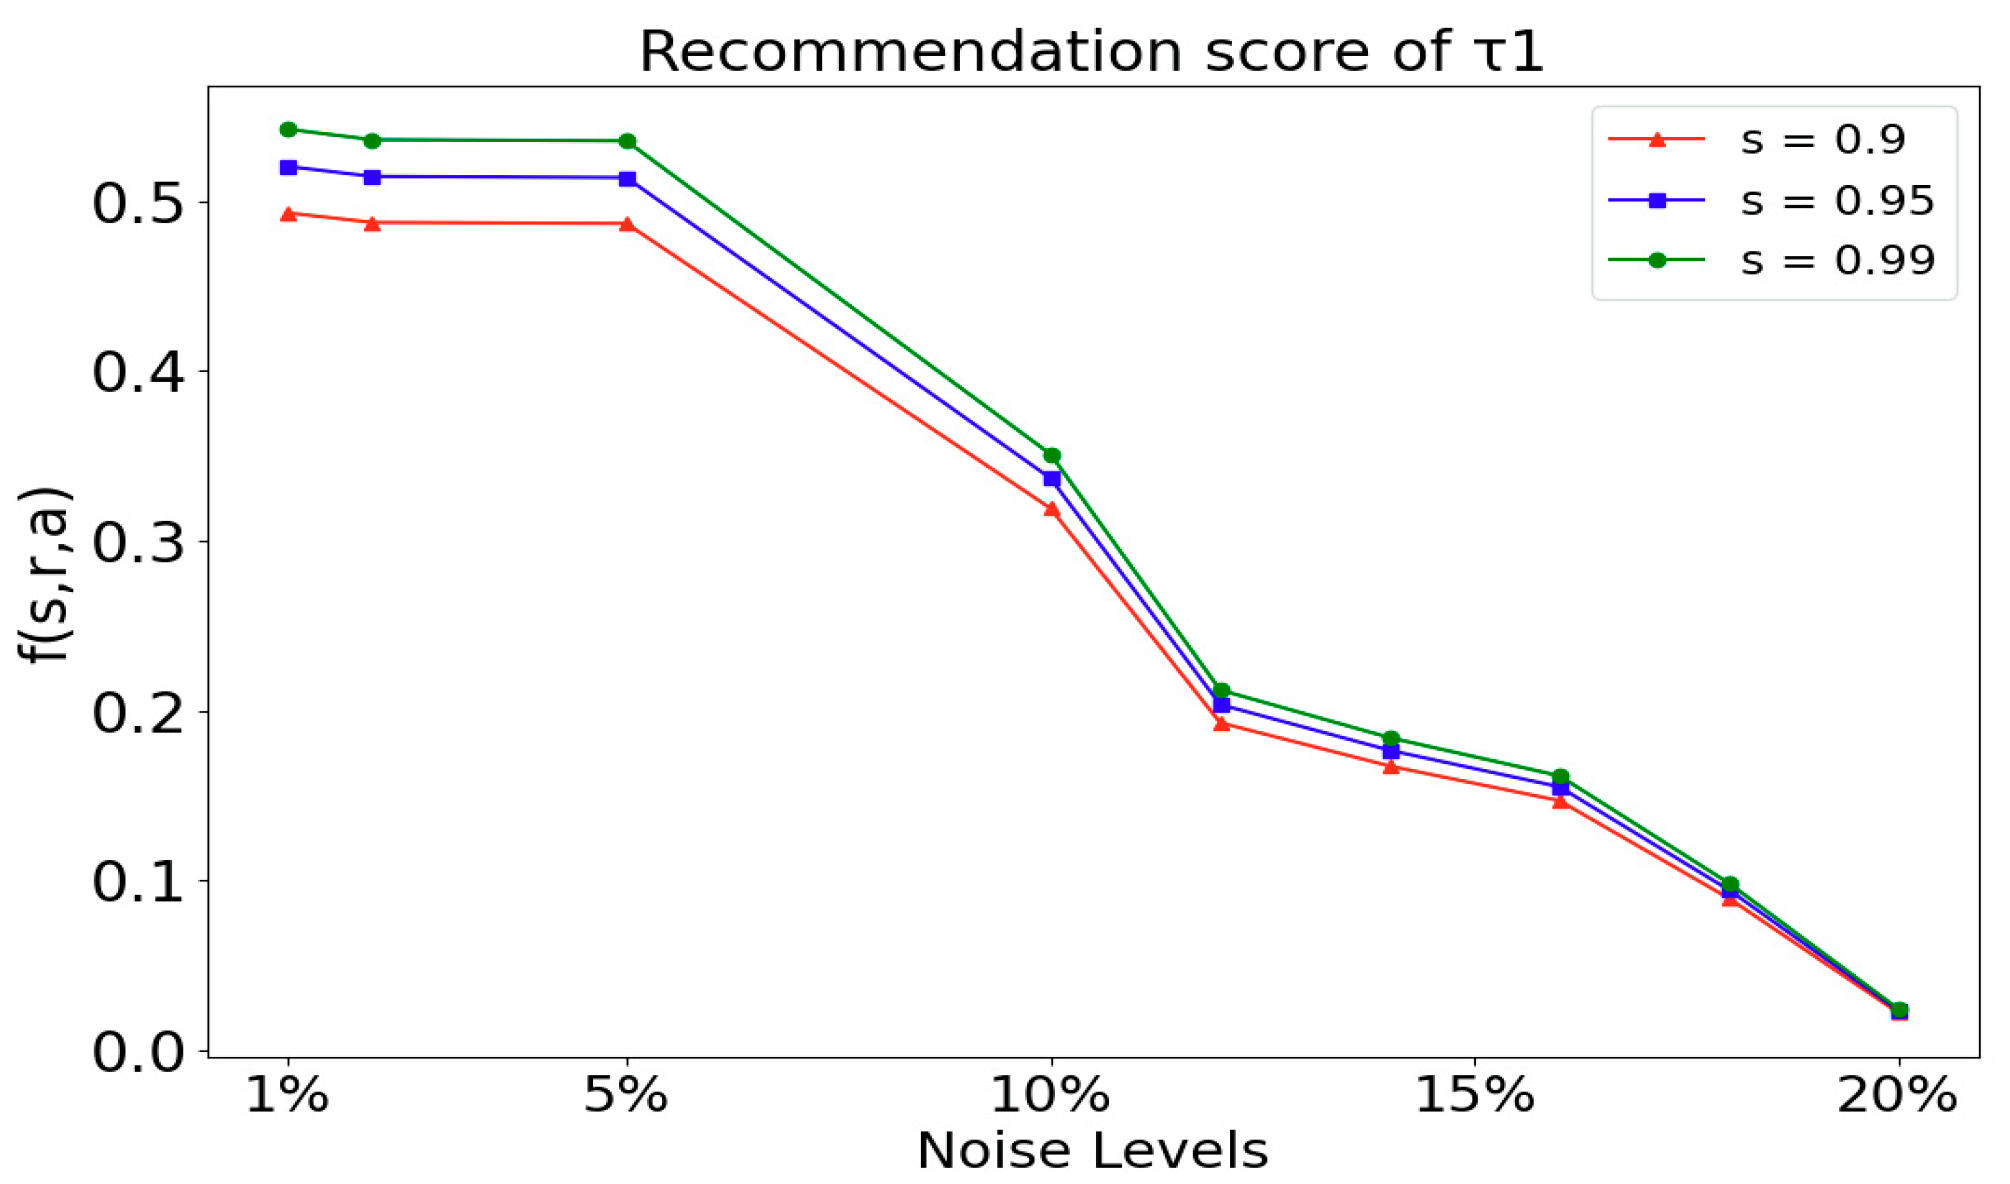
5.6. Recommendation Testing

In the recommendation score testing, we used the same dataset that we have used for quality assessment, examining recommendation scores under various noise levels while keeping similarity scores and publishing intervals fixed. Suppose a subscriber requests data from sensor_4, which was not in the smart broker at the time. Since sensor_4 correlates closely with sensor_1 data (correlation coefficient of 0.64), it will appear on the recommendation list in the smart broker for sensor_4. Figure 11 shows the recommendation score of sensor_1 varying under different noise levels, with Sensor_1 having the highest recommendation score in Γ‴.
The rest of the data streams will follow the same pattern but at lower levels than sensor_1. We consider the three possibilities of a similarity score of 0.9, 0.95, and 0.99, and most of the tags associated are the same. We can see that with increasing noise from the potential substitute itself (in this case, sensor_1), the recommendation score of the recommended substitute decreases.

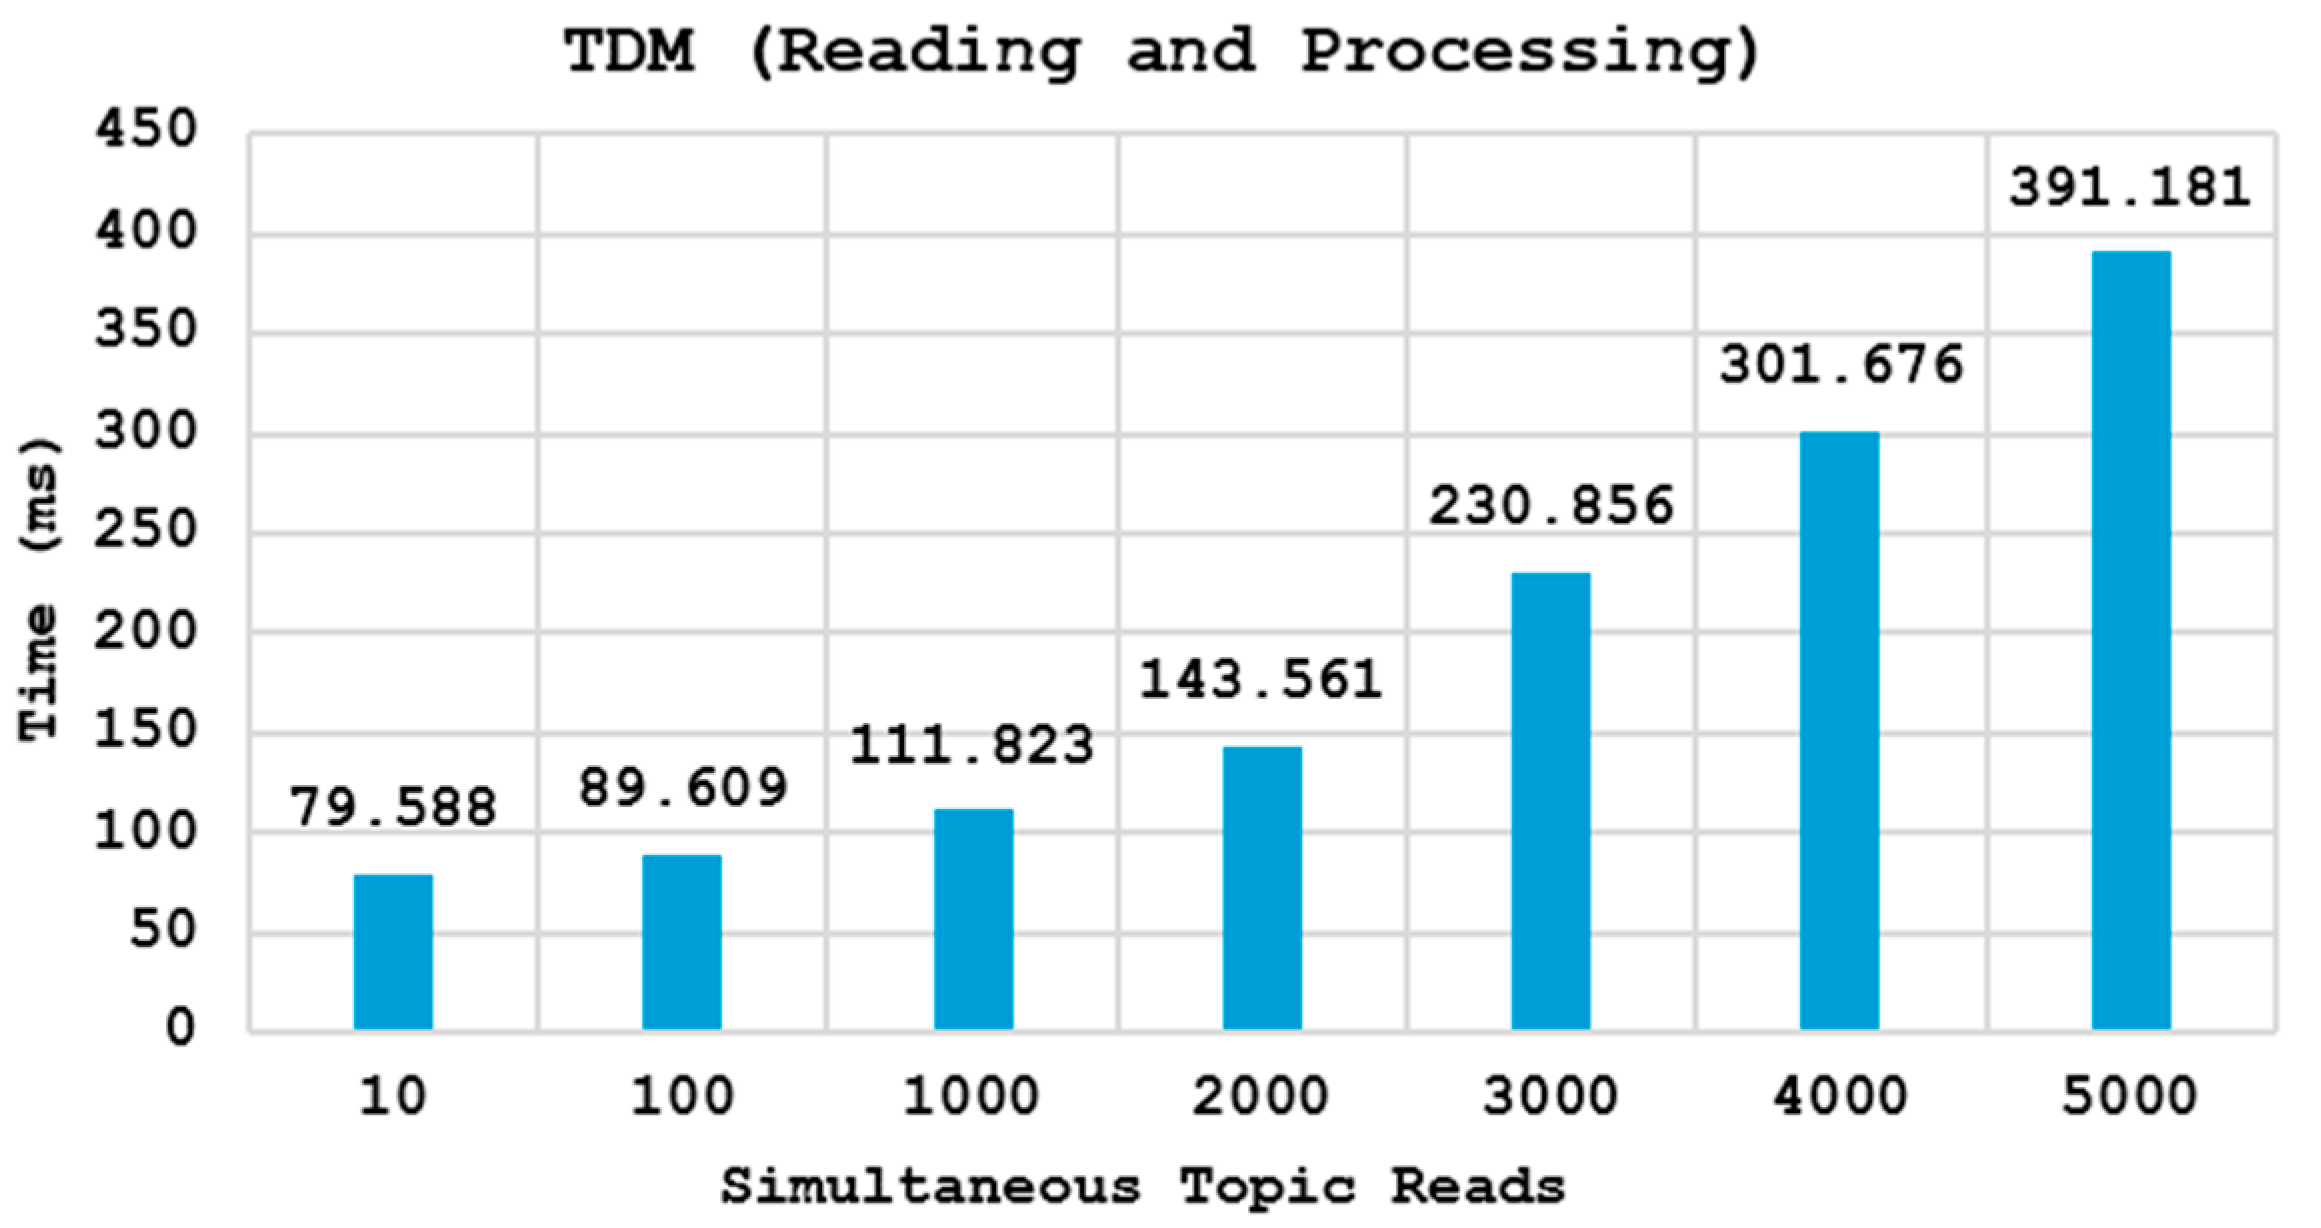
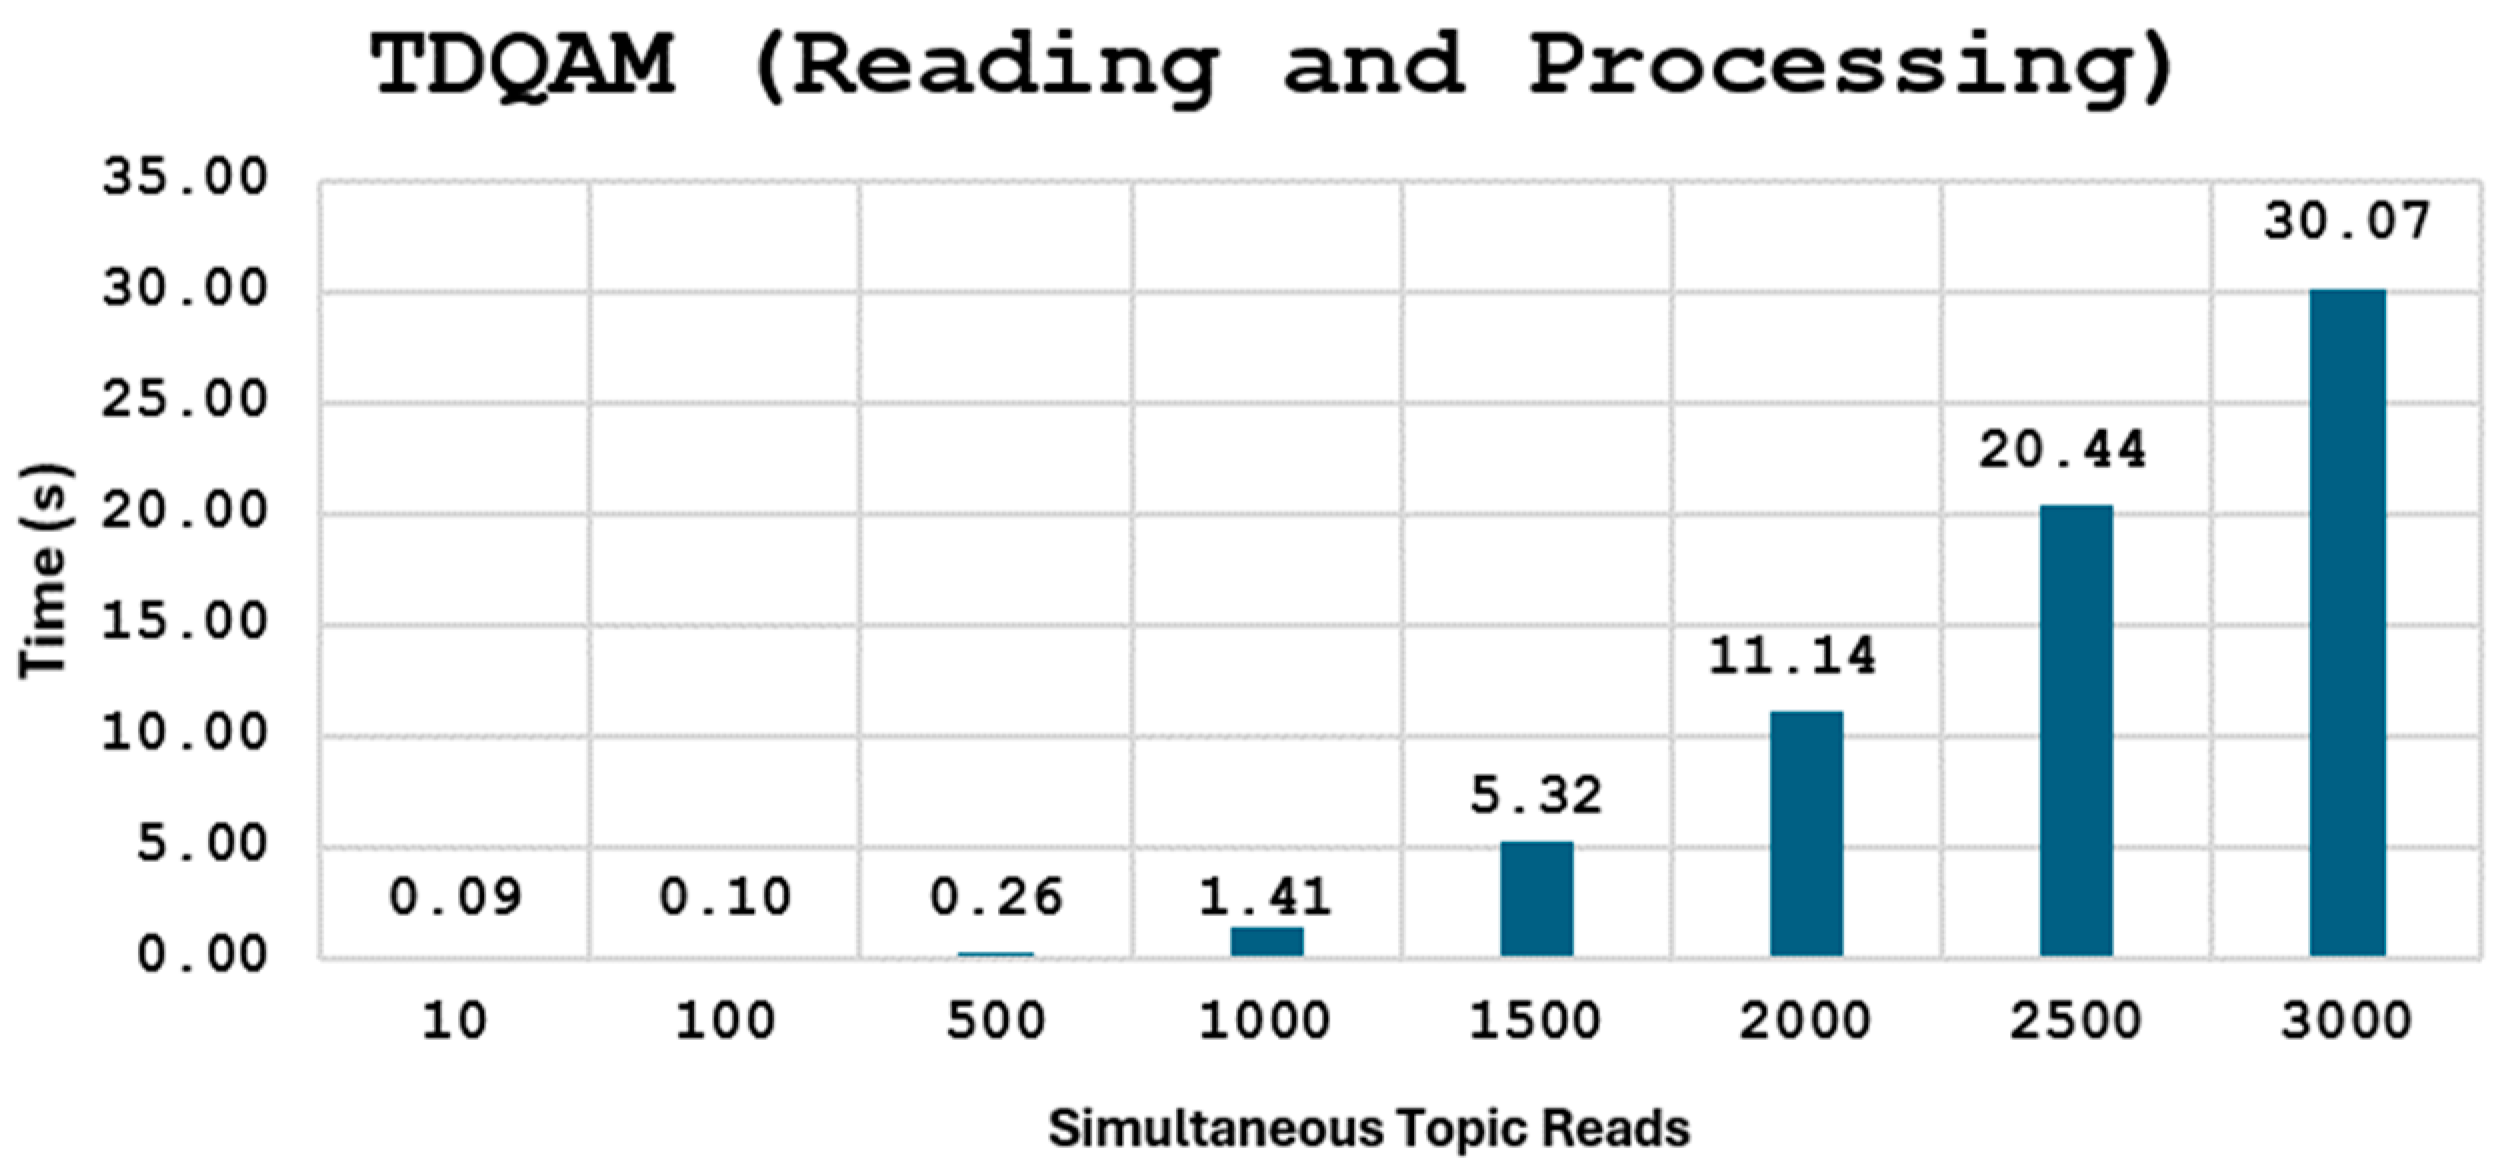
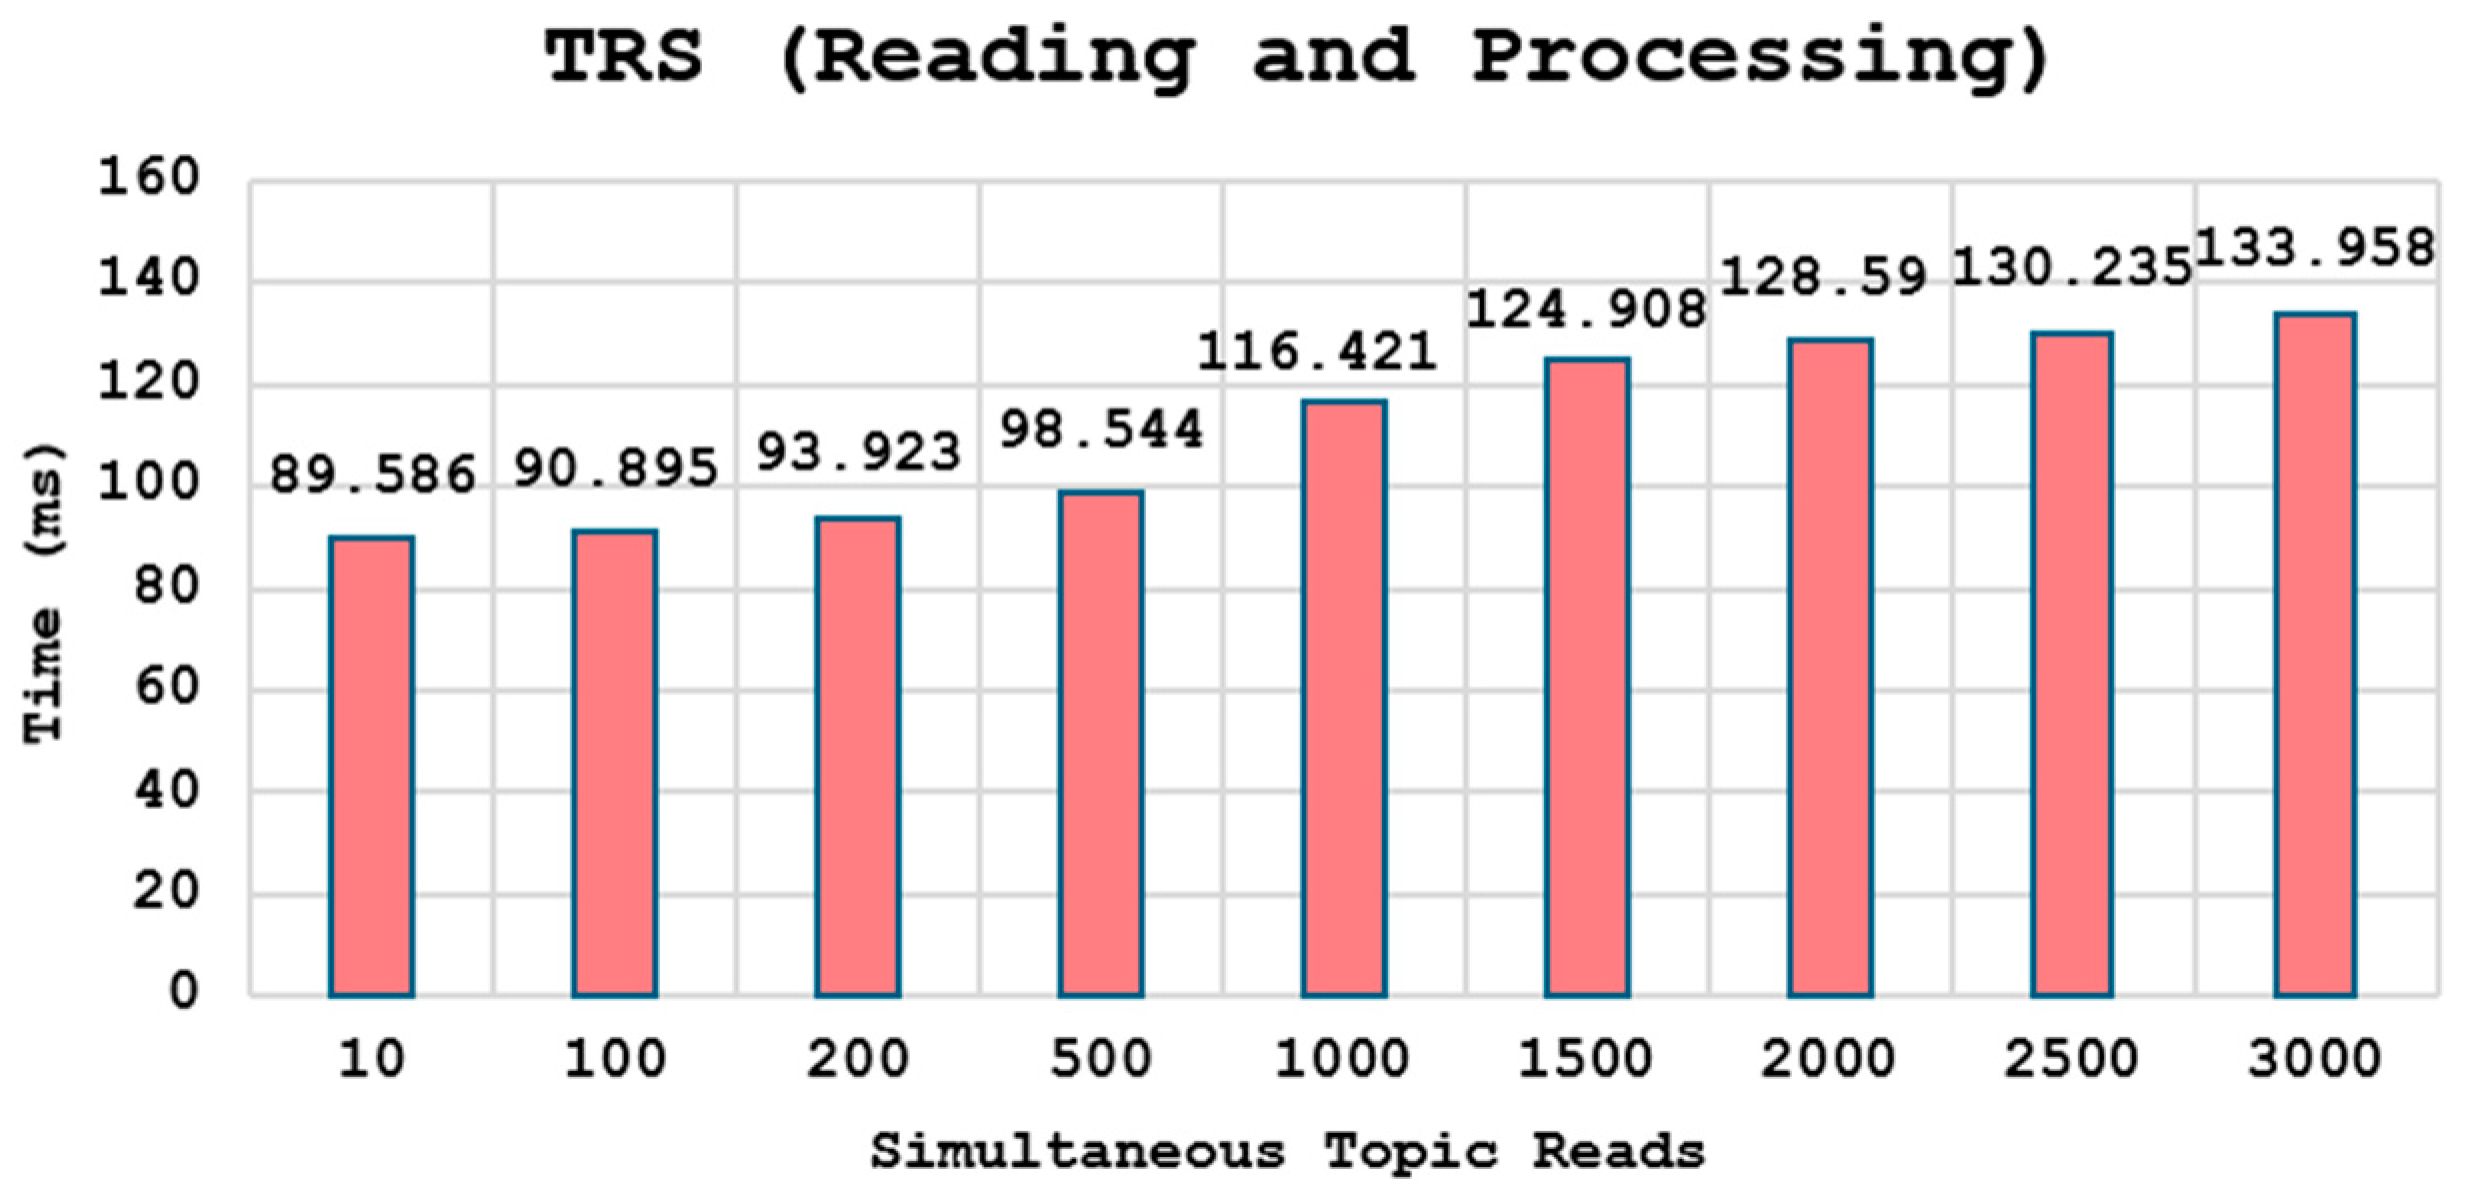
5.7. Performance Evaluation of Smart Broker

In this evaluation, we aimed to assess the smart broker’s performance within the Hyperledger fabric in terms of reading data, processing it, and writing the results into the ledger. We tested smart contracts (TDM, TDQAM, and TRS) within the smart broker deployed on a Hyperledger Fabric through a comprehensive simulation process. The simulation is to test the time consumption when the number of topics increases. At any given point in time, the smart contracts must calculate the quality of information on all topics. If the calculations are not simultaneous, then the time consumed would be naturally less, and the quality information would finalize much faster. If, however, the velocity of data is high and the smart contract needs to calculate the quality of all topics based on reading the data from the ledger, the time required to calculate the quality will increase. As such, we focus on this aspect of the performance. We varied the number of simultaneous topic reads, ranging from low (1 read) to high (5000 reads), keeping the channel number constant at 1, to assess the performance of the smart broker in taking the time to read, process, and write the results to the ledger. The network settings used in our evaluation are detailed in Table 4.
TDM (see Figure 12) shows a gradual increase in processing time as the number of simultaneous topic reads increases. Starting at 79.588 milliseconds for 10 reads, the time incrementally rises to 391.181 milliseconds for 5000 reads. It scales proportionally with the increase in topic reads.
With the TDQAM (Figure 13), the time varies more non-linearly, from about 90 ms for 10 simultaneous reads to 30 s for 3000 simultaneous topic reads.
With TRS (Figure 14), the time consumption is stable and linearly increases in processing time, starting at 89.586 milliseconds for 10 reads and rising to 133.958 milliseconds for 3000 reads. This gradual rise indicates that TRS efficiently manages increasing reads with minimal latency changes.
Assuming a typical IoT system can have several thousand devices (and corresponding topics), it is practical to implement the blockchain-based smart broker given that most IoT data will come in an update of more than a minute (δ > 60 s). Also, if multiple nodes of the Hyperledger are implemented, the time taken for calculating the quality components will also be reduced. Also, if using the Hyperledger fabric, multiple channels may be used to keep the data shared between peers (or publishers/subscribers) in the blockchain and potentially improve performance.

6. Characteristics of the Smart Broker

Smart broker inherits some of the key advantages of being implemented in the blockchain while having its own unique characteristics. This section also highlights some of the limitations and future studies needed to improve the smart broker.

6.1. Characteristics of the Blockchain Inherited by the Smart Broker

6.1.1. Advantage—Trust Management with Automation and Immutability

The execution of the smart broker mainly requires two parameters for each topic: δ and w , as shown in Figure 3. The modules in the smart broker continuously store their assessments based on δ and w inside the ledger for each topic. The modules are implemented as smart contracts, which execute in a timely manner automatically. Being executed and implemented inside a blockchain makes the incoming IoT data immutable and trustworthy. Also, the calculation of quality and reputation uses the best source of data, which is shared among the smart broker peers.

6.1.2. Advantage—Registration of Publisher Topics

The smart broker’s recommendation feature relies on the publisher’s provided topic details. Hence, topics must be registered before being evaluated within the smart broker. When stored in the blockchain, such data can be verified before being processed for recommendation calculations. They are also immutable but can be updated if needed.

6.1.3. Disadvantage—Scalability Issues

While integrating blockchain with IoT, there could be a chance of scalability issues due to the continuous high flow of IoT data. In terms of the blockchain, adding more nodes is not difficult as the smart broker contracts can be extended to the new nodes. For example, in Hyperledger, the smart contacts remain on the channel, and new nodes are added to the channel, giving access to the ledger. In terms of adding new devices (i.e., topics), increased velocity does not increase the workload too much. The main issue could be about the topics, which are the size of the groups. Larger group sizes may need the smart contract to perform the comparison of a larger number of topics.

6.1.4. Disadvantage—Bad Network Condition

In this paper, we assumed a functional network with stable latency. Variable latency on the internet will not impact the smart broker where the δ > 60, as the typical latency change is up to 1–2 s in typical internet services. Rarely, the quality may be impacted, but it can be considered negligible in the context of the actual time gaps expected. Even if bad network conditions lead to a loss of information enroute to the blockchain and no data being recorded for a topic in time, reputations do not suffer for a long time. It will eventually recover if the subsequent data arrives on time.

6.2. Other Advantages of the Smart Broker

6.2.1. Topic Level Reputation Management

The smart broker continuously monitors the reputation of topics by assessing their data quality and reliability in providing data within specified intervals. The modules involved study independently and rely on the latest available values of the components of the reputation scores. This ongoing assessment enables the smart broker to update the reputation of topics in real time. Consequently, when a subscriber requests data for a particular topic, the smart broker can promptly provide its reputation score. This real-time updating and sharing of reputation scores build trust between subscribers and the IoT data, ensuring transparency and reliability in the data exchange process.

6.2.2. Recommendation for Subscribers

The smart broker is able to monitor the relationship between the data streams continuously. Thus, it becomes easy for it to figure out substitutes for any given topic. This recommendation is based on both the reputation of the other topics as well as the similarity of those topics and the missing topics. Both the reputation and the recommendations can be calibrated according to the nature of the IoT systems, and certain aspects of the reputation and recommendation scoring may be magnified over others.

6.2.3. Real-Time Monitoring

All the modules within the smart broker perform real-time assessments of the topic data to continuously monitor its quality and reliability in terms of providing data within the required time interval.

6.3. Future Works and Limitations

The proposed smart broker has four key Equations (10), (12), (15) and (19) to determine the different scores within the whole system. These equations may be further improved according to blockchain performance efficiency and the nature of the relationships among the data streams. The following areas can be further enhanced:

6.3.1. Similarity Detection in a Smart Broker

The method for finding data streams with similar time series can be improved. In this paper, we assume manual data stream grouping, which requires a degree of human intervention and can introduce the possibility of tampering, making it unreliable. Also, if the nature of a relationship changes, then it has to be re-entered into the system periodically. Future improvements can be made where the blockchain keeps track of the actual relationship in real time and updates the value of the relationship matrix. It may find new relationships automatically and upgrade/downgrade existing relationships as well.

6.3.2. Non-Linear Relationships

The proposed approach needs to have a fixed w , λ , and δ. While having a fixed δ is not a big difficulty, having the right window size ( w ) is critical to the success of the TDQAM. In this paper, we use simple linear covariance to demonstrate the effectiveness of the proposed smart broker. However, in the future, smart brokers will need to use non-linear relationship measurements as well. This may be performed with neural network methods.
Furthermore, we only considered the most commonly used periodic sensor-oriented IoT application configuration here. Future studies can modify Equations (10), (12) and (19) as needed for different IoT application requirements.

6.3.3. Self-Checks

In this paper, we did not consider matching a stream with its historical values. This is primarily because just checking with its own historical values cannot account for actual environmental variations that are not a quality problem. However, based on the application, this factor can also be included in TDQAM alongside the streams’ peer assessment.

6.3.4. Speed of Detecting Variations

Currently, the proposed framework adjusts itself to provide the reputation score of the topics based on the specified windows of time. This could be improved if the smart broker could adjust the window itself based on external factors or information to make it more efficient.

6.3.5. Ability to Detect Problems

The proposed method can detect unexpected variations and report continuously in a reasonable time with respect to the periodicity of the data streams. If the variations disappear, then the reputation is restored. However, the depth of the actual problem is not identified by the current system. Unfortunately, even with a better version of quality assessment, it may still be difficult to identify if the variations are actually a problem. However, this aspect may be outside the scope of a smart broker and part of the subscriber applications.

6.3.6. Performance Inside the Blockchain

In this paper, we discussed the application of the smart broker inside a blockchain, thus inheriting the advantages of automation, accountability, and privacy that come with blockchain. We showed that the smart broker can be implemented in the blockchain. However, further testing and design issues need to be addressed, particularly regarding data storage. The subscriber only needs a specific window of the data and does not need older data, but blockchains typically keep storing information forever. The exact storage, exchange, and purging of data need to be investigated further.

6.3.7. Handling Event-Based Publishing Intervals

In the context of IoT, it is possible that the publishing interval may be event-based and happen at random times. In those cases, the quality would depend on other factors, such as the number of events in a given window.

6.4. Real-World Applications

The smart broker-based PS architecture can be used in any context where current PS applications work. The proposed method simply provides an opinion about every topic based on the recent performance of the individual publishing entities, that is, the IoT devices. Let us consider a smart city application, where the smart broker can be used to monitor various data streams from different sources to ensure the accuracy and reliability of the data used for critical decision-making processes. The possible publishers are as follows:
  • Traffic Monitoring Sensors, including traffic cameras, speed sensors, and vehicle counters. These publishers can provide topics such as traffic flow, vehicle speed, and vehicle count.
  • Environmental Sensors, including air quality monitors and weather stations, can provide information on topics such as the air quality index, temperature, humidity, and pollution levels.
  • Public Transit Systems, including buses, trains, and trams, can cover topics such as transit schedules, vehicle locations, and passenger counts.
  • Emergency Services, including police, fire departments, and ambulance services, can provide topics such as incident reports, response times, and emergency vehicle locations.
  • Infrastructure Sensors, including roadway sensors and bridge monitors, can offer topics like road conditions, structural integrity, and maintenance schedules.
All these entities will have a semi-permanent relationship with each other. These relationships can be captured in the relationship matrix, either manually or automatically, by analyzing historical information. Once the normal relationship is identified, any abnormality can be identified in real time. Based on the reputation scores, the smart broker recommends the most reliable information to city officials, optimizing city operations and enhancing citizen safety and well-being.

7. Conclusions

This paper has proposed a blockchain-driven smart broker designed for publisher-subscriber systems. It focuses on real-time tracking and monitoring of the reputation score of the topic’s data based on their quality and transmission intervals. We have proposed a mechanism capable of measuring drifts in the data and imposing penalties as well. Additionally, we implement a recommendation approach within the smart broker aimed at building trust between the subscriber and the recommended data. This approach provides recommendation scores derived from topic reputation within the smart broker, considering both data quality and transmission intervals. The proposed smart broker was tested using real-time datasets, demonstrating its capability to effectively handle and process IoT data in real-time scenarios while running from inside a blockchain. Every component of the smart broker can be improved and tailored for specific IoT applications.

Author Contributions

Conceptualization, AM. and R.I.; methodology, R.I. and A.M.; software, R.I.; validation, R.I. and A.M.; formal analysis, A.M. and R.I.; investigation, R.I. and A.M.; resources, R.I.; data curation, R.I. and A.M.; writing—original draft preparation, R.I. and A.M.; writing—review and editing, A.M.; visualization, R.I. and A.M.; supervision, A.M.; All authors have read and agreed to the published version of the manuscript.

Funding

This research received no external funding.

Institutional Review Board Statement

Not applicable.

Informed Consent Statement

Not applicable.

Data Availability Statement

The original contributions presented in the study are included in the article/supplementary material, further inquiries can be directed to the corresponding author/s. The weather data set used in this study is available in reference number [53].

Conflicts of Interest

The authors declare no conflicts of interest.

References

  1. Banti, K.; Louta, M.; Baziana, P. Data Quality in Human-Centric Sensing Based Next Generation IoT Systems: A Comprehensive Survey of Models, Issues and Challenges. IEEE Open J. Commun. Soc. 2023, 4, 2286–2317. [Google Scholar] [CrossRef]
  2. Teh, H.Y.; Kempa-Liehr, A.W.; Wang, K.I.K. Sensor data quality: A systematic review. J. Big Data 2020, 7, 11. [Google Scholar] [CrossRef]
  3. Zhang, P.; Pang, X.; Kumar, N.; Aujla, G.S.; Cao, H. A Reliable Data-Transmission Mechanism Using Blockchain in Edge Computing Scenarios. IEEE Internet Things J. 2022, 9, 14228–14236. [Google Scholar] [CrossRef]
  4. Alshami, A.; Ali, E.; Elsayed, M.; Eltoukhy, A.E.E.; Zayed, T. IoT Innovations in Sustainable Water and Wastewater Management and Water Quality Monitoring: A Comprehensive Review of Advancements, Implications, and Future Directions. IEEE Access 2024, 12, 58427–58453. [Google Scholar] [CrossRef]
  5. Domínguez-Bolaño, T.; Campos, O.; Barral, V.; Escudero, C.J.; García-Naya, J.A. An overview of IoT architectures, technologies, and existing open-source projects. Internet Things 2022, 20, 100626. [Google Scholar] [CrossRef]
  6. Agrawal, A.; Choudhary, S.; Bhatia, A.; Tiwari, K. Pub-SubMCS: A privacy-preserving publish–subscribe and blockchain-based mobile crowdsensing framework. Future Gener. Comput. Syst. 2023, 146, 234–249. [Google Scholar] [CrossRef]
  7. Hamad, M.; Finkenzeller, A.; Liu, H.; Lauinger, J.; Prevelakis, V.; Steinhorst, S. SEEMQTT: Secure End-to-End MQTT-Based Communication for Mobile IoT Systems Using Secret Sharing and Trust Delegation. IEEE Internet Things J. 2022, 10, 3384–3406. [Google Scholar] [CrossRef]
  8. Junior, F.M.R.; Kamienski, C.A. A Survey on Trustworthiness for the Internet of Things. IEEE Access 2021, 9, 42493–42514. [Google Scholar] [CrossRef]
  9. Zhu, R.; Boukerche, A.; Long, L.; Yang, Q. Design Guidelines On Trust Management for Underwater Wireless Sensor Networks. IEEE Commun. Surv. Tutor. 2024. early access. [Google Scholar] [CrossRef]
  10. Liu, J.; Yang, J.; Wu, W.; Huang, X.; Xiang, Y. Lightweight Authentication Scheme for Data Dissemination in Cloud-Assisted Healthcare IoT. IEEE Trans. Comput. 2022, 72, 1384–1395. [Google Scholar] [CrossRef]
  11. Sai Lohitha, N.; Pounambal, M. Integrated publish/subscribe and push-pull method for cloud based IoT framework for real time data processing. Meas. Sens. 2023, 27, 100699. [Google Scholar] [CrossRef]
  12. Vilenski, E.; Bak, P.; Rosenblatt, J.D. Multivariate anomaly detection for ensuring data quality of dendrometer sensor networks. Comput. Electron. Agric. 2019, 162, 412–421. [Google Scholar] [CrossRef]
  13. Abubakar, M.A.; Jaroucheh, Z.; Al-Dubai, A.; Liu, X. Blockchain-based identity and authentication scheme for MQTT protocol. In Proceedings of the 2021 3rd International Conference on Blockchain Technology, Shanghai, China, 26–28 March 2021; pp. 73–81. [Google Scholar]
  14. Paul, G.A.; Jagnani, Y.; Supraja, P. Improving Fault Tolerance and Tackling Broker Failure in MQTT through Blockchain. In Proceedings of the 2023 Third International Conference on Advances in Electrical, Computing, Communication and Sustainable Technologies (ICAECT), Bhilai, India, 5–6 January 2023; pp. 1–6. [Google Scholar]
  15. Ramachandran, G.; Wright, K.-L.; Zheng, L.; Navaney, P.; Naveed, M.; Krishnamachari, B.; Dhaliwal, J. Trinity: A Byzantine Fault-Tolerant Distributed Publish-Subscribe System with Immutable Blockchain-based Persistence. In Proceedings of the 2019 IEEE International Conference on Blockchain and Cryptocurrency (ICBC), Seoul, Republic of Korea, 14–17 May 2019; pp. 227–235. [Google Scholar]
  16. Hossain, M.I.; Steigner, D.T.; Hussain, M.I.; Akther, A. Enhancing Data Integrity and Traceability in Industry Cyber Physical Systems (ICPS) through Blockchain Technology: A Comprehensive Approach. arXiv 2024, arXiv:2405.04837. [Google Scholar]
  17. Bakar, K.; Zuhra, F.; Isyaku, B.; Sulaiman, S. A Review on the Immediate Advancement of the Internet of Things in Wireless Telecommunications. IEEE Access 2023, 11, 21020–21048. [Google Scholar] [CrossRef]
  18. Goknil, A.; Nguyen, P.; Sen, S.; Politaki, D.; Niavis, H.; Pedersen, K.J.; Suyuthi, A.; Anand, A.; Ziegenbein, A. A Systematic Review of Data Quality in CPS and IoT for Industry 4.0. ACM Comput. Surv. 2023, 55, 1–38. [Google Scholar] [CrossRef]
  19. Lv, P.; Wang, L.; Zhu, H.; Deng, W.; Gu, L. An IOT-Oriented Privacy-Preserving Publish/Subscribe Model Over Blockchains. IEEE Access 2019, 7, 41309–41314. [Google Scholar] [CrossRef]
  20. Li, L.; Jin, D.; Zhang, T.; Li, N. A Secure, Reliable and Low-Cost Distributed Storage Scheme Based on Blockchain and IPFS for Firefighting IoT Data. IEEE Access 2023, 11, 97318–97330. [Google Scholar] [CrossRef]
  21. Turner, S.W.; Karakus, M.; Guler, E.; Uludag, S. A Promising Integration of SDN and Blockchain for IoT Networks: A Survey. IEEE Access 2023, 11, 29800–29822. [Google Scholar] [CrossRef]
  22. Guo, Z.; Zhang, H.; Zhang, X.; Jin, Z.; Wen, Q. Secure and Efficiently Searchable IoT Communication Data Management Model: Using Blockchain as a New Tool. IEEE Internet Things J. 2018, 10, 11985–11999. [Google Scholar]
  23. Ataei, M.; Eghmazi, A.; Shakerian, A.; Landry, R.; Chevrette, G. Publish/Subscribe Method for Real-Time Data Processing in Massive IoT Leveraging Blockchain for Secured Storage. Sensors 2023, 23, 9692. [Google Scholar] [CrossRef]
  24. Buttar, H.M.; Aman, W.; Rahman, M.M.U.; Abbasi, Q.H. Countering Active Attacks on RAFT-Based IoT Blockchain Networks. IEEE Sens. J. 2023, 23, 14691–14699. [Google Scholar] [CrossRef]
  25. Li, K.C.; Shi, R.H. A Flexible and Efficient Privacy-Preserving Range Query Scheme for Blockchain-Enhanced IoT. IEEE Internet Things J. 2023, 10, 720–733. [Google Scholar] [CrossRef]
  26. Deebak, D.B.D.; Hussain, F.; Khowaja, S.; Dev, K.; Wang, W.; Qureshi, N.M.F.; Su, C. A Lightweight Blockchain Based Remote Mutual Authentication for IoT-Enabled Sustainable Computing Systems. IEEE Internet Things J. 2022, 8, 6652–6660. [Google Scholar] [CrossRef]
  27. AbuHalimeh, A.; Ali, O. Comprehensive review for healthcare data quality challenges in blockchain technology. Front. Big Data 2023, 6, 1173620. [Google Scholar] [CrossRef] [PubMed]
  28. Ashok, K.; Gopikrishnan, S. Statistical Analysis of Remote Health Monitoring Based IoT Security Models & Deployments From a Pragmatic Perspective. IEEE Access 2023, 11, 2621–2651. [Google Scholar] [CrossRef]
  29. Sanghami, S.V.; Lee, J.J.; Hu, Q. Machine-Learning-Enhanced Blockchain Consensus With Transaction Prioritization for Smart Cities. IEEE Internet Things J. 2023, 10, 6661–6672. [Google Scholar] [CrossRef]
  30. Li, C.; Chen, R.; Wang, Y.; Xing, Q.; Wang, B. REEDS: An Efficient Revocable End-to-End Encrypted Message Distribution System for IoT. IEEE Trans. Dependable Secur. Comput. 2024, 1–18. [Google Scholar] [CrossRef]
  31. Dedeoglu, V.; Jurdak, R.; Dorri, A.; Lunardi, R.C.; Michelin, R.A.; Zorzo, A.F.; Kanhere, S.S. Blockchain Technologies for IoT. In Advanced Applications of Blockchain Technology; Kim, S., Deka, G.C., Eds.; Springer: Singapore, 2020; pp. 55–89. [Google Scholar]
  32. Zhang, L.; Jeong, D.; Lee, S. Data Quality Management in the Internet of Things. Sensors 2021, 21, 5834. [Google Scholar] [CrossRef] [PubMed]
  33. Byabazaire, J.; O’Hare, G.; Delaney, D. Data Quality and Trust: Review of Challenges and Opportunities for Data Sharing in IoT. Electronics 2020, 9, 2083. [Google Scholar] [CrossRef]
  34. ISO 8000-8:2015; Data Quality—Part 8: Information and Data Quality: Concepts and Measuring. International Organization for Standardization: Geneva, Switzerland, 2015.
  35. KaradaŞ, H.B.; Kalkan, K. IBAM: IPFS and Blockchain based Authentication for MQTT protocol in IoT. In Proceedings of the 2023 IEEE Symposium on Computers and Communications (ISCC), Gammarth, Tunisia, 9–12 July 2023; pp. 537–542. [Google Scholar]
  36. Zupan, N.; Zhang, K.; Jacobsen, H.-A. Hyperpubsub: A decentralized, permissioned, publish/subscribe service using blockchains: Demo. In Proceedings of the 18th ACM/IFIP/USENIX Middleware Conference: Posters and Demos, Las Vegas, NV, USA, 11–15 December 2017; pp. 15–16. [Google Scholar]
  37. Zhao, Y.; Li, Y.; Mu, Q.; Yang, B.; Yu, Y. Secure Pub-Sub: Blockchain-Based Fair Payment With Reputation for Reliable Cyber Physical Systems. IEEE Access 2018, 6, 12295–12303. [Google Scholar] [CrossRef]
  38. Buccafurri, F.; Romolo, C. A Blockchain-Based OTP-Authentication Scheme for Constrainded IoT Devices Using MQTT. In Proceedings of the 2019 3rd International Symposium on Computer Science and Intelligent Control, Amsterdam, The Netherlands, 25–27 September 2020. Article 55. [Google Scholar]
  39. Hsu, T.C.; Lu, H.-S. Designing a Secure and Scalable Service Model Using Blockchain and MQTT for IoT Devices. In Proceedings of the IEEE/CVF Winter Conference on Applications of Computer Vision, Waikoloa, HI, USA, 1–6 January 2024; pp. 645–653. [Google Scholar]
  40. Liu, Z.; Meng, L.; Zhao, Q.; Li, F.; Song, M.; Dai, D.; Yang, X.; Guan, S.; Wang, Y.; Tian, H. A Blockchain-Based Privacy-Preserving Publish-Subscribe Model in IoT Multidomain Data Sharing. Wirel. Commun. Mob. Comput. 2022, 2022, 2381365. [Google Scholar] [CrossRef]
  41. Sharma, A.; Pilli, E.S.; Mazumdar, A.P.; Gera, P. Towards trustworthy Internet of Things: A survey on Trust Management applications and schemes. Comput. Commun. 2020, 160, 475–493. [Google Scholar] [CrossRef]
  42. Wang, J.; Yan, Z.; Wang, H.; Li, T.; Pedrycz, W. A Survey on Trust Models in Heterogeneous Networks. IEEE Commun. Surv. Tutor. 2022, 24, 2127–2162, Fourthquarter 2022. [Google Scholar] [CrossRef]
  43. Wairimu, S.; Iwaya, L.H.; Fritsch, L.; Lindskog, S. On the Evaluation of Privacy Impact Assessment and Privacy Risk Assessment Methodologies: A Systematic Literature Review. IEEE Access 2024, 12, 19625–19650. [Google Scholar] [CrossRef]
  44. Yin, C.; Xi, J.; Sun, R.; Wang, J. Location Privacy Protection Based on Differential Privacy Strategy for Big Data in Industrial Internet of Things. IEEE Trans. Ind. Inform. 2018, 14, 3628–3636. [Google Scholar] [CrossRef]
  45. Siboni, S.; Sachidananda, V.; Meidan, Y.; Bohadana, M.; Mathov, Y.; Bhairav, S.; Shabtai, A.; Elovici, Y. Security Testbed for Internet-of-Things Devices. IEEE Trans. Reliab. 2019, 68, 23–44. [Google Scholar] [CrossRef]
  46. Cai, B.; Li, X.; Kong, W.; Yuan, J.; Yu, S. A Reliable and Lightweight Trust Inference Model for Service Recommendation in SIoT. IEEE Internet Things J. 2022, 9, 10988–11003. [Google Scholar] [CrossRef]
  47. Shao, R.; Mao, H.; Jiang, J. Time-Aware and Location-Based Personalized Collaborative Recommendation for IoT Services. In Proceedings of the 2019 IEEE 43rd Annual Computer Software and Applications Conference (COMPSAC), Milwaukee, WI, USA, 15–19 July 2019; pp. 203–208. [Google Scholar] [CrossRef]
  48. Chen, Y.; Wang, J.; Wang, H.; Huang, S.; Lin, C. COSS: Content-Based Subscription as an IoT Service. In Proceedings of the 2015 IEEE International Conference on Web Services, New York, NY, USA, 27 June–2 July 2015; pp. 369–376. [Google Scholar] [CrossRef]
  49. Ugochukwu, N.A.; Goyal, S.B.; Rajawat, A.S.; Verma, C.; Illés, Z. Enhancing Logistics With the Internet of Things: A Secured and Efficient Distribution and Storage Model Utilizing Blockchain Innovations and Interplanetary File System. IEEE Access 2024, 12, 4139–4152. [Google Scholar] [CrossRef]
  50. Nawara, D.; Kashef, R. Context-Aware Recommendation Systems in the IoT Environment (IoT-CARS)—A Comprehensive Overview. IEEE Access 2021, 9, 144270–144284. [Google Scholar] [CrossRef]
  51. Ahlawat, P.; Rana, C. A Hybrid Trusted Knowledge Infusion Recommendation System for IoT-Based Applications. In Proceedings of the 2023 6th International Conference on Contemporary Computing and Informatics (IC3I), Gautam Buddha Nagar, India, 14–16 September 2023; pp. 973–977. [Google Scholar] [CrossRef]
  52. Yu, K.; Guo, Z.; Shen, Y.; Wang, W.; Lin, J.C.; Sato, T. Secure Artificial Intelligence of Things for Implicit Group Recommendations. IEEE Internet Things J. 2022, 9, 2698–2707. [Google Scholar] [CrossRef]
  53. Kaggle. dwinn183287. TPS July 2021—EDA. 2021. Available online: https://www.kaggle.com/code/dwin183287/tps-july-2021-eda (accessed on 27 June 2024).
Figure 3. Illustration of the relationship as vectors between three topics (a) normal and (b,c) when the relationship varies in the window. Quality is calculated based on the raw vector difference.
Applsci 14 05907 g003
Figure 4. The execution of various modules of the smart broker for a specific window and topic. Note that t 0 λ and t 0 w does not have to align for a topic.
Applsci 14 05907 g004
Figure 6. Time (s) taken by the smart broker to detect drops in Dτ below 0.7, 0.5, and 0.3, respectively, as delays increase at a rate of 0.2δ, when δ = 15 s.
Applsci 14 05907 g006
Figure 7. The smart broker quality calculation within a group. (a) the raw values of the time series data from each publisher topic, which are time-synchronized. (b) the quality calculations using Equation (12) for each of the time series. (c) the Normalized Group Specific Quality of each time series.
Applsci 14 05907 g007aApplsci 14 05907 g007b
Figure 8. Quality assessment of τ 1 over time with different levels of noise in the data, with a δ = 15 s and window size increasing from 150 s to 3000 s.
Applsci 14 05907 g008
Figure 9. Time taken by the smart broker to detect drop in q τ below 0.7, 0.6, and 0.5, as the level of noise increases over time (δ = 15 s, and there is no drift).
Applsci 14 05907 g009
Figure 10. Reputation score of the topic varying with levels of noise and delay in the data.
Applsci 14 05907 g010
Figure 11. Recommendation score of the topic drops across noise levels (δ = 15 s, w = 150 s, and a = 0.64).
Applsci 14 05907 g011
Figure 12. Time consumption by TDM for reading and processing data under varying topic loads.
Applsci 14 05907 g012
Figure 13. Time consumed by TDQAM for reading and processing data with varying topic loads.
Applsci 14 05907 g013
Figure 14. Time (s) consumption by TRS for reading and processing data under varying topic loads.
Applsci 14 05907 g014
Table 1. Parameters/Symbol Table.
SymbolsMeaning
τ A topic in the PS system
δ Expected publishing interval
g A tag for the topic
D τ Drifting sore Performance indicator of the topic
r τ Reputation of the topic τ
q τ The quality of the sensor data related to the topic τ
sSimilarity score
tCurrent time
v i j Expected relationship between the paired topics   { τ i , τ j }
a i j Association coefficient between the paired topics   τ i , τ j
w i j Time window for calculating quality for topics i and j
μ Tolerance level of drift
λTime window for calculating drift for a single topic
Table 2. Parameter settings for testing.
Parameter SettingsValue
δ 15 s
Delayed intervals[δ, 2δ] in increments of 0.2
α (0, 1]
β (0, 1]
Noise
µ
1%, 2%, 5%, 10%, 12%, 16%, and 20%
2*δ
Table 3. Input parameters for quality testing.
Correlation Thresholds for Topic
(sensor_1, sensor_2, and sensor_5)
v 12 0.81
v 13 0.86
v 23 0.86
Table 4. Network configurations.
Network
Configurations
Values
Batch timeout2 s
PreferredMaxBytes500
Ledger DatabaseCouchDB
Block Size10 transactions
Number of channels1
Number of topics1–5000
Disclaimer/Publisher’s Note: The statements, opinions and data contained in all publications are solely those of the individual author(s) and contributor(s) and not of MDPI and/or the editor(s). MDPI and/or the editor(s) disclaim responsibility for any injury to people or property resulting from any ideas, methods, instructions or products referred to in the content.

