Article

Experimental and Theoretical Study of Heat Transfer in a Chilled Ceiling System

by
Cüneyt Deniz Küheylan
* and
Derya Burcu Özkan
Department of Mechanical Engineering, Faculty of Mechanical Engineering, Yildiz Technical University, 34349 İstanbul, Turkey
*
Author to whom correspondence should be addressed.
Appl. Sci. 2024, 14(13), 5908; https://doi.org/10.3390/app14135908 (registering DOI)
Submission received: 22 May 2024 / Revised: 14 June 2024 / Accepted: 21 June 2024 / Published: 6 July 2024
(This article belongs to the Topic Advanced Heat and Mass Transfer Technologies)

Abstract

:
Radiant cooling has been growing in recent years due to energy savings and improved comfort and health. The aim of this study was to reduce energy consumption and provide comfort using a chilled ceiling panel in the zone. In the experimental part of this study, a test room was created to investigate the change in the heat transfer performance of a chilled ceiling panel according to different water temperatures, different water flow rates and different heat source values. As a result of the experimental study, it was found that optimum conditions were achieved with a heat rate of 280 Watts and the lowest supply water temperature of 14 °C, with indoor comfort conditions being achieved with water flow rates of 0.93 m3/h. In the theoretical part of this study, a thermal balance was established for ceiling panel cooling applications. An analytical model of the heat transfer between the cold ceiling panel and the room air was also developed. The convection coefficient, convective heat transfer and total heat transfer coefficient were compared using the values obtained from the experiments and those reported in the literature. It was found that the convection coefficient was within the range reported in the literature, and the radiation heat coefficient was within 99.8% of the literature values.

1. Introduction

Chilled ceiling systems have been used for space cooling in buildings because of their high efficiency and environmental protection. Compared to convective systems, radiant systems have the potential to provide thermal comfort at lower indoor temperatures for heating and at higher indoor temperatures for cooling. There are numerous studies on the heat transfer performance of a chilled ceiling space system.
Deng et al. [1] found that asymmetric radiation and cooling conditions significantly affect the thermal interaction between the human body and radiant surfaces. According to the obtained data, they determined that the magnitude of the thermal interaction between the human body and radiant surfaces is higher under asymmetric radiation conditions compared to symmetric radiation conditions. Junasová et al. [2] conducted research on the adaptation of radiant heating and cooling system construction for buildings. Koca et al. [3] performed experimental studies on the heat transfer properties of radiant-cooled walls in a fully conditioned life-size space. They concluded that cooling by radiation is an effective method of providing comfort conditions in the space. Camci et al.’s [4] experimental investigations examined the heat transfer properties of a radiantly cooled wall subjected to forced convection with displacement ventilation. They determined the increase in heat transfer during forced convection. Koca [5] experimentally determined that 67% of the total heat transfer coefficient in a wall-cooling application consists of the radiation heat transfer coefficient, and 33% consists of the convective heat transfer coefficient. Additionally, it was determined that the cooling capacity of the panels with an additional aluminum conductive layer is approximately 21% higher compared to the traditional classics panel. Chen et al.’s [6] studies demonstrated the effectiveness of model predictive control in improving the energy efficiency of ceiling cooling systems. They modeled the system behavior and optimized it in real time, demonstrating energy savings. Jin et al. [7] performed experimental studies on ceiling cooling systems, investigating the dynamic effect of water flow rate changes in the surface temperature of radiant cold ceiling panels. Their results showed that changes in the water flow rate affect surface temperature, increasing it at lower water flow rates. Shinoda et al. [8] conducted a literature review of surface heat transfer coefficients for radiant heating and cooling systems. They found greater variation and prediction error in total and convective heat transfer values compared to radiative heat transfer, which had a margin of error of ±20%. They investigated how to increase the cooling capacity of open-mounted chilled beam ceiling systems. Shin et al. [9] found that the cooling capacity could be increased by 54% to 80% with an appropriate design. Yuan et al. [10] proposed a correlation between heat transfer coefficients and heat flux in radiant ceiling panels based on their experimental work in a climate-controlled test chamber. They conducted an experimental study to determine the cooling capacity of radiant cooling ceiling systems. Andrés-Chicote et al. [11] evaluated the factors that influence the cooling capacity of the system, as well as its impact on energy efficiency and comfort conditions. Causone et al. [12] conducted theoretical and experimental studies on cooling ceiling systems to optimize their energy efficiency and performance. Diaz et al.’s [13] theoretical and experimental studies concluded that the heat transfer coefficients between radiant ceilings and the room are influenced by various parameters, including the surface temperature distribution, room heat gains and air movement. Cheng et al. [14] explored the use of zigzag walls with asymmetric emissivity to enhance passive daytime radiative cooling (PDRC). By reflecting sunlight and emitting infrared radiation, these walls achieve sub-ambient cooling, reducing energy consumption. The design yields a daily average temperature drop of 2.3 °C, potentially saving up to 37 GJ of energy and USD 1.4k annually for typical midrise apartments, particularly benefiting warmer southern U.S. areas. Cheng et al.’s [15] study explored fin walls with tunable angular emissivity for year-round thermal regulation. These walls adjust their emissivity according to the season, improving cooling in summer and retaining heat in winter. The dynamic design can save up to 24% of annual energy compared to traditional high-emissivity walls, offering a significant advance in building energy efficiency and sustainability.
Unlike previous studies in the literature, this study determined the optimum water temperature, water flow rate and heat rate conditions in terms of energy efficiency and comfort in a space cooled by chilled ceiling panels. This study also included the calculation of the thermal conductivity of the chilled ceiling panel. A theoretical model of heat transfer between the cold ceiling panel and the room air was also developed. This study found a high degree of agreement between the theoretical model and the experimental results, confirming the validity of the theoretical model.

2. Experimental Methodology

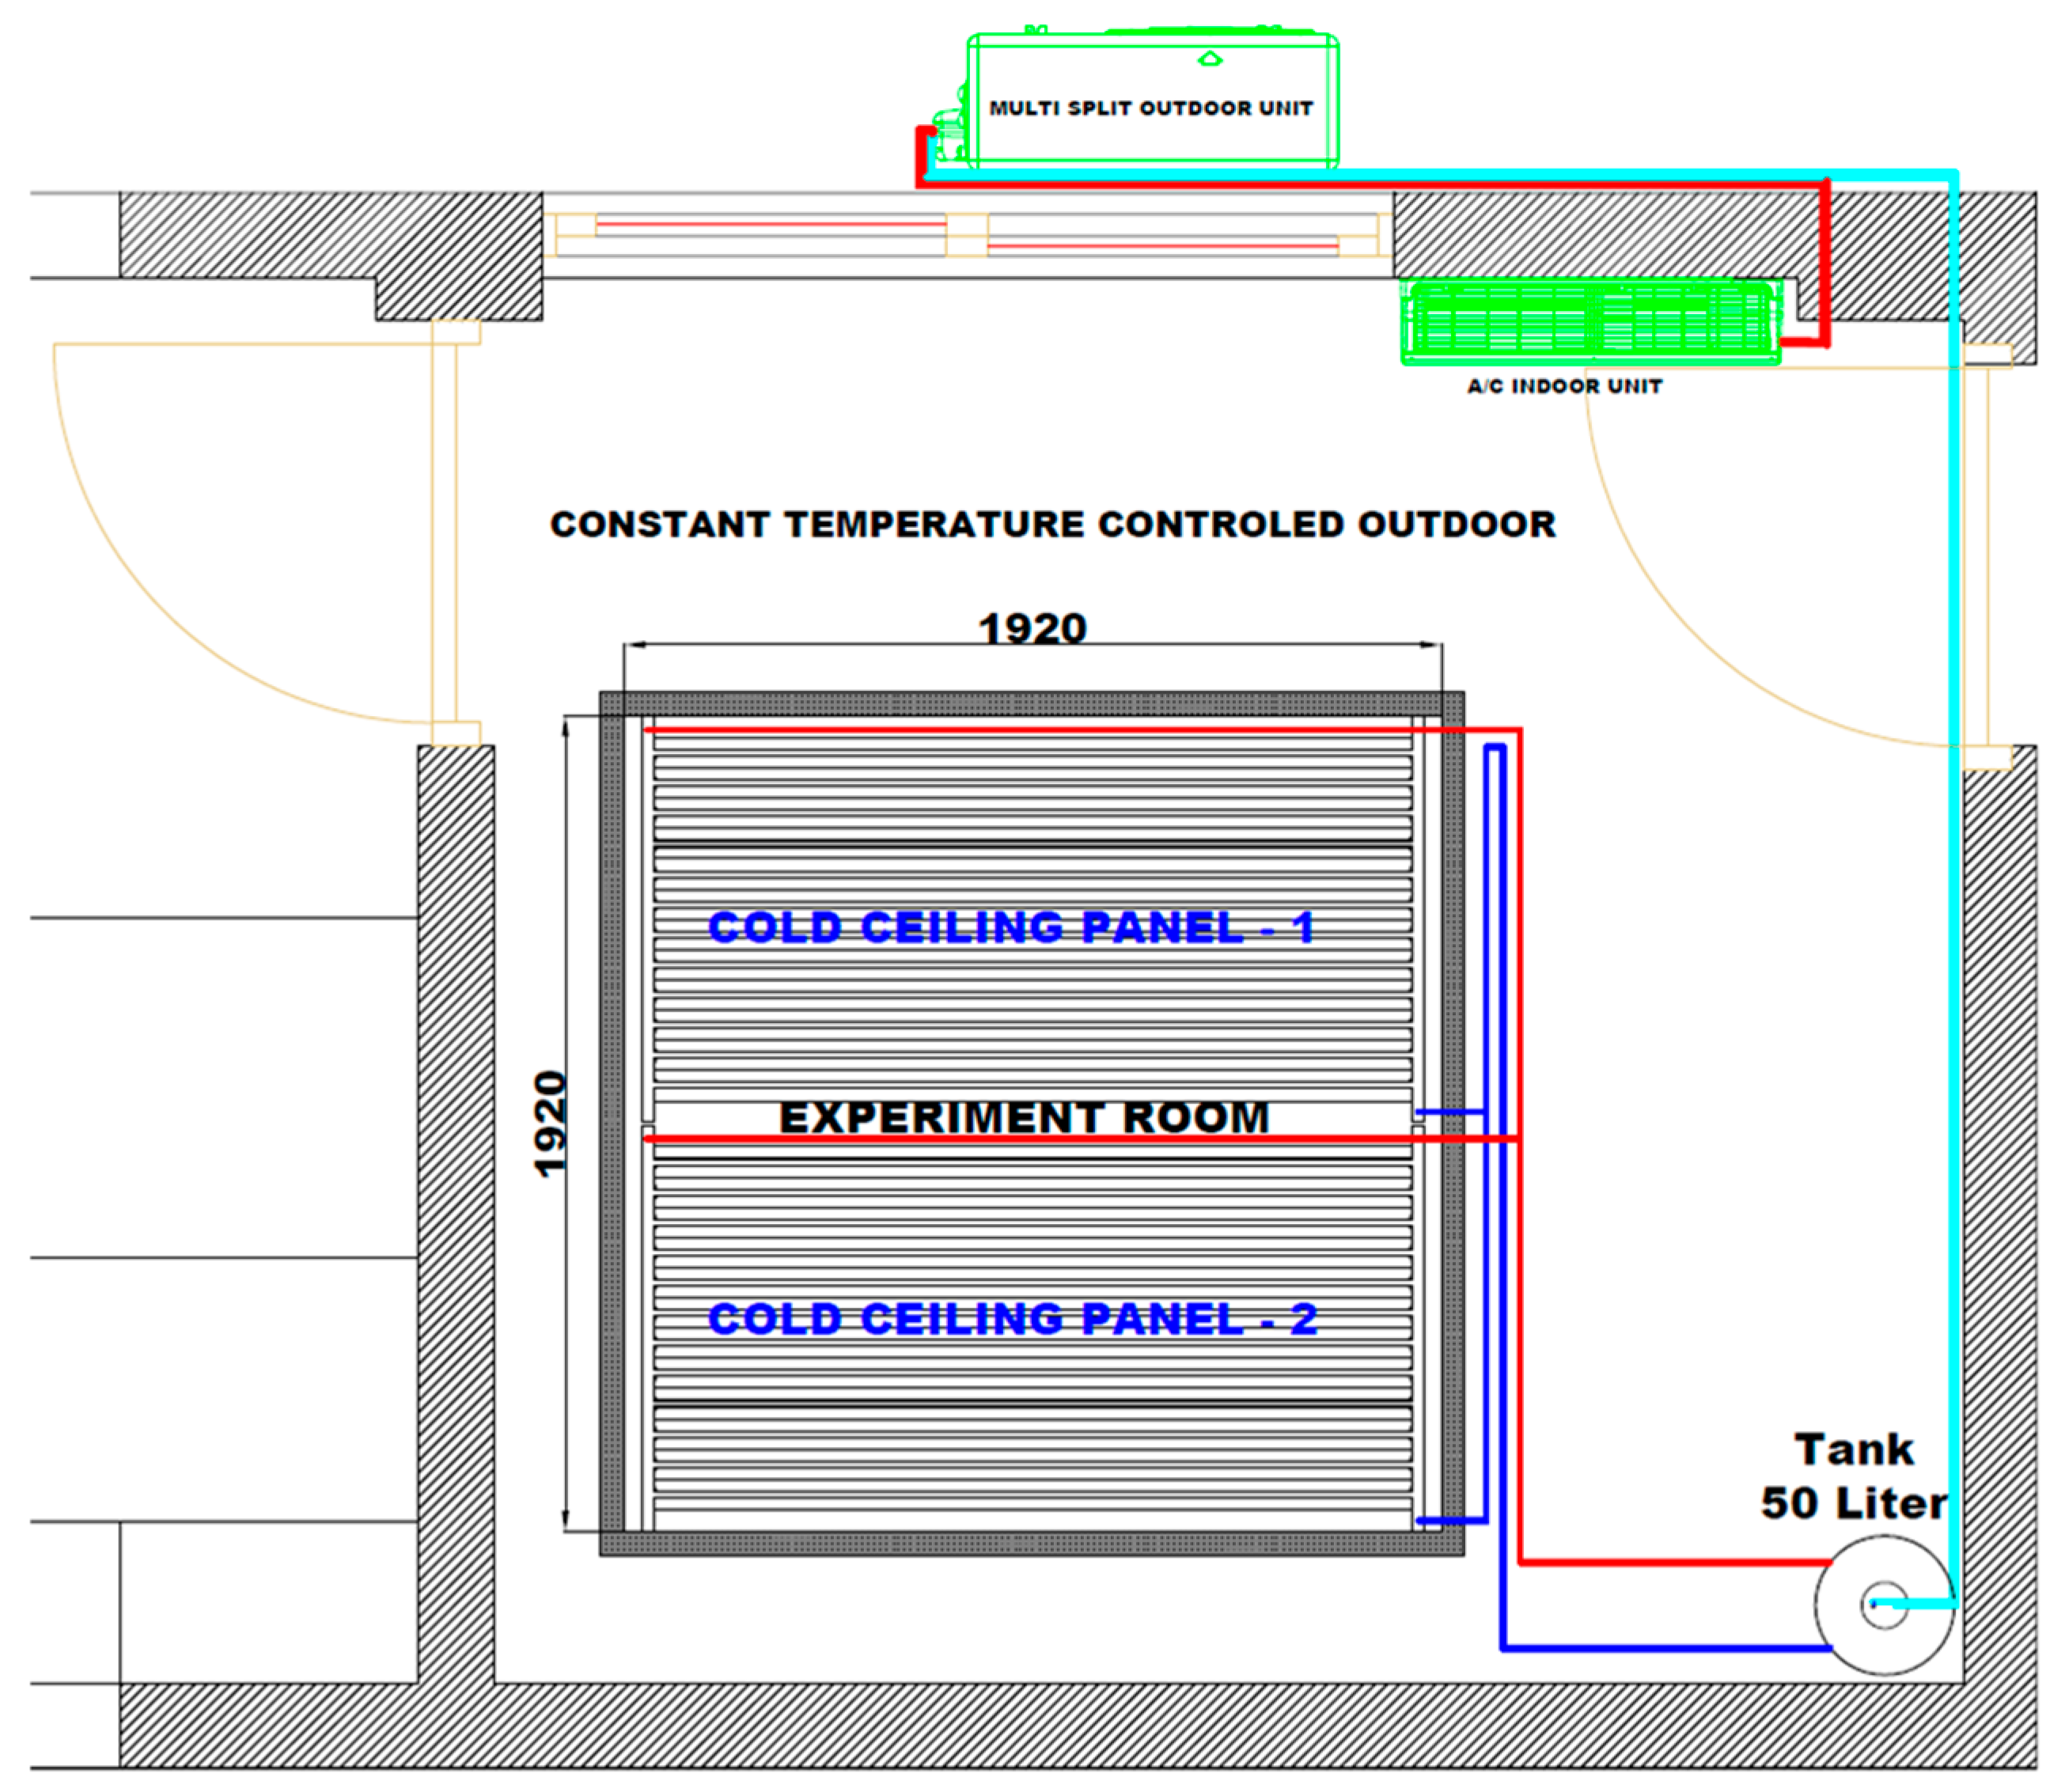
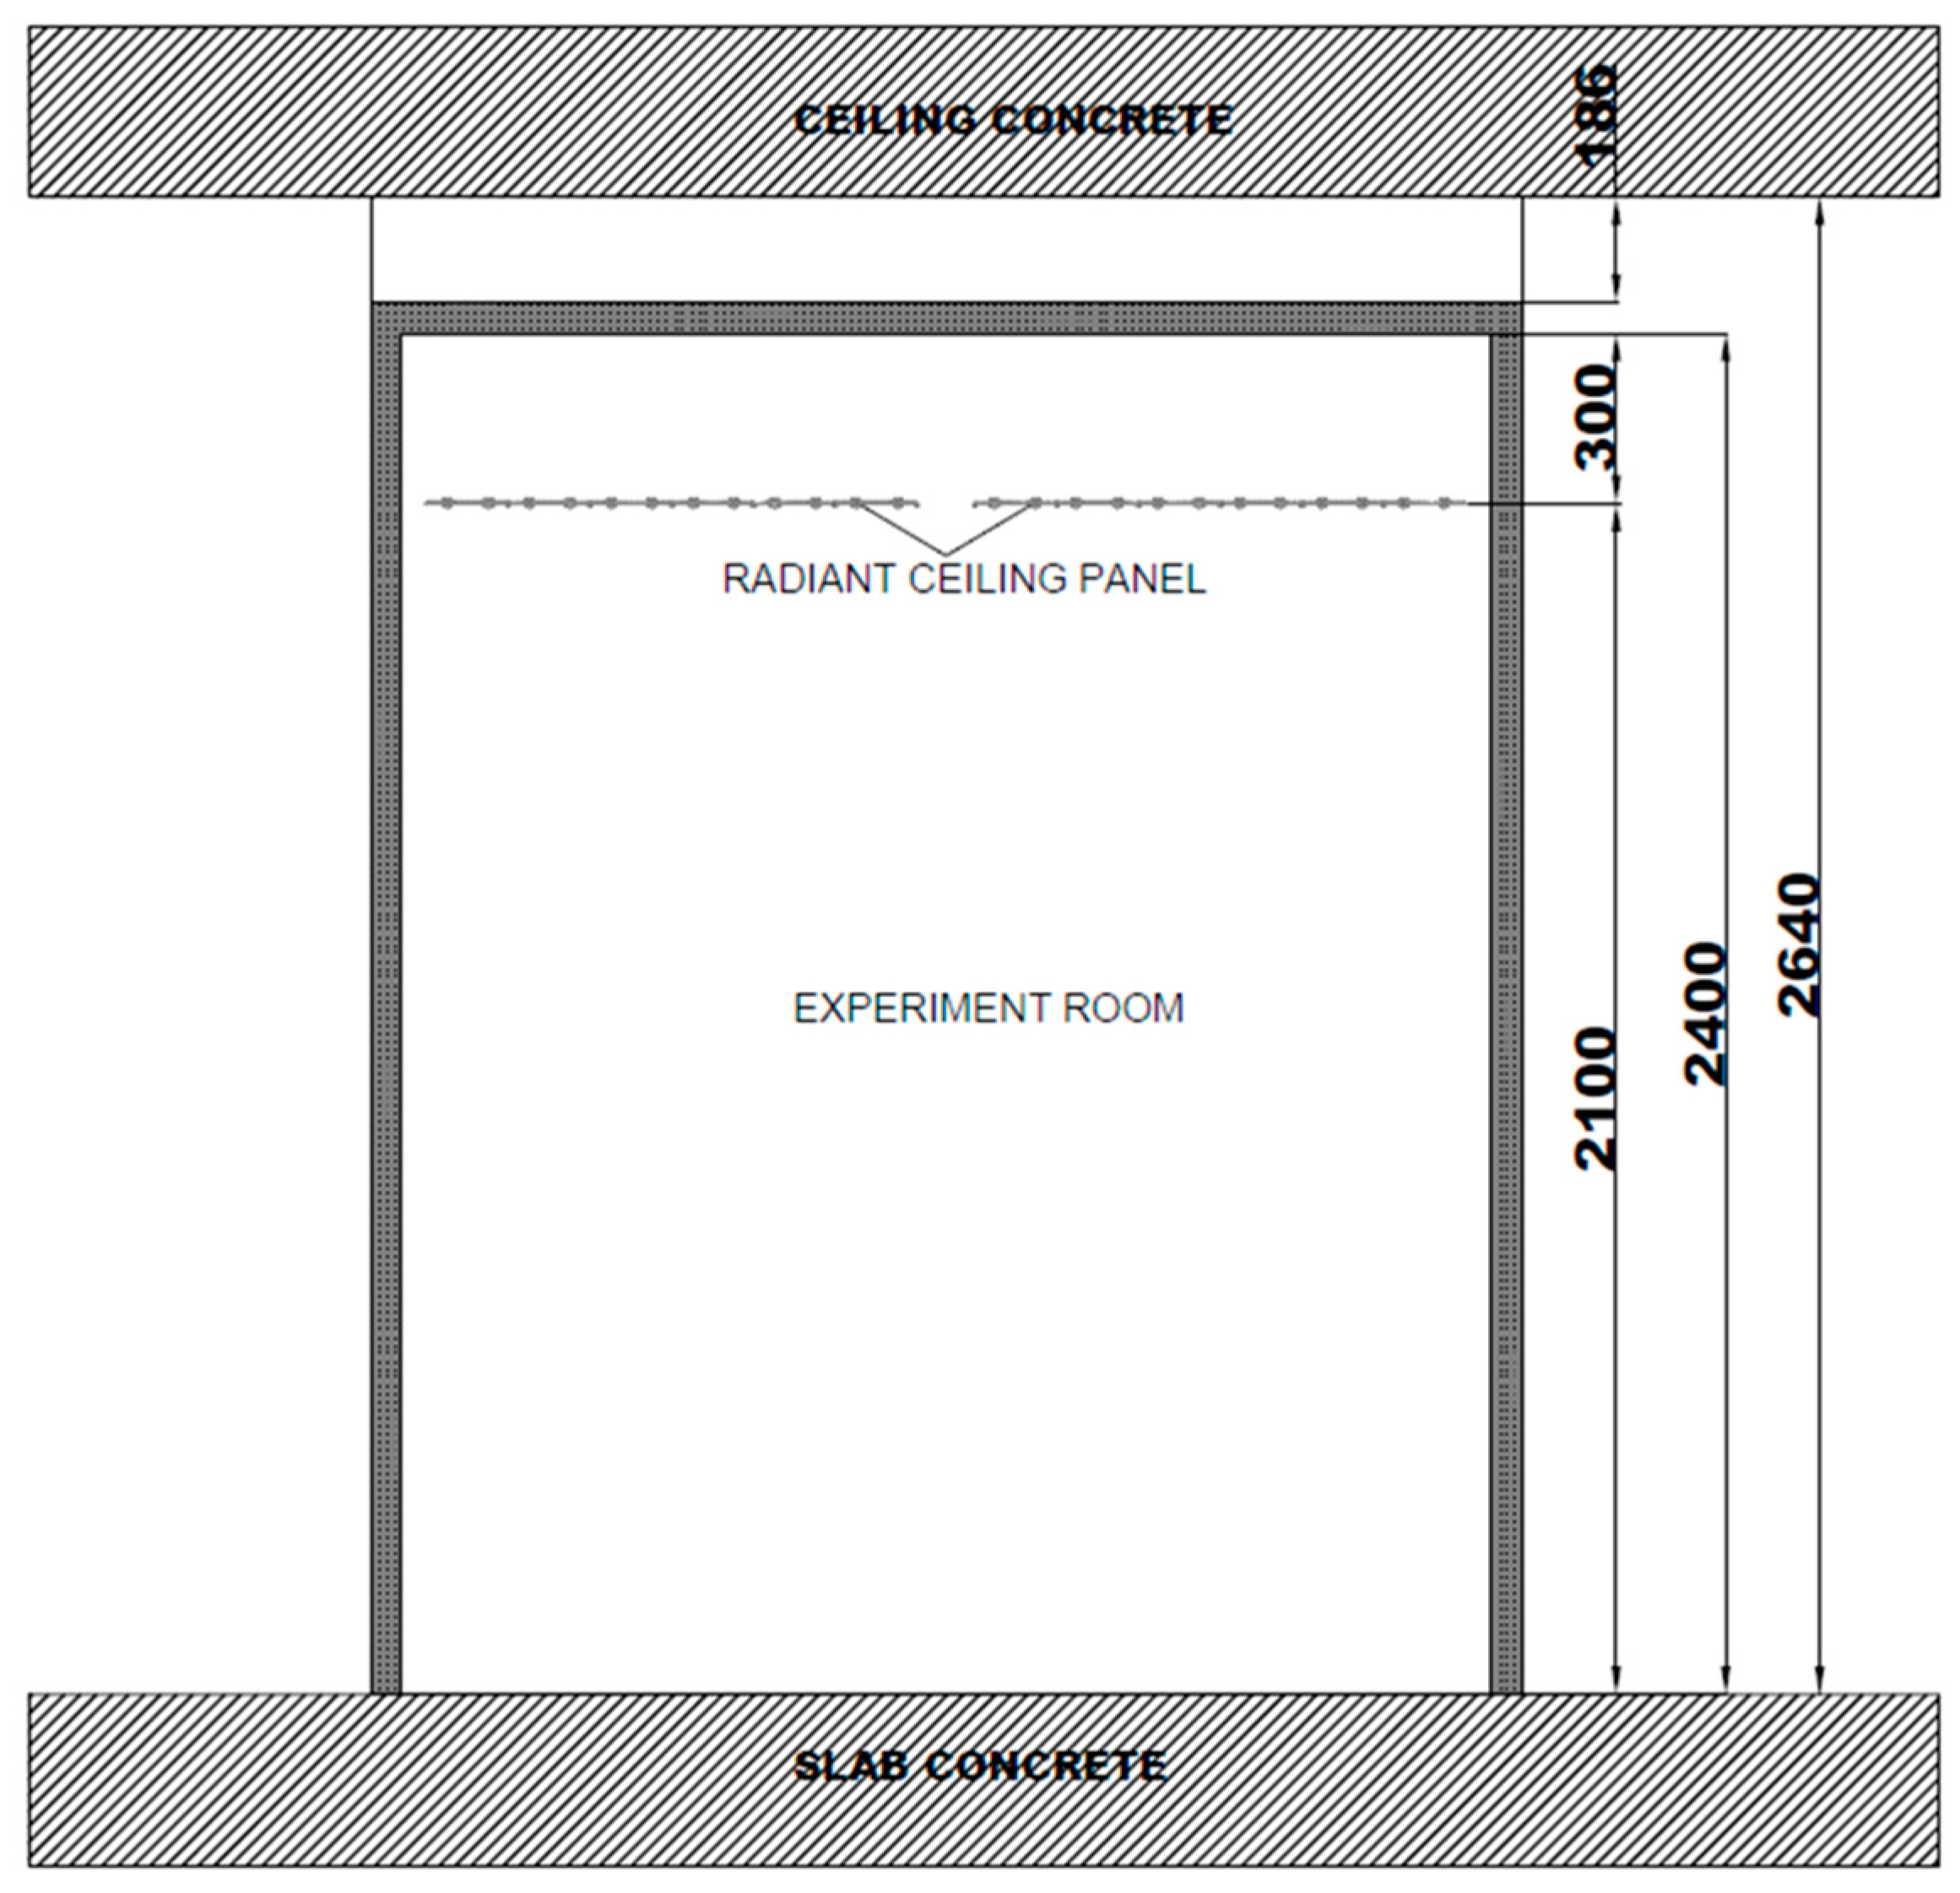
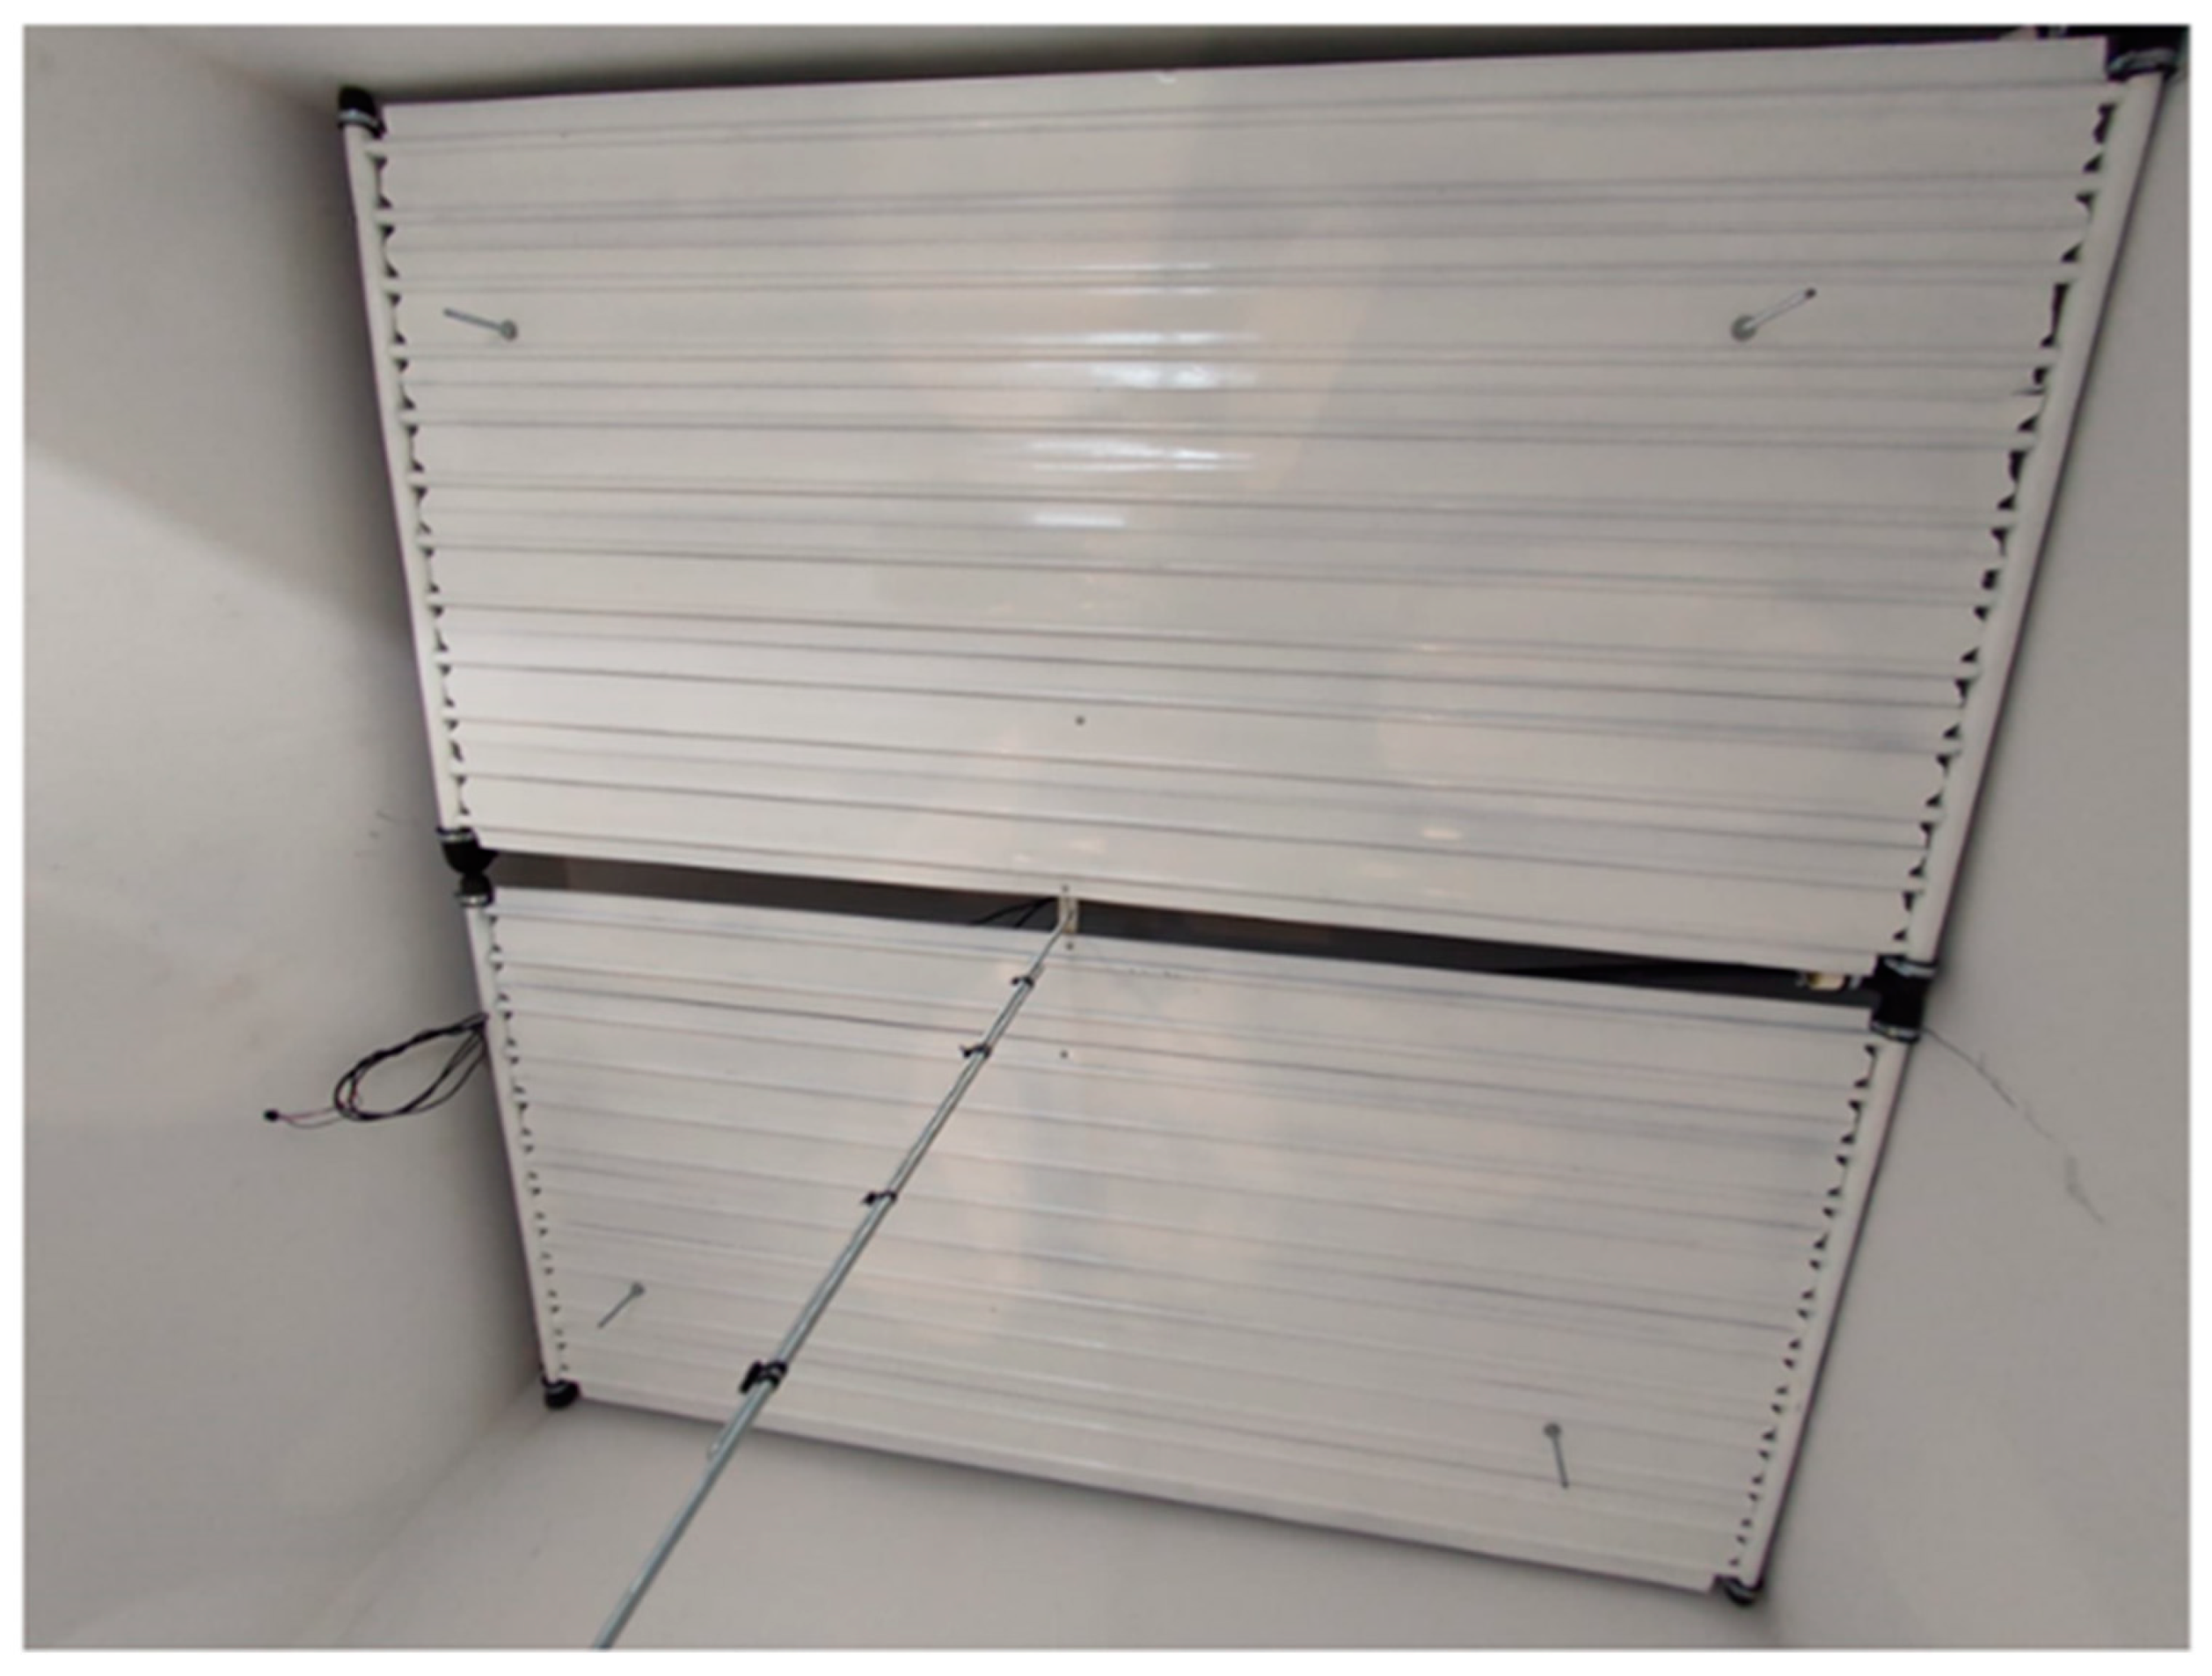
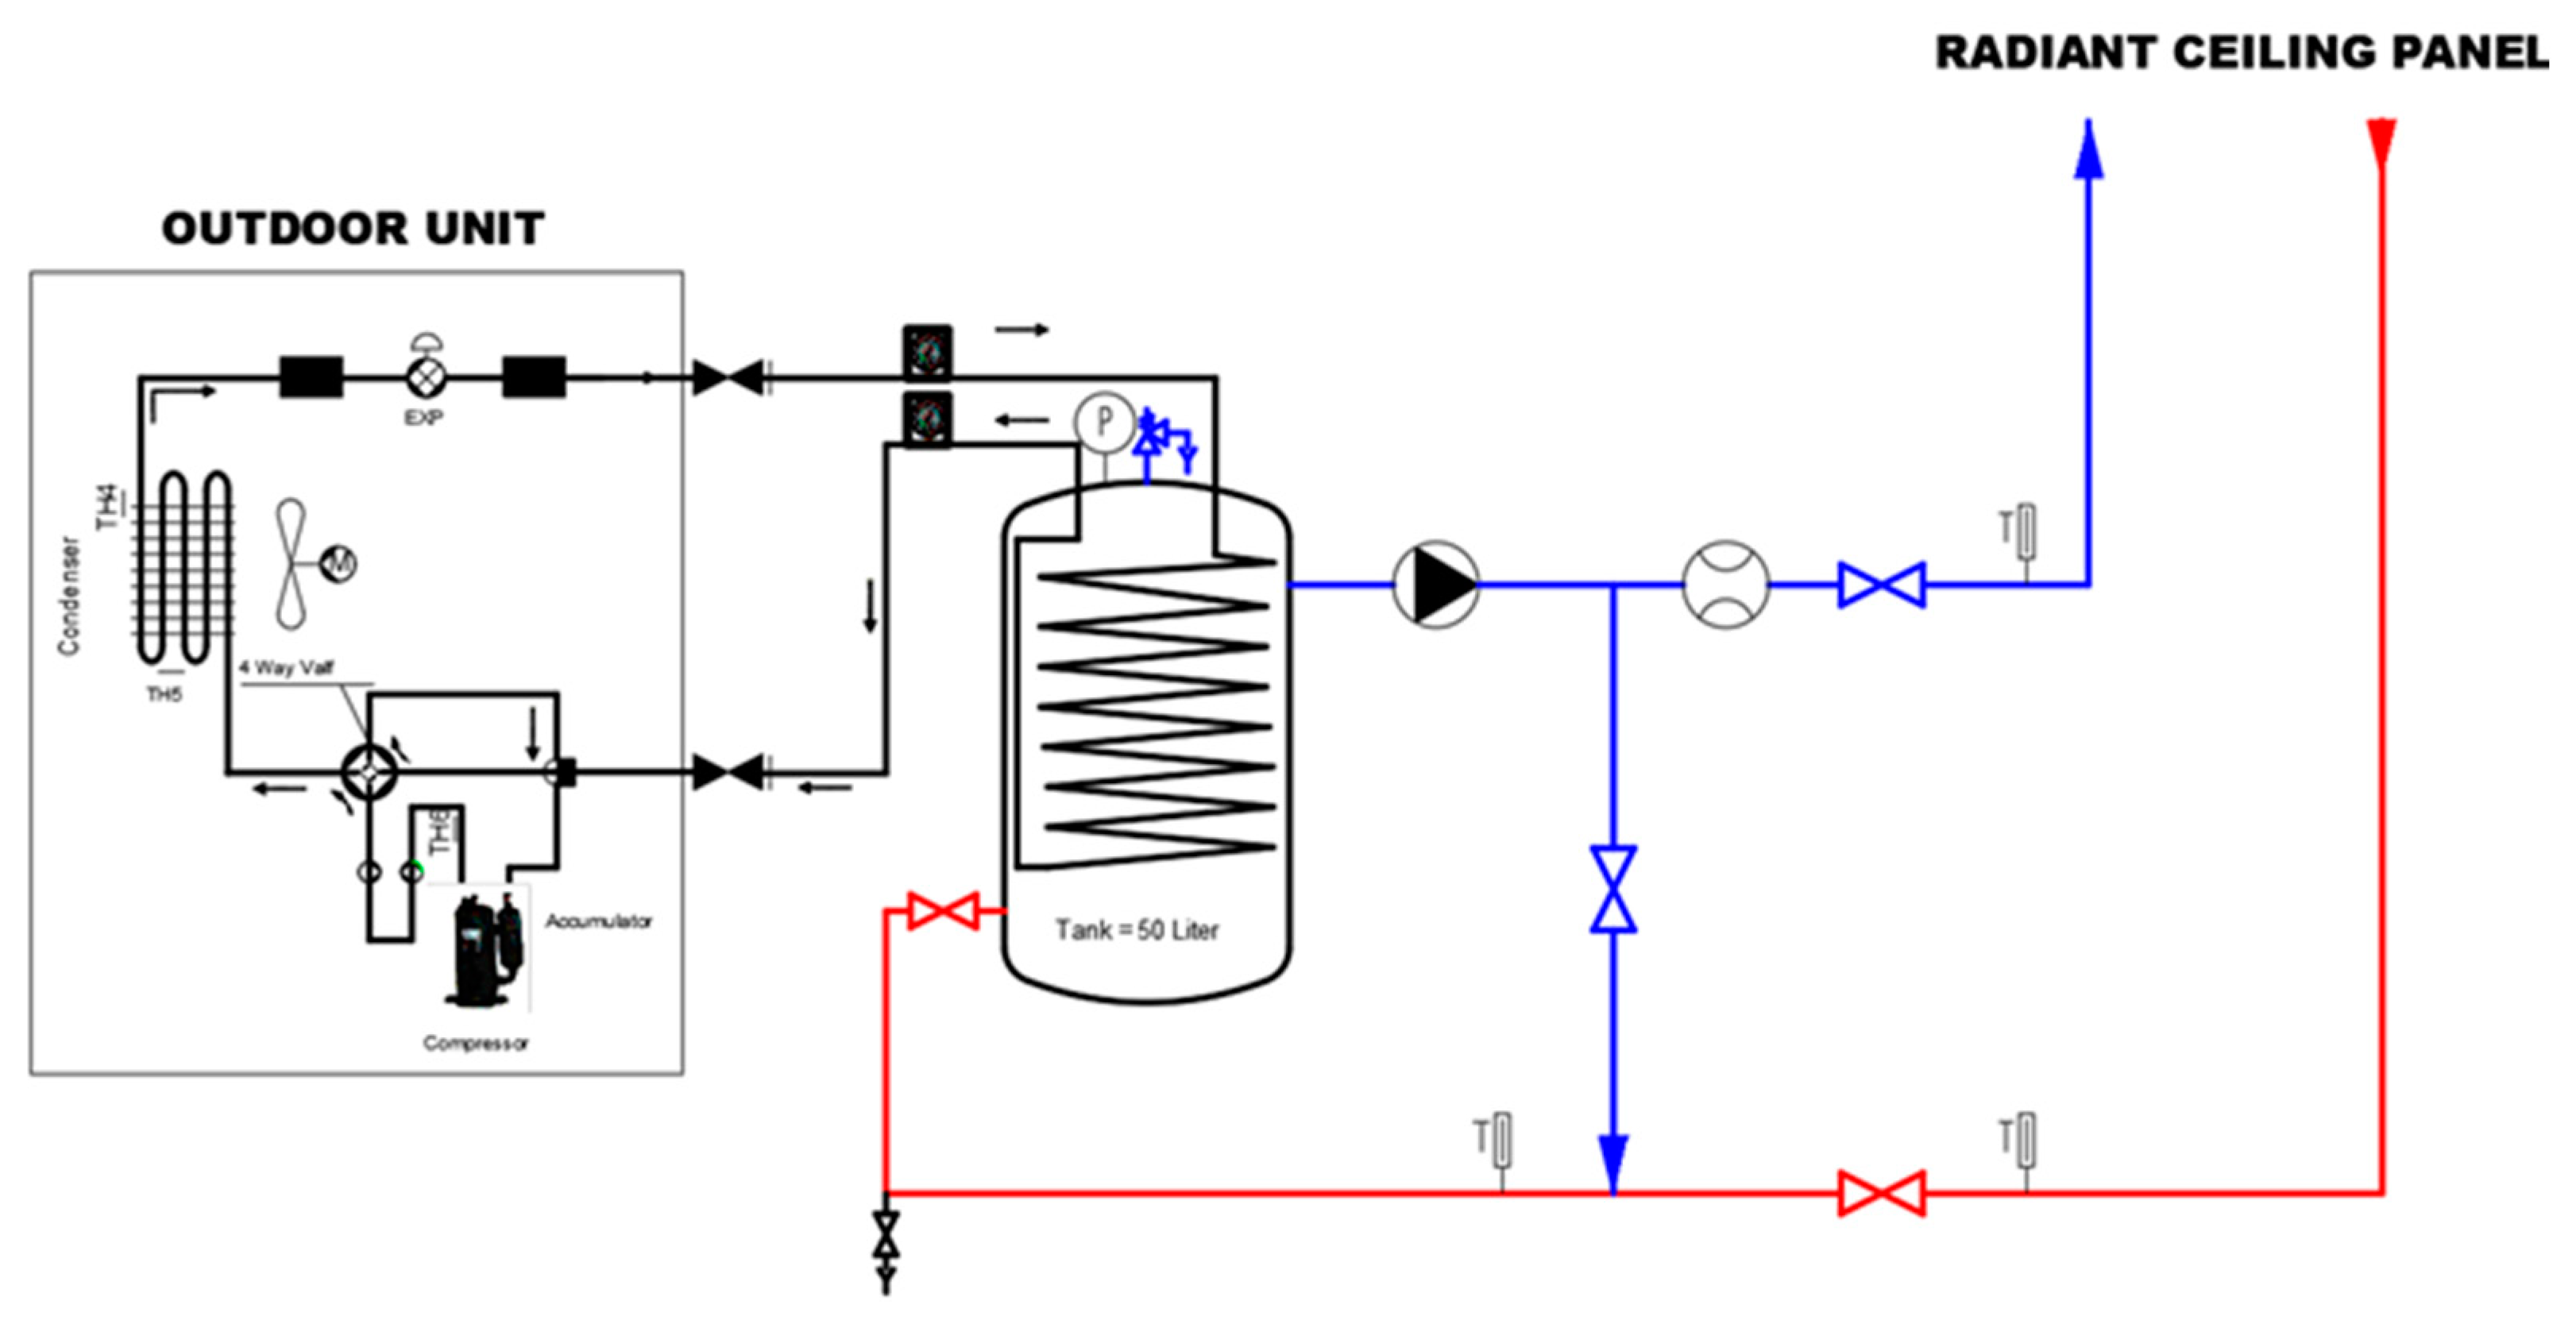
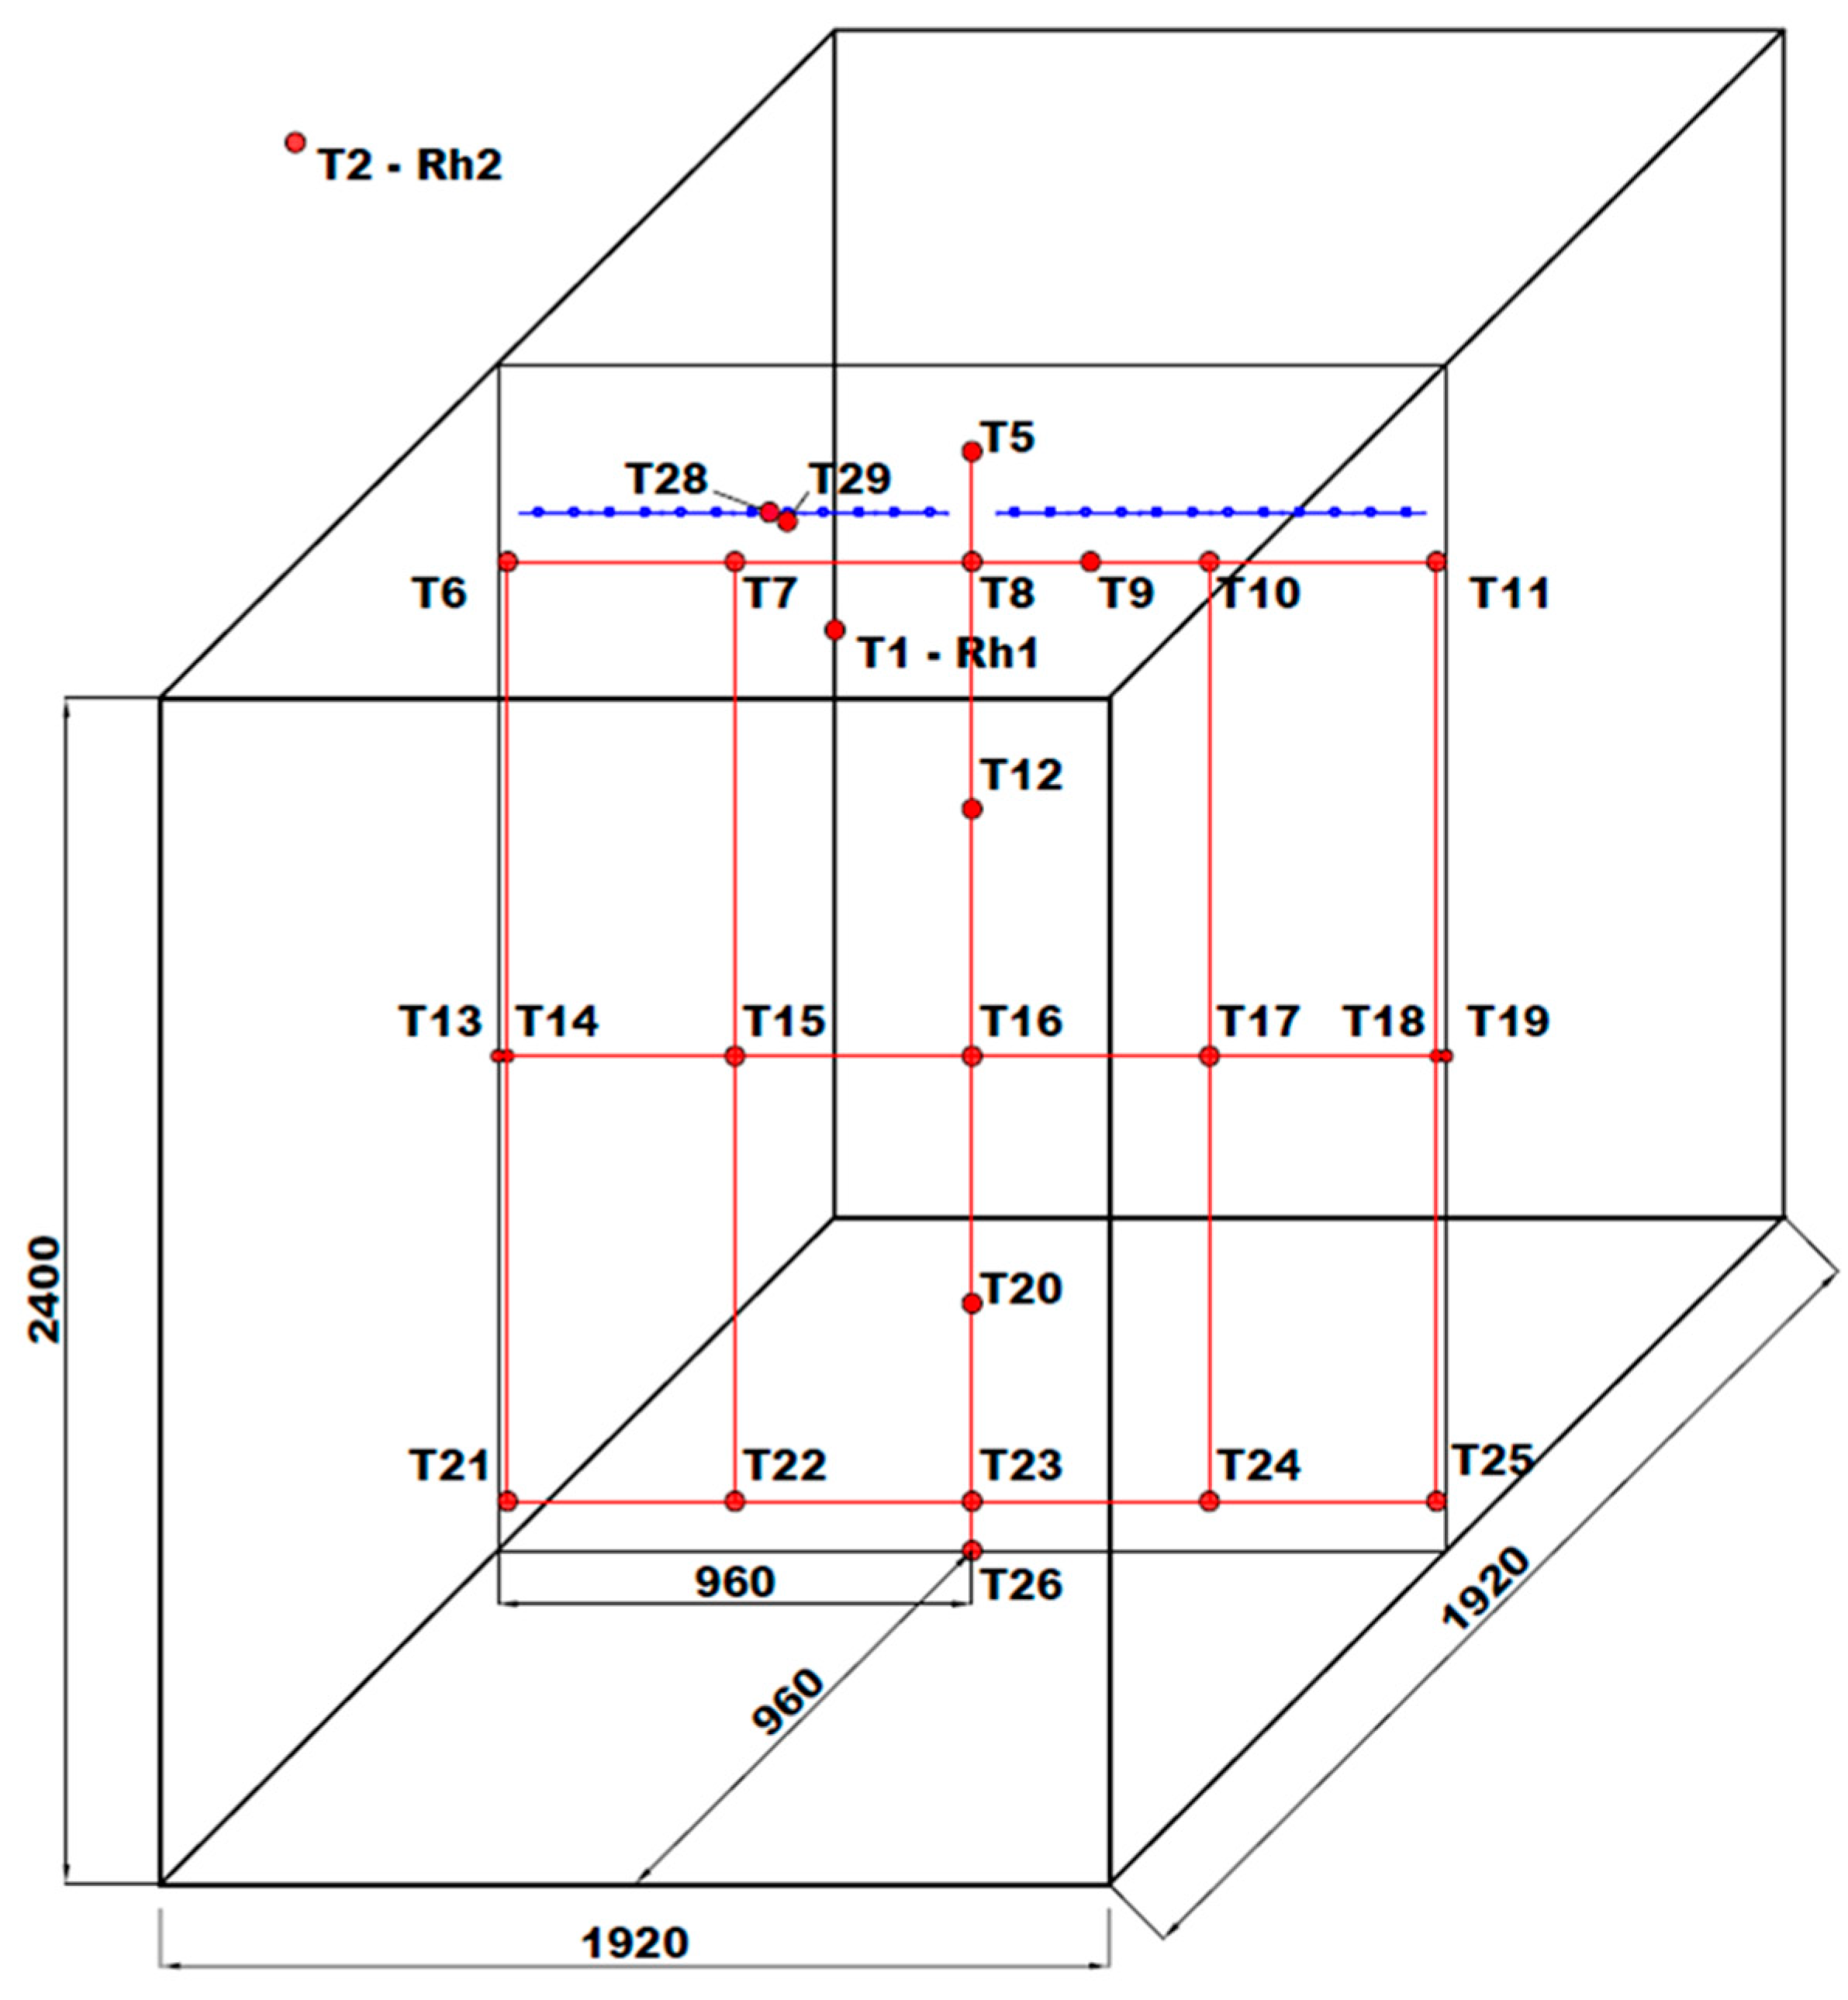
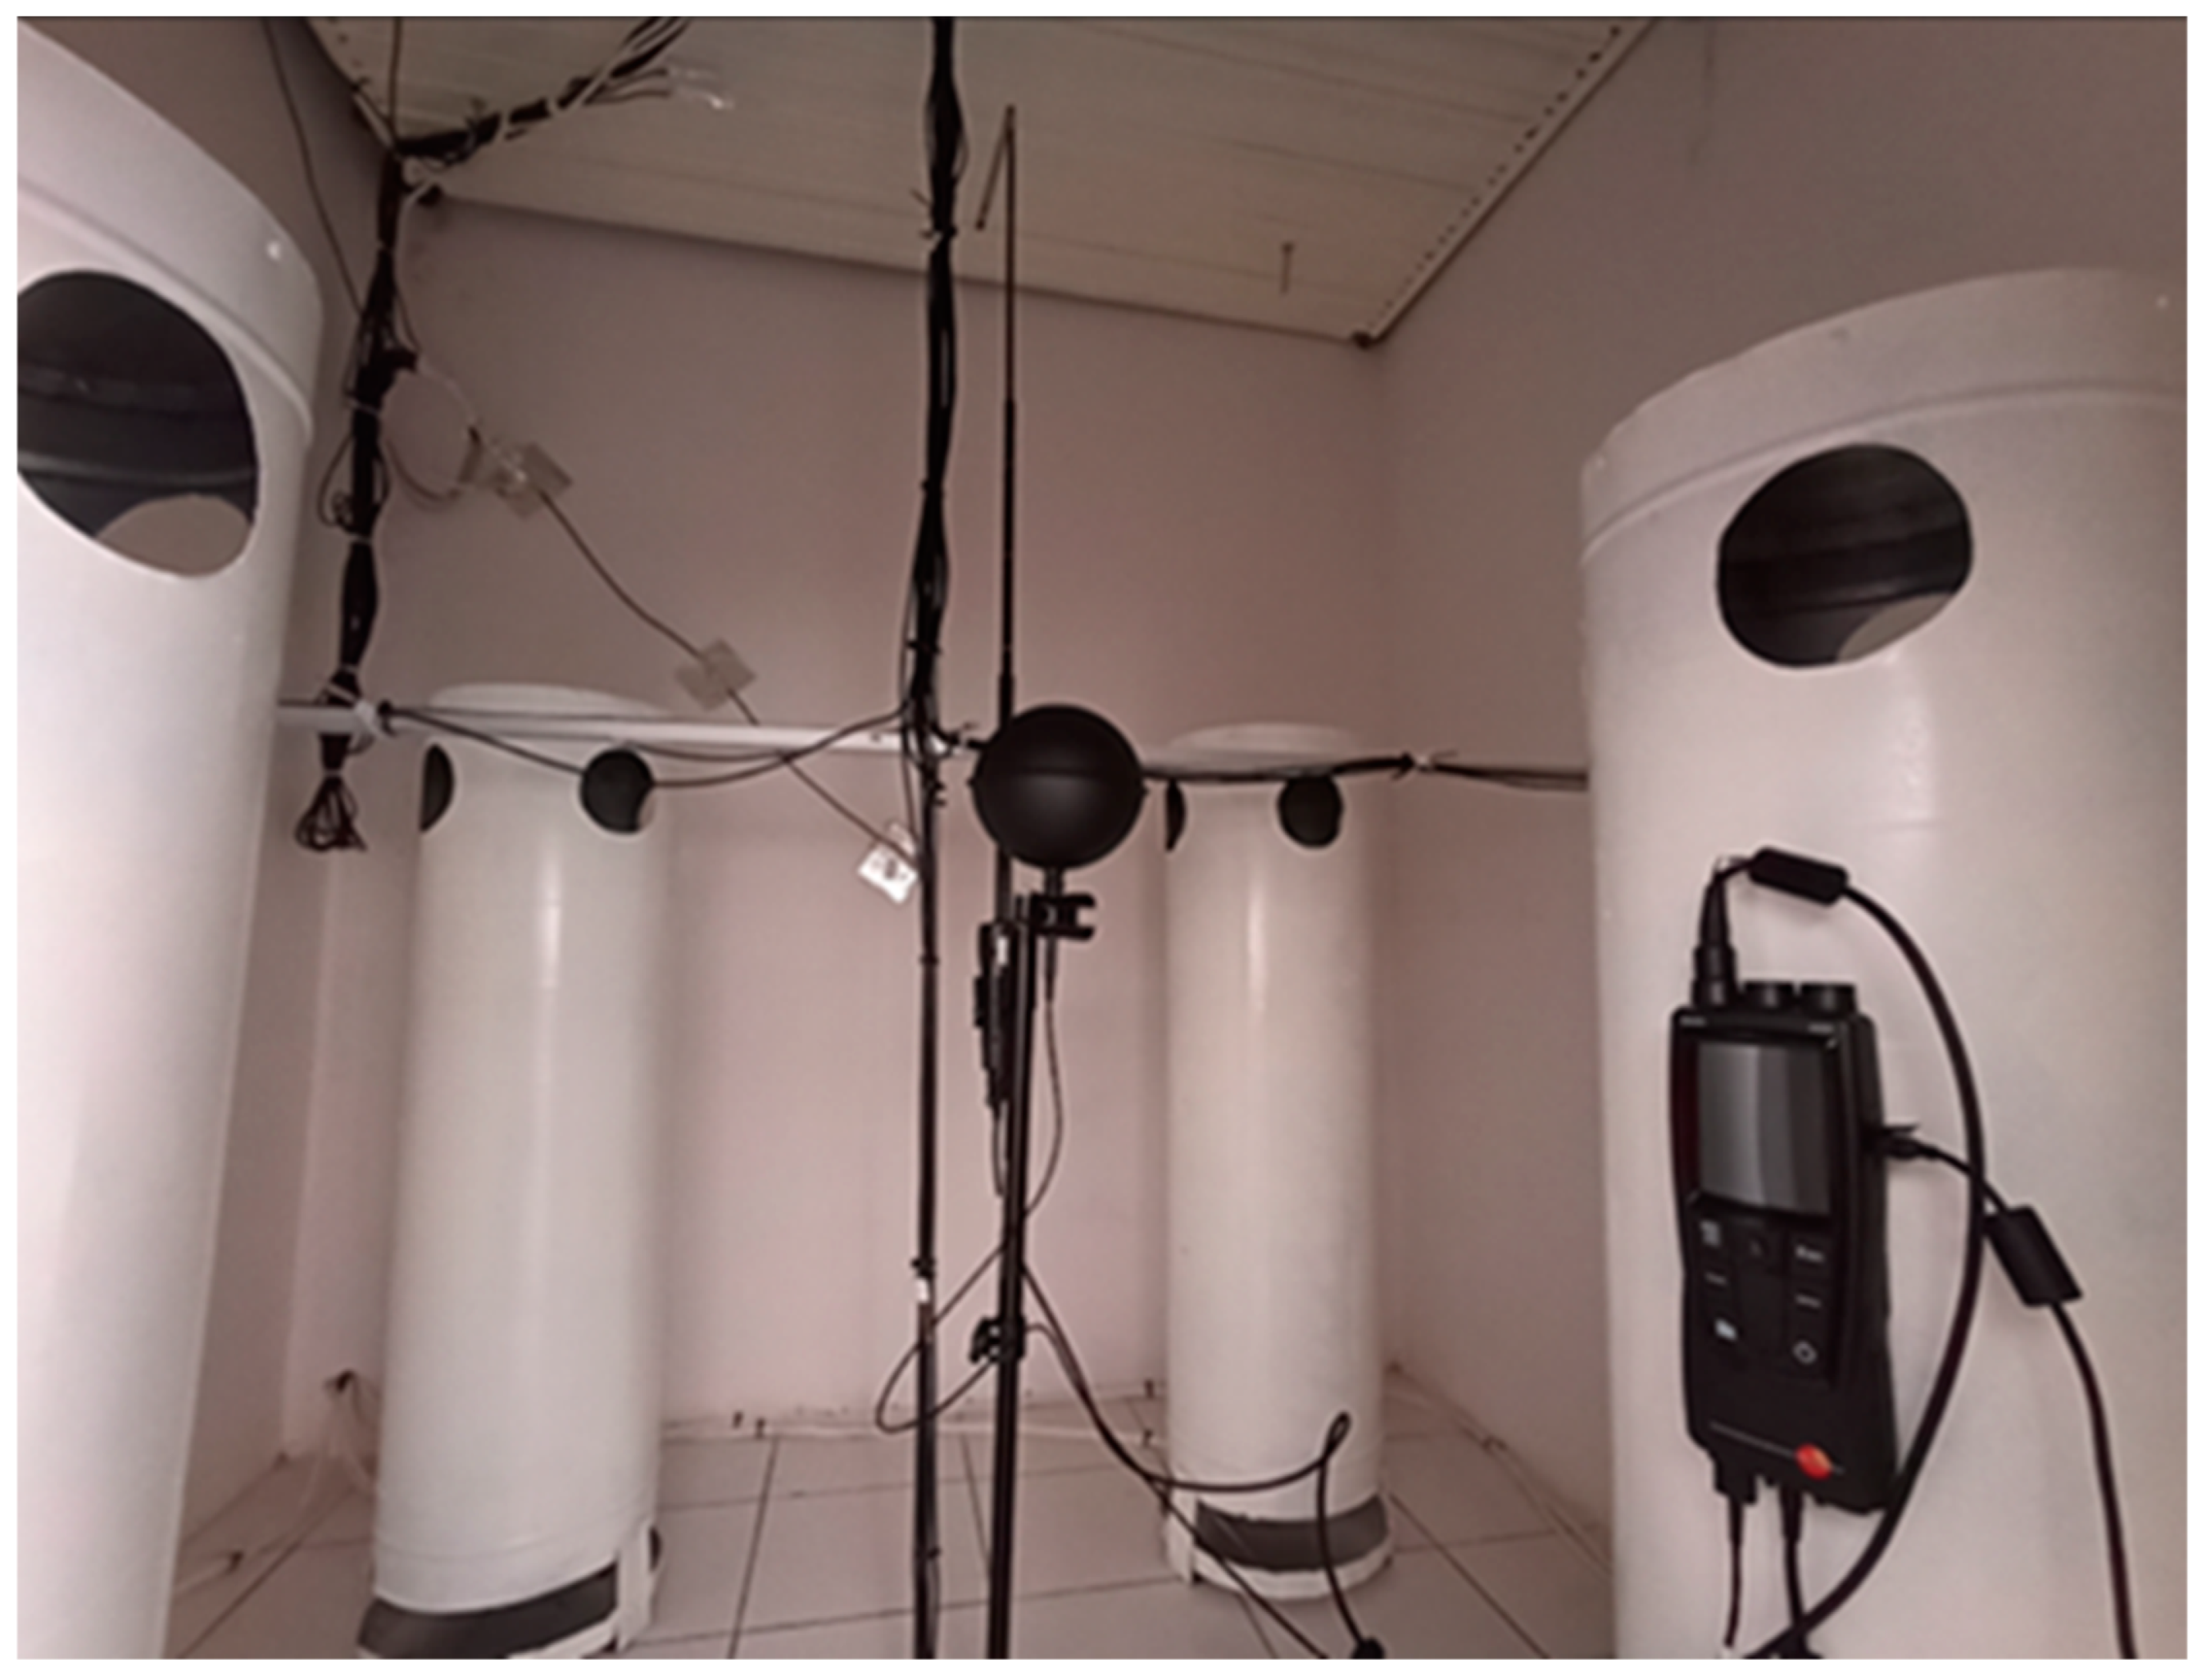
2.1. Experimental Setup

The experimental studies were carried out in a test room, which was designed with a width of 1920 mm, a length of 1920 mm and a height of 2400 mm. The walls and ceiling of the test chamber were made of insulating materials consisting of 30 mm mineral wool between 12 mm gypsum board layers. The thermal conductivity of the mineral wool was 0.047 W/(mK). The floor was covered with a ceramic material. All surfaces and the cold ceiling panels were painted white, taking into account the emissivity coefficient for radiation effects. The layout of the test chamber is shown in Figure 1. A sectional view of the test chamber is shown in Figure 2. The door of the chamber is identical to the wall elements and was surrounded by sponge insulation material during the tests to ensure airtightness.
An aluminum solar collector panel, manufactured in accordance with BS EN 12975-2:2006 [16] standards, was used as the ceiling cooling panel in the experimental setup. The collector water volume was 3.6 L, the maximum operating pressure was 9 bar, and the operating temperature range was 30–200 °C. The entire surface of the collector was painted with white oil-based paint. The collector dimensions are shown in Figure 3, and the internal diameter of the manifold and headers was 24 mm. The collector panel contained 12 finned tubes with an internal diameter of 13.6 mm. Two solar collector panels were mounted to completely cover the ceiling of the test room. The panels were mounted 2100 mm above the floor and 300 mm below the ceiling of the test room. The arrangement of the collector panels in the test room is shown in Figure 4.
A copper pipe coil was installed in a tank, as shown in Figure 5, and acted as a heat exchanger to provide chilled water to the system from the refrigerant gas. The chilled water produced in this way was circulated in the ceiling cooling panels by a three-speed wet rotor circulating pump. Figure 5 shows the coil, the tank and the circulation pump. The pump has a step adjustment that allows the water flow to be set to three different values: 0.54 m3/h, 0.93 m3/h and 1.10 m3/h.

2.2. The Measurement Apparatus

During the experiments, the analog data measured by the sensors were digitized and recorded in a data logger system. The test room temperature was measured using 28 thermocouples and a humidity sensor. The ambient temperature of the test room was measured with one thermocouple and one humidity sensor. The flow rate of the cold ceiling panels was measured with a total of two flow sensors, one for each panel. The calibration of all the sensors used in the system was checked, and each was found to have the accuracy values given below. The SHT3X-DIS sensor is a digital temperature and humidity sensor. It offers a sensitivity of ±0.3 °C for temperature measurements and ±3% RH for humidity measurements. Since temperature differences were determined and presented, it is thought that the measurement sensitivity did not affect the results. In addition, the results obtained were compared with the results of the amount of heat radiated to the space from the heat source and were found to be in full agreement. YF-B6 sensors were used as flow meters for water flow to the ceiling cooling panels. The sensors use the Hall effect principle to measure water flow. The accuracy of the sensors within the water flow range of the experiment was ±3%. The cold water in the cooling system was circulated by a three-stage wet rotor circulating pump. The arrangement of the temperature sensors is shown in Figure 6 and Figure 7. The arrangement of the temperature sensors and the heat simulator in the test room is shown in Figure 8.

2.3. Determination of Experimental Parameters

According to the ASHRAE Comfort Zone Chart, room temperature values between 23 and 27 °C are defined as the comfort zone in summer operation, as shown in Figure 9. The experiments were carried out with water temperatures above the indoor dew point temperature and with different water flow temperatures to avoid condensation on the cold ceiling panel.
In order to prevent condensation on the cold ceiling panel during the experiments, the cooling system should be operated with water at a temperature above the dew point. As can be seen in Figure 9, the condensation temperature value in the operating temperature range was 13 °C and below. Research and manufacturer recommendations say to operate the system at least 1 °C above the dew point temperature [17]. Increasing the water temperature more than necessary will lead to a decrease in the thermal capacity of the cold ceiling panel. According to different space temperatures and relative humidity values (at sea level), the water temperature value was determined to be a minimum of 14 °C and a maximum of 18 °C.
Figure 9. ASHRAE summer and winter comfort zone diagram [18].
Applsci 14 05908 g009
The water temperature values for the experiment were selected as follows, and the flow and return water temperature values measured during the experimental period are shown in Table 1. The experiments were carried out by setting three different water flow rates using the control valves and pump speed adjustment in the experimental setup. The pump flow values according to the measurements made during the experiments are summarized in Table 2.
Four heat simulators were installed in the test room in accordance with the size and layout details specified in the international standards. In each simulator, three incandescent lamps of 3 different heights and with heat outputs of 70 W + 55 W + 70 W were installed. The amounts of heat applied during the experimental period with the heat simulator are shown in Table 3. The layout of the heat simulator is shown in Figure 10.

3. Calculation Method

The total amount of heat transfer ( q t ), the convective heat transfer amount from the panel surface ( q c ), the radiation heat transfer amount ( q r ) and the heat transfer amount from the test space to the outside ( q l s ) are expressed below. By performing calculations per unit surface area, we obtained Equation (1).
q t = q c + q r q l s
The heat energy supplied to the experimental chamber by the circulating water through the cold ceiling panel can be expressed using Equations (2) and (3).
q t = m w c p T w , r e t u r n T w , s u p p l y A q l s
q t = h t T o p T s
The operative temperature ( T o p ) can be calculated using Equation (4).
T o p = h c T a +   h r   T m r h c + h r
According to ISO Standard 7730:2005 [18] and ASHRAE Standard 55:2004 [19], when the air velocity within the space is below the value of 0.2 m/s and the difference between the radiant temperature and the room temperature is less than 4 °C, the operative temperature ( T o p ) can also be calculated using Equation (5).
T o p     T a + T m r 2
The heat energy transferred from the cold ceiling panel to the experimental chamber through radiation can be expressed using Equations (6) and (7).
q r =   ε σ T A U S T + 273 4 T s + 273 4
q r = h r T A U S T T s
The radiative heat transfer coefficient is calculated, as shown below, through the simultaneous solution of both equations.
h r = ε σ T A U S T + 273 4 T s + 273 4 T A U S T T s
Heat transfer resulting from convection according to Newton’s cooling law is calculated using Equation (9) below.
q c = h c T a T s
The convective heat transfer coefficient ( h c ) is calculated using Equation (10).
h c = q c T a T s
The net heat flux from the cold ceiling panel to the space can be expressed using Equations (11) and (12).
q t = q c + q r
The total heat transfer coefficient ( h t ) is calculated using Equation (12).
h t T o p T s = h r T A U S T T s + h c T a T s
The heat flow from the experimental chamber to the outside can be expressed using Equation (13).
q l s = U A d T d T i
The total heat transfer coefficient of the external walls and the total heat transfer coefficient of the floor were calculated according to Table 4 and Table 5 and were Uwall = 1.092 W/(m2K) and Ufloor = 3.626 W/(m2K).
According to the BS EN 14240:2004 standard [20], the analysis of the data for the cooling capacity of the cold ceiling panel should involve drawing a graph showing the change in the cooling water flow rate and the cooling water temperature increase under steady-state conditions, and the cooling capacity is expressed as a function of the temperature difference between the reference room temperature and the average cooling water temperature.
The specific cooling capacity of the ceiling can be expressed using Equations (14) and (15).
P = c p m w T w , r e t u r n T w , s u p p l y
P a = P A
The specific cooling capacity is then plotted as a function of the temperature difference between the globe temperature (reference room temperature) and the mean cooling water temperature. A curve of best fit is then drawn through the plotted points. The curve should follow the form expressed using Equation (16).
P a = k Δ θ n

4. Uncertainty Analysis

The experimental results’ accuracy hinges on both measurement devices and errors stemming from the experimental setup. Various approaches exist for assessing error ratios associated with parameters derived from experimental data. One such approach is the uncertainty analysis method pioneered by Kline and McClintock [21]. In our study, we employed a particularly sensitive version of this method for error analysis. As a result of the calculations, it was found that the maximum uncertainty of the convection coefficient was 6%.

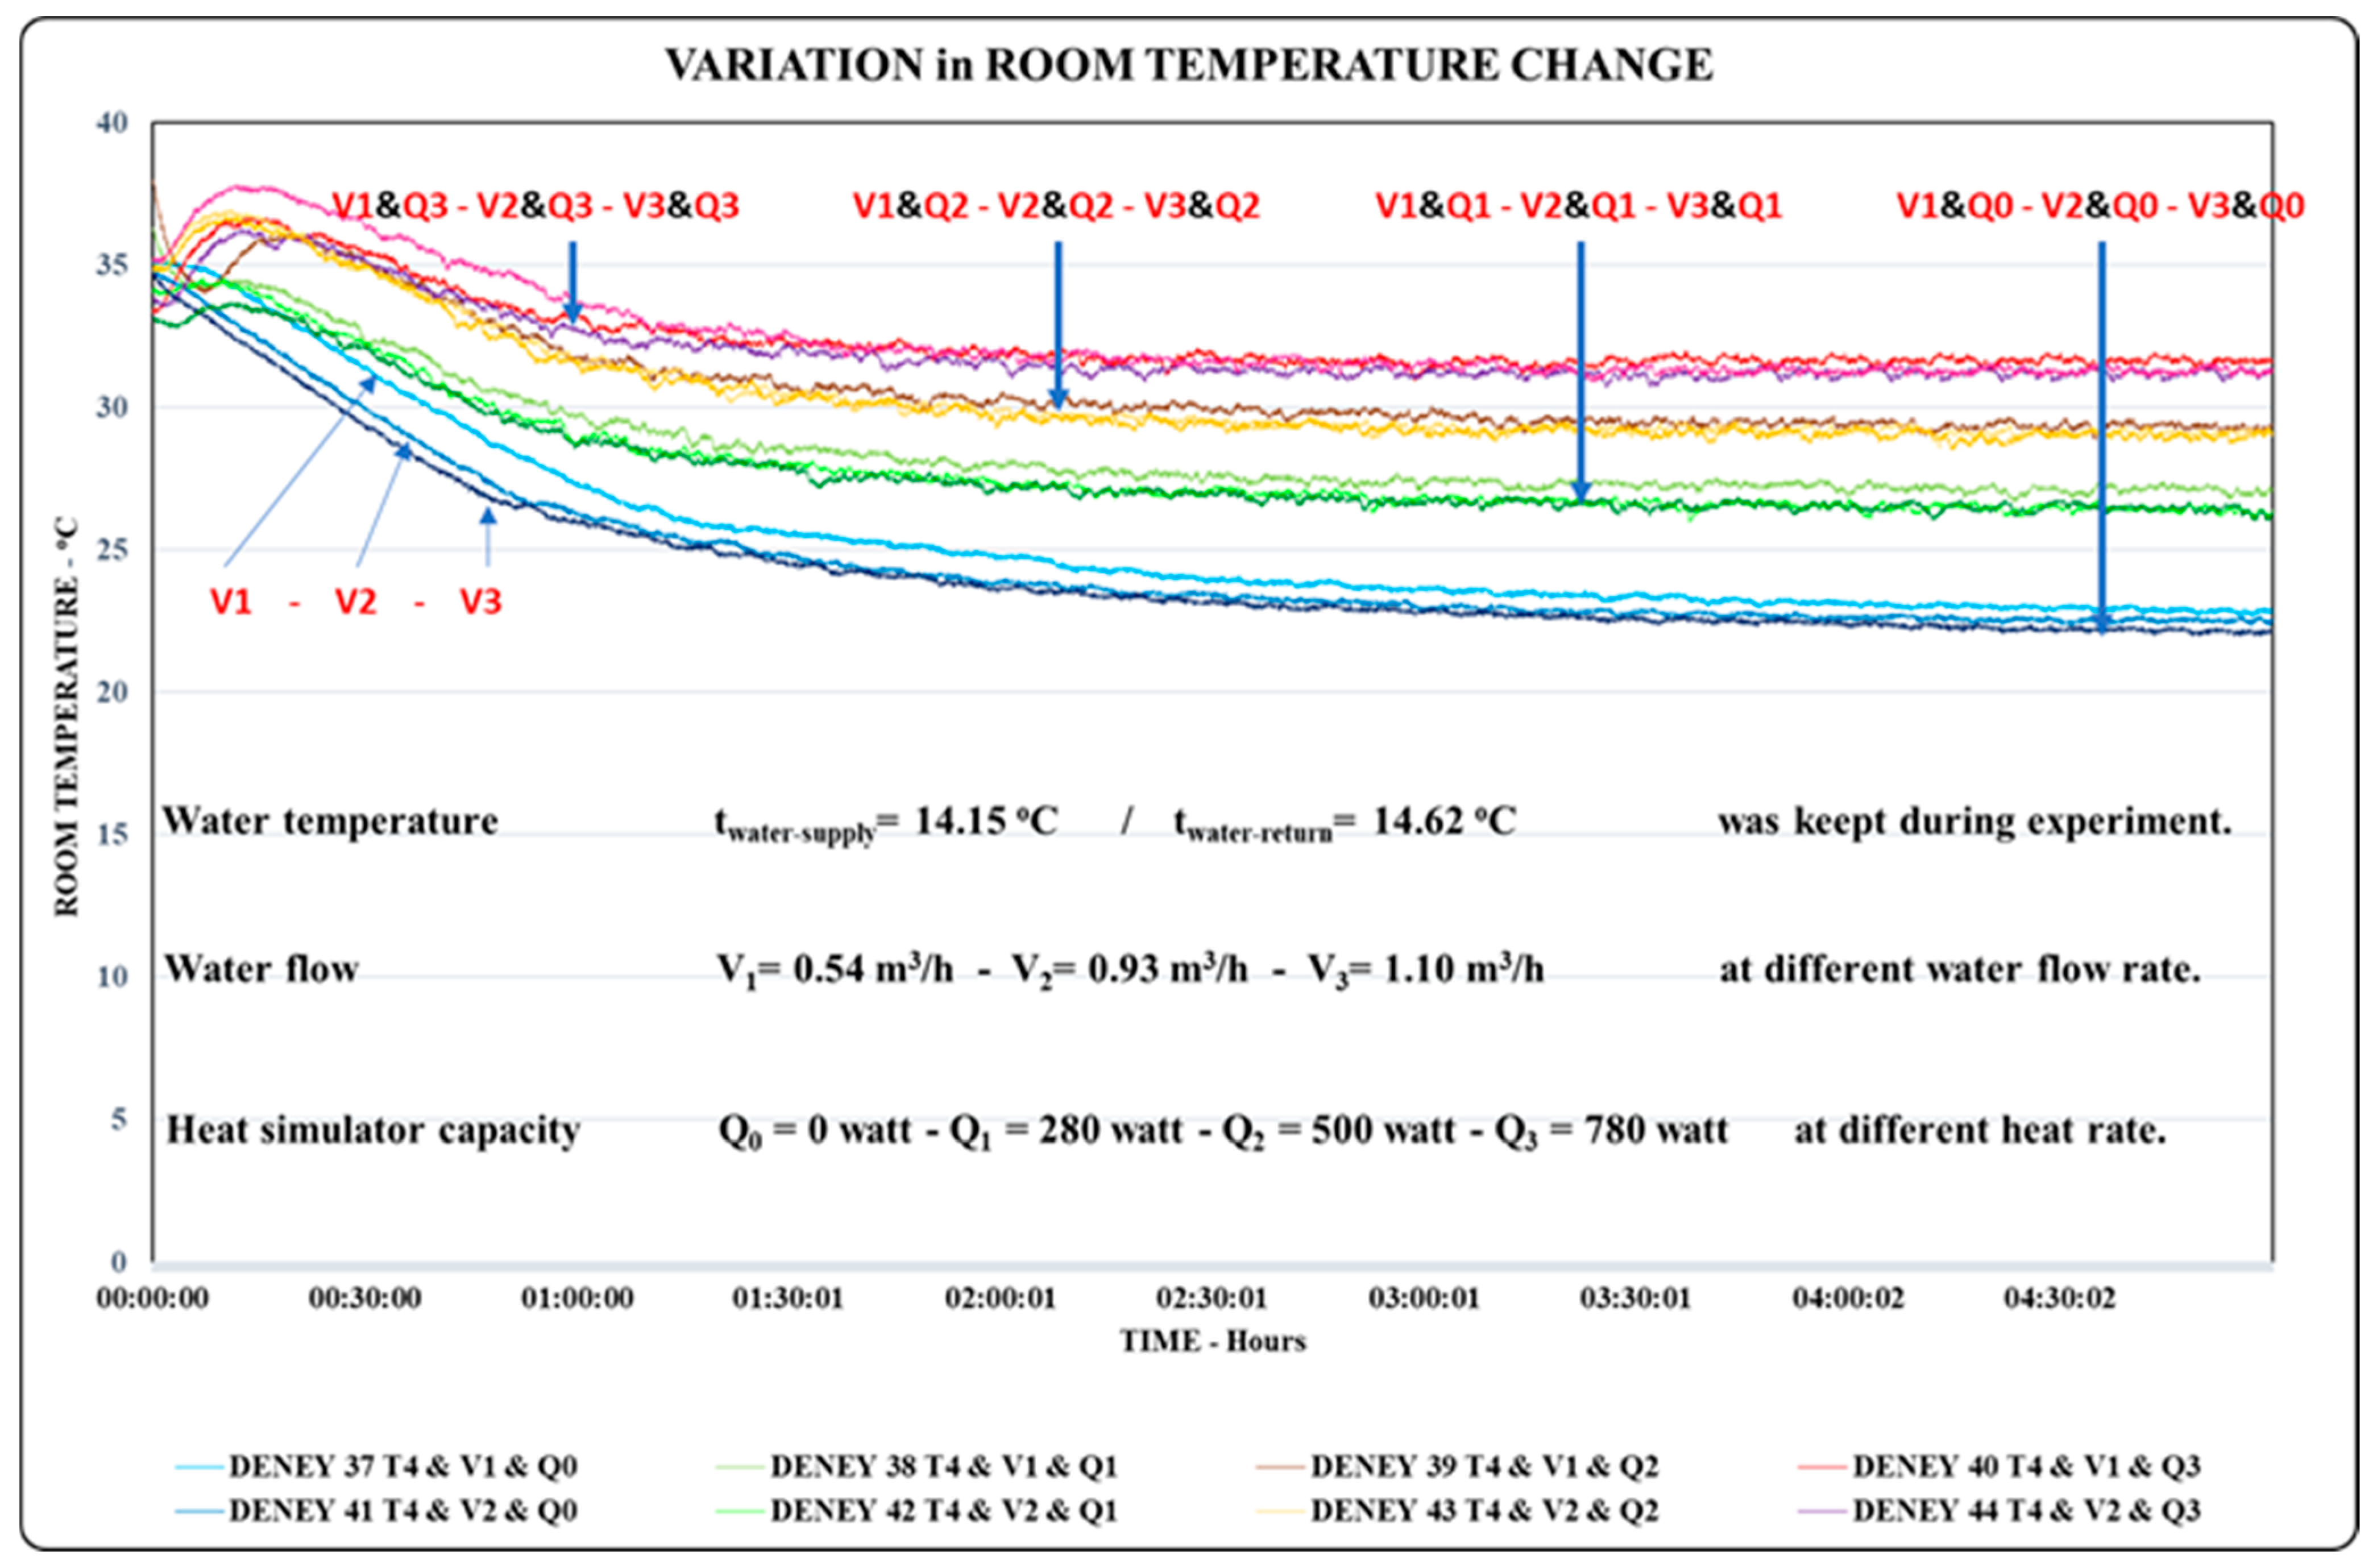
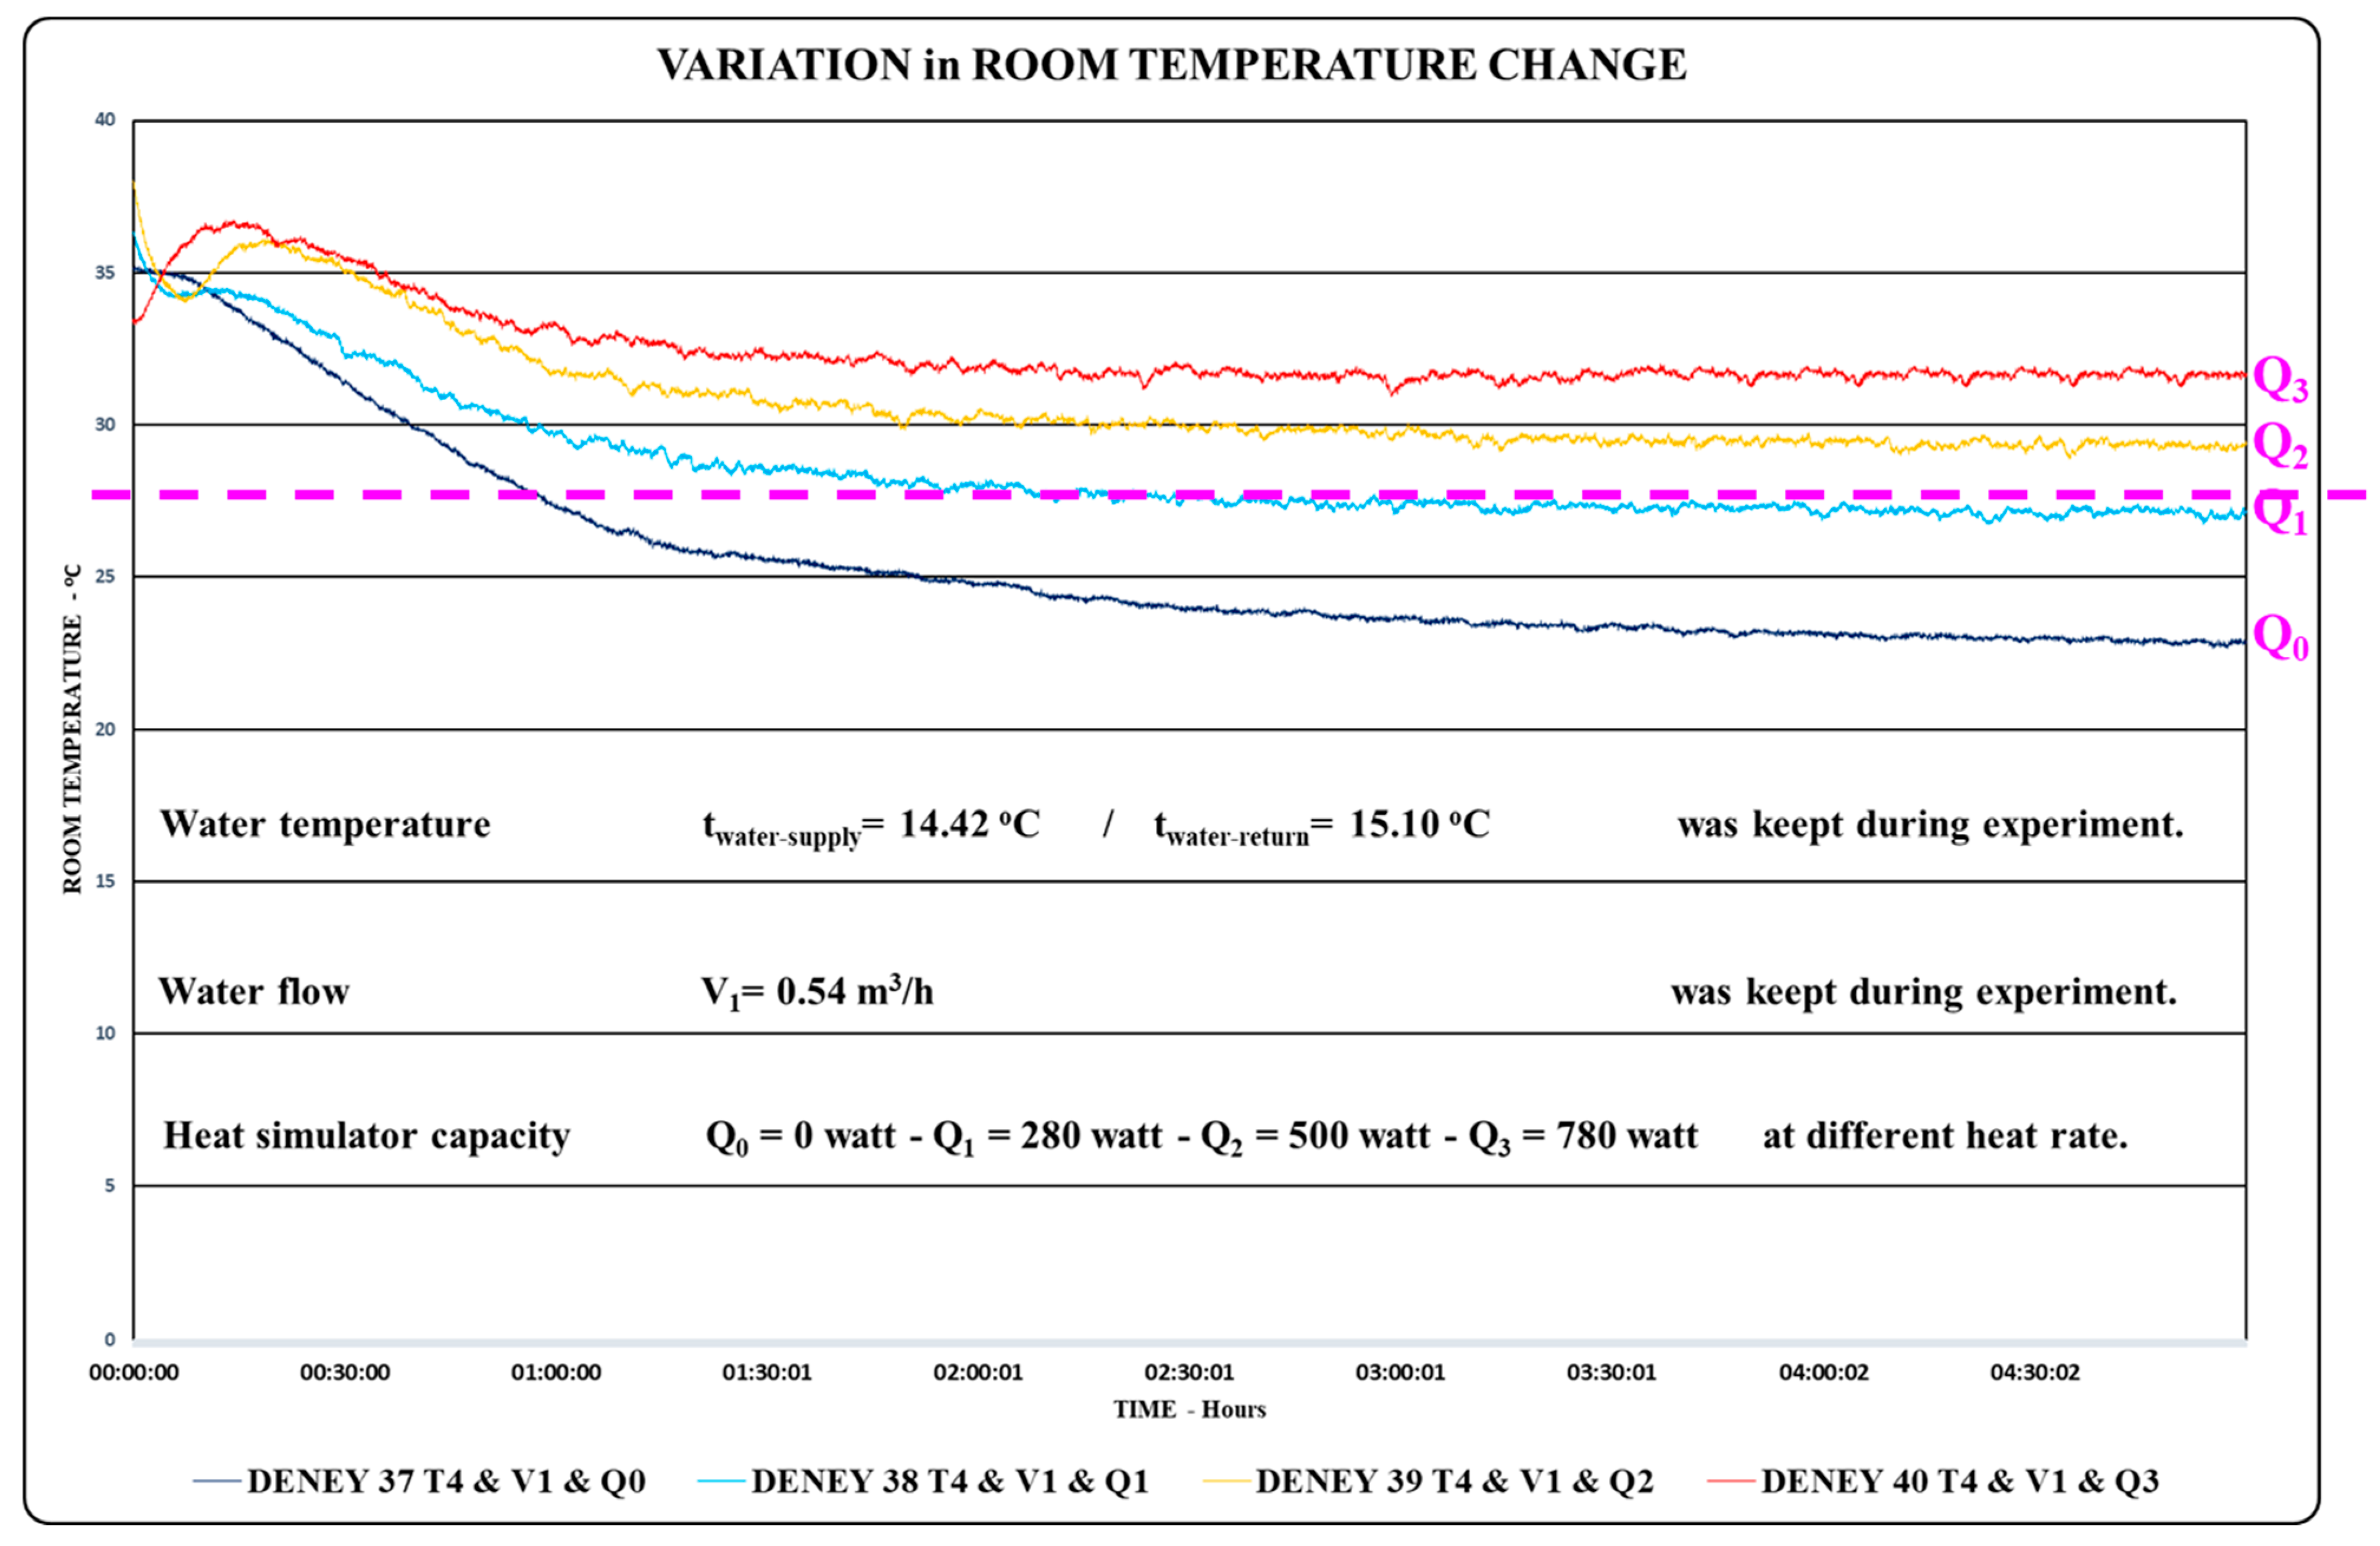
5. Results and Discussion

According to the data, which are explained in the section on the Experimental Methodology, the experiments were carried out with 48 different variations at four different water temperatures, three different water flow rates and four different heat sources. To verify the experiments, experiment 33 was repeated on three different days under the same conditions, and the same results were obtained. For when the water flow temperature was kept constant at 14.15 °C, the water flow rate was varied among 0.54 m3/h, 0.93 m3/h and 1.10 m3/h and the heat supplied to the room was changed to 0 W, 280 W, 500 W and 780 W, the observed change in room temperature is shown in Figure 11.
Figure 11 shows the relationship between water flow temperature, water flow rate, heat rate and room temperature. As can be seen, as the water flow rate increases, the room temperature decreases rapidly. It has been observed that for the same heat rate and water flow temperatures, the room temperature decreases to lower temperatures as the water flow rate increases. In the experimental studies, it was observed that the relative humidity in the room varied between 35 and 50% Rh, and no condensation occurred during the experiments.
In Figure 11, it is seen that in all experiments where the chilled ceiling room system was used, the room temperature decreased over time, showing the same trend. It was concluded that with high heat rates, the room temperature increases for the first 30 min and then decreases and enters a stable regime, while with low heat rates, the room temperature constantly decreases. It is understood from Figure 11 that the effect of the increase in water flow rate on the decrease in room temperature is more effective at low heat rates.
In this study, the heat transfer rate and convection coefficient values for experiments providing the desired environmental conditions were calculated, and their comparison with the values reported in the literature [8] are shown in Table 6.
According to the results of the experiments, there is an increase in cooling capacity when the water flow rate is increased from 0.54 m3/h to 1.10 m3/h; when the heat load in the room is increased from 0 W to 780 W, there is a decrease in cooling capacity; and when the water temperature is reduced from 18 °C to 14 °C, an increase in cooling capacity was observed. The experimental results indicated that with a heat rate of 280 Watts and the lowest supply water temperature of 14 °C, indoor comfort conditions were achieved with water flow rates of 0.93 m3/h and 1.10 m3/h, respectively.
When comparing the heat transfer coefficient values, it was found that the radiation and convection heat transfer coefficients were within the reference range reported in the literature. In the literature, values of 3.1–4.1 W/(m2K) have been specified for hc. The hc value obtained in this study is 4.02 W/(m2K) and is compatible with that in the literature. In the literature, values of 5.5 W/(m2K) have been specified for hr. The h r value obtained as a result of this study is 5.49 W/(m2K) and is compatible with that in the literature.
Figure 12 shows the temperature change in the test room when the water flow temperature is kept constant at 14.42 °C, the water flow rate is kept constant at 0.54 m3/h, and the heat supplied to the room is changed to Q1 = 0 W, Q2 = 280 W, Q3 = 500 W and Q4 = 780 W. The dashed horizontal line in Figure 12 represents the comfort limit shown in the ASHRAE Comfort Zone Graph. It is observed that in the cases of Q0 = 0 W and Q1 = 280 W heat rates, the room temperature can be kept below 27 °C, while in the cases of Q2 = 500 W and Q3 = 780 W heat rates, the room temperature exceeds 27 °C and does not meet the comfort conditions.
Non-linear regression equations were performed on the available data, obtaining the most optimum R2 value in the case of expansional regression, and the data were analyzed accordingly.
BS EN 14240:2004 standard [20] requires the specific cooling capacity of a chilled ceiling panel to be plotted as a function of the temperature difference between the reference room temperature and the average chilled water temperature. According to the data obtained, the graph of the change in the capacity of the chilled ceiling panel is shown in Figure 13. A regression analysis was performed on the graphical data, and it was found that the function of the capacity change obtained was consistent.

6. Conclusions

This study found that the heat transfer coefficients for both radiation (5.49 W/(m2K)) and convection (4.02 W/(m2K)) were within the literature’s reference ranges, confirming their compatibility. The accuracy was found to be 90% and above.
In ceiling panel cooling applications, maintaining the water temperature above the dew point temperature increases the efficiency of the panel system and results in greater energy efficiency. Cooling with ceiling panel systems can be achieved at very low cost using a nearby water source, such as a river or lake, rather than cooling the water itself. In the near future, the use of ceiling cooling systems for energy efficiency will become widespread. The engineering design calculations for this application will require heat transfer rates and their variations. In this study, heat transfer rates were formulated with equations to facilitate the engineering design calculations.
Detailed research into thermally active building structures (using low-temperature heating and high-temperature cooling with pipes embedded in the concrete structure of the building) for the specific climatic conditions where the building is located is crucial to achieving increased efficiency.

Author Contributions

Conceptualization, C.D.K. and D.B.Ö.; methodology, C.D.K. and D.B.Ö.; validation, C.D.K. and D.B.Ö.; investigation, C.D.K.; resources, C.D.K.; writing—original draft preparation, C.D.K. and D.B.Ö.; writing—review and editing, C.D.K. and D.B.Ö.; supervision, C.D.K. and D.B.Ö. All authors have read and agreed to the published version of the manuscript.

Funding

This research received no external funding.

Institutional Review Board Statement

Not applicable.

Informed Consent Statement

Not applicable.

Data Availability Statement

The original contributions presented in the study are included in the article, further inquiries can be directed to the corresponding author.

Acknowledgments

The authors would like to acknowledge that this paper is submitted in partial fulfilment of the requirements for PhD degree at Yildiz Technical University.

Conflicts of Interest

The authors declare no conflict of interest.

Nomenclature

ASurface area of the heating/cooling panel, m2
AUSTAverage unheated (uncooled) surface temperature, °C
cpSpecific heat capacity, J/(kg K)
h c Convective heat transfer coefficient, W/(m2 K)
h r Radiant heat transfer coefficient, W/(m2 K)
h t Total heat transfer coefficient, W/(m2 K)
mwWater mass flow, kg/s
q c Natural convective heat flux, W/m2
q l s Heat losses due to transmission, W/m2
q r Radiation heat flux, W/m2
q t Heat flux density, W/m2
T a Indoor air dry-bulb temperature, °C
T d Outdoor (outside the test chamber) air dry-bulb temperature, °C
T i Internal surface temperature, °C
T m r Mean radiant temperature, °C
T o p Indoor operative temperature, °C
T w Water temperature, °C
T s Radiant ceiling surface temperature, °C
ΔθDifference between reference room temperature and mean cooling water temperature, °C
Greeks
ϵEmissivity
σStefan–Boltzmann constant

References

  1. Deng, Y.; Ding, Y.; Chen, S.; Li, J.; Zhou, C. Study on radiant heat exchange between human body and radiant surfaces under asymmetric radiant cooling environments. Therm. Sci. Eng. Prog. 2023, 37, 101617. [Google Scholar] [CrossRef]
  2. Junasová, B.; Krajčík, M.; Šikula, O.; Arıcı, M.; Šimko, M. Adapting the construction of radiant heating and cooling systems for building retrofit. Energy Build. 2022, 268, 112228. [Google Scholar] [CrossRef]
  3. Koca, A.; Karakoyun, Y.; Acikgoz, O.; Dogu, M.; Dalkilic, A.S. An experimental investigation on the radiant cooled wall’s heat transfer characteristics in a fully conditioned real-sized living environment. Energy Build. 2022, 277, 112578. [Google Scholar] [CrossRef]
  4. Camci, M.; Karakoyun, Y.; Acikgoz, O.; Dalkilic, A.S. An experimental study on the heat transfer characteristics over a radiant cooled wall exposed to mixed and forced convection driven by displacement ventilation. Int. Commun. Heat Mass Transf. 2022, 135, 106122. [Google Scholar] [CrossRef]
  5. Koca, A. Experimental examination of heat transfer coefficients in hydronic radiant wall cooling Systems. J. Build. Eng. 2022, 60, 105209. [Google Scholar] [CrossRef]
  6. Chen, Q.; Li, N. Model predictive control for energy-efficient optimization of radiant ceiling cooling systems. Build. Environ. 2021, 205, 108272. [Google Scholar] [CrossRef]
  7. Jin, W.; Jing, J.; Jia, L.; Wang, Z. The dynamic effect of supply water flow regulation on surface temperature changes of radiant ceiling panel for cooling operation. Sustain. Cities Soc. 2020, 52, 101765. [Google Scholar] [CrossRef]
  8. Shinoda, J.; Kazanci, O.B.; Tanabe, S.; Olesen, B.W. A review of the surface heat transfer coefficients of radiant heating and cooling systems. Build. Environ. 2019, 159, 106156. [Google Scholar] [CrossRef]
  9. Shin, M.S.; Rhee, K.N.; Park, S.H.; Yeo, M.S.; Kim, K.W. Enhancement of cooling capacity through open-type installation of cooling radiant ceiling panel systems. Build. Environ. 2019, 148, 417–432. [Google Scholar] [CrossRef]
  10. Yuan, Y.; Zhang, X.; Zhou, X. Simplified correlations for heat transfer coefficient and heat flux density of radiant ceiling panels. Sci. Technol. Built Environ. 2017, 23, 251–263. [Google Scholar] [CrossRef]
  11. Andres-Chicote, M.; Tejero-Gonzalez, A.; Velasco-Gomez, E.; Javier Rey-Martinez, F.J. Experimental study on the cooling capacity of a radiant cooled ceiling system. Energy Build. 2012, 54, 207–214. [Google Scholar] [CrossRef]
  12. Causone, F.; Corgnati, S.P.; Filippi, M.; Olesen, B.W. Experimental evaluation of heat transfer coefficients between radiant ceiling and room. Energy Build. 2009, 41, 622–628. [Google Scholar] [CrossRef]
  13. Diaz, F.N.; Lebrun, J.; André, P. Experimental study and modelling of cooling ceiling systems using steady-state analysis. Int. J. Refrig. 2010, 33, 793–805. [Google Scholar] [CrossRef]
  14. Cheng, Q.; Gomez, S.; Hu, G.; Abaalkhail, A.; Beasley, J.; Zhang, P. A Zigzag Wall with Asymmetric Emissivity for Radiative Cooling Building Envelope. engrXiv, 2023; preprint. [Google Scholar] [CrossRef]
  15. Cheng, Q.; Tang, C.; Luo, D.; Park, M.; Tian, S.; Yang, Y. A dynamic wall design with tunable angular emissivity for all-season thermal regulation. Cell Rep. Phys. Sci. 2024, 5, 101934. [Google Scholar] [CrossRef]
  16. BS EN 12975-2:2006; BRITISH Standard: Thermal Solar Systems and Components. Solar Collectors—Test Methods. British Standards Institution (BSI): London, UK, 2006.
  17. ASHRAE Handbook—Fundamentals 2021; ASHRAE: Peachtree Corners, GA USA, 2021; ISBN 978-1-947192-90-4.
  18. BS EN ISO 7730:2005; ISO Standard: Ergonomics of the Thermal Environment. Analytical Determination and Interpretation of Thermal Comfort Using Calculation of the PMV and PPD Indices and Local Thermal Comfort Criteria. ISO: Geneva, Switzerland, 2005.
  19. ANSI/ASHRAE 55:2010; ASHRAE Standard: Thermal Environmental Conditions for Human Occupancy. American Society of Heating, Refrigerating and Air-Conditioning Engineers Inc.: Atlanta, GA, USA, 2010.
  20. BS EN 14240:2004; BRITISH Standard: Ventilation for Buildings—Chilled Ceilings—Testing and Rating. ASTM International: West Conshohocken, PA, USA, 2004.
  21. Kline, S.J.; ve McClintock, F.A. Describing Uncertainties in Single-Sample Experiments. Mech. Eng. 1953, 75, 3–8. [Google Scholar]
Figure 1. The layout of the test chamber.
Applsci 14 05908 g001
Figure 2. A sectional view of the test chamber.
Applsci 14 05908 g002
Figure 3. The dimensions of the collector panel.
Applsci 14 05908 g003
Figure 4. The placement of the collector panels.
Applsci 14 05908 g004
Figure 5. Radiant cooling system configuration.
Applsci 14 05908 g005
Figure 6. Arrangement of temperature sensors (dimensions in mm).
Applsci 14 05908 g006
Figure 7. Arrangement of temperature sensors (dimensions in mm).
Applsci 14 05908 g007
Figure 8. A layout view of the temperature sensors.
Applsci 14 05908 g008
Figure 10. Experimental room heat simulator layout plan (dimensions in mm).
Applsci 14 05908 g010
Figure 11. Time-dependent change in room air temperature with different heat rates and water flow rates (Twater−supply = 14.15 °C in the case of constant water temperature).
Applsci 14 05908 g011
Figure 12. Time-dependent change in room air temperature in cases with constant water flow rate, constant water temperature and variable heat rate of internal heat source.
Applsci 14 05908 g012
Figure 13. Specific cooling capacity chart in the case of an internal heat source, variable heat rate, water temperature and constant water flow rate.
Applsci 14 05908 g013
Table 1. Water flow temperatures.
Supply Water—°CReturn Water—°CNumber of
Experiments
ExplanationMinMaxAvgMinMaxAvg
Water temp. Step 117.5518.0417.7717.6218.7618.2512
Water temp. Step 216.3616.9716.6216.8917.8717.2112
Water temp. Step 315.3115.8715.6115.5016.7716.1217
Water temp. Step 413.7614.6314.1113.9415.4414.6415
Table 2. Water flow rates.
Pump Flow—m3/hNumber of
Experiments
ExplanationMinMaxAvg
Pump Flow Step 10.520.580.5418
Pump Flow Step 20.900.940.9318
Pump Flow Step 31.071.131.1020
Table 3. Heat simulator capacity.
ExplanationCapacity
W
Qty.Total Capacity
W
Heat Simulator—Closed040
Heat Simulator—Step 1704280
Heat Simulator—Step 255 + 704500
Heat Simulator—Step 370 + 55 + 704780
Table 4. Calculations for the total heat transfer coefficient of the wall.
LAYER—WALLThicknessThermal
Conductivity Calculation Value
d/kh, 1/hThermal
Conductivity
Coefficient
U
d (m)kh (W/mK)(m2K/W)(W/m2K)
1/hi 0.130
Interior Plaster (gypsum mortar)0.0010.7000.001
Gypsum board—800 kg/m30.0120.2500.048
Thermal Insulation Material0.0300.0470.644
Gypsum board—800 kg/m30.0120.2500.048
Outer Plaster (gypsum mortar)0.0010.2500.004
1/hd 0.040
0.9161.092
Table 5. Calculations for the total heat transfer coefficient of the floor.
LAYER—FLOORThicknessThermal
Conductivity Calculation Value
d/kh, 1/hThermal
Conductivity
Coefficient
U
d (m)kh (W/mK)(m2K/W)(W/m2K)
1/hi 0.130
Ceramic Tile0.0011.6500.001
Cement mortar screed—2000 kg/m30.0801.4000.057
Concrete—2400 kg/m30.1002.5000.040
Outer Plaster (cement mortar) 0.0020.2500.008
1/hd 0.040
0.2763.626
Table 6. The heat transfer coefficient values.
Explanation h c h r
Literature values–[W/m2K]3.1–4.15.50
Calculated values–[W/m2K]4.025.49
Disclaimer/Publisher’s Note: The statements, opinions and data contained in all publications are solely those of the individual author(s) and contributor(s) and not of MDPI and/or the editor(s). MDPI and/or the editor(s) disclaim responsibility for any injury to people or property resulting from any ideas, methods, instructions or products referred to in the content.

