Article

Analysis and Experimental Study on the Stability of Large-Span Caverns’ Surrounding Rock Based on the Progressive Collapse Mechanism

by
Huanxia Chen
1,
Junqi Fan
1,2,* and
Jingmao Xu
1,2
1
Defense Engineering Institute, AMS, PLA, Luoyang 471023, China
2
State Key Laboratory of Target Vulnerability Assessment, Luoyang 471023, China
*
Author to whom correspondence should be addressed.
Appl. Sci. 2024, 14(13), 5929; https://doi.org/10.3390/app14135929
Submission received: 3 June 2024 / Revised: 1 July 2024 / Accepted: 5 July 2024 / Published: 7 July 2024
(This article belongs to the Special Issue Advanced Research on Tunnel Slope Stability and Land Subsidence)

Abstract

:
The collapse failure of rock surrounding caverns involves a progressive collapse process. Based on the nonlinear Hoek–Brown failure criterion and the upper limit theorem, the whole process curve of the progressive collapse of the surrounding rock of a large-span cavern is outlined in this paper. The progressive collapse process of the surrounding rock of the large-span cavern is experimentally studied using an independently developed visualized large-span-cavern geomechanical model test device with variable angles. The results show that, through theoretical calculation and model tests, the surrounding rock at the top of the large-span cavern undergoes three collapses. Under the condition of rock mass and the shape of the cavern, the larger the span of the cavern, the more times the surrounding rock collapses; with the increase in surrounding rock pressure, the first collapse occurs in the middle part of the arch roof. When the overlying load reaches a certain level, the arch foot becomes the weakest part, and the rock undergoes shear failure along the arch foot, gradually extending upwards, accompanied by multiple collapses, forming a progressive collapse process. The theoretical calculation results of this paper are basically consistent with the scope of the model test, and the research results can provide a basis for the construction and support design of the large-span cavern.

1. Introduction

The existence of the structural plane destroys the continuity of rock mass. For engineering rock mass, the rock mass structure will change relative to changes in engineering scale and size. When a cavern span is small, there will be relatively few structural planes in the surrounding rock, and the strength of the rock mass will be close to the overall rock strength; when a cavern span is large, there will be more structural planes in the surrounding rock, and the strength of the rock mass will be close to the strength of the structural plane. In this context, the failure mode of the surrounding rock is predominantly part of the controlled failure of the rock mass structure. Therefore, under the same surrounding rock conditions, for the large-span cavern project, the strength of the rock mass will be lower, the degree of fragmentation will be higher, and progressive collapse will happen more easily. The mechanical mechanism of the rock mass and the stability analysis method of the project are different for different structures of engineering rock mass [1,2]. Therefore, it is of great theoretical significance and practical value to carry out in-depth research on the progressive collapse mechanism of the surrounding rock of large-span caverns.
Scholars both at home and abroad have studied the collapse mechanism of surrounding rock by using the nonlinear Hoek–Brown failure criterion and the upper limit analysis theorem. Fraldi et al. [3,4,5] proposed a combination of plasticity theory and the Hoek–Brown criterion to analyze the collapse profile of cavern excavation and obtain the analytical solution of the collapse curve of a vault of circular and rectangular tunnels. The research results have also been expanded upon and applied by many scholars. Yang et al. [6,7,8,9] studied the tunnel collapse failure mechanisms of circular, rectangular, and layered soil. Yu Li et al. [10] derived the three-dimensional failure mechanism of deep soil tunnels based on the Mohr–Coulomb criterion, studied the influence of various parameters on the collapse range, and obtained the exact solution of the collapse curve. Sun Chuang et al. [11] established a three-dimensional progressive collapse mechanism for deep-buried tunnels and compared it with the actual tunnel engineering situation, verifying the applicability of the theoretical calculation results to predict the progressive collapse range of tunnel vaults. In underground mining, particularly with room and pillar methods, excavations are often expanded to residual dimensions during the pillar recovery phase. This approach aims to minimize operational losses [12] and optimize waste storage [13].
The collapse of the surrounding rock of the cavern is not formed in a single instance. With the gradual weakening of the mechanical parameters of the surrounding rock of the cavern during excavation, a short-term stable collapse arch will be formed within the loosening range of the surrounding rock for each collapse failure, until the minimum residual strength of the surrounding rock is reached, when, finally, a stable collapse will be formed. The progressive collapse phenomenon of rock surrounding a cavern has been confirmed many times [14,15,16]. At the same time, according to the statistical results of underground engineering collapse accidents [17], among 50 underground engineering collapse accidents, 44% had two or more collapses. Among them, the instances of three or more collapses accounted for 26%.
By reviewing the relevant literature, it is apparent that research on the collapse of rock surrounding an arch mainly focuses on the final failure mode, with research lacking on progressive collapse incubation and evolution mechanisms. This paper will use the Hoek–Brown failure criterion and the upper limit theorem to study the progressive collapse characteristics of the surrounding rock of long-span caverns through theoretical analysis and model experiments.

2. Basic Theory

2.1. Upper Limit Theorem

According to the upper limit theorem, and under the assumption of small deformation and the conditions of static and maneuvering permits, the virtual work equation is as follows [18]:
s T i U i * d s + F i v U i * d v = σ i j v ε i j * d v
where Ti is a surface force on boundary s; Ui* is the velocity along the velocity discontinuity surface; Fi is the body force; σij and εij* are the stress tensor and strain rate in the kinematically admissible velocity field, respectively; and v is the volume of the collapsing block. In this study, to ensure the feasibility of the computational process, only the impact of the rock mass gravity on the stability of the surrounding rock was considered, while the influence of horizontal stress was neglected.

2.2. Hoek–Brown Nonlinear Failure Criterion

The stability of large span caverns is influenced by geological and mining factors, including but not limited to, the presence of faults, fractures, and the dynamic hazards associated with underground excavations. This complexity underscores the importance of accurate theoretical models and their validation through rigorous testing. The Hoek–Brown failure criterion is an empirical formula for rock mass failure in geotechnical engineering. It is expressed in two forms, namely the large minimum principal stress and the normal and shear stress. Due to the energy involved, dissipation is generated by the normal stress and shear stress. For the convenience of calculation, the following expression is selected [19,20]:
τ = A σ c   σ n + σ t σ c B
where A and B are material constants; τ is shear stress; σc and σt represent the uniaxial compressive strength and the tensile strength of the rock mass, respectively; and σn is normal effective stress.

2.3. Calculation of Energy Consumption Based on the Upper Limit Method

Assuming that the rock mass is an ideal plastic material and obeys the relevant flow law, according to the Hoek–Brown failure criterion and its related flow law, the expression of the plastic potential function of the rock surrounding the cavern can be obtained as
F = τ A σ c σ n + σ t σ c B
The normal plastic strain rate and the tangential plastic strain rate are expressed as
ε ˙ n = λ F σ = λ A B     σ   n + σ t σ c γ ˙ n = λ F τ = λ
where ε ˙ n is the normal plastic strain rate; γ ˙ n is the tangential plastic strain rate; and λ is the plastic index.

3. Analysis of the Collapse Mechanism of the Surrounding Rock of Large-Span Caverns

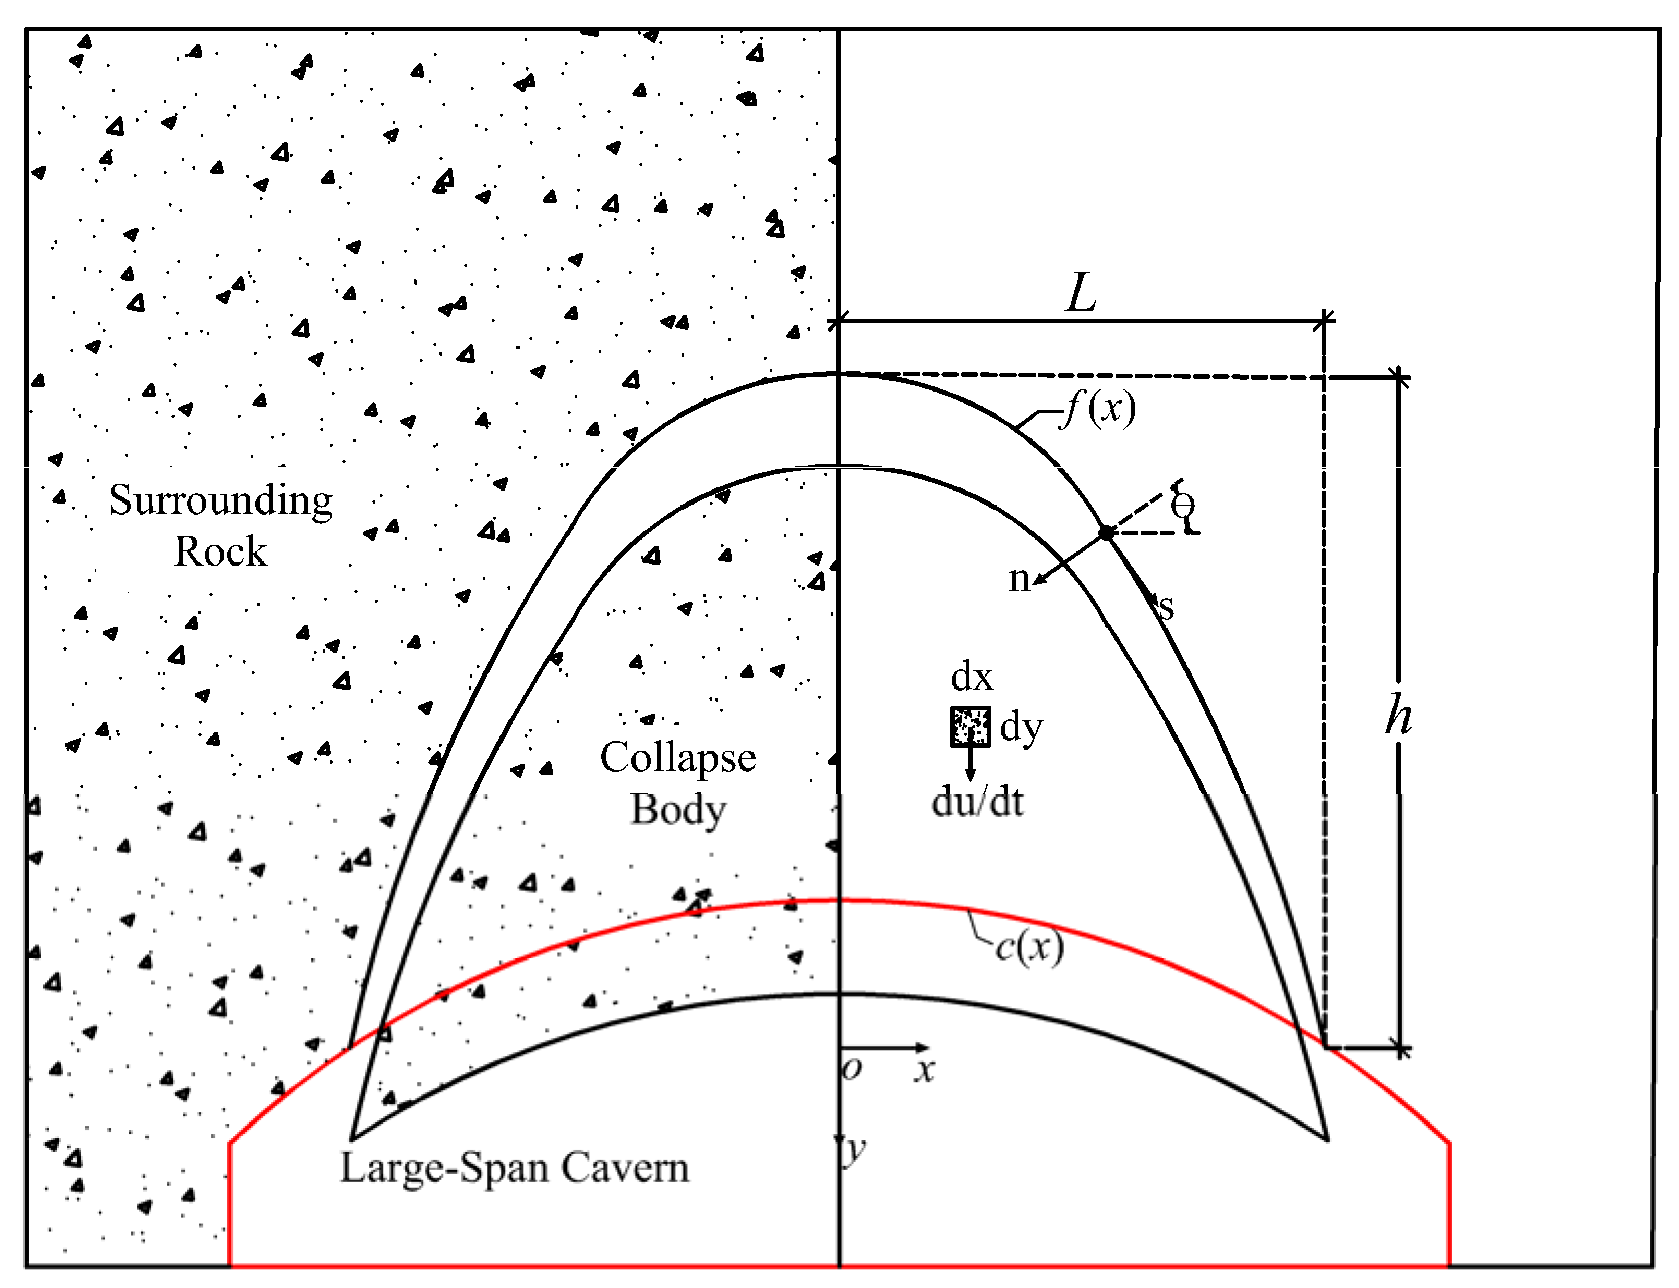
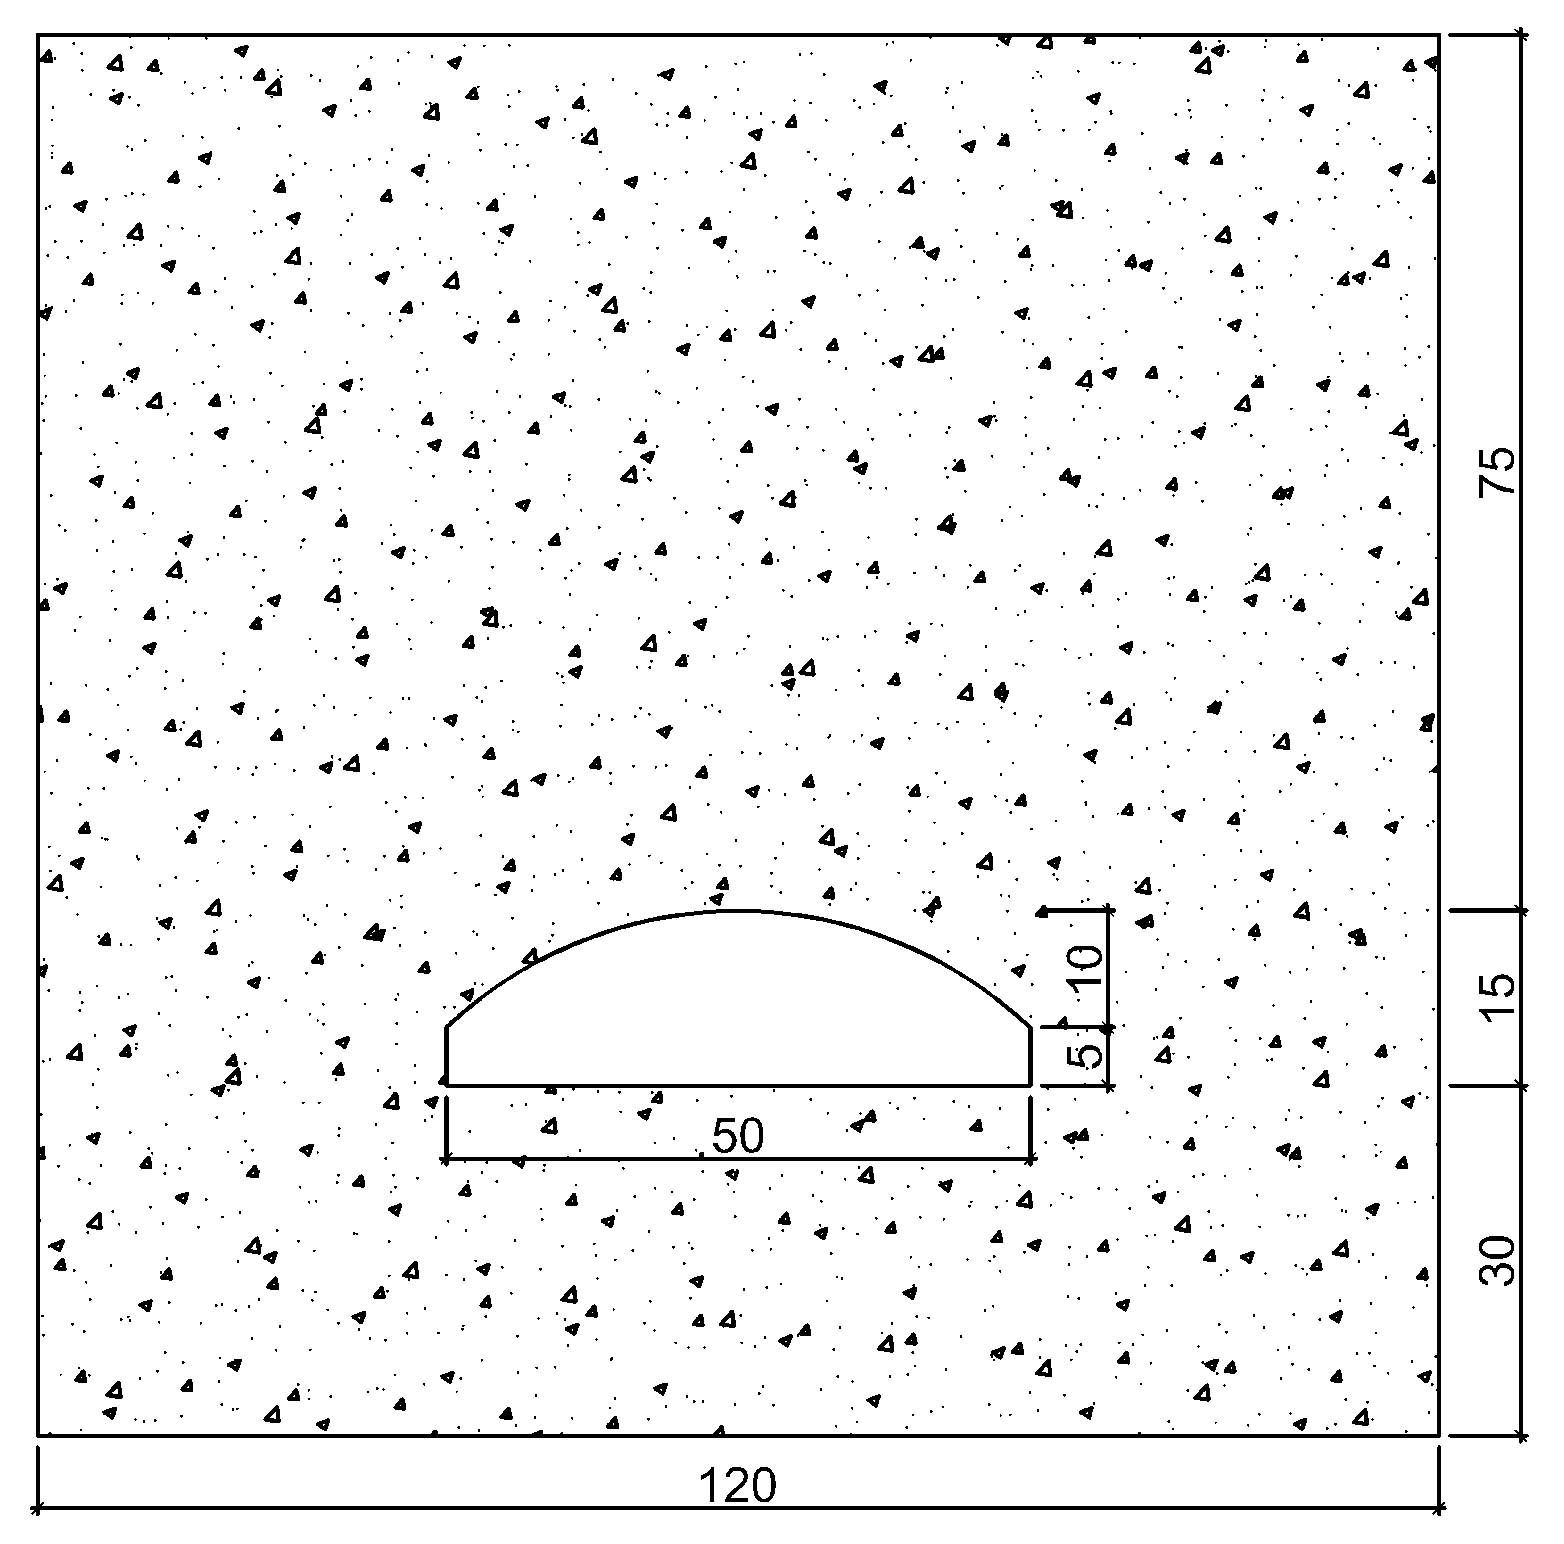
3.1. Establishment of a Computational Model

The collapse mechanism diagram of the surrounding rock at the top of the cavern is constructed according to the theory of strain localization, as shown in Figure 1. Assuming that the velocity discontinuity equation of the surrounding rock at the top of the cavern is f(x), a two-dimensional arch collapse surface will be formed on the xoy plane. The collapse body is regarded as a rigid body, that is, the surrounding rock does not change in volume when it is damaged, its height is h, its width is 2L, the collapse velocity is v, and the volumetric weight of the surrounding rock is γ. σn and τn represent the normal stress and shear stress at the fracture surface of the surrounding rock, while c(x) is the curve equation of the top boundary of the large-span cavern. θ represents the angle between the tangent and the horizontal line at any point on the collapse curve. “s” and “n” are the normal and tangent directions at any point on the collapse curve, respectively. dx and dy are the lengths of any tiny element on the collapse curve f(x), respectively, and du/dt is the change in velocity.

3.2. Solution to the Collapse Curve of Rock Surrounding a Large-Span Cavern Vault

According to the strain localization theory, the velocity discontinuity surface is considered a thin deformation layer with a thickness t, so the normal velocity and tangential velocity at any point on the velocity discontinuity surface can be determined using the first derivative f′(x) of the velocity discontinuity surface function f(x). Then, with triangular transformation, ε ˙ n and γ ˙ n can be expressed as
ε ˙ n = v t s i n θ = v t 1 1 + f x 2 γ ˙ n = v t c o s θ = v t f x 1 + f x 2
The expression of normal stress on the speed discontinuity surface can be obtained by combining Equations (4) and (5).
σ n = σ t   + σ c A B f x 1 1 B
According to Fraldim’s [3] research, the internal energy dissipation rate D at any point on the velocity discontinuity surface is equal to the sum of the tangential stress dissipation power and the normal phase stress dissipation power:
D = σ n ε ˙ n   + τ γ ˙ n   =   σ   t + { σ c A B f x 1   1 B 1 B 1 } ν t 1   +   f x 2
The power expression of gravity per unit length of a collapse body is
W D = γ f x c x v
According to the virtual work equation, the energy dissipation objective function composed of the independent variables of f(x) can be obtained using the upper bound analysis method. However, f(x) is itself a function, so the energy dissipation objective function is universal. In order to obtain the expression of f(x), according to the principle of variational method, the objective function ψ is introduced to represent the difference between the internal energy dissipation rate and the external force work power, and f(x) is obtained by means of the extreme value of the objective function. Since the surrounding rock collapse body is symmetric about the y-axis, the right half of the y-axis is taken for calculation, so the total work equation is
ψ f x , f x , x = 0 s D t d s 0 L W γ d x γ                                                           = 0 L ( D t 1 + f x 2 W γ ) d x                                                                 = 0 L Λ f x ,     f x , x V d x
where d s = 1 + f x 2 d x is the length of any tiny element on the line f(x), and s is the total length of the right half of the collapse curve f(x). Λ f x ,   f x , x is a universal function of f(x), and its specific expression is
Λ f x , f x , x = σ c A B f x   1 1 B 1 1 B σ t   γ f x c x
The extreme value problem of the universal function can be transformed for the problem of solving the Euler equation, satisfying the boundary conditions, and then the Euler equation expression of Λ is as follows:
δ Λ f x , f x , x = 0 Λ f x d d x Λ f x = 0
According to formula (10), it can be concluded that
Λ f x = γ ,     Λ f x = σ c A B 1 1 B B 1 f x B 1 B
Substituting Equation (12) into Equation (11) yields the body expression of the Euler equation as
σ c 1 B 1 A B 1 1 B f x 2 B 1 1 B f x γ = 0
Equation (13) is a nonlinear second-order differential equation with respect to the first integral of the equation, producing
σ c B 1 A B 1 1 B f x B 1 B γ x C 0 = 0
where C is the integration constant.
From Equation (14), the specific expression of the first derivative f′(x) is
f x = B σ c 1 A B 1 1 B     1 B B γ x + C 0     1 B B
After integrating the above equation again, the final analytical expression of the collapse curve f(x) can be obtained:
f x = k x + γ 1 C 0 1 B h
where k = A 1 B γ σ c 1 B B , h is also an integral constant, and in a geometric sense, h is the maximum height of the collapsed body since there are integral constants, C0 and h, in f(x). For convenience of calculation, C0 should be found first.
If n and s are the normal and tangent directions of the collapse curve f(x), respectively, n = c o s θ ,   s i n θ T and s = s i n θ , c o s θ T , which can be expressed in the partial coordinate system {n, s} as
σ n n + τ n s = γ s i n θ τ n s = γ c o s θ
By substituting Formulas (6) and (16) into Equation (2), it can be concluded that
τ n = γ x + C 0
Then, the following can be introduced:
τ n n = τ n · n   = γ c o s θ
where τ n = τ n x , τ n y T .
Since the collapse body curve f(x) is symmetrical with respect to the y-axis, the shear stress at x = 0 and y = −h is zero, and then
τ x y x = 0 , y = h = 0
Using the stress field coordinate transformation formula,
τ x y = τ n c o s 2 θ 1 2 σ n s i n θ
Since c o t θ = f x ,
c o s 2 θ = f x 2 1 f x 2 + 1 ,     1 2 s i n 2 θ = f x f x 2 + 1 c o t θ x = 0 = f x = 0 = Q c 0 1 B B
where Q = B σ c 1 A B 1 B 1 B B . Substitute Equations (15) and (22) into Equation (21), and then
Q 2 c 0 2 1 B B + 1 1 c 0 Q 2 c 0 2   1 B B   1 + σ t A B Q 1 1 B c 0 1 B Q c 0   1 B B = 0
It can be found that
C 0 = 0
The expression of the collapse body curve is
f x = k x 1 B h
There is a geometric relationship known as f = 0, which can be deduced:
h = k L 1 B L = k B h B
Substituting Equations (15) and (16) and Equation (24) into Equation (10), it can be found that
Λ f x , f x , x = α β x 1 B   + γ c x
where
α = γ h σ t ,     β = B 1 γ A 1 1 B σ c B 1 B = k γ B 1
Equations (26) and (27) can be substituted into Equation (20), and the principle of virtual work can be combined to obtain
ψ f x , f x , x = 0 L Λ f x , f x , x v d x = 0 v L α β B 1 + B 1 L 1 B + P = 0 α β B 1 + B 1 L 1 B   + P = 0
where P is the generalized pressure, which can be expressed as
P = 1 L γ 0 L c x d x
Substitute Equations (26) and (27) into Equation (20); and combine the principle of virtual work to obtain
γ k L 1 B B 1 + B 1 σ t   + P = 0
Substitute with Equations (26) and (27), and the expression of the maximum half width of the collapse body can be obtained as
L = A B B 1 + B B γ 1 σ c 1 B σ t   P B
The expressions of the collapse body height h is
h = γ B 1 1 + B σ t   P
Substitute Equation (32) into Equation (25), and the collapse body curve equations can be obtained as
f x = k x   1 B h k = A 1 B γ σ c 1 B B
According to Figure 1, the coordinates of the dome center of the large cavern are 0 , R 2   L 2 , and the expression of the curve c(x) can be obtained as follows:
c x = R 2   x 2   R 2   L 2
where R is the radius of the long-span cavern vault curve c(x), and the generalized pressure is
P = γ 1 2 L R 2 α r c sin L R L R 1 L R 2
Substituting Equation (35) into Equation (31), it can be found that
  L A B B   1 + B B γ 1 σ c 1 B σ t   γ 1 2 L R 2 a r c s i n L R L R 1 L R 2 B = 0
In the above equations, all other parameters except L are known. After L has been obtained using MATLAB numerical calculation software, P can be calculated, and the expressions of the collapse body height h and the collapse line f(x) can be obtained in sequence.

4. Calculation of the Progressive Collapse Process of the Surrounding Rock of a Large-Span Cavern

4.1. Establishment of the Progressive Collapse Model

When the surrounding rock at the top of the cavern collapses, the surrounding rock above the collapse boundary will be greatly deformed, and the physical and mechanical parameters of the surrounding rock will be weakened. Therefore, the first collapse boundary f1(x) is taken as the contour, which results in the second collapse, forming a new collapse boundary f2(x), as shown in Figure 2. As can be seen from the figure, the two square curve equations f1(x) and f2(x) are, respectively, under two independent coordinates, namely the coordinate systems o1 and o2.

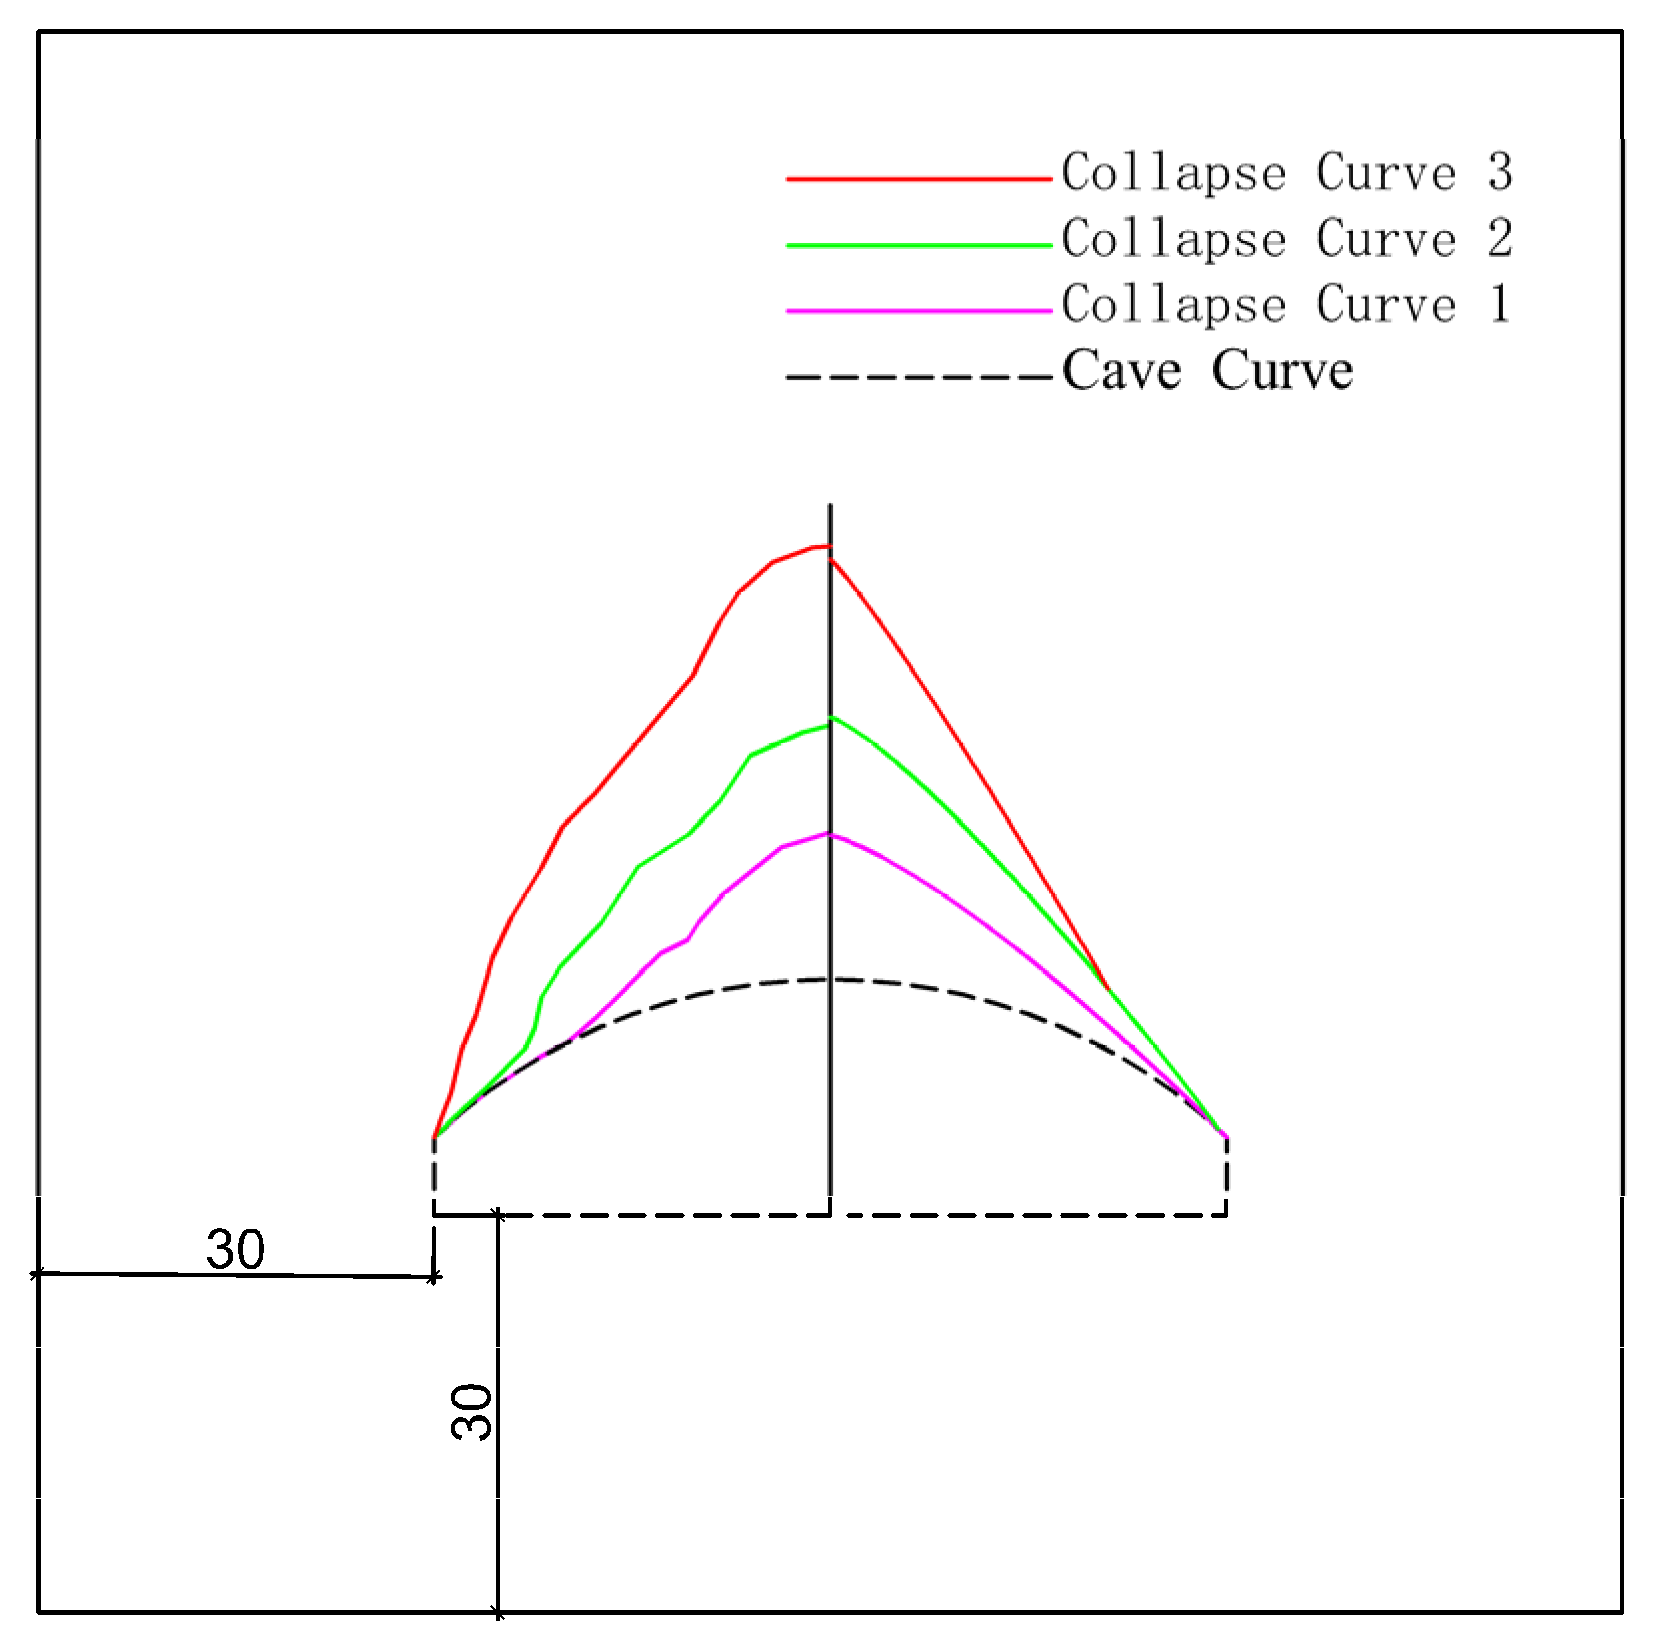
4.2. Analytical Solution of the Progressive Collapse Curve of a Large-Span Cavern’s Surrounding Rock

According to the content of the previous section, the first collapse curve equation, width, and height expressions are
f 1 x = k 1 x 1 B h 1 k 1 = A 1 B γ σ c 1 1 B B
L 1   = A B B   1 + B B γ 1 σ c 1 1 B σ t   1 P B P 1 = γ 1 2 L R 2 α r c sin L R L R 1 L R 2
h 1 = γ B 1 1 + B σ t 1 P
In Equations (37)–(39), f1(x) uses the coordinate system o1, where σc1 and σt1 are the uniaxial compressive strength and the tensile strength of the rock mass during the first fall, respectively.
With the gradual weakening of the surrounding rock parameters, the second collapse curve equation f2(x) is generated by taking the first collapse curve as the wheel line, which can be expressed as
f 2 x   = k 2 x 1 B h 2 k 2 = A 1 B γ σ c 2 1 B B
where f2(x) is the uniaxial compressive strength of the first square time rock mass using the coordinate system o2.
After converting the coordinate system of the first collapse curve f1(x) into o2, the expression of the first collapse curve is
f 12 x = k 1 x 1 B h 1 + h 1 k 1 L 2 1 B
The expression of the objective function ψ2 in the second collapse curve is
ψ 2   = v L 2 r h 2   σ t 2   γ   1 + B 1 h 2 + p 1 P 1 = γ 1 + B 1 k 1 L 2 1 B
where P1 is the generalized pressure, i.e.,
P 1 = 1 L 2 γ 0 1 f 12 x d x
Using the virtual power principle ψ2 = 0, the following can be obtained:
r h 2 σ t 2 γ 1 + B 1 h 2 + p 1 = 0
The expressions for the height h2 and width L2 of the second collapse body are
h 2 = 1 + B σ t 2 γ B + k 1 / k 2 = 1 + B σ t 2   γ B + σ c 1 / σ c 2 B 1 B
L 2 = 1 + B   σ t 2 γ B k 2   + k 1 = A 1 + B σ t 2 B σ t 2 1 B γ B + ( σ c 1 / σ c 2 ) B 1 B B
It can be seen from Equations (47) and (48) that the parameters of the second collapse are only related to a/b, so the i-th collapse range is only related to the ratio of σ c i 1 / σ c i i     2 of the uniaxial resistance of the rock mass. If n − 1 falls are carried out on the basis of the first collapse, and the uniaxial compressive strength of the rock mass is uniformly reduced, and the compressive strength of the final surrounding rock is stable at σ c n , the uniaxial compressive strength reduction value of the rock mass is
σ c i = σ c 1 σ c n n 1  
The equation for the i-th collapse curve in the coordinate system o is expressed as
f i x = k i x 1 B h 2
Substituting Equation (47) into Equations (45) and (46) yields the curve equation for the nth collapse. Finally, by using coordinate system transformation, the progressive collapse process of the surrounding rock of the cave can be obtained by plotting the n-fold collapse curve onto the coordinate system o1.

5. Model Test of the Progressive Collapse of the Surrounding Rock of a Large-Span Cavern

5.1. Selection of Similar Scale

Starting from the overall intention of this study, for rock engineering, the similarity relationships involved in the geomechanical model test mainly include the geometric similarity ratio Cl, the stress similarity ratio Cσ, and the severe similarity ratio Cγ, and each index should satisfy Cσ = ClCγ. The similarity ratio of this test can be determined as follows: geometric similarity ratio: Cl = 100, stress similarity ratio: Cσ = 100, and severe similarity ratio: Cγ = 1.
In order to facilitate the production of large-span cavern models, the model should be as large as possible; however, when considering the economic problems of model testing, it is necessary to make the model as small as possible. After comprehensive consideration, the geometric scale was taken as Cl = 100, the top of the cavern was buried at about 70 cm, and the left and right parts of the cavern were 30 cm away from the boundary, so that there was enough distance between the cavern and the boundary, so that a relatively uniform free-field stress state could be obtained around the cavern. Due to the small geometric scale, considering the operability of the later model, the thickness of the model was 5 cm. The final selected model boundary size parameters were length × height × thickness = 120 cm × 120 cm × 5 cm. The span of the cavern was 60 cm, the total height was 18 cm, with the height of the straight wall was 6 cm, and the arrow height was 12 cm. The size of the large-span cavern model is detailed in Figure 3.

5.2. Identification of Similar Materials

If the geomechanical model test takes the rock block as the simulation object, its strength will be higher, and it will not be able to reflect the real situation of rock collapse failure. According to the test objectives and main contents, irregular steel sand and quartz sand were selected as aggregates to control the weight scale, and the stress scale was controlled by changing the amount of lubricating oil and fly ash. These four materials do not chemically react and are not volatile, so they can be used repeatedly, thus saving test costs and time. The particle sizes of the steel sand selected from the national standard irregular steel sand were G10 (2.5 mm), G12 (2.0 mm), G14 (1.7 mm), G16 (1.4 mm), and G18 (1.2 mm), and the steel sand and quartz sand were proportioned by grading in a ratio of 1:1. In this model test, the gravity scale was Cγ = 1, and the gravity of the rock mass was 26.5–24.5 kN/m3. After repeated tests, it was determined that the ratio of rock mass simulation materials was steel sand/quartz sand/lubricating oil/fly ash = 12.5:10.75:1:3.25, and the gravity of the ratio material was 25.87 kN/m3, which meets the requirements of similar severity.
The shear strength curve of the model material measured using the direct shear test is shown in Figure 4. The relationship between the cohesion and internal friction angle of the model material and the shear strength can be expressed with the Mohr–Coulomb criterion as
τ = σ tan φ + c       = 2.928 + 0.684 σ
where τ is the shear strength; σ is the normal stress; φ is the internal friction angle; and c is the cohesion.
The cohesive force of the model material is 2.9 kPa and the internal friction angle is 34.4°. The mechanical parameters of the rock mass based on the Hoek–Brown failure criterion need to be converted using the linear regression method. The specific regression steps can be referred to in [17]. Under similar scales, the equivalent parameters of the rock mass are γ = 25.87 kN/m3; σc = 7.586 kPa; σt = 0.051 kPa; and A = 0.515; B = 0.77.

5.3. Test Conditions

In order to simulate the progressive collapse process of large-span caverns, a visualized large-span cavern geomechanical model test device with variable angles was developed. As shown in Figure 5, the force on the rock mass at the open surface after cavern excavation was changed by rotating the angle of the model frame. The model box was rotated from 0° to 90° in sequence, and the force on the surrounding rock of the cavern vault was also increased from 0 to the maximum, thus simulating the gradual collapse process of the surrounding rock of the large-span cavern vault. When the model frame is at 0°, the surrounding rock at the top of the cavern is not affected by gravity and the force on the vault is 0. With the continuous increase in the angle, the force on the surrounding rock of the vault also gradually increases, and the surrounding rock within a certain range becomes deformed, and the local surrounding rock collapses and fails. After the rotation has stopped, the surrounding rock around the cavern will redistribute the stress and finally stabilize to form a collapse curve under the force. When the model is rotated to 90°, the final collapse curve is formed. The test device is small and lightweight. In order to facilitate the observation of the whole process of collapse of large-span caverns, 2 cm thick tempered glass was used on the upper and lower parts of the model box, and 2 cm steel plates were used around it for support. The built-in size of the model box was length × width × height = 120 cm × 120 cm × 5 cm.

5.4. Test Steps for the Progressive Collapse Model of Large-Span Caverns

The long-span cavern progressive collapse model test process is as follows:
(1)
Rotate the model box of the test device to the level and apply a layer of lubricating oil evenly around the model box to reduce the friction between the model box and the model material;
(2)
Mix the model material evenly according to the ratio, divide it into two layers, each layer 2.5 cm thick, and strictly control the weight and thickness of each layer to ensure that the density of the model material is consistent;
(3)
Model self-compaction and cavern excavation. After the model has been rammed and formed, the model box is rotated to 90° and left to stand for 2 h to complete the self-compaction of the model material to simulate the initial stress state of the rock mass. Then, the model box is rotated to the horizontal level and excavated according to the prefabricated cavern-shaped template;
(4)
Observation and recording of the whole process of the collapse and destruction of the cavern’s surrounding rock. In order to facilitate recording, an acrylic pen can be used to divide the upper glass of the model box into 2 × 2 cm squares, so that the deformation of the cavern surrounding rock can be observed more intuitively. Slowly rotate the model box with every 5° increase, and then let it stand for 10 min, observe, and record the collapse of the cavern surrounding rock until it rotates to 90°. When material is found to collapse around the cavern during the rotation process, immediately stop rotation and rest for 30 min to fully deform the surrounding rock, and then observe and record the collapse of the cavern. When the model frame rotates to 90°, let it stand for 30 min to record the final collapse of the cavern’s surrounding rock. The contents recorded during the test mainly include the rotation angle of the model frame and the shape and position of the collapsed part of the surrounding rock collapse.

5.5. Results and Analysis of a 60 m Large-Span Cavern Model Test

Figure 6 shows the progressive collapse process of the surrounding rock of a large-span cavern. The collapse of the surrounding rock of the large-span cavern starts from the middle of the vault and occurs three times successively.
It can be seen from the figure that, when the model frame rotates slowly to 61°, the surrounding rock at the top of the cavern collapses for the first time, and the surrounding rock does not continue to collapse after 30 min of rest, as shown in Figure 6a. Due to the large span of the cavern, with the increase in the load and the surrounding rock being under the action of gravity, the middle part of the cavern vault first undergoes tensile and shear damage, and the local collapse phenomenon occurs. The half width of the collapse body is 19.9 cm, and the height is 16.6 cm. The height of the first collapse body was 27.7% of the cavern span.
Continue to rotate the model box slowly. When the model box rotates slowly to 74°, the surrounding rock of the ceiling of the cavern vault collapses twice instantaneously. After leaving it to stand for 30 min, it can be observed that the model does not continue to deform, as shown in Figure 6b. With the increase in overburden, the remaining part of the surrounding rock at the arch foot cannot support the top pressure. Taking the maximum span of the cavern as the collapse width, it will extend again above the vault until a new collapse arch appears. The half width of the collapse body is 30 cm, and the height is 31.6 cm. The height of the first collapse body was 52.7% of the cavern span.
When the model box rotates slowly to 85°, the top of the cavern collapses for the third time. After standing still for 30 min, the model does not continue to deform. According to Figure 6c, it can be seen that the collapse range of the cavern continues to increase along the arch foot of the second collapse, forming the shape of the third collapse. The half-width of the collapse body is 30 cm, and the height is 45.1 cm. The height of the first collapse body was 75.2% of the cavern span.
Continue to rotate the model box slowly to 90°, and the surrounding rock of the model will be relatively stable from 85° without collapse. The outline of the gradual collapse process of the final large-span cavern is shown in Figure 6d.

5.6. Comparative Analysis of Theoretical Calculation and Experimental Results

According to the research content of Section 3 and Section 4, the curve diagram of the progressive collapse of the large-span cavern’s surrounding rock can be obtained using numerical calculation software. In Figure 7, the left half is the contour diagram of the model test, and the right half is the theoretical calculation contour diagram. Through comparative analysis, it was found that the height of the collapse body obtained via theoretical calculation was not much different from that of the model test. The first calculated collapse body curve width was larger than the collapse body width of the model test, while the second and third calculated collapse body curve widths were slightly smaller than the collapse body width of the model test, which was mainly due to the simplification of the theoretical analysis.
From the comparison chart of the collapse profile, it can be found that the arch foot is the weakest part of the surrounding rock. When the overlying load increases to a certain extent, the rock mass will cause shear failure along the arch foot. Through the above theoretical calculations and model test comparison, it was found that the theoretical calculation width of the first collapse body was smaller than the model test results, while the height of the collapse body was not very different. The main reason is that the theoretical analysis has been simplified. It can also be seen from the figure that the collapse body curve calculated only once was quite different from the actual one. The theoretical calculation results in this paper are basically consistent with the model test range, which verifies the rationality of the theoretical calculation and model test for predicting the progressive collapse curve of the surrounding rock of large-span caverns.

6. Influence of Cavern Span on Stability of Surrounding Rock

Due to changes in the scale and dimensions of the project, the structure of the engineering rock mass also changes accordingly. For small-span chambers, the same rock mass structure can be seen as a whole structure without structural surfaces. However, for large-span chambers, it can be considered a fracture structure or even a rupture structure. Thus, the size of the chamber has a direct impact on the stability of the surrounding rock. Using the rock mass materials and experimental method from Section 5, model experiments are conducted on large-span chambers of 30 m, 40 m, and 50 m, and compared with the experimental results of a 60 m large-span chamber to understand the influence of chamber span on the stability of the surrounding rock.

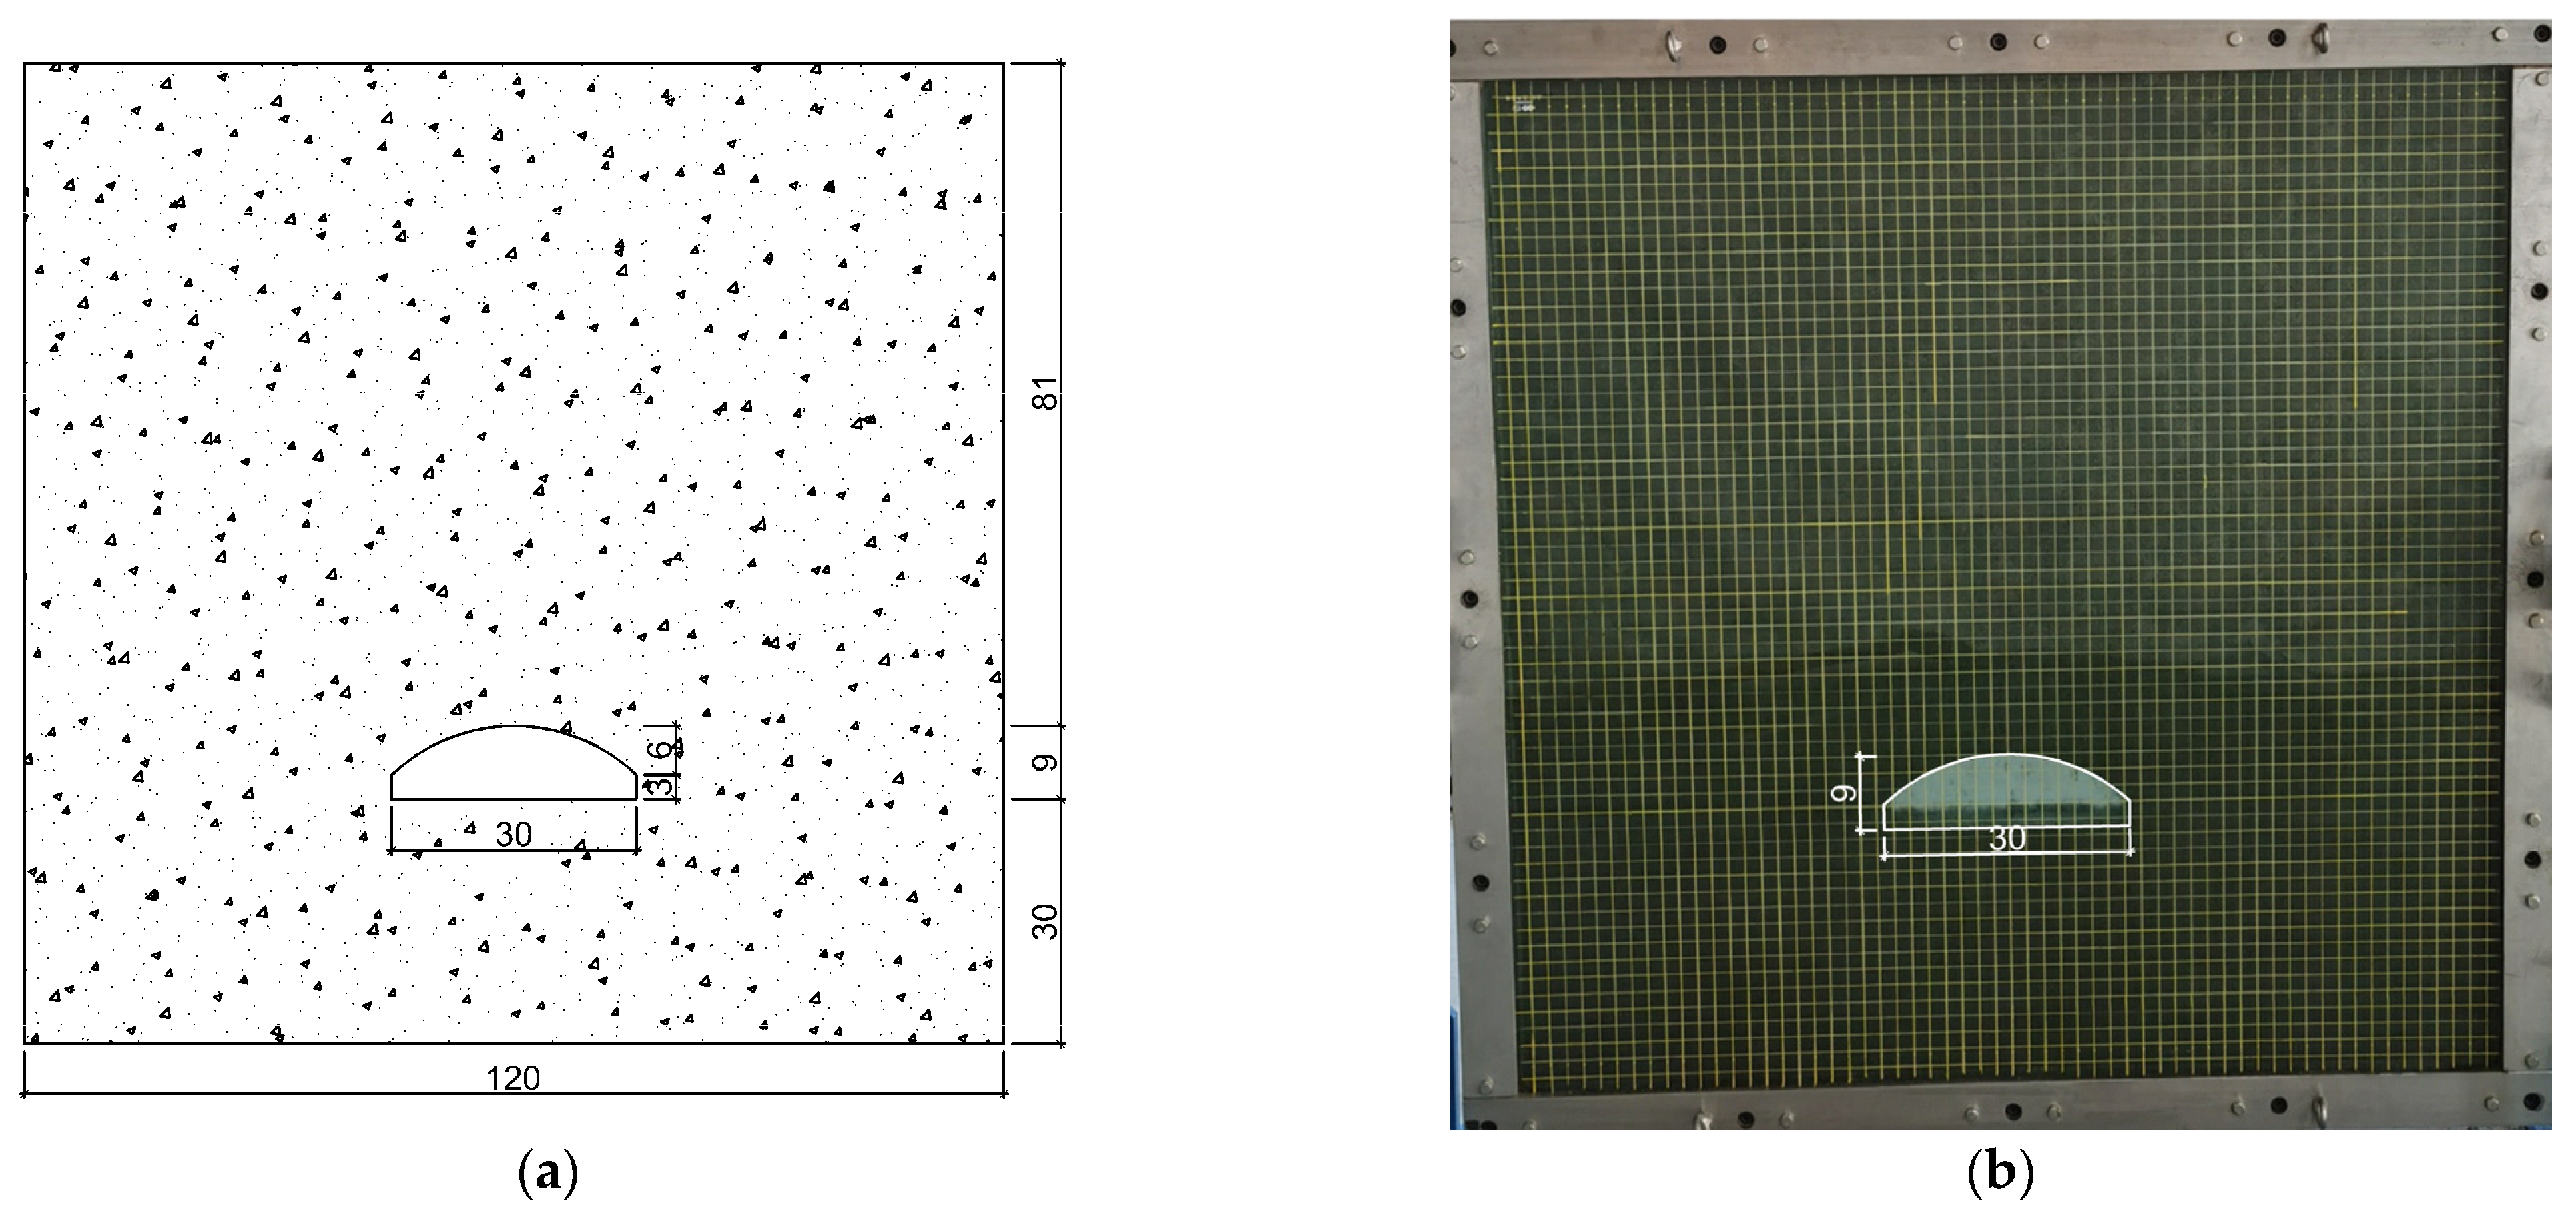
6.1. Model Test of 30 m-Span Cavern

Figure 8a presents the size diagram of the cavern model with a span of 30 m, while Figure 8b illustrates the progressive collapse process of the surrounding rock in a cavern with the same span. In small-span caverns, the stress concentration in the surrounding rock is relatively low, and the stress distribution at the top of the cavern is more even. The surrounding rock is able to bear stress well, thus leading to higher stability.

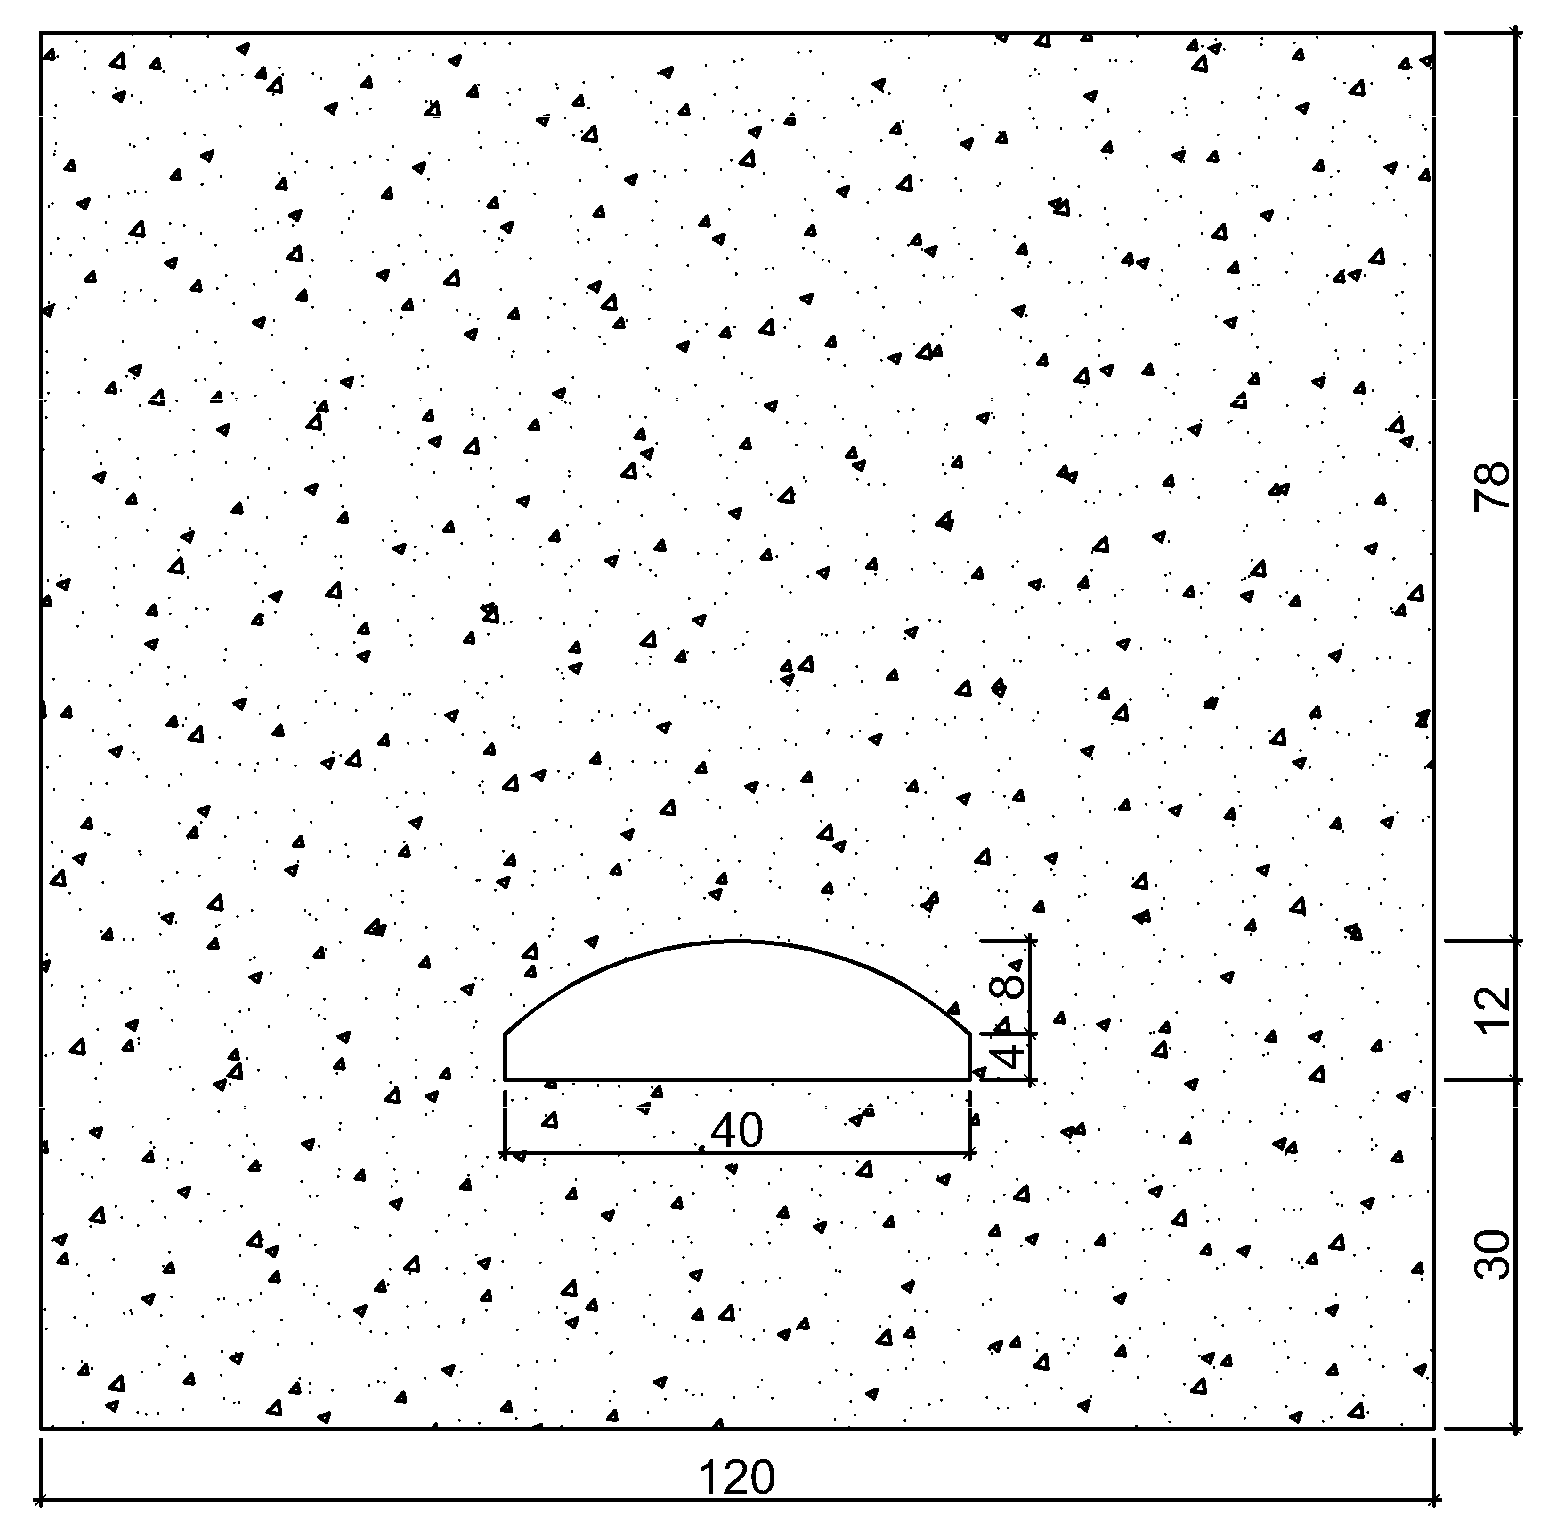
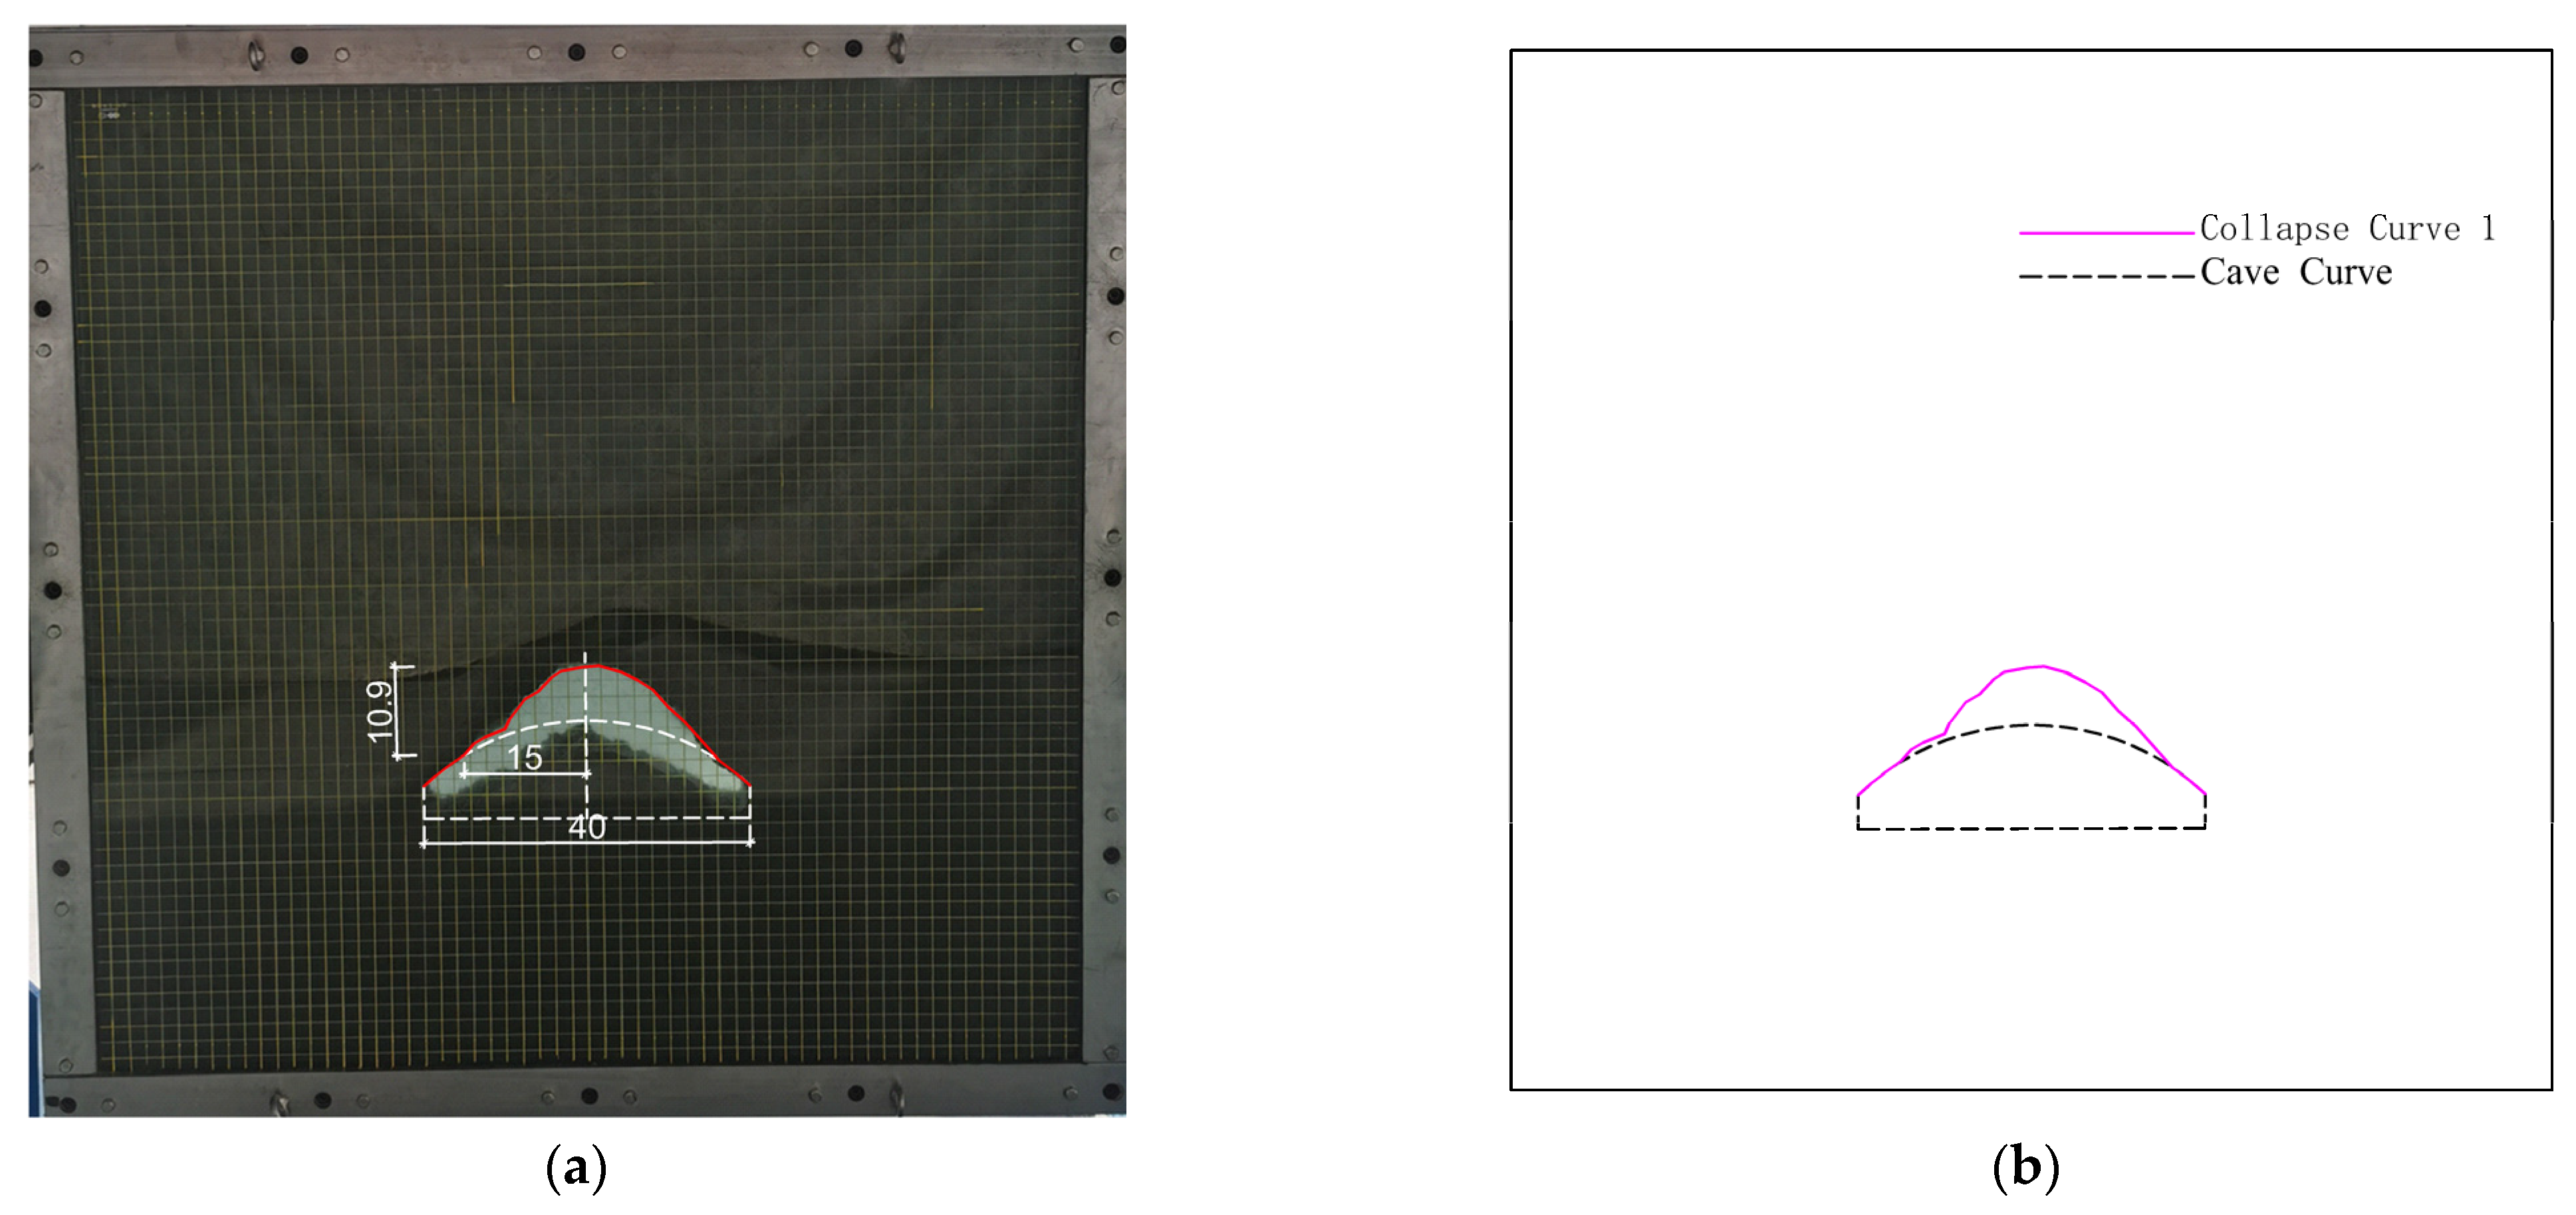
6.2. Model Test of 40 m-Span Cavern

Figure 9 presents the size diagram of the cavern model with a span of 40 m. Figure 10 illustrates the progressive collapse process of the surrounding rock in a cavern with the 40 m span. From Figure 10, it can be observed that the intermediary section of the vault in the cavern experienced its first collapse when the model was slowly rotated to 78°. After observing the model for 30 min of stability, no further collapse occurred, as shown in Figure 10a. At this point, the width of the collapsed mass was 15 cm, with a height of 10.9 cm. The height of the collapsed mass accounts for 27.25% of the span of the cavern. Subsequently, continuing the slow rotation of the model box to 90°, it can be observed that no collapse occurred in the surrounding rock of the cavern’s top after 78°, eventually forming a progressive collapse outline, as shown in Figure 10b.

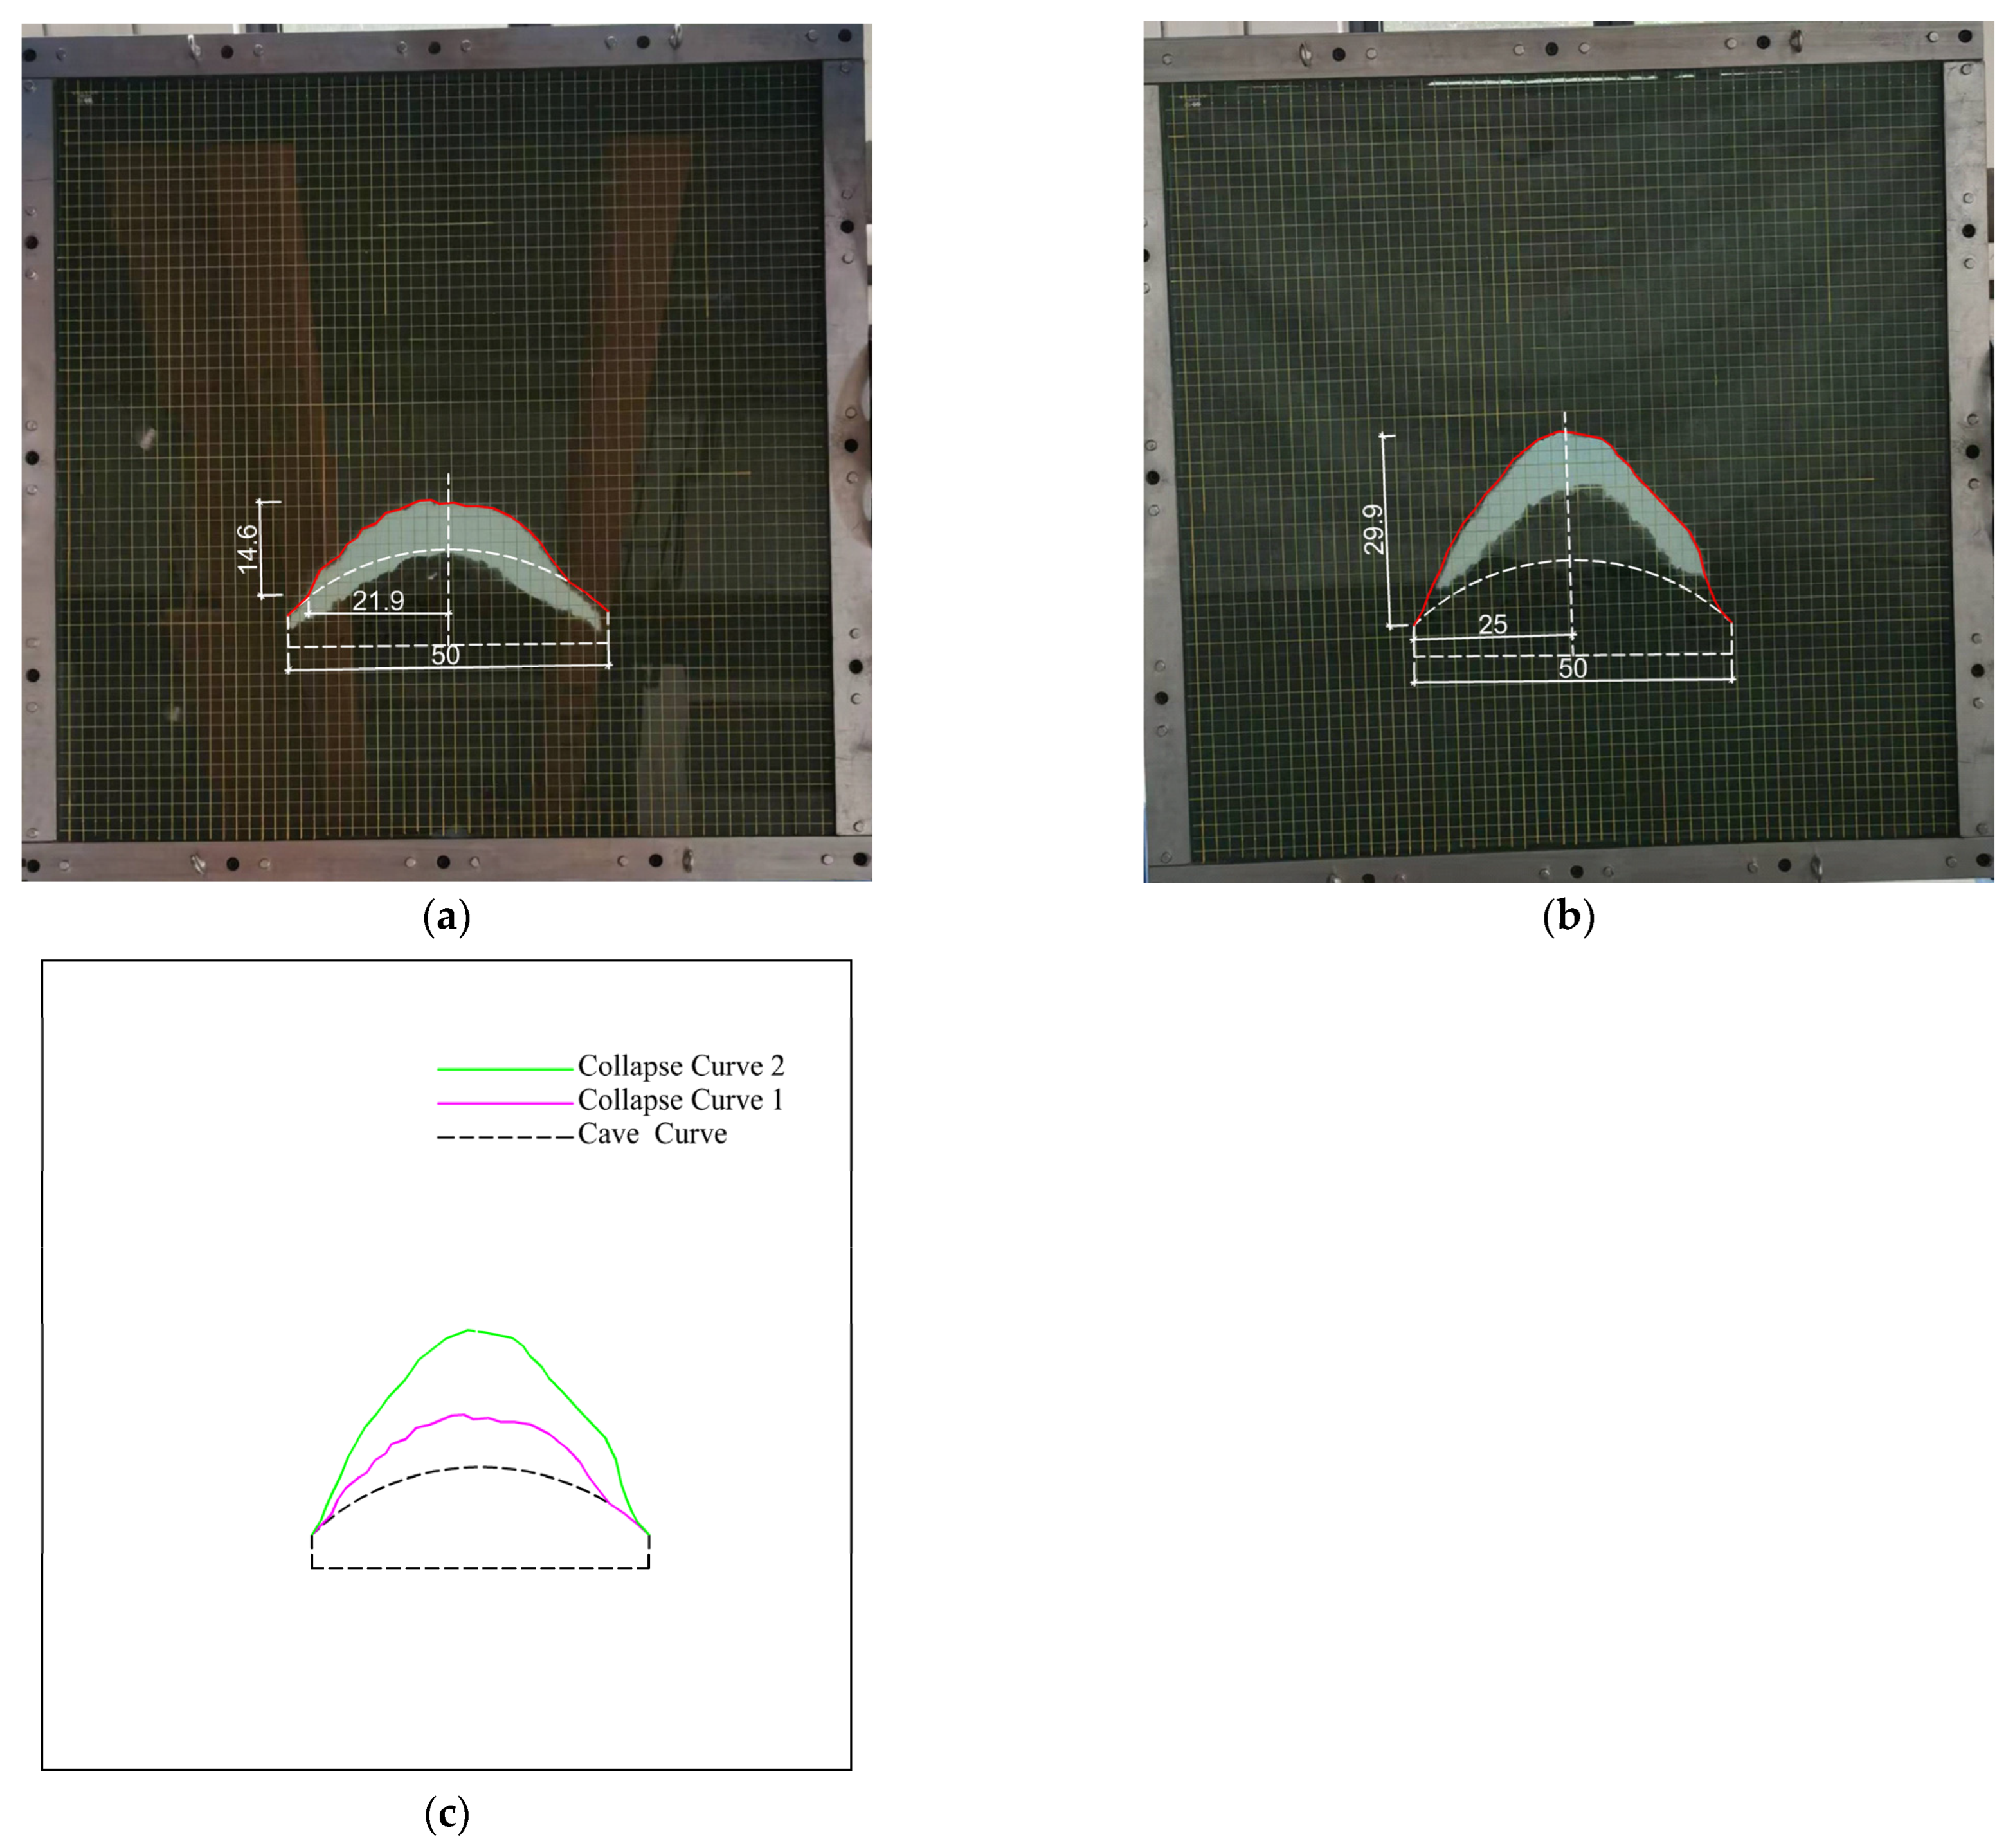
6.3. Model Test of 50 m-Span Cavern

Figure 11 presents the size diagram of the cavern model with a span of 50 m. Figure 12 illustrates the progressive collapse process of the surrounding rock in a cavern with the 50 m span.
From Figure 12, it can be observed that when the model slowly rotates to 67°, the intermediate portion of the cavern’s arch roof experiences the first collapse. After observing the model for 30 min without further collapses, as shown in Figure 12a, the width of the collapsed portion is 21.9 cm, and the height is 14.6 cm. The height of the collapsed portion is 29.2% of the cavern span.
Continuing the slow rotation of the model box, when the model rotates slowly to 82°, a second collapse occurs upward along the arch foot of the cavern, as shown in Figure 12b. At this time, the width of the collapsed portion is 25 cm, and the height is 29.9 cm. The height of the collapsed portion is 59.8% of the cavern span. After observing for 30 min without further collapses, continue to rotate the model box to 90°. No collapse occurs in the surrounding rocks, forming the final progressive collapse profile, as shown in Figure 10b.
The relationship between cavern span and collapse curve is detailed in Table 1. Through the comparison of stability model test results for cavern surrounding rocks with spans of 20 m, 30 m, 40 m, 50 m, and 60 m, it can be concluded that during the excavation process of small-span caverns, the stress release range of the surrounding rocks is relatively small, and the impact of stress redistribution on the surrounding rocks is minimal. Thus, the stability of the surrounding rocks is relatively easy to control. As the span of the cavern increases, the phenomenon of stress concentration becomes more pronounced. Significant stress concentration occurs at the intersection of the arch roof and the sidewalls of large-span caverns, making these areas prone to initiation of failure and multiple collapses. Non-uniform stress distribution increases the risk of local instability.
In the model test results, the reason the ground surface remains intact without collapsing is attributed to a combination of factors including the initial stress state of the rock mass, the structural plane orientation, and the mechanical properties of the rock. Specifically, as the span length increases, stress concentration at the arch roof and sidewalls of the cavern becomes more pronounced, leading to a higher propensity for failure and multiple collapses in these areas. Conversely, smaller-span caverns exhibit a more uniform stress distribution and a smaller stress release range, making the stability of the surrounding rock easier to manage. This phenomenon is corroborated with model tests of caverns with varying spans, where the 30 m-span model demonstrated higher stability, compared to the 60 m-span model that experienced three distinct collapses.

7. Conclusions

Based on the Hoek–Brown failure criterion and the upper limit theorem of limit analysis, this paper studies the progressive collapse mechanism of the surrounding rock of large-span caverns by means of theoretical analysis and model tests. The following conclusions are drawn:
(1)
The mechanism model of progressive collapse of large-span caverns is established, and the calculation method of the whole process curve of the progressive collapse of large-span caverns’ surrounding rock is deduced and compared with the model test results;
(2)
Using the self-developed geomechanical model device for visualizing large-span caverns with variable angles, the load on the top of the cavern is increased in a rotating manner, and the progressive collapse process of the surrounding rock of large-span caverns is revealed through the method of model tests;
(3)
Three collapses occurred in the 60 m large-span chamber. Due to the large span of the cavern, with an increase in surrounding rock pressure, the middle part of the vault roof will collapse first. When the overburden increases to a certain extent, the arch foot is the weakest part, and the rock mass will be found along the arch foot. Two shear failures will occur and gradually extend upward. Finally, the half-width of the collapse body will be 30 cm and the height will be 45.06 cm, which is 75.1% of the span of the cavern;
(4)
Through theoretical analysis and model tests, it was found that the large-span cavern model underwent collapse three times, and the collapse range calculated only once was quite different from the actual one. The theoretical calculation results in this paper are basically consistent with the model test results, verifying the rationality of the theoretical calculation and the model test for predicting the progressive collapse curve of the surrounding rock of the large-span cavern. The experimental method was used to obtain the progressive collapse characteristics and evolution processes of the surrounding rock of the large-span cavern, providing a basis for the selection of construction plans and the optimization of the supporting structure. It has certain guiding significance for the large-span cavern project;
(5)
Under the condition of rock mass and the shape of the cavern, the larger the span of the cavern, the more times the surrounding rock collapses. No collapse has occurred in the cavern with a span of 30 m, one collapse has occurred in the cavern with a span of 40 m, two collapses have occurred in the cavern with a span of 50 m, and three collapses have occurred in the cavern with a span of 60 m. Simultaneously, the collapse range also increases as the span increases;
(6)
Statement on Future Studies: The theoretical models and experimental results of this study lay the foundation for the excavation and support engineering of large-span caverns. Future work will focus on verifying these results under industrial conditions, ensuring practical applicability and enhancing the understanding of large span cavern stability.

Author Contributions

Conceptualization, H.C.; methodology, H.C.; software, H.C.; validation, H.C., J.F. and J.X.; formal analysis, H.C.; investigation, J.F.; resources, J.X.; data curation, H.C.; writing—original draft preparation, H.C.; writing—review and editing, H.C.; visualization, H.C.; supervision, J.X.; project administration, J.F.; funding acquisition, J.F. All authors have read and agreed to the published version of the manuscript.

Funding

This research received no external funding.

Institutional Review Board Statement

Not applicable.

Informed Consent Statement

Not applicable.

Data Availability Statement

The original contributions presented in the study are included in the article, further inquiries can be directed to the corresponding authors.

Conflicts of Interest

The authors declare no conflicts of interest.

References

  1. He, M.; Jing, H.; Sun, X. Soft Rock Engineering Mechanics; Science Press: Beijing, China, 2002. [Google Scholar]
  2. Cai, M.; He, M.; Liu, D. Rock Mechanics and Engineering; Science Press: Beijing, China, 2013. [Google Scholar]
  3. Fraldi, M.; Guarracino, F. Limit analysis of collapse mechanisms in cavities and tunnels according to the Hoek-Brown failure criterion. Int. J. Rock Mech. Min. Sci. 2009, 46, 665–673. [Google Scholar] [CrossRef]
  4. Fraldi, M.; Guarracino, F. Analytical solutions for collapse mechanisms in tunnels with arbitrary cross sections. Int. J. Solids Struct. 2010, 47, 216–223. [Google Scholar] [CrossRef]
  5. Fraldi, M.; Guarracino, F. Evaluation of impending collapse in circular tunnels by analytical and numerical approaches. Tunn. Undergr. Space Technol. 2011, 26, 507–516. [Google Scholar] [CrossRef]
  6. Yang, X.L.; Huang, F. Collapse mechanism of shallow tunnel based on nonlinear Hoek–Brown failure criterion. Tunn. Undergr. Space Technol. 2011, 26, 686–691. [Google Scholar] [CrossRef]
  7. Yang, X.L.; Yan, R.M. Collapse mechanism for deep tunnel subjected to seepage force in layered soils. Geomech. Eng. 2015, 8, 741–756. [Google Scholar] [CrossRef]
  8. Yang, X.L.; Xu, J.S.; Li, Y.X.; Yan, R.M. Collapse mechanism of tunnel roof considering joined influences of nonlinearity and non-associated flow rule. Geomech. Eng. 2016, 10, 21–35. [Google Scholar] [CrossRef]
  9. Yang, X.L.; Zhou, T.; Li, W.T. Reliability analysis of tunnel roof in layered Hoek-Brown rock masses. Comput. Geotech. 2018, 104, 302–309. [Google Scholar] [CrossRef]
  10. Yu, L.; Lü, C.; Wang, M. Three-dimensional upper bound limit analysis of deep soil tunnels based on nonlinear Mohr-Coulomb criterion. Chin. J. Geotech. Eng. 2019, 41, 1023–1030. [Google Scholar]
  11. Sun, C.; Lan, S.; Tao, Q.; Guan, X.; Han, X. Upper bound analysis of three-dimensional progressive collapse mechanism of deep tunnel roof with weak surrounding rock. Rock Soil Mech. 2023, 44, 2471–2484. [Google Scholar]
  12. Skrzypkowski, K.; Korzeniowski, W.; Zagórski, K.; Zagórska, A. Adjustment of the Yielding System of Mechanical Rock Bolts for Room and Pillar Mining Method in Stratified Rock Mass. Energies 2020, 13, 2082. [Google Scholar] [CrossRef]
  13. Korzeniowski, W.; Poborska-Młynarska, K.; Skrzypkowski, K. The Idea of the Recovery of Municipal Solid Waste Incineration (MSWI) Residues in Klodawa Salt Mine Sa by Filling the Excavations With Self-Solidifying Mixtures. Arch. Min. Sci. 2018, 63, 553–565. [Google Scholar]
  14. Wang, C. Study on the Progressive Failure Mechanism of the Surrounding Rock of Tunnel Constructed in Soft Rock. Ph.D. Dissertation, Tongji University, Shanghai, China, 2007. [Google Scholar]
  15. Zhu, H.; Huang, F.; Xu, Q. Model test and numerical simulation for progressive failure of weak and fractured tunnel surrounding rock under different overburden depths. Chin. J. Rock Mech. Eng. 2010, 29, 1113–1122. [Google Scholar]
  16. Xu, Q.; Ding, W.; Zhu, H.; Tang, Z.; Li, Y. Study on progressive unloading failure characteristics of superlarge tunnel in soft and weak rock mass. China Civ. Eng. J. 2017, 50, 104–114. [Google Scholar]
  17. Wei, X.; Duan, Y.; Qiao, N.; Feng, J. Causes and countermeasures of accidents related to underground construction in China. J. Tsinghua Univ. (Sci. Technol.) 2019, 59, 314–325. [Google Scholar]
  18. Chen, W.F. Limit Analysis and Soil Plasticity; Elsevier: Amsterdam, The Netherlands, 1975; pp. 85–96. [Google Scholar]
  19. Hoek, E.; Brown, E.T. Practical estimate the rock mass strength. Int. J. Rock Mech. Min. Sci. 1997, 34, 1165–1186. [Google Scholar] [CrossRef]
  20. Hoek, E.; Carranza-Torres, C.; Corkum, B. Hoek-Brown Failure Criterion; University of Toronto Press: Toronto, ON, Canada, 2002; pp. 267–273. [Google Scholar]
Figure 1. Caving mechanism diagram of a large-span cavern and surrounding rock.
Applsci 14 05929 g001
Figure 2. Solution of the progressive collapse curve of the surrounding rock of a large cavern.
Applsci 14 05929 g002
Figure 3. Model boundary size diagram, unit: cm.
Applsci 14 05929 g003
Figure 4. Model material strength envelope.
Applsci 14 05929 g004
Figure 5. Visualization of large-span cavern geomechanical model test device.
Applsci 14 05929 g005
Figure 6. Progressive collapse process diagram of large-span caverns, unit: cm. (a) The first collapse, where the angle of the model box is 61°; (b) the second collapse, where the angle of the model box is 74°; (c) the third collapse, where the angle of the model box is 85°; and (d) the progressive collapse profile.
Applsci 14 05929 g006
Figure 7. Comparison of model tests and theoretical calculations.
Applsci 14 05929 g007
Figure 8. The size diagram and collapse process diagram of a cavern model with a span of 30 m, unit: cm. (a) Model size diagram and (b) collapse process diagram, where the angle of the model box is 90°.
Applsci 14 05929 g008
Figure 9. Model size diagram of 40 m span cavern.
Applsci 14 05929 g009
Figure 10. Collapse process diagram, unit: cm. (a) The first collapse, where the angle of the model box is 78° and (b) progressive collapse profile.
Applsci 14 05929 g010
Figure 11. Model size diagram of 50 m span cavern.
Applsci 14 05929 g011
Figure 12. Collapse process diagram, unit: cm. (a) The first collapse, where the angle of the model box is 67°; (b) the second collapse, where the angle of the model box is 82°; and (c) the progressive collapse profile.
Applsci 14 05929 g012
Table 1. The relationship between cavern span and collapse curve.
CAVERN Span (cm)Number of CollapsesHalf Width of Falling Body (cm)Collapse Height (cm)
30000
4011510.9
5022529.9
6033045.1
Disclaimer/Publisher’s Note: The statements, opinions and data contained in all publications are solely those of the individual author(s) and contributor(s) and not of MDPI and/or the editor(s). MDPI and/or the editor(s) disclaim responsibility for any injury to people or property resulting from any ideas, methods, instructions or products referred to in the content.

