Article

Propagation Characteristics of Initial Compression Wave Induced by 400 km/h High-Speed Trains Passing through Very Long Tunnels

Gansu Province Engineering Laboratory of Rail Transit Mechanics Application Engineering, Lanzhou Jiaotong University, Lanzhou 730070, China
*
Author to whom correspondence should be addressed.
Appl. Sci. 2024, 14(13), 5946; https://doi.org/10.3390/app14135946
Submission received: 26 April 2024 / Revised: 24 June 2024 / Accepted: 24 June 2024 / Published: 8 July 2024
(This article belongs to the Special Issue New Insights into Railway Vehicle Dynamics)

Abstract

:

Featured Application

The research results provide a reliable basis for analyzing the initial compression wave propagation mechanism induced by 400 km/h high-speed trains entering very long tunnels while also evaluating the mitigation effect of the tunnel entrance hood on compression wave pressure gradients.

Abstract

When high-speed trains enter tunnels, an initial compression wave is generated. As the compression wave propagates at the local speed of sound to the tunnel exit, it radiates into the surrounding environment, forming micro-pressure waves (MPWs). MPWs create sonic booms, resulting in significant environmental issues. The magnitude of the micro-pressure waves is directly proportional to the pressure gradient of the compression wave at the tunnel exit. The nonlinear effects of the initial compression wave during propagation lead to a significant increase in pressure gradient. Therefore, the propagation characteristics of the initial compression wave during the tunnel are the crucial factor affecting the amplitude of MPWs. Based on the one-dimensional compressible unsteady non-isentropic flow model and the improved generalized Riemann variable characteristic method, this paper researched the propagation and evolution characteristics of an initial compression wave generated when 400 km/h high-speed trains enter tunnels with three portal shapes: (no tunnel entrance hood (no hood), an oblique, enlarged tunnel entrance hood (type A), an enlarged equal-section non-uniform opening hole tunnel entrance hood (type B)). The results show that when the initial compression wave propagates inside very long tunnels, the pressure gradient of the compression wave exhibits a trend of initially increasing and then decreasing with the increase in propagation distance. When the pressure gradient of the compression wave reaches its maximum value, the corresponding propagation distance is the steepening critical distance. For no tunnel entrance hoods, type A tunnel entrance hoods, and type B tunnel entrance hoods, the steepening critical distances are 5 km, 6 km, and 16 km, respectively. The steepening critical distance shortens with increasing train speed. Steady friction and unsteady friction effects mainly affect the pressure amplitude and pressure gradient during compression wave propagation, respectively. At lower ambient temperatures, the nonlinear effects in compression wave propagation are significantly enhanced. The mitigation effects of type A tunnel entrance hoods and type B tunnel entrance hoods on pressure gradient reduction are mainly concentrated within 4 km and 12 km, respectively. It is necessary to determine the optimal matching relationship between the tunnel entrance hood and tunnel length based on the characteristics of compression wave propagation to ensure their mitigating performance is maximized.

1. Introduction

High-speed railways, as crucial national infrastructure, play an irreplaceable role in economic development. As high-speed train speeds continue to increase, the aerodynamic problems of high-speed trains and tunnel aerodynamic effects become more significant [1]; hence, tunnel micro-pressure waves (MPWs) have become an urgent problem to be solved [2]. The generation of tunnel MPWs involves four processes: the formation of initial compression waves, the propagation and evolution of initial compression waves within the tunnel, the radiation of micro-pressure waves, and their transmission through the air to the receiving end outside the tunnel [3], viz., buildings or people. MPWs cause vibrations of doors and windows in buildings near the tunnel and produce sonic booms, creating a serious environmental noise problem that is hazardous to people’s physical and mental health [4]. The magnitude of the micro-pressure waves is directly proportional to the pressure gradient of the compression wave at the tunnel exit [5,6]. Therefore, reducing the pressure gradient is the main way to mitigate micro-pressure waves. At present, installing tunnel entrance hoods at the tunnel port [7,8,9,10,11,12,13] and optimizing the train head shape [14,15] are the main measures to mitigate micro-pressure waves, the basic principle of which is to extend the rise time of the initial compression wave pressure generated by the train entering the tunnel, viz., reducing the pressure gradient of the initial compression wave. Full-scale experimental measured data indicated [16] that when initial compression waves propagate in tunnels, the pressure gradient at the tunnel exit increases, sometimes even to several times the pressure gradient of the initial compression wave. Therefore, the evolutionary characteristics of the initial compression wave in the tunnel are the most crucial factors determining the magnitude of MPWs.
Japan’s Shinkansen cross-section area is relatively small compared to other countries, making it prone to micro-pressure wave issues. Therefore, Japan was the first country to begin researching such problems. Mashimo et al. [17] conducted field measurements to research the propagation characteristics of compression waves along Shinkansen slab track tunnels and ballast track tunnels, where the train speed was 215 km/h, slab track tunnels were 3409 m and 8488 m in length, and ballast track tunnels were 16,250 m in length. The study indicated that the pressure gradient increases during the propagation of compression waves in the slab track tunnels, while the pressure gradient of compression waves decreases in the ballast track tunnel. Fukuda et al. [18,19] and Miyachi et al. [20,21] conducted full-scale experimental research into the evolutionary characteristics of compression waves in tunnels, in which the train speed was 128~256 km/h and 271~342 km/h and the tunnels were 3.064 km, 26 km, and 9.7 km in length. The research shows that the compression wave pressure gradient and propagation process are reduced in the tunnels’ side branches. The train’s head shape, the train’s speed, and the form of the tunnel entrance hood all affected the propagation evolution process of the compression wave. After propagating through the very long tunnel, initial compression waves of similar pressure gradients but different waveforms will result in significant differences in the magnitude of micro-pressure waves at the tunnel exit. The German high-speed train tunnel cross-section area of 92 m2 is the largest in the world. Therefore, the problem of micro-pressure waves appeared later in Germany. During the first test of the German ICE on the Nuremberg–Ingolstadt high-speed railway line in 2005 [22], sonic boom phenomena occurred at the exits of the Euerwang (7700 m) tunnel and the Irlahüll (7260 m) tunnel. Upon analysis, the reason for this was the nonlinear steepening of the compression wave propagation process in slab track tunnels. Adami et al. [23] took data from a high-speed train entering the 7700 m Euerwang tunnel at 330 km/h for field analysis. The research showed that due to the compression wave propagation in the tunnel, the compression wave pressure gradient increased, but installing acoustical absorbers can inhibit steepening in the tunnel while also reducing the compression wave pressure amplitude. Wu et al. [24] conducted field tests to research the propagation characteristics of compression waves in Wuhan’s Guangzhou high-speed railway tunnels. The research shows that when the train speed is 200 km/h, there is no phenomenon of nonlinear steepening observed during the propagation of compression waves in the tunnel. Nakamura et al. [25] conducted experimental tests to investigate the influence of the unsteady boundary layer on the propagation characteristics of compression waves. The data obtained from full-scale experiments are the most accurate, but the cost is high; considering the limitations of completed lines and tunnels of high-speed trains, full-scale experiments could not achieve research on the propagation characteristics of initial compression waves under different tunnel entrance hoods for high-speed trains of 400 km and above. Okubo et al. [26] and Wang et al. [27] used one-dimensional theory to investigate the evolutionary characteristics of the initial compression waves. The research findings indicate that the propagation characteristics of compression waves not only depend on the pressure amplitude and maximum pressure gradient of the initial compression waves but also rely on the waveform of the initial compression waves. Iyer et al. [28] determined the critical tunnel length for different train velocities and friction coefficients based on the steepening rate, which is important for the study of compression wave propagation. Wang et al. [29] investigated the formation and propagation of weak shock waves. The results show that the formation distance of the weak shock wave decreases with the increase in the maximum pressure gradient of the initial compression wave.
The propagation of compression waves in short tunnels can be addressed using three-dimensional simulation methods, but with high computational costs and demanding requirements [30]. In studies of the propagation of compression waves within very long tunnels, the one-dimensional flow model is commonly chosen, which can provide accurate numerical simulation results and high computational efficiency [31,32]. The one-dimensional flow model requires reasonable initial compression wave waveforms provided by a full-scale experimental or three-dimensional flow model. We used the initial compression wave waveform as the entrance boundary condition for the one-dimensional flow model. The unsteady friction model is crucial for the numerical simulation of the propagation process of initial compression waves. Zielke [33] and Vardy et al. [34] have made outstanding contributions to the unsteady friction model. In 1968, Zielke proposed a weighted function model applicable to laminar transient flows. In 1975, Trikha [35] proposed an approximate expression for the original weighted function to reduce the computational time of Zielke’s transient friction model. In 1995, Vardy et al. extended Zielke’s laminar transient friction model to high Reynolds number transient flows. In 2002, Vardy et al. [36] researched the propagation characteristics of compression waves based on the transient friction model. In 2004, Vardy et al. [37] proposed a transient friction model for fully rough pipe flows. In 2002, Mohamed et al. [38] discovered an accurate method to approximate the Vardy–Brown transient friction model. The research indicated that approximate methods provided higher computational efficiency and better accuracy. Therefore, this paper adopts Mohamed’s transient friction model.
Based on the one-dimensional compressible unsteady non-isentropic flow model and an improved method of characteristics, the propagation and evolution characteristics of the initial compression wave generated when a 400 km/h high-speed train enters very long tunnels are studied in this paper. Firstly, a detailed introduction to the control equations of the one-dimensional model and numerical computation methods is provided in Section 2. The accuracy of the theoretical approach is evaluated through comparison with full-scale experimental data. Three unsteady friction models are compared in Section 3. The remainder of this paper is an analysis of the initial compression wave propagation characteristics in very long tunnels and the influence factors in the propagation process. Finally, relevant conclusions are presented.

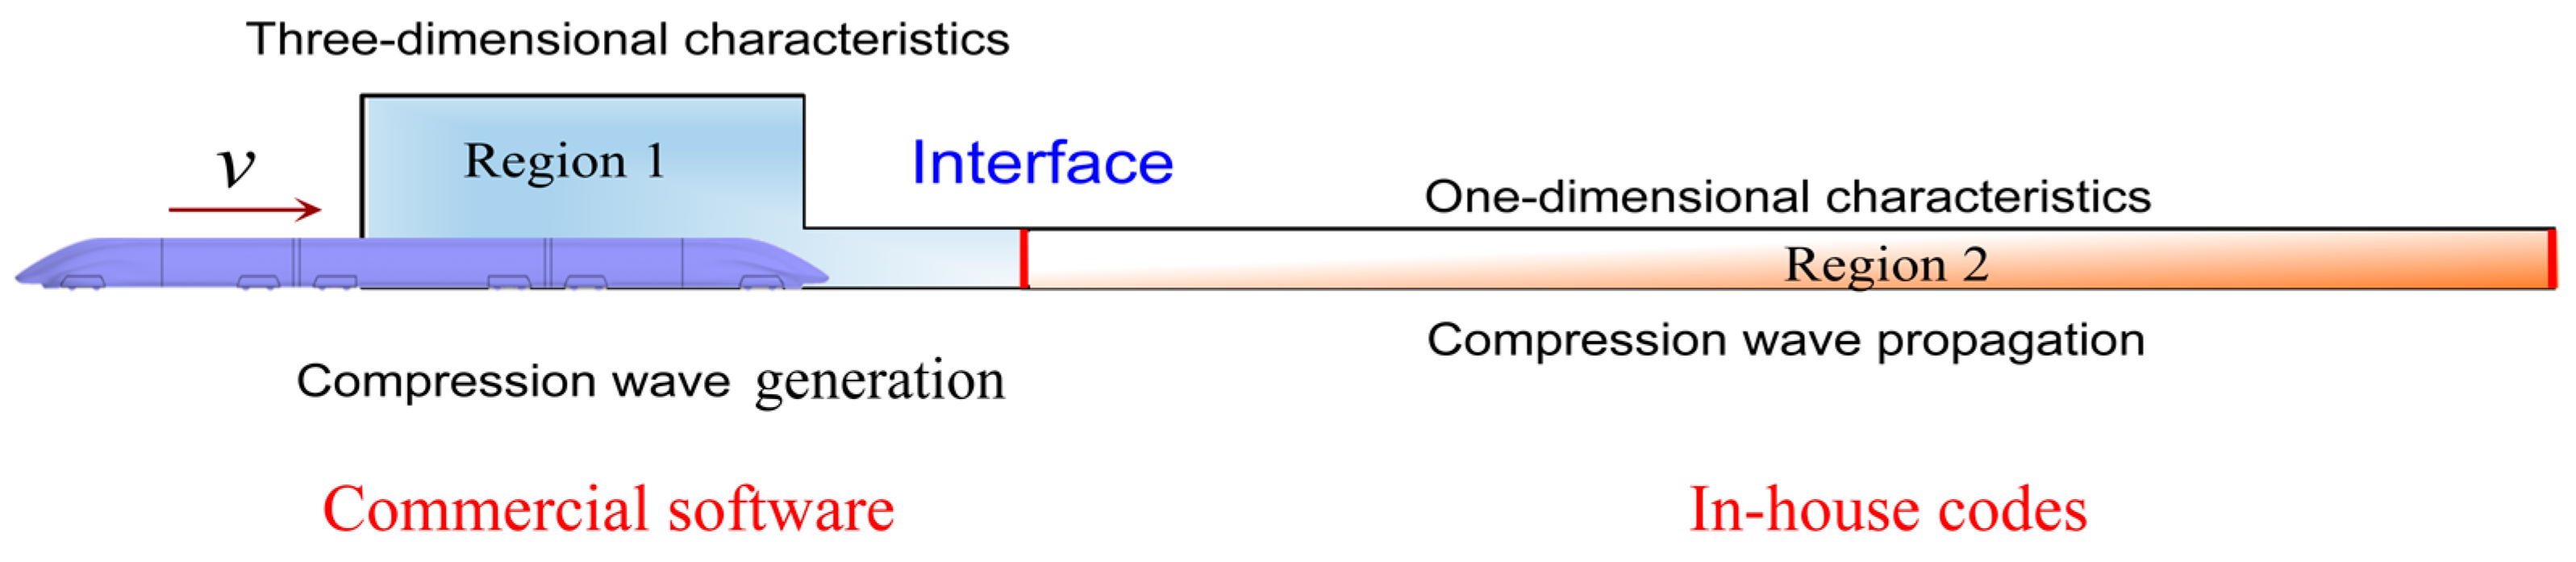
2. Theoretical Approach

2.1. Governing Equations

As the compression wave propagates at the local speed of sound to the tunnel exit, it induces unsteady turbulent boundary layer flow within the tunnel [39]. In the region where the initial compression wave passes through, air pressure and density change. When the tunnel length is much greater than the tunnel hydraulic diameter, and the time taken for the compression wave to reach the entire tunnel cross-section is much shorter than the propagation time along the length of the tunnel, the pressure fluctuations on the tunnel cross-section can be neglected. The pressure and airflow velocity on the tunnel cross-section can be considered uniformly distributed. Therefore, the airflow induced by the propagation of the compression wave can be reasonably simplified into a one-dimensional compressible unsteady flow model. The friction term and heat transfer term between the air and the tunnel wall are introduced into the momentum and energy equations, and the governing equations for the compression wave propagation process are derived using the laws of conservation of mass, momentum, and energy, which are specified as [4]:
Continuity equation:
ρ t + ρ u x + u ρ x = 0
Momentum equation:
u t + u u x + 1 ρ p x + G ( u ) = 0
Energy equation:
p t + u p x a 2 ( ρ t + u ρ x ) = ρ ( κ 1 ) ( q + u G ( u ) )
where ρ is the air density, u is the fluid velocity, a is the sound velocity, κ is the ratio of principal specific heat capacities, p is the pressure, q is the heat transfer term, and G(u) is the friction term.

2.2. Heat Transfer and Friction Terms

In Equations (1)–(3), the heat transfer term q mainly considers the convective heat transfer between the air and the tunnel wall. According to the Reynolds analogy method, the heat transfer term is defined as:
q = f 2 | u | C p ( T W T ) S F
where f is the Fanning friction coefficient for a steady flow, C p is the constant pressure specific heat capacity, T W is the tunnel wall temperature, T  is the air temperature in the tunnel, S is the tunnel cross-section perimeter, and F is the tunnel cross-section area.
Compression wave propagation in tunnels requires consideration of the friction between the airflow and the tunnel wall. The friction effect will cause viscous dissipation, resulting in attenuation of the compression wave amplitude and elongation of the waveform. Steady friction can reasonably calculate the pressure amplitude of the compression waves, but it cannot reflect the variation law of compression wave waveforms. This is mainly because steady friction theory calculates wall shear stress based on the average flow velocity and average acceleration, which does not correspond to the great friction resistance present in the near-wall region during transient flow. This steady friction leads to considerable errors in calculating the pressure gradient of compression wave propagation. Therefore, to accurately simulate the propagation process of compression waves, steady friction and unsteady friction terms must be considered.
There are several transient friction models, including Brunone’s instantaneous acceleration model, Zielke’s weighted transient friction model, and the weighted function model proposed by Mohamed et al. However, the presence of empirical coefficients k needs to be determined by a specific experiment in Brunone’s instantaneous acceleration model; k is related to the Reynolds number, which is a significant limitation in the application of the model. In 2002, Mohamed et al. [38] approximated the Vardy and Brown unsteady friction model by recursion after comparing and analyzing the results of the experiments. The approximated computational method has a higher computational efficiency and good accuracy, so this paper adopts the weighted function model, which has the specific expression of
G ( u ) = 2 f D u | u | + 4 D μ π ( 1 + κ 1 P r ) t u ( τ ) τ d τ t τ
The friction term G ( u ) [4,16,19,28,40] consists of steady friction 2 f D u | u | and unsteady friction
4 D μ π ( 1 + κ 1 P r ) t u ( τ ) τ d τ t τ
where μ is the dynamic viscosity coefficient, Pr is the Prandtl number, and D is the tunnel hydraulic diameter.

2.3. Initial and Boundary Conditions

In this paper, we take the proposed 400 km/h high-speed train’s head type and the 350 km/h railway tunnel cross-section parameters in China as the background for the research of initial compression wave propagation characteristics.
The aerodynamic geometric model of the train is depicted in Figure 1. The train model adopts the full-scale model of a certain type of China 400 km/h high-speed train. The train model reproduces (as much as possible) the real original body structure, including the bogie and windshield, and ignores devices such as pantographs, etc. The train cross-section area is 11.8 m2, the length of the train’s nose is 12 m, the tunnel cross-section area F is 100 m2, and the tunnel hydraulic diameter (D) is 10.64 m. The initial compression waves have three-dimensional characteristics within the near tunnel portal and become significantly one-dimensional characteristics after propagating a shorter distance. In this paper, the complete compression waveform at the measuring point 7D away from the tunnel portal is selected to research the evolution process.
This paper researches the propagation characteristics of the initial compression waves generated when a 400 km/h high-speed train enters a tunnel without installing the entrance hood (no hood), an oblique enlarged entrance hood (type A) tunnel, and an expanded equal section non-uniform opening hole entrance hood (type B) tunnel.
Figure 2 represents the schematic diagrams of the type of tunnel entrance hoods. The length of the oblique enlarged tunnel entrance hood is 26.8 m, and the maximum cross-sectional area is two times the tunnel area. The maximum open hole area of the tunnel entrance hood is 2.89 m2. The expanded equal section non-uniform opening hole tunnel entrance hood cross-sectional area is two times the tunnel cross-section area, and the tunnel entrance hood length is 80.0 m. Along the length of the tunnel entrance hood, the ventilation ratio gradually decreases; the area of each small hole in the tunnel entrance hood is 0.25 m2, the area of each large hole is 1.25 m2, and the ventilation ratio is 3.75%–0.25%.
Figure 3 presents the initial compression wave pressure and pressure gradient time history curves for the train entering the tunnel with no tunnel entrance hood and two different tunnel entrance hoods. Point a indicates that the pressure at the measuring point inside the tunnel begins to rise prior to the train entering the tunnel. The compression waves generated from the train’s nose and shoulder propagate to the measurement points, denoted as points a and c, respectively. Curves a,b, and c are defined as the initial compression waves. Without a tunnel entrance hood, the pressure of the initial compression waves increases rapidly, with a maximum pressure gradient of 18.50 kPa/s and a maximum pressure amplitude of 2.18 kPa. For the type A tunnel entrance hoods, the rate of pressure increase for the initial compression waves is slower compared to with no tunnel entrance hood. The maximum pressure gradient is 12.51 kPa/s, and the maximum pressure amplitude is 2.17 kPa. For the type B tunnel entrance hoods, the initial compression waves transition from a single pressure increase to two stepped increases, resulting in a pressure gradient waveform with two peaks. The maximum pressure gradient is 5.90 kPa/s, and the maximum pressure amplitude is 2.09 kPa. When using type A and type B tunnel entrance hoods, compared to no tunnel entrance hoods, their pressure gradient reduction rates are 32.38% and 68.11%, respectively. Therefore, installing a tunnel entrance hood can prolong the duration of pressure rise, consequently reducing the pressure gradient of the initial compression waves.
The initial condition for the one-dimensional flow model is the airflow velocity is zero, and standard atmospheric pressure is the initial pressure. The exit boundary conditions are defined as atmospheric boundary conditions. In light of this, the research idea of our team was to use different methods to solve different regions according to the generation process of micro-pressure waves. As shown in Figure 4, for the initial compression wave generation stage, based on the IDDES SST k ω turbulence model, a three-dimensional numerical model was used to transiently simulate the initial compression wave induced by a 400 km/h high-speed train entering a tunnel. As the compression waves transition from three-dimensional characteristics to one-dimensional plane waves, the initial compression wave propagation process in tunnels of different lengths is simulated by a one-dimensional compressible unsteady non-isentropic flow model. Here, we select the waveform of the compression waves at the 7D (one-dimensional characteristics) measurement point as the entrance boundary conditions for the one-dimensional model.
The improved MOC utilizes the initial conditions to determine the flow parameters on the initial time (Z0). In the improved MOC, the Riemann variables, known at Z time grid points, cannot determine the Riemann variables at the boundary points for the Z + ∆Z time. Utilizing boundary conditions enables the computation of the Riemann variable at boundary points. The reasonableness of the boundary conditions directly affects the accuracy of the numerical computation results. Additionally, for both the basic MOC and the improved MOC, the roles of the initial conditions and boundary conditions are the same.

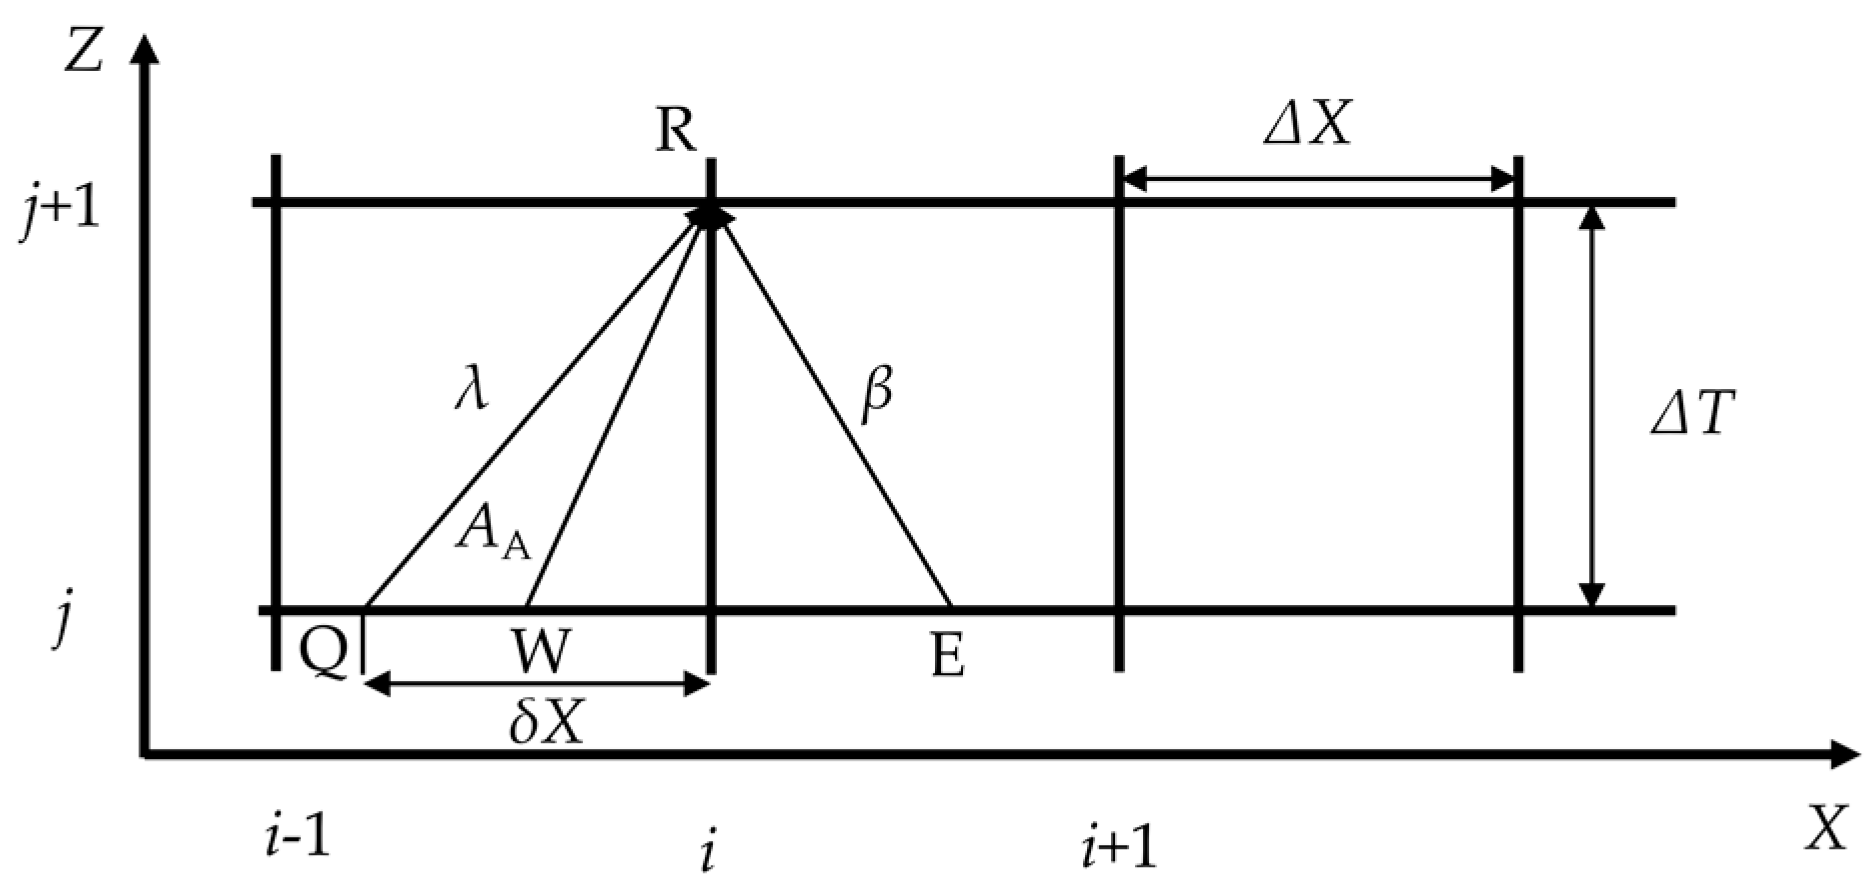
2.4. Numerical Calculation Approach

Equations (1)–(3) constitute a system of first-order quasilinear partial differential equations. The solution methods have the finite difference method, the finite volume method, and the method of characteristics (MOC). The MOC is a widely used approach in the study of flow in pipes and the propagation of transience [28]. The MOC has good computational accuracy, and introducing Riemann variables makes the computation process simple and convenient. The MOC has numerous applications for pressure waves of high-speed railway tunnels [4,41]. According to the theory of characteristics, the system of partial differential equations is transformed into characteristic line equations for each characteristic line. The dimensionless form of the characteristic line equation is as follows [4]:
(1)
λ characteristic line
Characteristic direction:
d X d Z = U + A
Characteristic equation:
d λ = δ λ A A + δ λ f + δ λ h
(2)
β characteristic line
Characteristic direction:
d X d Z = U A
Characteristic equation:
d β = δ β A A + δ β f + δ β h
(3)
A A characteristic line
Characteristic direction:
d X d Z = U
Characteristic equation:
d A A = δ A A f + δ A A h
where the subscripts A A , f , and h denote the effect of entropy, friction, and heat transfer, respectively. The specific expressions are given below as follows:
δ λ A A = δ β A A = λ + β 2 d A A A A
δ λ f = 1 κ 2 [ 1 2 λ β λ + β ] l R a R 2 G ( u ) d Z
δ β f = κ 1 2 [ 1 + 2 λ β λ + β ] l R a R 2 G ( u ) d Z
δ λ h = δ β h = ( κ 1 ) 2 λ + β q ω a R 3 l R d Z
δ A A f = 2 ( λ β ) ( λ + β ) 2 a R 2 G ( u ) d Z
δ A A h = 2 ( κ 1 ) ( λ + β ) 2 q ω a R 3 l R d Z
where λ , β , and A A are generalized Riemann variables. The MOC equations, A , U , X , and Z are the dimensionless speed of sound, the dimensionless velocity of airflow, dimensionless length, and dimensionless time, respectively, defined as:
A = a a R ,   U = u a R ,   X = x l R   Z = a R t l R
where a R is the reference speed of sound and l R is the reference length.
In the numerical computation process using MOC, the computational grid is first determined, and then linear interpolation is used to solve the flow parameters at the grid points. Since the characteristic line is a curve with a changing slope, it will bring large errors to the numerical calculation of the pressure gradient of the compression waves in the process of propagation evolution due to the accuracy of linear interpolation, so in order to improve the accuracy of the MOC with regard to the linear interpolation of the mesh, it is necessary to improve the MOC [42]. This paper used the modified iterative algorithm as an improved MOC. The determination of the interpolation points in the improved MOC is illustrated in Figure 5. To optimize the accuracy of interpolation, it is necessary to correct the position δX of the interpolation points. Based on the previously determined λ, β, and AA values at point R, we recalculated the positions δXQ, δXW, and δXE of points Q, W, and E, respectively, using the following equations:
[ δ X Q δ X W δ X E ] = 1 2 [ ( U + A ) Q + ( U + A ) R U W + U R ( U A ) E + ( U A ) R ] Δ Z
[ δ X Q δ X W δ X E ] = [ ( U + A ) i , j + ( U + A ) i , j + 1 2 Δ Z [ ( U + A ) i 1 , j + ( U + A ) i , j ] Δ X U i , j + U i , j + 1 2 Δ Z [ U i 1 , j U i , j ] 1 Δ X ( U A ) i , j + ( U A ) i , j + 1 2 Δ Z [ ( U A ) i + 1 , j ( U A ) i , j ] Δ X ]
Using the recalculated values of δXQ, δXW, and δXE at the three points, we recomputed the λ, β, and AA values at point R. We repeated the iterative calculation with multiple corrections using the same method until the accuracy requirements of the numerical simulation results were satisfied.
[ λ R λ Q β R β E A A R A A W ] = [ [ ( δ λ ) e + ( δ λ ) f + ( δ λ ) h ] Q + [ ( δ λ ) e + ( δ λ ) f + ( δ λ ) h ] R [ ( δ β ) e + ( δ β ) f + ( δ β ) h ] E + [ ( δ β ) e + ( δ β ) f + ( δ β ) h ] R [ ( δ A A ) f + ( δ A A ) h ] W + [ ( δ A A ) f + ( δ A A ) h ] R ] Δ Z
In summary, the improved MOC first employs linear interpolation to determine the interpolation points, then computes the Riemann variables at the next time grid points, and finally repositions the interpolation points based on the Riemann variables [42]. This process is iterated multiple times using the same method until the accuracy requirements of the numerical simulation results are satisfied. The basic MOC [4,28,43,44] only adopts linear interpolation to determine the interpolation points without undergoing repeated iterative calculations.
Figure 6 shows the computational flowchart of the one-dimensional flow model. The grid size (Δx) of 1 m is adopted for numerical computations in this manuscript, while the corresponding time-stepping is determined based on the CFL condition.

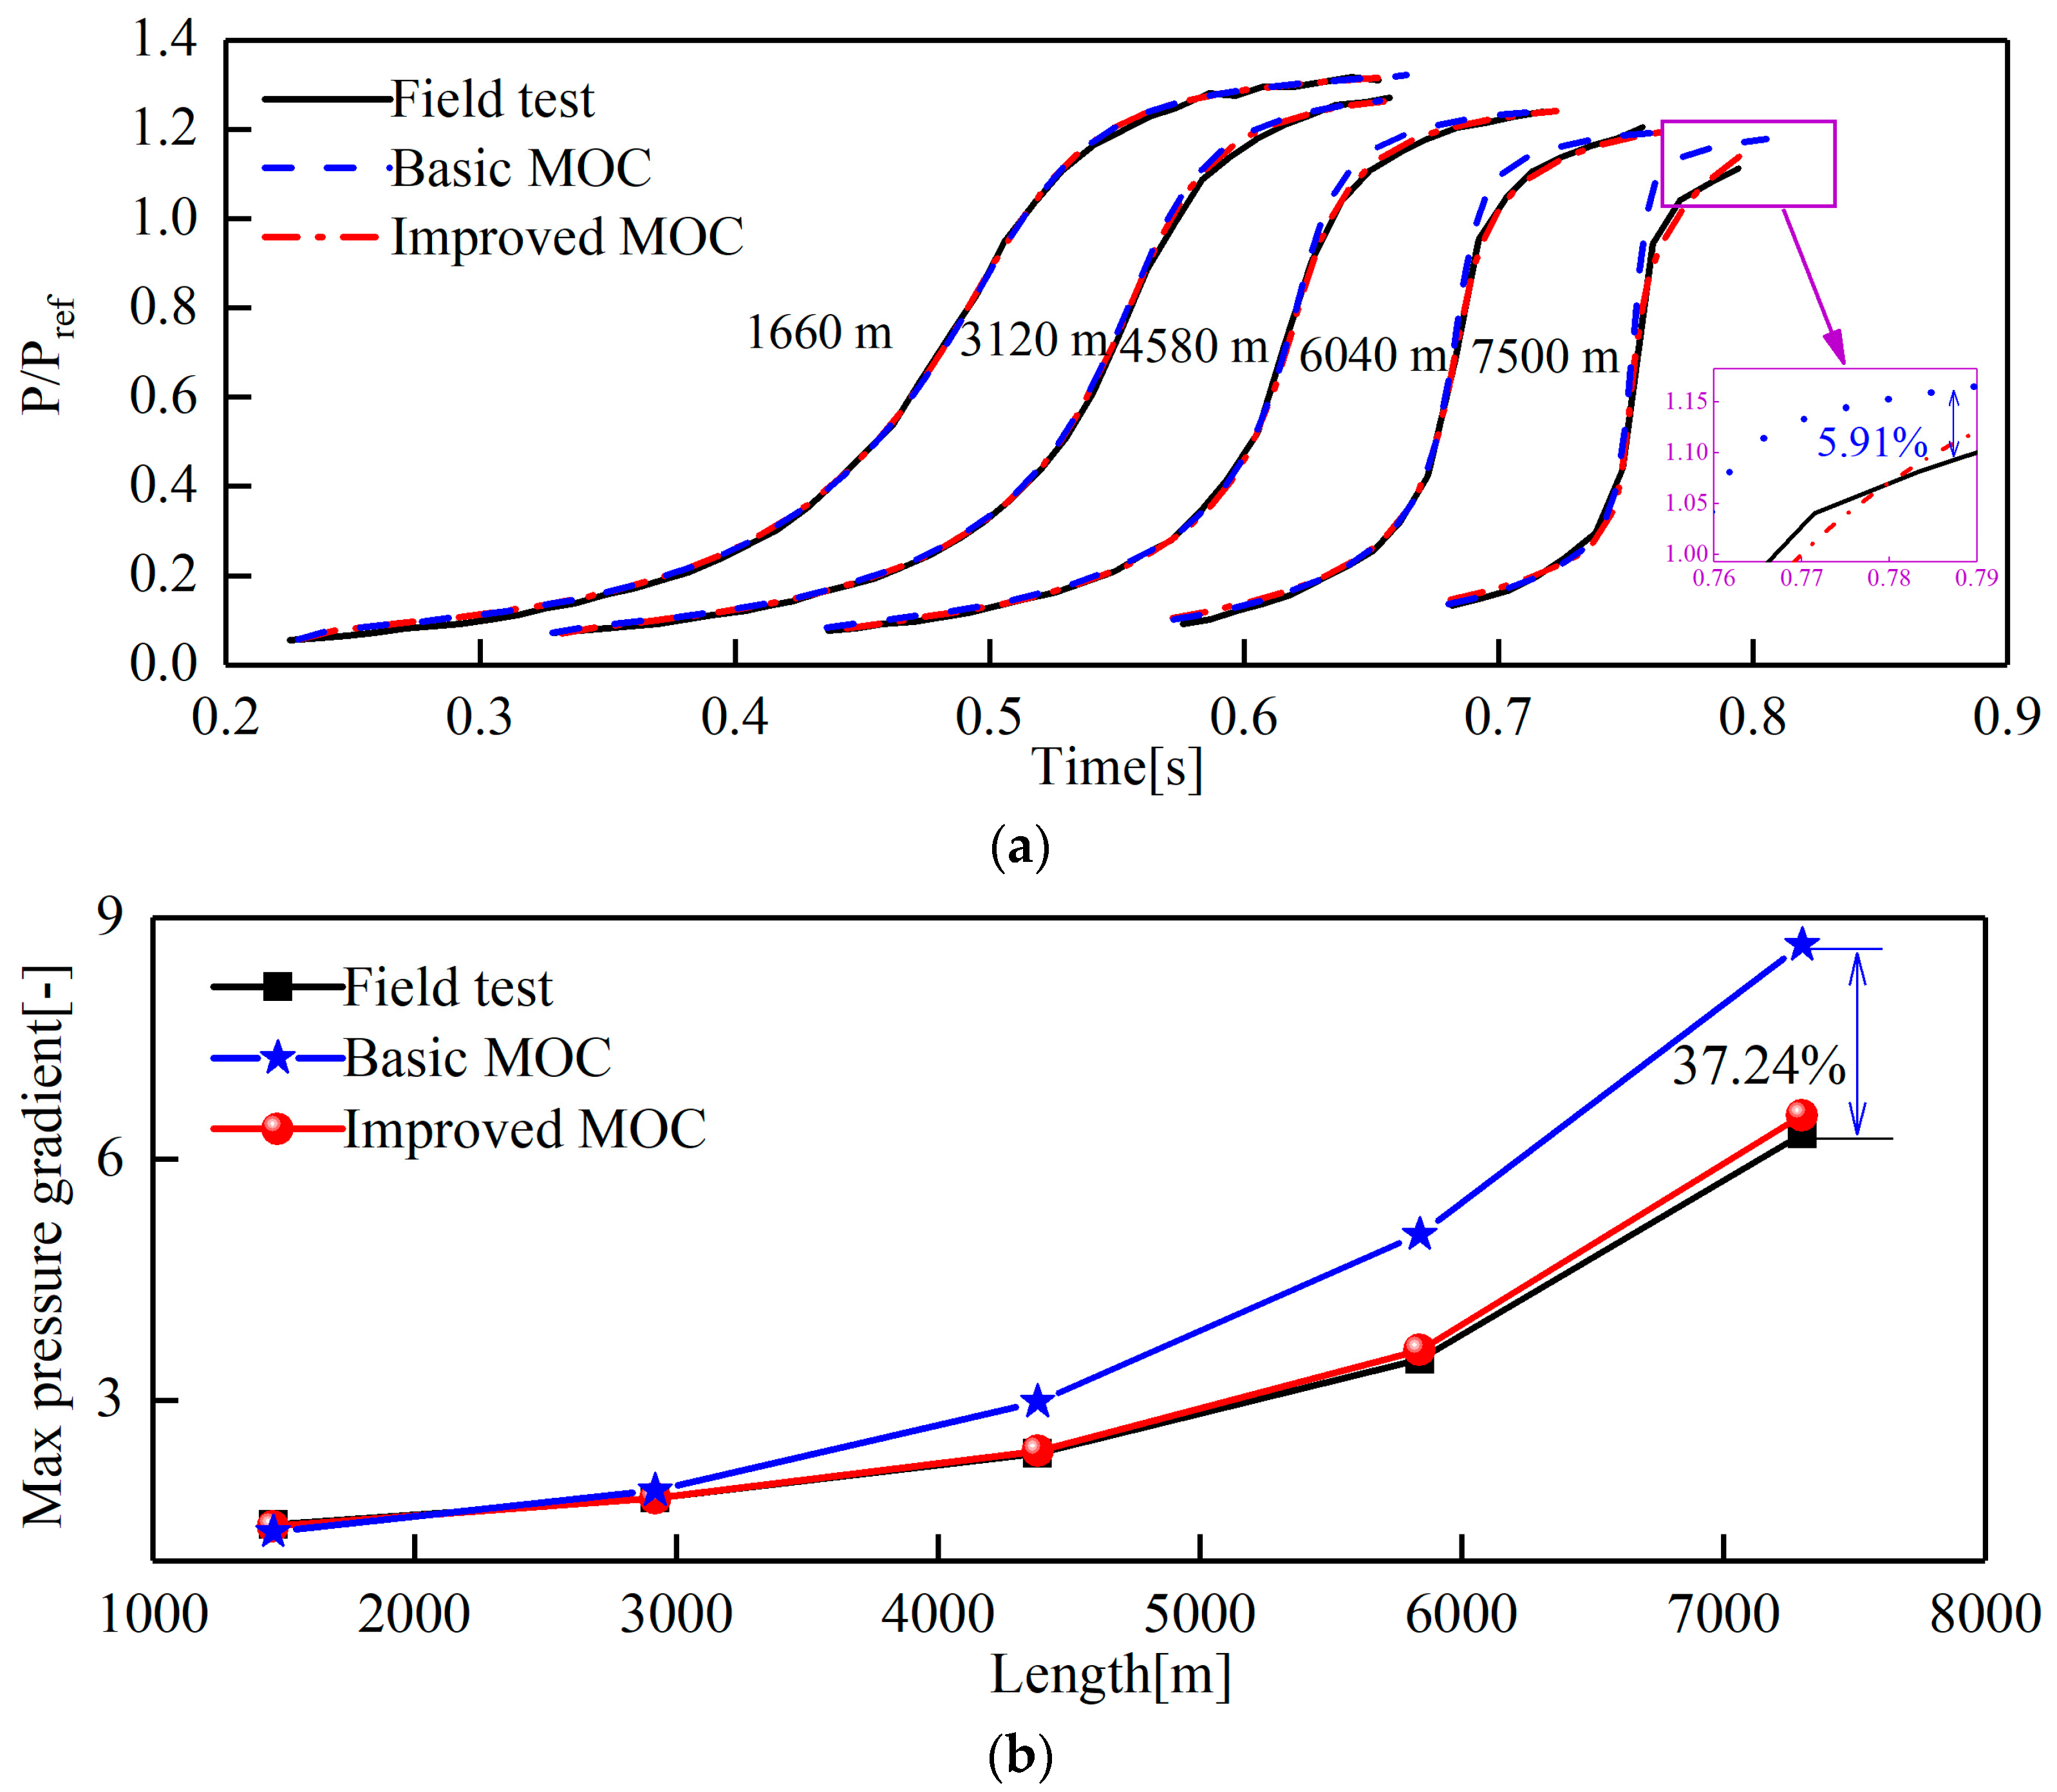
2.5. Validation of the Numerical Approach

The field test data from China [45], the full-scale experimental data of the Shinkansen from Japan [18], and the measured data of the Eurwang Tunnel from Germany [23] were used to verify the computational accuracy and reasonableness of the results of the one-dimensional compressible nonconstant unequal entropy flow model and improved MOC in this paper.
Figure 7 presents the validation results of the measured data and numerical calculations of the compression waveform at the 2600 m tunnel measurement point. The tunnel cross-section area is 100 m2. The tunnel length is 2800 m. The error between the numerical results of the basic MOC and the measured data is 1.60%. This literature does not provide measured data for the pressure gradient, and further validation work needs to be completed.
A comparison of the waveforms and pressure gradients of the compression waves at the Japanese Shinkansen tunnel measurement point at 2864 m is given in Figure 8. The cross-section area of the tunnel is 63.4 m2. The tunnel length is 3064 m. The numerical results of the improved MOC are the same as the measured data in the pressure gradient. The errors in the compression wave amplitude and pressure gradient of the basic method numerical calculation results are 2.37% and 7.08%, respectively.
A comparison of the measured and calculated compression waveforms and pressure gradients for the Germany Eurwang Tunnel is presented in Figure 9. Eurwang Tunnel’s length is 7700 m. The tunnel cross-section area is 92 m2. The measuring points were set at 1660 m, 3120 m, 4580 m, 6040 m, and 7500 m from the tunnel entrance, respectively. The waveforms numerically calculated by the improved MOC are basically exactly coincident with the measured data, and the errors of the pressure gradients are all within 5%. The basic MOC has large errors, with maximum errors of 5.91% and 37.24% for the compression wave amplitude and pressure gradient, respectively.

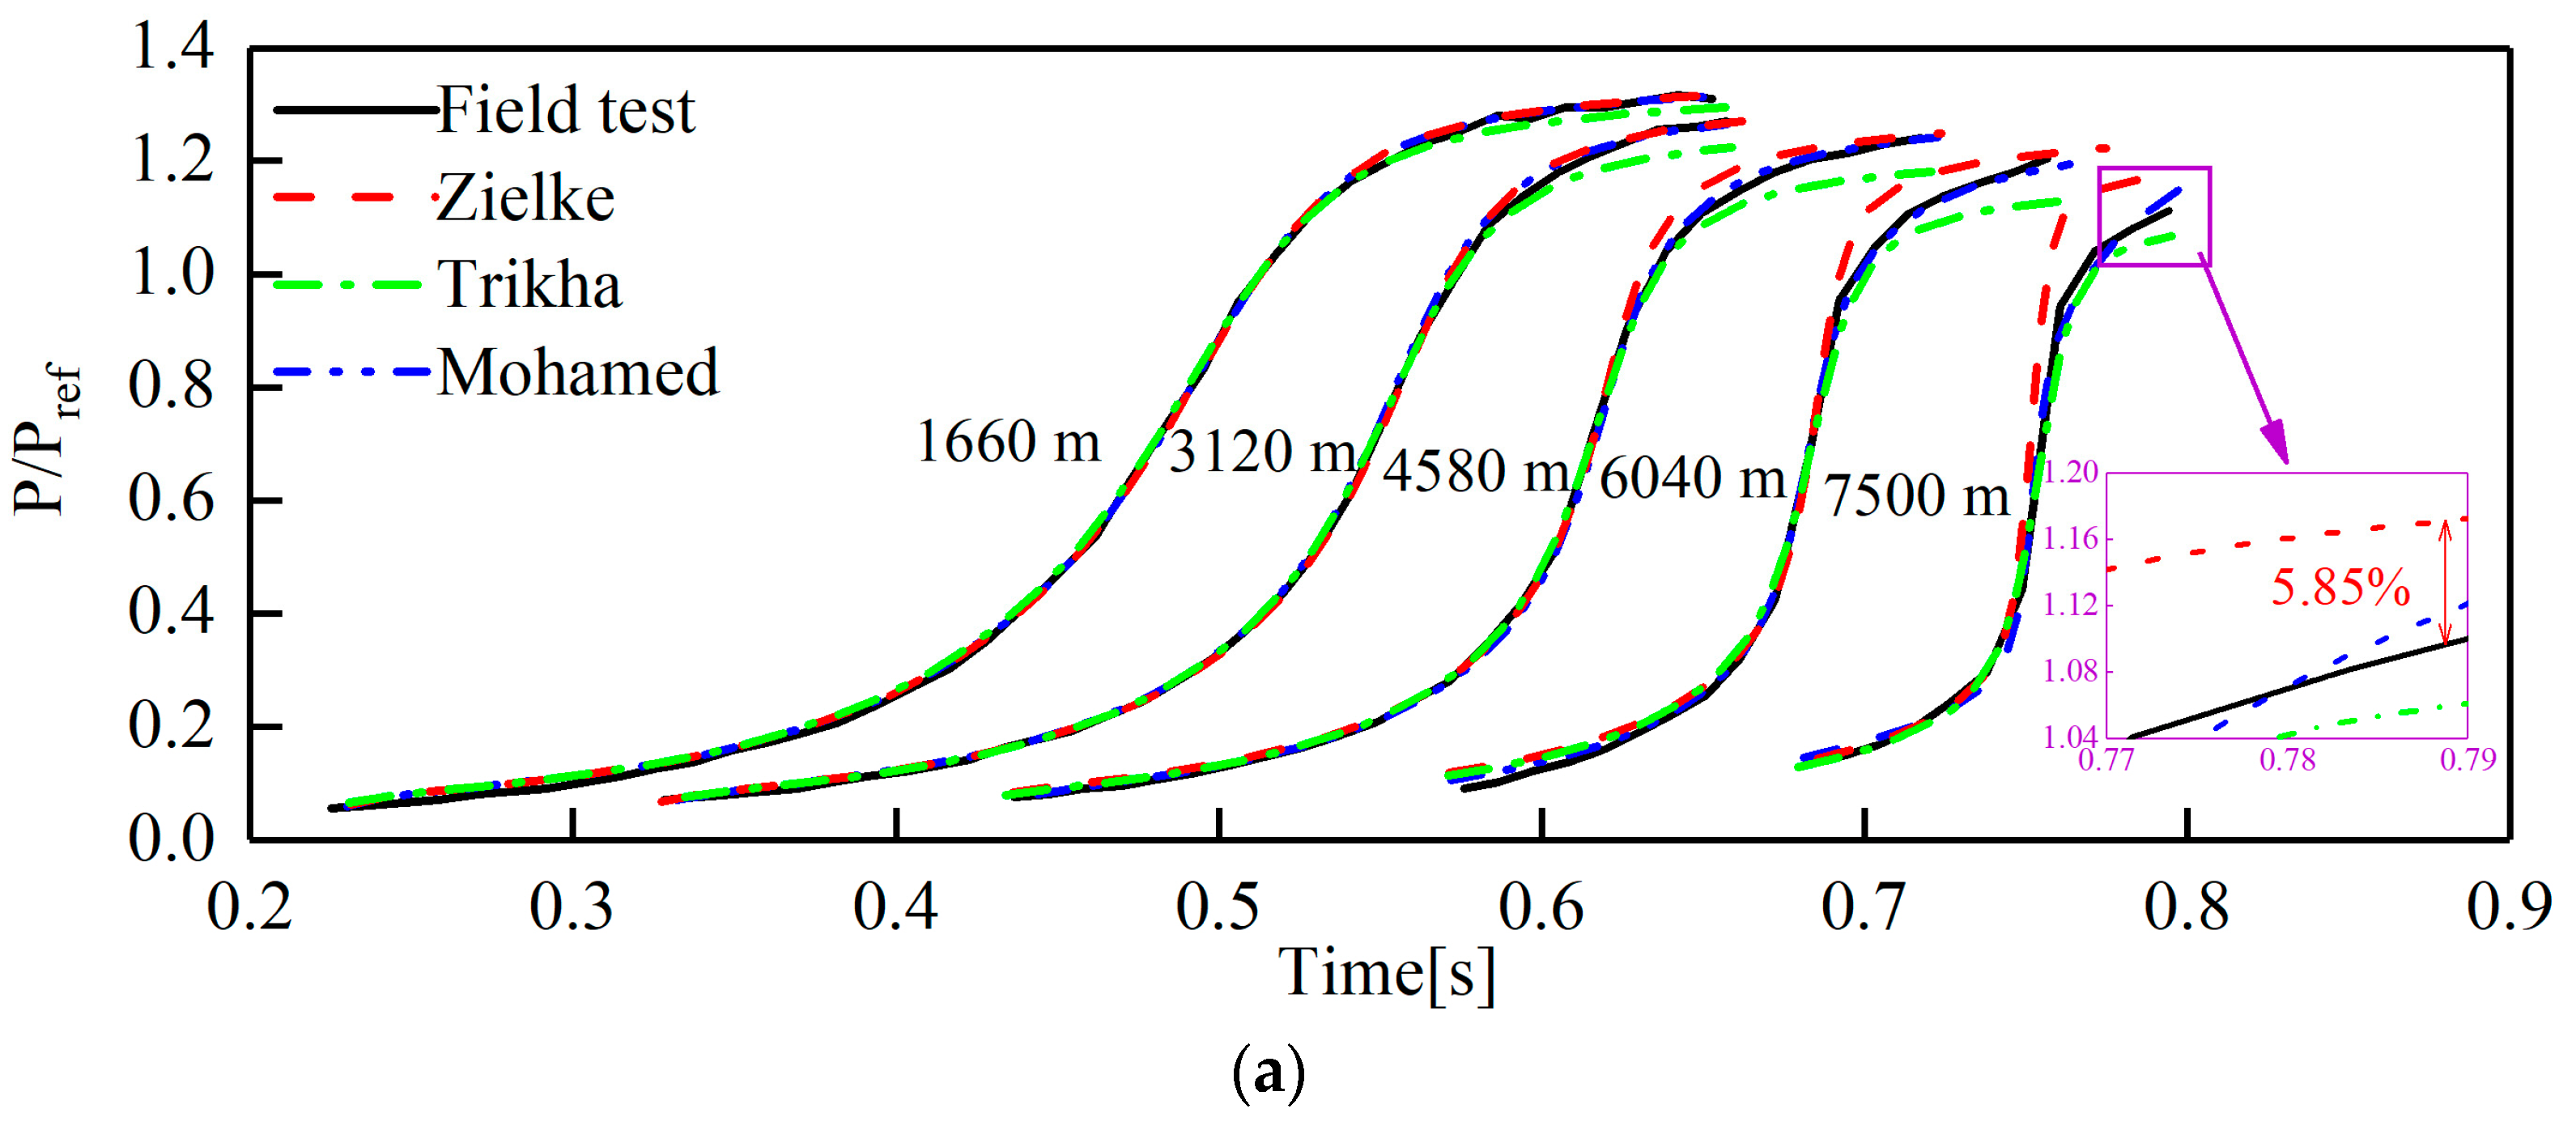
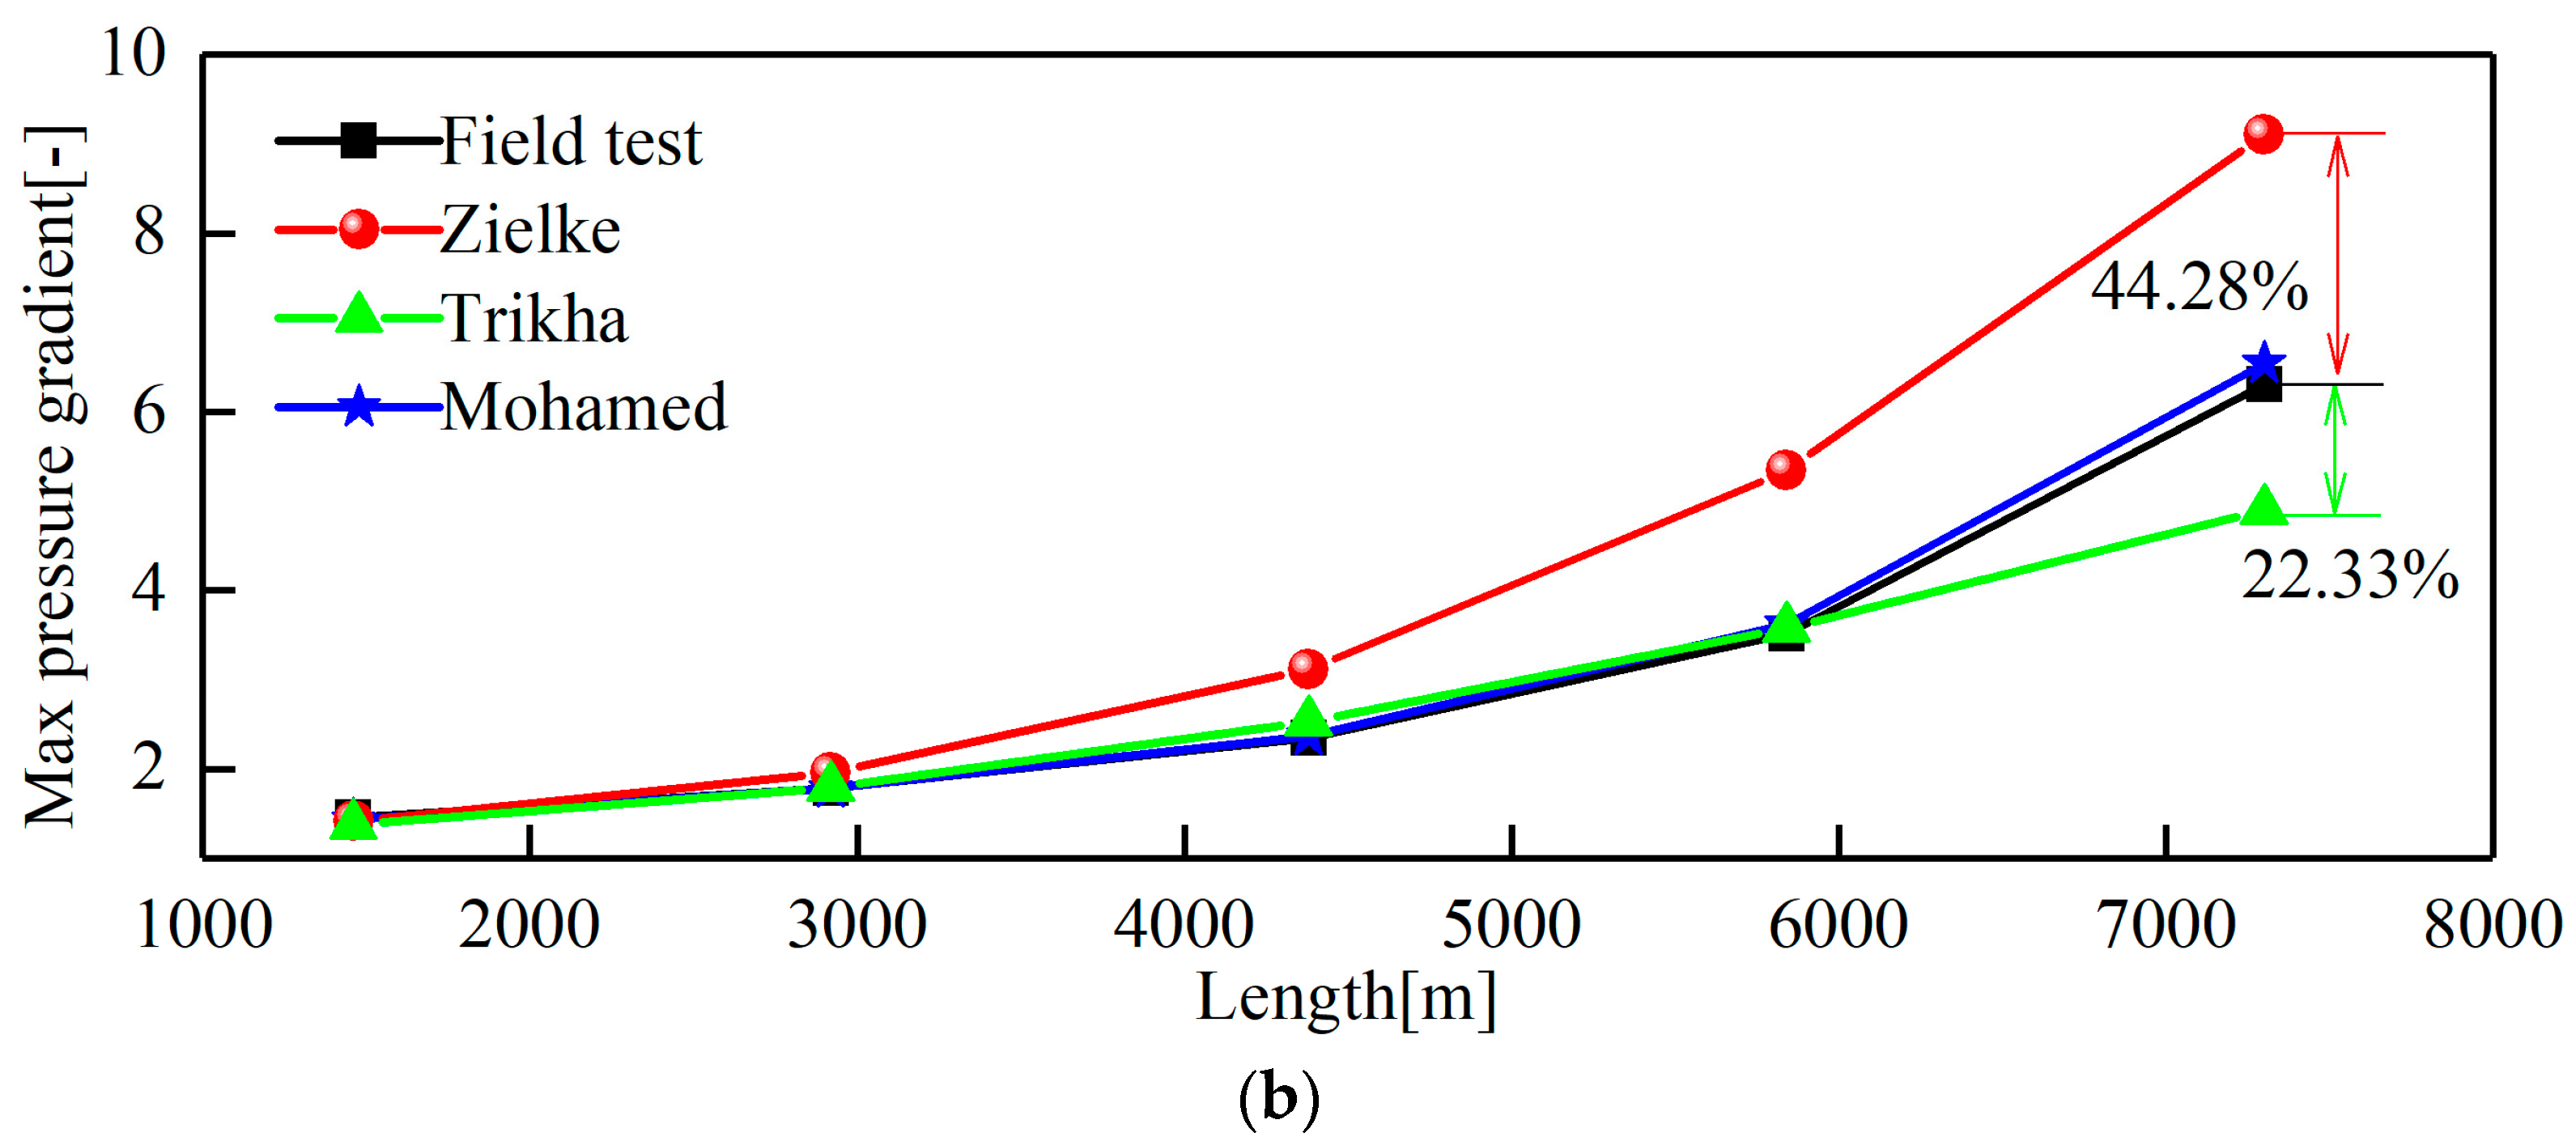
3. Comparison of Unsteady Friction Models

Figure 10 shows the compression waveforms and pressure gradients under three distinct friction models. As the propagation distance of the compression waves increases, the errors of the transient friction model and the measured data gradually increase. At the 7500 m measurement point [23], Zielke’s [33] laminar unsteady friction model numerical results in the pressure amplitude error are 5.85%, and the pressure gradient error is 44.28%. At the 7500 m measurement point, Trikha [35] and Mohamed’s [38] unsteady friction model show pressure gradient errors of 22.33% and 3.65%, respectively. In conclusion, Zielke’s laminar transient friction model underestimates the viscous dissipation effects of turbulence during the propagation of compression waves, resulting in an increased pressure gradient and pressure amplitude of the compression waves.

4. Results and Discussion

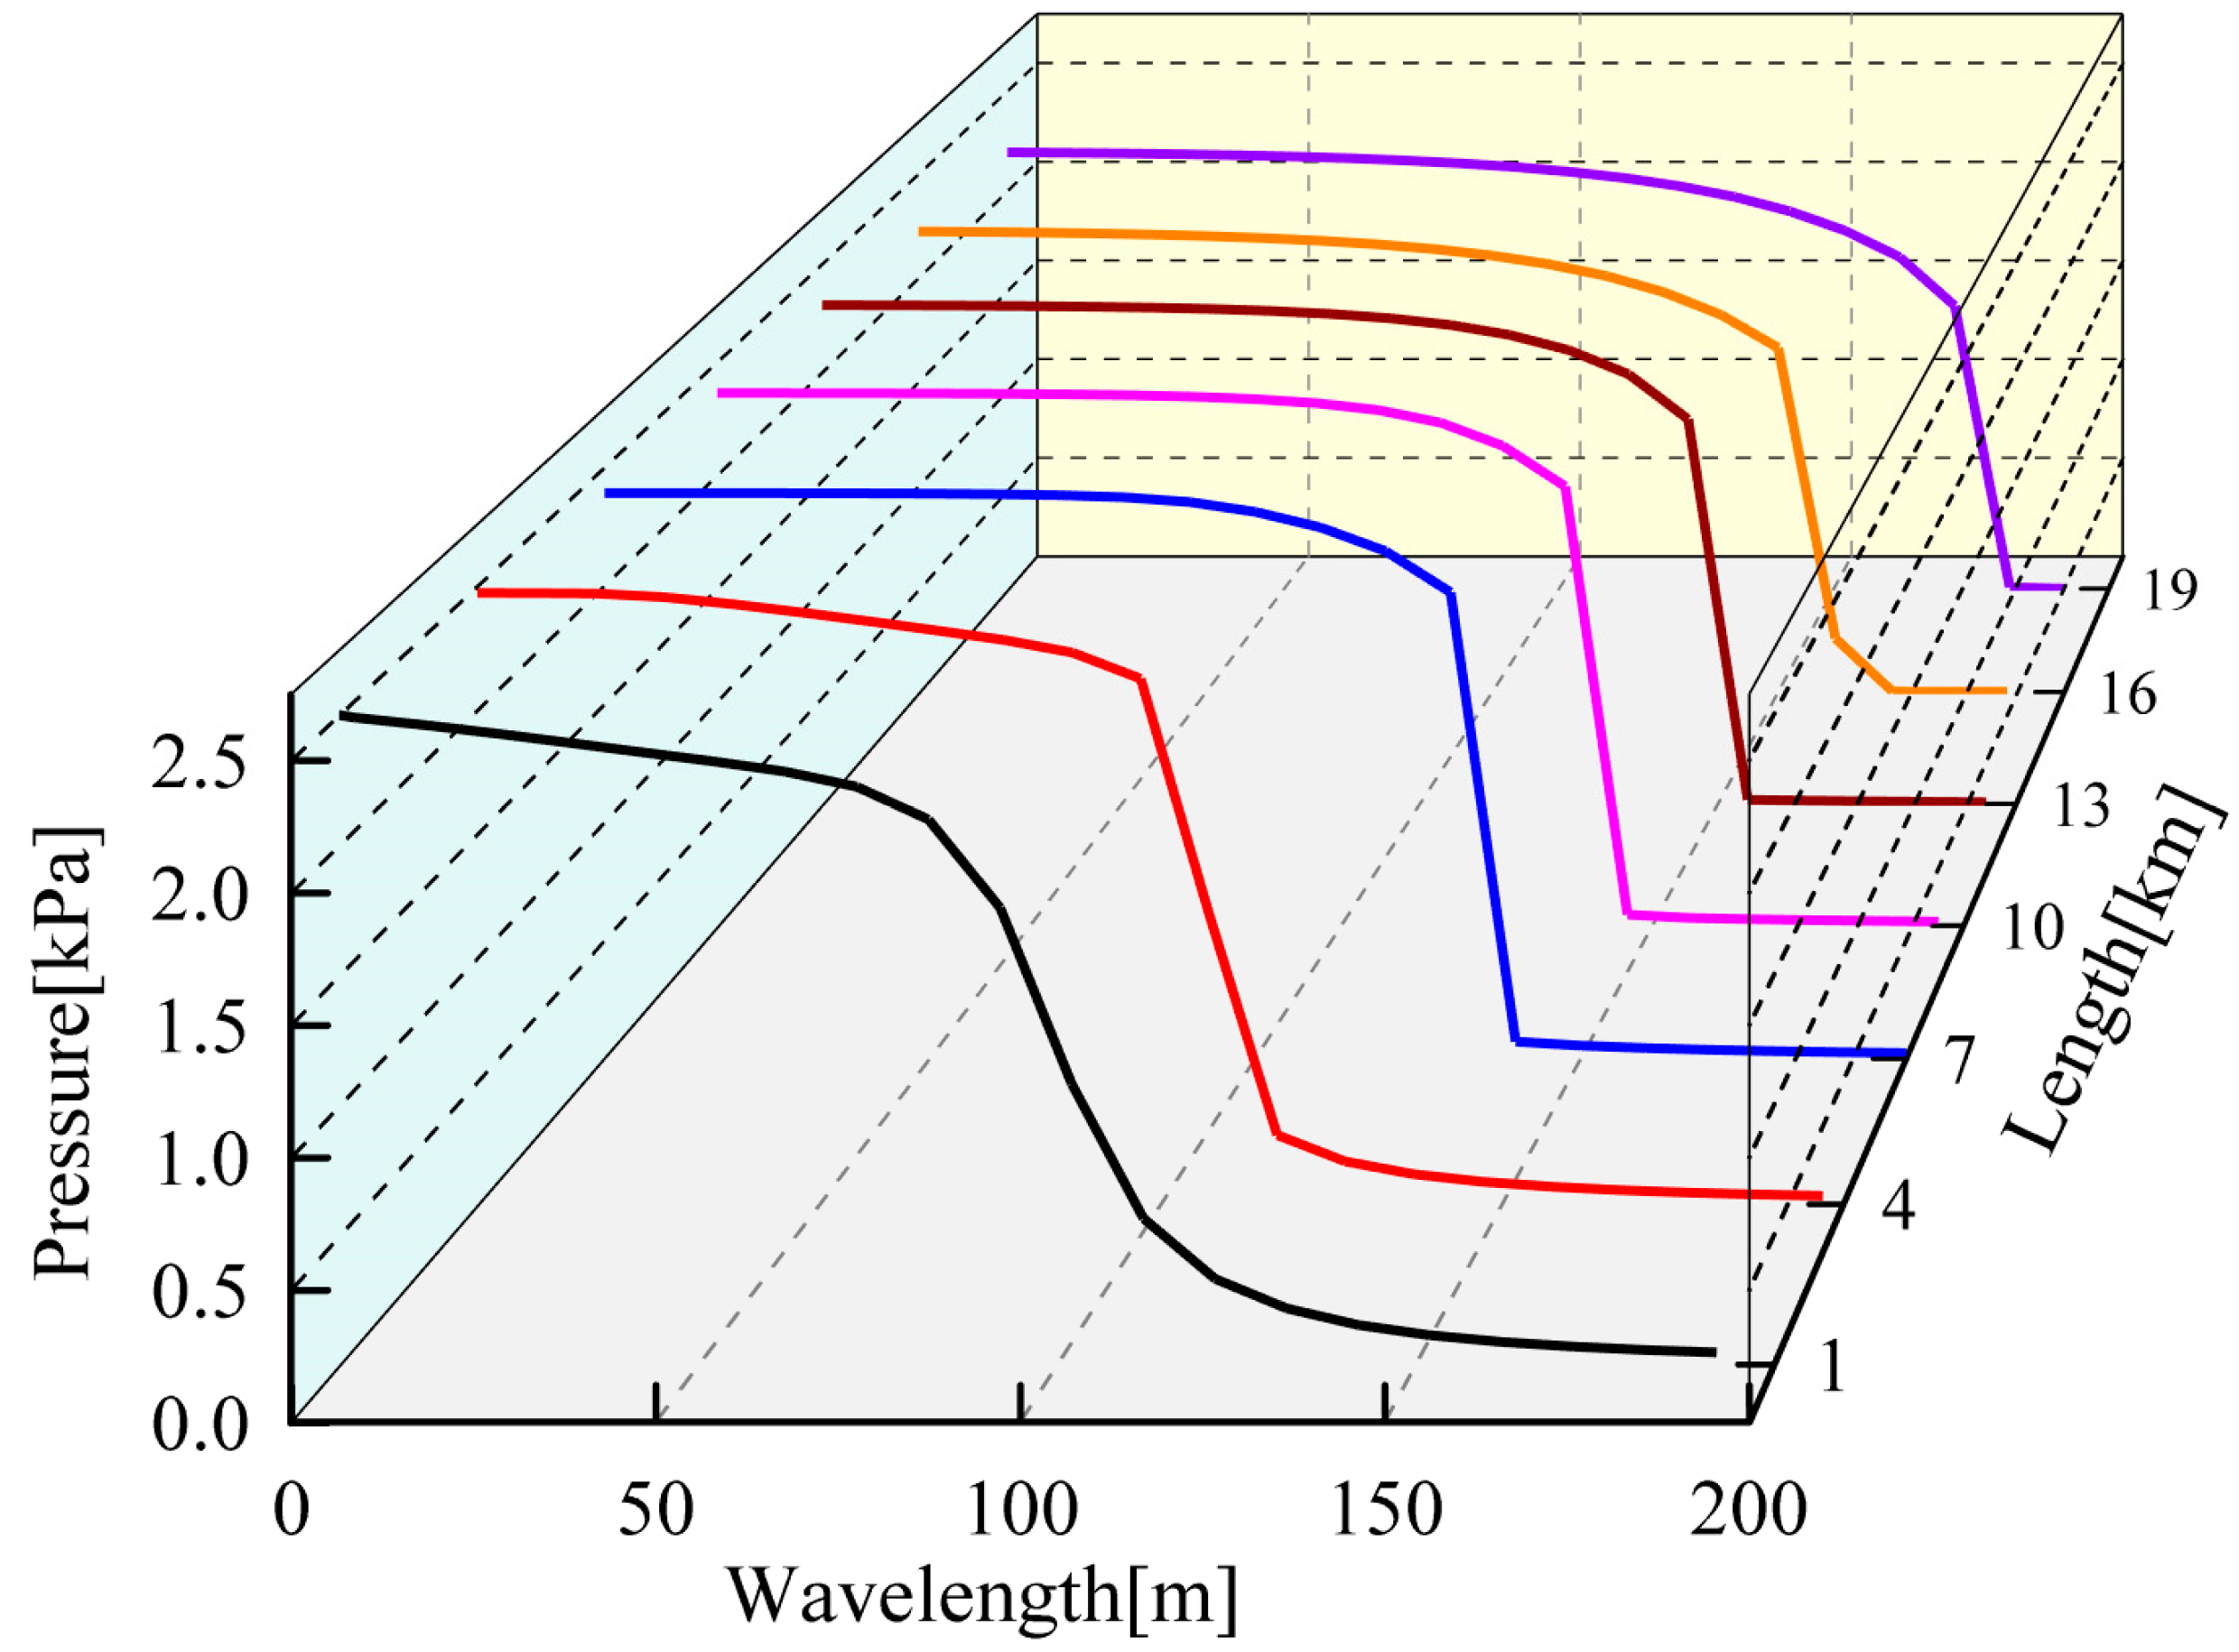
4.1. The Spatiotemporal Variation Characteristics of Pressure and Pressure Gradient during Compression Wave Propagation

Figure 11 shows the generation mechanism of the initial compression waves and their propagation characteristics in the tunnel.
Point a in Figure 11a represents the starting point of the initial compression wave front, point b denotes the generation of the initial compression waves as the train enters the tunnel, and point c signifies the endpoint of the initial compression waves front. Before point a, the pressure had already begun to rise, indicating that disturbance had been created in the air inside the tunnel before the high-speed train entered it. Until the leading edge of the high-speed train’s nose reaches the entrance of the tunnel, the pressure increment reaches ∆Pb. When the rear end of the high-speed train’s nose reaches the entrance of the tunnel, the pressure reaches its maximum value, designated as ∆Pc. As the high-speed train continues to enter the tunnel, the friction between the train’s surface and the air causes the pressure to increase gradually, resulting in the pressure increment from point c to point d. The segment from point a to point c on the curve is defined as the initial compression waves.
In Figure 11b, the left and right sides of the diagram illustrate the variations in pressure amplitude and pressure gradient of the compression waves, respectively. The solid and dashed red lines represent the running trajectories of the train’s head and tail, while the solid and dashed black lines represent the propagation trajectories of the waves’ front and the waves’ trail of the initial compression waves. As the compression waves propagate in the tunnel, the pressure amplitude of the compression waves continuously decreases with increasing propagation distance. In undisturbed tunnel regions, the pressure remains at 0 kPa. The pressure gradient of the compression waves rapidly increases within a propagation distance of 5 km, reaching its maximum value at 5 km before gradually decreasing thereafter. During the whole propagation process, the pressure gradient of the compression waves always remains greater than the pressure gradient of the initial compression waves.

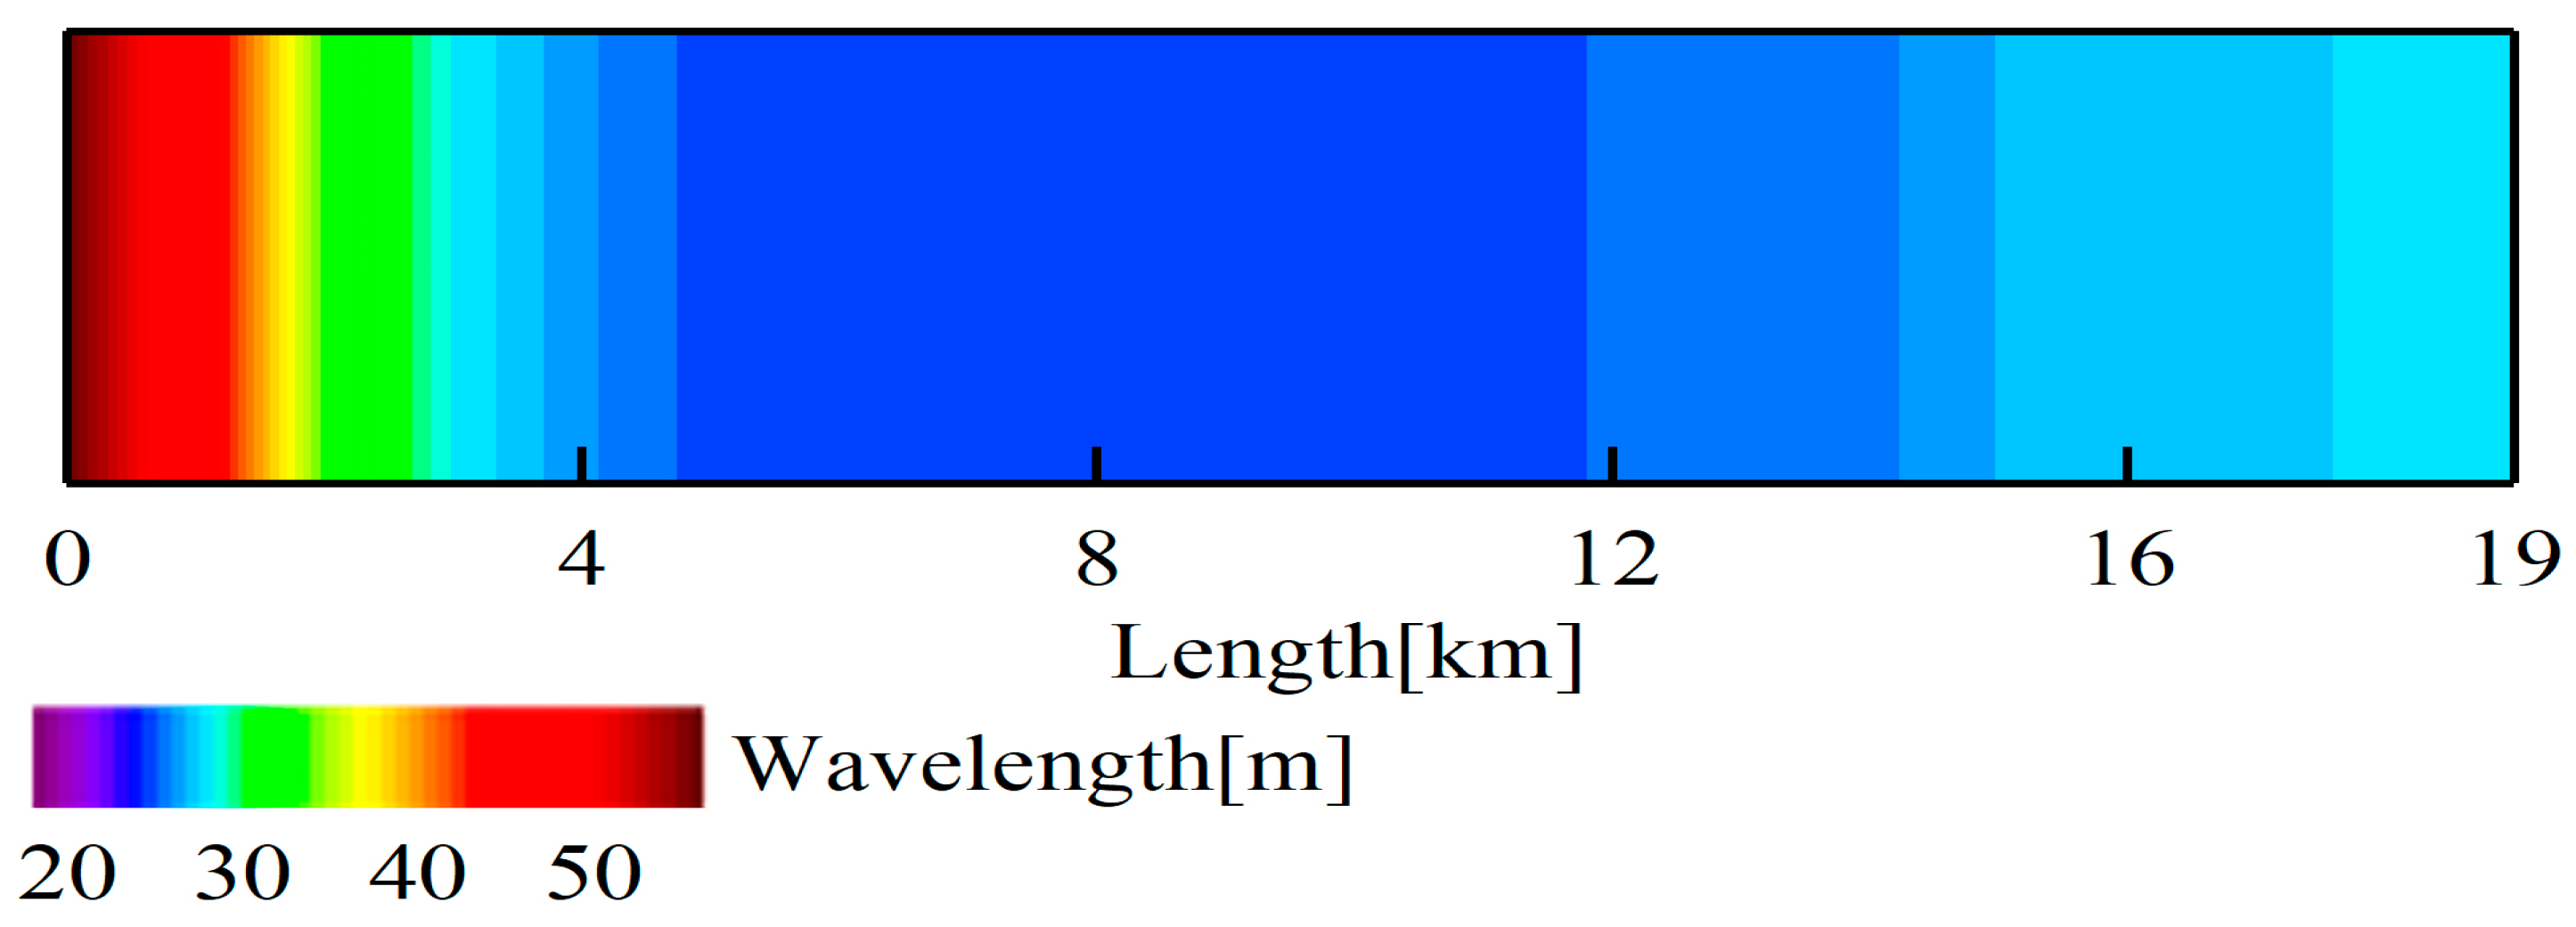
4.2. Variation Characteristics of Wavelength of Compression Waves

Figure 12 presents the pressure waveforms of the initial compression waves at the measurement points of 1 km, 4 km, 7 km, 10 km, 13 km, 16 km, and 19 km when propagating in a 20 km tunnel without a tunnel entrance hood. Figure 13 represents the variation characteristics of the wavelength with propagation distance. Figure 14 depicts the variation pattern of the pressure gradient with the wavelength of the compression waves during its propagation in the tunnel. As the propagation distance of the compression waves increases in the tunnel, its amplitude decreases while the wavelength shortens and the waveform steepens. During the propagation of the compression waves, its wavelength exhibits a trend of initially decreasing and then gradually increasing. The wavelength reaches its minimum value of 23.88 m at a distance of 5 km. During the propagation of the compression waves, the pressure gradient increases as the wavelength of the compression waves decreases. The smaller the wavelength of the compression waves, the more pronounced the variation in the pressure gradient.

4.3. Variation Characterization of Pressure Gradient and Amplitude of Compression Wavess

Based on the formation of micro-pressure waves to mitigate the micro-pressure waves at the tunnel exit, a tunnel entrance hood can be installed at the tunnel entrance. This increases the wavelength of the initial compression wave and reduces the maximum pressure gradient of the initial compression wave. From the previous research analysis, it is concluded that during the propagation of the initial compression wave in the tunnel, the amplitude of the tunnel compression wave decreases, but the compression wave waveforms steepen, and the maximum pressure gradient increases. The “Steepening” of the compression waves will “counteract” the effect of the tunnel entrance hood, instead enhancing the micro-pressure waves. To compare and describe the effect of the waveform on the propagation of the initial compression waves, this paper introduces the following two concepts.
The pressure amplitude of the compression waves at the entrance and at a distance x from the entrance are denoted by ∆p0 and ∆px, respectively. The attenuation ratio ζ is defined as:
ζ = Δ p x Δ p 0
The maximum pressure gradient of the compression waves at the entrance and at a distance x from the entrance is denoted by p t ( max , 0 ) and p t ( max , x ) , respectively. The steepening rate η is defined as:
η = p t ( m a x , x ) p t ( m a x , 0 )
Figure 15 depicts the pressure waveforms and pressure gradient curves at measurement points 1 km, 4 km, 7 km, 10 km, 13 km, 16 km, and 19 km; this occurs during the 20 km tunnel propagation of the initial compression waves generated by the train entering different tunnel entrance hoods. When the initial compression waves propagate inside the tunnel, its waveform undergoes a process of initially steepening and then gradually flattening. Both type A tunnel entrance hoods and type B tunnel entrance hoods increase the rise time of the compression wave pressure, resulting in a relatively lower pressure gradient during the propagation of the compression waves compared to when no tunnel entrance hood is present. The waveform of the initial compression waves under both no tunnel entrance hood and type A tunnel entrance hoods show a rapid steepening within propagation short distances. Due to the type B tunnel entrance hood, the waveform of the compression waves exhibits two distinct rising steps, resulting in two peaks in the pressure gradient. This significantly reduces the pressure gradient of the compression waves. When propagating to 13 km, the two distinct rising steps on the waveform of the compression waves disappear, and the pressure gradient increases sharply at this point.
Figure 16 illustrates the variation patterns of the maximum pressure gradient and steepening rate with a propagation distance for the initial compression waves propagating. Figure 17 illustrates the variation characteristics of the pressure amplitude and attenuation ratio with a propagation distance. In the cases of no tunnel entrance hoods, type A tunnel entrance hoods, and type B tunnel entrance hoods, as the compression waves propagate in the tunnel, their pressure gradient shows a trend of initially increasing and then decreasing. The nonlinear effects of compression waves lead to the phenomenon of steepening during their propagation. During the propagation of the compression waves, the wavefront travels through stationary air, while the wave tail propagates through air moving in the same direction. Additionally, the density and temperature of the air increase, leading to an increase in the speed of sound. These factors result in a higher propagation speed of the wave tail, resulting in a shorter wavelength of the compression waves and an increase in the pressure gradient. The nonlinear steepening of compression waves during propagation is the fundamental reason for the formation of micro-pressure waves. As compression waves continue to propagate in the tunnel, the friction effects gradually strengthen, dominating the state and suppressing the nonlinear effects of compression wave propagation, leading to a decrease in pressure gradient. Therefore, there must exist a steepening critical distance at which the pressure gradient of the compression waves reaches its maximum value, and this length is defined as the steepening critical distance. The pressure amplitude of the compression waves continuously decreases due to the friction effects, with the attenuation ratio decreasing as the propagation distance increases. Under the conditions of no tunnel entrance hood, type A tunnel entrance hoods, and type B tunnel entrance hoods, the steepening critical distances are reached at 5 km, 6 km, and 16 km, respectively. With the type A tunnel entrance hoods, the steepening extent during propagation is the highest, with a maximum steepening rate of 15.6, meaning the maximum pressure gradient increases to 15.6 times the initial compression wave’s pressure gradient. Different types of tunnel entrance hoods not only reduce the maximum pressure gradient of the initial compression waves but also change the steepening critical distance.

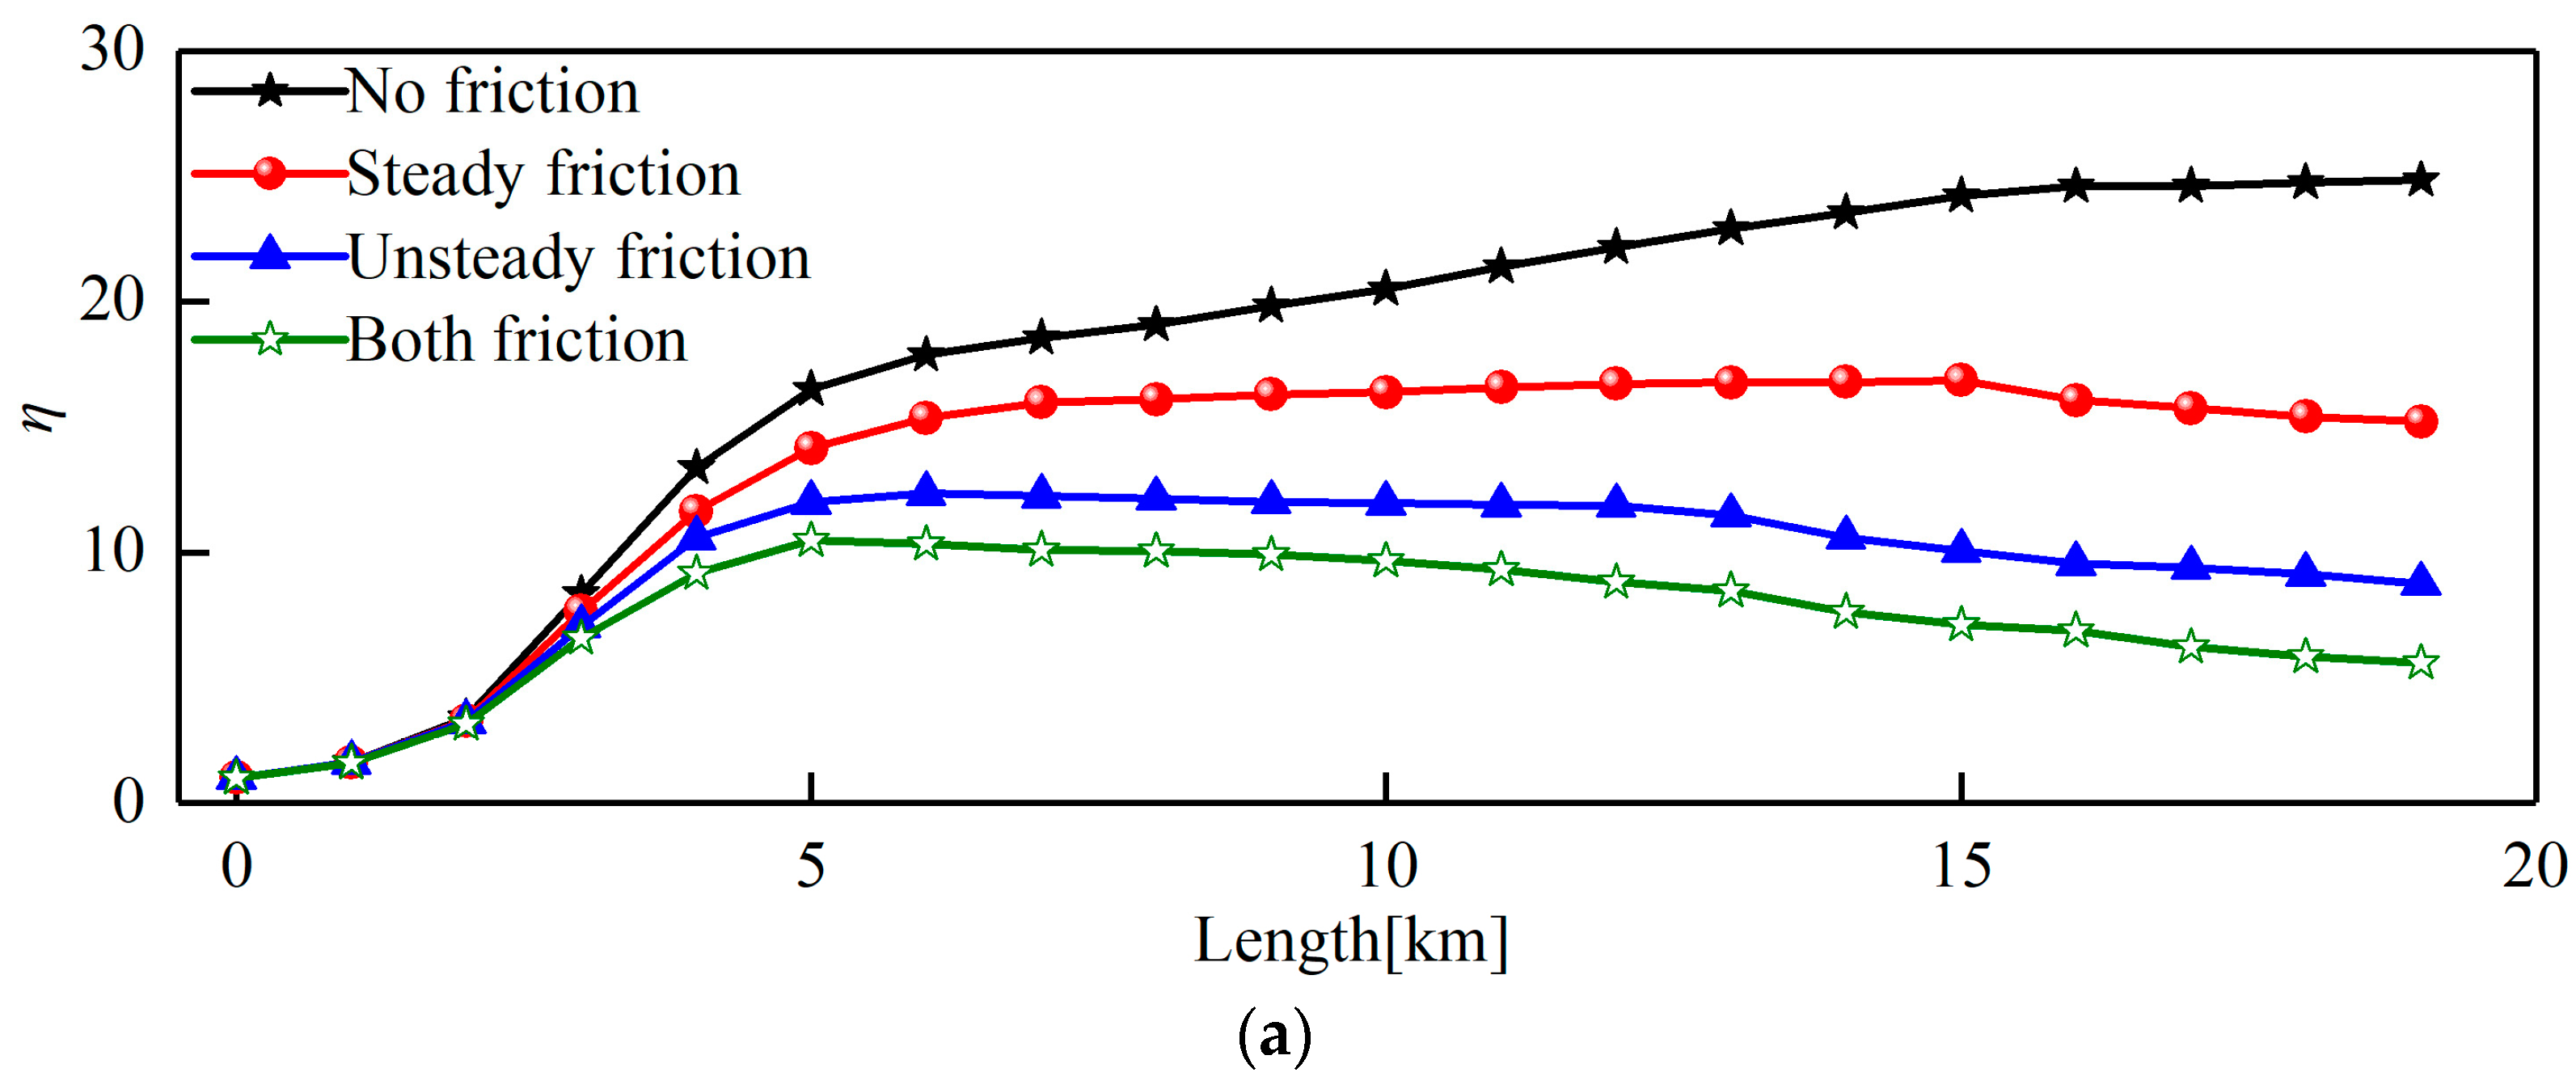
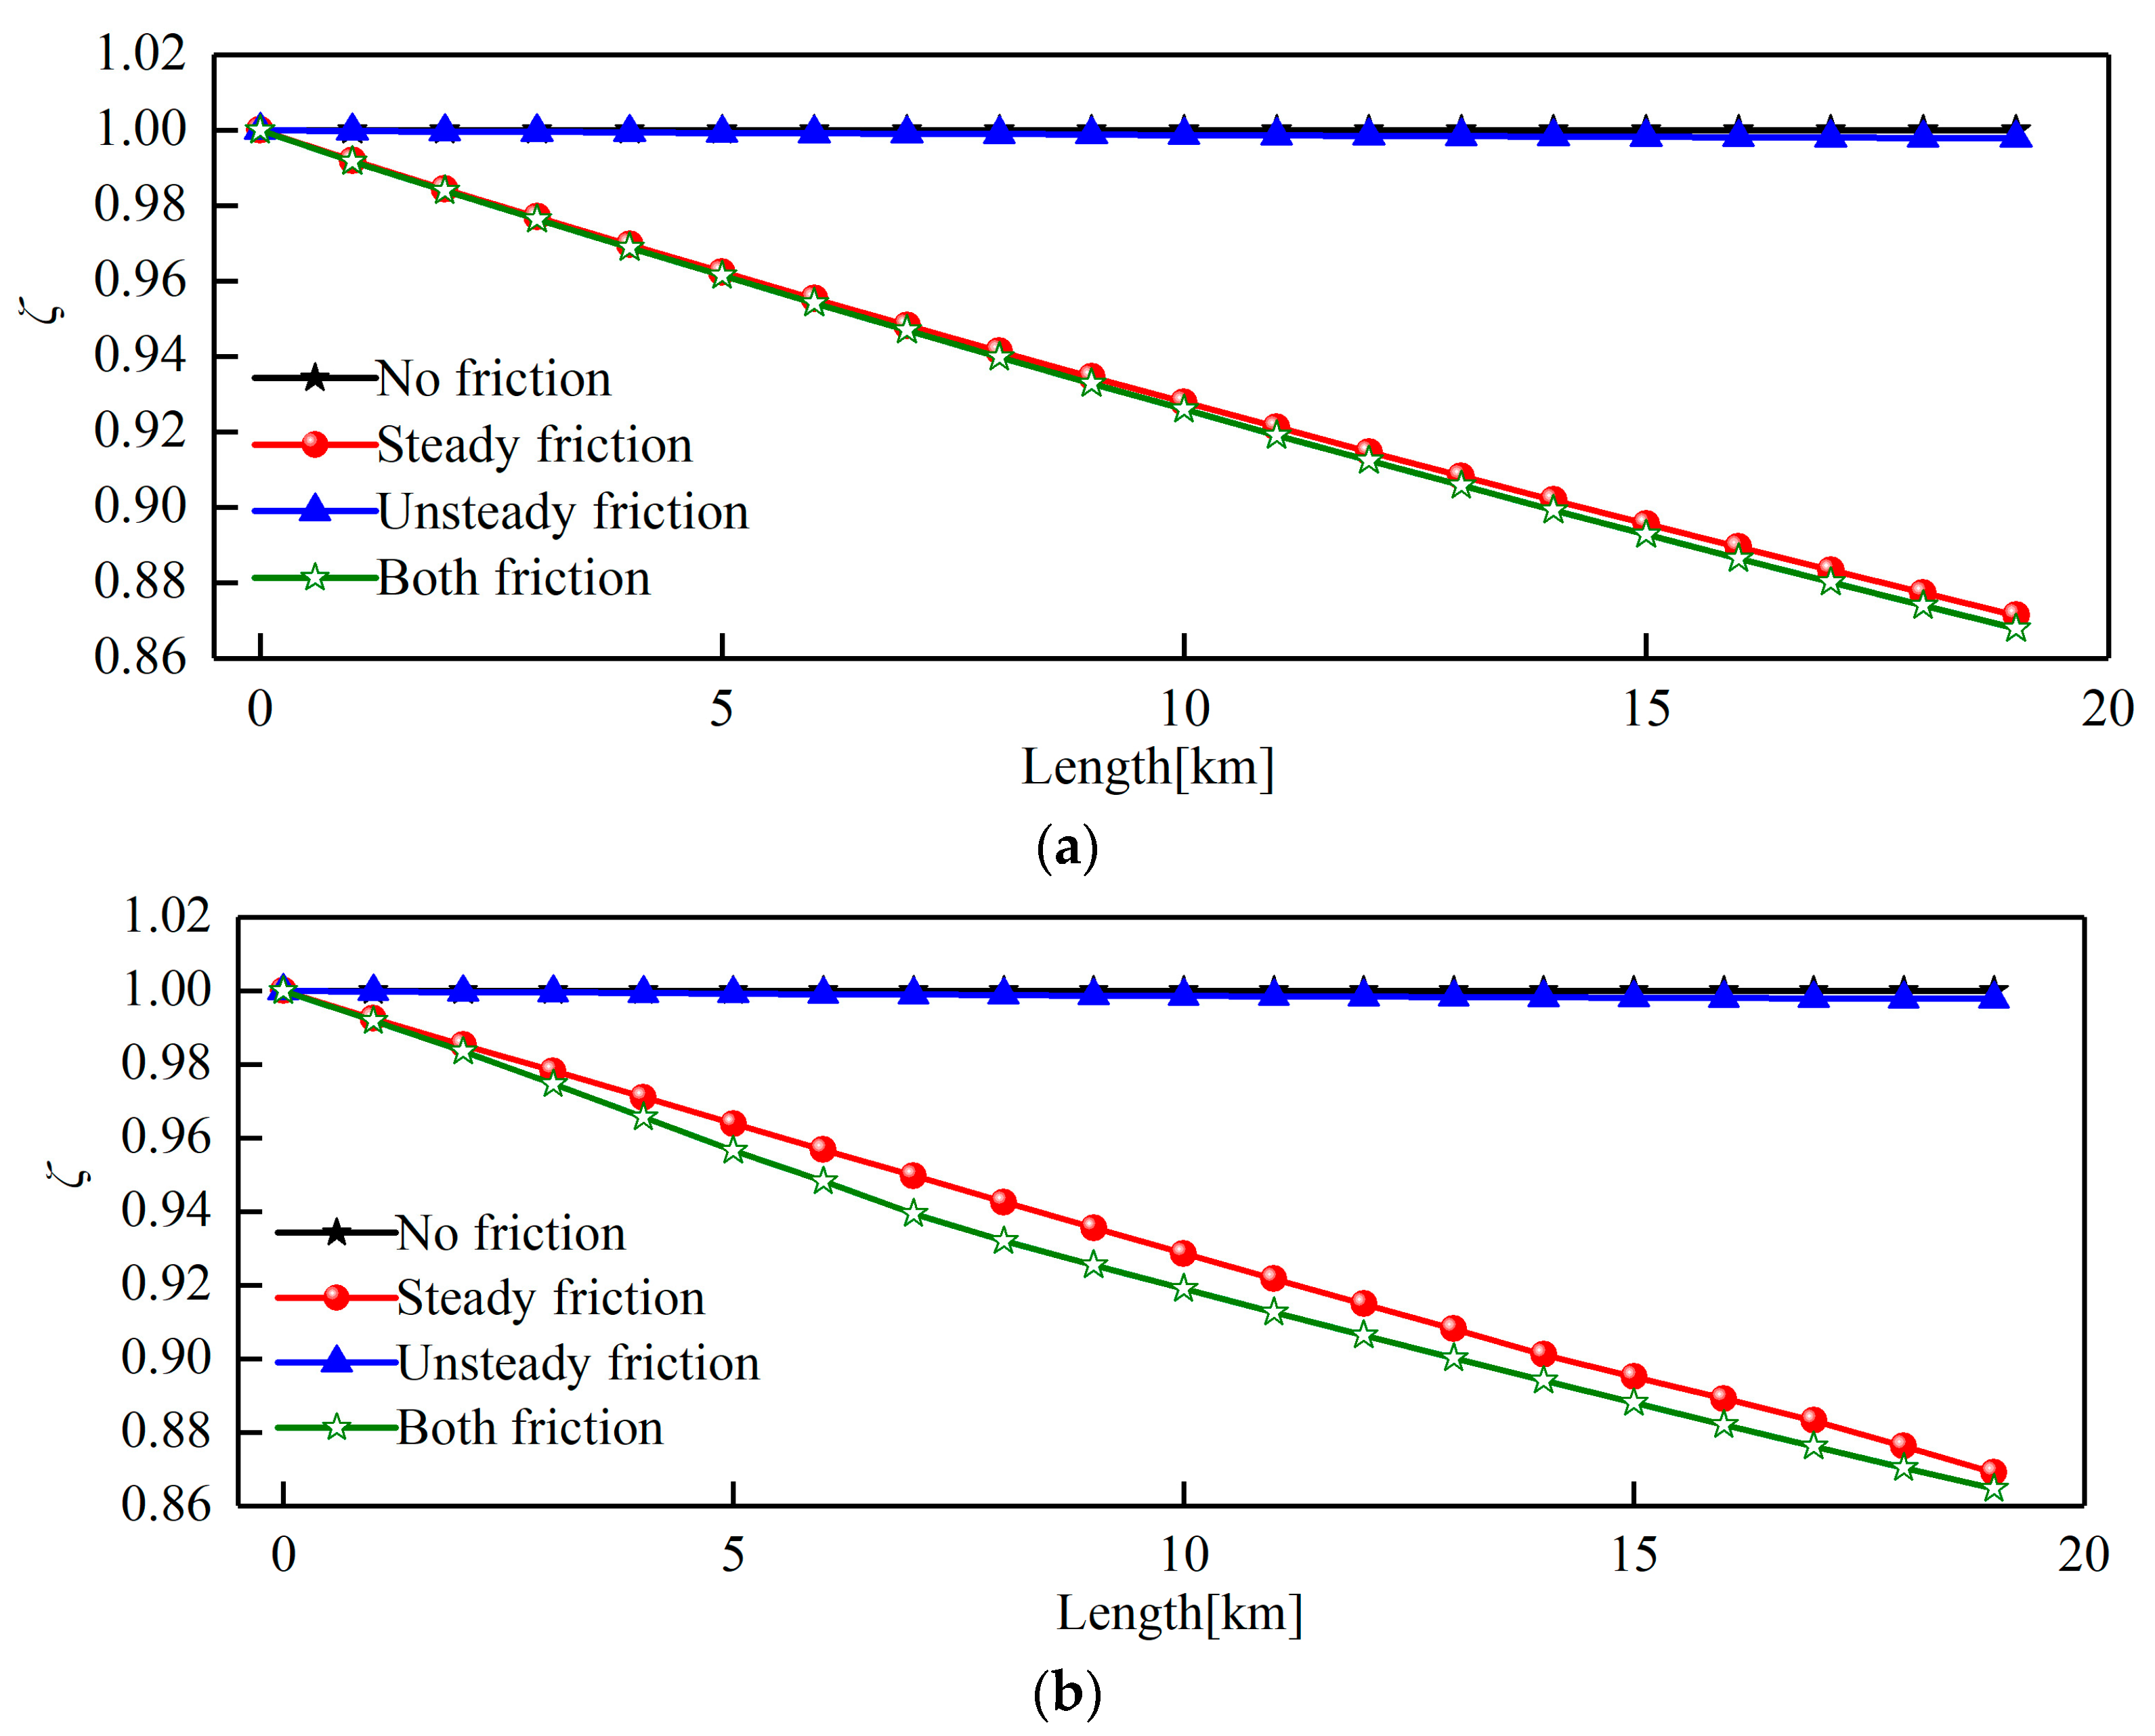
4.4. Effect of Friction Terms

The airflow induced by the propagation of compression waves is influenced by frictional effects, leading to viscous dissipation and affecting the waveform changes during propagation. This section investigates the impact characteristics of the frictional effects on the propagation of initial compression waves. To analyze the impact characteristics of the friction terms on compression waves, the friction effects are defined. When the friction terms in the momentum and energy equations only consider the viscous dissipation caused by steady frictional forces, it is defined as steady friction effects. This considers only the viscous dissipation caused by unsteady frictional forces and is defined as the unsteady friction effects. If both steady and unsteady friction are considered, it is defined as both friction effects. If friction terms are not considered in the equations, it is defined as no frictional effects.
Figure 18 presents the comparison of compression waveforms and pressure gradients under conditions of no frictional effect, steady frictional effect, unsteady frictional effects, and frictional effects. The tunnel has a length of 20 km, and the analysis is conducted at five measurement points located at distances of 1 km, 5 km, 9 km, 15 km, and 19 km from the tunnel entrance. When the compression waves propagate to a distance of 1 km, the compression waveforms and pressure gradients under the influence of the four friction effects coincide. This indicates that for the propagation of initial compression waves in the tunnel, the relatively short propagation distance results in the friction term do not yet prominently affect the pressure changes associated with the propagation of compression waves. When the compression waves propagate to 5 km, the waveform of the compression waves gradually separates. Relative to the scenario of no frictional effects, steady friction causes a reduction in the amplitude of the compression waves. Upon adding unsteady friction, the amplitude of the compression waves is further reduced and rapid mitigation in the rising trend of the waveform occurs, consequently resulting in a significant decrease in the pressure gradient. When the compression waves propagate to 19 km, there is a clear separation phenomenon in the waveform of the compression waves. This is because frictional effects reduce the propagation velocity of the compression waves.
Friction effects play a crucial role in reducing the pressure amplitude and pressure gradients of compression waves. Compression waves propagate in tunnels under the combined influence of nonlinear effects and frictional effects.
Figure 19 and Figure 20, respectively, illustrate the characteristic influence of the friction effects on the steepening rate and attenuation ratio.
When no frictional effects are considered, the steepening rate for three different waveforms all continue to increase steadily, with no attenuation observed in the amplitude of the compression waves. The attenuation ratio remains constant at a value of 1. When steady friction effects and both friction effects are considered, the attenuation ratio of the compression waves exhibits a quasilinear decreasing trend, indicating the presence of viscous dissipation during the propagation of compression waves. When adding steady friction, the steepening rate initially increases to reach a maximum value, after which it remains nearly constant overall. When the unsteady frictional effects and both frictional effects are considered, the steepening rate exhibits a trend of initially increasing and then decreasing. However, for the unsteady frictional effects, the amplitude of the compression waves shows almost no attenuation. The steady frictional effect tends to decrease the amplitude of the compression waves while having little influence on the variation in the pressure gradient of the compression waves. This indicates that the steady frictional effect on compression waves does not exert sufficient inhibitory action on their nonlinear effects. Unsteady friction effects cause a significant alteration in the pressure gradient of compression waves propagating in tunnels, indicating that the unsteady friction effects inhibit the nonlinear steepening of compression waves. When both friction effects are present, there are significant alterations in the waveform of the compression waves during propagation. These changes stem not only from the steady frictional affecting pressure amplitude but also from the unsteady frictional altering of the pressure gradient of the compression waves.
Full-scale experimental research shows that in the propagation of compression waves, there is not only attenuation in the pressure amplitude but also a steepening critical distance. Therefore, qualitatively, it can be determined that both types of friction effects must be considered when studying the propagation of the compression waves.

4.5. Effect of Ambient Temperature

The variation characteristics of compression wave propagation in tunnels are influenced by ambient temperature. Analyzing the patterns of change in compression wave propagation under different ambient temperatures is crucial.
Figure 21 depicts the influence of the ambient temperature on the steepening rate and attenuation ratio during compression wave propagation. The ambient temperatures are 323 K, 293 K, 273 K, and 253 K, respectively. As the ambient temperature decreases, both the steepening rate and attenuation ratio show an increasing trend. When air propagates at higher ambient temperatures, its speed increases, which affects the waveform changes of the compression waves during propagation. At lower temperatures, the nonlinear effects of compression waves are relatively larger. The increase in temperature enhances the frictional effects during the propagation of compression waves, suppressing their nonlinear effects and resulting in a decrease in the steepening rate.

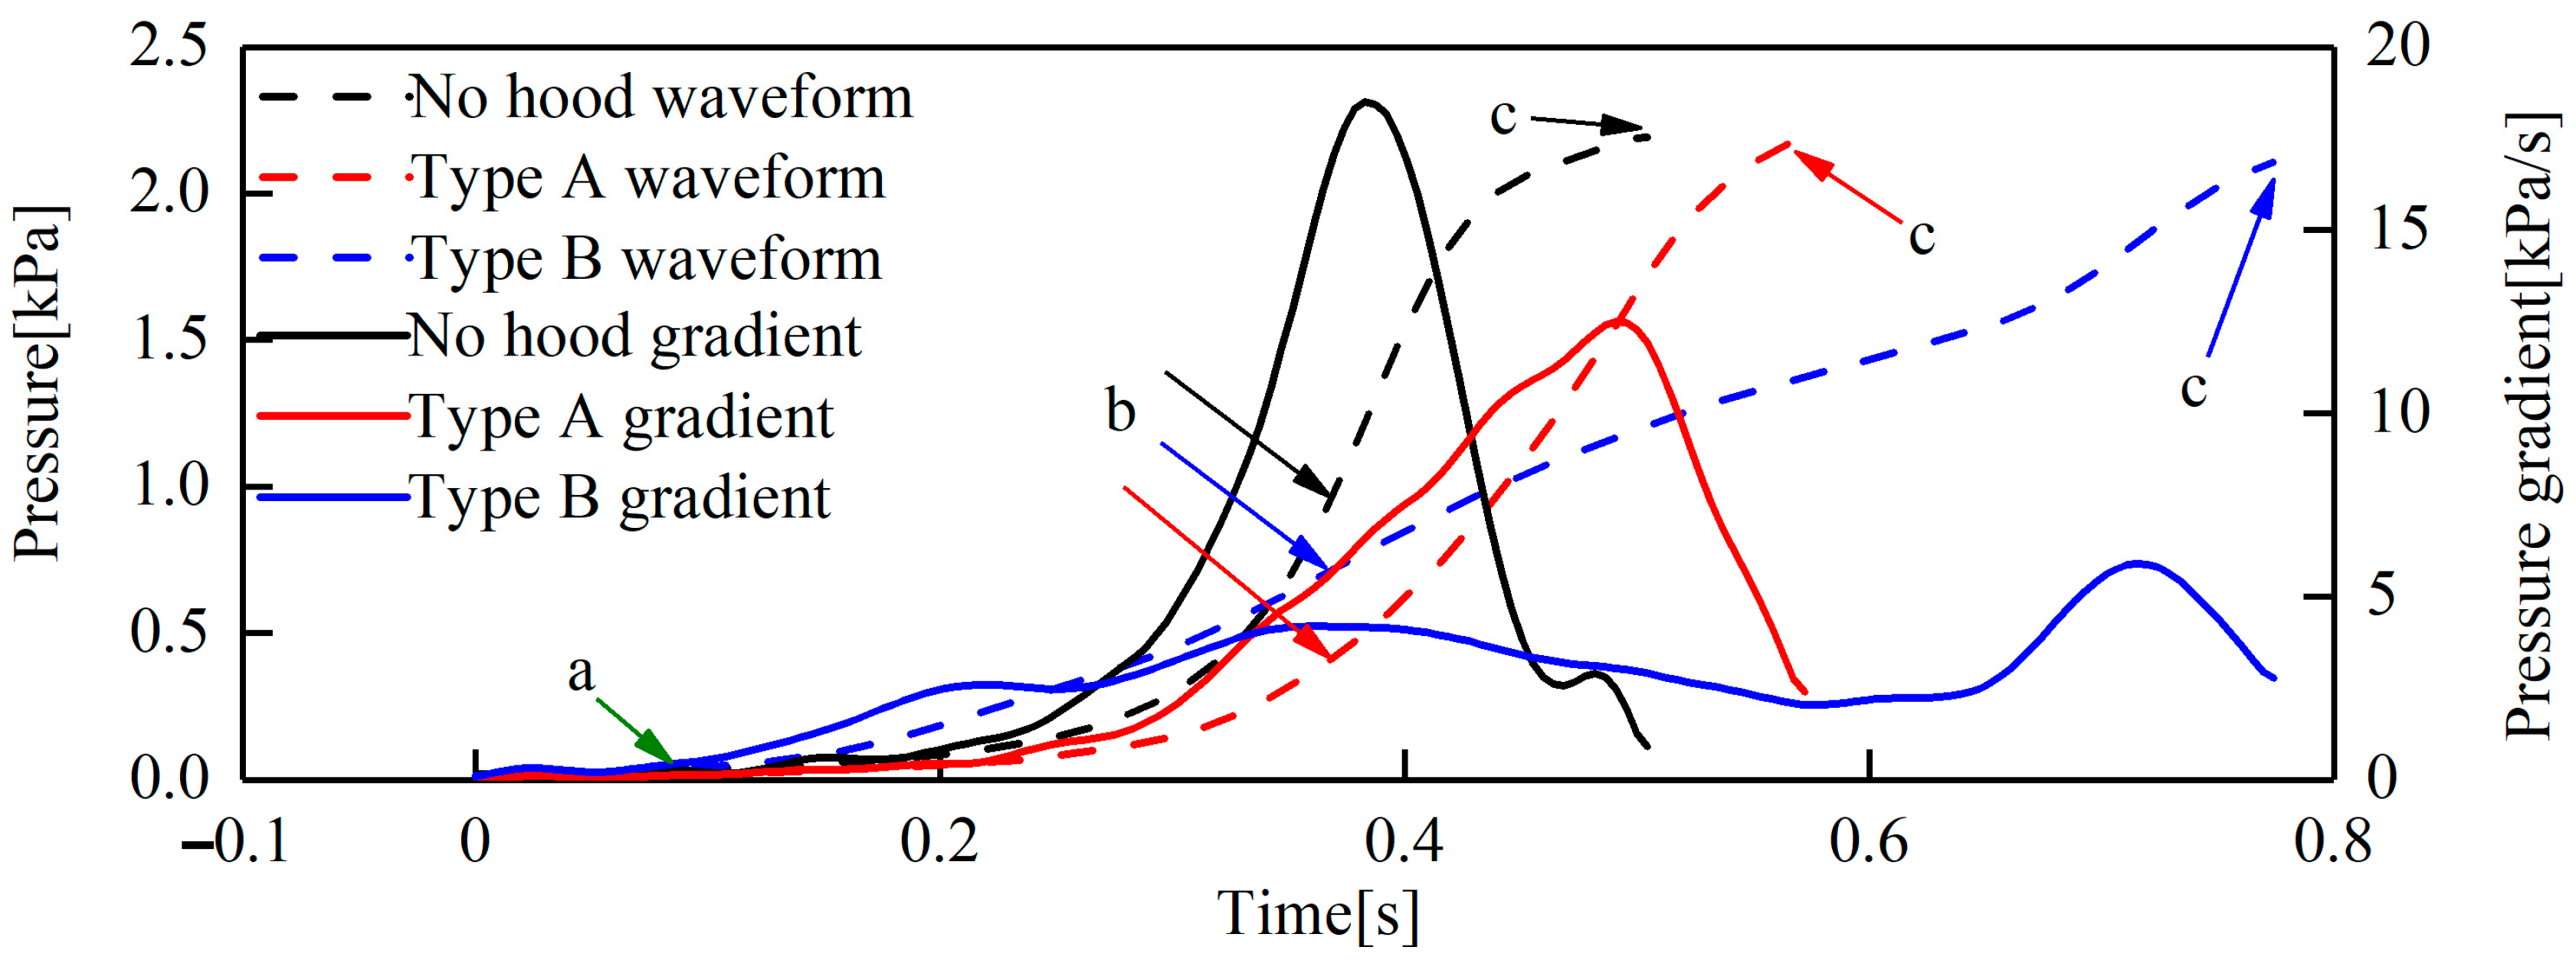
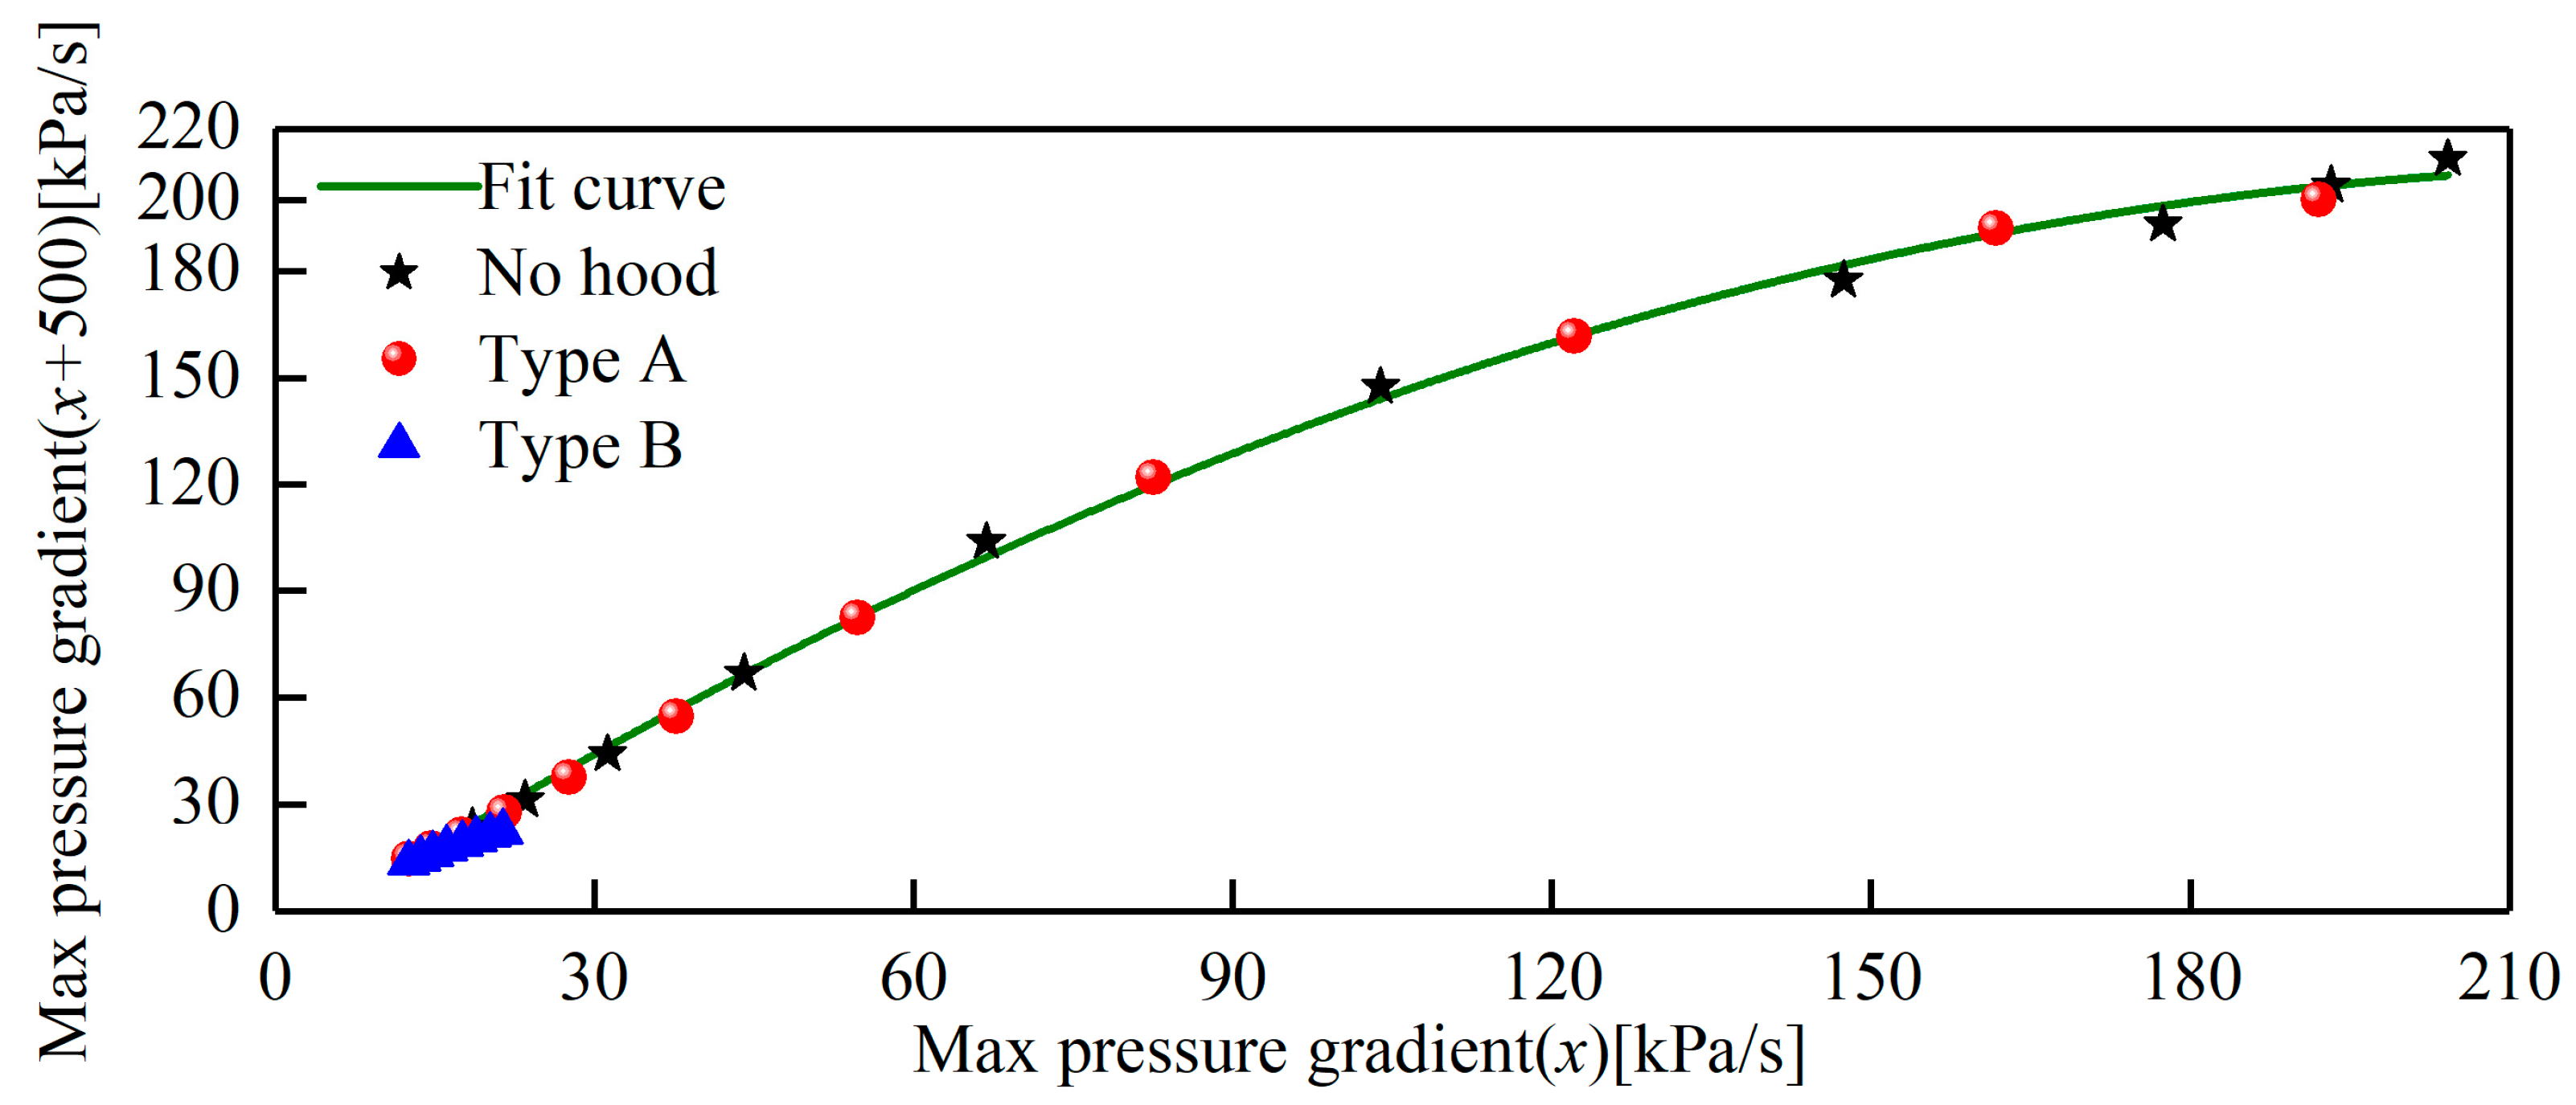
4.6. Mitigation Characteristics of Compression Waves Pressure Gradient in Different Tunnel Entrance Hoods

The research results mentioned above indicate that the waveform significantly influences the propagation and evolution process of compression waves in very long tunnels. As the propagation distance increases, the mitigation performance of the tunnel entrance hoods decreases. When compression waves propagate in very long tunnels, a thorough evaluation of the mitigation performance of the tunnel entrance hood is necessary to ensure its effectiveness.
Figure 22 presents the relative increase in the maximum pressure gradient of the initial compression waves propagating in the tunnel over a 500 m length segment. The horizontal axis represents the pressure gradient at any propagation length (x), while the vertical axis represents the pressure gradient after propagating 500 m (x + 500). When compression waves with different waveforms but identical pressure gradients propagate a distance of 500 m, their pressure gradients remain the same. This demonstrates that the steepening extent of the compression waves is closely correlated with the maximum pressure gradient of the compression waves. Therefore, reducing the maximum pressure gradient of the initial compression waves is highly effective in mitigating micro-pressure waves.
Figure 23 illustrates the variation in the reduction rate of the maximum pressure gradient with the tunnel length when tunnel entrance hoods are installed. The mitigating effect of type A tunnel entrance hoods on compression waves is primarily concentrated within the first 4 km ahead of the tunnel, with an optimal reduction rate of 63%, observed at the 3 km mark; when greater than 4 km, the reduction rate drops to less than 15%. For a tunnel length of 9 km, the pressure gradient reduction rate is −2%, indicating that by the time the compression waves propagate to 9 km, the type A tunnel entrance hoods do not mitigate the compression waves but instead amplify their pressure gradient. The mitigating effect of type B tunnel entrance hoods on compression waves is primarily concentrated within the first 12 km ahead of the tunnel, reaching an optimal reduction rate of 95% at the 4 km mark. Greater than 14 km, the reduction rate drops to less than 40%.
As the propagation distance of the compression waves increases, the mitigation performance of the tunnel entrance hoods for the pressure gradient shows a trend of initially increasing and then decreasing. This indicates that tunnel entrance hoods have a certain range of effectiveness in reducing the pressure gradient of compression waves. Therefore, in engineering design, appropriate tunnel entrance hoods should be selected based on the consideration of tunnel length to find the most reasonable matching relationship. Additionally, for higher-speed railways, tunnel entrance hoods originally designed for existing line train-speed levels are insufficient to suppress the steepening process of the compression waves within the tunnel.

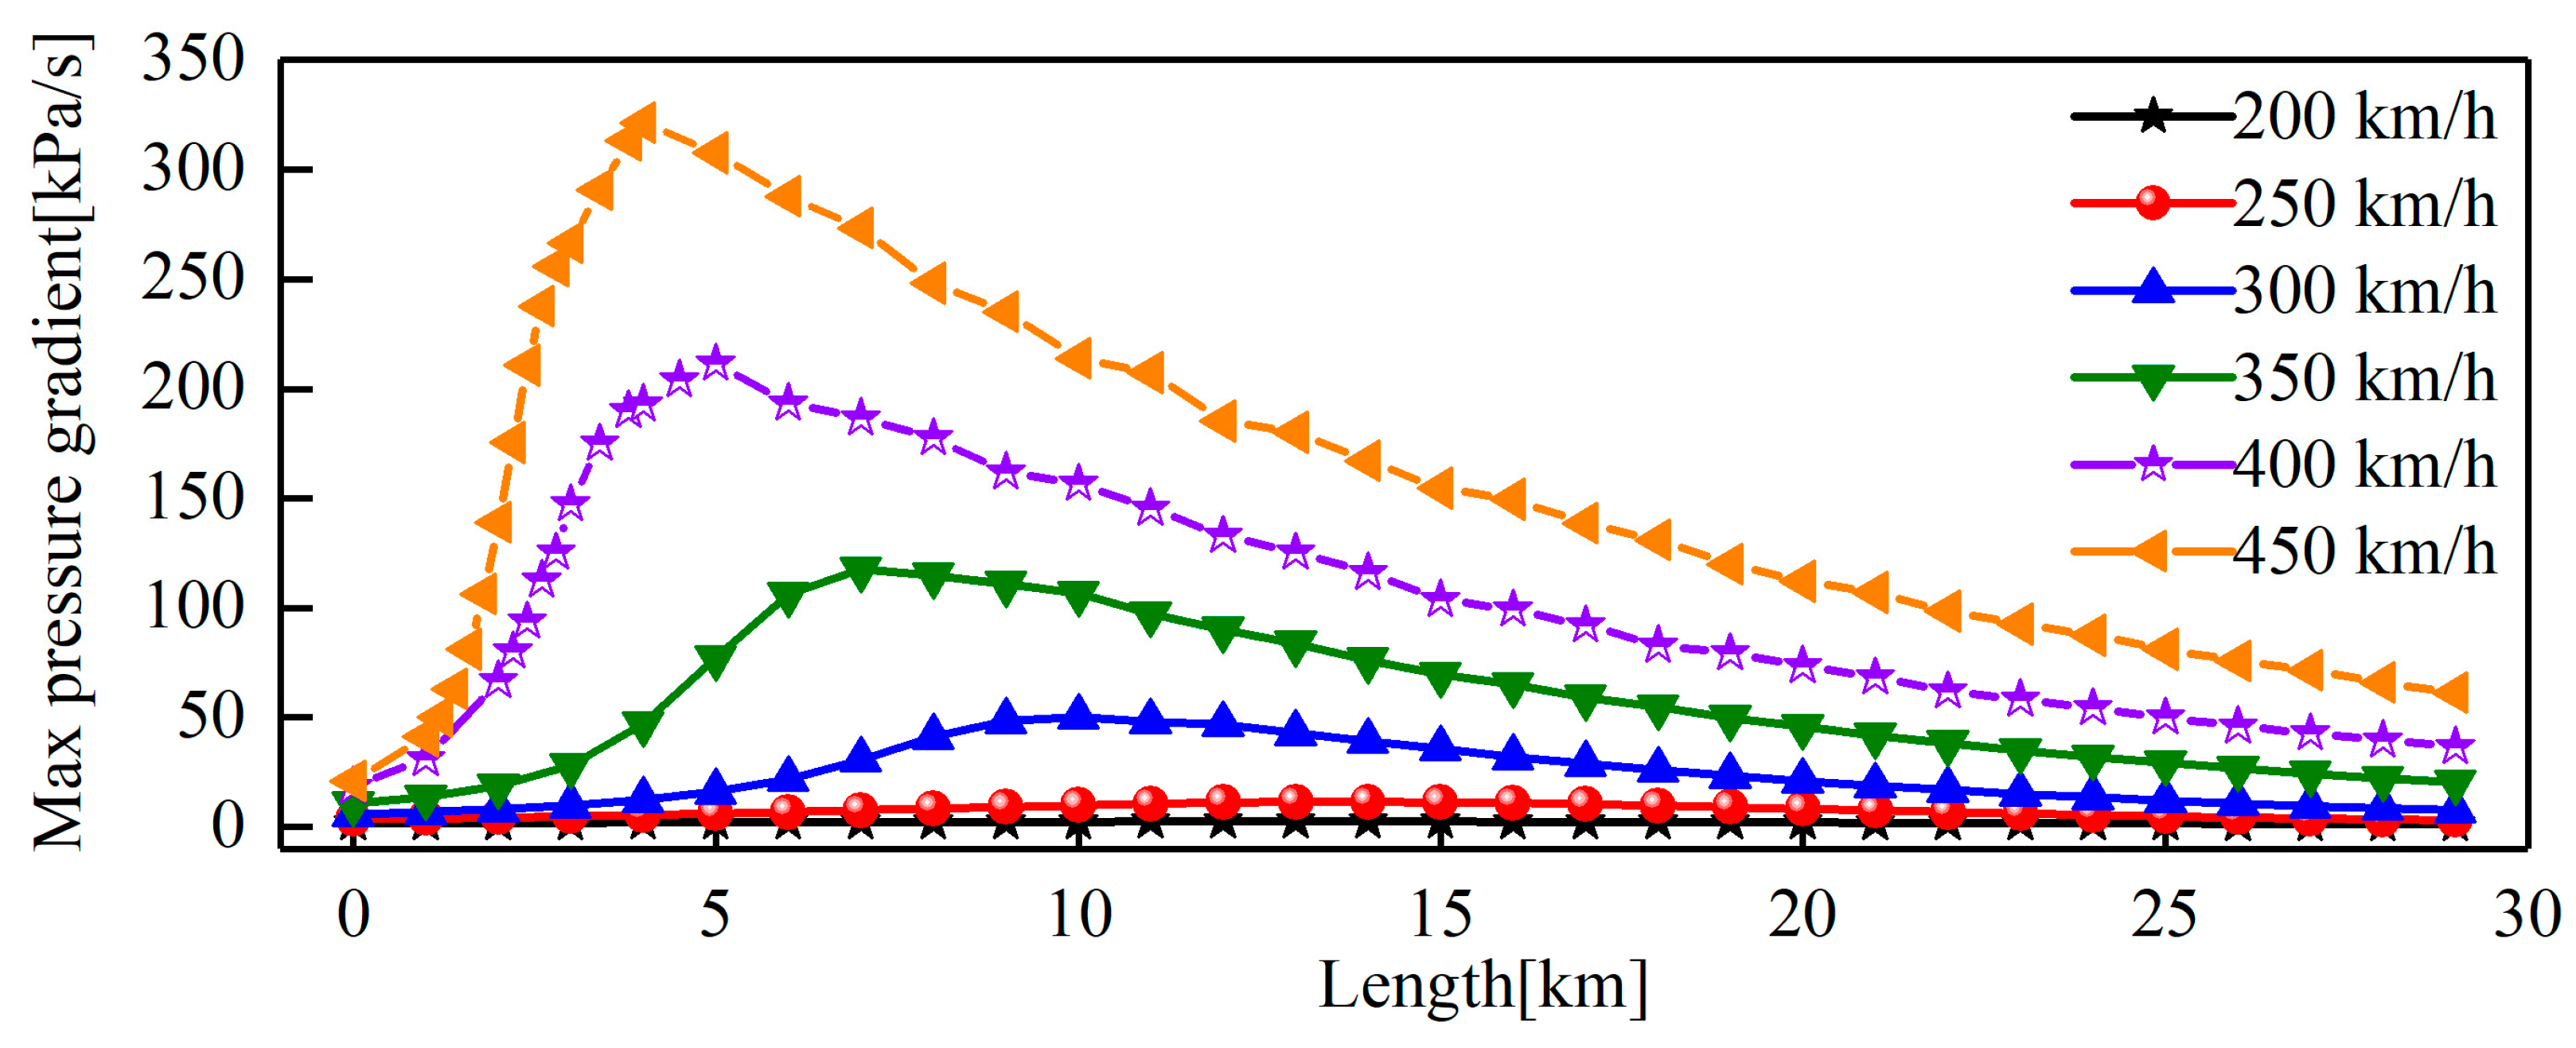
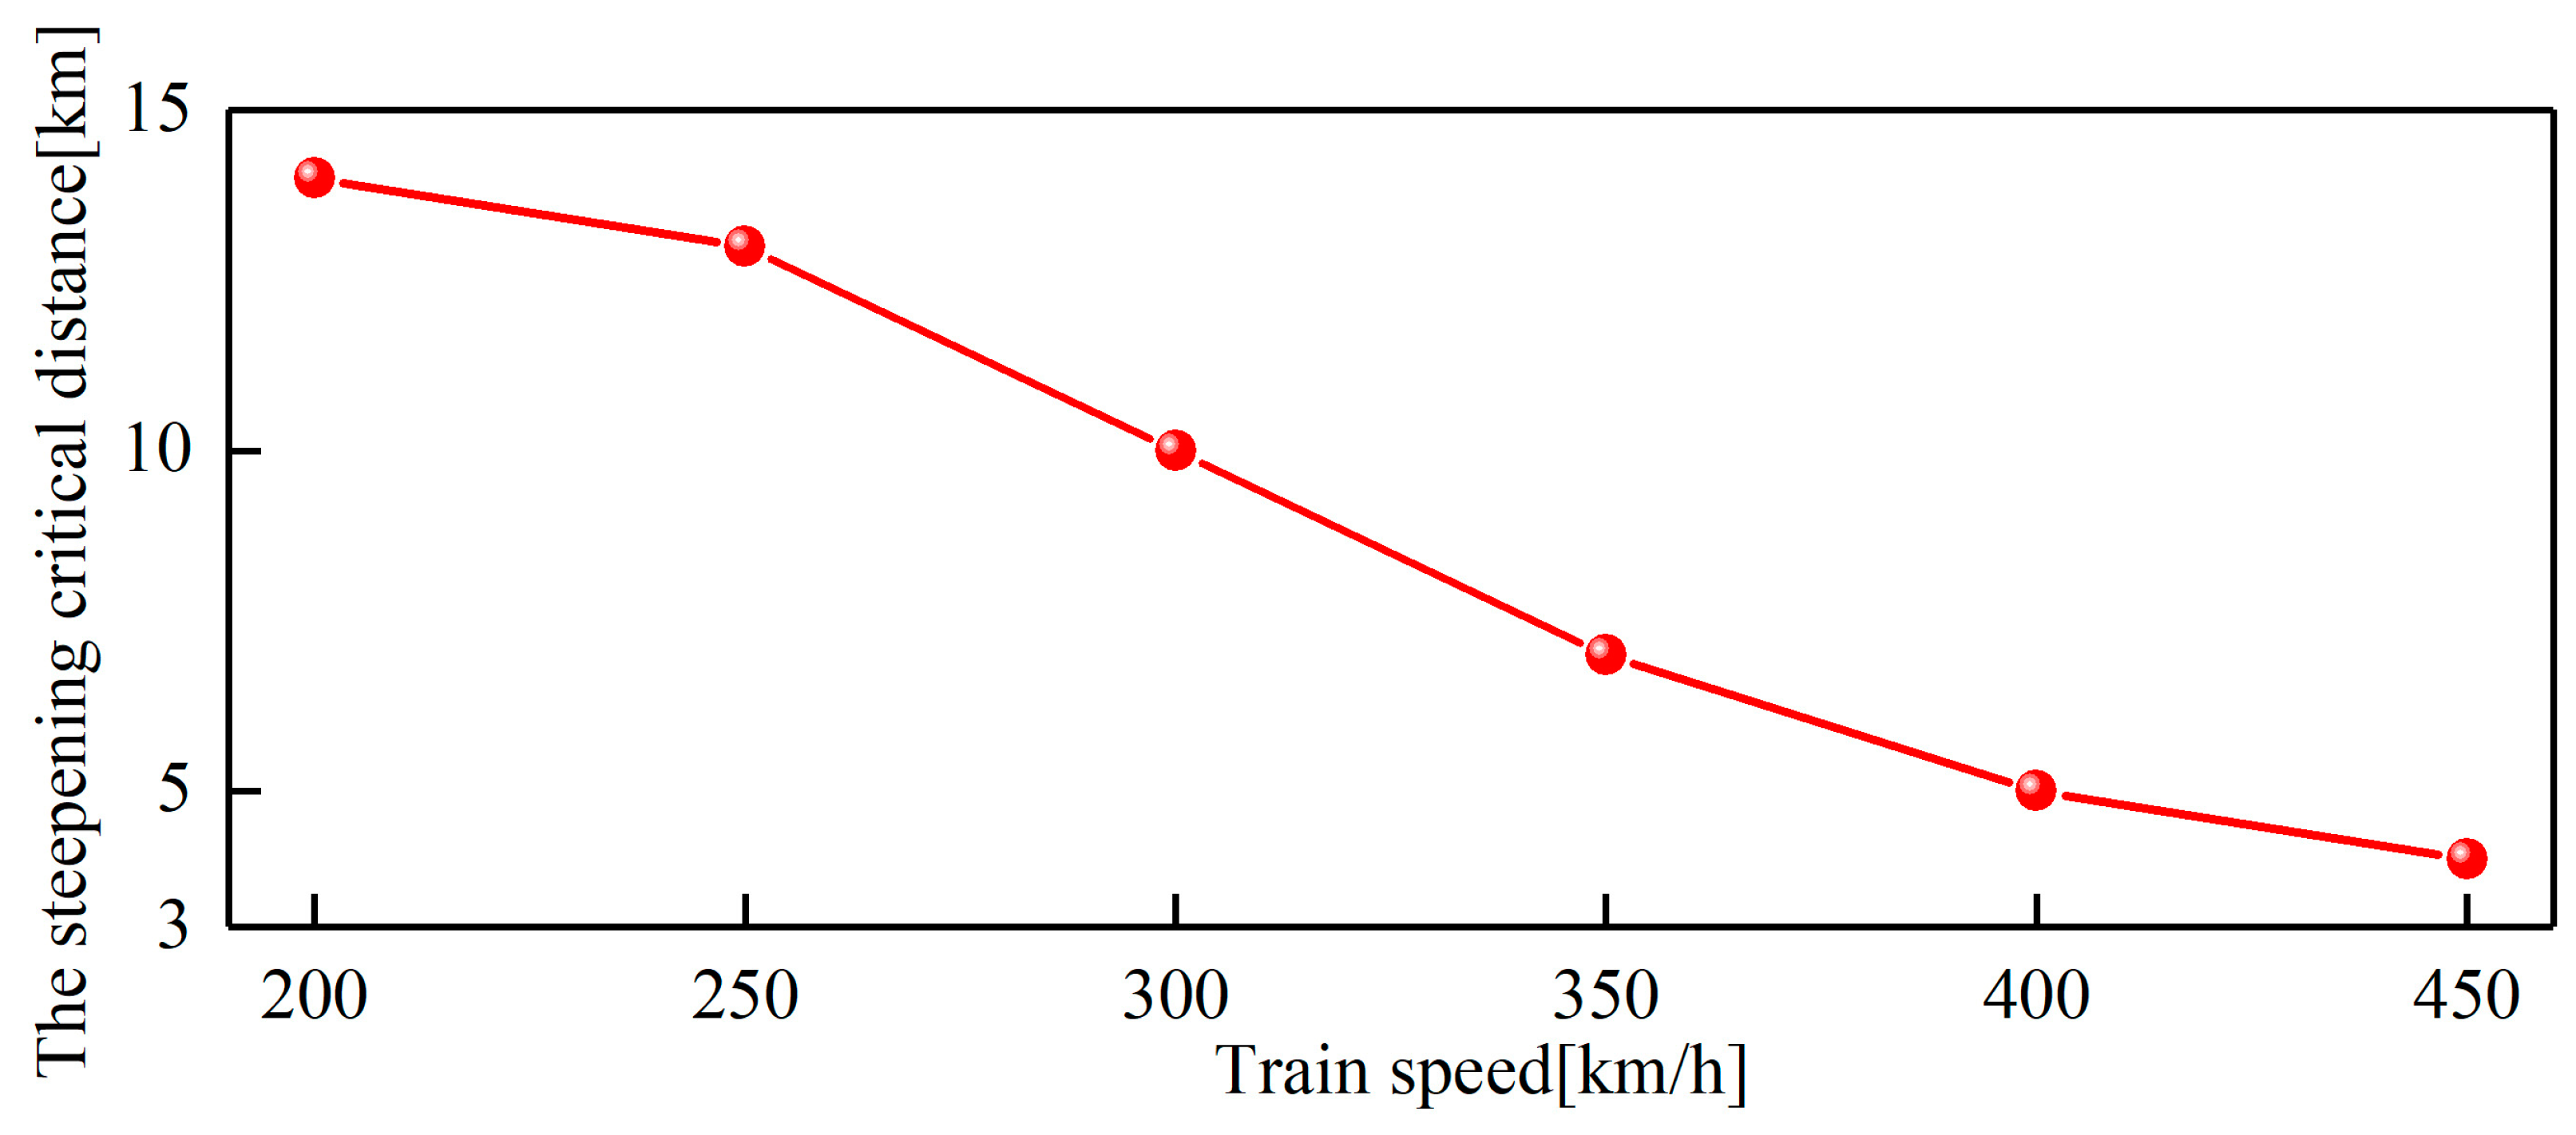
4.7. The Distribution Characteristics of Steepening Critical Distance of Compression Waves at Different Train Speeds

During the propagation of compression waves in tunnels, there is a tendency for the pressure gradient to increase. Moreover, the larger the initial compression wave pressure gradient, the more significant the steepening during the propagation of compression waves. This section discusses the influence of train speeds on the evolution process of compression waves.
Figure 24 shows the variation patterns of the maximum pressure gradient with propagation distance at different train speeds. Figure 25 depicts the variation pattern of the steepening critical distances with train speeds. The initial compression wave pressure gradient increases with the increase in train speed. The larger the pressure gradient of the initial compression waves, the stronger the nonlinear effect. This induces a higher airflow velocity, resulting in stronger frictional effects. Therefore, as the train speed increases, both the nonlinear effects and frictional effects are enhanced. The steepening critical distance shortens with the increasing train speed. Without the tunnel entrance hood, at train speeds of 200 km/h, 250 km/h, 300 km/h, 350 km/h, 400 km/h, and 450 km/h, the steepening critical distances are 14 km, 13 km, 10 km, 7 km, 5 km, and 4 km, respectively. This indicates that, with the increasing train speed, the friction effect becomes more prominent compared to the nonlinear effects. Frictional effects can suppress the steepening process of compression waves, leading to an advance in the steepening critical distance. The steepening extent of compression waves depends on the initial compression wave’s pressure gradient, but ultimately, it is strongly influenced by the frictional effects. The friction effects determine the propagation characteristics of compression waves in the tunnel.

5. Conclusions

Based on the one-dimensional compressible unsteady non-isentropic flow model and the improved generalized Riemann variable characteristic method, this paper elucidates the propagation and evolution characteristics of different initial compression waves.
(1)
When the initial compression waves propagate in very long tunnels, they undergo a steepening phase (characterized by steepening waveform, decreasing wavelength, and increasing pressure gradient) followed by an attenuation phase (characterized by elongation waveform, increasing wavelength, and decreasing pressure gradient). During the steepening phase, the nonlinear effects of the compression waves are stronger than the frictional effects, whereas during the attenuation phase, the opposite is true. Due to the frictional effects, the pressure amplitude decreases continuously during compression wave propagation.
(2)
The pressure gradient of the initial compression waves of the type A tunnel entrance hoods and type B tunnel entrance hoods decreased by 32.38% and 68.11%, respectively. This is compared to the case of no tunnel entrance hood. The tunnel entrance hoods not only reduce the pressure gradient of the initial compression waves but also extend the steepening critical distance.
(3)
Steady frictional effects primarily reduce the pressure amplitude of compression waves without affecting the steepening process of the compression waves. Unsteady frictional effects alter the waveform of the compression waves, reducing the pressure gradient and suppressing the steepening process of the compression waves. The decrease in ambient temperature increases the nonlinear effects of compression waves, reducing viscous dissipation and resulting in an increased steepening rate and attenuation ratio. The degree of the steepening of compression waves depends on the initial compression waves’ pressure gradient and friction effects. As a train’s speed increases, the steepening critical distance shortens.
(4)
The mitigating performance of different tunnel entrance hoods shows a trend of initially increasing and then decreasing with increasing propagation distance. The type A tunnel entrance and type B tunnel entrance hoods achieve maximum reduction rates of 63% and 95%, respectively, at distances of 3 km and 4 km. When assessing the performance of tunnel entrance hoods, it is essential to consider not only their impact on the pressure gradient of initial compression waves but also the propagation characteristics of the initial compression waves in the tunnel. This implies the need to find the optimal matching relationship between tunnel entrance hoods and tunnel length to ensure their mitigating performance is maximized.

Author Contributions

Writing—Review and Editing by K.W., Y.M. and X.H.; Methodology by Y.M.; Data Curation by K.W.; Visualization by Q.S. and X.H.; Funding Acquisition by Y.M. All authors have read and agreed to the published version of the manuscript.

Funding

This work was financially supported by the National Key R&D Program of China (Grant No.2022YFB2603400).

Institutional Review Board Statement

Not applicable.

Informed Consent Statement

Not applicable.

Data Availability Statement

Data are contained within the article.

Conflicts of Interest

The authors declare no conflicts of interest.

References

  1. Niu, J.; Sui, Y.; Yu, Q.; Cao, X.; Yuan, Y. Aerodynamics of railway train/tunnel system: A review of recent research. Energy Built Environ. 2020, 1, 351–375. [Google Scholar] [CrossRef]
  2. Ozawa, S.; Maeda, T.; Matsumura, T.; Uchida, K.; Kajiyama, H.; Tanemoto, K. Countermeasures to reduce micro-pressure waves radiating from exits of Shinkansen tunnels. In Proceedings of the Seventh International Symposium on the Aerodynamics and Ventilation of Vehicle Tunnels, Brighton, UK, 27–29 November 1991. [Google Scholar]
  3. Sturt, R.; Lynch, P.; Burns, R.; Clark, S.; Horton, B.; Derkowski, P.; Keylin, A.; Wilson, N. Aerodynamic Assessment and Mitigation–Design Considerations for High-Speed Rail; Department of Transportation: Washington, DC, USA, 2022; pp. 221–236. [Google Scholar]
  4. Mei, Y. High-Speed Railway Tunnel Aerodynamics, 1st ed.; Science Publishers: Beijing, China, 2009; pp. 40–255. [Google Scholar]
  5. Ozawa, S.; Uchida, T.; Maeda, T. Reduction of micro-pressure wave radiated from tunnel exit by hood at tunnel entrance. Railw. Tech. Res. Inst. Q. Rep. 1978, 19, 77–83. [Google Scholar]
  6. Ozawa, S. Studies of micro-pressure wave radiated from a tunnel exit. Railw. Tech. Res. Rep. 1979, 1121, 1–92. [Google Scholar]
  7. Takayama, K.; Sasoh, A.; Onodera, O.; Kaneko, R.; Matsui, Y. Experimental investigation on tunnel sonic boom. Shock Waves 1995, 5, 127–138. [Google Scholar] [CrossRef]
  8. Murray, P.R.; Howe, M.S. Influence of hood geometry on the compression wave generated by a high-speed train. J. Sound Vib. 2010, 329, 2915–2927. [Google Scholar] [CrossRef]
  9. Saito, S. Optimizing Cross-Sectional Area of Tunnel Entrance Hood for High-Speed Rail. J. Wind. Eng. Ind. Aerodyn. 2019, 184, 296–304. [Google Scholar] [CrossRef]
  10. Ma, W.; Fang, Y.; Li, T.; Shao, M. Effects of Hoods at the Entrances and Exits of High-Speed Railway Tunnels on the Micro-Pressure Wave. Appl. Sci. 2024, 14, 692. [Google Scholar] [CrossRef]
  11. Zhang, J.; Wang, Y.; Han, S.; Wang, F.; Gao, G. A novel arch lattice-shell of enlarged cross-section hoods for micro-pressure wave mitigation at exit of maglev tunnels. Tunn. Undergr. Space Technol. 2023, 132, 104859. [Google Scholar] [CrossRef]
  12. Wang, T.; Feng, Z.; Lu, Y.; Gong, Y.; Zhu, Y.; Zhao, C.; Wang, Y. Study on the mitigation effect of a new type of connected structure on micro-pressure waves around 400 km/h railway tunnel exit. J. Wind. Eng. Ind. Aerodyn. 2023, 240, 105510. [Google Scholar] [CrossRef]
  13. Lin, T.; Yang, M.; Zhang, L.; Wang, T.; Zhong, S. Influence of bionics shark gills tunnel portal on the micro-pressure wave at the tunnel exit. Tunn. Undergr. Space Technol. 2024, 144, 105542. [Google Scholar] [CrossRef]
  14. Kurita, T.; Okumura, Y.; Ichigi, T. Development of train nose shape for reducing micro-pressure waves. JR East Tech. Rev. 2002, 1, 22–28. [Google Scholar]
  15. Hein, D.; Ehrenfried, K.; Heine, G.; Huntgeburth, S. Experimental and theoretical study of the pressure wave generation in railway tunnels with vented tunnel portals. J. Wind. Eng. Ind. Aerodyn. 2018, 176, 290–300. [Google Scholar] [CrossRef]
  16. Mashimo, S.; Nakatsu, E.; Aoki, T.; Matsuo, K. Attenuation and Distortion of a Compression Wave Propagating in a High-Speed Railway Tunnel. JSME Int. J. Ser. B Fluids Therm. Eng. 1997, 40, 51–57. [Google Scholar] [CrossRef]
  17. Mashimo, S.; Nakatsu, E.; Aoki, T.; Funasaki, K.; Matsuo, K. Attenuation and Distorition of Propagating Compression Waves in Shinkansen Tunnel. Eng. Sci. Rep. Kyushu Univ. 1994, 16, 15–22. [Google Scholar]
  18. Fukuda, T.; Iida, M.; Murata, K. Distortion of Compression Wave Propagating through Slab Track Tunnel with Side Branches. Q. Rep. RTRI 2001, 42, 71–76. [Google Scholar] [CrossRef]
  19. Fukuda, T.; Ozawa, S.; Iida, M.; Takasaki, T.; Wakabayashi, Y. Distortion of compression wave propagating through very long tunnel with slab tracks. JSME Int. J. Ser. B Fluids Therm. Eng. 2006, 49, 1156–1164. [Google Scholar] [CrossRef]
  20. Miyachi, T.; Saito, S.; Fukuda, T.; Sakuma, Y.; Ozawa, S.; Arai, T.; Sakaue, S.; Nakamura, S. Propagation characteristics of tunnel compression waves with multiple peaks in the waveform of the pressure gradient: Part 1: Field measurements and mathematical model. Proc. Inst. Mech. Eng. Part F J. Rail Rapid Transit 2016, 230, 1297–1308. [Google Scholar] [CrossRef]
  21. Miyachi, T.; Ozawa, S.; Iida, M.; Fukuda, T.; Arai, T. Propagation characteristics of tunnel compression waves with multiple peaks in the waveform of the pressure gradient: Part 2: Theoretical and numerical analyses. Proc. Inst. Mech. Eng. Part F J. Rail Rapid Transit 2016, 230, 1309–1317. [Google Scholar] [CrossRef]
  22. Tielkes, T.; Kaltenbach, H.J.; Hieke, M.; Deeg, P.; Eisenlauer, M. Measures to counter-act micro-pressure waves radiating from tunnel exits of DB’s new Nuremberg-Ingolstadt high-speed line: Noise and Vibration Mitigation for Rail Transportation Systems. In Proceedings of the 9th International Workshop on Railway Noise, Munich, Germany, 4–8 September 2007. [Google Scholar]
  23. Adami, S.; Kaltenbach, H.J. Sensitivity of the wave-steepening in railway tunnels with respect to the friction model. In Proceedings of the 6th International Colloquium on: Bluff Body Aerodynamics and Applications, Milano, Italy, 20–24 July 2008. [Google Scholar]
  24. Wu, J.; Shi, X.; Wan, X. Study on intensification and mitigation methods of micro pressure wave of double track tunnel in 300 to 350 km/h high speed railway. China Civ. Eng. J. 2017, 50, 209–214. [Google Scholar]
  25. Nakamura, S.; Sasa, D.; Aoki, T. Attenuation and distortion of compression waves propagating in very long tube. J. Therm. Sci. 2011, 20, 53–57. [Google Scholar] [CrossRef]
  26. Okubo, H.; Fukuda, T.; Miyachi, T.; Saito, S. Prediction of the Micro-pressure Waves Using an Unsteady Acoustic Analysis. Q. Rep. RTRI 2020, 61, 278–283. [Google Scholar] [CrossRef]
  27. Wang, H.; Lei, B.; Bi, H.; Yu, T. Wavefront evolution of compression waves propagating in high speed railway tunnels. J. Sound Vib. 2018, 431, 105–121. [Google Scholar] [CrossRef]
  28. Iyer, R.S.; Kim, D.H.; Kim, H.D. Propagation characteristics of compression wave in a high-speed railway tunnel. Phys. Fluids 2021, 33, 086104. [Google Scholar] [CrossRef]
  29. Wang, K.; Xiong, X.; Wen, C.; Chen, G.; Liang, X.; Huang, H.; Wang, J. Formation and propagation characteristics of a weak shock wave in maglev tube. Phys. Fluids 2024, 36, 036120. [Google Scholar] [CrossRef]
  30. Yoon, T.; Lee, S. Efficient prediction methods for the micro-pressure wave from a high-speed train entering a tunnel using the Kirchhoff formulation. J. Acoust. Soc. Am. 2001, 110, 2379–2389. [Google Scholar] [CrossRef] [PubMed]
  31. Rivero, J.M.; González-Martínez, E.; Rodríguez-Fernández, M. A methodology for the prediction of the sonic boom in tunnels of high-speed trains. J. Sound Vib. 2019, 446, 37–56. [Google Scholar] [CrossRef]
  32. Baron, A.; Molteni, P.; Vigevano, L. High-speed trains: Prediction of micro-pressure wave radiation from tunnel portals. J. Sound Vib. 2006, 296, 59–72. [Google Scholar] [CrossRef]
  33. Zielke, W. Frequency-Dependent Friction in Transient Pipe Flow. J. Base Eng. Trans ASME 1968, 90, 109–115. [Google Scholar] [CrossRef]
  34. Vardy, A.E.; Brown, J.M. Transient, turbulent, smooth pipe friction. J. Hydraul. Res. 1995, 33, 435–456. [Google Scholar] [CrossRef]
  35. Trikha, A.K. An Efficient Method for Simulating Frequency-Dependent Friction in Transient Liquid Flow. ASME J. Fluids Eng. 1975, 97, 97–105. [Google Scholar] [CrossRef]
  36. Vardy, A.E.; Brown, J.M. An overview of wave propagation in tunnels. In TRANSAERO—A European Initiative on Transient Aerodynamics for Railway System Optimisation; Springer: Berlin/Heidelberg, Germany, 2002; pp. 249–266. [Google Scholar]
  37. Vardy, A.E.; Brown, J.M. Transient turbulent friction in fully rough pipe flows. J. Sound Vib. 2004, 270, 233–257. [Google Scholar] [CrossRef]
  38. Mohamed, S.G.; Ghidaoui, M.S.; Mansour, S. Efficient treatment of the Vardy–Brown unsteady shear in pipe transients. J. Hydraul. Eng. 2002, 128, 102–112. [Google Scholar]
  39. Tanaka, T.; Aoki, T. Characteristics of unsteady boundary layer induced by the compression wave propagating in a tunnel. Open J. Fluid Dyn. 2012, 2, 257–263. [Google Scholar] [CrossRef]
  40. Fukuda, T.; Iida, M.; Maeda, T.; Maeno, K.; Honma, H. Investigation of Compression Wave Propagating in Slab Track Tunnel of High-Speed Railway (1st Report, Field Test and One-Dimensional Numerical Analysis). Jpn. Soc. Mech. Eng. 1998, 64, 1391–1397. [Google Scholar] [CrossRef]
  41. Liu, Z.; Soper, D.; Hemida, H.; Chen, B. A study of the influence of separation bubbles around a generic freight train on pressure waves inside tunnels using 1D and 3D numerical methods. J. Wind. Eng. Ind. Aerodyn. 2023, 240, 105461. [Google Scholar] [CrossRef]
  42. Abd El-Rahman, A.I.; Sabry, A.S.; Mobarak, A. Non-linear simulation of single pass perforated tube silencers based on the method of characteristics. J. Sound Vib. 2004, 278, 63–81. [Google Scholar] [CrossRef]
  43. William-Louis, M.J.P.; Tounier, C. Non-homentropic flow generated by trains in tunnels with side branchs. Int. J. Numer. Methods Heat Fluid Flow 1998, 8, 183–198. [Google Scholar] [CrossRef]
  44. Woods, W.A.; Pope, C.W. A generalized flow prediction method for the unsteady flow generated by a train in a single tunnel. J. Wind. Eng. Ind. Aerodyn. 1981, 7, 331–360. [Google Scholar] [CrossRef]
  45. Wang, H. Wavefront Evolution during the Propagation of Compression Wave and Micro-Pressure Wave. Ph.D. Thesis, Southwest Jiaotong University, Chengdu, China, 20 May 2015. [Google Scholar]
Figure 1. Schematic diagram of high-speed train’s head type: (a) side view; (b) front view.
Applsci 14 05946 g001
Figure 2. Schematic diagram of tunnel entrance hoods: (a) no tunnel entrance hood; (b) oblique enlarged tunnel entrance hood; (c) expanded equal section non-uniform opening holes tunnel entrance hood.
Applsci 14 05946 g002
Figure 3. Comparison of different initial compression waves’ pressure histories and pressure gradient histories.
Applsci 14 05946 g003
Figure 4. The one-dimensional and three-dimensional characteristics of the initial compression waves.
Applsci 14 05946 g004
Figure 5. Discrete grids and interpolated points.
Applsci 14 05946 g005
Figure 6. Flowchart of the one-dimensional flow model program calculation.
Applsci 14 05946 g006
Figure 7. Comparison of the field-measured [45] and numerically calculated compression wave pressure histories.
Applsci 14 05946 g007
Figure 8. Comparison of the field-measured and numerically calculated data for the Shinkansen tunnel [18]: (a) compression wave pressure histories; (b) pressure gradient histories.
Applsci 14 05946 g008
Figure 9. Comparison of field-measured and numerically calculated data at different measurement points [23]: (a) compression wave pressure histories; (b) max pressure gradients.
Applsci 14 05946 g009
Figure 10. Comparison of the different unsteady friction models: (a) compression wave pressure histories; (b) max pressure gradients.
Applsci 14 05946 g010aApplsci 14 05946 g010b
Figure 11. Characteristics of generation and propagation of initial compression waves: (a) generation of initial compression waves; (b) propagation of initial compression waves.
Applsci 14 05946 g011
Figure 12. The pressure waveforms at different measurement points during the propagation of compression waves.
Applsci 14 05946 g012
Figure 13. The variation pattern of wavelength with the propagation distance.
Applsci 14 05946 g013
Figure 14. The variation pattern of max pressure gradient with wavelength.
Applsci 14 05946 g014
Figure 15. The compression waves waveform and pressure gradients at different measurement points during the propagation of the compression waves: (a) compression waves waveform; (b) pressure gradient.
Applsci 14 05946 g015
Figure 16. The variations in maximum pressure gradient and steepening rate with propagation distance.
Applsci 14 05946 g016
Figure 17. The variation patterns of maximum pressure amplitude and attenuation ratio with propagation distance.
Applsci 14 05946 g017
Figure 18. The impact characteristics of friction terms on the propagation of compression waves waveform: (a) no tunnel entrance hood; (b) type A tunnel entrance hoods; (c) type B tunnel entrance hoods.
Applsci 14 05946 g018aApplsci 14 05946 g018b
Figure 19. The influence of friction terms on the steepening rate: (a) no tunnel entrance hood; (b) type A tunnel entrance hoods; (c) type B tunnel entrance hoods.
Applsci 14 05946 g019aApplsci 14 05946 g019b
Figure 20. The influence of friction terms on the attenuation ratio: (a) no tunnel entrance hood; (b) type A tunnel entrance hoods; (c) type B tunnel entrance hoods.
Applsci 14 05946 g020aApplsci 14 05946 g020b
Figure 21. Effect of temperature on the steepening rate and attenuation ratio: (a) steepening rate; (b) attenuation ratio.
Applsci 14 05946 g021
Figure 22. The max pressure gradient at a propagating distance of 500 m.
Applsci 14 05946 g022
Figure 23. The impact of tunnel entrance hoods on the reduction rate of maximum pressure gradient.
Applsci 14 05946 g023
Figure 24. The variation patterns of the max pressure gradient with propagation distance at different train speeds.
Applsci 14 05946 g024
Figure 25. The variation pattern of steepening critical distances with train speeds.
Applsci 14 05946 g025
Disclaimer/Publisher’s Note: The statements, opinions and data contained in all publications are solely those of the individual author(s) and contributor(s) and not of MDPI and/or the editor(s). MDPI and/or the editor(s) disclaim responsibility for any injury to people or property resulting from any ideas, methods, instructions or products referred to in the content.

