Vision-Based Online Molten Pool Image Acquisition and Assessment for Quality Monitoring in Gas–Metal Arc Welding

 ,
,  ,
,  ,
,  and
and
Abstract
:1. Introduction
2. Materials and Methods
2.1. Welding Conditions
2.2. Analysis of Spectroscopic Characteristics and Wavelength Band Selection
2.3. System Configuration
2.3.1. Vision Camera
2.3.2. Lens
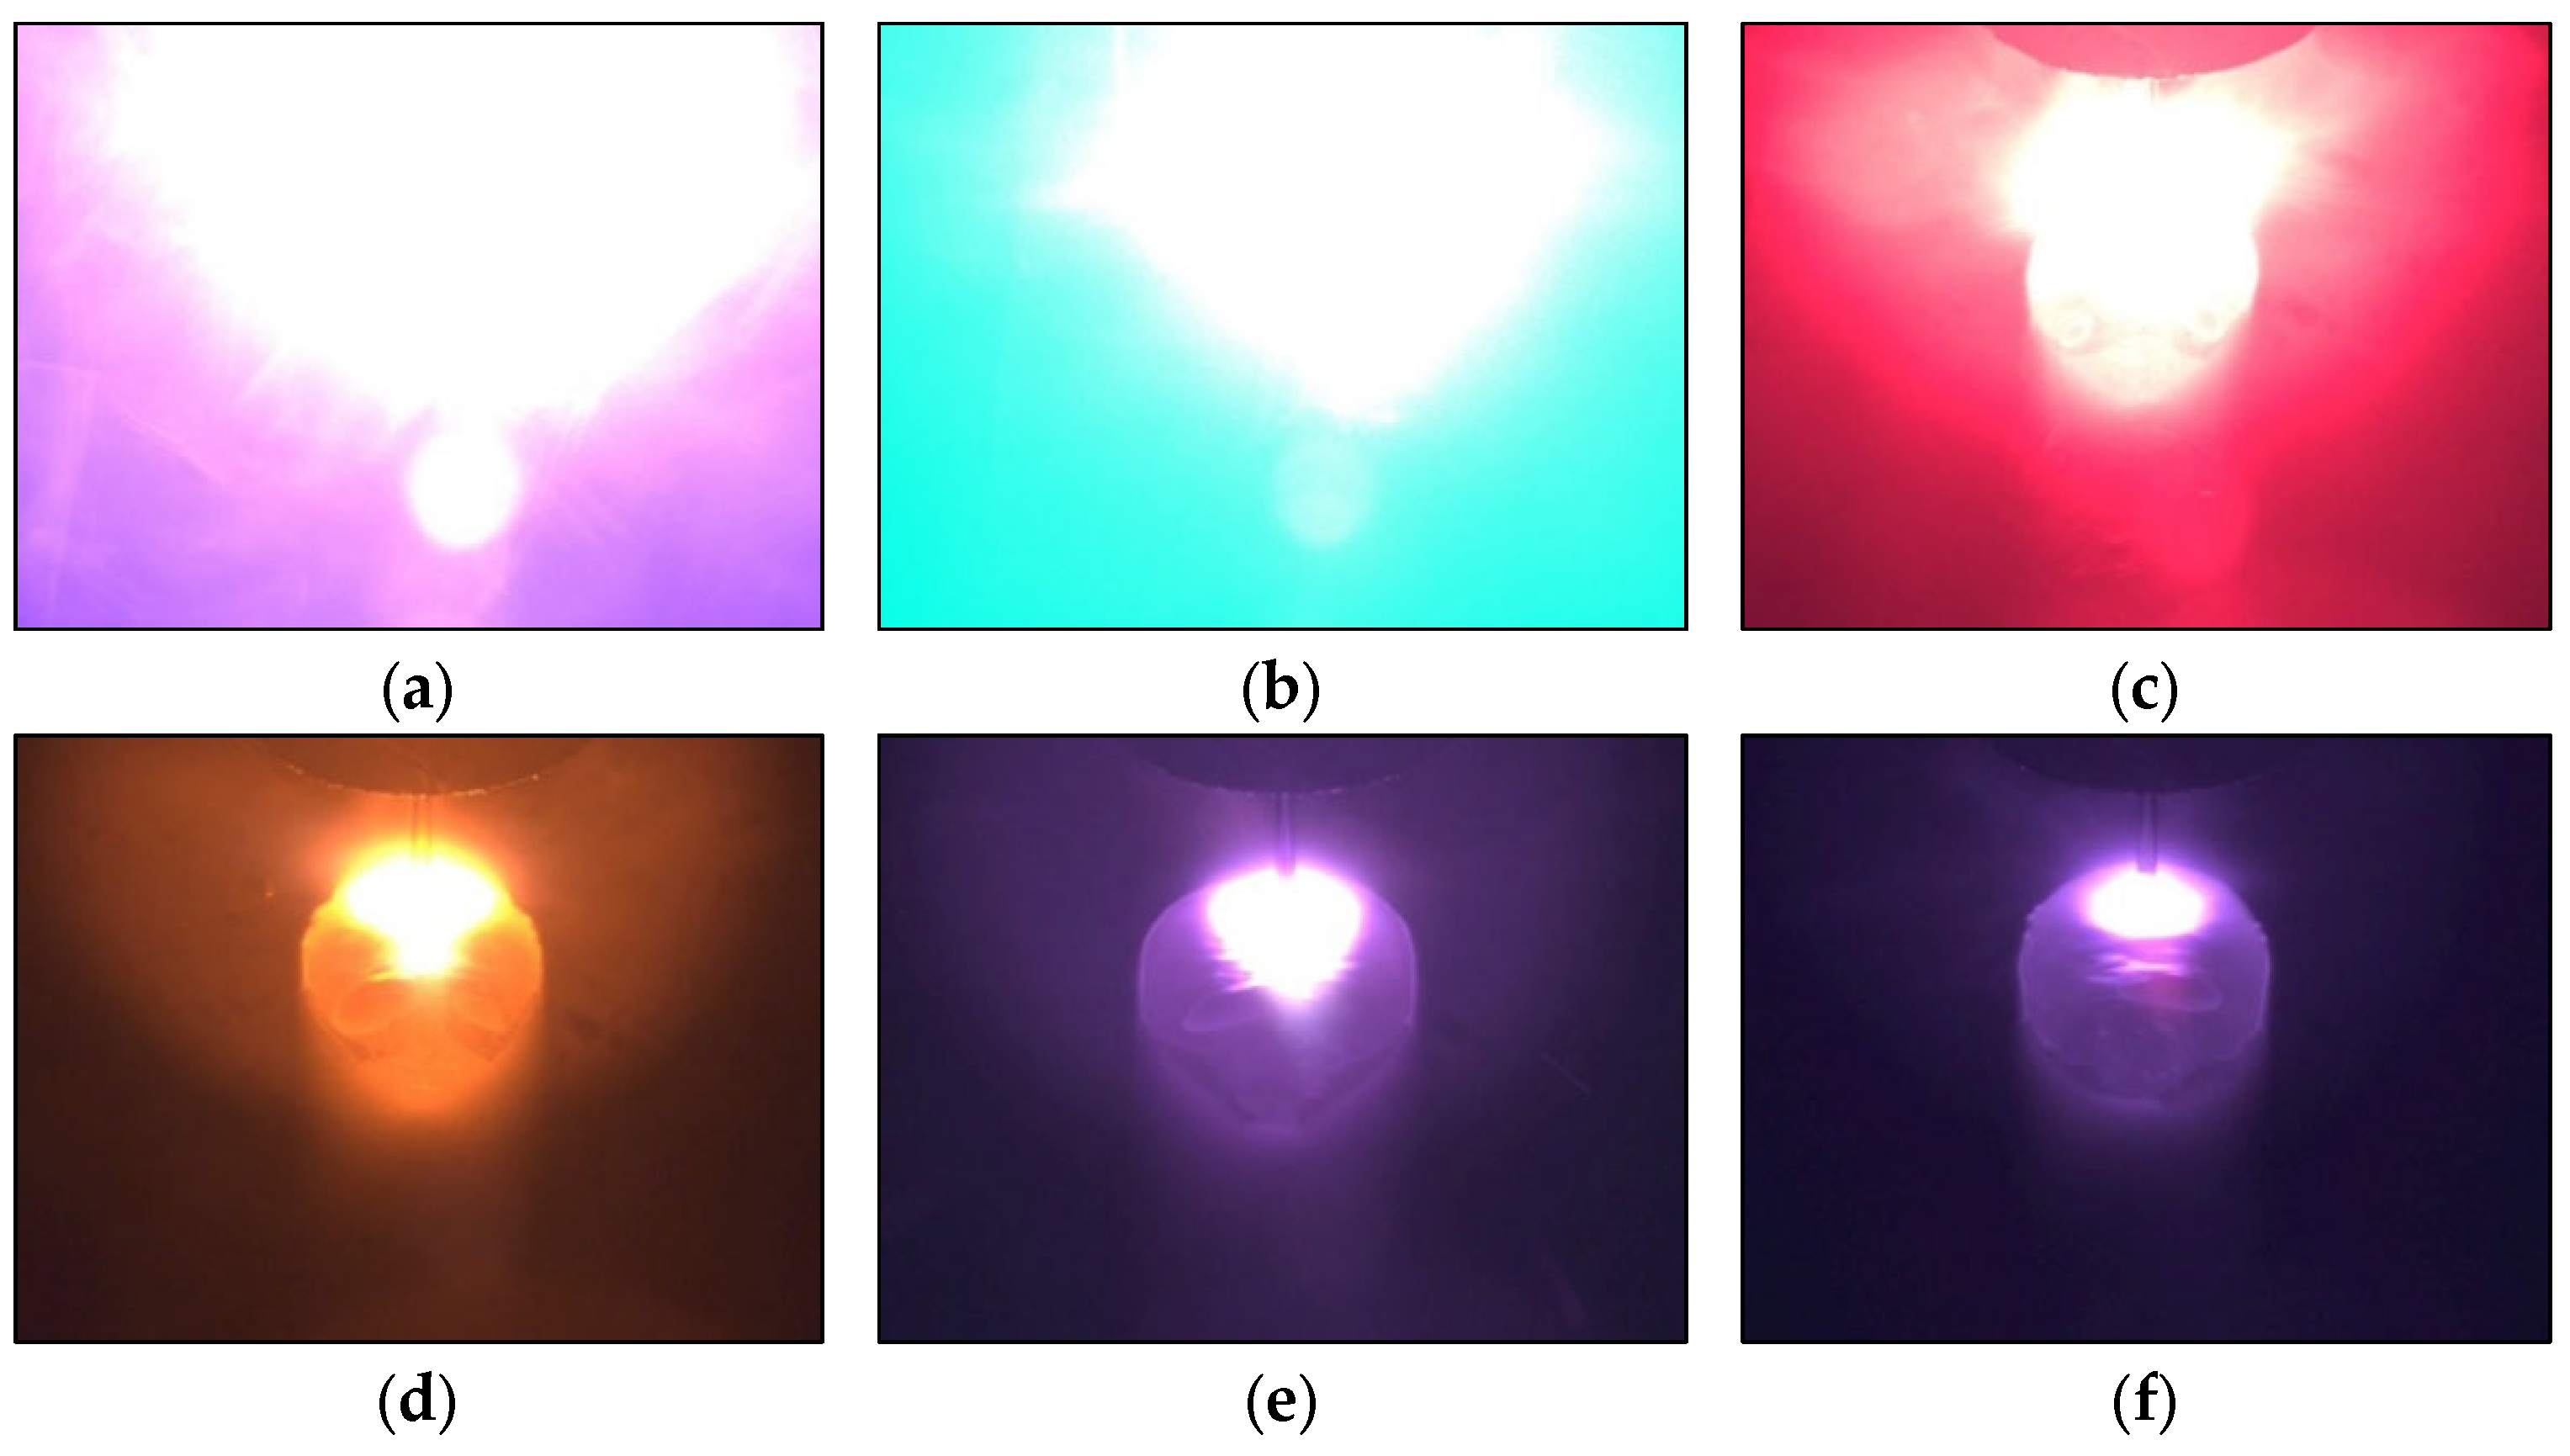
2.3.3. Filter
2.4. Image Quality Assessment
3. Results and Discussion
3.1. Spectroscopic Characteristics
3.2. Image Acquisition
3.3. Image Quality Assessment
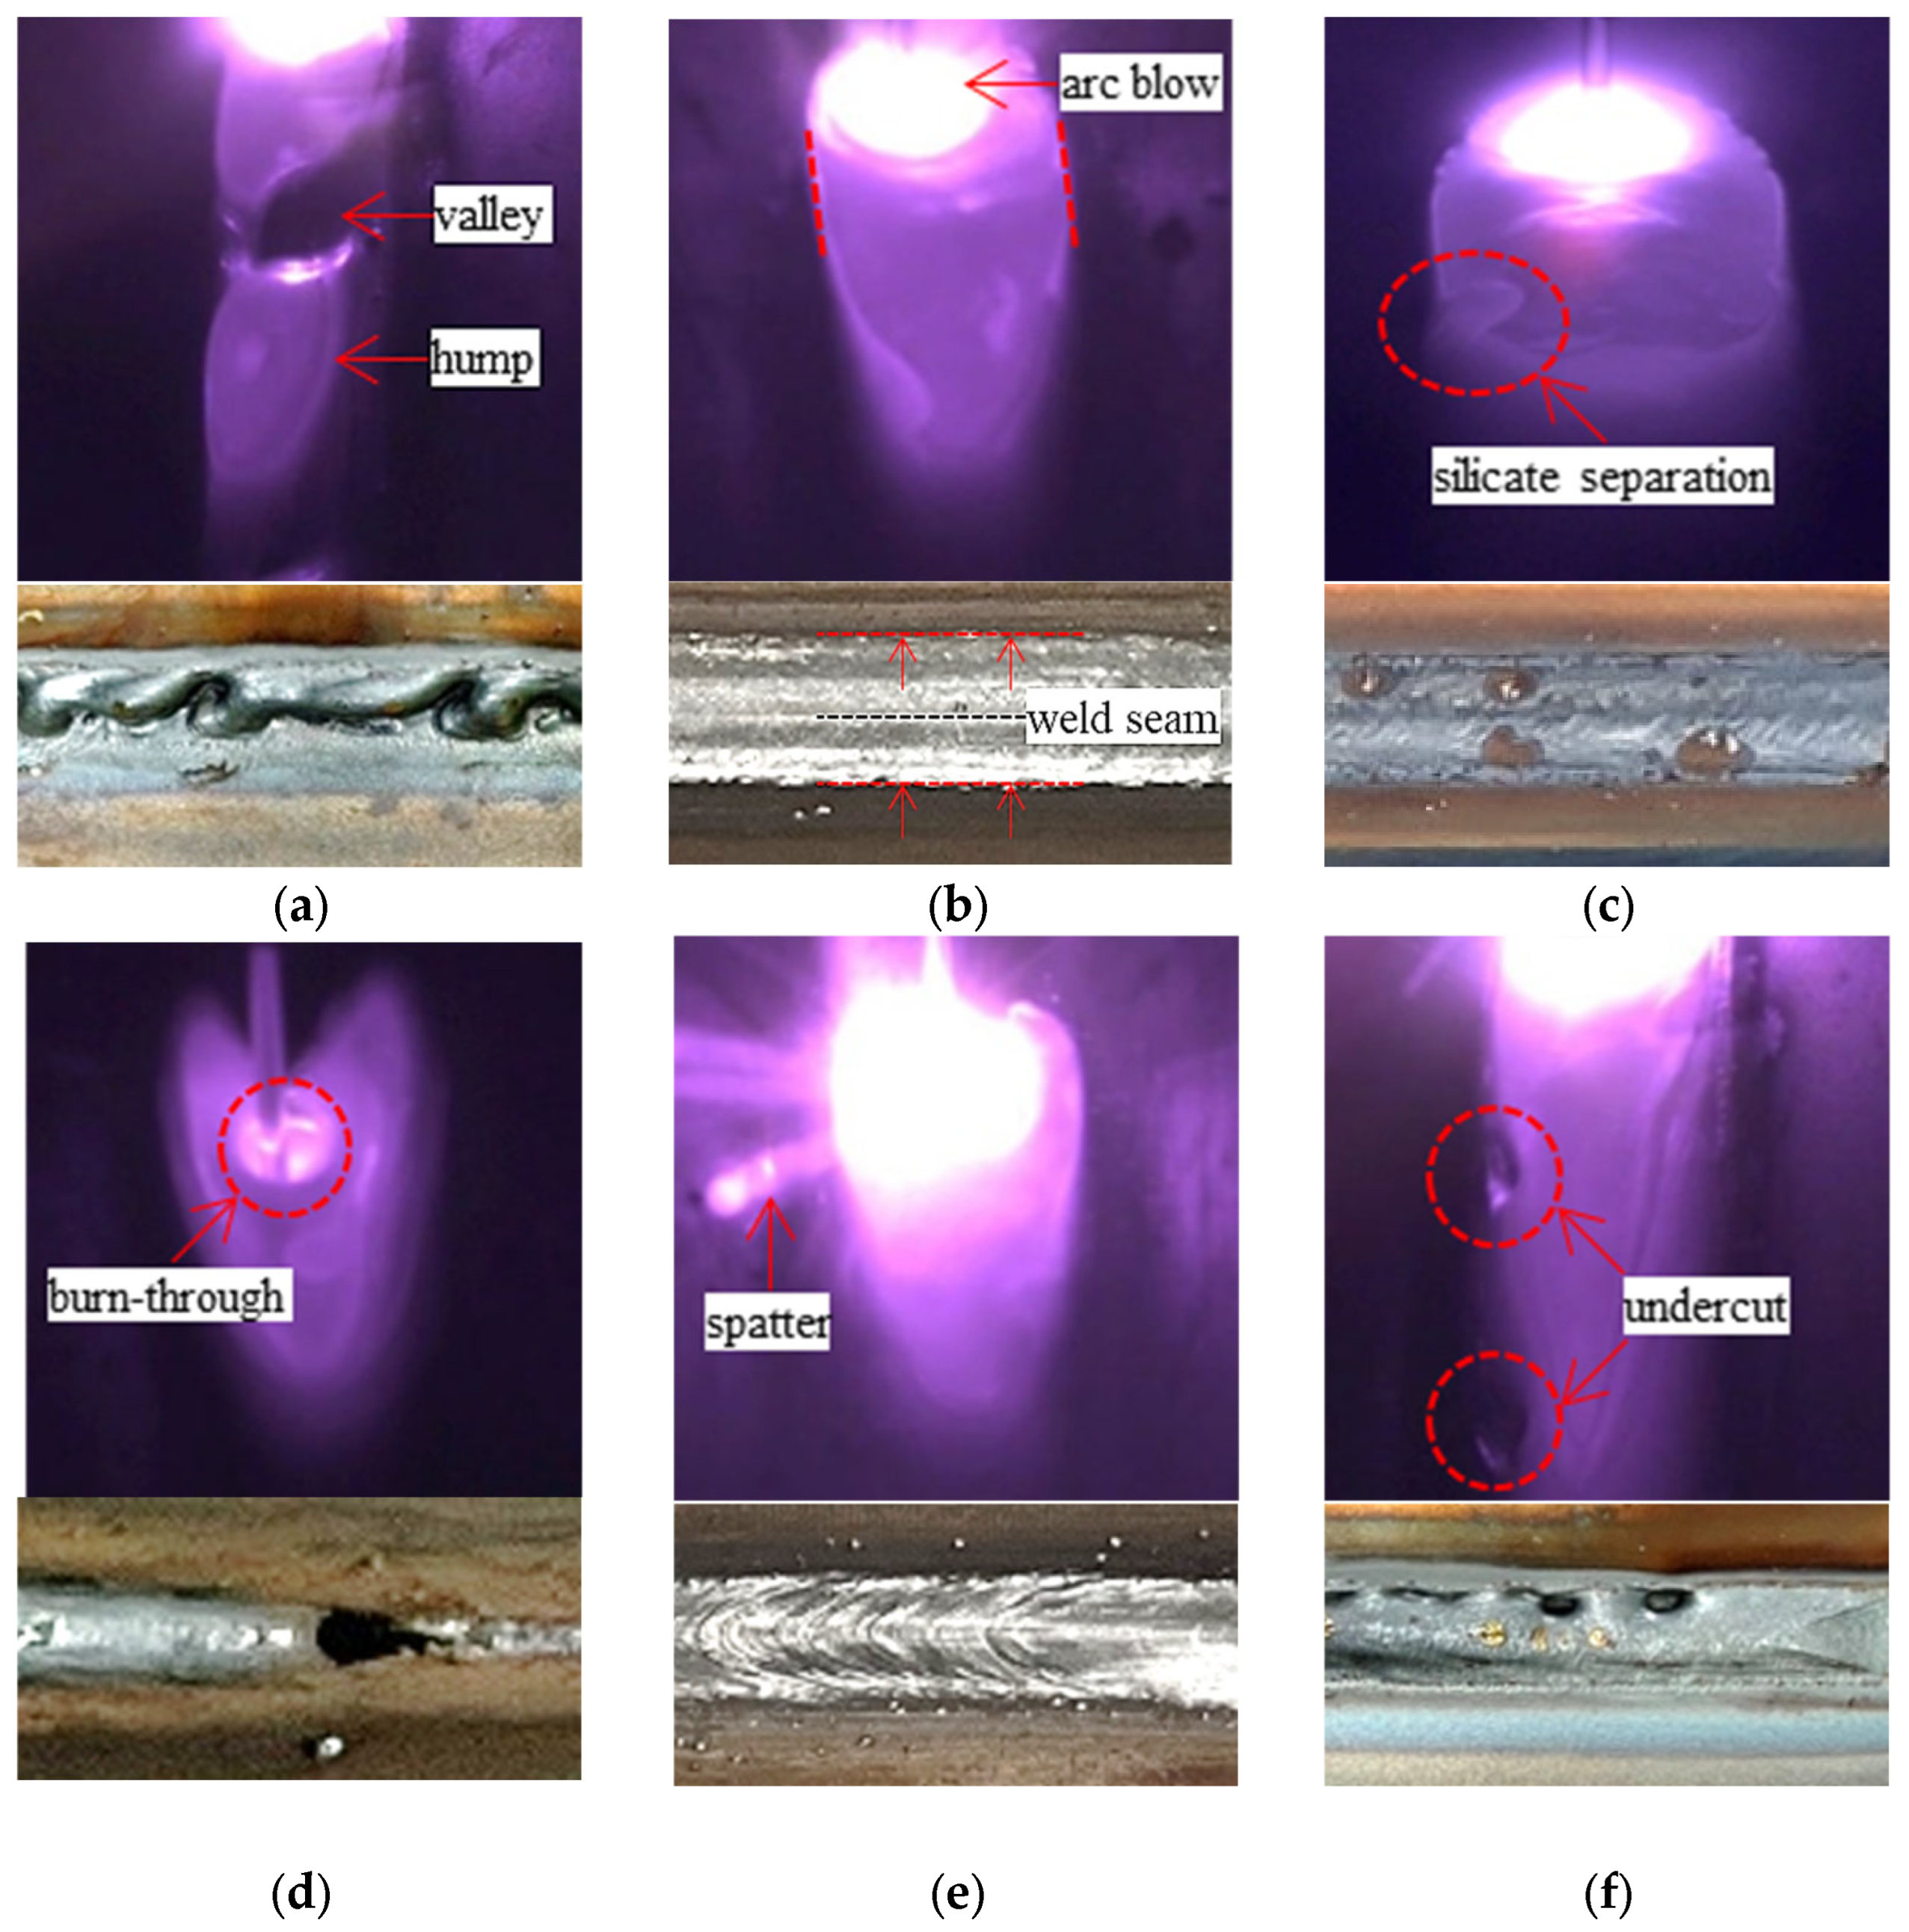
3.4. Molten Pool Quality Monitoring
4. Conclusions
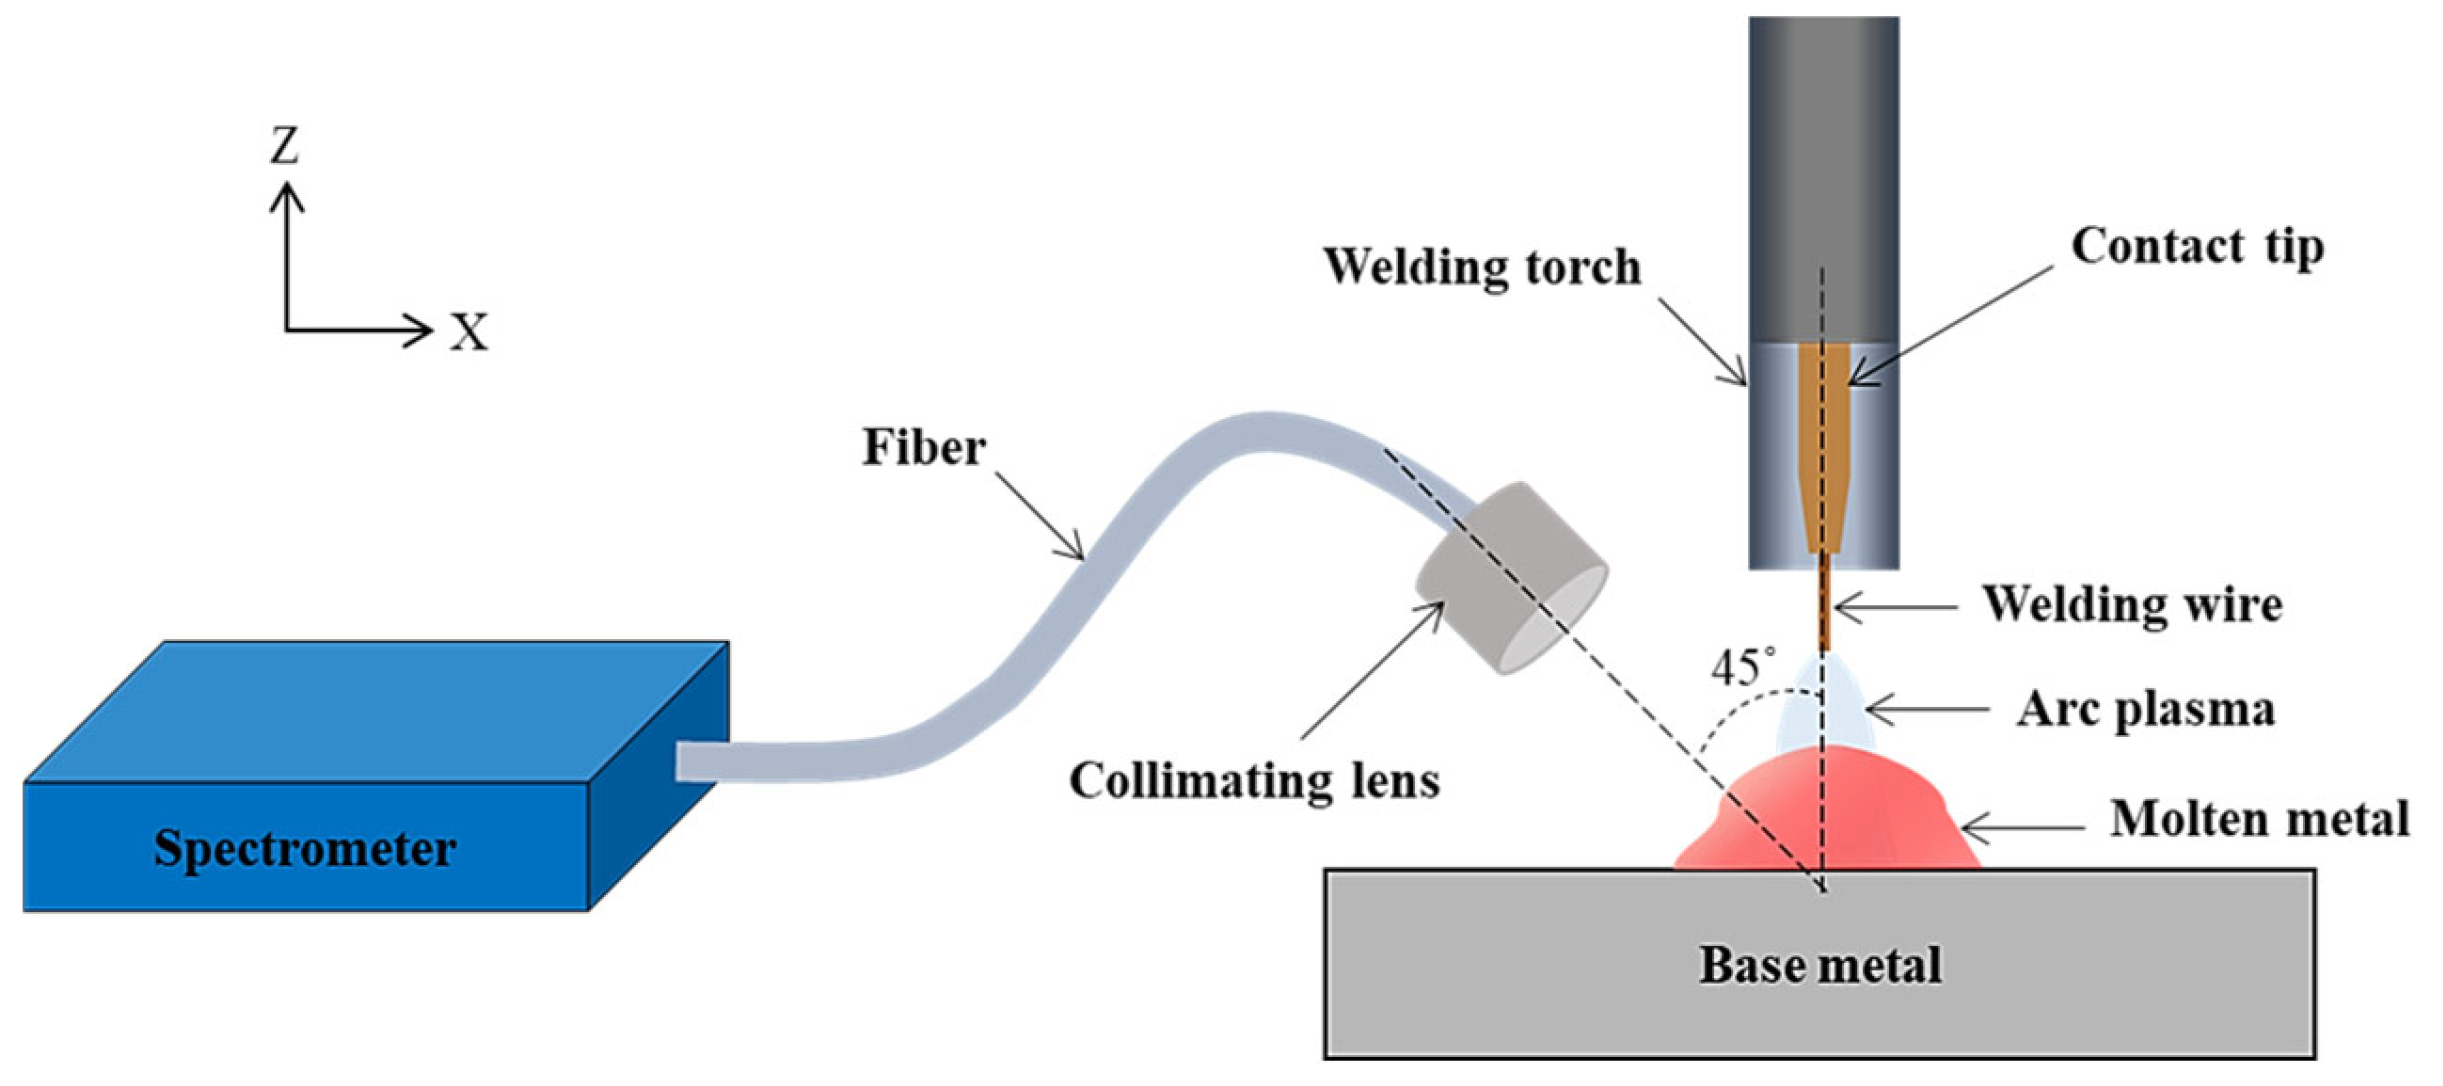
- Accurate measurement of radiation is crucial for clearly observing the molten pool during welding. In this study, the radiation was measured by aligning the collimating lens of the spectrometer, similar to the distance and angle between the weld and camera.
- The selection of an appropriate lens in combination with a camera is essential for effective monitoring during welding. Factors such as the f-number, light throughput, and diffraction limit must be considered. The focal length was selected based on the ROI size and working distance between the image sensor and weld. In this study, a lens with an f-number of f/4 and focal length of 16 mm was proposed for molten pool monitoring during mild-steel GMAW.
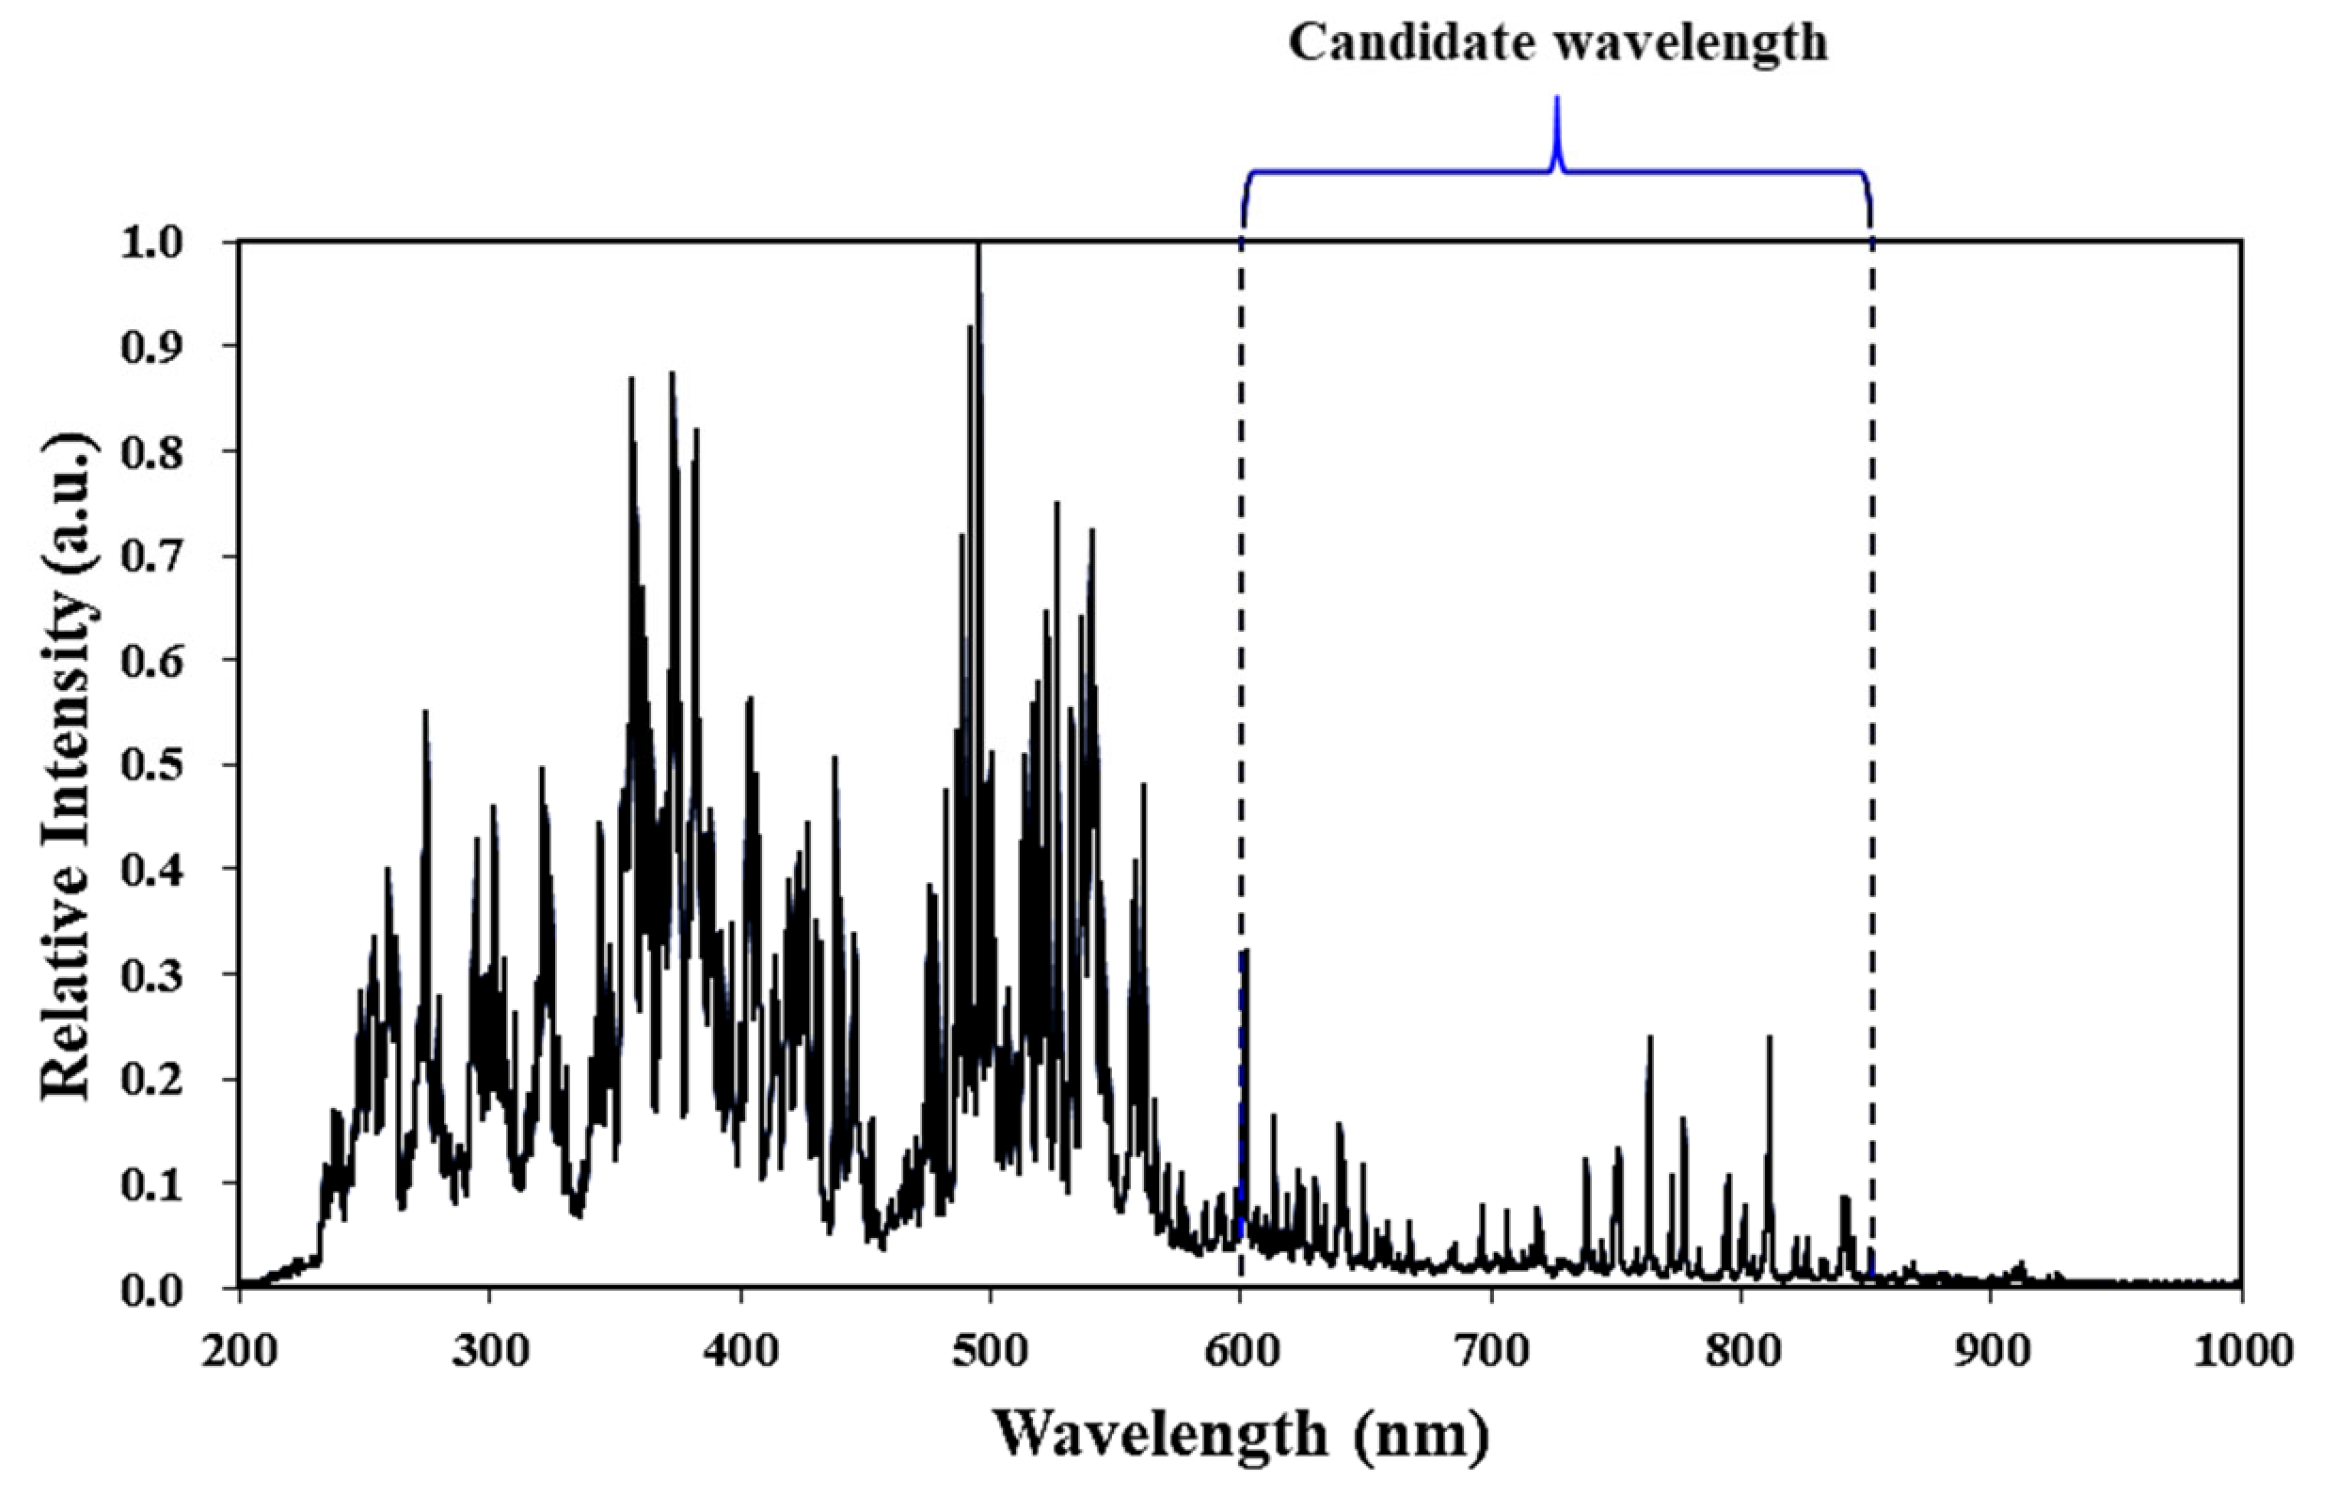
- During mild-steel GMAW, the imaging wavelength band with the least interference from the arc plasma and the most suitable for molten pool observation was 830 nm, with a BRISQUE score of 52.03.
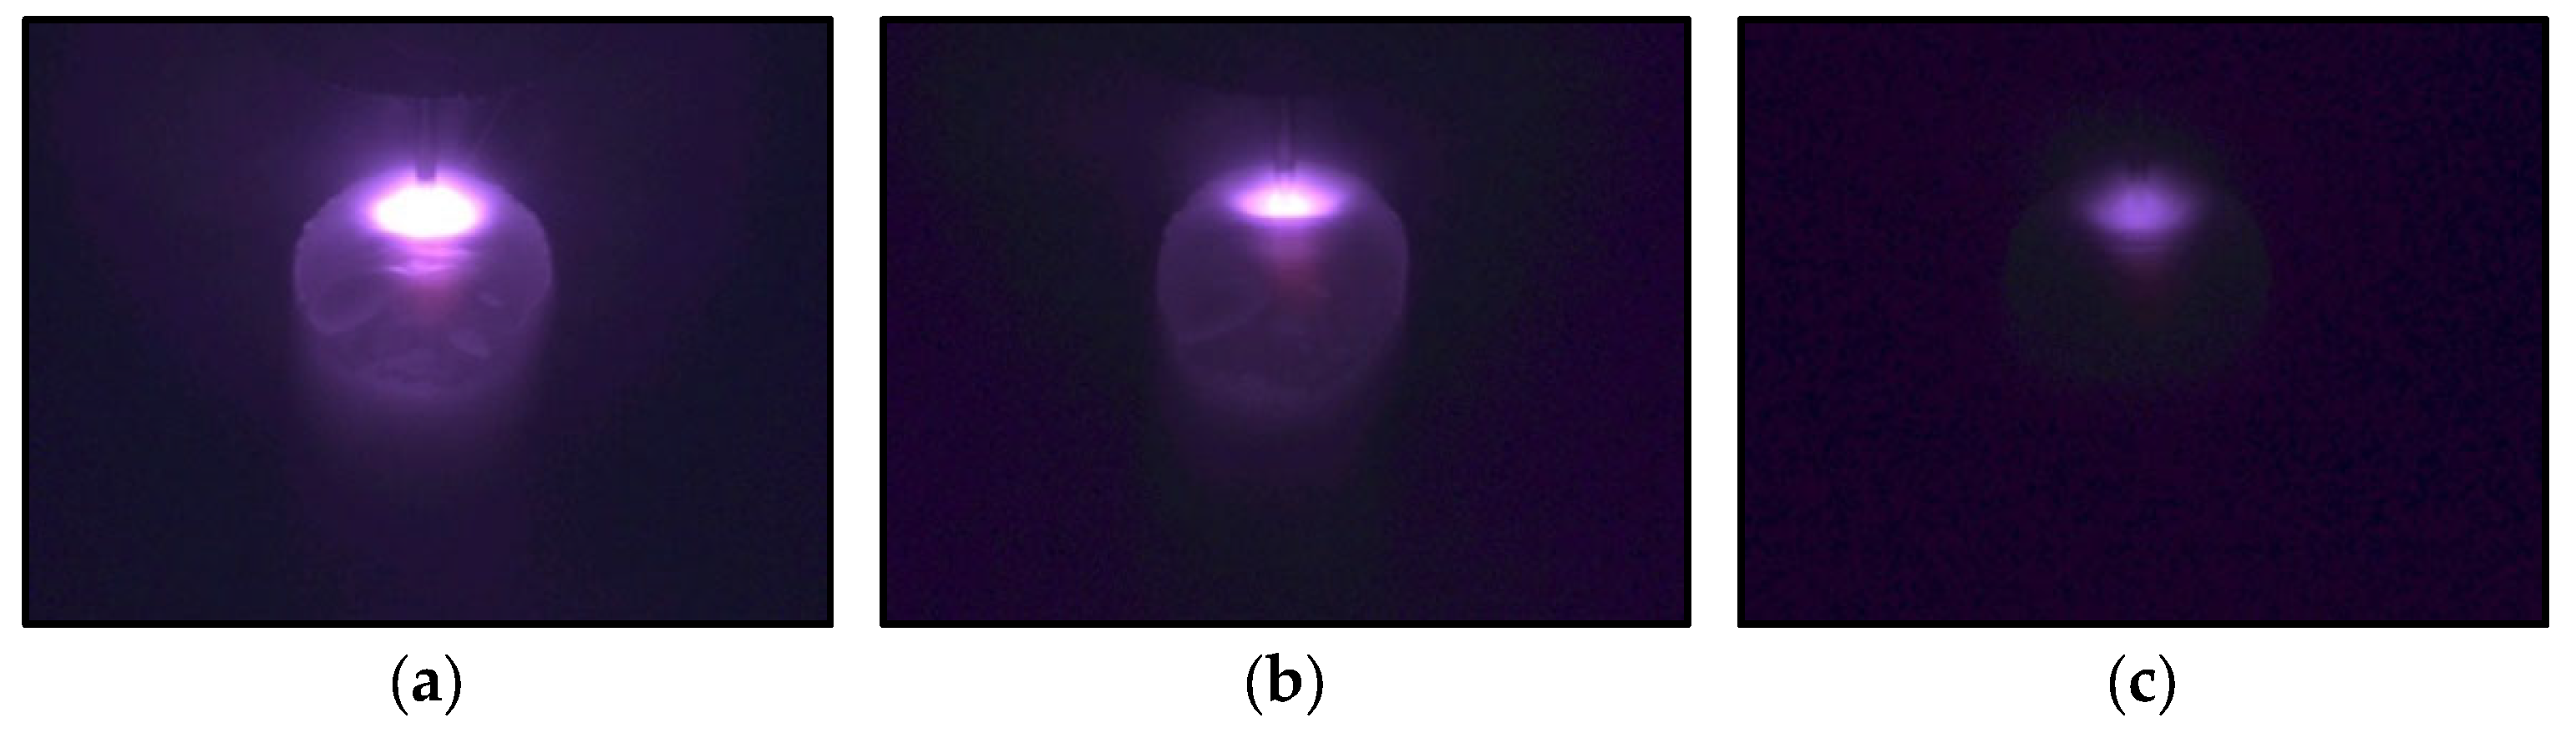
- To capture the information of the molten pool with less noise in the image during mild-steel GMAW, the combination of an 830 nm band-pass filter and an OD1.0 ND filter is the most suitable. It possessed a BRISQUE score of 15.3, which was the best score.
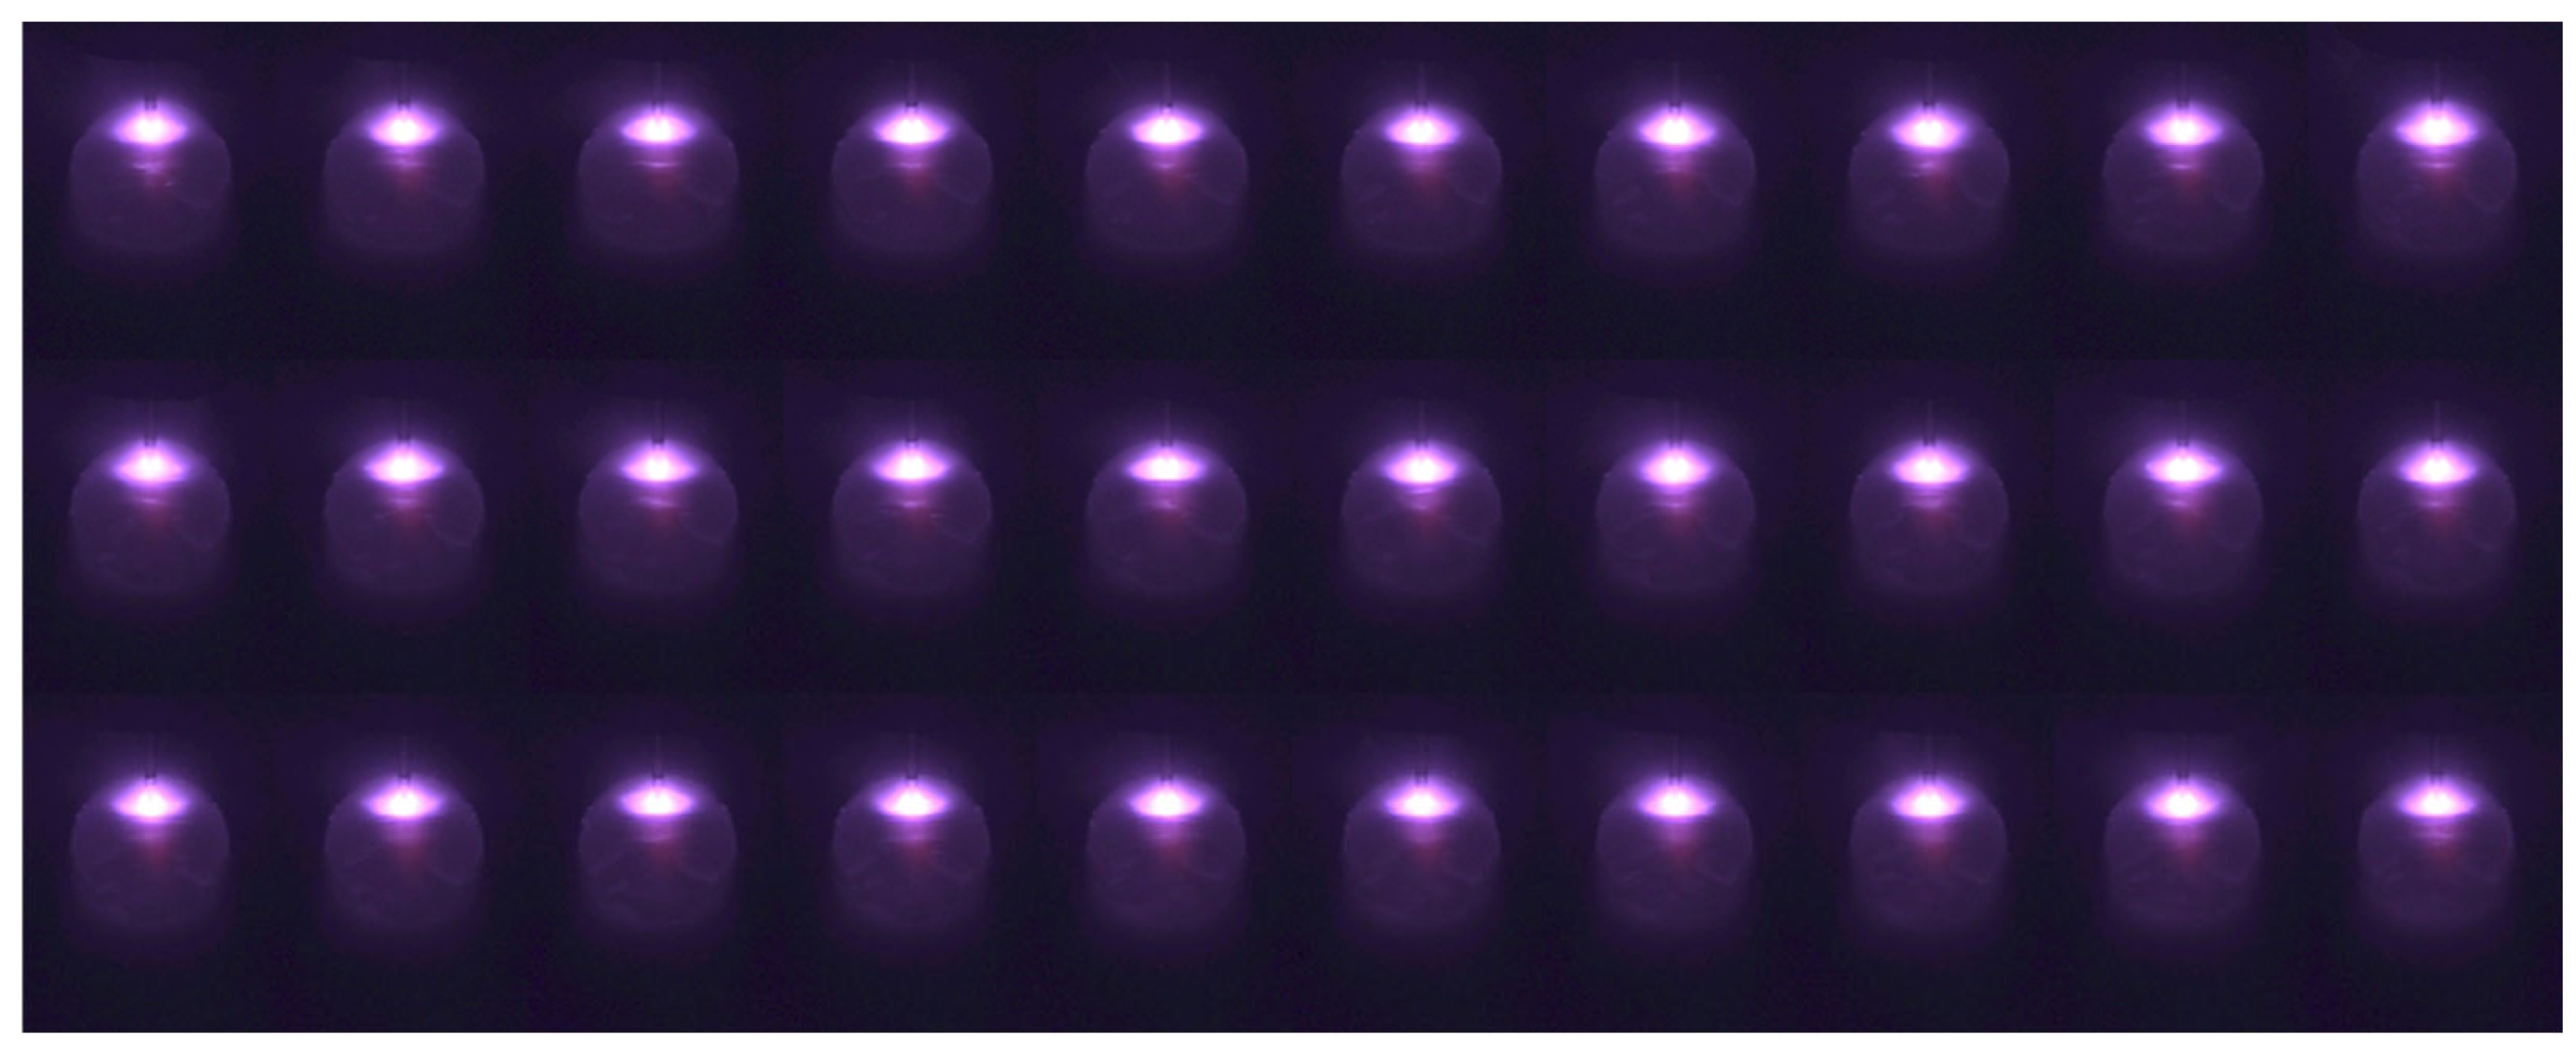
- Image-quality assessment using BRISQUE confirmed that the image acquired with the proposed optical design method was suitable for monitoring with the highest quality, consistent with the assessment scores.
Author Contributions
Funding
Institutional Review Board Statement
Informed Consent Statement
Data Availability Statement
Conflicts of Interest
Correction Statement
References
- Ma, X.; Zhang, Y. Gas metal arc weld pool surface imaging: Modeling and processing. Weld. J. 2011, 90, 85s–94s. [Google Scholar]
- Kovacevic, R.; Zhang, Y.M.; Ruan, S. Sensing and Control of Weld Pool Geometry for Automated GTA Welding. J. Eng. Ind. 1995, 117, 210–222. [Google Scholar] [CrossRef]
- Liu, Y.; Shi, L.; Tian, X. Weld seam fitting and welding torch trajectory planning based on NURBS in intersecting curve welding. Int. J. Adv. Manuf. Technol. 2018, 95, 2457–2471. [Google Scholar] [CrossRef]
- Liu, J.; Fan, Z.; Olsen, S.I.; Christensen, K.H.; Kristensen, J.K. Boosting active contours for weld pool visual tracking in automatic arc welding. IEEE Trans. Autom. Sci. Eng. 2015, 14, 1096–1108. [Google Scholar] [CrossRef]
- Wang, Z. Monitoring of GMAW weld pool from the reflected laser lines for real-time control. IEEE Trans. Ind. Inform. 2014, 10, 2073–2083. [Google Scholar] [CrossRef]
- Dong, H.; Cong, M.; Zhang, Y.; Liu, Y.; Chen, H. Modeling and real-time prediction for complex welding process based on weld pool. Int. J. Adv. Manuf. Technol. 2018, 96, 2495–2508. [Google Scholar] [CrossRef]
- Chen, Z.; Chen, J.; Feng, Z. Monitoring Weld Pool Surface and Penetration Using Reversed Electrode Images. Weld. J. 2017. Available online: https://www.osti.gov/servlets/purl/1407780 (accessed on 21 May 2024).
- You, D.; Gao, X.; Katayama, S. WPD-PCA-based laser welding process monitoring and defects diagnosis by using FNN and SVM. IEEE Trans. Ind. Electron. 2014, 62, 628–636. [Google Scholar] [CrossRef]
- Wang, J.J.; Lin, T.; Chen, S.B. Obtaining weld pool vision information during aluminium alloy TIG welding. Int. J. Adv. Manuf. Technol. 2005, 26, 219–227. [Google Scholar] [CrossRef]
- Wu, J.; Chen, S. Software system designs of real-time image processing of weld pool dynamic characteristics. In Robotic Welding, Intelligence and Automation; Springer: Berlin/Heidelberg, Germany, 2007; pp. 303–309. [Google Scholar]
- Zhang, X.; Wang, F.; Chen, Y.; Zhang, H.; Liu, L.; Wang, Q. Weld joint penetration state sequential identification algorithm based on representation learning of weld images. J. Manuf. Process. 2024, 120, 192–204. [Google Scholar] [CrossRef]
- Hong, Y.; Yang, M.; Yuan, R.; Du, D.; Chang, B. A Novel Quality Monitoring Approach Based on Multigranularity Spatiotemporal Attentive Representation Learning During Climbing GTAW. IEEE Trans. Ind. Inform. 2024, 20, 8218–8228. [Google Scholar] [CrossRef]
- Baek, D.; Moon, H.S.; Park, S.-H. Optimization of weld penetration prediction based on weld pool image and deep learning approach in gas tungsten arc welding. Int. J. Adv. Manuf. Technol. 2024, 130, 2617–2633. [Google Scholar] [CrossRef]
- Hong, Y.; Yang, M.; Chang, B.; Du, D. Filter-PCA-based process monitoring and defect identification during climbing helium arc welding process using DE-SVM. IEEE Trans. Ind. Electron. 2022, 70, 7353–7362. [Google Scholar] [CrossRef]
- Chen, C.; Lv, N.; Chen, S. Welding penetration monitoring for pulsed GTAW using visual sensor based on AAM and random forests. J. Manuf. Process. 2021, 63, 152–162. [Google Scholar] [CrossRef]
- Lertrusdachakul, I.; Mathieu, A.; Aubreton, O. Vision-based control of wire extension in GMA welding. Int. J. Adv. Manuf. Technol. 2015, 78, 1201–1210. [Google Scholar] [CrossRef]
- Zhang, G.; Yan, Z.; Wu, L. Visual sensing of weld pool in variable polarity TIG welding of aluminium alloy. Trans. Nonferrous Met. Soc. China 2006, 16, 522–526. [Google Scholar] [CrossRef]
- Jin, B.; Li, H.; Wang, Q.; Gao, H. Online measurement of the GMAW process using composite sensor technology. Weld. J. 2017, 96, 133–142. [Google Scholar]
- Zhao, Z.; Deng, L.; Bai, L.; Zhang, Y.; Han, J. Optimal imaging band selection mechanism of weld pool vision based on spectrum analysis. Opt. Laser Technol. 2019, 110, 145–151. [Google Scholar] [CrossRef]
- Reisgen, U.; Purrio, M.; Buchholz, G.; Willms, K. Machine vision system for online weld pool observation of gas metal arc welding processes. Weld. World 2014, 58, 707–711. [Google Scholar] [CrossRef]
- Cai, Y.; Li, C.; Chen, H.; Xiong, J. Monitoring of distance between laser beam and arc in laser-arc hybrid welding based on deep learning. Opt. Laser Technol. 2024, 174, 110562. [Google Scholar] [CrossRef]
- ISO 630:1995; Structural Steels—Plates, Wide Flats, Bars, Sections and Profiles. ISO: Geneva, Switzerland, 1995.
- ISO 636:2017; Welding Consumables—Rods, Wires and Deposits for tungsten Inert Gas Welding of Non-Alloy and Fine-Grain Steels—Classification. ISO: Geneva, Switzerland, 2017.
- Wang, L.; Chen, J.; Zhang, S.; Wu, C. Numerical simulation of coupled arc-droplet-weld pool behaviors during compound magnetic field assisted gas metal arc welding. AIP Adv. 2021, 11, 065221. [Google Scholar] [CrossRef]
- Cai, X.; Dong, B.; Lin, S.; Murphy, A.B.; Fan, C.; Yang, C. Heat source characteristics of ternary-gas-shielded tandem narrow-gap GMAW. Materials 2019, 12, 1397. [Google Scholar] [CrossRef] [PubMed]
- Zhao, Z.; Sun, B.; Zhang, Y.; Bai, L.; Han, J. Weld pool image acquisition and contour extraction based on arc spectrum and camera quantum efficiency. Optik 2020, 202, 163719. [Google Scholar] [CrossRef]
- Mittal, A.; Moorthy, A.K.; Bovik, A.C. No-reference image quality assessment in the spatial domain. IEEE Trans. Image Process. 2012, 21, 4695–4708. [Google Scholar] [CrossRef] [PubMed]


| C | Si | Mn | P | S |
|---|---|---|---|---|
| 0.1852 | 0.343 | 1.355 | 0.011 | 0.0044 |
| C | Si | Mn | P | S |
|---|---|---|---|---|
| 0.07 | 0.65 | 1.14 | 0.015 | 0.01 |
| Specification | Setting Value | |
|---|---|---|
| Resolution (h × v) | 2056 × 1542 | 600 × 450 |
| Aspect ratio (h:v) | adjustable | 4:3 |
| Exposure time | 0.024–1000 ms | 15 ms |
| Gamma | 0–2.2 | 2.2 |
| Gain | 0–100 | 100 |
| Frame rate | adjustable | 30 fps |
| Wavelength (nm) | 420 | 508 | 660 | 752 | 808 | 830 |
| Score | 72.12 | 70.63 | 61.70 | 55.89 | 54.18 | 52.03 |
| Gamma Value | 1.0 | 1.1 | 1.5 | 2.0 | 2.2 |
| Image | 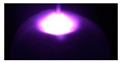 | 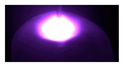 | 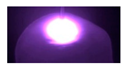 | 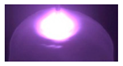 | 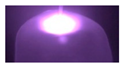 |
| Score | 76.12 | 72.33 | 64.89 | 60.02 | 56.09 |
| Optical Density | 0.5 (transmission: 32%) | 1.0 (transmission: 10%) | 2.0 (transmission: 1%) |
| Image | 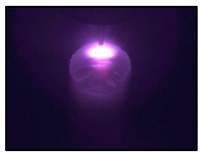 | 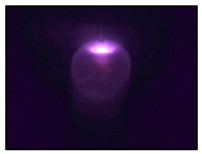 | 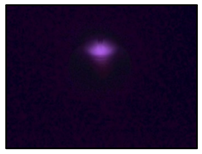 |
| Score | 42.85 | 15.30 | 34.51 |
Disclaimer/Publisher’s Note: The statements, opinions and data contained in all publications are solely those of the individual author(s) and contributor(s) and not of MDPI and/or the editor(s). MDPI and/or the editor(s) disclaim responsibility for any injury to people or property resulting from any ideas, methods, instructions or products referred to in the content. |
© 2024 by the authors. Licensee MDPI, Basel, Switzerland. This article is an open access article distributed under the terms and conditions of the Creative Commons Attribution (CC BY) license (https://creativecommons.org/licenses/by/4.0/).
Share and Cite
Kim, G.-G.; Kim, Y.-M.; Kim, D.-Y.; Park, J.-K.; Park, J.; Yu, J. Vision-Based Online Molten Pool Image Acquisition and Assessment for Quality Monitoring in Gas–Metal Arc Welding. Appl. Sci. 2024, 14, 5998. https://doi.org/10.3390/app14145998
Kim G-G, Kim Y-M, Kim D-Y, Park J-K, Park J, Yu J. Vision-Based Online Molten Pool Image Acquisition and Assessment for Quality Monitoring in Gas–Metal Arc Welding. Applied Sciences. 2024; 14(14):5998. https://doi.org/10.3390/app14145998
Chicago/Turabian StyleKim, Gwang-Gook, Young-Min Kim, Dong-Yoon Kim, Jong-Kyu Park, Junhong Park, and Jiyoung Yu. 2024. "Vision-Based Online Molten Pool Image Acquisition and Assessment for Quality Monitoring in Gas–Metal Arc Welding" Applied Sciences 14, no. 14: 5998. https://doi.org/10.3390/app14145998
APA StyleKim, G.-G., Kim, Y.-M., Kim, D.-Y., Park, J.-K., Park, J., & Yu, J. (2024). Vision-Based Online Molten Pool Image Acquisition and Assessment for Quality Monitoring in Gas–Metal Arc Welding. Applied Sciences, 14(14), 5998. https://doi.org/10.3390/app14145998