Article

An Integrated Numerical Study of CO2 Storage in Carbonate Gas Reservoirs with Chemical Interaction between CO2, Brine, and Carbonate Rock Matrix

Natural Resources Canada, Geological Survey of Canada, Calgary, AB T2L 2A7, Canada
*
Author to whom correspondence should be addressed.
Appl. Sci. 2024, 14(14), 6002; https://doi.org/10.3390/app14146002
Submission received: 19 June 2024 / Revised: 4 July 2024 / Accepted: 8 July 2024 / Published: 10 July 2024

Abstract

:
In light of the burgeoning interest in mitigating anthropogenic CO2 emissions, carbonate reservoirs have emerged as promising sequestration sites due to their substantial storage potentials. However, the complexity of CO2 storage in carbonate reservoirs exceeds that in conventional sandstone reservoirs, predominantly due to the rapid interactions occurring between the injected CO2, brine, and carbonate rock matrix. In this study, a numerical model integrated with the chemical CO2–brine–rock matrix interaction was developed to analyze the carbonate rock dissolution process and the physical property variations of different carbonate gas reservoirs during the CO2 injection and sequestration process. More specifically, a total of twenty scenarios were simulated to examine the effects of lithology, pore size, pore–throat structures, and CO2 injection rate on carbonate rock matrix dissolution and reservoir property variation. Calcite is significantly easier and quicker to react with CO2-solvated brine than dolomite; as a result, limestones exhibit an expedited rock dissolution and pore volume increase, along with a slower pressure buildup in comparison to dolomites. Also, the carbonate reservoir with a smaller pore size has a higher rock dissolution rate than one with a larger pore size. Furthermore, the simulation results show injected CO2 can modify the pore-dominant carbonate reservoir to a more pronounced extent than the fracture-dominant carbonate reservoir. Lastly, the carbonate rock dissolution is more obvious at a lower CO2 injection rate. The insights derived from this research aid evaluations related to CO2 injectivity, storage capacity, and reservoir integrity, thereby paving the way for environmentally and structurally sound carbon sequestration strategies.

1. Introduction

Carbon dioxide storage and sequestration in underground geological formations such as saline aquifers, depleted oil and gas reservoirs, and coal seams is a critical strategy for mitigating anthropogenic CO2 emission and reducing atmospheric greenhouse gas levels [1,2]. Carbonate reservoirs are considered attractive CO2 storage sites as they hold the majority of the world’s oil and gas reserves, making them a primary storage target when CO2 based enhanced oil recovery (CO2-EOR) is incorporated [3,4]. Furthermore, it can be assumed that CO2 can be stored in a carbonate reservoir for an indefinite period since the hydrocarbons have been held in these reservoirs for millions of years [5]. Compared to conventional sandstone reservoirs, CO2 storage in carbonate reservoirs is much more difficult and challenging for the following reasons. First, carbonate rocks are known to be structurally heterogeneous, with dual or triple pore–throat systems, and exhibit a range of wetting behaviors, all of which strongly impact CO2 storage performance [3,6]. Second, carbonate rocks are very reactive with injected CO2, thus undergoing a series of physical and chemical changes that may affect the reservoir’s integrity, injectivity, and storage capacity [7,8].
The CO2–brine–carbonate rock interactions can cause mineral precipitation or rock dissolution in the carbonate reservoir, depending on the chemical species present in the formation brine [1,9]. Mineral precipitation, which solidifies the injected CO2 as carbonate minerals, is one of the major CO2 trapping mechanisms [10]. It happens when the brine pH is high and alkaline elements are present in the formation brine [11]. The precipitated carbonate minerals can occupy the reservoir pore spaces and block the flow paths leading to a reduction in porosity and permeability [11,12]. Another pronounced phenomenon is rock dissolution when injected CO2 reduces the pH in formation water, converting CO 3 2 - to HCO 3 - [13]. On the plus side for CO2 storage and sequestration, dissolution of carbonate rocks facilitates injectivity, increases storage capacity, and enhances the performance of carbonate hosted CO2 storage reservoirs [14]. Sometimes, the dissolution of carbonate minerals may result in the formation of highly porous and conductive channels or wormholes [5,15]. On the down side, dissolution creates concern for the long-term storage security of CO2 in carbonate reservoirs [15,16]. The injected CO2, being a less dense fluid than the formation fluids in subsurface pore spaces, will move laterally or migrate vertically after injection until it is restricted by a caprock or seal [3]. The dissolution and reactivity of carbonate reservoirs exposed to CO2 may negatively affect their storage integrity, thus jeopardizing the long-term security of CO2 sequestrated in the carbonate reservoirs [3,17].
The impacts of mineral dissolution in carbonate reservoirs due to CO2 injection have been extensively investigated. It is found by Hosseini et al. that the interfacial tension between calcite and gas decreases after the introduction of supercritical CO2 (scCO2) into the carbonate pore spaces, and the decrease level is highly related to the reservoir pressure, temperature, and formation water salinity [18]. Menke et al. experimentally investigated dissolution in two different carbonate rocks with different levels of heterogeneity. They observed that both rocks exhibited channel widening at the millimeter scale, and the dissolution was more focused and progressed along the flow direction [16]. Similarly, it is claimed by Cui et al. that the formation of high permeability pathways due to rock dissolution is only observed in pre-existing open fractures where most injected scCO2 flowed through [19]. Seyyed et al., recognized that the impact of calcite dissolution may be limited to the area near the scCO2 injection point, while at distances far from the injection point, only minimal or no change was observed in the pore structure, pore roughness, and pore populations [20]. The interaction between the injected CO2 and carbonate rock can also promote the diffusion of CO2 in the carbonate reservoir. It has been found that the effective diffusion coefficient of CO2 can increase by approximately one order of magnitude when the interaction of the CO2–brine–carbonate rock matrix is considered in comparison to the pure CO2 diffusion in the carbonate reservoir [21].
Many studies have been conducted to optimize the dissolution effects on CO2 storage in carbonate reservoirs. Valle et al. found that scCO2 can substitute acids and be used as safe, non-aqueous fracturing fluid in reservoir fracturing [22]. They claimed that the use of scCO2 enables a greater development of fractures, and the permeability of such fractured rocks is three orders of magnitude higher than the ones created by conventional hydraulic fracturing [23]. Zhang et al., using a combined CT scanning and discrete element method (DEM), found that the carbonate dissolution will be much stronger when scCO2 is injected after live brine flooding [24]. A series of carbonate water injection tests revealed that flow rate can notably influence the natural fracture profiles in carbonate rocks. The fracture widening is more pronounced when CO2 is injected at a higher rate [24]. In addition, the carbonate dissolution rate can be changed by adding some external material during CO2 injection, such as microbials and nanoparticles. For example, in Kolawole’s study, samples from deep carbonate formations are treated with microbial media and scCO2. The results indicate that carbonate dissolution is slower with appropriate post-injection remediation [3]. In another study, Tan et al. found that CO2–brine–rock interactions can be more intense and occur in small pores with the addition of SiO2 nanoparticles [25].
In summary, it is known that the injection of large amounts of CO2 into geological reservoirs may lead to a series of alterations due to chemical and physical interactions between minerals and fluids in carbonate- or carbonate-rich reservoirs. However, some research gaps need to be filled. First, so far, most of the CO2 capture, utilization, and sequestration (CCUS) studies are focused on siliciclastic formations rather than highly chemically reactive carbonate formations [26]. Also, even though few studies regarding CO2 storage in carbonate reservoirs have been conducted, researchers prioritized scCO2 injection in deep saline aquifers rather than shallow hydrocarbon reservoirs, whose CO2 storage advantages, such as low-cost drilling, injection, and transportation, abundance of available reservoir data and knowledge, and minimal uncertainties, should not be ignored. In this study, the carbonate rocks are selected as CO2 storage sites, and different carbonate geological models are constructed to numerically investigate the effects of chemical CO2–brine–carbonate rock interactions on CO2 storage and sequestration. Specifically, a sensitivity analysis of four factors, i.e., lithologies, pore–throat structures, pore sizes, and rate, is presented, and the physical property variations before and after CO2 injection in different carbonate reservoirs are compared. This study, to some extent, fills the knowledge gap in rock–pore fluid interaction in CO2 storage in shallow carbonate reservoirs and helps researchers and engineers in aspects of reservoir selection and operation optimization in the projects of CO2 storage in carbonate reservoirs.

2. Simulation

2.1. Scenarios

In this study, twenty scenarios were numerically simulated to analyze the effects of lithology, pore size, pore-structure type, and CO2 injection rate on the process of carbonate rock dissolution. These four parameters are studied because the lithology, pore-structure type, and pore size are the most important geophysical features, and the injection rate is one of the most important operating parameters. The numerically constructed geological models used in the scenarios have the same dimensions of 10 m in length, 10 m in width, and 1 m in height. The porosity of the geological model used in each scenario is also the same and set at 10%. The lithology, pore space type, pore size, and CO2 injection rate in each scenario are listed in Table 1. The lithologies in Scenarios #1–10 and #11–20 are limestone and dolostone, respectively. Scenarios #1–3, #6–8, #11–13, and #16–18 are simulated to investigate the CO2 injection rate effect on carbonate matrix dissolution in different reservoirs with different lithologies and pore space types. Scenarios #1–3 have limestone lithology, pore-dominant space type, 5 µm pore size, and varying CO2 injection rates of 0.1, 0.5, and 1.0 mol/min to examine carbonate matrix dissolution in limestone pore-dominant reservoirs. Similarly, scenarios #6–8, #11–13, and #16–18 are simulated to understand the effects of CO2 injection rate on carbonate matrix dissolutions in limestone fracture-dominant, dolomite pore-dominant, and dolomite fracture-dominant reservoirs, respectively.
Scenarios #3–5, #8–10, #13–15, and #18–20 are simulated to investigate the effect of pore/fracture size on the carbonate matrix dissolution process in different carbonate reservoirs with different lithologies and pore space types. For example, the pore size effect on limestone pore-dominant reservoirs can be found in Scenarios #3–5. Similarly, the other three groups of scenarios, i.e., Scenarios #8–10, #13–15, and #18–20, are simulated to investigate the pore space size effect on limestone fracture-dominant reservoirs, dolomite pore-dominant reservoirs, and dolomite fracture-dominant reservoirs, respectively. It is worth noting that the residual water saturations in the reservoirs with different pore sizes are different. The residual water saturations are 76.5%, 55.0%, and 18.4% for pore-dominant reservoirs with pore sizes of 5 µm, 10 µm, and 50 µm, respectively. For the fracture-dominant reservoirs, the residual water saturations are 68.2%, 44.1%, and 8.7% for the reservoirs with fracture diameters of 5 µm, 10 µm, and 50 µm, respectively. The calculation of the residual water saturation will be presented in Section 2.3.
Two groups of scenarios, i.e., #3 and #6, as well as #13 and #16, are compared to analyze the CO2–brine–rock interactions in pore-dominant and fracture-dominant reservoirs. Scenarios #3 and #6 are simulated to compare the dissolution process in limestones. Scenarios #3 and #6 have the same lithology, pore/throat size, and CO2 injection rate, which are limestone, 5 µm, and 10 mol/min, respectively. The difference between these two scenarios is that the geological model used in Scenario #3 is pore-dominant type, whereas the other is fracture-dominant in Scenario #6. Scenarios #13 and #16 are similar to Scenarios #3 and #6. The difference between these two series is that scenarios #13 and #16 are used to compare the dissolution processes in different pore–throat types in dolomite reservoirs instead of limestone reservoirs.

2.2. Simulation of CO2 Injection

In this study, the process of continuous CO2 injection and sequestration in a carbonate-depleted gas reservoir is simulated. The code for simulating the process of continuous CO2 injection was written by the author and compiled using MATLAB software (Mathworks, MATLAB, R2023a). The simulator involves four major parts: CO2 injection, CO2 dissolution in residual water, carbonate rock dissolution, and reservoir property variation.
CO2 is injected and stored in the carbonate-depleted gas reservoir in a gas phase. Thus, first, there is no phase change during the entire process, and second, the geological model only takes in injected CO2, but no CO2 flows out. In each simulation step, CO2 is injected into the depleted gas reservoir at a constant injection rate (Table 1). With CO2 injection, the reservoir pressure will build up. For the reservoir dimension (10 m × 10 m × 1 m), it is assumed that the injected CO2 can instantaneously and evenly spread into and fill the pore space. As a result, the reservoir pressure can instantaneously reach equilibrium once CO2 is injected. The reservoir pressure is calculated using the Peng–Robinson equation of state (P-R EOS) [27].

2.3. CO2 Dissolution in Residual Brine

After CO2 is injected into the depleted carbonate gas reservoir, the injected CO2 will start to dissolve in the residual brine, which will lead to a decreased amount of CO2 in the pore space and an increased amount of dissolved CO2 in the residual brine. This will result in a decrease in CO2 partial pressure in pore space and an increase in CO2 partial pressure in brine. An equilibrium will be reached once the CO2 partial pressure in the pore space is equal to that in the residual brine.
The CO2 partial pressure in the pore space is calculated using the P-R EOS. Meanwhile, the CO2 partial pressure in the residual brine is calculated using Henry’s law:
P = k/C
where P is the CO2 partial pressure in brine, Pa; k is Henry’s law constant, mol/L/Pa; and C is the CO2 concentration in brine, mol/L.
The methods to calculate the residual brine volumes for pore-dominant reservoir and fracture-dominant reservoir are as follows. For both the pore-dominant and fracture-dominant reservoirs, it is assumed that residual brine exists in the pore or fracture spaces in the form of brine film attached to the surface of pore or fracture wall. The thickness of the brine film is set at 0.2 µm [28,29]. The pores and fractures are assumed to be spheric and cylindrical shapes, respectively. The volume of the residual brine is calculated by using the deduction of total pore or fracture volume to void space volume. As for the pore-dominant reservoir, the equation to calculate residual brine volume is the following:
Vw = VPor ∗ [r3 − (r − 2)3]/r3
And for the fracture-dominant reservoir, the equation is:
Vw = Vpor ∗ [r2 − (r − 2)2]/r2
where Vw is the residual brine volume, m3; Vpor is the pore volume, m3; and r is the pore or fracture radius, m. The residual brine saturation is calculated using the residual brine volume divided by the pore volume, which is:
Sw = Vw/VPor

2.4. CO2–Brine–Carbonate Interaction

The kinetics of the CO2–brine–carbonate interaction are illustrated by the following kinetic rate law, which is given by TOUGHREACT [10,29].
R m = S m k m e E m R ( 1 T 1 298.15 ) ( 1 Q m K m eq )
where Rm is the mineral reaction rate, Sm is the specific surface area for the mineral, T is the absolute temperature, R is the gas constant, K m e q is the equilibrium constant of mineral reaction, and Qm is the corresponding activity product. km and Em are the rate constant at 298.15 K and activation energy, respectively, which are listed in Table 2 [10,13,30].

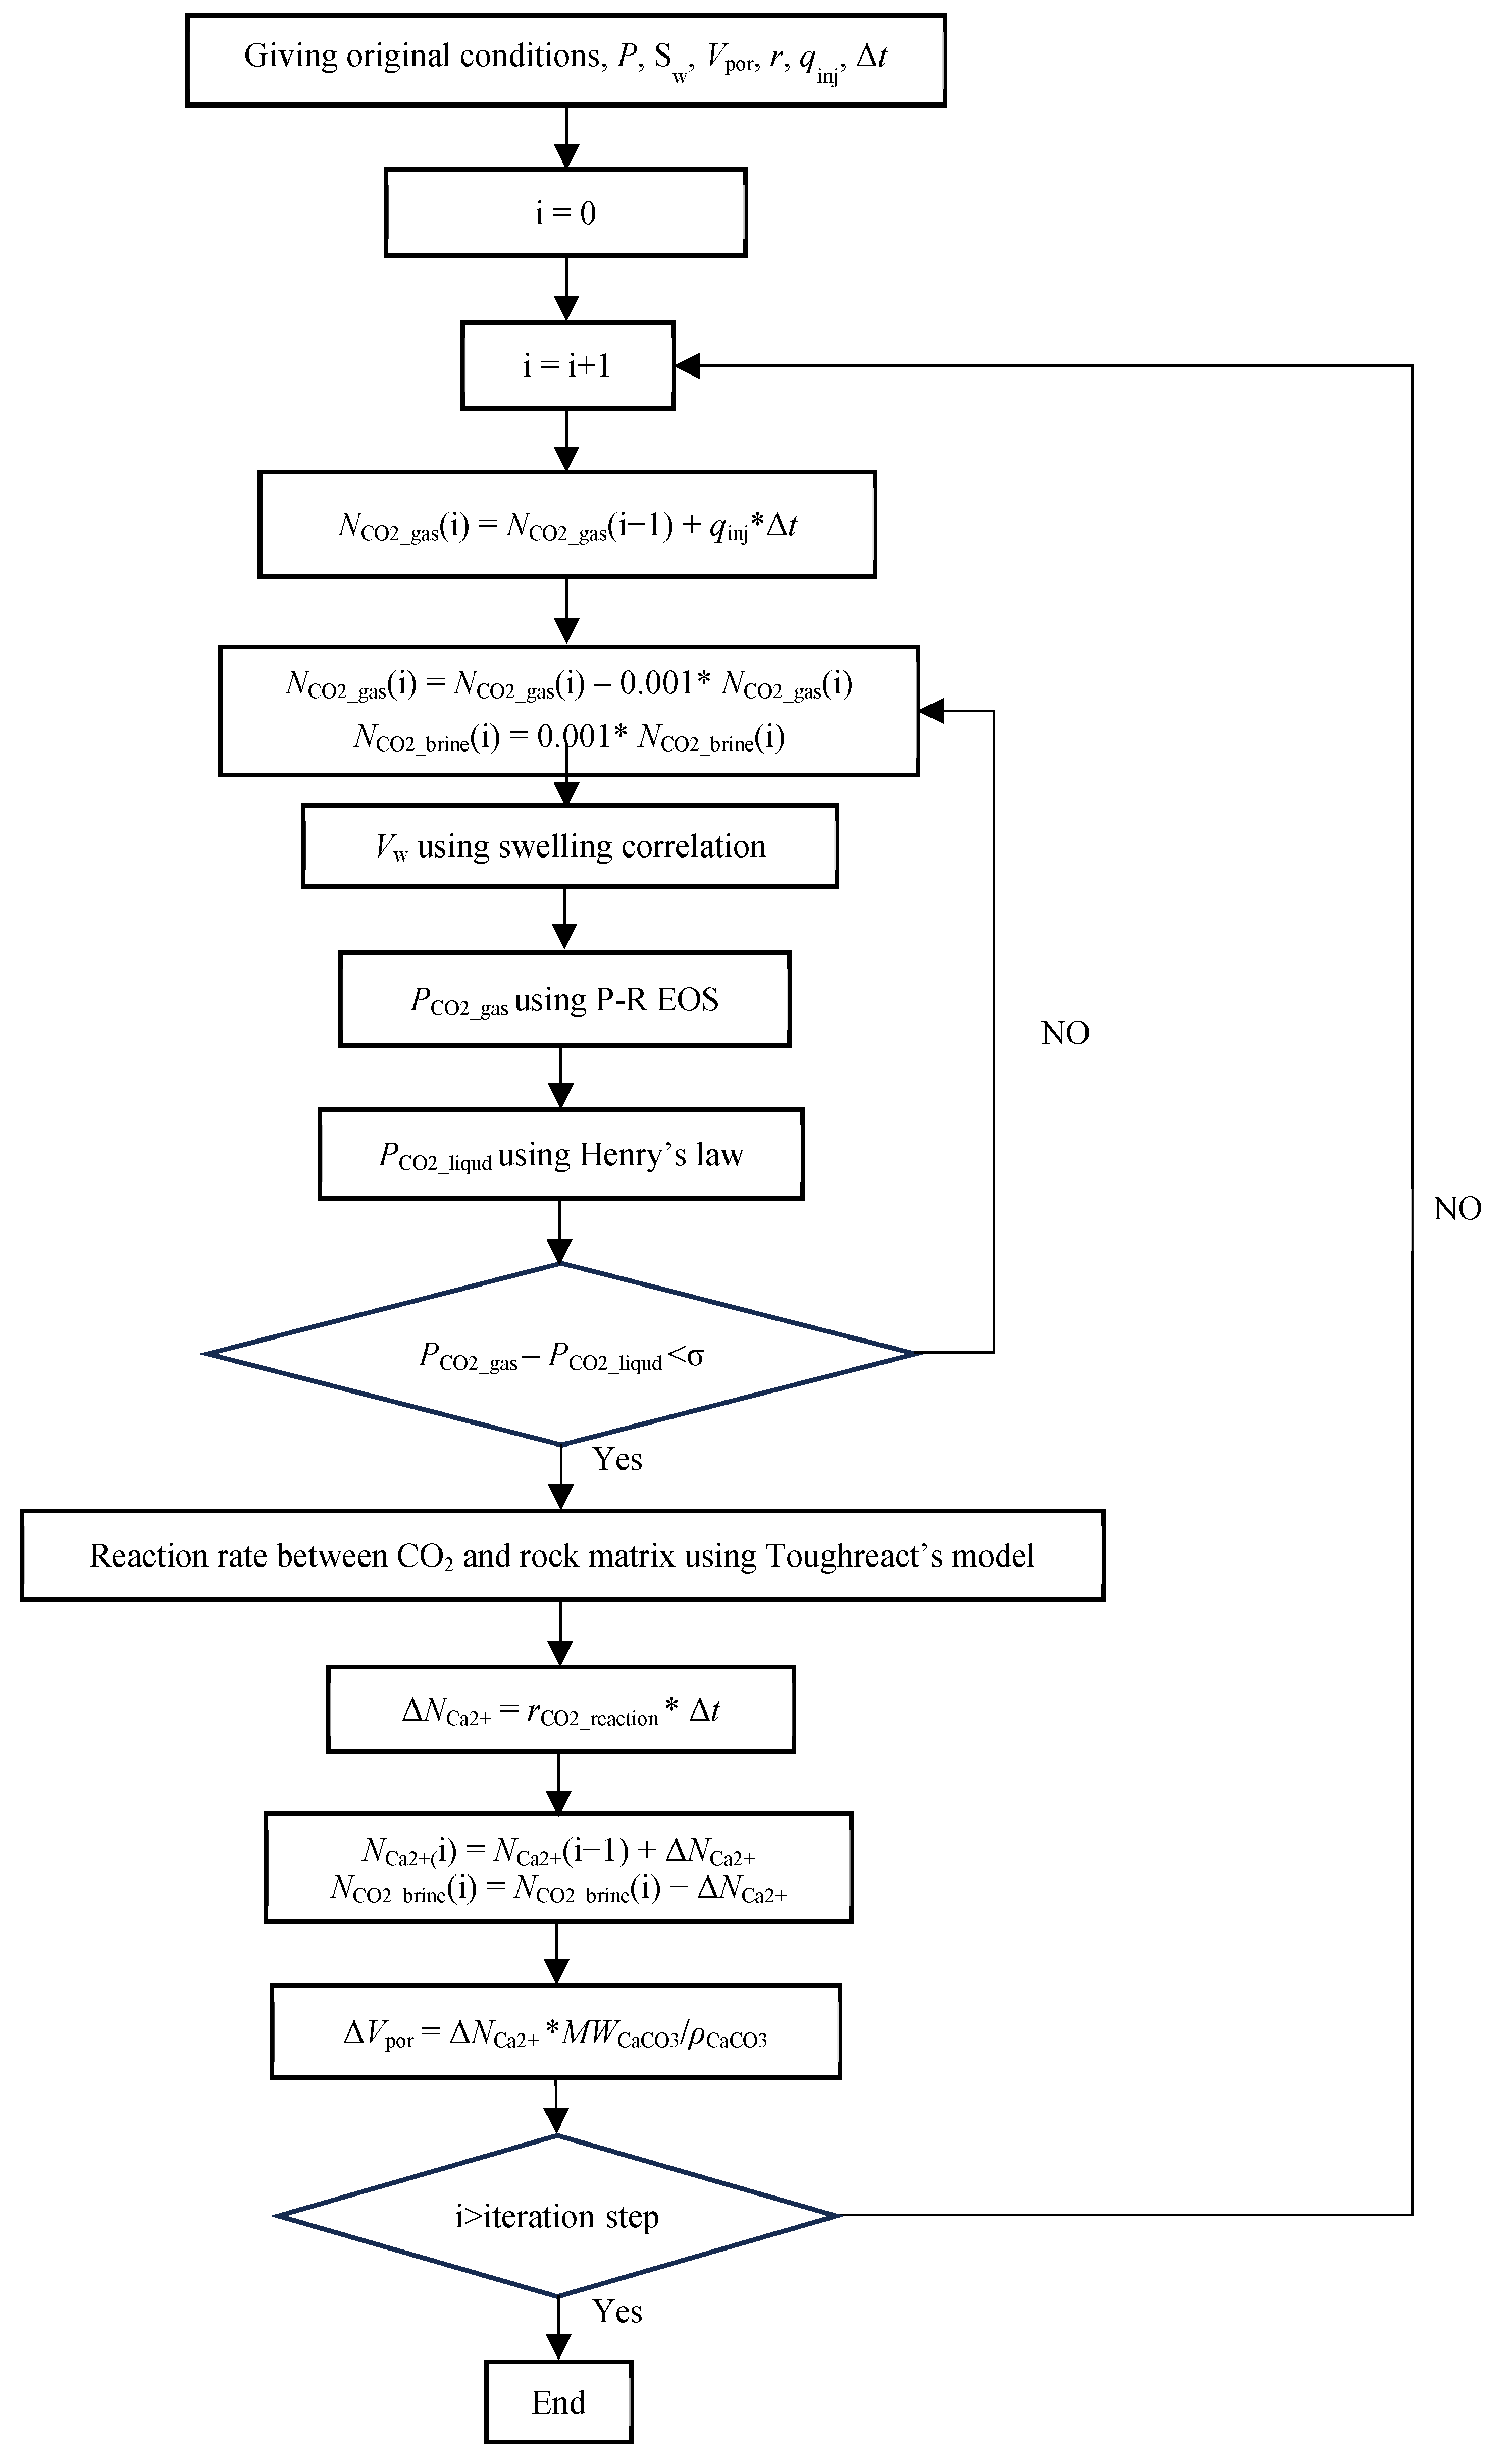
2.5. Simulation Workflow

Figure 1 illustrates the workflow employed to simulate the dissolution of carbonate rocks during the CO2 injection and sequestration process. This simulation begins with the assignment of initial property values to the geological model, encompassing parameters such as initial reservoir pressure (Pini, MPa), initial reservoir porosity (Φini, %), initial pore volume (Vpor, in m3), time interval (Δt, s), residual brine saturation (Sw, m3/m3), pore or fracture radius (r, m), and CO2 injection rate (qinj, mol/min). Specifically, Pini, Φini, and Vpor are standardized across all simulation scenarios at 1 MPa, 10%, and 10 m3, respectively, with the assumption that the residual gas in the carbonate reservoir is methane. Distinct values for pore radius (rPor, m), fracture radius (rf, m), and CO2 injection rates for each simulation scenario are provided in Table 1. Residual brine saturation is determined through equations [2,3,4] for pore-dominant and fracture-dominant reservoirs.
Upon each CO2 injection into the reservoir, the simulation updates the quantity of CO2 in the pore space ( N CO 2 _ gas ). Subsequently, the injected CO2 starts to dissolve into the residual brine, and the dissolved CO2 in the brine accounts for the brine volume (Vw) change in response to CO2 concentration change, which is characterized by using the swelling correlation. The pressures of CO2 in both gas and liquid phases are updated employing the Peng-Robinson equation of state (P-R EOS) and Henry’s law, respectively. The equilibrium between these phases is assessed by comparing their pressure differences. If the difference falls below a threshold of σ = 0.001 bar, the system is deemed at equilibrium, and then the system is prompted to calculate the CO2–brine–rock matrix interaction rates. If not, 0.1% of CO2 from the gas phase is dissolved into the liquid phase for another comparison, continuing until equilibrium criteria are met.
The acidic brine, resulting from dissolved CO2, reacts with the carbonate rock matrix, where the reaction rate is calculated using Toughreact’s model as referenced in the previous section. This reaction updates the concentrations of dissolved Ca2+ (NCa2+, mol) and CO2 (NCO2_water) and calculates the enlargement of pore space due to CO2–brine–rock matrix interaction. This procedure is repeated at an incrementing time Δt of 10 min at each iteration until a continuous injection period of 72 h is concluded. Upon reaching this end condition, the simulation compiles outcomes, including changes in reservoir pressure, space volume, CO2 concentration, and porosity.

3. Results and Discussion

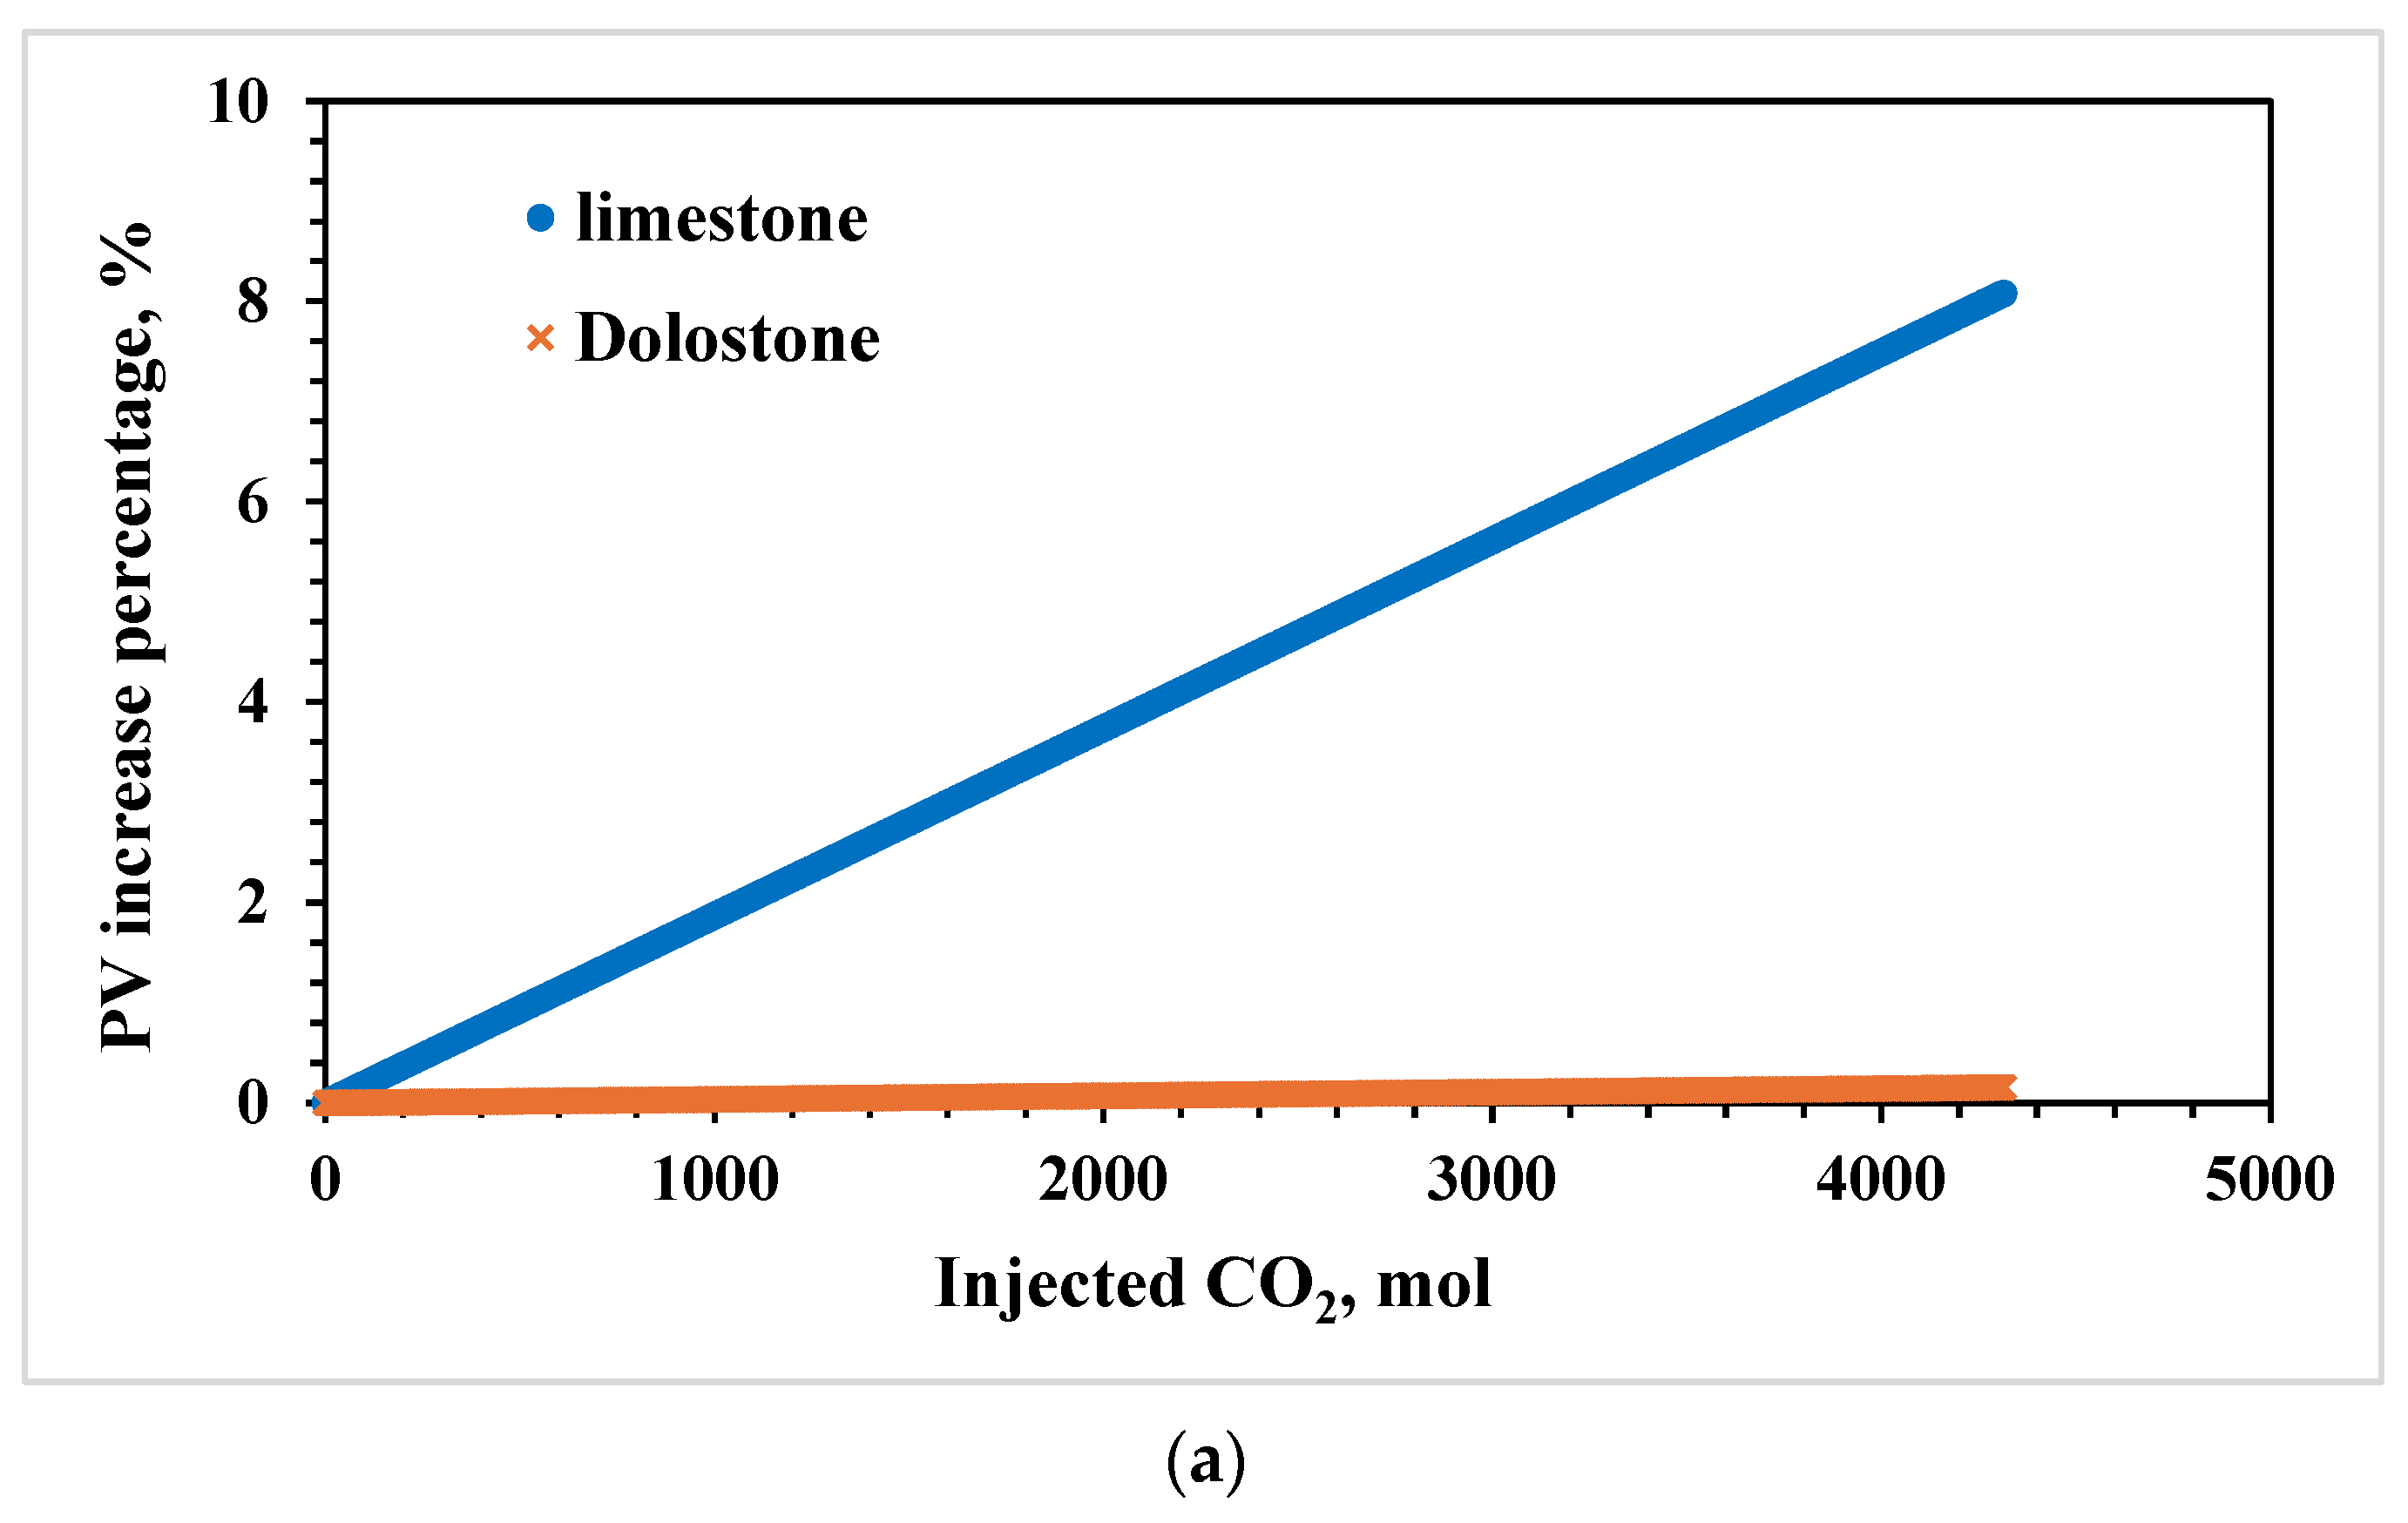
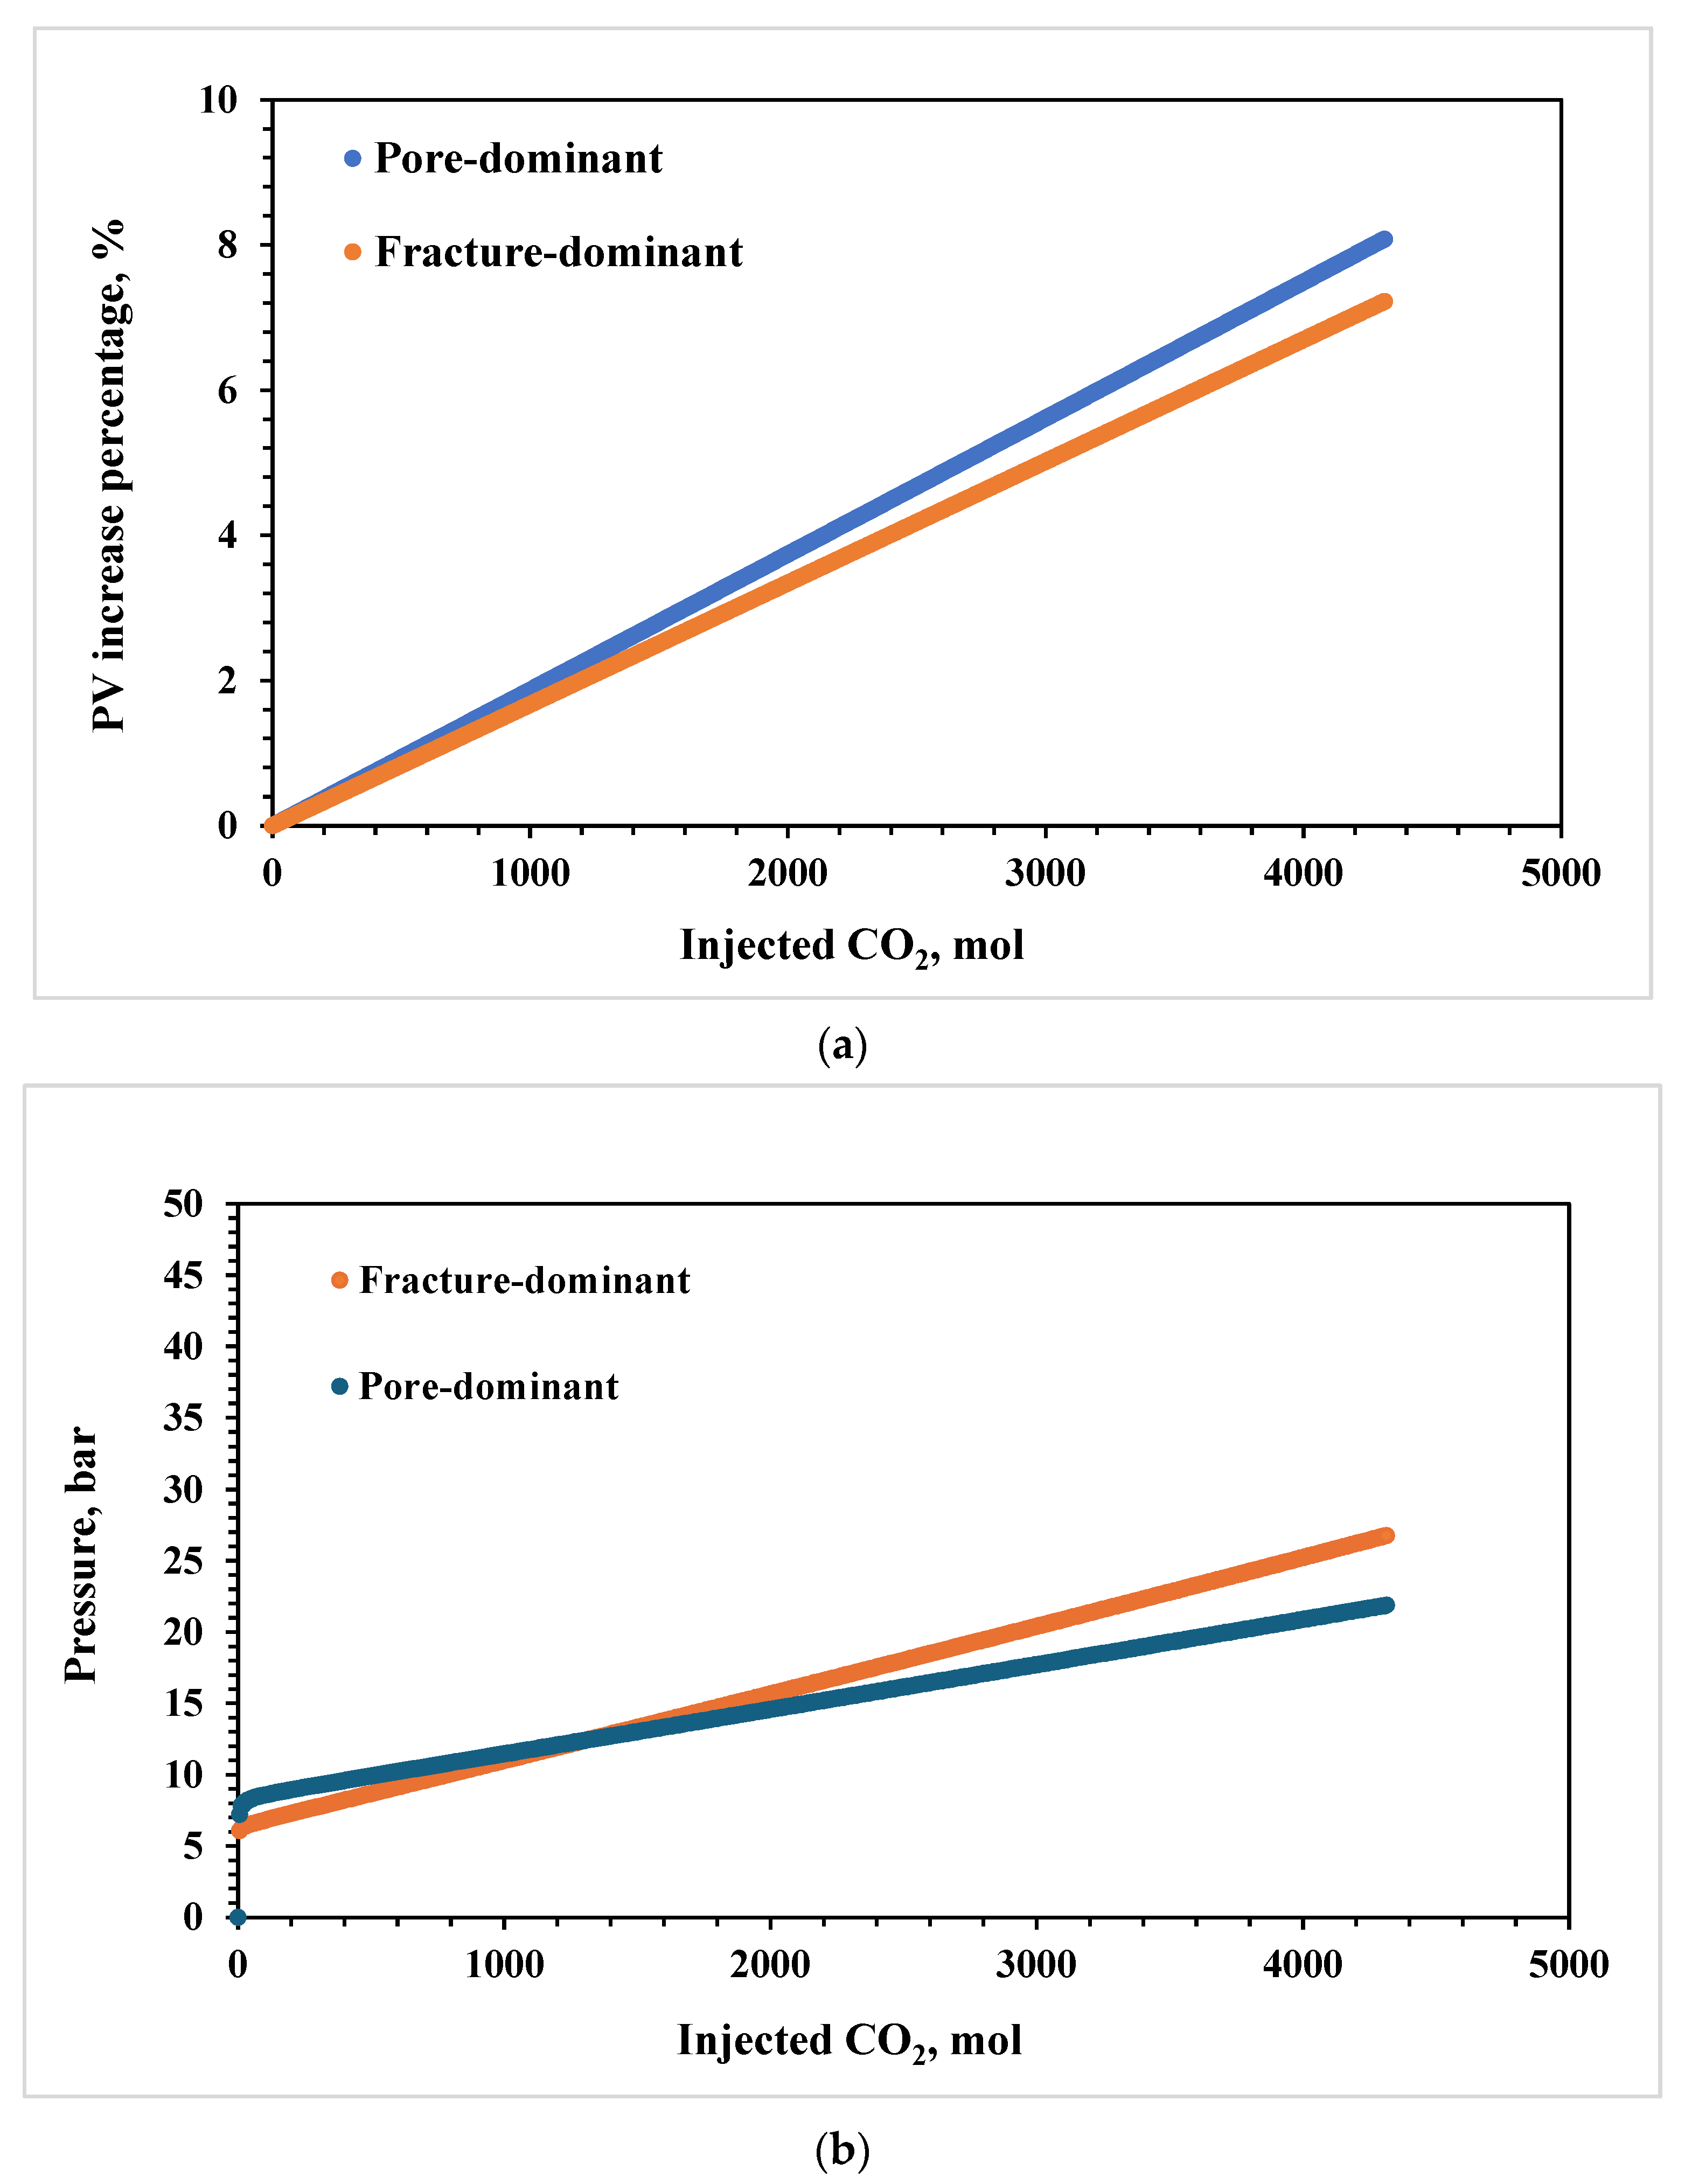
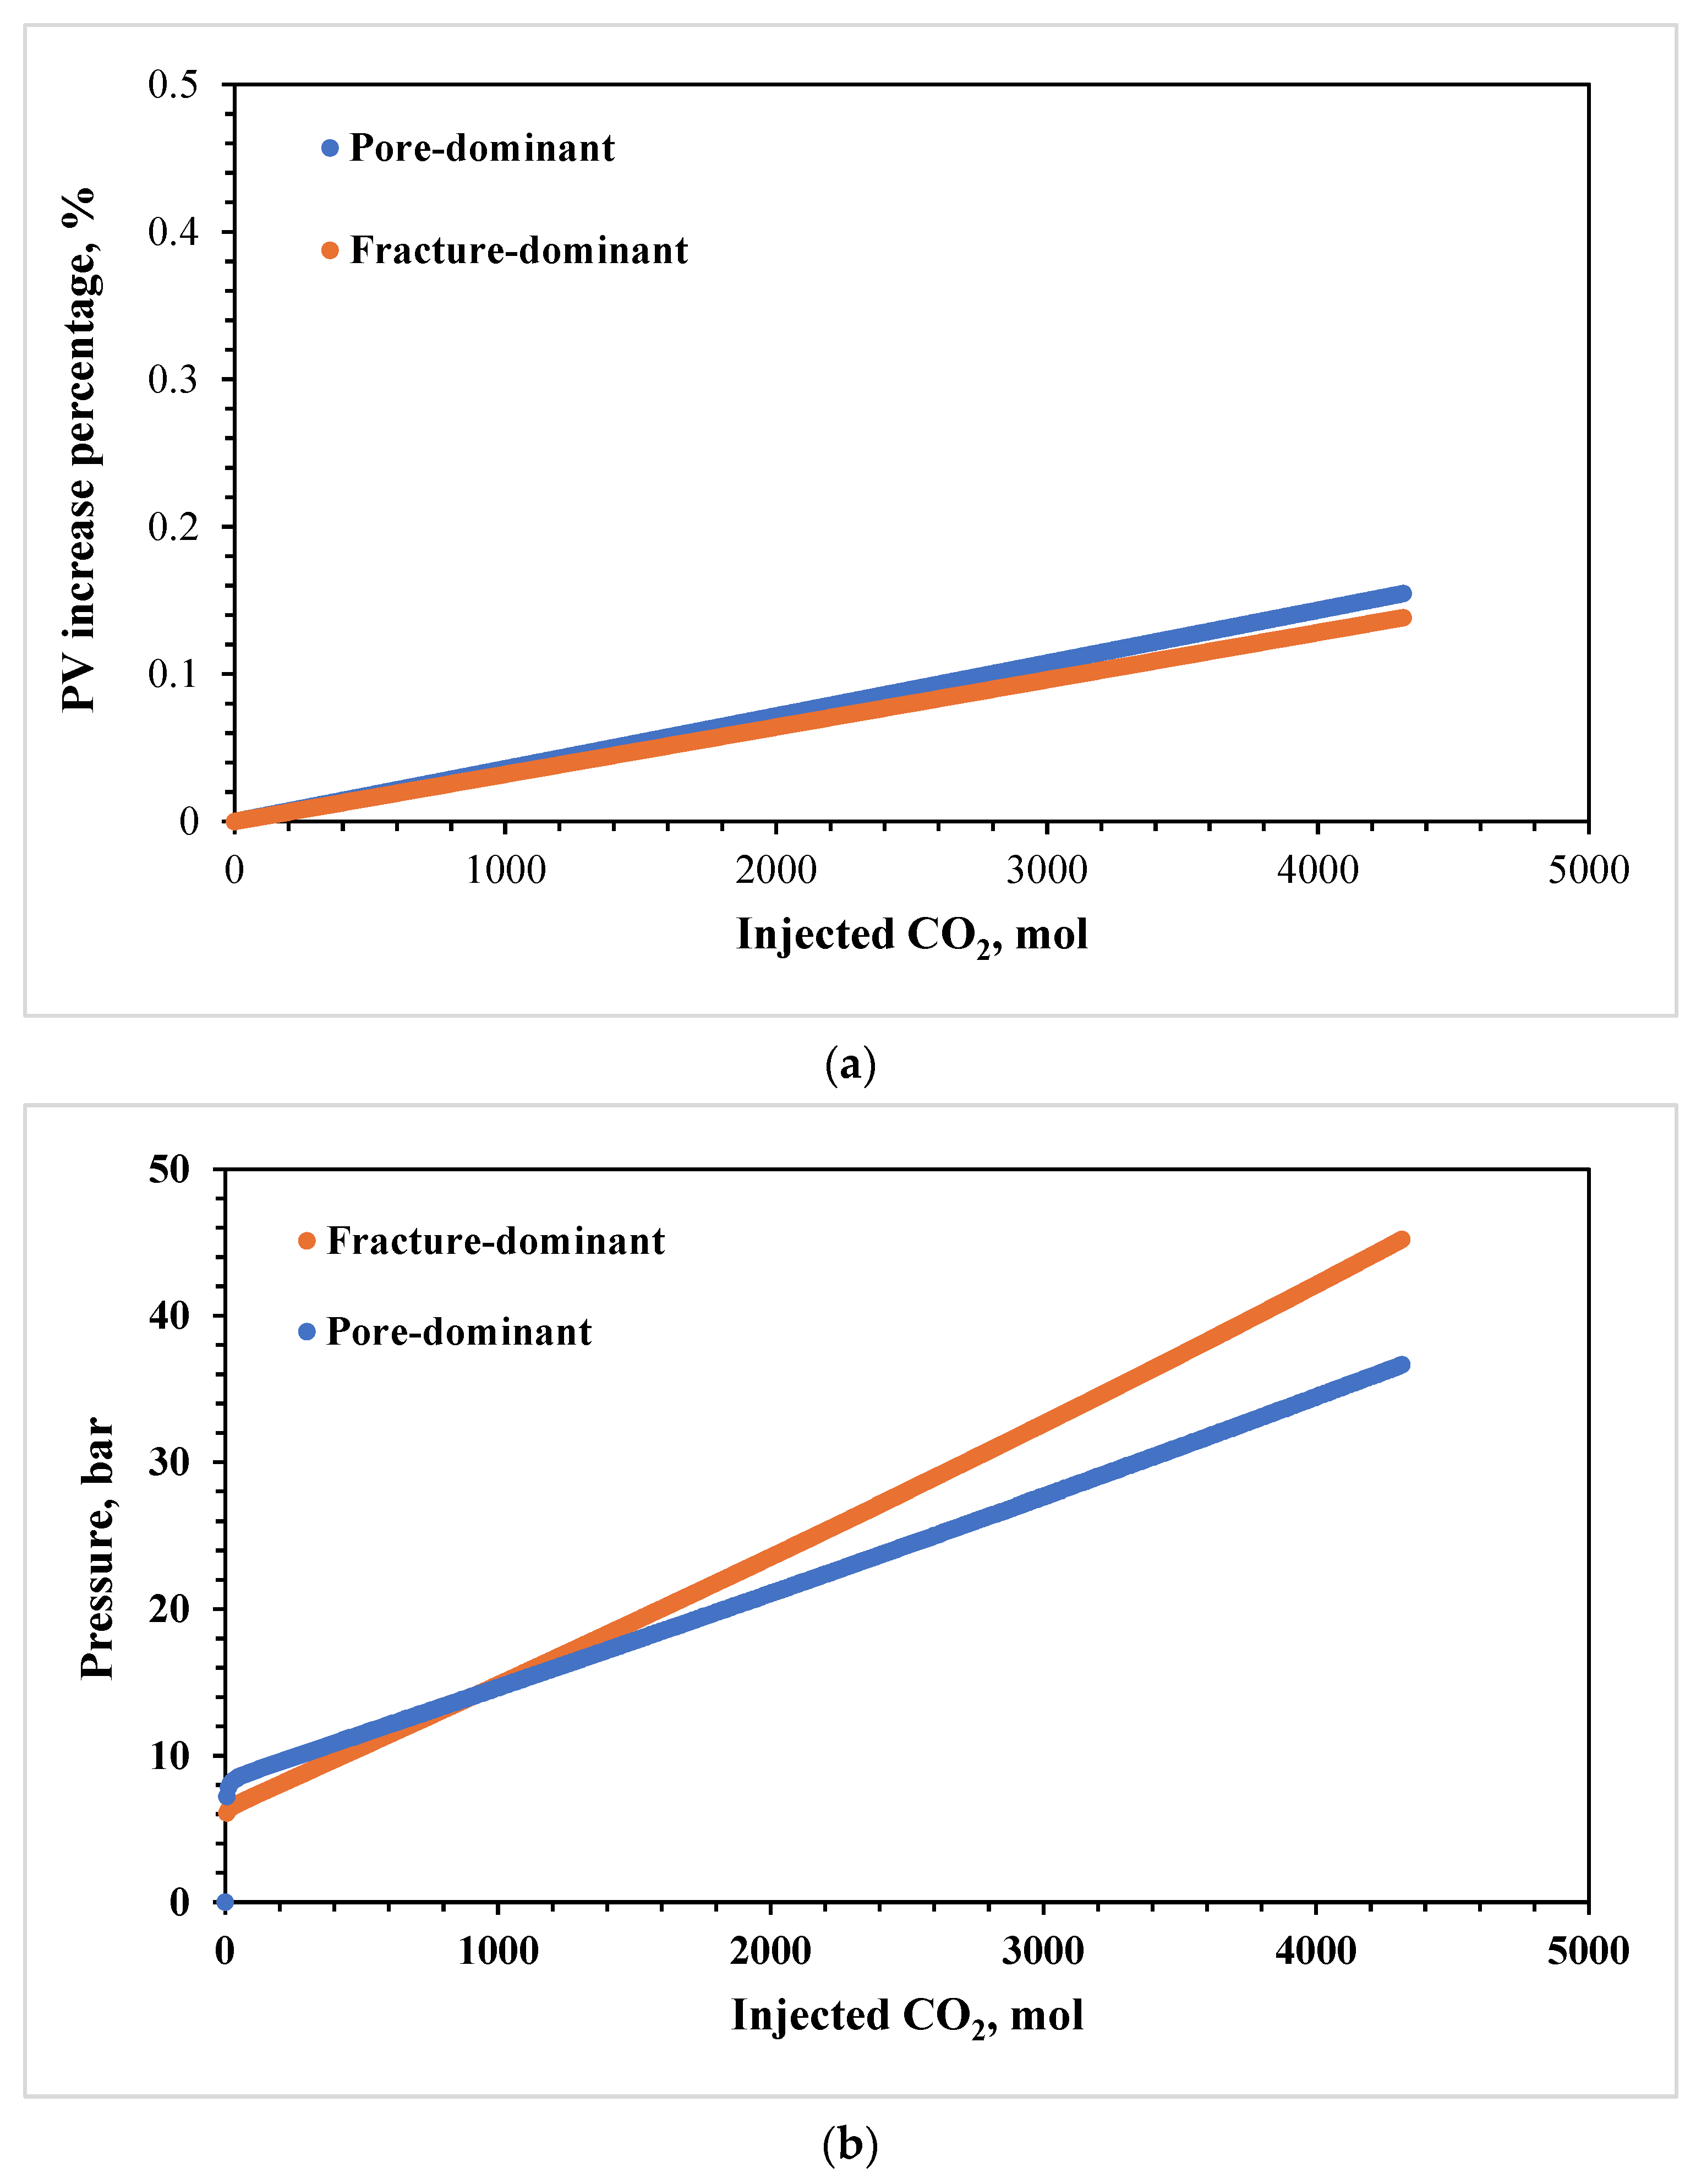
3.1. Effects of Lithology

The intricate CO2–brine–rock matrix interaction in different lithological carbonate reservoirs, particularly limestone and dolostone reservoirs, showcases markedly different physicochemical responses under equivalent operational conditions. Figure 2a,b demonstrates these disparities, focusing on the respective variations in pore volume augmentation and pressure escalation within the limestone and dolostone reservoirs during CO2 injection at a fixed rate of 0.1 mol/min. With an underlying assumption that the limestone is exclusively composed of calcite and the dolostone solely of dolomite, the depicted outcomes reveal a more pronounced pore volume enlargement observed in the limestone reservoir in comparison with that in the dolostone reservoir. Specifically, the introduction of 4200 mol of CO2 into the limestone reservoir catalyzed an 8.5% increment in pore volume. However, this value is reduced to a paltry 0.16% in the dolostone reservoir, one-fifth of the limestone value. This pronounced disparity can be attributed to the inherent reactivity characteristics of the reservoir materials, where calcite is characterized by a significantly higher propensity to react with carbonate brine compared to dolomite. This is further evidenced by the superior reaction rate between calcite and carbonate brine. Moreover, the reactivity variance precipitates a more rapid pressure accumulation in the limestone reservoir in comparison to that in the dolomite reservoir, as delineated in Figure 2b. This observation is primarily driven by two key factors. Firstly, the rapid interaction between the limestone’s rock matrix and carbonate brine facilitates an accelerated CO2 consumption, which consequently results in a smaller amount of CO2 in the pore space in the limestone reservoir in comparison to that in the dolostone reservoir. As a result, the reservoir pressure increases at a slower rate in the limestone reservoir than its dolostone counterpart. Second, the above-mentioned faster increase in the pore volume within the limestone reservoir, relative to the dolostone reservoir, plays a crucial role. According to the real gas law expressed as P = ZnRT/V, a larger pore volume can lead to a lower reservoir pressure. There, an expedited volumetric expansion effectively slows down the rate of reservoir pressure build-up in the limestone reservoir.
These findings underscore the paramount importance of mineralogical composition in the practice of CO2 storage and sequestration in carbonate reservoirs. For example, dolostone reservoirs commonly have superior initial injectivity due to their more developed natural factures compared to limestone reservoirs. However, the limestone reservoirs may hold greater potential for CO2 storage and less operational difficulties in CO2 injection in the long run because of their higher reactivity with carbonate brine [31].

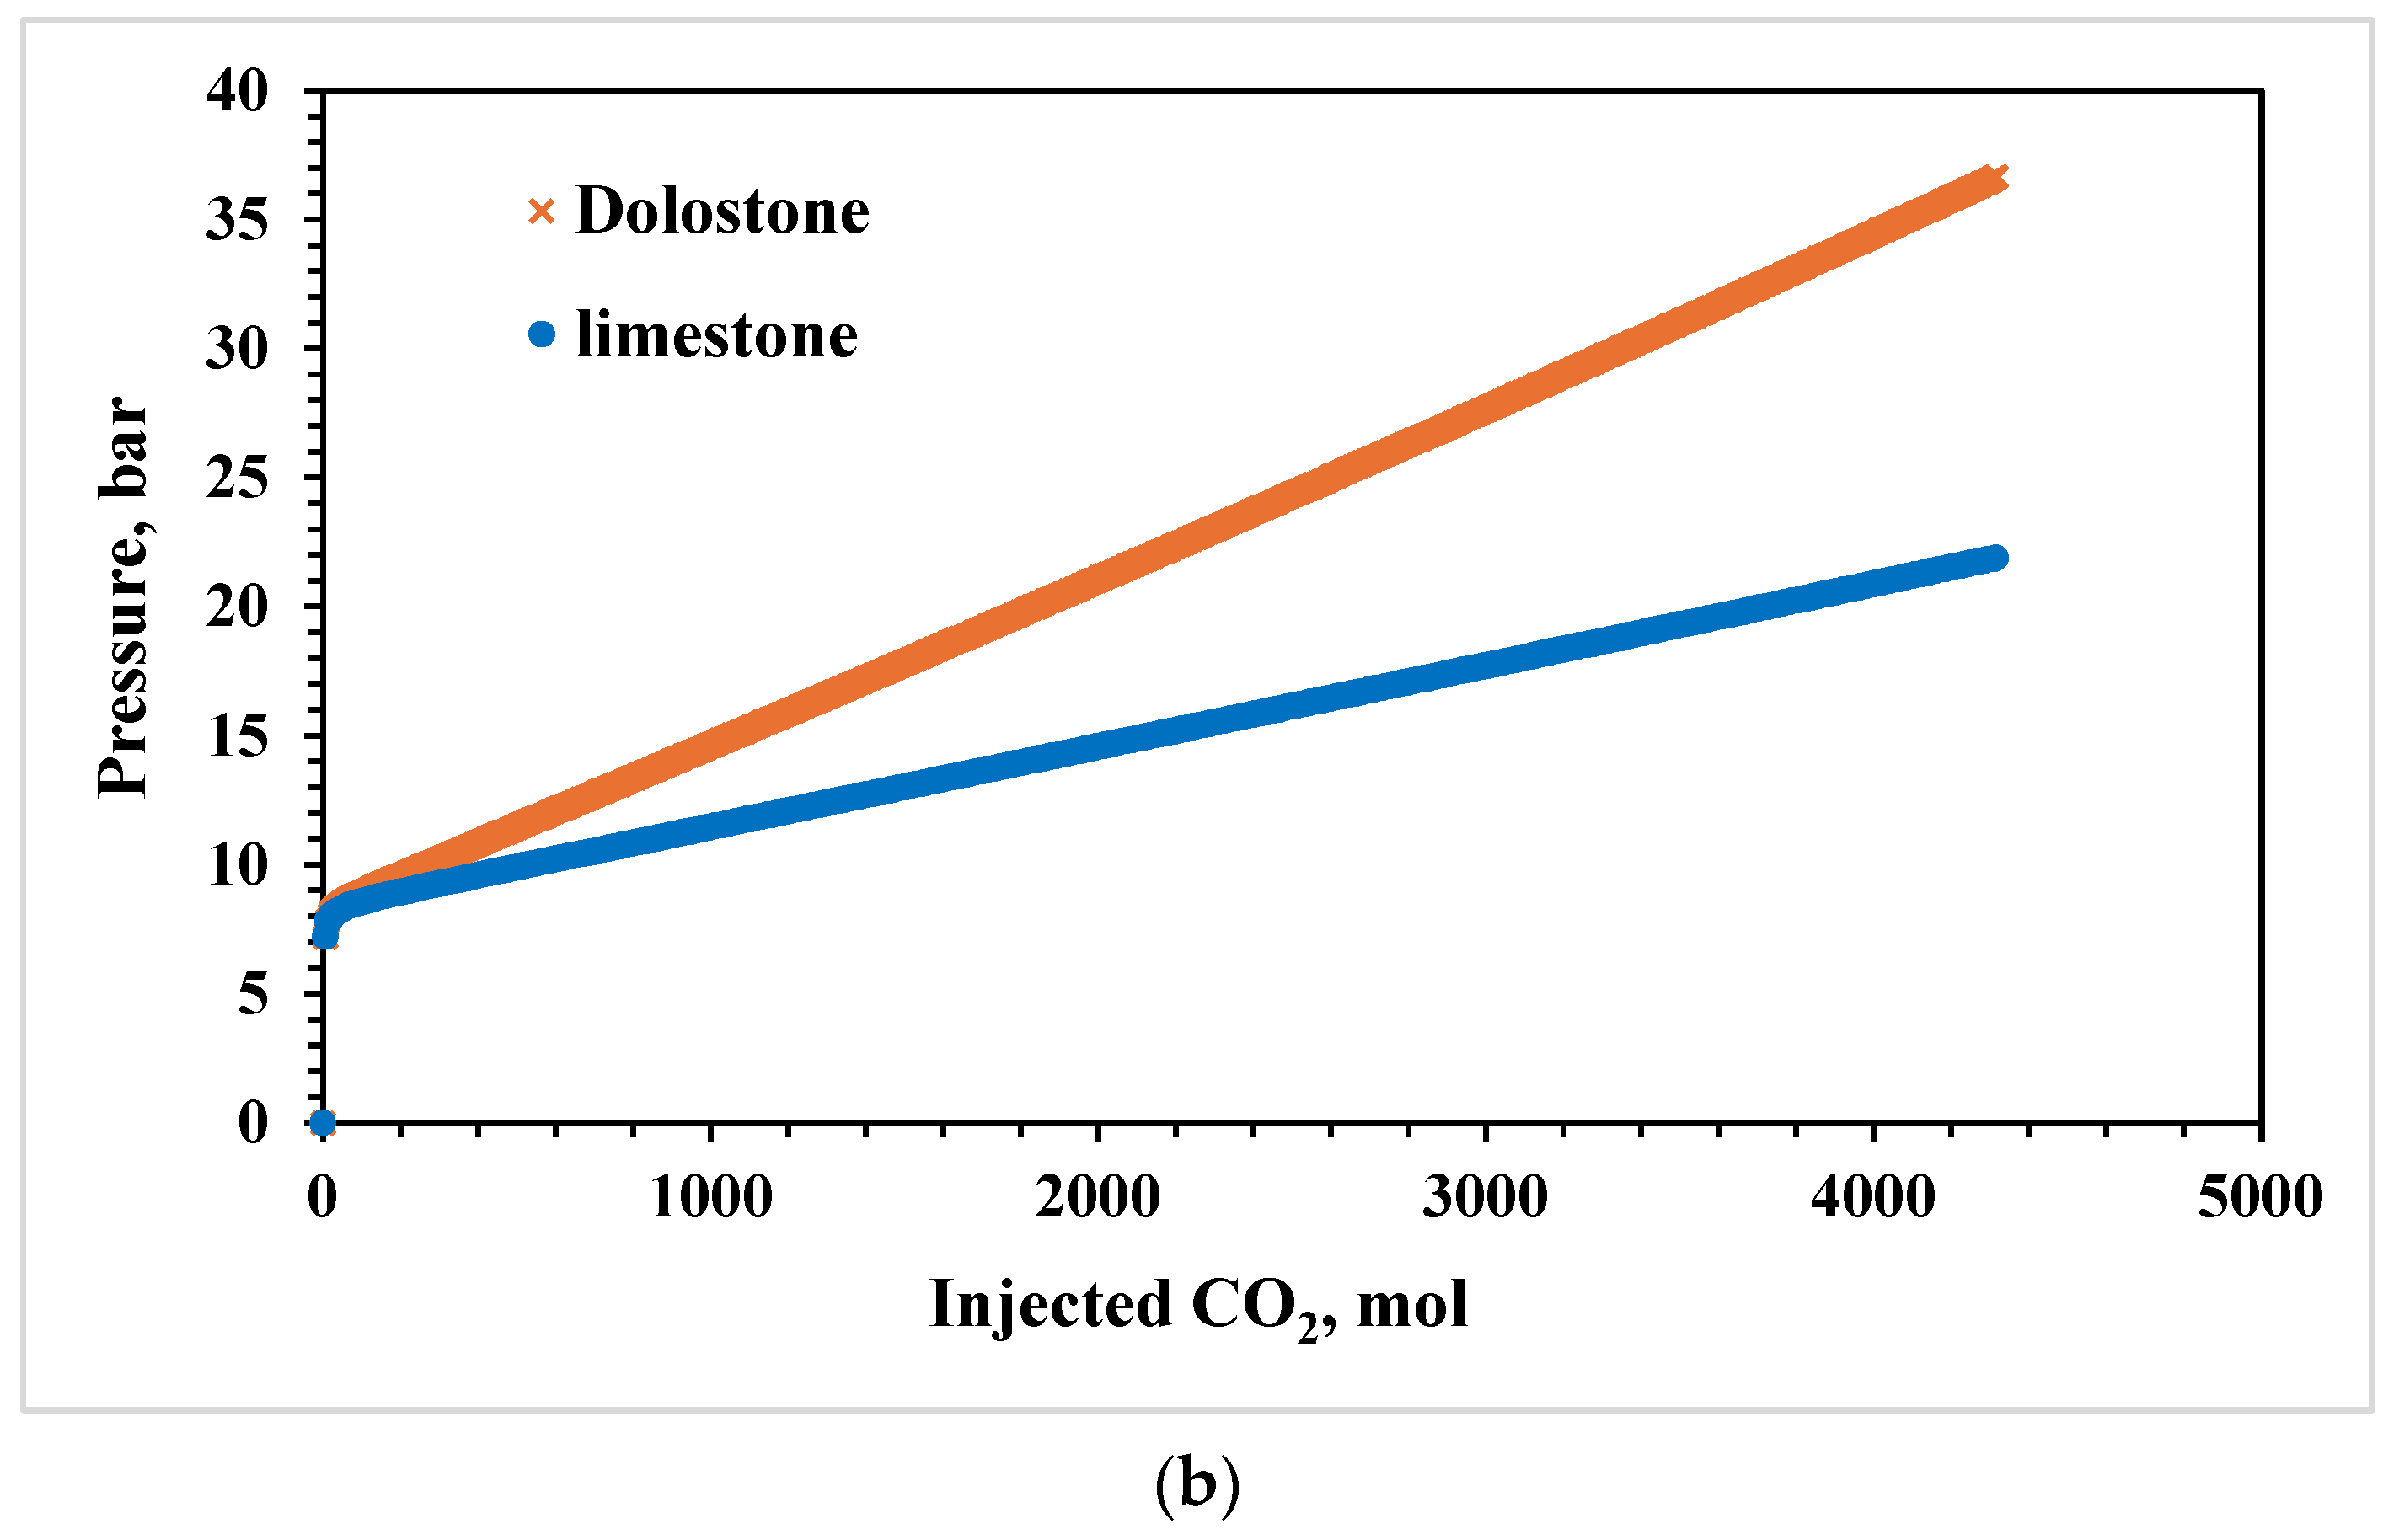
3.2. Effects of Pore Size

Figure 3 and Figure 4 present the physical variances, i.e., the reservoir pressure and pore volume, in the carbonate reservoirs during the CO2 injection process, specifically targeting the limestone and dolostone formations with different pore radii of 5, 10, and 50 µm. The constant CO2 injection rate of 0.1 mol/min serves as a controlled parameter to elucidate the effects of pore size on reservoir behavior as a result of the introduced CO2. Analysis of these two figures reveals a consistent trend across both types of carbonate reservoirs, whereby a diminution in pore radius correlates with an increase in reservoir pressure and a more pronounced augmentation in reservoir pore volume. The underlying mechanisms driving this observed phenomenon can be attributed to the increased surface area afforded by smaller pore sizes, since for a fixed pore volume, a smaller pore radius results in a larger surface area. The larger surface area in the carbonate reservoir with a smaller pore radius significantly enhances the interaction between the CO2-saturated carbonate brine and the carbonate rock matrix, which accelerates the dissolution process of the rock matrix and leads to a faster pore volume increment and slower pressure buildup. Moreover, the residual brine saturations are higher in the reservoir with smaller pore radii due to the hypothesis in this study that no free brine exists in the reservoir and all the residual brine adheres to the pore walls. This is exemplified by the calculation showing a dramatic difference in residual water saturation levels—75% in reservoirs with a pore radius of 5 µm versus only 8.5% in those with 50 µm pores. The higher residual brine saturation levels in smaller pores facilitate a larger CO2 dissolution capacity in the brine, leading to a more pronounced and rapid increase in pore volume. A comparative analysis between limestone and dolostone reservoirs reveals that with identical pore sizes and no matter what the pore radius is, limestone reservoirs exhibit lower reservoir pressures and more significant increases in pore volumes compared to dolostone reservoirs. This distinction is attributed to limestone’s inherently greater reactivity with CO2-saturated carbonate brine compared to dolostone, which has been stated in Section 3.1.

3.3. Effects of Pore–Throat Structures

Figure 5 and Figure 6 illustrate the impact of pore–throat structures on the space volume increase and reservoir pressure dynamics on the respective limestone and dolostone reservoirs during the CO2 injection process, respectively. The space volume in this subsection means pore volume for the pore-dominant reservoir and fracture volume for the fracture-dominant reservoir. Figure 5a,b presents a comparative analysis of space volume changes and pressure buildup in both pore-dominant and fracture-dominant limestone reservoirs during the CO2 injection process. Similarly, Figure 6a,b details the comparison of space volume change and pressure buildup in the dolostone reservoir under the same conditions. It is worth noting that both the pore or fracture radius and the CO2 injection rate were held constant across all scenarios, set at 5 µm and 0.1 mol/min, respectively.
The analysis shows a notably faster increase in the space volume within the pore-dominant reservoirs compared to their fracture-dominant counterparts. For instance, a limestone reservoir exhibited an 8.5% increase in space volume upon the injection of 4200 mol of CO2 in a pore-dominant structure, as opposed to a 6.8% increase in a fracture-dominant structure under identical injection conditions. This discrepancy is attributed to the differences in the reaction surface area provided by the geometrical shapes of the reservoir structures: cylindrical for fractures and spherical for pores. The spherical shape offers a larger surface–volume ratio, hence providing a larger reaction surface area in pore-dominant reservoirs when the space volume of the two types of reservoirs is the same. It has been stated in Section 3.2 that the larger reaction surface area not only accelerates rock matrix dissolution but also facilitates higher CO2 dissolution in brine, leading to a more significant increase in space volume. Furthermore, the disparity in space volume increase between pore-dominant and fracture-dominant reservoirs is more pronounced in limestone than in dolostone. This is due to the faster CO2–brine–rock matrix interaction in limestone, which amplifies the effects of pore–throat structures on space volume increment. The reservoir pressure change with the injected CO2 amount follows an opposite trend as the space volume increase vs. injected CO2 amount data. Fracture-dominant reservoirs display larger and faster reservoir pressure increases than pore-dominant reservoirs, either in limestone or dolostone. This phenomenon is directly associated with the fact that fracture-dominant reservoirs possess smaller and slower space volume enlargement. Since the pressure is inversely related to the space volume based on the real gas EOS stated in Section 3.1, the reservoir pressures in the fracture-dominant reservoirs are larger and increase faster than those in the pore-dominant reservoirs. Similarly, the larger pressure difference between the pore-dominant and fracture-dominant reservoirs observed in limestone in comparison to that in dolostone can be explained by the larger discrepancy in space volume increase between the pore-dominant and fracture-dominant reservoirs in limestone.
These findings underscore the dynamic interplay between pore–throat structures and CO2 injection in carbonate reservoirs. While fracture-dominant reservoirs may initially seem advantageous for CO2 sequestration due to easier injection, pore-dominant reservoirs exhibit a greater long-term CO2 storage capacity [32]. This is primarily due to their enhanced and more rapid increase in pore space, highlighting the critical role of reservoir structure, lithology, and mineralogy in optimizing CO2 storage and sequestration processes.

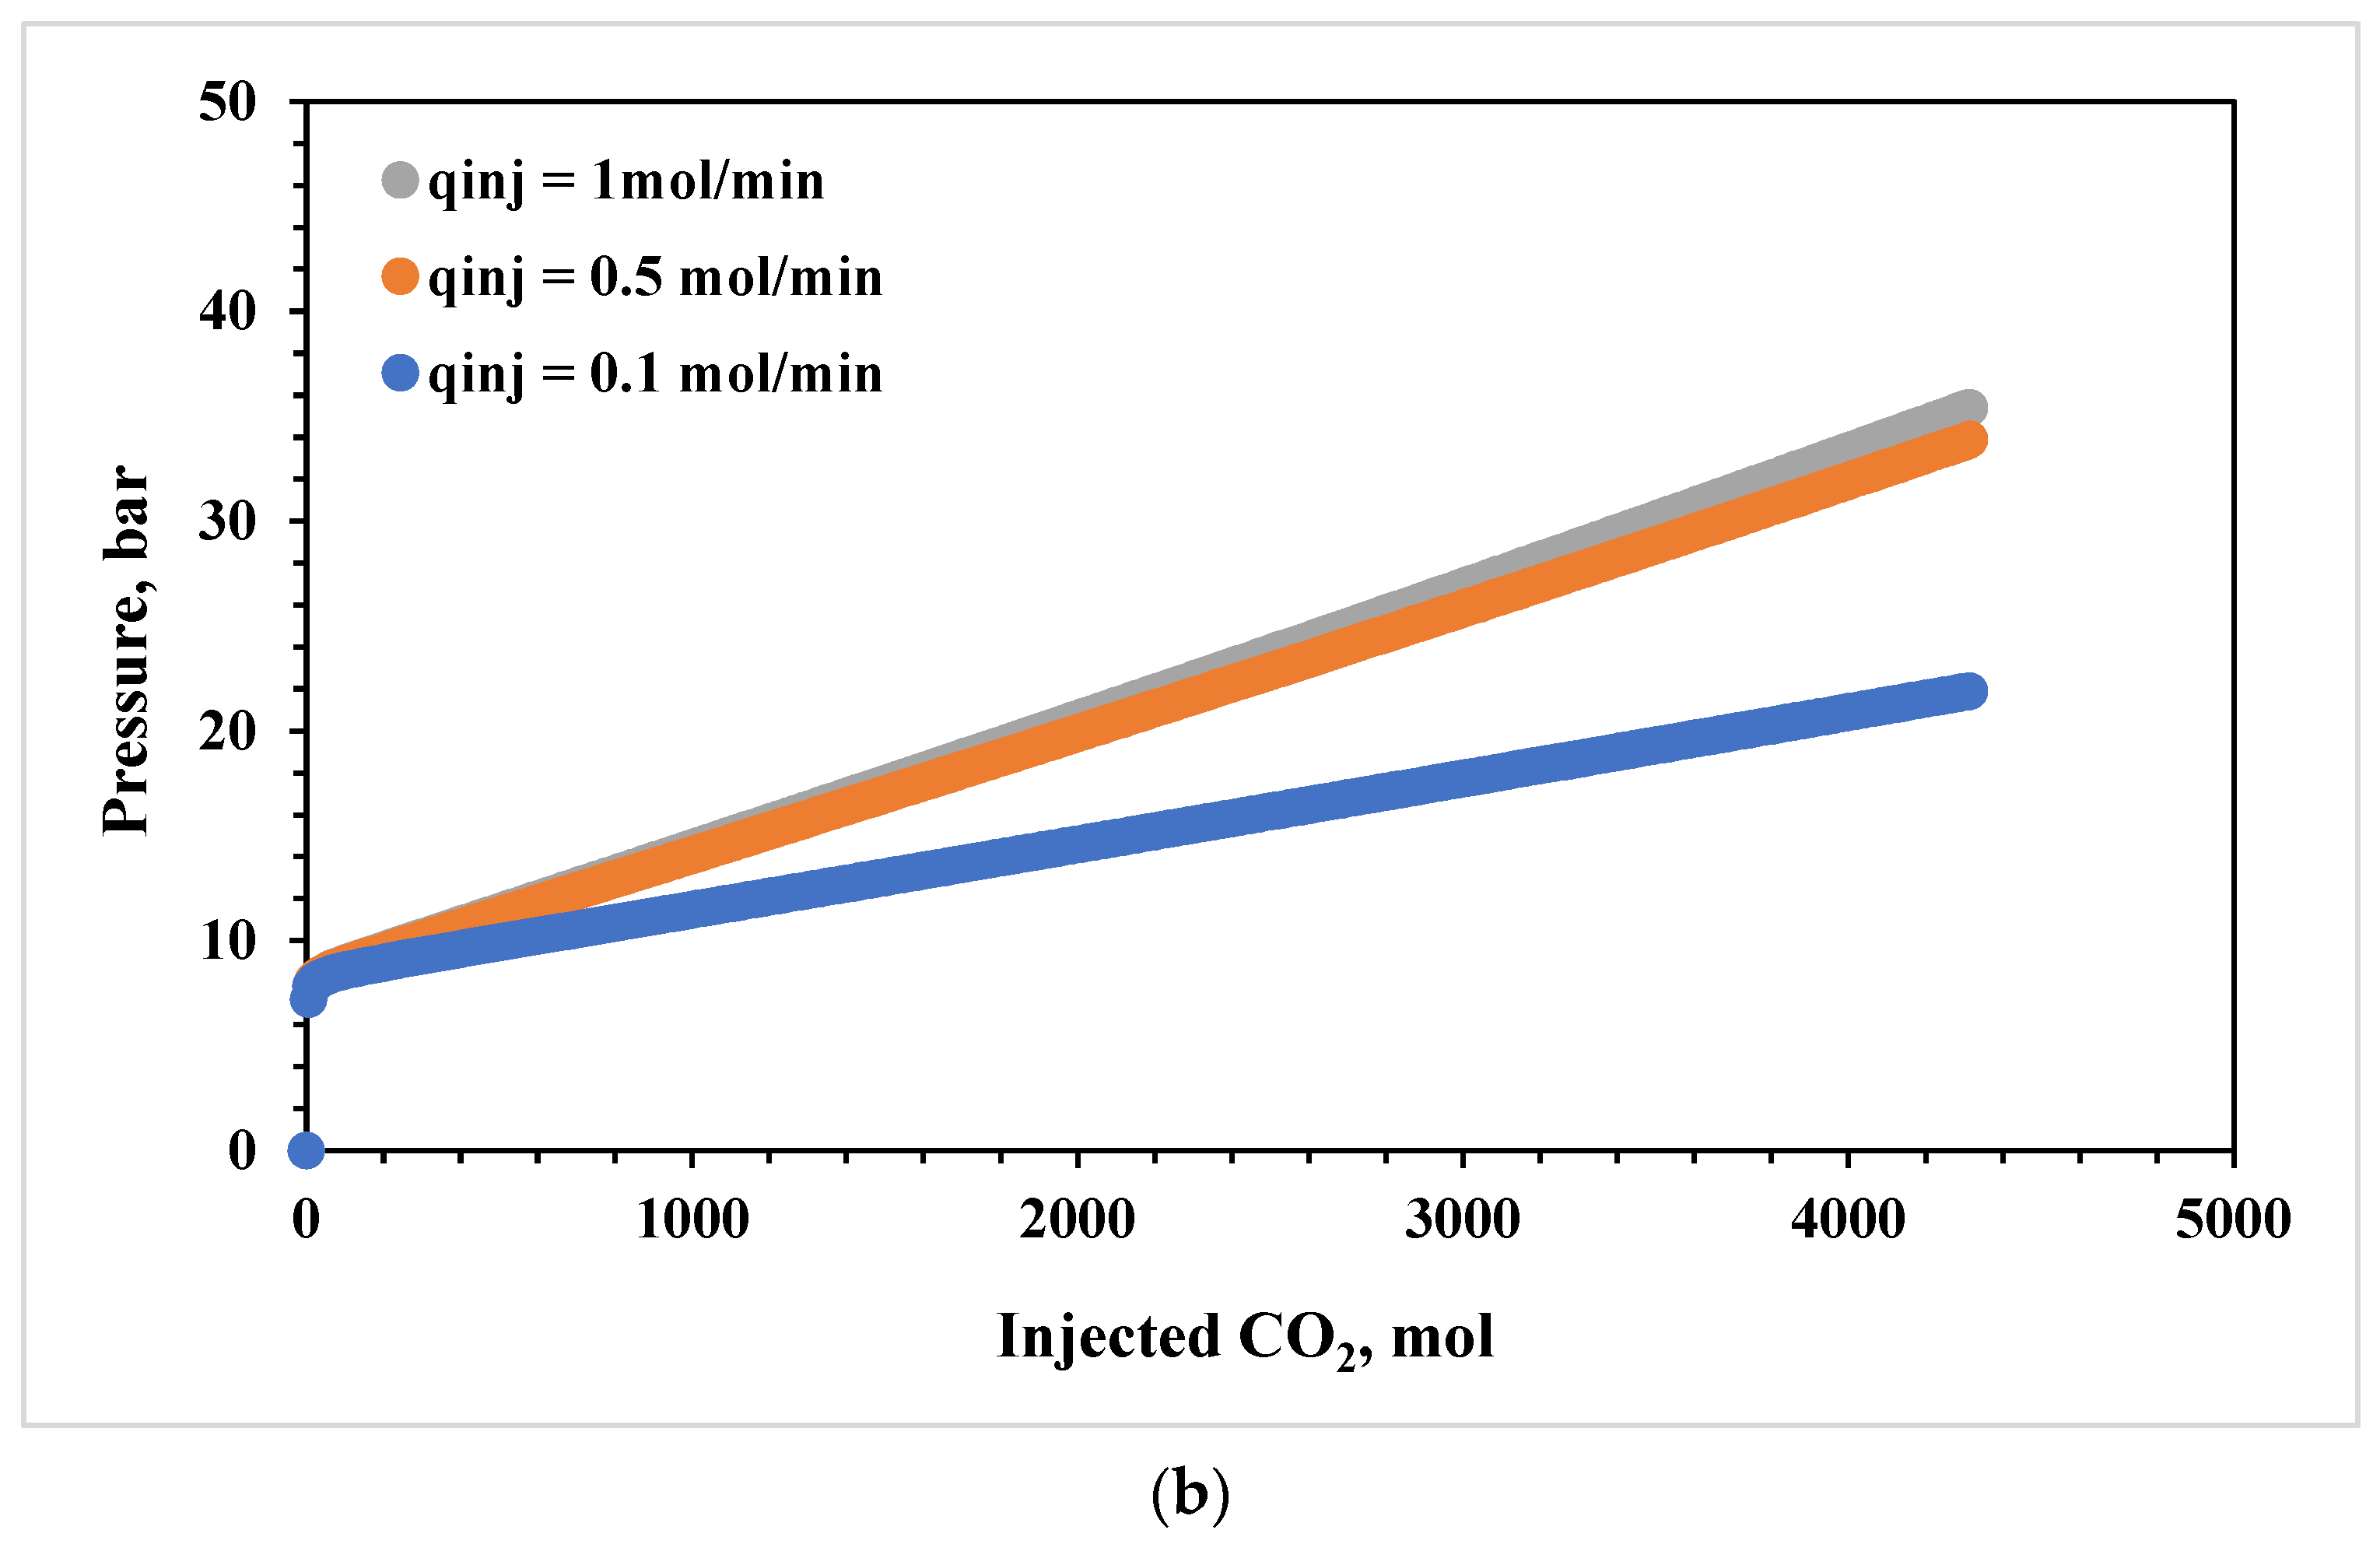
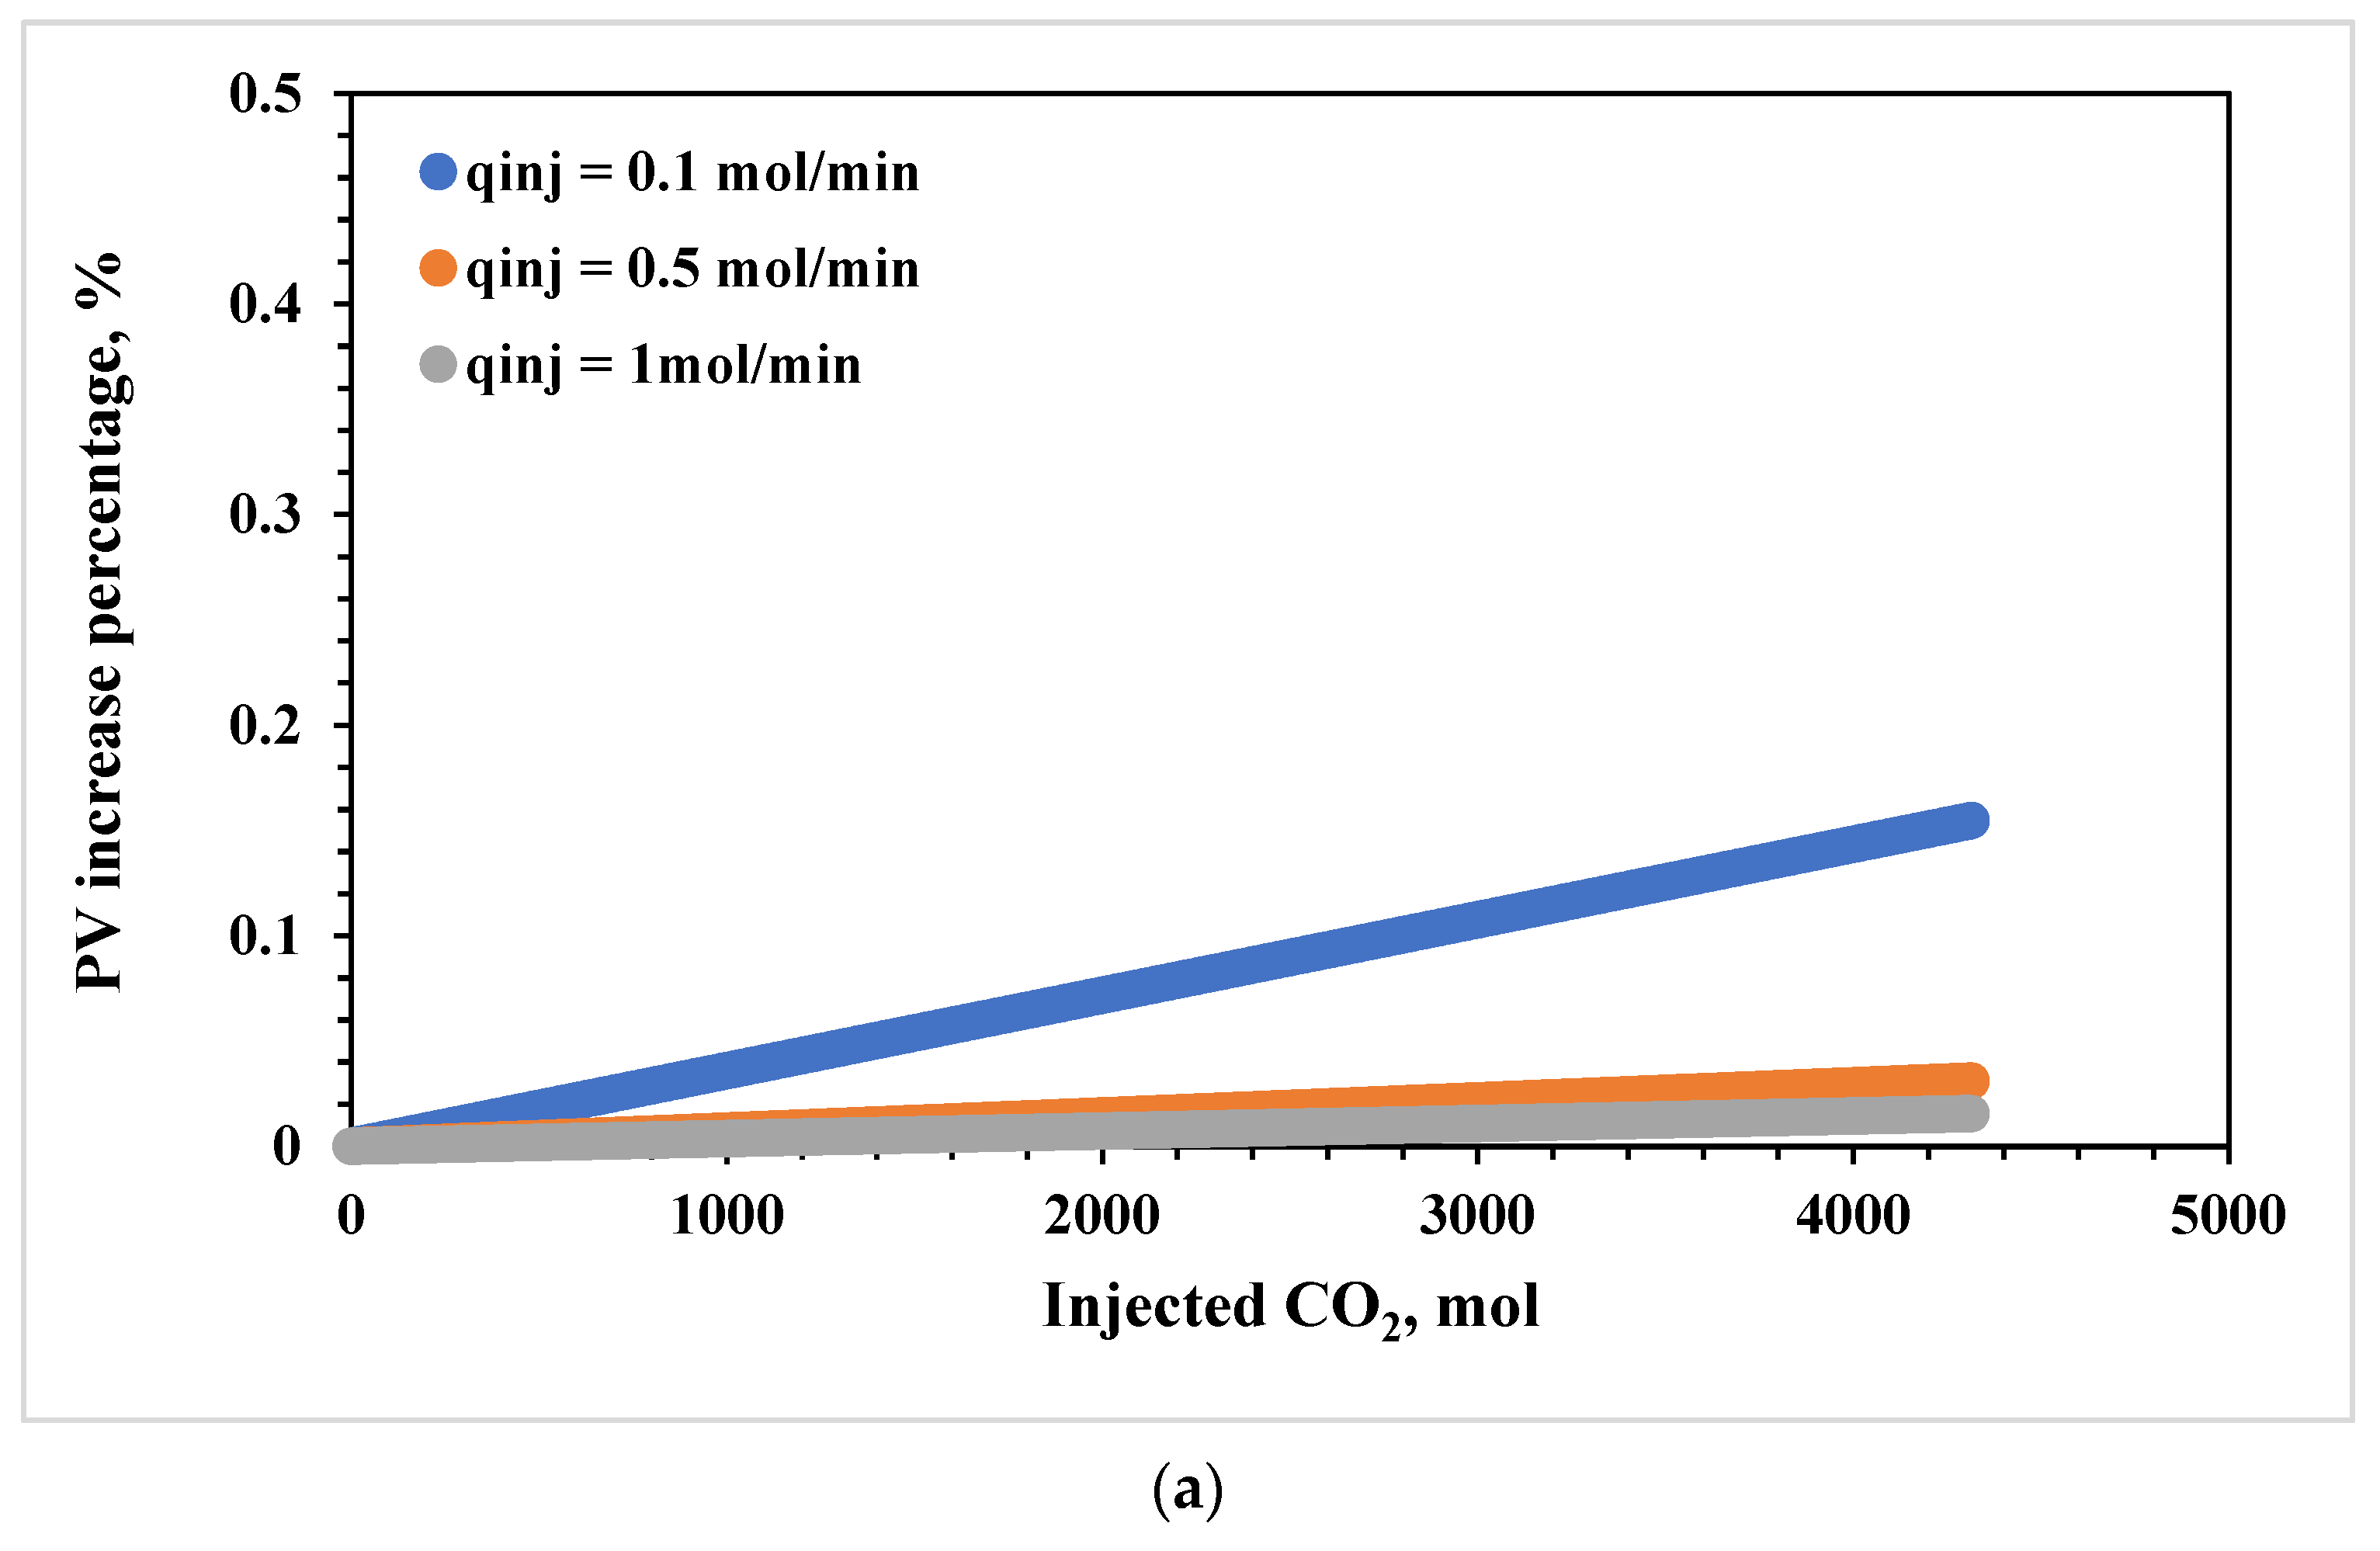
3.4. Effects of CO2 Injection Rate

The dynamic responses of pore volume and reservoir pressure to varying CO2 injection rates in limestone and dolostone reservoirs are demonstrated in Figure 7 and Figure 8. Specifically, Figure 7 delineates the increment in pore volume and the corresponding reservoir pressure build-up in the limestone reservoir during CO2 injection at injection rates of 0.1, 0.5, and 1 mol/min. Figure 8 illustrates the same results, but in the dolostone reservoir.
It is observed that the pore volume expansion within both limestone and dolostone reservoirs inversely correlates with the CO2 injection rate. For instance, the pore volumes increase by 8.5% and 0.16% in the respective limestone and dolostone reservoirs at a CO2 injection rate of 0.1 mol/min. In contrast, the increases in pore volume in the limestone and dolostone reservoirs are merely 0.85% and 0.016%, respectively, at a higher injection rate of 1 mol/min, which are ten times less than those at the lower injection rate of 0.1 mol/min. The mechanism for this inverse relationship is attributed to the slower injection rates, which provide a longer residence time for CO2 to physically dissolve and chemically interact with the carbonate rock matrix, thereby facilitating a greater increase in pore volume. It is worth noting that the reduction in pore volume increase is not linearly proportional to the increase in CO2 injection rate. For instance, in the limestone reservoir, a five-fold increase in the CO2 injection rate from 0.1 mol/min to 0.5 mol/min can result in an 8.5-fold reduction in pore volume increase. However, doubling the injection rate further to 1 mol/min only led to a 1.6-fold reduction in the pore volume increase. This phenomenon illustrates the non-linear and more pronounced impact of CO2 injection rates at lower ranges on pore volume expansion. Conversely, reservoir pressure exhibits a directly proportional relationship with the CO2 injection rates, which is opposed to the trend observed in pore volume changes. This observation is consistent with the established understanding that an inverse relationship exists between pore volume and reservoir pressure; a faster rate of pore volume increase leads to a comparatively slower rate of reservoir pressure buildup. The findings suggest the existence of an optimal CO2 injection rate for carbonate reservoirs. While a rapid injection rate may expedite reaching CO2 storage targets and reduce costs, it could potentially compromise the long-term maximum CO2 storage capacity of the reservoirs, indicating a trade-off between immediate efficiency and future storage potential.
Overall, the findings challenge traditional perceptions regarding carbonate reservoir suitability for CO2 storage, particularly highlighting the favorable characteristics of pore-dominant limestone reservoirs with small pore sizes, which is very much against the traditional opinion of seeking high-permeable fracture-dominant dolostone reservoirs with large pore sizes. This underscores the importance of constantly reevaluating reservoir characteristics because of CO2 injection-induced modifications. It is also worth noting that this study aims to investigate the effects of CO2–brine–carbonate rock interactions from a mechanistic perspective. Thus, the geological model was ideally constructed, such as the geological features of homogeneity, pore space of perfect spherical and cylindrical shape, uniform pore size, etc. It is evident that the actual carbonate reservoirs are far more complex than the geological model constructed in this paper. Therefore, further research is necessary to quantitatively apply the results of this research to real-world practices.

4. Conclusions

In this paper, the carbonate rock matrix dissolution process is comprehensively studied, and its implications on the physical variation in different carbonate reservoirs during CO2 injection and sequestration are simulated and demonstrated. The following conclusions can be drawn from this study.
Firstly, mineralogy plays an important role in the practice of CO2 sequestration in carbonate reservoirs. Limestone reservoirs exhibit a faster reaction with injected CO2 and residual brine compared to dolostone reservoirs due to their higher reactivity with carbonate. This leads to a slower reservoir pressure buildup in limestone reservoirs due to the more rapid dissolution of pore space.
Secondly, the type of reservoir, whether pore-dominant or fracture-dominant, significantly influences the dissolution process. Pore-dominant reservoirs exhibit a larger reaction surface area, resulting in faster dissolution and slower pressure buildup compared to fracture-dominant reservoirs.
Thirdly, carbonate mineral dissolution behavior is also related to pore size. Smaller pore sizes lead to larger reaction surface areas and greater residual brine saturation, resulting in faster pore volume expansion but slower pressure buildup. Conversely, carbonate reservoirs with larger pore sizes exhibit faster pressure buildup and slower pore volume expansion.
Furthermore, the CO2 injection rate also has an impact on dissolution dynamics. Slower injection rates allow for more time for CO2 to dissolve into residual brine and react with the rock matrix, leading to increased pore volume expansion and reduced pressure buildup compared to faster injection rates.
Importantly, these effects, i.e., pore space type, pore size, and injection rate, were found to be more pronounced in limestone reservoirs than in dolostone reservoirs, which indicates that the dolostone reservoir is more stable and less affected during the CO2 injection process.
Lastly, the above-mentioned conclusions hint at the necessity of continually reassessing the characteristics of the carbonate reservoir due to variations induced by injected CO2 and challenge the traditional perspective in the selection of high porosity and permeability zones for CO2 storage in carbonate reservoirs. Also, the idealistic geological model can be used to mechanistically and qualitatively study carbonate rock dissolution during CO2 injection. However, the quantitative application is limited.

Author Contributions

J.Y.: conceptualization, methodology, validation, formal analysis, investigation and writing original draft; Z.C.: conceptualization, methodology, writing review & editing, supervision and funding acquisition; C.J.: Methodology and writing review & editing; X.P.: methodology, investigation and formal analysis. All authors have read and agreed to the published version of the manuscript.

Funding

This work is funded by GeoEnergy program of Natural Resources Canada: 330149.

Data Availability Statement

Data is available upon request.

Conflicts of Interest

The authors declare on conflicts of interests.

References

  1. Baban, A.; Ali, M.; Arif, M.; Keshavarz, A.; Amin, R.; Iglauer, S. Effect of Organic Acid on CO2 Trapping in Carbonate Geological Formations: Pore-Scale Observations Using NMR. Energy Fuels 2023, 37, 2983–2992. [Google Scholar] [CrossRef]
  2. Yao, J.; Yuan, W.; Peng, X.; Chen, Z.; Gu, Y. A Novel Multi-Phase Strategy for Optimizing CO2 Utilization and Storage in an Oil Reservoir. Energies 2023, 16, 5289. [Google Scholar] [CrossRef]
  3. Kolawole, O.; Millikan, C.; Kumar, M.; Ispas, I.; Schwartz, B.; Weber, J.; Badurina, L.; Segvic, B. Impact of Microbial-Rock- CO2 interactions on Containment and Storage Security of Supercritical CO2 in Carbonates. Int. J. Greenh. Gas. Con. 2022, 120, 103755. [Google Scholar] [CrossRef]
  4. Tiab, D.; Donaldson, E.C. Chapter 8—Naturally Fractured Reservoirs. In Petrophysics, 4th ed.; Tiab, D., Donaldson, E.C., Eds.; Gulf Professional Publishing: Oxford, UK, 2016; pp. 415–481. [Google Scholar] [CrossRef]
  5. Postma, T.J.W.; Bandilla, K.W.; Peters, C.A.; Celia, M.A. Field-Scale Modeling of CO2 Mineral Trapping in Reactive Rocks: A Vertical Integrated Approach. Water Resour. Res. 2022, 58, e2021WR030626. [Google Scholar] [CrossRef]
  6. Agada, S.; Geiger, S.; Doster, F. Wettability, Hysteresis and Fracture–Matrix Interaction during CO2 EOR and Storage in Fractured Carbonate Reservoirs. Int. J. Greenh. Gas. Con. 2016, 16, 57–75. [Google Scholar] [CrossRef]
  7. Lee, Y.; Kim, S.; Wang, J.; Sung, W. Relationship between Oil Production and CO2 Storage during Low-Salinity Carbonate Water Injection in Acid Carbonate Reservoirs. J. Ind. Eng. Chem. 2020, 88, 215–223. [Google Scholar] [CrossRef]
  8. Huang, Z.; Cheng, Y.; Zhang, D.; Yan, D.; Shen, Y. Seismic Fragility and Resilience Assessment of Shallowly Buried large-Section Underground Civil Defense Structure in Soft Soils: Framework and Application. Tunn. Undergr. Space Technol. 2024, 146, 145640. [Google Scholar] [CrossRef]
  9. Kumar, R.; Campbell, S.; Sonnenthal, E.; Cunningham, J. Effect of Brine Salinity on the Geological Sequestration of CO2 in a Deep Saline Carbonate Formation. Greenh. Gases 2019, 10, 296–312. [Google Scholar] [CrossRef]
  10. Raza, A.; Gholami, R.; Rezaee, R.; Bing, C.H.; Nagarajan, R.; Hamid, M.A. Preliminary Assessments of CO2 Storage in Carbonate Formations: A Case Study from Malaysia. J. Geophy. Eng. 2017, 14, 533–554. [Google Scholar] [CrossRef]
  11. Smith, M.M.; Hao, Y.; Carroll, S.A. Development and Calibration of a Reactive Transport Model for Carbonate Reservoir Porosity and Permeability Changes Based on CO2 Core-Flood Experiments. Int. J. Greenh. Gas. Con. 2017, 57, 73–88. [Google Scholar] [CrossRef]
  12. Yang, Y.; Li, Y.; Yao, J.; Iglauer, S.; Luqout, L.; Zhang, K.; Sun, H.; Zhang, L.; Song, W.; Wang, Z. Dynamic Pore-Scale Dissolution by CO2-Saturated Brine in Carbonates: Impact of Homogeneous Versus Fractured Versus Vuggy Pore Structure. Water Resour. Res. 2020, 56, e2019WR026112. [Google Scholar] [CrossRef]
  13. Pearce, J.K.; Dawson, G.W.; Brink, F.; Southam, G.; Paterson, D.; Hall, N.; Heath, R.; Greer, D.; Kirste, D.; Golding, S.D. Impure CO2 Storage Reactions of Sandstone, Mudstone and Carbonate Cemented Cores: Experimental CO2, SO2, NOxO2 Reaction Metal Mobilisation and Fate. Int. J. Coal Geol. 2023, 277, 104352. [Google Scholar] [CrossRef]
  14. Hao, Y.; Smith, M.M.; Carroll, S.A. Multiscale Modeling of CO2-Induced Carbonate Dissolution: From Core to Meter Scale. Int. J. Greenh. Gas. Con. 2019, 88, 272–289. [Google Scholar] [CrossRef]
  15. Mitiku, A.B.; Li, D.; Bauer, S.; Beyer, C. Geochemical Modelling of CO2-Water-Rock Interactions in a Potential Storage Formation of the North German Sedimentary Basin. Appl. Geochem. 2013, 36, 168–186. [Google Scholar] [CrossRef]
  16. Menke, H.P.; Reynolds, C.A.; Andrew, M.G.; Pereira, J.P.; Bijeljic, B.; Blunt, M.J. 4D Multi-Scale Imaging of Reactive Flow in Carbonates: Assessing the Impact of Heterogeneity on Dissolution Regimes Using Streamlines at Multiple Length Scales. Chem. Geol. 2016, 481, 27–37. [Google Scholar] [CrossRef]
  17. Salem, A.M.; Shedid, S.A. Variation of Petrophysical Properties due to Carbon Dioxide (CO2) Storage in Carbonate Reservoirs. 2013. J. Pet. Gas. Eng. 2013, 4, 91–102. [Google Scholar]
  18. Hosseini, M.; Ali, M.; Fahimpour, J.; Keshavarz, A.; Iglauer, S. Calcite−Fluid Interfacial Tension: H2 and CO2 Geological Storage in Carbonates. Energy Fuels 2023, 37, 5986–5994. [Google Scholar] [CrossRef]
  19. Cui, G.; Zhang, L.; Tan, C.; Ren, S.; Zhuang, Y. Injection of supercritical CO2 for geothermal exploitation from sandstone and carbonate reservoirs: CO2–water–rock interactions and their effects. J. CO2 Uti. 2017, 20, 113–128. [Google Scholar] [CrossRef]
  20. Seyyedi, M.; Mahmud, H.K.B.; Verrall, M.; Giwelli, A.; Esteban, L.; Ghasemiziarani, M.; Clennell, B. Pore Structure Changes Occur during CO2 injection into Carbonate Reservoirs. Sci. Rep. 2020, 10, 3624. [Google Scholar] [CrossRef]
  21. Chen, M.; Zhang, Y.; Liu, S.; Zhao, C.; Dong, S.; Song, Y. CO2 Transport and Carbonate Precipitation in the Coupled Diffusion-Reaction Process during CO2 Storage. Fuel 2023, 334, 126805. [Google Scholar] [CrossRef]
  22. Valle, L.M.; Grima, C.; Rodriguez, R.; Llopis, C. Effect of sc CO2-Brine Mixture on Injectivity and Storage Capacity in Rock Samples of Naturally Fractured Carbonate Formations. J. Nat. Gas Sci. Eng. 2020, 81, 103452. [Google Scholar] [CrossRef]
  23. Zhang, Y.; Zhang, Z.; Arif, M.; Lebedev, M.; Andreas, B.; Sarmadivaleh, M.; Iglauer, S. Carbonate Rock Mechanical Response to CO2 Flooding Evaluated by a Combined X-ray Computed Tomography—DEM Method. J. Nat. Gas Sci. Eng. 2020, 24, 103675. [Google Scholar] [CrossRef]
  24. Shokri, J.; Ruf, M.; Lee, D.; Mohammadrezaei, S.; Steeb, H.; Niasar, V. Exploring Carbonate Rock Dissolution Dynamics and the Influence of Rock Mineralogy in CO2 Injection. Environ. Sci. Technol. 2024, 58, 2728–2738. [Google Scholar] [CrossRef] [PubMed]
  25. Tan, Y.; Li, Q.; Xu, L.; Onyekwena, C.C.; Yu, T.; Xu, L. Effects of SiO2 Nanoparticles on Wettability and CO2-Brine-Rock interactions in Carbonate Reservoirs: Implications for CO2 Storage. Energy Fuels 2024, 38, 1258–1270. [Google Scholar] [CrossRef]
  26. Siqueira, T.A.; Iglesia, R.S.; Ketzer, J.M. Carbon Dioxide Injection in Carbonate Reservoirs—A Review of CO2-Water-Rock Interaction Studies. Greenh. Gases 2017, 7, 802–816. [Google Scholar] [CrossRef]
  27. Peng, D.Y.; Robinson, D.B. A new two-constant equation of state. Ind. Eng. Chem. Fundam. 1976, 15, 59–64. [Google Scholar] [CrossRef]
  28. Xu, T.; Kharaka, Y.K.; Doughty, C.; Freifeld, B.M.; Daley, T.M. Reactive Transport Modeling to Study changes in Water Chemistry Induced by CO2 Injection at the Frio-I Brine Pilot. Chem. Geol. 2010, 271, 153–164. [Google Scholar] [CrossRef]
  29. Zhao, Y.; Zhang, Q.; Chen, X. Experimental Investigation on Effect of Water Flim Thickness in Unsaturated Sandstone Cores on CO2 Transport during Geologic Storage. J. Hydrol. 2021, 601, 126595. [Google Scholar] [CrossRef]
  30. Andre, L.; Audigane, P.; Azaroual, M.; Menjoz, A. Numerical Modeling of Fluid–Rock Chemical Interactions at the Supercritical CO2–Liquid Interface during CO2 Injection into a Carbonate Reservoir, the Dogger Aquifer (Paris Basin, France). Energy Conv. Manag. 2007, 48, 1782–1797. [Google Scholar] [CrossRef]
  31. Schmoker, J.W.; Krystinik, K.B.; Halley, R.B. Selected Characteristics of Limestone and Dolomite Reservoirs in the United States. AAPG Bull. 1985, 69, 733–741. [Google Scholar]
  32. Marchado, M.V.B.; Khanal, A.; Delshad, M. Unveiling the Essential Parameters Driving Mineral Reactions during CO2 storage in Carbonate Aquifers through Proxy Models. Appl. Sci. 2024, 14, 1465. [Google Scholar] [CrossRef]
Figure 1. The flowchart to describe CO2 injection and carbonate rock matrix dissolution.
Applsci 14 06002 g001
Figure 2. The comparison of (a) pore volume (PV) increase and (b) pressure buildup during CO2 injection in limestone and dolostone reservoirs.
Applsci 14 06002 g002aApplsci 14 06002 g002b
Figure 3. The comparison of (a) pore volume (PV) increase and (b) pressure increment in the limestone reservoir with different pore sizes during CO2 injection.
Applsci 14 06002 g003
Figure 4. The comparison of (a) pore volume (PV) increase and (b) pressure increment in the dolostone reservoir with different pore sizes during CO2 injection.
Applsci 14 06002 g004
Figure 5. The comparison of (a) pore volume (PV) increase and (b) pressure increment in the limestone reservoirs with pore-dominant and fracture-dominant structures.
Applsci 14 06002 g005
Figure 6. The comparison of (a) pore volume (PV) increase and (b) pressure increment in the dolostone reservoirs with pore-dominant and fracture-dominant structures.
Applsci 14 06002 g006
Figure 7. The comparison of (a) pore volume (PV) increase and (b) pressure increment in the limestone reservoirs during CO2 injection with different injection rates of 0.1, 0.5, and 1.0 mol/min.
Applsci 14 06002 g007aApplsci 14 06002 g007b
Figure 8. The comparison of (a) pore volume (PV) increase and (b) pressure increment in the dolostone reservoirs during CO2 injection with different injection rates of 0.1, 0.5, and 1.0 mol/min.
Applsci 14 06002 g008aApplsci 14 06002 g008b
Table 1. The lithology, pore space type, pore size, and CO2 injection rate in each scenario.
Scenario No.LithologyPore Space TypePore Size (µm)Injection Rate (mol/min)
1LimestonePore-dominant51.0
2LimestonePore-dominant50.5
3LimestonePore-dominant50.1
4LimestonePore-dominant100.1
5LimestonePore-dominant500.1
6LimestoneFracture-dominant51.0
7LimestoneFracture-dominant50.5
8LimestoneFracture-dominant50.1
9LimestoneFracture-dominant100.1
10LimestoneFracture-dominant500.1
11DolostonePore-dominant51.0
12DolostonePore-dominant50.5
13DolostonePore-dominant50.1
14DolostonePore-dominant100.1
15DolostonePore-dominant500.1
16DolostoneFracture-dominant51.0
17DolostoneFracture-dominant50.5
18DolostoneFracture-dominant50.1
19DolostoneFracture-dominant100.1
20DolostoneFracture-dominant500.1
Table 2. The mineral kinetic reaction constant for calcite and dolomite used in this study [10,13,30].
LithologyReaction Constant
logkEm (kJ/mol)
Calcite−5.8123.5
Dolomite−7.5352.2
Disclaimer/Publisher’s Note: The statements, opinions and data contained in all publications are solely those of the individual author(s) and contributor(s) and not of MDPI and/or the editor(s). MDPI and/or the editor(s) disclaim responsibility for any injury to people or property resulting from any ideas, methods, instructions or products referred to in the content.

