Article

Multicriteria Decision Model for Port Evaluation and Ranking: An Analysis of Container Terminals in Latin America and the Caribbean Using PCA-TOPSIS Methodologies

by
Adriana Pabón-Noguera
1,*,
María Gema Carrasco-García
2,
Juan Jesús Ruíz-Aguilar
2,*,
María Inmaculada Rodríguez-García
3,
María Cerbán-Jimenez
4 and
Ignacio José Turias Domínguez
3
1
Department of Civil Engineering, Faculty of Engineering, University of Magdalena (Unimagdalena), Santa Marta 470003, Colombia
2
Department of Industrial and Civil Engineering, Algeciras School of Engineering and Technology (ASET), University of Cádiz, 11202 Algeciras, Spain
3
Department of Computer Science Engineering, Algeciras School of Engineering and Technology (ASET), University of Cádiz, 11202 Algeciras, Spain
4
Faculty of Economic and Business Sciences, Avda. Duque de Nájera s/n, 11002 Cádiz, Spain
*
Authors to whom correspondence should be addressed.
Appl. Sci. 2024, 14(14), 6174; https://doi.org/10.3390/app14146174
Submission received: 11 June 2024 / Revised: 12 July 2024 / Accepted: 13 July 2024 / Published: 16 July 2024

Abstract

:
In recent years, despite a decline in international trade and disruptions in the supply chain caused by COVID-19, the main container terminals in Latin America and the Caribbean (LAC) have increased their container volumes. This growth has necessitated significant adaptations by seaports and their authorities to meet new demands. Consequently, there has been a focused analysis on the performance, efficiency, and competitiveness, particularly their most relevant logistical aspects. In this paper, a multi-objective hybrid approach was employed. The Principal Component Analysis (PCA) technique was combined with the Technique for Order of Preference by Similarity to the Ideal Solution (TOPSIS) to rank LAC container terminals and identify operational criteria affecting efficiency. The analysis considered all input variables (berth/quay length, quay draught, yard area, number of quay cranes (portainer), number of yard cranes (trastainer), reachstacker, multicranes, daily montainer movement capacity, number of station reefer container type, number of terminals, and distance to the Panama Canal) and output variable (port performance expressed in TEUs from 2014 to 2023). The results revealed noteworthy findings for several terminals, particularly Colón, Santos, or Cartagena, which stands out as the main container port in LAC not only in annual TEUs throughput, but also in resource utilization.

1. Introduction

Container terminals represent the most crucial link in global trade, making containerization one of the primary modes of goods transportation [1]. Being competitive implies, for container terminals, operating efficiently, considering all operational and logistical resources, and often, even their geographical position. Analyzing container terminals is of interest not only to economists but also to businesses, governments, academia, and international organizations. This is because maritime ports play a significant role in facilitating the economic development of countries, regions, and the world [2].
This article focuses on container terminals in Latin America and the Caribbean (LAC), particularly those that have averaged over one million TEUs in container movements over the past ten years. Additionally, other terminals have been analyzed despite not meeting this criterion, as they represent the most significant traffic in their respective countries, such as Montevideo in Uruguay, or are of particular interest to the authors, such as Santa Marta and Barranquilla in Colombia. The aim is to evaluate all operational characteristics and annual performance to establish an operational ranking of ports using multi-criteria decision models and multivariate data analysis methods for a selection of 23 ports.
The terminals in LAC have played a key role in international commercial markets. LAC’s main trading partners are the United States, China, and the European Union (EU). Trade exchanges with these three blocs represent about 65% of the total international trade in the region [3]. Additionally, the geographical position of many terminals near the Panama Canal offers competitive advantages to maritime carriers, which has materialized in the trend of container traffic growth and consequently in the improvement of operational and logistical capacities [4].
Container movement in LAC is relatively low (for 2022, it recorded a total volume of 58,669,478 TEUs) when compared to the entirety of the European Union and even if we consider China and other countries in Southeast Asia. A comparison can be seen in Table 1. However, its significance lies in the strength and concentration of business, with its main trading partners, China and the United States, moving 40% of TEUs worldwide. Strong trade ties with the Asian country are maintained by Brazil, Chile, and Peru and it is noteworthy that 73% of Mexico’s total exports for 2022 were to the neighboring country [3].
One of the key strengths of Latin American ports is their geographical proximity to the Panama Canal, which has resulted in increased container traffic, private investments, and operational enhancements at their terminals. Most of these investments have taken place since 2010, making it pertinent to conduct this study using container traffic volumes from 2014 onwards, by which time most terminals had been adapted to meet current logistical demands.
As indicated, a set of 23 ports was selected based on two important criteria. Firstly, the average total container traffic over the past ten years had to exceed one million TEUs per year. Secondly, the port’s significance to the national economy was considered. Accordingly, seven ports from the Pacific coast and sixteen from the Caribbean and Atlantic coasts were chosen. The Pacific ports handle 35% of the total container volume in LAC.
In addition to physical and operational characteristics, other factors could contribute to improving the efficiency of container terminals. Some of these factors include technological advancements in state-of-the-art handling equipment, physical expansion of storage areas, investments by private companies and major shipping lines as terminal operators, blockchain, terminal automation, or integrated management platforms for port operations, among others [5]. However, not all ports in LAC have adapted to these changes in the same way.
As the LAC ports adapt and reconfigure in response to various challenges to become future Smart Ports, they must compete on an equal footing to maintain high productivity, efficiency, and consequently, competitiveness by utilizing all available resources. In this context, the resources available to all the analyzed terminals are similar and have been evaluated under the same conditions and methodologies.
For this document, a review of articles published over the past 20 years was conducted, with particular emphasis on literature from 2010 onwards. There is a clear interest in analyzing container terminals globally, especially in Europe and Southeast Asia, focusing on evaluating efficiency and competitiveness. Most of the available methodologies are based on multi-criteria decision-making methods.
In recent years, particularly over the last 20 years, multi-criteria decision-making models (MCDMs) have gained significant preference in the evaluation of various transportation systems and transport chains [6]. This growing preference is driven by the perspectives of exporters, importers, and users of transportation systems, for whom the characteristics of the terminals themselves have become more important than the costs associated with port activities [7]. To study the efficiency and productivity of terminals, optimization and simulation models have also been predominantly employed [8]. The use of MCDM is crucial because it allows for a comprehensive assessment and comparison of various aspects of transport logistics and transport chains [9]. Recent studies have focused on intermodal transport in Europe, aiming to analyze, define, and classify constraints related to logistics chains in intermodal transport. This enables a comparison of different logistics chain implementation alternatives to select the most suitable one [10].
In the selection of alternatives within transportation systems, MCDM provides a systematic approach for evaluating and selecting the most appropriate transport system. In Europe, MCDM aims to develop a decisive system with clear rules and standards for selecting the most suitable business partner in the freight railway market [11]. For evaluating the logistics and competitiveness of public and private transportation systems, MCDM examines the economic and technological factors influencing the competitiveness of public transport services in integrated transport systems [12]. In the case at hand, which involves the evaluation for port ranking and the selection of ports and container terminals [13], there are significant references. This evaluation focuses on the classification of constraints and the development of a multi-criteria assessment framework to improve the efficiency of logistics chains. Table 2 summarizes the most used methods and criteria for studying transport systems, the efficiency, and creating rankings of ports, particularly for container terminals in Asia and Europe.
Using Principal Component Analysis (PCA) and the Technique for Order of Preference by Similarity to Ideal Solution (TOPSIS), the main aim of this study was to create a ranking of container terminals in LAC by implementing the innovative application of the discrete multi-attribute decision making (distance-based) TOPSIS model for assessing container terminals. The use of PCA aims to assess the dimensional reduction of variables to determine the significance of each variable within the ranking. And through TOPSIS, the ranking can be calculated and validated [17]. PCA is a classical technique commonly used for dimensionality reduction across a wide range of fields even in logistics and supply chain management strategies [18] or marine pollution.
The synergy of methods: Combining PCA and TOPSIS leverages the strengths of both approaches. PCA reduces complexity and highlights key factors, while TOPSIS provides a detailed and weighted evaluation of each terminal [19]. Improved accuracy: Initially employing PCA to simplify and emphasize key factors makes the subsequent application of TOPSIS more precise and manageable [20]. Informed decision making: The combination of these methods establishes a solid foundation for decision making, ensuring that all relevant aspects are considered and subjectivity is minimized [21].
PCA reduces the dimensionality of data while retaining most of the original variability, facilitating the handling of complex data and avoiding redundancy [22]. Additionally, it enables the identification of key components that influence terminal performance, highlighting the most important factors for decision making. TOPSIS, as a multi-criteria evaluation method, considers multiple criteria simultaneously, providing a comprehensive evaluation of each container terminal. This method is based on proximity to the ideal solution, meaning terminals are evaluated based on their closeness to the best possible performance in each criterion [23].
In this research, the number of variables does not make dimensionality reduction essential. However, PCA allows us to analyze the relevance of the variables themselves, observe how they impact the final ranking, and thereby conduct a more thorough analysis of the results. The comprehensive analysis considers 23 major LAC container ports characterized in terms of supply (berth length, depth, yard area, number of quay cranes, number of yard cranes, daily container handling capacity, number of reefer container stations, number of terminals, and distance to the Panama Canal) and demand variables (TEUs moved between 2014 and 2023). See Appendix A and Appendix B.
This document is divided into five sections. Section 1 outlines the main background and context of the research. Section 2 describes the methodology and procedures followed during the study, detailing the materials and methods utilized. Section 3 and Section 4 present the findings and their discussion, respectively. Finally, Section 5 delineates the conclusions drawn from the results.

2. Materials and Methods

Specific data, such as port operational criteria and annual performance metrics, will be detailed in this section. Additionally, the step-by-step methodologies employed for this analysis will be thoroughly explained. As previously mentioned, the primary objective of this research was to establish a ranking of container terminals in Latin America and the Caribbean (LAC); for this purpose, a description of the database is described below.

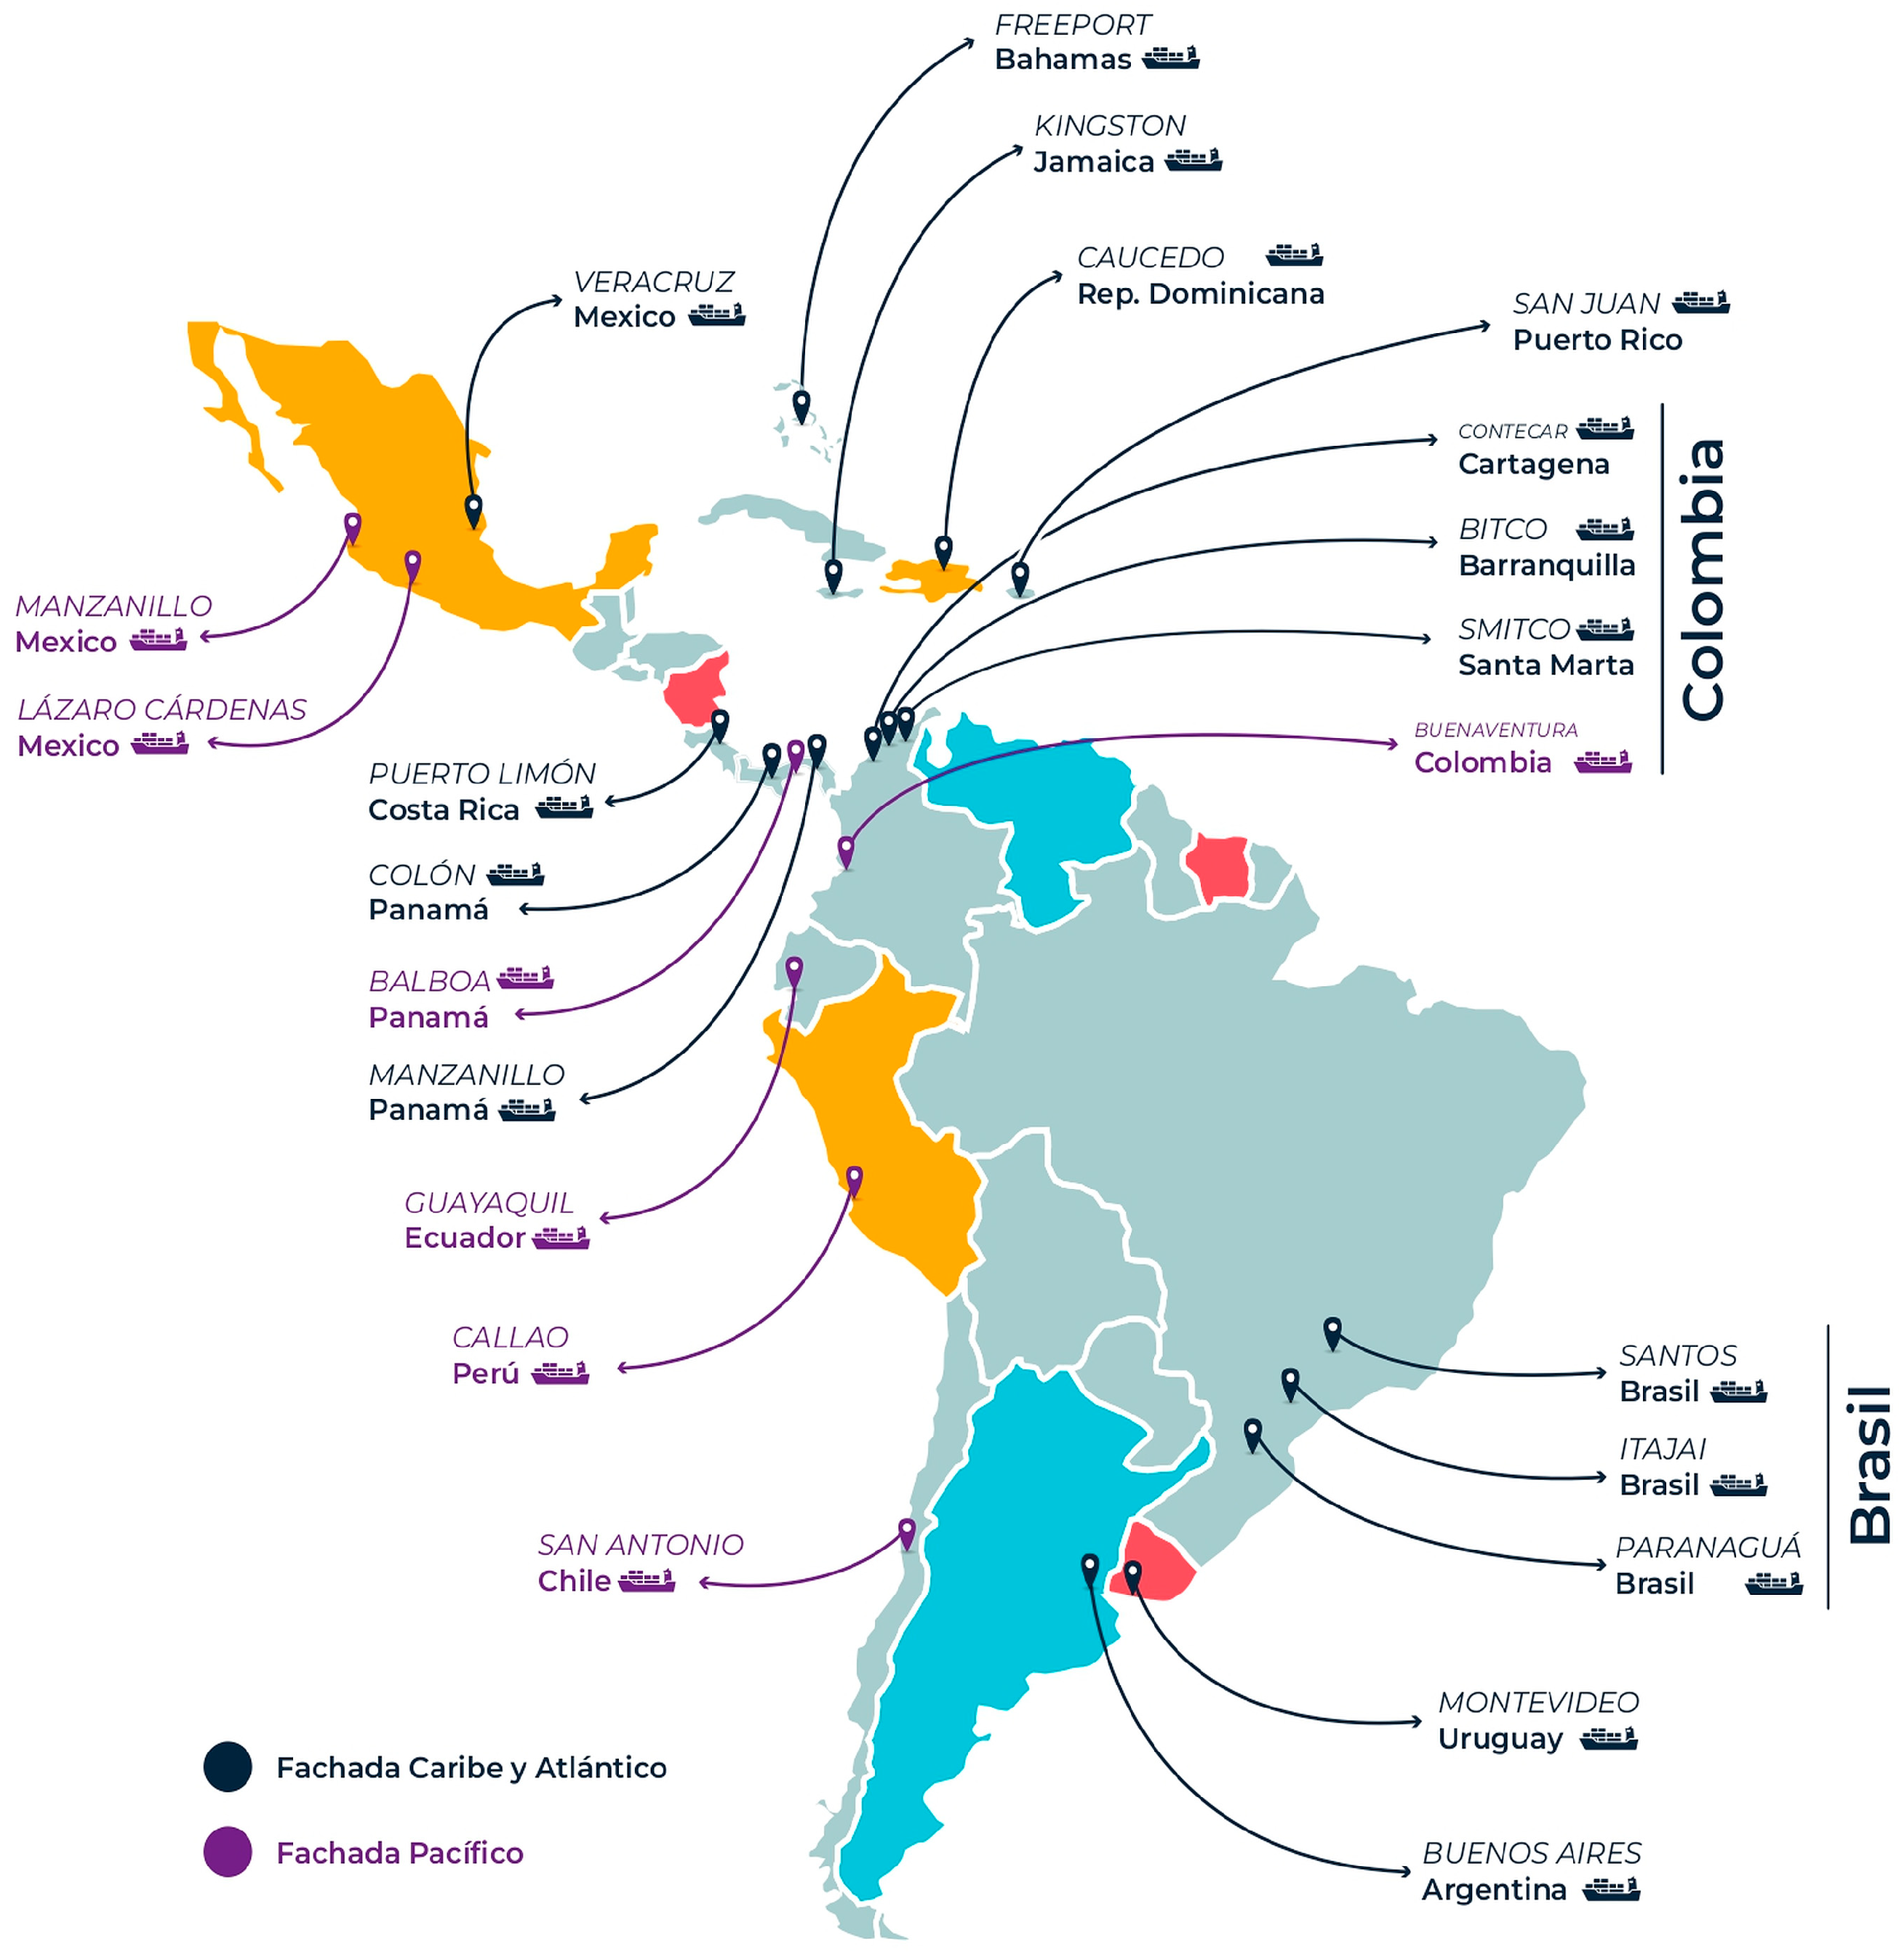
2.1. Data Description

The specific data used for this research were obtained from official documents and bulletins of the Economic Commission for Latin America (ECLAC), the World Bank (WB), and of the web pages of Port Authorities. These data encompass the main operational characteristics of a total of 23 ports in Latin America and the Caribbean and their container terminals (41 analyzed in Figure 1). The selection of terminals has been made on both the Pacific, Caribbean, and Atlantic sides, and in total, they add up to a volume of 46,145,468 TEUs by 2023, 85% of the traffic in the entire Latin American system and 5.6% of the world. The container throughput was selected as the research output due to the relevance of this indicator for the assessment of the container terminal around the world and its operational quality [18].
A selection of 23 ports has been made based on two important criteria. Firstly, the average total container traffic over the past ten years must exceed one million TEUs per year. Secondly, the port’s significance to the national economy was considered. Accordingly, seven ports from the Pacific coast and sixteen from the Caribbean and Atlantic coasts were chosen. The Pacific ports handle 35% of the total container volume in LAC.
Santa Marta and Barranquilla in Colombia are included (as a cluster), considering the interests of the researchers, as well as the port of Paranagua near the city of Curitiba, which has doubled its performance in just 10 years due to significant investment by its main operator, China Merchants Port Holdings (CM-Ports). The selection of ports and their geographical context can be seen in Figure 1.
The top 5 ports analyzed have remained consistent since 2018, with Panama benefiting the most. The top 10 has not changed significantly since 2014, primarily because the variable under study has been the volume of containers moved annually (TEUs/year), as shown in Table 3. However, a classification that considers other operational and logistical criteria is necessary for a comprehensive evaluation of the terminals. This is essential for making informed decisions regarding investments, operations, or the loading and unloading of goods. Additionally, it provides the opportunity to identify the operational advantages of many ports, enabling future optimization, specialization, or their use as hubs—seaports that serve as central points in a regional or global shipping network where cargo is transferred between different shipping routes or modes of transportation.
There is not much published regarding the history, investments, and logistical development of ports in LAC, except for those found in reports by The Economic Commission for Latin America (ECLAC) and the World Bank (WBG), which have advanced research and provided technical assistance in maritime activity and transportation in LAC. It is presumed from readings that the significant investments made by various Port Authorities, by major shipping lines and operators worldwide (such as Maersk, Hapag-Lloyd, Cosco, DP World Group, CP Ports, etc.), particularly in container terminals, are aimed at transforming them into major hubs in some cases, such as Lima, Colón, Cartagena, or Kingston.
Based on the data, a mixed reality can be observed, especially in short-term performance. Over 75% show a positive variation, with fifteen of these terminals experiencing double-digit growth, while at the other end, two ports also see double-digit declines, as depicted in Figure 2. In recent years, Lazaro Cárdenas, Freeport, and Paranagua have exhibited the best performances with changes exceeding 30% (coincidentally, one in the Pacific, one in the Caribbean, and the other in the Atlantic). Simultaneously, Cartagena, Kingston, and Montevideo have surpassed 20% growth. Buenaventura, Buenos Aires, and San Antonio have recorded poor results in terms of comparative growth, likely overshadowed by the performance of Callao and Guayaquil.
Operational and logistical criteria were used for this analysis. In total, there were 11: berth/quay length, quay draught, yard area, number of quay cranes (portainer), number of yard cranes (trastainer), reachstacker, multicranes, daily container movement capacity, number of station reefer container type, number of terminals, and distance to the Panama Canal. For the demand variables, only one was used (the TEUs moved between 2014 and 2023). Figure 3 displays box and whisker plots, illustrating the descriptive measures of each operational criterion used in this study. The objective is to identify outliers and compare their distributions.

2.2. Methodology

The methodology used in this study combines the classical relevance analysis technique with a multi-criteria decision model (MCDM) to evaluate port rankings. The assessment utilized selected variables by integrating the TOPSIS and PCA methods, marking a novel approach for container terminals. The primary objective is to establish a ranking of container terminals in LAC, employing the innovative application of the discrete multi-attribute decision making (distance-based) TOPSIS model in conjunction with PCA for evaluating these terminals.

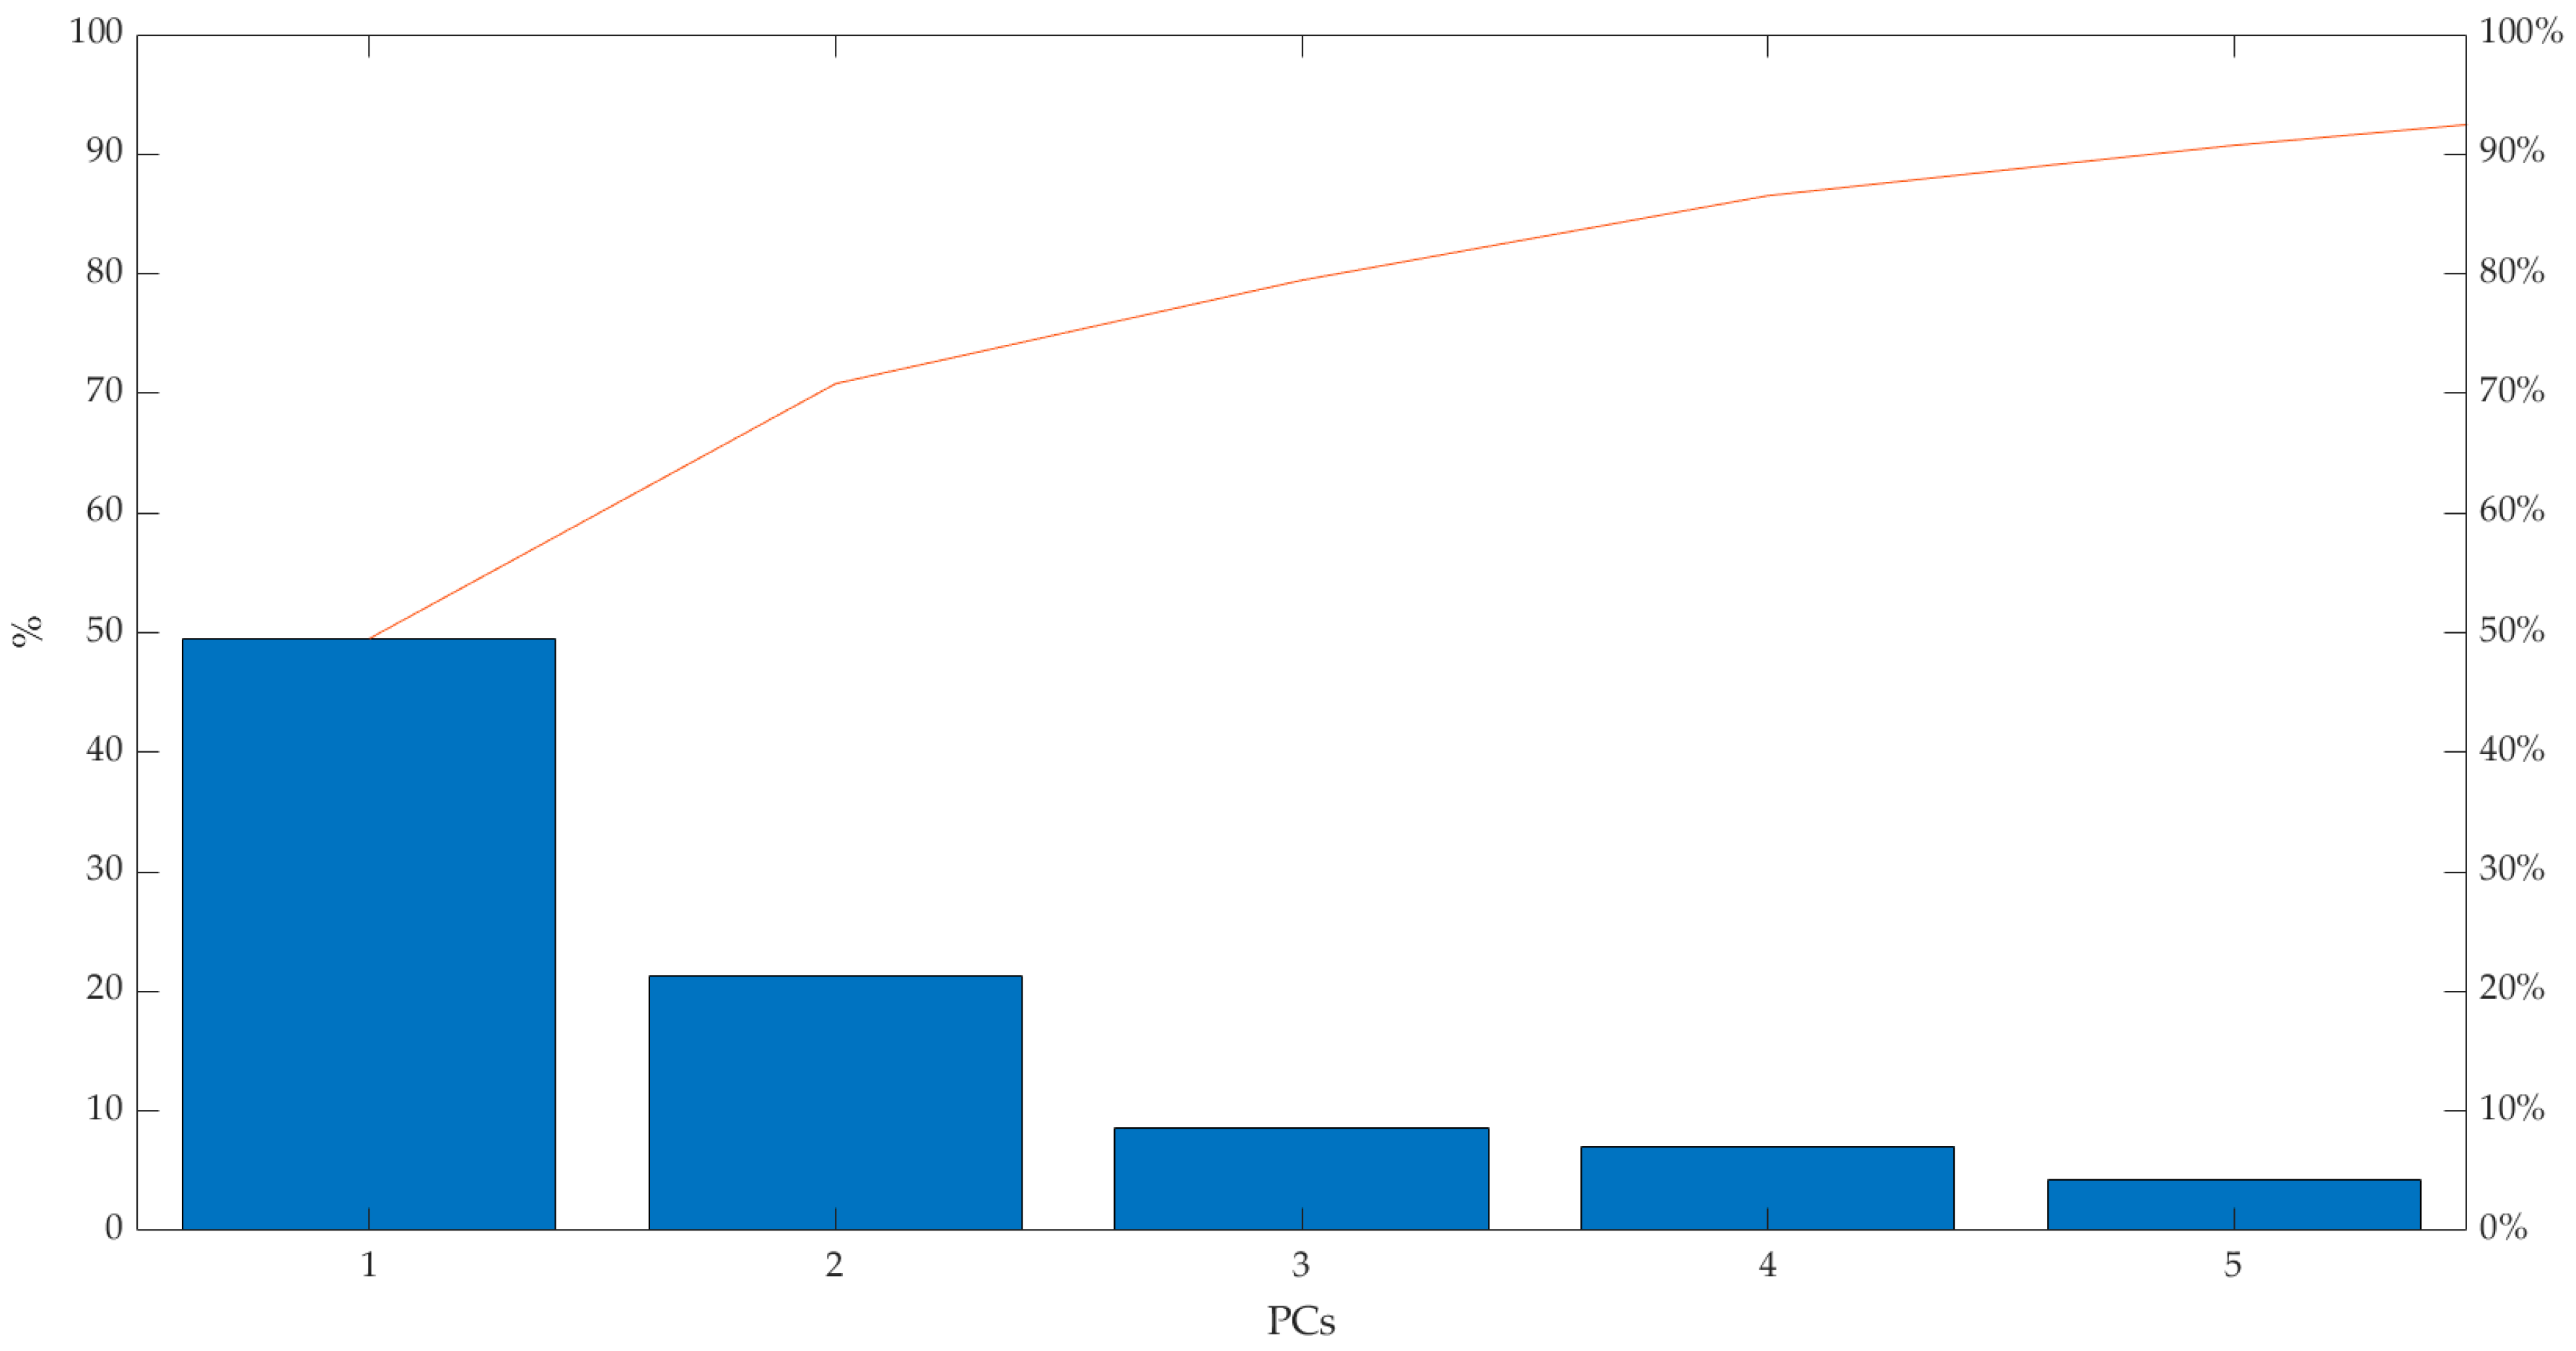
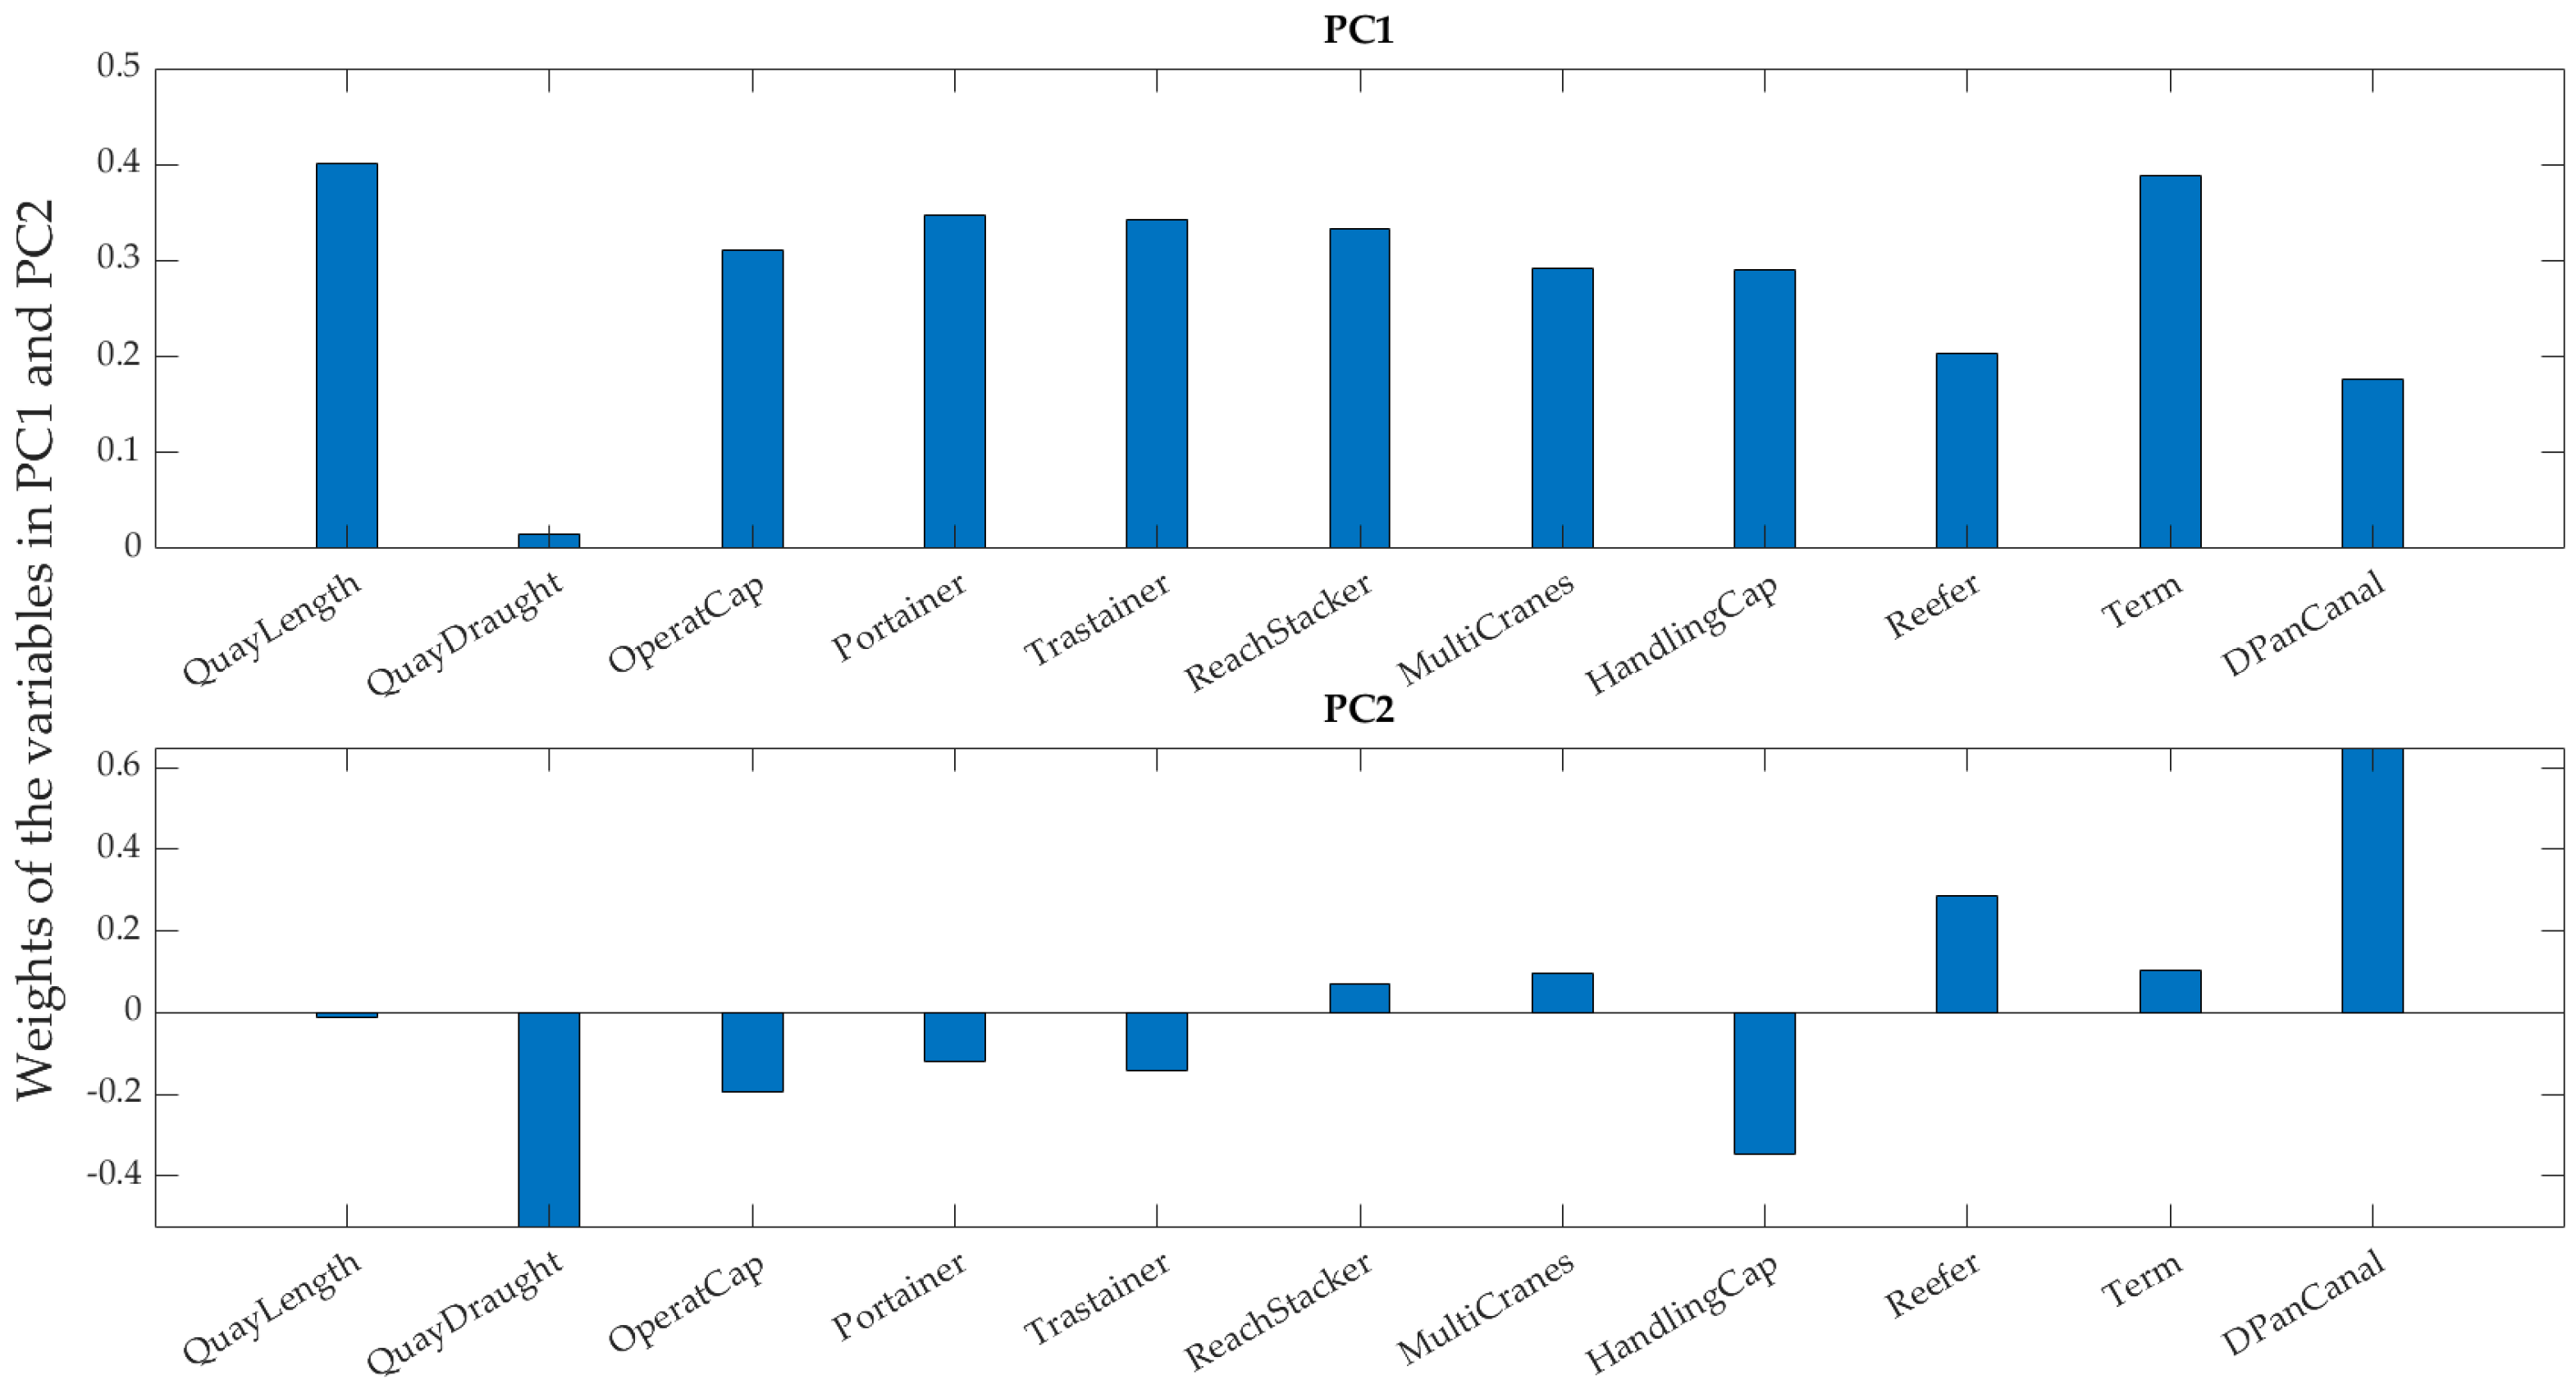
2.2.1. Principal Component Analysis (PCA)

Hotelling [24] and Jollife [25] developed PCA as a statistical method to reduce the dimensionality of a dataset. PCA projects the original dataset, x, from an M-dimensional space, into a new orthonormal N-dimensional space, resulting in the transformed data, y, which is a linear combination of the original data. In this transformation, the constants, aij, are the weights along the axes of the new space, known as principal components (PCs) (see Equation (1)). The principle behind PCA is to identify the principal components (PCs) as the directions in which the original data exhibit the most variation. These directions are the eigenvectors of the covariance matrix of the original data, x, corresponding to the largest eigenvalues. As a result, the PCs are ranked from those containing the most information to those containing the least. This enables a reduction in the original data to the PCs that account for a significant percentage of the variance. The weights of the variables in each PC indicate their relevance.
y j = i = 1 n x i · a i j
In this research, PCA was applied to the original dataset of 11 variables to gain a deep understanding of these variables and their impact on the resulting port rankings. The explained variance of the original data by each principal component (PC) and the weights of each variable in these PCs were used for this purpose. Validity of the relevance analysis was verified by applying TOPSIS to the dataset reduced to different dimensionalities.

2.2.2. Technique for Order of Preference by Similarity to Ideal Solution (TOPSIS)

The TOPSIS method was created by Hwang and Yoon in 1981 [26] and introduced in 1992 by Chen and Hwang [27]. It is one of the strongest techniques for solving multi-attribute decision making (MADM) within Discrete MCDM. The selected alternatives should have the shortest distance from the Positive Ideal Solution (PIS) and the longest distance from the Negative Ideal Solution (NIS) [28]. This method is quite useful when the decision making is faced with several qualitative and quantitative factors [29].
Among the relevant characteristics considered for the use of TOPSIS in this investigation, the following are noteworthy:
  • TOPSIS evaluates the relative closeness of each alternative to an ideal solution, making it straightforward to understand and implement [30].
  • TOPSIS is compensatory, meaning that poor performance in one criterion can be compensated by good performance in another, which is often more realistic in practical decision-making scenarios [31].
  • TOPSIS requires the normalization of criteria to ensure comparability. This step helps in handling criteria measured in different units and scales, allowing a fair comparison among alternatives [32].
  • Criteria weights can be assigned based on their importance, reflecting the decision-maker’s priorities. This flexibility allows customization of the decision-making process according to specific needs [32].
  • TOPSIS provides a clear ranking of alternatives, facilitating easy interpretation of results. The ranking helps decision-makers to understand the relative performance of each alternative quickly [33].
The primary advantage of the TOPSIS method is that it ranks X options based on N criteria, aligning with the objective of our research. The TOPSIS method can be succinctly explained through the following phases [34,35]:
  • Phase 1: Calculate the normalized performance ratings.
Vector normalization is applied to obtain normalized performance ratings from Matrix Xij, which represents the performance ratings for each alternative against each attribute. Standardizing the collected indicator data is essential.
Matrix Xij
X i j = X 11 X i j X 22 X i 1 X i j
Vector Yij
Y i j = X i j k = 1 i X 2 i j
  • Phase 2: Integrate weight with ratings.
A normalized vector Yij
Y i j = Y 11 Y i j Y 22 Y i 1 Y i j
The weighted and normalized vij, for the specific weights, will use the scores obtained through the PCA method, when the PCA method is used.
v i j = W j Y i j
The weighted and normalized decision Matrix Vij.
V i j = V 11 V i j V 22 V i 1 V i j
  • Stage 3: Find positive and negative ideal solutions.
Determine the positive values A* and A from the matrix Vij as per Equation (5).
A * = ( V 1 * , V 2 * .     V j * )
A = ( V 1 , V 2 .     V j )
  • Stage 4: Obtain the separation values.
The separation measure is the distance of each alternative rating from both the positive and negative ideal solutions, obtained by applying the Euclidean Distance Theory.
S i * = j = 1 j v i j v j * 2
and
S i = j = 1 j ( v i j v j ) 2
  • Stage 5: Calculate the overall preference score.
The ranking is obtained from the overall uniqueness score Vi for each alternative Ai.
V i = S i S i + S i *

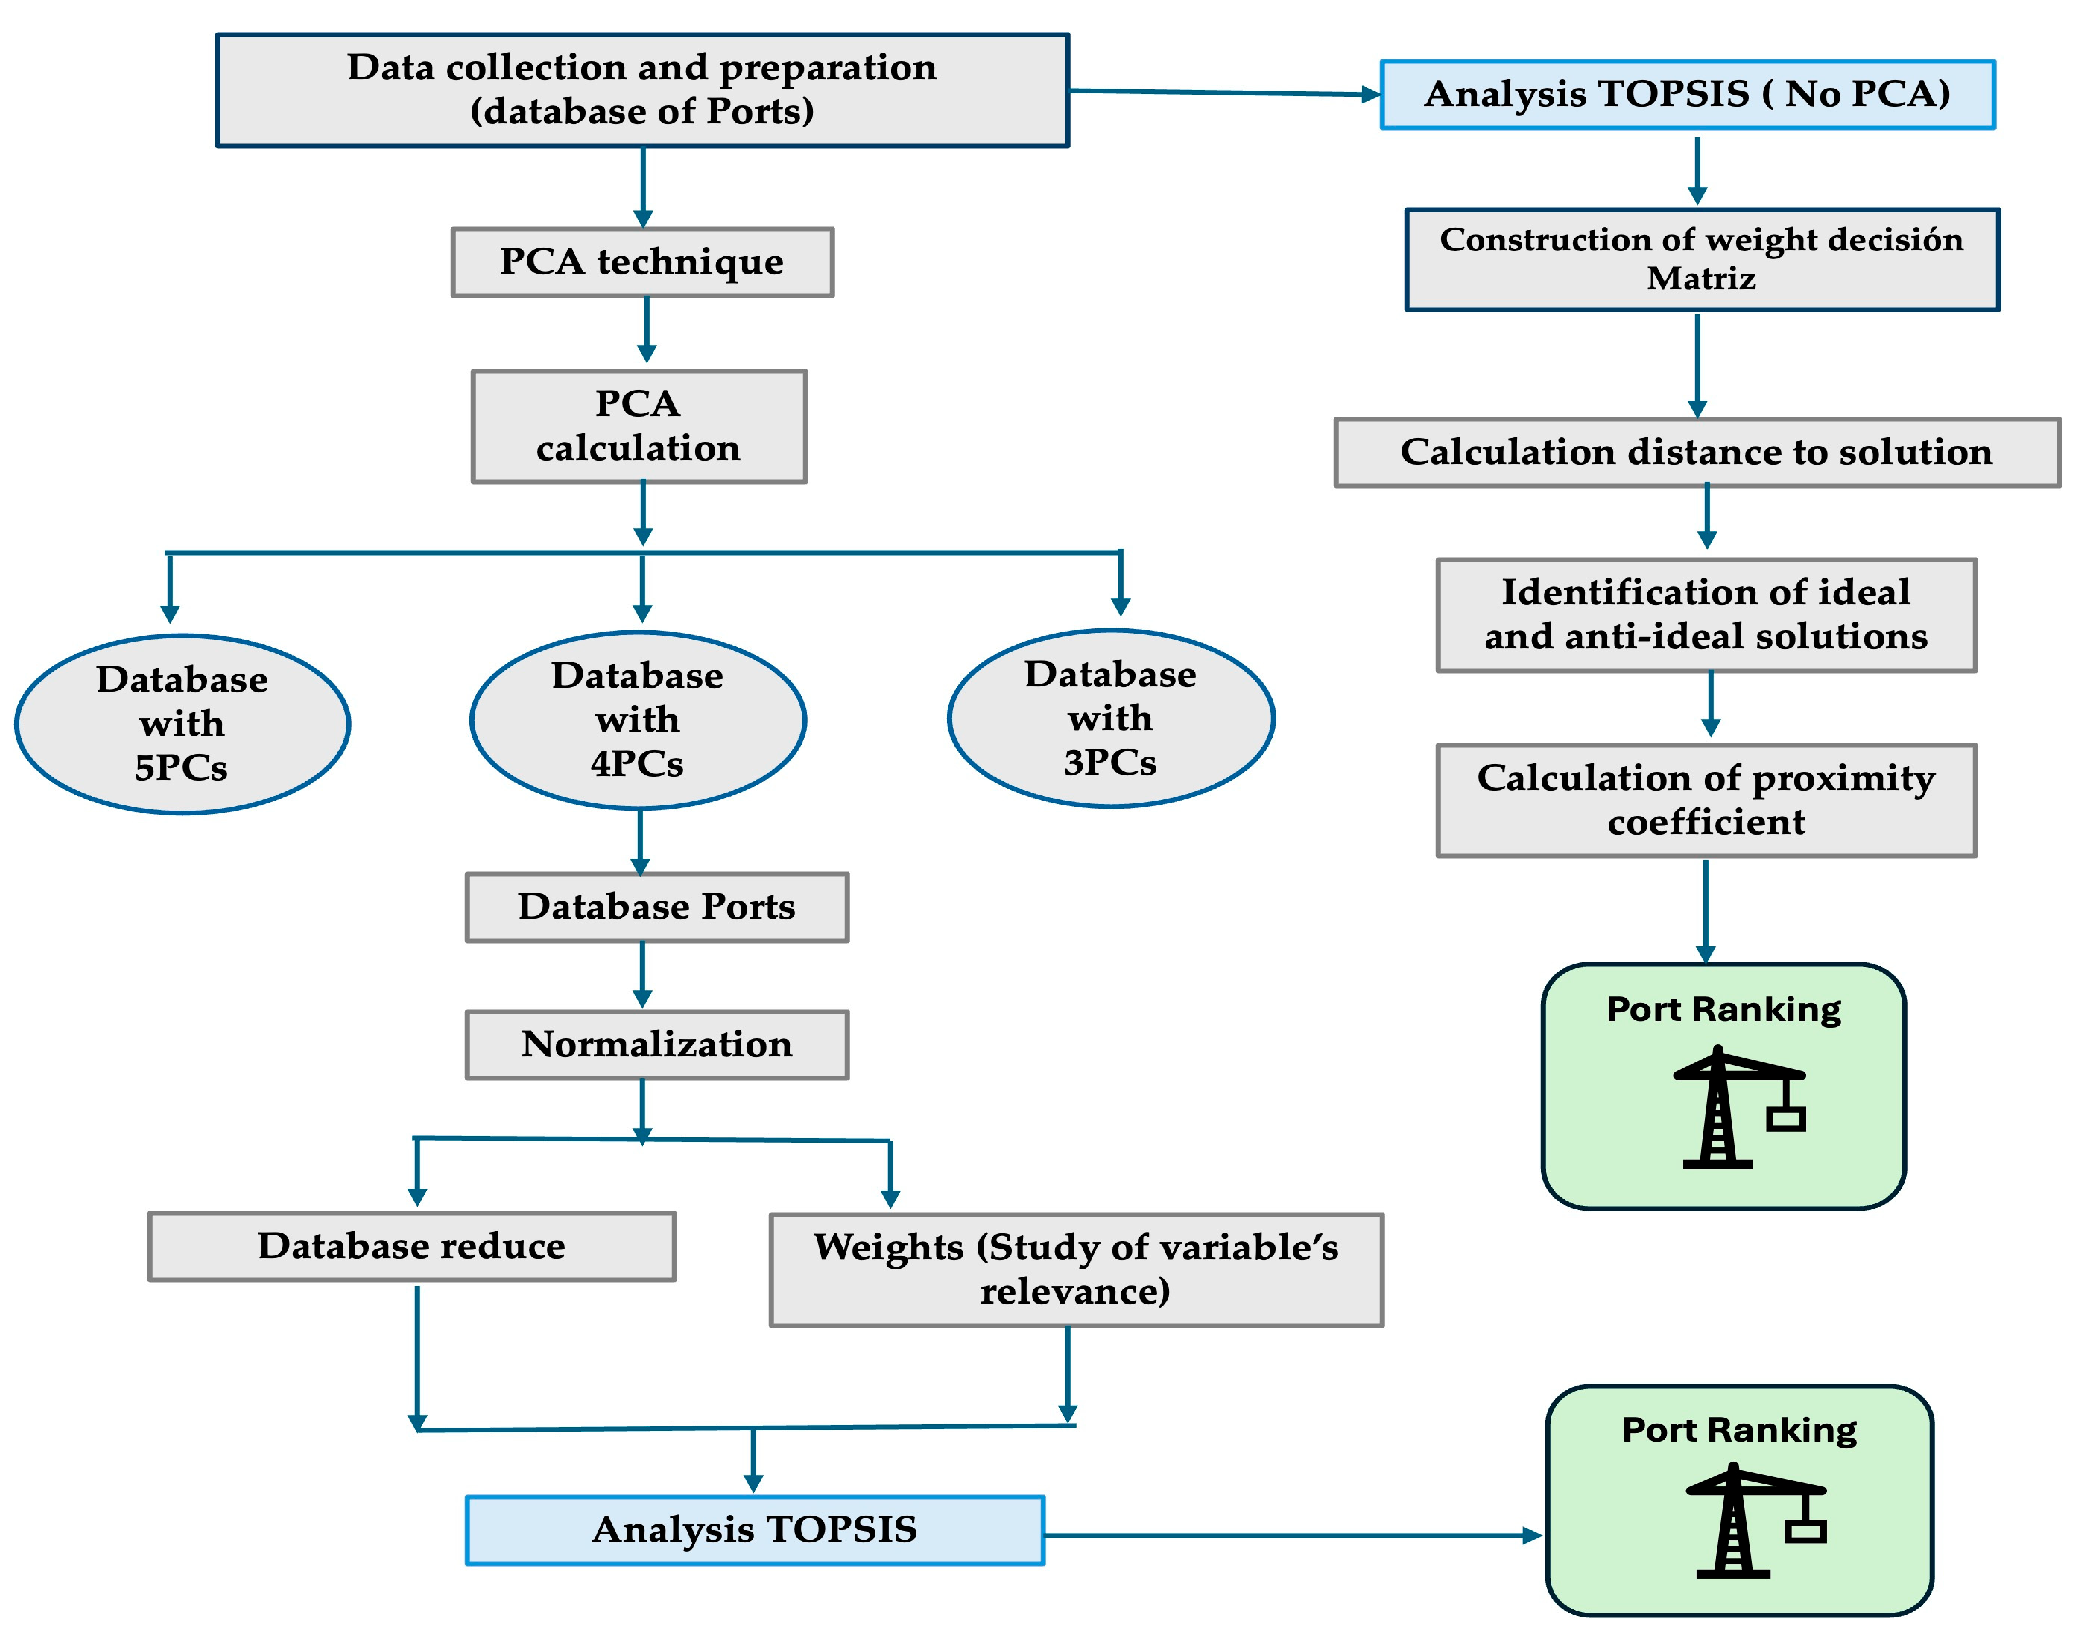
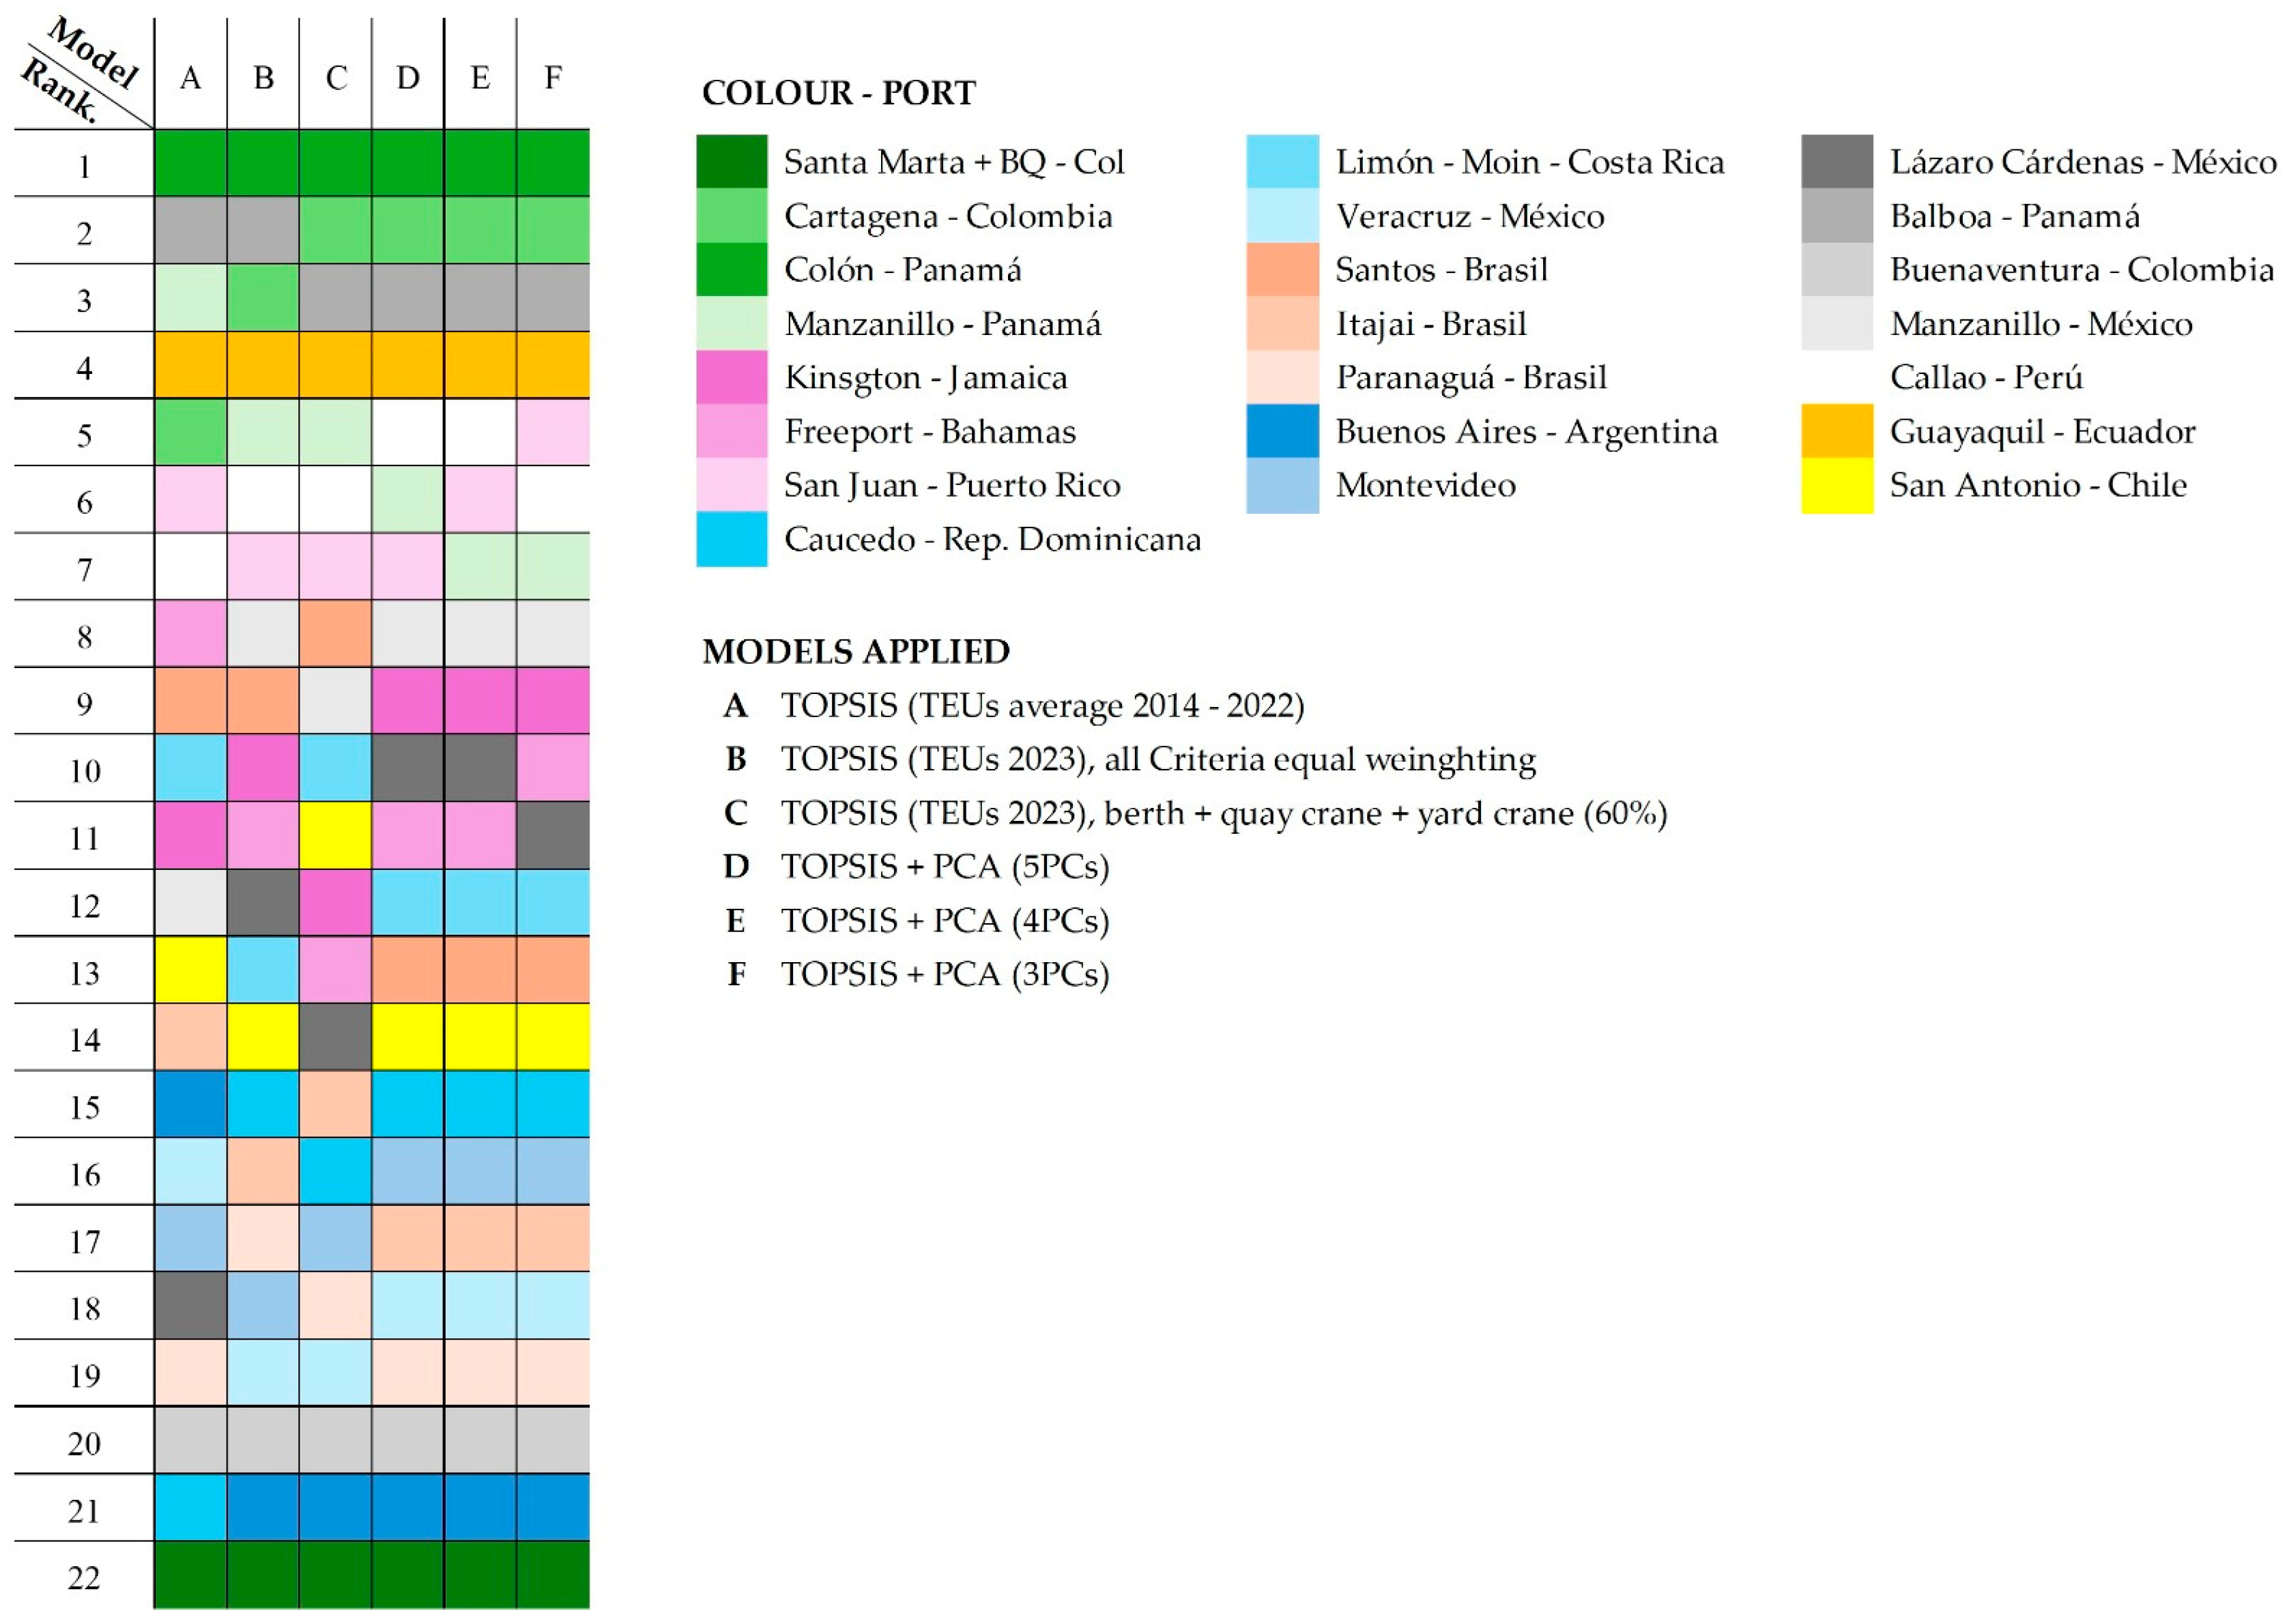
2.2.3. Experimental Procedure

To enhance readers’ understanding, a visual explanation in Figure 4 of the combined PCA and TOPSIS methodologies is provided. This approach leverages PCA’s capability to reduce dimensionality and extract key information, along with TOPSIS’s strength in evaluating and ranking alternatives based on multiple criteria. Together, these methodologies offer a robust tool for decision making in port terminal management and ranking many container terminals according to several criteria. Technical (computational) procedures, like MATLAB and Excel, were used for the calculations in the research and outcomes (results) were obtained.
The combined PCA and TOPSIS methodology involves several key steps. Initially, relevant data about selected ports are collected to create a comprehensive database. In the PCA application phase, the data are normalized to standardize the units of measurement, and Principal Component Analysis (PCA) is applied to reduce data dimensionality, thereby determining the weights of the criteria based on the principal components. Following this, the TOPSIS application phase begins with the construction of a weighted decision matrix by multiplying the normalized values by the determined weights. The best and worst possible values for each criterion, termed ideal and anti-ideal solutions, are identified. Subsequently, the distances of each port to these ideal and anti-ideal solutions are calculated, and the relative proximity coefficient of each port to the ideal solution is determined. Finally, the ports are ranked based on their proximity coefficients, with the highest coefficient indicating the most preferred port.
In summary, TOPSIS is distinguished by its simplicity, ease of use, intuitiveness, and effective handling of multiple criteria. It provides a clear and rational approach to ranking alternatives, combining straightforwardness with analytical rigor.

3. Results

After applying the previously described methodology, which features the innovative evaluation of container terminals using the combination of PCA and TOPSIS for port ranking, the most significant results are summarized below.
The percentages of variance in the original data explained by the PCs are shown in Figure 5. The first five PCs account for more than 90% of the original information, as indicated by the red line. Individually, the first PC explains nearly 50% of the original data, while the second PC explains 20%. The remaining three PCs each explain less than 10% of the variance.
Based on these results, the weights of the variables in the first two principal components (PCs) were plotted to gain a deeper understanding of the research problem (Figure 6). In the first principal component, all variables have similar weights except for quay draught, which is close to zero, and the distance to the Panama Canal and the number of reefers, which have values below 0.3. Conversely, in the second principal component, these three variables, along with TEU handling capacity, have the highest weights. Important and notable is that the relationship between quay draught and TEU handling capacity is inversely proportional.
Figure 7 presents the ports ranked according to the methodologies described in the same figure. Figure 7 (Models A, B, C) shows the results of the TOPSIS methodology. In the first two columns, all operational criteria (berth length, dock depth, yard area, number of quay cranes, number of yard cranes, daily container movement capacity, number of reefer container stations, number of terminals, and distance to the Panama Canal) have equal weighting. The first TOPSIS uses the average annual TEU performance from 2014 to 2022, while the second uses the 2023 data. The third column shows the results where the operational criteria of berth length, number of quay cranes, and number of yard cranes were each weighted at 20% (totaling 60%), with the remaining 40% distributed equally among the other operational criteria. The final three columns in Figure 7 (Models D, E, F) display the results of the innovative combination of PCA and TOPSIS (applied to LAC container terminals) using three weightings: 5PCs, 4PCs, and 3PCs. These represent the three most relevant variable reductions after performing the calculations, as explained in the PCA section. For this calculation, the 2023 annual performance data (throughput) were used as the variable.
A final test was conducted using TOPSIS to examine significant differences in the port rankings. This test was carried out without considering the annual TEU performance. Instead, only ten operational criteria (berth length, dock depth, yard area, number of quay cranes, number of yard cranes, daily container movement capacity, number of terminals, and distance to the Panama Canal) were used, each weighted at 10%. The results are presented in Table 4.

4. Discussion

In this section, we examine the implications of our findings from assessing the container terminal using PCA and the TOPSIS methodologies. We investigate how the integration of these analytical techniques contributes to a more nuanced understanding of terminal performance. This discussion aims to bridge the gap between theoretical analysis and real-world application, offering a comprehensive evaluation of the methodologies employed and their impact on enhancing operational efficiency and decision-making processes in container terminal management.
The results obtained from PCA (Figure 5 and Figure 6) show that the 11 selected variables have similar relevance in ranking the ports. Considering the weight values in the first and second PCs, which together explain over 70% of the original information, all variables have similar weights. Although in the first PC, which explains 50% of the variance, quay draught and the distance to the Panama Canal have the lowest weights, this is reversed in the second PC, which accounts for the remaining 20% of the original information. However, by definition of PCA, these variables influence the ranking less than those with high weights in the first PC.
The results presented in Table 4 and Figure 7 combined with the information provided in Figure 3 and Table A1 and Table A2 facilitates the understanding of certain situations that occur around some ports and their container traffic. It has been an interesting exercise to carry out a ranking from the point of view of the port’s operational capacity, considering all the evaluated criteria. Operational capacity can be similar to Terminal Efficiency, through other methodologies. The most important results will be established by the Port Authority:
Colón: The Panamanian port of Colón has been the most significant port in LAC for several years. This prominence is not only due to its annual TEU performance, which has exceeded four million TEUs since 2018, but also because it consistently ranks No. 1 in all evaluations, significantly ahead of second place. This success is attributed to a combination of technical criteria and the efficient use of resources relative to the output variables. However, its ranking drops when annual TEU performance is not considered, indicating that despite having fewer operational resources compared to ports such as Santos in Brazil, Colón effectively utilizes its resources to secure the top spot when TOPSIS combined with PCA methodologies is applied, taking these resources into account.
Santos: As Brazil’s main port and the second largest in LAC by annual TEU performance, Santos faces limitations in the rankings. This is due to its large operational criteria dimensions and relatively low TEU performance, similar to Colón. The best-ranking Santos achieved, No. 8, was obtained using TOPSIS without PCA and applying three operational criteria with a 60% weighting. This highlights that merely having the largest criteria dimensions is insufficient, indicating a potential underutilization of resources. Notably, Santos ranks first when only operational resources are considered, excluding annual performance. This is primarily because five terminals were studied for this port. The distance from the Panama Canal is irrelevant for Santos, as its Foreland is more logistically connected to Europe.
Balboa: The Panamanian Pacific port of Balboa consistently ranks in the top 3 in the LAC under both applied methodologies. Similar to Colón, its proximity to the Panama Canal, a crucial route for international maritime traffic, significantly influenced the weighting of its criteria.
Manzanillo, Panama: Its ranking drops out of the top 5 when TOPSIS is combined with PCA. However, its annual TEU performance keeps it among the top contenders. The combination of its primary operational criteria and proximity to the Panama Canal make its container terminal notable.
Cartagena: Colombia’s primary container port has improved its ranking, now occupying the second position according to the applied methodologies. Undoubtedly, it is the Caribbean’s best-utilized port in terms of operational criteria, as indicated by the various weighting combinations studied.
Callao and Guayaquil: These two Pacific ports, close in both distance and annual performance, have improved their rankings, positioning in the top 5 when TOPSIS is combined with PCA. These container terminals, which have moved over two million TEUs annually for the past six years, have proportional dimensions. However, Guayaquil has a better combination of operational criteria.
In the Caribbean, the best-ranked ports are San Juan and Kingston. However, San Juan ranks higher when considering its operational criteria compared to Kingston, which, despite sometimes having double the dimensions relative to the Jamaican port (as seen in Table A1 and Table A2), does not double its TEU movements, thus being better dimensioned in its operational resources.
The Brazilian ports of Itajai and Paranagua have very similar operational criteria dimensions and annual TEU performance. This similarity is reflected in their rankings, which have been close in all methodologies applied. However, the Port of Itajai ranks higher than the other port, despite having fewer resources in the considered criteria. This is attributed to greater efficiency in its utilization, as confirmed by Table A2.
The Mexican ports of Manzanillo and Lazaro Cardenas, despite being in the top 10, require special attention given their low overall rankings in LAC. Despite having the United States as a primary trading partner and a Foreland connection to China, Veracruz has shown growth over the past ten years, but like all Caribbean ports, it has not consistently secured a stable top 10 position.
Other ports, such as San Antonio, Montevideo, and Buenos Aires, which are the most important terminals in their respective countries (Chile, Uruguay, and Argentina), have consistently ranked in the lower half under the applied methodologies.
Santa Marta and Barranquilla: Despite being analyzed as a cluster to improve input data, these ports always ranked last in all calculations and combinations. This is due to their inherent physical and logistical characteristics—Barranquilla lacks portainer cranes and faces access difficulties to its container terminal, while Santa Marta has minimal container handling capabilities and the lowest primary operational conditions, including berth length and cranes.
In Figure 3, it is evident that certain factors, such as draft depth, appear to be irrelevant because all values are centralized and do not significantly impact the ranking of terminals, as they all have similar draft depths. The same holds true for the distance to the Panama Canal, multi-cranes, and reefers, where the majority of ports have values situated in the third quartile. However, certain variables are deemed highly relevant, such as berth length and the number of quay and yard cranes, which were explicitly considered in the TOPSIS calculations and assigned greater weights, as indicated by the results.
The Port of Santos, with several terminals evaluated collectively, exhibits outlier behavior in almost all criteria owing to the aggregation of data, resulting in an over-dimensionality of the port. It would be worthwhile to separately evaluate each terminal of the Port of Santos.

5. Conclusions

The primary objective of this research was to employ a novel methodology to establish a coherent ranking of ports in Latin America and the Caribbean, particularly focusing on their container terminals to categorize each port in the Spanish-speaking continent and Brazil. The innovation lay in combining Principal Component Analysis (PCA) with the Technique for Order Preference by Similarity to Ideal Solution (TOPSIS). PCA was used to assign the respective weights for the TOPSIS calculations. These methodologies based their calculations on the annual performance from 2014 to 2022 and 2023 and the operational criteria described throughout this article.
The principal finding, despite the purely technical results, offers a close approximation of the behavior of the main container terminals in LAC. The results, although technical and operational, reflect the reality of the LAC port system. However, future research should incorporate additional non-technical variables that influence terminal performance, such as operational efficiency (considering all factors and operational and logistical criteria), environmental and economic criteria, and, given the current circumstances, factors related to digital transformation in port activities.
It is crucial to consider the intentions of investors, as the ports that ranked highest using the TOPSIS and PCA-TOPSIS methodologies are the main HUB terminals in LAC. Variables should also account for different types of activities, whether export or import and the specific products of interest.
Not all operational criteria need to be evaluated; some only add value, such as Reefer container stations, mobile cranes, or even the distance to the Panama Canal. Considering the complications in 2024 and the droughts in Panama, other routes might be more advantageous for southern ports.
Understanding the Foreland of each port is essential to coherently establish its importance. For instance, a port that primarily serves the United States and is affected by the Panama Canal may rank differently compared to a Brazilian port serving Europe.
Future studies should include other factors, such as economic and environmental considerations or port governance in each country, and pure performance calculations using different methodologies for comparative purposes. It is indeed crucial to consider whether, in addition to the quantitative criteria used in this study, other aspects such as logistics frameworks, governance systems, and various contextual factors might significantly impact the performance of container terminals in Latin America and the Caribbean (LAC). It is evident that a more comprehensive assessment must incorporate qualitative dimensions to provide a holistic view of port efficiency. Additionally, other weighting models should be explored. Although the methodology applied in this research is novel for container terminals (particularly in LAC), it aligns closely with the annual rankings of supranational authorities like ECLAC, the WBG, and UNCTAD.
In conclusion, this research was focused on three fundamental aspects. Firstly, it aimed to review the fundamental operational criteria for a container terminal and the multicriteria analysis methods to analyze them. Secondly, it emphasizes the importance of merging PCA with the TOPSIS Technique to evaluate port operations effectively and establish a ranking consistent with the reality of ports. Thirdly, the results not only demonstrate the effectiveness of this combined approach but also advocate for its broader implementation across diverse port activities, showcasing its versatility and potential for enhancing operational decision making in the maritime industry.

Author Contributions

Conceptualization, A.P.-N. and I.J.T.D.; data curation, M.G.C.-G., I.J.T.D. and A.P.-N.; formal analysis, A.P.-N., M.G.C.-G. and I.J.T.D.; funding acquisition, I.J.T.D.; investigation, M.G.C.-G. and M.I.R.-G.; methodology, A.P.-N., M.G.C.-G., M.I.R.-G. and I.J.T.D.; project administration, J.J.R.-A. and I.J.T.D.; software, M.G.C.-G. and I.J.T.D.; resources M.G.C.-G., M.I.R.-G. and I.J.T.D.; supervision J.J.R.-A. and I.J.T.D.; validation, A.P.-N. and M.G.C.-G.; visualization, M.G.C.-G.; writing—original draft, A.P.-N., M.G.C.-G. and I.J.T.D.; writing—review and editing, A.P.-N., M.G.C.-G., J.J.R.-A., M.C.-J. and I.J.T.D. All authors have read and agreed to the published version of the manuscript.

Funding

This research received no external funding.

Institutional Review Board Statement

Not applicable.

Informed Consent Statement

Not applicable.

Data Availability Statement

The raw data supporting the conclusions of this article will be made available by the authors on request.

Conflicts of Interest

The authors do not have a relevant conflict of interest to declare regarding the content of this article.

Appendix A

This appendix displays the annual performance in TEUs of each port selected for the study over the past ten years (2014–2023).
Table A1. Throughtput (TEUS/year).
Port2014201520162017201820192020202120222023
Santa Marta (SMITCO)71,219120,468120,543120,000104,521124,439129,29462,77377,09382,570
Barranquilla (BITCO)92,346136,624137,683125,943160,104160,892146,563172,655187,534163,154
Santa Marta + Barranquilla-Col163,565257,092258,226245,943264,625285,331275,857235,428264,627245,724
Cartagena-Colombia2,037,0002,135,5082,245,5882,094,5392,406,3392,932,0003,127,0003,344,0003,145,4493,299,000
Colón-Panamá3,286,3003,577,4773,258,3813,891,2094,324,4784,379,4774,454,9024,915,9805,102,6004,869,000
Manzanillo-Panamá2,100,0002,120,0002,145,6002,150,0042,225,0482,543,3392,663,4352,814,0152,744,0142,622,300
Kinsgton-Jamaica1,638,1131,653,2721,567,4421,560,0001,833,0531,647,6091,611,6371,975,4002,137,5002,329,875
Freeport-Bahamas1,400,5001,400,5601,200,000850,4261,050,1401,396,6001,231,7031,642,7901,574,2001,605,000
San Juan-Puerto Rico1,319,9611,210,0001,110,0001,199,1571,405,3481,404,6021,490,2181,438,7401,398,6001,510,488
Caucedo-Rep, Dominicana831,375826,935918,5421,149,0791,314,7981,263,991950,2191,265,4591,406,5001,476,825
Puerto Limón-Costa Rica1,089,5001,134,2821,177,3851,199,6201,187,7601,247,0001,213,0001,319,0001,321,0001,366,000
Veracruz-México847,370937,139965,2541,117,3041,176,2531,144,0001,006,0001,165,0001,187,0001,148,000
Santos-Brasil3,569,8703,265,4103,393,5933,578,1923,836,4874,165,0004,232,0004,442,8804,451,0004,284,000
Itajai-Brasil971,358963,565926,926999,2771,045,8131,235,0001,273,0001,610,0001,493,0001,268,000
Paranaguá-Brasil757,320782,346635,536752,250765,785865,000925,0001,044,0001,114,0001,186,000
Buenos Aires-Argentina1,428,8431,433,0531,352,0681,468,9601,797,9551,485,3281,371,9801,446,4501,508,6471,279,000
Montevideo776,554811,297951,050939,427797,874750,000765,000978,0001,085,0001,125,000
Lázaro Cárdenas-México996,6541,014,0471,115,4521,314,7981,149,0791,319,0001,064,0001,686,0002,027,0001,869,000
Balboa-Panamá3,468,2833,294,1132,989,8692,678,0052,862,7672,898,9773,161,6583,563,4303,348,9003,370,000
Buenaventura-Colombia855,400911,533865,749920,0001,369,1401,453,0001,018,8401,082,7461,211,0001,061,256
Manzanillo-México2,355,1502,541,1402,580,9002,830,3703,078,5133,069,1852,910,0003,371,4383,474,0003,699,000
Callao-Perú1,992,4731,900,4442,054,9702,250,2242,340,6572,313,9072,250,8272,486,4302,461,0002,703,000
Guayaquil-Ecuador1,621,3811,764,9371,821,6541,871,5912,064,2812,074,0002,071,1242,163,1502,170,0002,254,000
San Antonio-Chile1,093,6251,170,1841,287,6581,296,8901,660,8321,709,6421,556,7081,840,4601,683,0001,575,000

Appendix B

This appendix details the primary operational characteristics (criteria data) of the ports selected for the study.
Table A2. Criteria Data.
PortBerth
(mt)
Draft (mt)Yard
(m2)
Quay
Crane
Yard
Crane
ReachstackerMulticranesTEUs/Day
Capacity
Reefer
Stations
No. TerminalsDistance to Panamá Canal (kms)
Santa Marta (SMITCO)3251587,0002460144013001790
Barranquilla (BITCO)70011120,0000317228801811720
Santa Marta + Barranquilla-Col105014207,00027232150018002755
Cartagena-Colombia167016580,000197018012,00016402570
Colón-Panamá250015740,00013301709360103210
Manzanillo-Panamá130014520,000213070010,900150010
Kinsgton-Jamaica240015800,000187427695001721920
Freeport-Bahamas150016570,000103500720075012250
San Juan-Puerto Rico85013400,00044150250028011875
Caucedo-Rep, Dominicana100014,5800,0001032113750065411570
Puerto Limón-Moin-Costa Rica65014.5400,00062950350038001470
Veracruz-México75015420,000715185950052012650
Santos-Brasil4000141,400,00047136901016,800614258160
Itajai-Brasil90014400,0006186112,250243018620
Paranaguá-Brasil100013420,000822214500450018430
Buenos Aires-Argentina480014650,00022626153800280049800
Montevideo65014350,000728204500250019660
Lázaro Cárdenas-México165016760,0001428120550065022890
Balboa-Panamá1710151,000,00025835015,500218420
Buenaventura-Colombia120014360,000133683150,00013201650
Manzanillo-México465014.51,140,000349458416,300200043100
Callao-Perú160015570,00013392244500210022490
Guayaquil-Ecuador100013140,000623163350025021450
San Antonio-Chile105015300,0008103107500232824950

References

  1. Cullinane, K.; Fei, W.T.; Cullinane, S. Container terminal development in mainland China and its impact on the competitiveness of the port of Hong Kong. Transp. Rev. 2004, 24, 33–56. [Google Scholar] [CrossRef]
  2. Kaliszewski, A.; Kozłowski, A.; Dąbrowski, J.; Klimek, H. Key factors of container port competitiveness: A global shipping lines perspective. Mar. Policy 2020, 117, 103896. [Google Scholar] [CrossRef]
  3. Campos, R.; Timini, J. Los vínculos comerciales de América Latina y el Caribe ante los riesgos de fragmentación geopolítica global. Boletín Económico/Banco De España 2023, 13, 2–6. [Google Scholar] [CrossRef] [PubMed]
  4. Miller, K.; Hyodo, T. Assessment of port efficiency within Latin America. J. Shipp. Trade 2022, 7, 4. [Google Scholar] [CrossRef]
  5. Gervasi, O.; Murgante, B.; Misra, S.; Rocha, A.M.A.C.; Garau, C. (Eds.) Computational Science and Its Applications—ICCSA 2022 Workshops. In Lecture Notes in Computer Science; Springer International Publishing: Cham, Switzerland, 2022; Volume 13381. [Google Scholar] [CrossRef]
  6. Yannis, G.; Kopsacheili, A.; Dragomanovits, A.; Petraki, V. State-of-the-art review on multi-criteria decision-making in the transport sector. J. Traffic Transp. Eng. (Engl. Ed.) 2020, 7, 413–431. [Google Scholar] [CrossRef]
  7. Vega, L.; Cantillo, V.; Arellana, J. Assessing the impact of major infrastructure projects on port choice decision: The Colombian case. Transp. Res. Part A Policy Pract. 2019, 120, 132–148. [Google Scholar] [CrossRef]
  8. Chang, Y.-T.; Talley, W.K. Port Competitiveness, Efficiency, and Supply Chains: A Literature Review. Transp. J. 2019, 58, 1–20. [Google Scholar] [CrossRef]
  9. Ližbetin, J.; Stopka, O. Application of specific mathematical methods in the context of revitalization of defunct intermodal transport terminal: A case study. Sustainability 2020, 12, 2295. [Google Scholar] [CrossRef]
  10. Kudlac, S.; Gasparik, J.; Dedik, M.; Kurenkov, P.V. Identification of Restricting Criteria for Comprehensive Assessment of Logistics Chains in Intermodal Transport. LOGI—Sci. J. Transp. Logist. 2018, 9, 18–27. [Google Scholar] [CrossRef]
  11. Čarný, Š.; Šperka, A.; Zitrický, V. Multi-criteria evaluation of railway transport using evaluation method. LOGI—Sci. J. Transp. Logist. 2020, 11, 88–99. [Google Scholar] [CrossRef]
  12. Golnar, M.; Beškovnik, B. A Multi-Criteria Approach for Evaluating a Sustainable Intermodal Transport Chain Affected by the COVID-19 Pandemic. J. Mar. Sci. Eng. 2022, 10, 1644. [Google Scholar] [CrossRef]
  13. Barysienė, J. A Multi-criteria evaluation of container terminal technologies applying the COPRAS-G method. Transport 2012, 27, 364–372. [Google Scholar] [CrossRef]
  14. Luo, M.; Chen, F.; Zhang, J. Relationships among port competition, cooperation and competitiveness: A literature review. Transp. Policy 2022, 118, 1–9. [Google Scholar] [CrossRef]
  15. Parola, F.; Risitano, M.; Ferretti, M.; Panetti, E. The drivers of port competitiveness: A critical review. Transp. Rev. 2017, 37, 116–138. [Google Scholar] [CrossRef]
  16. Serebrisky, T.; Sarriera, J.M.; Suárez-Alemán, A.; Araya, G.; Briceño-Garmendía, C.; Schwartz, J. Exploring the drivers of port efficiency in Latin America and the Caribbean. Transp. Policy 2016, 45, 31–45. [Google Scholar] [CrossRef]
  17. Ilyas, M.; Jin, Z.; Ullah, I. Optimizing Logistics and Transportation Locations in the China–Pakistan Economic Corridor: A Strategic Risk Assessment. Appl. Sci. 2024, 14, 1738. [Google Scholar] [CrossRef]
  18. da Costa, D.S.; Carvalho, M.V.G.S.d.A.; de Figueiredo, N.M.; de Moraes, H.B.; Ferreira, R.C.B. The efficiency of container terminals in the northern region of Brazil. Util. Policy 2021, 72, 101278. [Google Scholar] [CrossRef]
  19. Lirn, T.C.; A Thanopoulou, H.; Beynon, M.J.; Beresford, A.K.C. An application of AHP on transhipment port selection: A global perspective. Marit. Econ. Logist. 2004, 6, 70–91. [Google Scholar] [CrossRef]
  20. Ghazinoory, S.; Mansour, S.; Sadeghian, A. A hybrid Fuzzy AHP-TOPSIS approach for assessing the sustainability of industrial parks. Environ. Model. Softw. 2009, 24, 730–735. [Google Scholar] [CrossRef]
  21. Wang, T.-C.; Lee, H.-D. Developing a fuzzy TOPSIS approach based on subjective weights and objective weights. Expert Syst. Appl. 2009, 36, 8980–8985. [Google Scholar] [CrossRef]
  22. Cullinane, K.P.; Wang, T.F. The efficiency of European container ports: A cross-sectional data envelopment analysis. Int. J. Logist. Res. Appl. 2006, 9, 19–31. [Google Scholar] [CrossRef]
  23. Kabak, M.; Burmaoglu, S.; Kazancoglu, Y. A fuzzy hybrid MCDM approach for professional selection. Expert Syst. Appl. 2012, 39, 3516–3525. [Google Scholar] [CrossRef]
  24. Hotelling, H. Analysis of a complex of statistical variables into principal components. J. Educ. Psychol. 1933, 24, 498–520. [Google Scholar] [CrossRef]
  25. Jolliffe, I.T. Principal Component Analysis; Springer: Berlin/Heidelberg, Germany, 1986. [Google Scholar]
  26. Behzadian, M.; Otaghsara, S.K.; Yazdani, M.; Ignatius, J. A state-of the-art survey of TOPSIS applications. Expert Syst. Appl. 2012, 39, 13051–13069. [Google Scholar] [CrossRef]
  27. Król, R.; Więckowski, J.; Wątróbski, J. Accuracy of the TOPSIS Method with Different Input Data. Procedia Comput. Sci. 2022, 207, 4574–4583. [Google Scholar] [CrossRef]
  28. Kim, A.R. A Study on Competitiveness Analysis of Ports in Korea and China by Entropy Weight TOPSIS. Asian J. Shipp. Logist. 2016, 32, 187–194. [Google Scholar] [CrossRef]
  29. Sayareh, J.; Iranshahi, S.; Golfakhrabadi, N. Service Quality Evaluation and Ranking of Container terminal Operators. Asian J. Shipp. Logist. 2016, 32, 203–212. [Google Scholar] [CrossRef]
  30. Liu, Z.; Jiang, Z.; Xu, C.; Cai, G.; Zhan, J. Assessment of provincial waterlogging risk based on entropy weight TOPSIS–PCA method. Nat. Hazards 2021, 108, 1545–1567. [Google Scholar] [CrossRef]
  31. Sonawane, S.A.; Wangikar, S.S. Multi-superiority response optimization of WEDM for titanium grade-5 using PCA based TOPSIS theory. Mater. Today Proc. 2022, 62, 841–847. [Google Scholar] [CrossRef]
  32. Li, Y.; Wu, L.; Han, Q.; Wang, X.; Zou, T.; Fan, C. Estimation of remote sensing based ecological index along the Grand Canal based on PCA-AHP-TOPSIS methodology. Ecol. Indic. 2021, 122, 107214. [Google Scholar] [CrossRef]
  33. Wang, Y.; Yeo, G.-T.; Ng, A.K. Choosing optimal bunkering ports for liner shipping companies: A hybrid Fuzzy-Delphi–TOPSIS approach. Transp. Policy 2014, 35, 358–365. [Google Scholar] [CrossRef]
  34. Chakraborty, S. TOPSIS and Modified TOPSIS: A comparative analysis. Decis. Anal. J. 2022, 2, 100021. [Google Scholar] [CrossRef]
  35. Wang, T.; Wang, D.; Zeng, Z. Research on the Construction and Measurement of Digital Governance Level System of County Rural Areas in China—Empirical Analysis Based on Entropy Weight TOPSIS Model. Sustainability 2024, 16, 4374. [Google Scholar] [CrossRef]
Figure 1. Geographical reference of the selected ports in LAC.
Applsci 14 06174 g001
Figure 2. Performance variation (TEUs/year) between 2018–2023.
Applsci 14 06174 g002
Figure 3. Box and whisker plot of the operational criteria.
Applsci 14 06174 g003
Figure 4. Combined PCA and TOPSIS methodology.
Applsci 14 06174 g004
Figure 5. Explained variance of the original data. The bars represent the individual percentage of explained variance of each principal component. The red line represents the accumulative percentage of explained variance.
Applsci 14 06174 g005
Figure 6. The first and second principal components.
Applsci 14 06174 g006
Figure 7. Ranking of ports using the TOPSIS and PCA-TOPSIS models applied.
Applsci 14 06174 g007
Table 1. Percentage comparison of container movements of the studied ports relative to other movements for the year 2022.
LAC
Studied Ports
World *Europe UnionChinaLAC
Entire Port System
USA
46,572,664840,635,534102,751,696262,605,70058,669,47860,554,285
5.13%41.9%16.41% 71.3%
* The data were obtained from World Bank, ECLAC newsletter, and bulletins.
Table 2. Methodologies and criteria most used for the analysis and ranking of port terminals in recent years.
YearGeographical ZoneMethodologyCriteriaReview’s Papers
1990–2000North American,
Asia
Surveys,
Univariate and multivariate analysis
Number of sailings,
Freight rates, User satisfaction,
Loading and unloading Facilities,
Equipment available,
Port congestion,
Special handling ability
[14]
2001–2010Asia,
Europe
Discrete Choice Model-DCM,
Analytic Hierarchy Process-AHP,
Gray Decision Model-GDM,
Surveys and ranking of importance,
Binary Logistic Regression-BLR
Port location,
Port characteristics,
Number of berths,
Travel time,
Maritime costs, Reability,
Port charges and port services,
Number of routes and frequency,
Hinterland and quality of connection,
Feeder connection
[6,14]
2011–2020Asia,
Europe,
South America
Discrete Choice Model-DCM,
Analytic Hierarchy Process-AHP,
Data Envelopment Analysis-DEA,
Electre III, Promethee
Stochastic Frontier Analysis–SFA,
COPRAS–model
Port location, Port characteristics,
Number of berths, Cranes, productivity,
Cargo handling costs, Maritime costs,
Port charges and port services,
Number of routes and frequency,
Hinterland and Foreland and quality of connection, Connection among ports,
Maritime transit time,
Proximity to import/export areas,
Channel access depth, Freights
[14,15,16]
2021–2024Asia,
Europa
Discrete Choice Model,
Data Envelopment Analysis-DEA,
Principal Component Analysis-PCA, Clustering
Port location, Number of berths,
Yard, Quay Cranes,
Throughput (TEUS)/(Tons)
[5,6]
Table 3. The 5 main container terminals in LAC according to TEUs/year throughput, recent years.
Ranking201820192020202120222023
1ColónColónColónColónColónColón
2SantosSantosSantosSantosSantosSantos
3Manz-MexManz-MexBalboaBalboaManz-MexManz-Mex
4BalboaCartagenaCartagenaManz-MexBalboaBalboa
5CartagenaBalboaManz-MexCartagenaCartagenaCartagena
Table 4. Results obtained from the application of the TOPSIS methodology, excluding throughput.
Ranking LACTOPSIS
(No Throughput Considered)
1Santos-Brasil
2Manzanillo-México
3Buenos Aires-Argentina
4Kingston-Jamaica
5Balboa-Panamá
6Cartagena-Colombia
7Manzanillo-Panamá
8Callao-Perú
9Buenaventura-Colombia
10Colón-Panamá
11Veracruz-México
12Lázaro Cárdenas-México
13Caucedo-Rep. Dominicana
14Itajai-Brasil
15San Antonio-Chile
16Freeport-Bahamas
17Paranaguá-Brasil
18Montevideo-Uruguay
19Guayaquil-Ecuador
20Santa Marta + Barranquilla-Col
21Puerto Limón-Moin Costa Rica
22San Juan-Puerto Rico
Disclaimer/Publisher’s Note: The statements, opinions and data contained in all publications are solely those of the individual author(s) and contributor(s) and not of MDPI and/or the editor(s). MDPI and/or the editor(s) disclaim responsibility for any injury to people or property resulting from any ideas, methods, instructions or products referred to in the content.

