Article

Shape Optimization of Structures by Biological Growth Method

Department of Applied Mechanics and Mechanical Engineering, Faculty of Mechanical Engineering, Technical University of Košice, Letná 9, 042 00 Košice, Slovakia
*
Author to whom correspondence should be addressed.
Appl. Sci. 2024, 14(14), 6245; https://doi.org/10.3390/app14146245
Submission received: 12 June 2024 / Revised: 12 July 2024 / Accepted: 15 July 2024 / Published: 18 July 2024
(This article belongs to the Special Issue Modernly Designed Materials and Their Processing)

Abstract

:
Structural element shape optimization based on the biological growth method is increasingly used nowadays. This method consists of two main methods: topological optimization (soft kill option—SKO) and shape optimization (computer-aided optimization—CAO). This paper presents the solution procedures for both shape optimization and topological optimization. In applying these methods, first of all, a certain stress norm must be established, where the most appropriate and most used criterion is the equivalent stress according to von Mises. The application of the mentioned optimization methods is illustrated by several examples. The aim was to compare the change in volume or mass and the maximum stress of the structural elements between the different designs: the initial design, the design after topological optimization, and the design after shape optimization.

1. Introduction

Among the classical very well-known optimization procedures is the method described in the 1904 paper by Michell [1], which deals with the optimization of the frame transferring a given load to the foundation. These designs are interesting in that they are associated with optimal stress “flows” responding to a given load and thus determine the optimal frame arrangement. The optimal arrangement emerges from among all possible structural topologies, creating unique structures that are both lightweight and stiff. Although Michell’s approach applies to rod structures, the smallest volume condition extends this class of structures to discrete continuous structures. The solution of a broad class of problems based on Michell’s approach is addressed in [2].
The aim of this paper is not to address the whole class of optimization problems oriented to the optimization of structures, but to focus only on some that are related to processes that mimic what happens in nature. Thus, the whole class of methods based on mathematical optimization methods implemented by analytical or numerical approaches is not mentioned here [3,4]. There are more optimization approaches that mimic processes existing in nature, and one can mention here the nowadays frequently used algorithms for mathematical optimization, such as the genetic algorithm [5], the simulated annealing method, swarm optimization techniques, etc.
The optimization of structures based on the growth methods of organisms in nature, as in the case of trees, is an interesting example of the efficient use of energy and material to achieve strength, stability, and durability. For a species to be guaranteed to survive, the least possible cost must be incurred to create safe structures, but a certain degree of natural failure is also accepted. Optimization, however, avoids such failure.
The most likely cause of failure of structures under service conditions is fatigue loading. Failure usually occurs at locations of high stress concentration, which is usually caused by the presence of notches. A structure characterized by such a locally inhomogeneous stress distribution is unsafe and is usually not optimized for the loading conditions. Many times, various stress concentrators are part of the structure and cannot be removed for functional reasons. Therefore, the designer’s goal is to optimize the shape of the structure in order to limit as much as possible the stress growth at critical points of the structure, but other factors such as weight, manufacturing capabilities, production costs, or aesthetic considerations of the component or structure must also be taken into account [6,7,8].
Low weight and high fatigue resistance are two of the most important requirements that structural designs must meet. This can only be achieved if the structural element is well optimized for the given load. Often it is not enough to modify the design of a component, but an entirely new design must be created. Thus, the optimization growth method proves to be an effective method for the optimal design of a component [9].
Among the first works in this field are those of Mattheck [6], who investigated tree growth and formulated the basic postulates of this approach. Optimization of structures by the growth method represents an innovative approach to the design and construction of structures. This method is based on the analysis of tree growth and its ability to adapt to the surrounding situation. The method is based on the observation that trees grow efficiently and resist external influences by adding material only where necessary. The basic concept of this method is to minimize the weight of the structure while maintaining sufficient strength and stability. Just as trees only add material in areas of increased load, structures could be designed to use materials efficiently and minimize their weight.
In the case of structures, this method could lead to the development of structures that are not only lighter but also greener. This method also emphasizes the importance of a dynamic balance between force and mass. Just as trees optimize their structures to withstand wind and other external influences, industrial structures should be able to adapt to changing conditions. Dynamic balance could lead to longer lasting structures and a better ability to withstand extreme conditions. A more extensive description of this method is given in [10]. Many variations of the presented procedure have been developed based on that principle. In [11], topological optimization methods are investigated. Among the various numerical methods for topological optimization, evolutionary structural optimization (ESO) and bidirectional evolutionary structural optimization (BESO) are currently used. Topological optimization problems are also addressed in the works of [12,13]. Isogeometric topological optimization, i.e., optimization based on geometry interpolation using non-uniform rational B-splines (NURBS), is described in [14].
In [15], the authors discuss the topological optimization method of continuum structures with stress constraints under an aperiodic load based on the bi-directional evolutionary structural optimization method (BESO). Topological optimization issues related to stability are addressed by the authors in [16], considering design-dependent loads. The bi-directional evolutionary structural optimization and simulated annealing algorithm is described in [17]. The bisection constraint method is described in the work of [18]. The method attempts to minimize the compliances at one load state, while the compliances at other load states are constrained. During the optimization process, the problem is automatically reformulated with a new objective function and new constraint sets. Solving the problem of thermoelastic damping of microresonators using optimization is addressed in [19].
An automated skeletonization-based feature recognition system for use with biomimetic structural optimization results is described in [20]. It allows the optimization results to be imported back into the CAD system as a set of parameterized geometries.
The biological growth method optimization described in this paper consisted of two main methods, the SKO (topological optimization) method and the CAO (shape optimization) method. The initial design of the object under study could be very simple and preliminary. The subsequent optimization strategy was carried out by applying both methods sequentially. First, topological optimization was used to obtain a preliminary design of the element under study, and then shape optimization was used to refine the design, resulting in a structure with a more homogeneous stress distribution.
Currently, one of the most widely used topological optimization methods is the solid isotropic material with penalization (SIMP) method, which belongs to the density-based approaches. In formulating and solving the topology optimization problem in the solid design domain, simple continuous design variables are used for which the Young’s modulus is defined as a polynomial function of the element density [21]. Simulation optimization by the growth method has been successfully introduced into structural design in recent years.
This paper presents FEM optimization of structural elements using topological and shape optimization.

2. Materials and Methods

Optimization consists of finding the minimum or maximum of a function of one or more variables. This function is called an objective function. We were interested in either the value of the function or the values of the variables or parameters (or both) for which the function reached an optimum. There are two main categories of optimization search: analytical and numerical optimization methods.
The solution by analytical method is achieved by applying differential and integral calculus on continuous functions. The loading conditions, as well as the material properties in real structures, are considerably more complicated than the relations described by analytical methods; therefore, numerical methods are more often used in practice. Therefore, we could say that numerical methods only provided us with approximate solutions to the problem. Numerical methods resulted in numerical data (e.g., displacements, deformations, stresses, etc.).
Analytical methods provide an important theoretical basis for optimization, but in general, optimization is performed using iterative numerical methods (successive approximation), especially for large-scale problems such as those encountered in engineering. Numerical optimization can take different forms such as linear, nonlinear, or quadratic programming. The most complicated case of optimization is nonlinear programming of a function of several variables [22,23,24,25].

2.1. Growth Optimization Method—CAO Method 1

Biological organisms are composed of supporting parts that are optimized by natural evolution. It is difficult to find an exact criterion for their evolution, but it can be said that living organisms “try” to make optimal use of the material of which they are composed. This means, in particular, that low-stress parts are reduced, and parts with a high concentration of stresses threatening destruction are strengthened. These processes are known in organisms as atrophy and growth. Living organisms can thus be said to “try” to construct their load-bearing parts in such a way that the stress values are approximately balanced and, of course, do not exceed a certain critical value.
Thus, the optimization criteria for the supporting parts of living organisms are
-
uniform stress distribution for all load conditions;
-
minimum weight.
These requirements cannot always be met in living organisms for all possible loading conditions. The optimal shape is more adapted to the most important loading states and to a lesser extent to less important loading states.
The shape and structure of the load-bearing parts of living organisms is a compromise for different modes of loading, and the organism grows in such a way that it does not develop stress peaks. The optimum shape is defined as the shape that exhibits a state of constant stress on part or all of the surface of the component.
When applying this method, first of all, a certain stress standard must be established. The most appropriate and most widely used criterion is the equivalent von Mises stress, given by the relation
σ eq = 1 2 σ 22 σ 33 2 + σ 33 σ 11 2 + σ 11 σ 22 2 + 6 σ 23 2 + σ 13 2 + σ 12 2 ,
where σ eq is the equivalent stress and σ ij are the components of the stress tensor. The goal of our shape optimization was to make the shape change as uniform as possible by distributing the σ eq stresses in the component as evenly as possible.
Let us now formulate the components of the relaxation ratio strain tensor as a function of the equivalent stresses in the element σ eq and the average value of the equivalent stresses in the whole component σ 0 by the relation
ε ij R = δ ij σ eq σ 0 σ 0 h r ,
where δ ij is the Kronecker delta
δ ij = 1 ,       i f       i = j 0 ,       i f       i j
and h r is a reduction factor that reduces the values of ε ij R to an acceptable size. Acceptable size is understood as those values of ε ij R that do not cause very large changes in the finite element mesh, i.e., do not cause a large degeneracy of the mesh. For practical computations, one can choose h r = 0.05 . According to the opinions of the authors, the removal of 5 percent of weak loaded elements represents the appropriate value. A small number slows down process of optimization, and on the other hand, a big number removes too many elements from the structure at the individual optimization step.
We can leave the value of the stress σ 0 constant for all iteration steps, but it is better to update it after each iteration.
Based on Hooke’s law, it is now possible to express the tensor components of the so-called growth stress σ i j G ,
σ ij G = D ijkl ε k l G ε k l R ,
where ε k l G are the components of the growth-ratio strain tensor and D ijkl are the components of the constitutive tensor. On the right-hand side of Equation (4), Einstein’s summation rule is used to perform summations for the same indices. In our case, the indices are k and l . The extent of the summation depends on the type of problem.
Based on relationships known from the finite element method, we can express the growth displacement vector u G x at x as a function of the displacement of the nodes u G by the equation
u G x = N x   u G
and growth strain by the relationship
ε G x = B x   u G .
Substituting this relation into Equation (4) gives the relation for the growth stress vector σ G x ,
σ G x = D   B x   u G D   ε R x .
Assuming that the external forces do not change during growth, the relation holds according to the principle of virtual work for the finite element,
V e δ ε G T x   σ G x d V = 0 ,
where δ ε G x T is the virtual change to ε G x T and V e is the finite element volume.
Substituting Equations (6) and (7) into Equation (8) gives
k   u G = r ,
where
k = V e B T x   D   B x d V , r = V e B T x   D   ε R x d V .
The matrix k is the element stiffness matrix, and the vector r is the vector of equivalent forces generated by the relaxation ratio deformation vector ε R x .
The global system of equations is given by the superposition of all the stiffness matrices of the structural elements and the equivalent forces, and its solution gives the growth displacements. Adding these displacements to the coordinates of the nodal points, we then obtain the coordinates of the points of the structure with the improved shape.
The nature of the displacements is such that if the equivalent stress in the element is greater than the average equivalent stress in the structure, the element is enlarged; otherwise, i.e., if the stress is less, the element is reduced. This nature of nodal point displacements follows from Equations (2) and (10). If the equivalent stress in the element is greater than the average equivalent stress in the structure, then it follows from Equation (2) that the components of ε m m R are positive and from Equation (10) that the forces are of such a nature that they expand the element. Conversely, when the equivalent stress in the element is less than the average equivalent stress in the structure, the element is compressed. ε m m R are the normal components of the strain tensor, i.e., elements that lie on the main diagonal of the matrix representing strain tensor.
From relation (2) it can be seen that the tensor ε R does not contain shear components. Hence, a pure tension or pressure is assumed. Thus, a computation according to this relation would ensure a uniform increase or decrease in one element in all considered directions. For multiple elements, the direction of growth will result from the interaction of the elements with each other [26,27,28,29].
Figure 1 shows the solution of the example of optimizing the stress distribution in the rod. The tie rod was formed by a flat piece of steel with a thickness of 10 mm. The material of the tie rod had Young’s modulus E = 210 GPa and Poisson’s ratio μ = 0.3 . A half-model of the structure with its dimensions is shown in Figure 1a. Due to the symmetry, it was not necessary to model the whole tie rod; its half-model with dimensions is shown in Figure 1a. The model contained approximately 140,000 triangular finite elements with 90,000 nodes. The average size of the finite elements was about 4 mm. In Figure 1b, the load and the applied boundary conditions are shown (marked by green arrows in Figure 1b). A force of F = 10,000 N was applied on the left side of the rod (marked with purple arrows in Figure 1b). The resulting field of equivalent stresses according to von Mises theory for the structure before optimization is shown in Figure 1c. The biggest equivalent stress according to von Mises theory was at point A and had the value 87 MPa. This stress was at the point of application of the boundary conditions (Figure 1b) and represented the stress at the point of contact between the pin and the pull rod. Obviously, this contact stress at the cylindrical surface could not be significantly affected by the shape optimization at the other edges of the component. Moreover, the allowable values of the contact stresses were higher than those of the other loading methods. Of interest from the point of view of shape optimization was the equivalent stress around point B, where the sharp edge, and hence the stress concentrator, was located. The magnitude of the equivalent stress according to von Mises theory was approximately 72 MPa in this region before optimization. The optimization of the distribution of equivalent stresses was carried out by the growth method. During the optimization, only the changes of the upper edges marked in red in Figure 1b were allowed to be realized. The shape of the rod after 15 optimization steps is shown in Figure 1d. The field of equivalent stresses according to von Mises theory can also be seen in this figure. It can be seen from Figure 1d that the stress field was distributed more homogeneously, and the stress peaks at the transition point from the arc to the longitudinal part of the rod were removed. The equivalent stress according to von Mises theory in the vicinity of point C was reduced to approximately 26 MPa after optimization.

2.2. Shape Optimization—CAO Method 2

Shape optimization (CAO method) allows one to reduce local stress concentrators (notch stresses) by adaptive growth until a uniform stress distribution over the entire surface of the component is achieved. After shape optimization using CAO, the notched stresses can be reduced by more than 50 % , causing the resulting design to have a higher fatigue life than the original design. In the new design, the low loaded regions could be replaced by holes, which again reduced the stress concentrators using CAO and resulted in a design with homogeneous stresses along the internal contour lines but also already with a lower mass of the part [25].
The procedure for simulating the growth mechanism of biological structures using the finite element method (FEM) can be described by the following steps:
  • Create an FEA model with an initial design proposal.
  • Cover the model with a thin layer of finite elements that have a much smaller Young’s modulus value than the original elements.
  • Apply a load to the model, thereby elastically modifying both the surface layer and the underlying structure.
  • Multiply the incremental displacements by an appropriate factor to obtain visible shape corrections. The multiplied displacements shall be added to the coordinates of the nodal points on the grid surface.
  • Subsequently, the inner edge of the surface layer is displaced outward so that the thickness of the surface layer is constant throughout. It is also possible to move the nodal points further inward to avoid strong deformations of the mesh.
  • Repeat step 3 but with the new FEM model optimized according to step 5.
  • Perform elastic control cycles to determine the degree of optimization with a high value of Young’s modulus (also on a surface layer that was previously soft).
  • Stop the optimization procedure if the stress concentrators are sufficiently reduced or if there are dimensional design constraints [6].
The quality of design element relief by the CAO method mainly depends on the topology of the initial design. Using the CAO method always results in a design with a higher fatigue life, but sometimes, low-load areas remain in the component. Thus, shape optimization cannot create new holes in the structure but only shapes the already existing contour lines of the design. We use the SKO method to remove these redundant regions [25,26,27,28,29,30,31,32,33].
Although the procedure for changing the Young’s modulus of the SKO method is analogous to that of the CAO method, there are several significant differences between the two. The first difference is that the reference stresses of the two methods are not the same. For the SKO method, the contour lines of the optimized structure (called boundaries) are represented by the temperature isoclines inside the region under study. The stresses calculated for the merged points are averaged over the nodes. This leads to a halving of the stresses in the boundary region, where the stress values gradually change from high to approximately zero. To maintain a good approximation between the reference stresses of the two methods, a relationship is given:
σ r e f S K O = σ r e f C A O 2 ,
where σ r e f S K O is the reference stress for the SKO method, and σ r e f C A O is the reference stress for the CAO method [25].

2.3. Topological Optimization—SKO Method

The SKO method can generate the topology of the structure without the occurrence of low-loaded regions, which will guarantee the minimum weight of the component.
The simulation of this optimization mechanism can be performed without the use of the difficult relations that characterize the mathematical optimization by changing the Young’s modulus according to the computed stress distribution in the structural element. One way is to define the Young’s modulus as a function of temperature using the FEM program used. The Young’s modulus/temperature relationship can be defined as an open polygon that gives the moduli different temperatures from a given interval.
The procedure for applying the SKO method, which can use any commercial FEM program and does not require special optimization software, can be described in the following steps:
  • Compute the stresses within the selected design area for given loads. The design has a constant Young’s modulus over the entire area.
  • The values of the Young’s modulus across the surface vary as a function of stress.
  • Compute the new stress distribution over the whole given area under the same load but already with a locally different distribution of the Young’s modulus [25].
Steps 2 and 3 are repeated until areas between the high and low Young’s modulus can be clearly distinguished. This distribution of the Young’s modulus indicates the optimal topology for a given load. The unloaded parts of the structure are removed in this iterative manner. The new FEM model with the optimal topology can then be shape-optimized using the CAO method to reduce the remaining stress concentrators around the contour lines and to achieve a final highly fatigue-resistant design with a homogeneous stress distribution on its surface [23].
By using optimization, the new low-mass structure cannot be expected to be optimal in terms of fatigue life as well, so the optimization strategy by the biological growth method consists of successively applying topological optimization and shape optimization. The initial design can be tentative and very simple [25,26,27,28,29,30,31,32,33].

2.4. Application of the SKO and CAO Method for Optimization of 2D Structural Element

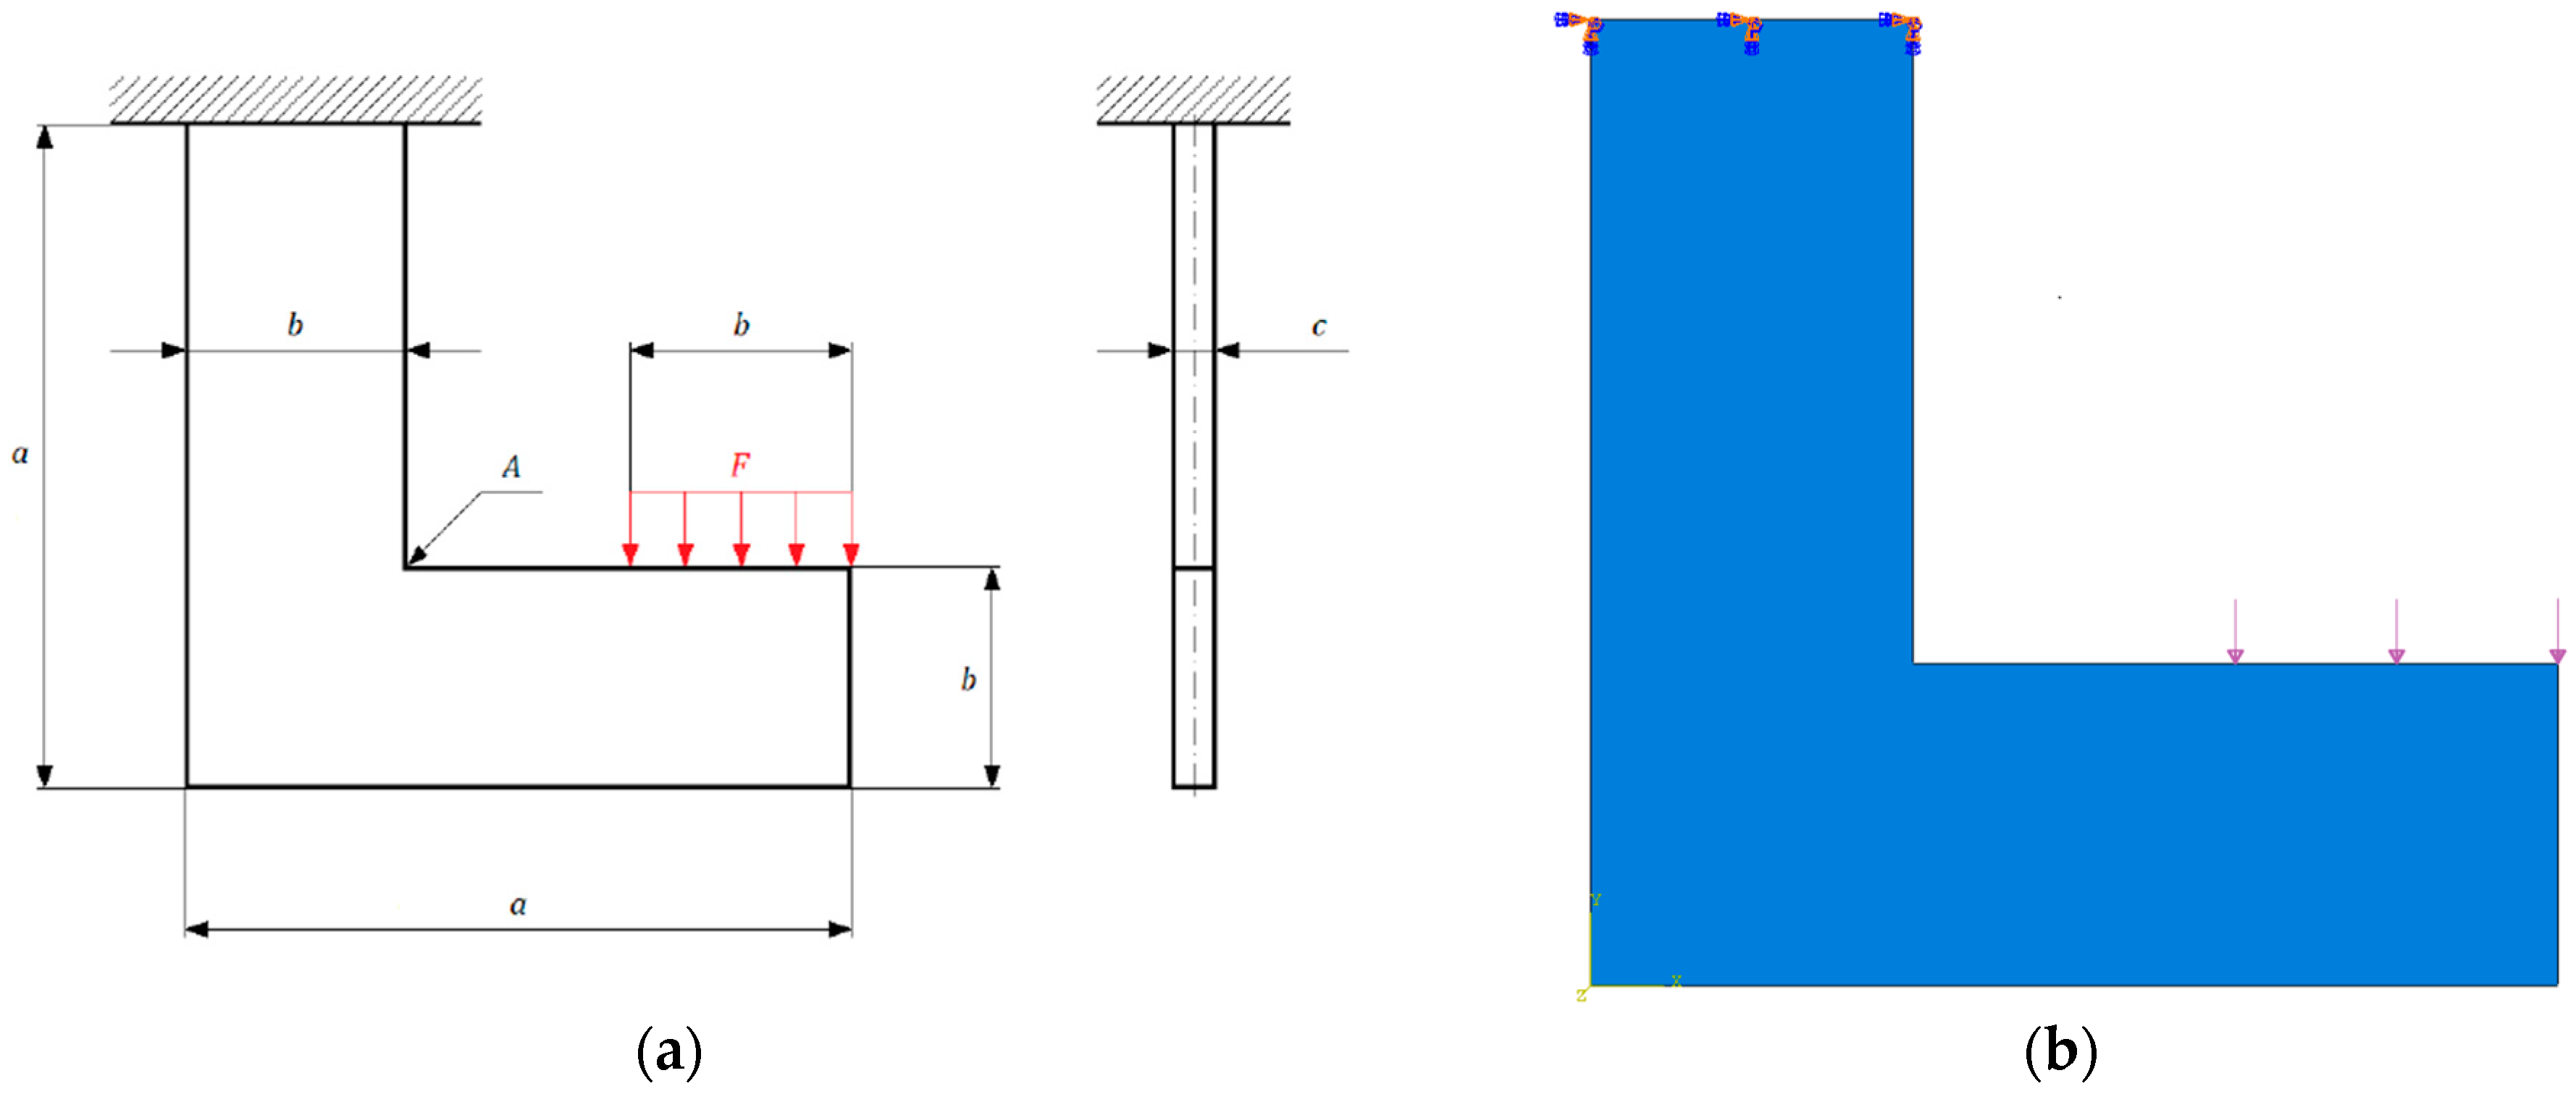
The selected 2D steel structural element is fixed at the top side, and a static load is applied to the area b × c; the resulting force is F = 1000 N. The dimensions of the element and the defined load parameters are a = 150 mm, b = 50 mm, c = 10 mm (Figure 2a), volume V = 125,000 mm3, and mass m = 0.981 kg. The basic material properties of the steel used are density ρ = 7850 kg∙m−3, Young’s modulus E = 210 GPa, Poisson’s ratio μ = 0.3 , and yield strength R e = 235 Mpa. The point A in Figure 2a represents the region in which we assume the stress concentrator to occur under the given loading conditions.
First, a meshed FEM model with assigned material properties and properly defined boundary conditions must be created. Figure 2b shows the defined boundary conditions of the initial design model of the investigated structural element, which has been modeled as a 2D model with an assigned required thickness of 10 mm. The finite element mesh consists of square elements with a side length of 2.50 mm, whose sides are loosely arranged along the contour lines of the design. The element is formed by eight nodes (quadratic element), with each node taking six degrees of freedom. A finer mesh (a mesh with smaller elements) will provide us better quality results but will negatively affect the computation time, so it is important to choose a mesh with a suitable number of elements and nodes. The finite element mesh of the initial structural design model consists of 2000 elements and 6241 nodes.
The static analysis of the initial structural element design model yielded a field of equivalent stresses according to von Mises theory and a field of resultant displacements (Figure 3). Already from the boundary conditions for a given structural element, it can be assumed that the critical region (the maximum stressed region with the occurrence of a stress concentrator) will occur at point A, and the maximum displacements will be located at the end of the structure. Abaqus was used for FEA computations of static loads and beam optimization.
A maximum equivalent stress of σmax = 78 MPa was generated on the model under investigation (Figure 3a). The yield strength of the selected material Re = 235 Mpa was located at a sufficient distance from the maximum stress occurring on the loaded structure, even when taking into account computational errors or undesirable effects that were not considered in the model design. Thus, it could be concluded that the investigated structural element was satisfactory for the given loading conditions, which provided us the possibility to optimize its topology in order to lighten the structure. The maximum displacement of the investigated element was umax = 0.102 mm (Figure 3b).
The SKO method is used to find the optimum structural topology of a given structural element and can be used to remove low-load areas in the structure, resulting in a significant reduction in the weight of the product. The density of the finite element mesh affects the computation of the topological optimization. While a finer mesh will provide us a better design topology with respect to the given loading conditions, such a model may be characterized by a very complicated design, which may contain, for example, very thin partitions, which could make it technologically impossible to produce such a component. Therefore, it is very important to choose an appropriate element size before starting the topological optimization.
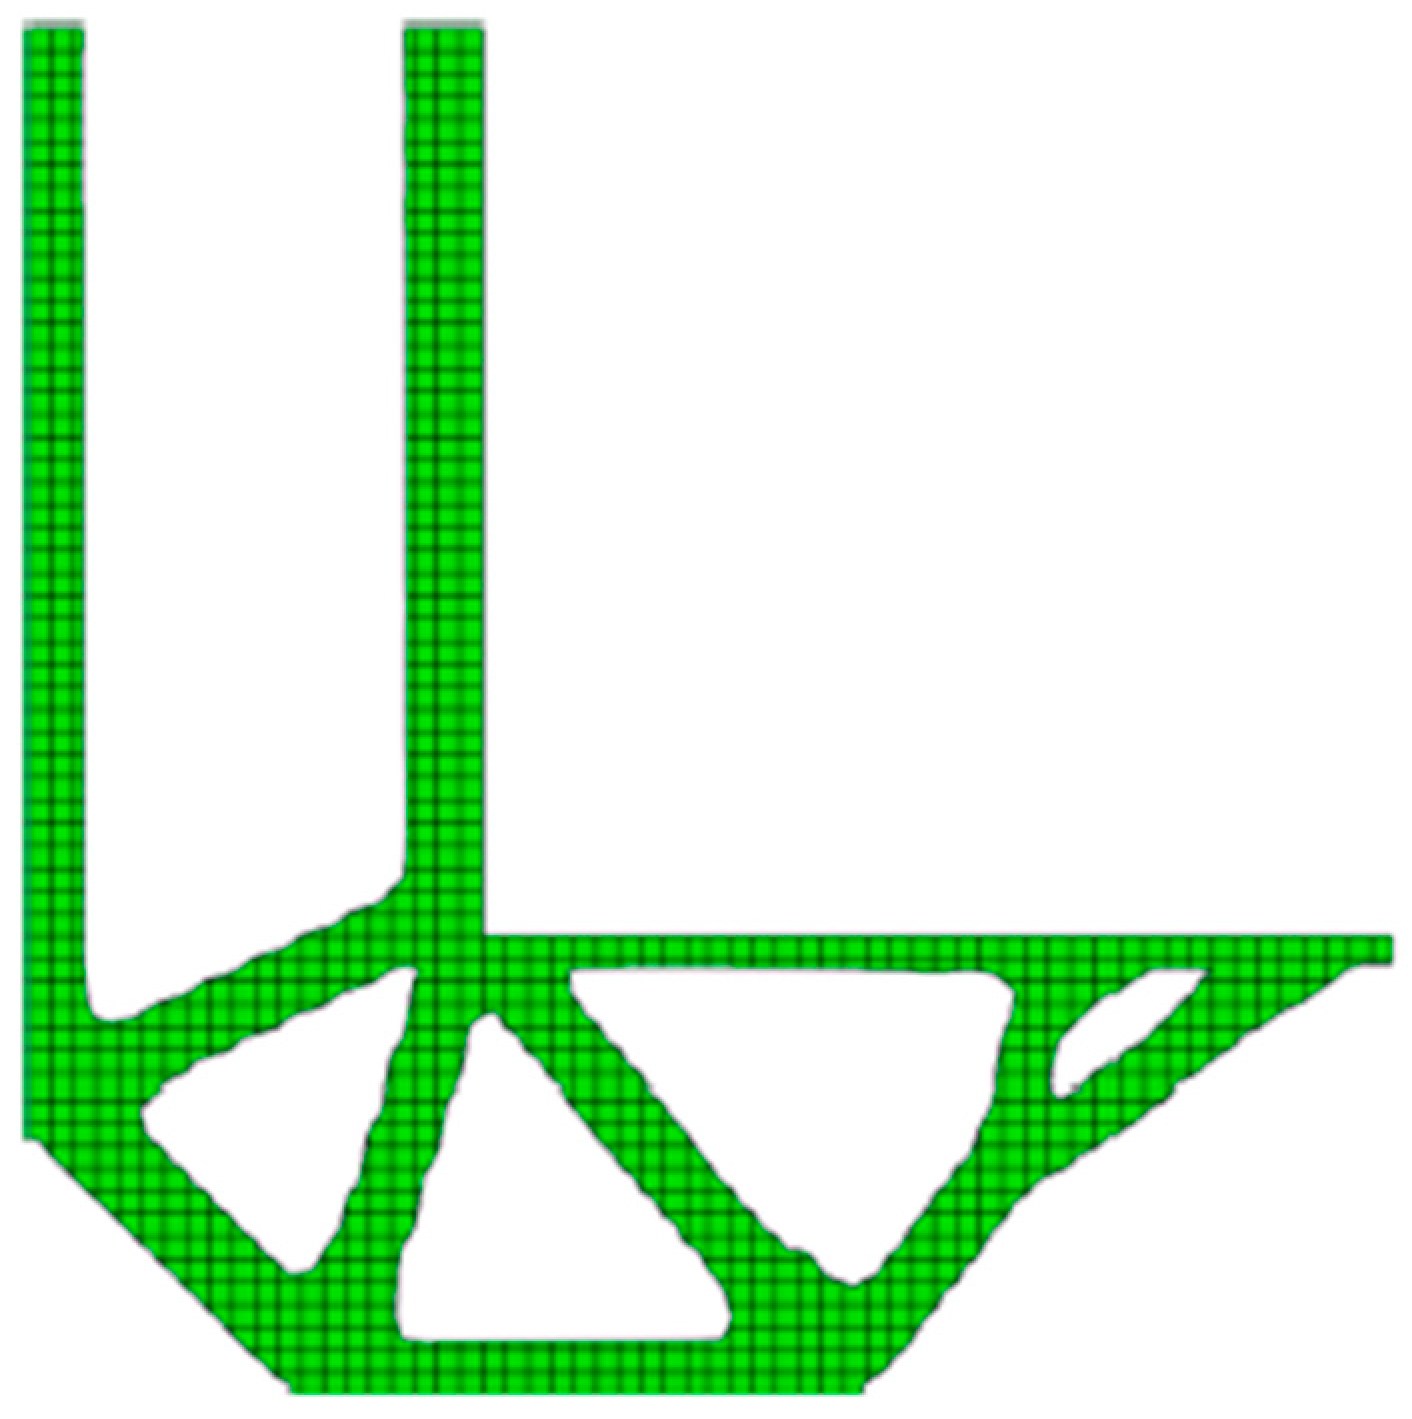
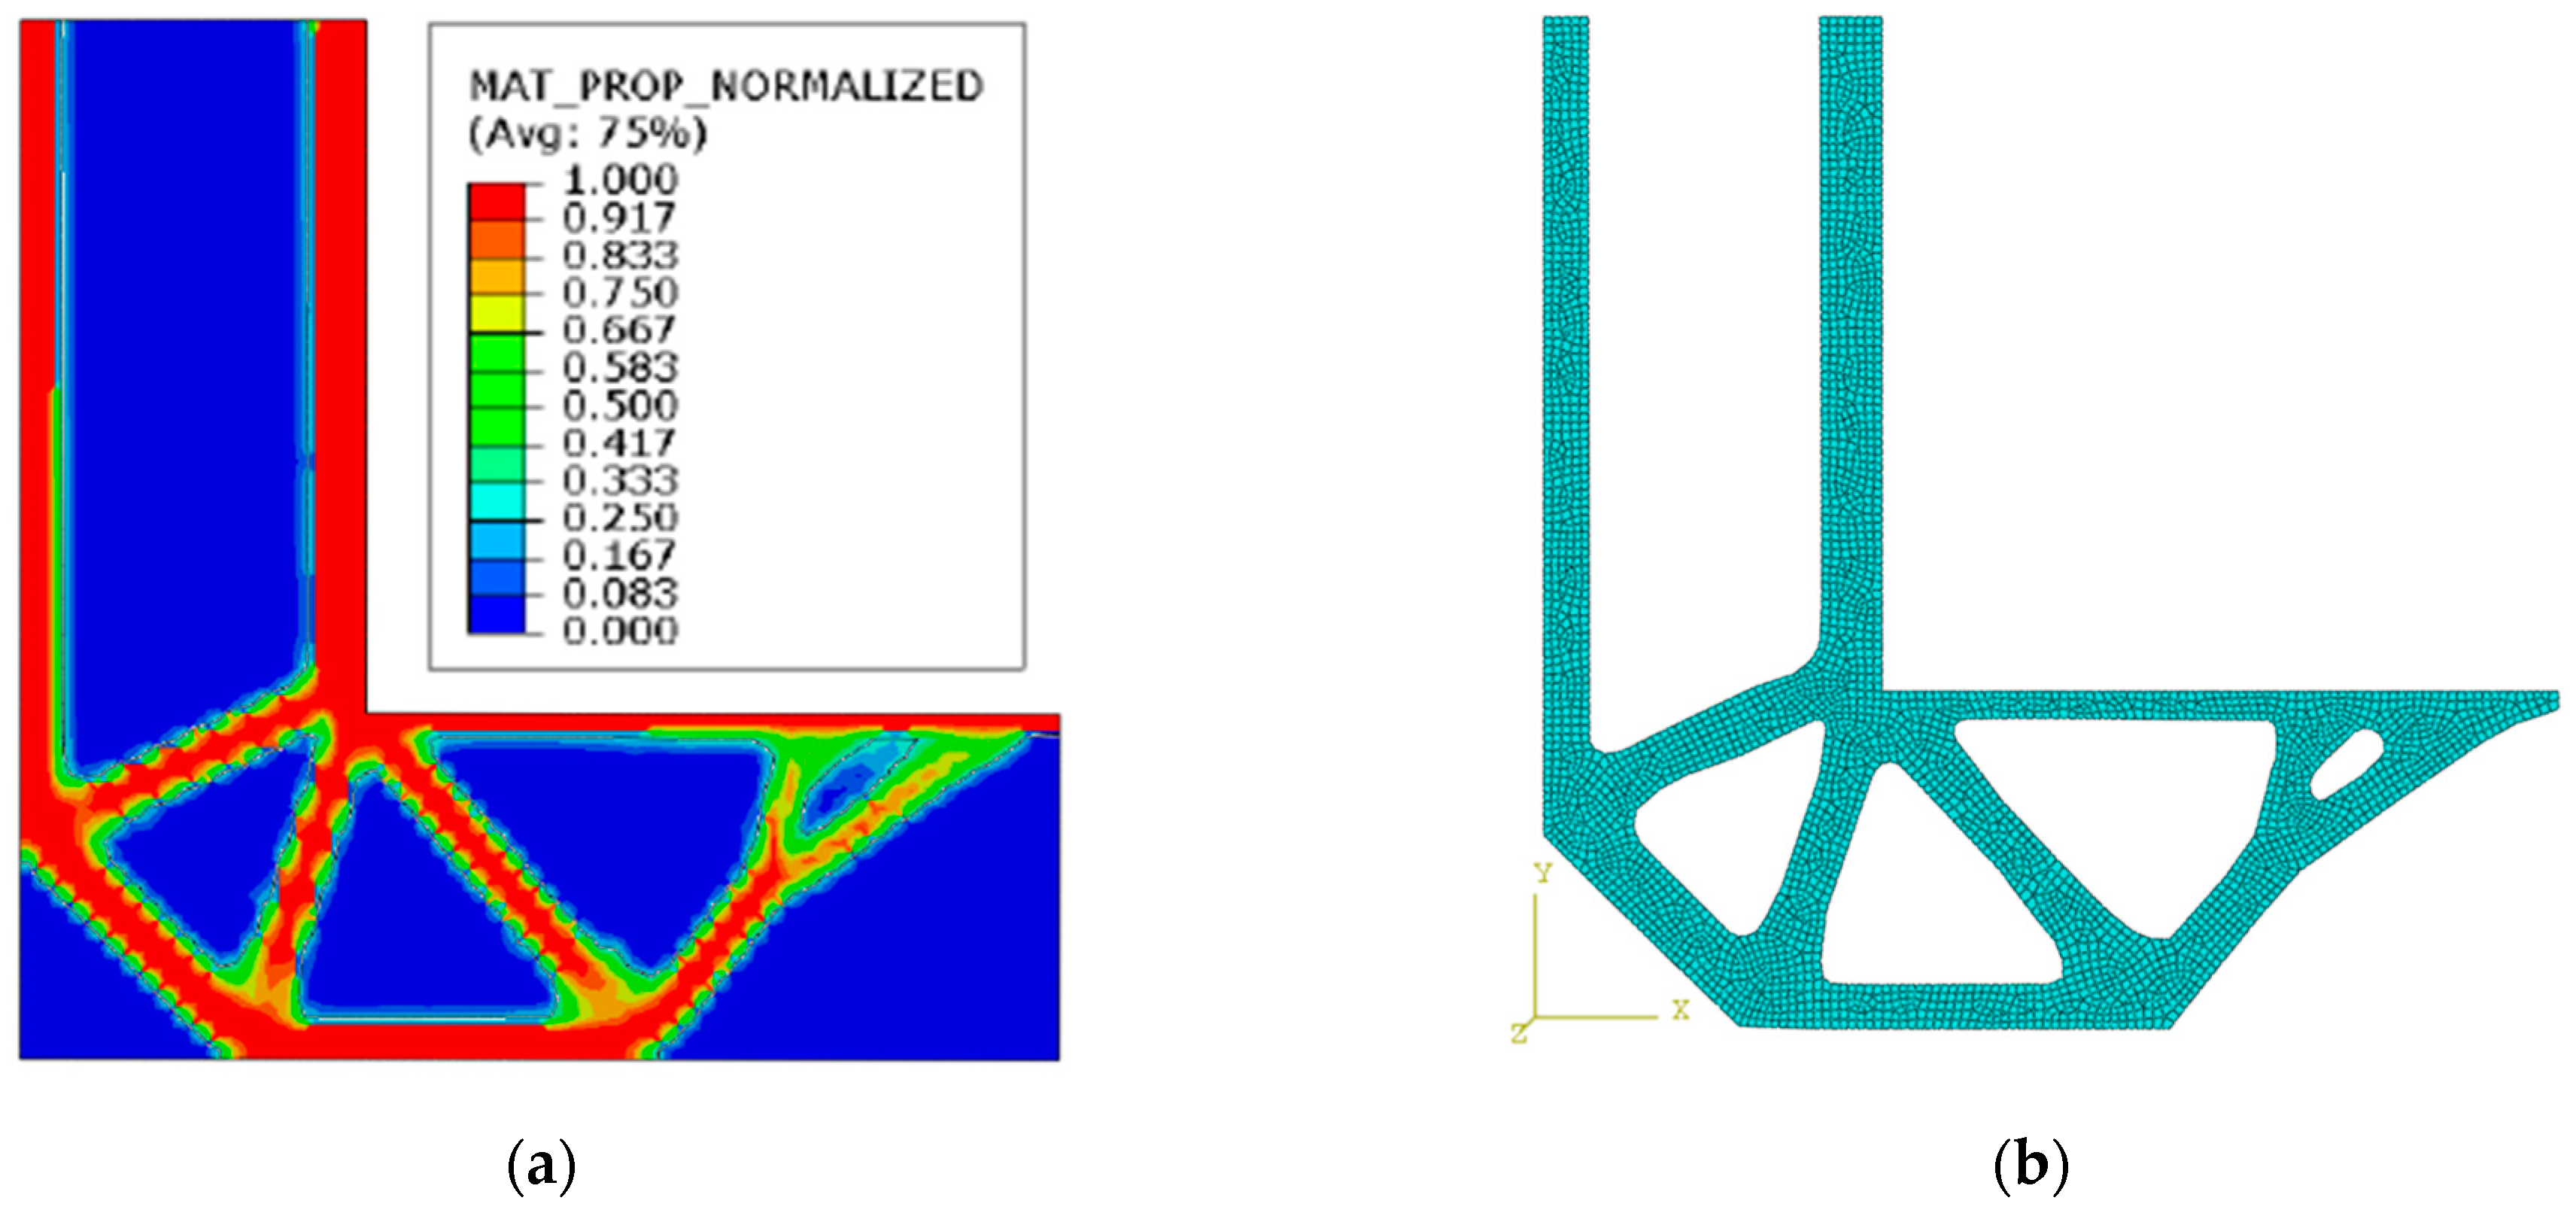
Another important input for the implementation of topological optimization is the number of cycles of the computation. A greater number of cycles increases the computation time but provides better results. Figure 4 shows the topological optimization with n = 20 computation cycles. Before starting the topological optimization of the selected component, it was necessary to set two main criteria: the goal and the constraints of the topological optimization, which will guide the Abaqus program in the computation. Only one optimization constraint was set: a reduction in the design volume by 70%. The result of the topological optimization of the design element at computation cycle n = 30 is shown in Figure 5a. The finite element mesh of the model after topological optimization is shown in Figure 5b. It consisted of 3354 elements and 10,851 nodes (Figure 5b). In some regions the mesh was not ideal, but we assumed that these were low-load regions in the center of the geometry, which would not negatively affect the computation of the structural element under study.
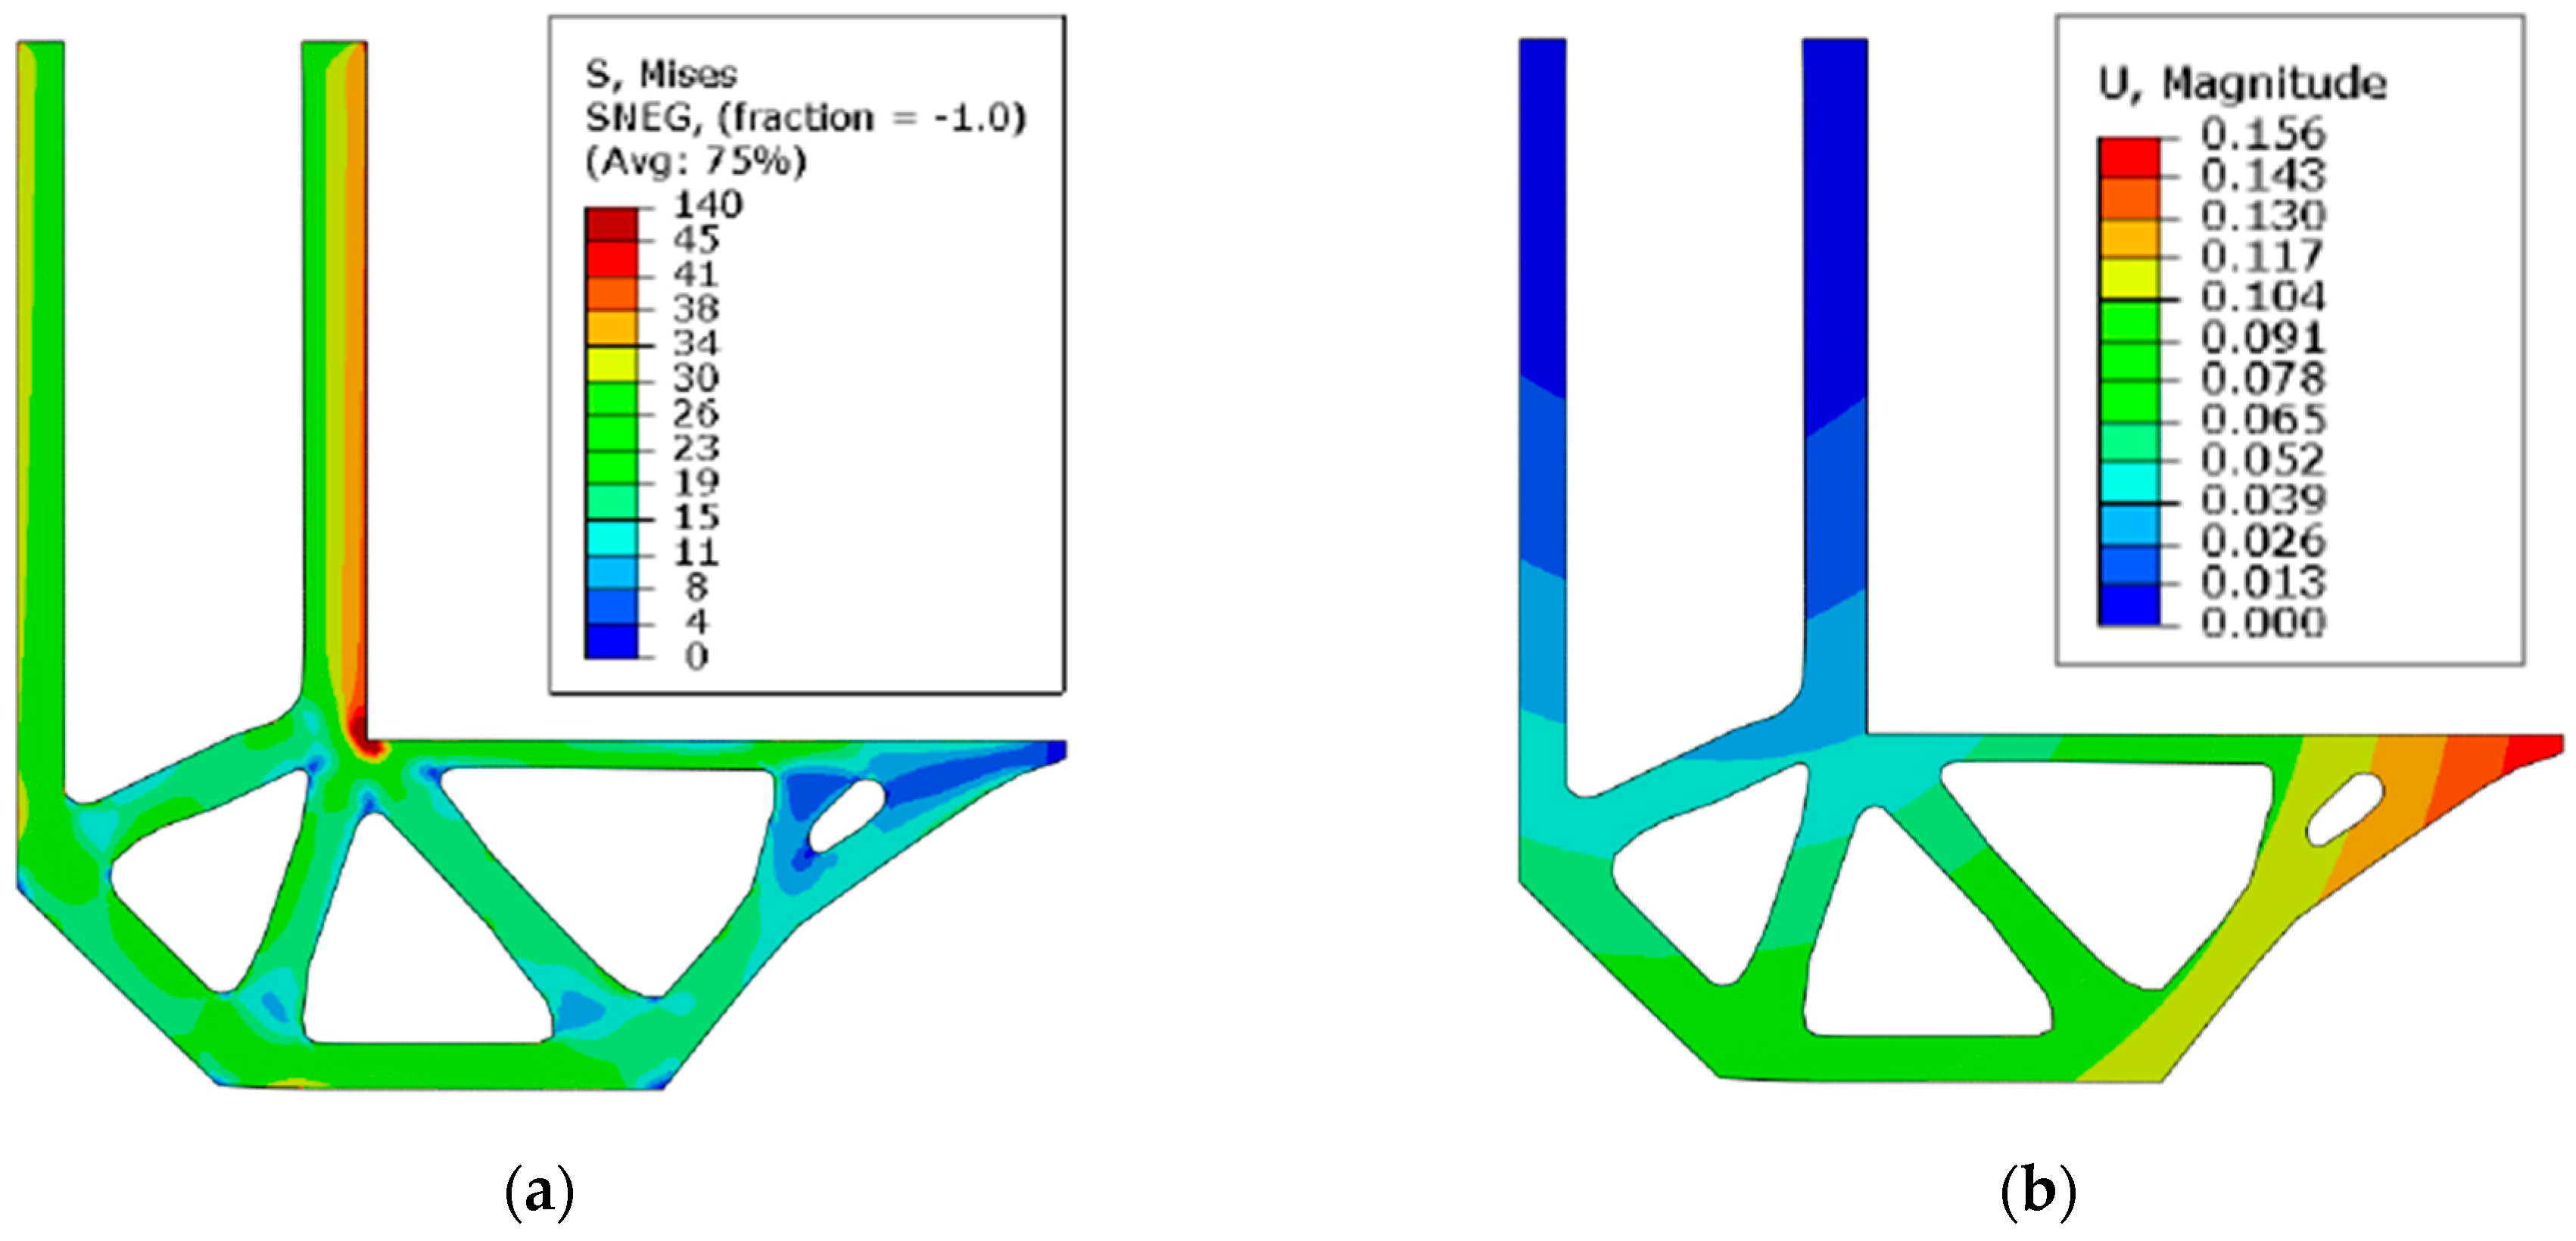
The static analysis of the 2D structural element after topological optimization is shown in Figure 6. In the extracted geometry, it can be seen that the shape of the component at the stress concentrator location (point A, Figure 2a) did not change even after topological optimization, since the SKO method cannot generate geometry outside the design contour lines. Its main goal is to lighten the given component in low-load regions. For this reason, it can be expected that the value of the maximum stress at a given (critical) location will not decrease.
Topological optimization negatively affected the resulting displacements and equivalent stresses in the contour lines of the initial design. Despite the high percentage increase (+52.94%) in the maximum value of the resulting displacement, its overall value of umax = 0.156 mm was acceptable. It was already worse with the distribution of the equivalent stress in the investigated element.
The case of the CAO method on a 2D structural element was performed on the same structural element as for the SKO method (Figure 1).
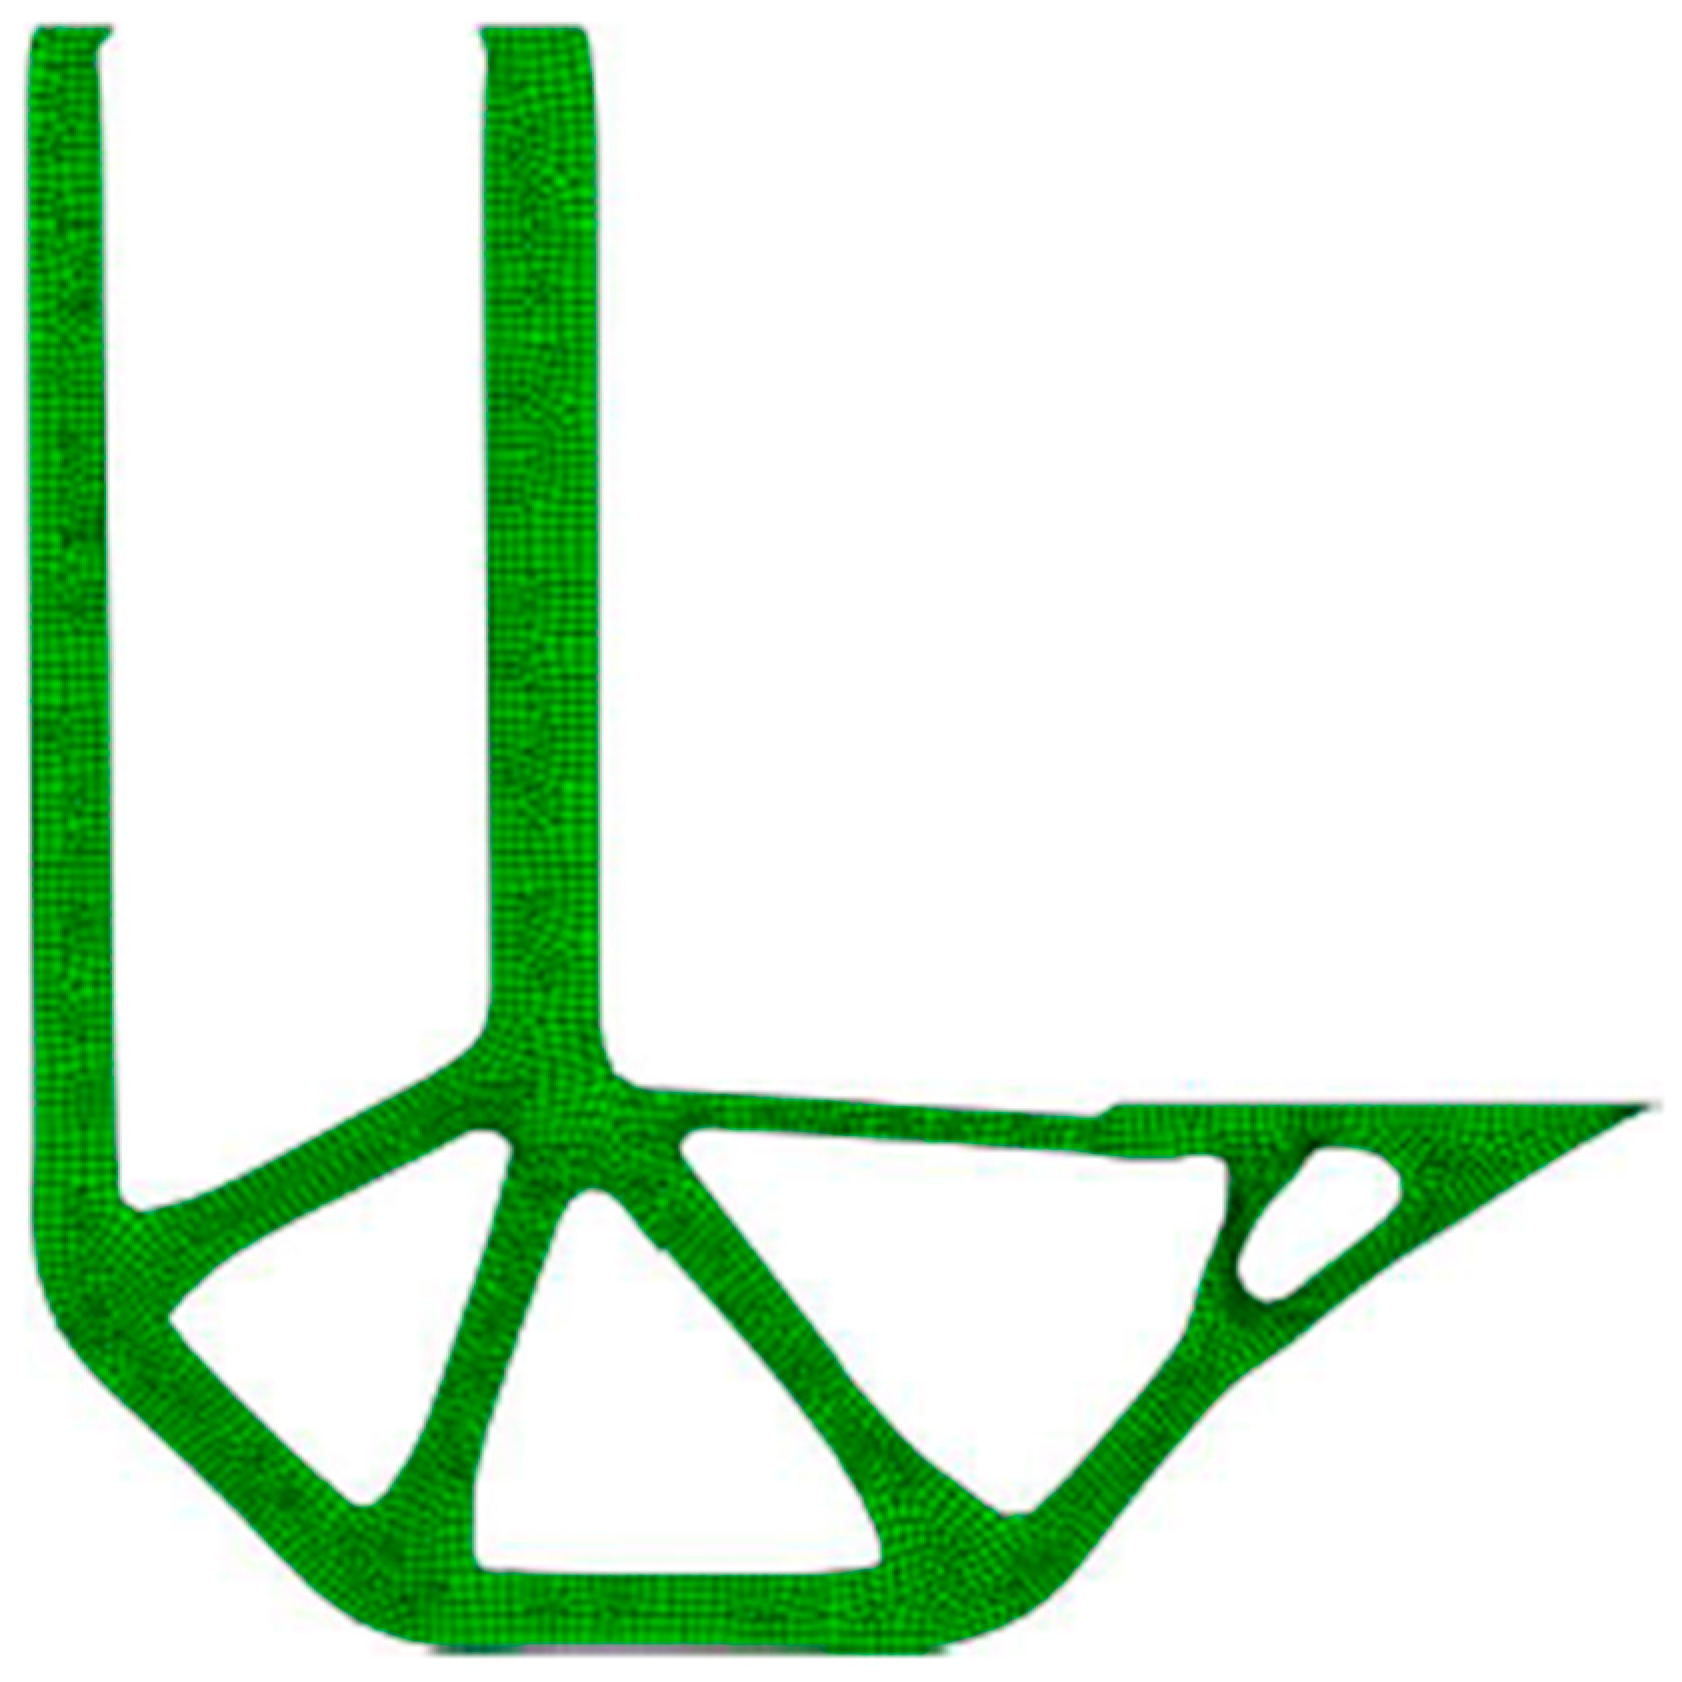
The optimization strategy of the biological growth method consisted of the successive application of topological optimization (SKO), which guaranteed us a minimum weight of the component, and then by applying shape optimization (CAO) we could obtain a design whose elements around the contour lines were modified (grew/shrank) so that the structure exhibited a constant stress on its surface. In other words, by using shape optimization, we could remove stress concentrators but also less stressed areas around the contour lines of the design [27,31]. The CAO method could not create new holes in the design but only modified the already existing contour lines to the final optimal shape. Also in this case, the optimization result was affected by the number of computational cycles. A larger number of cycles increased the computation time but provided better quality results. The results of the shape optimization for n = 20 cycles are shown in Figure 7.
Again, it is necessary to set the input parameters that will guide the Abaqus program in the computation. The chosen shape optimization objective for the structural element under study was to minimize the maximum stress variations in the given design elements. In other words, the Abaqus program tried to adjust (shift) the nodes of the mesh so that the elements with different stresses, after optimization, were as close as possible to the reference (most occurring) value of the equivalent stress in the design. This resulted in a more homogeneous distribution of the equivalent stress in the component. No optimization constraints were defined in the above example.
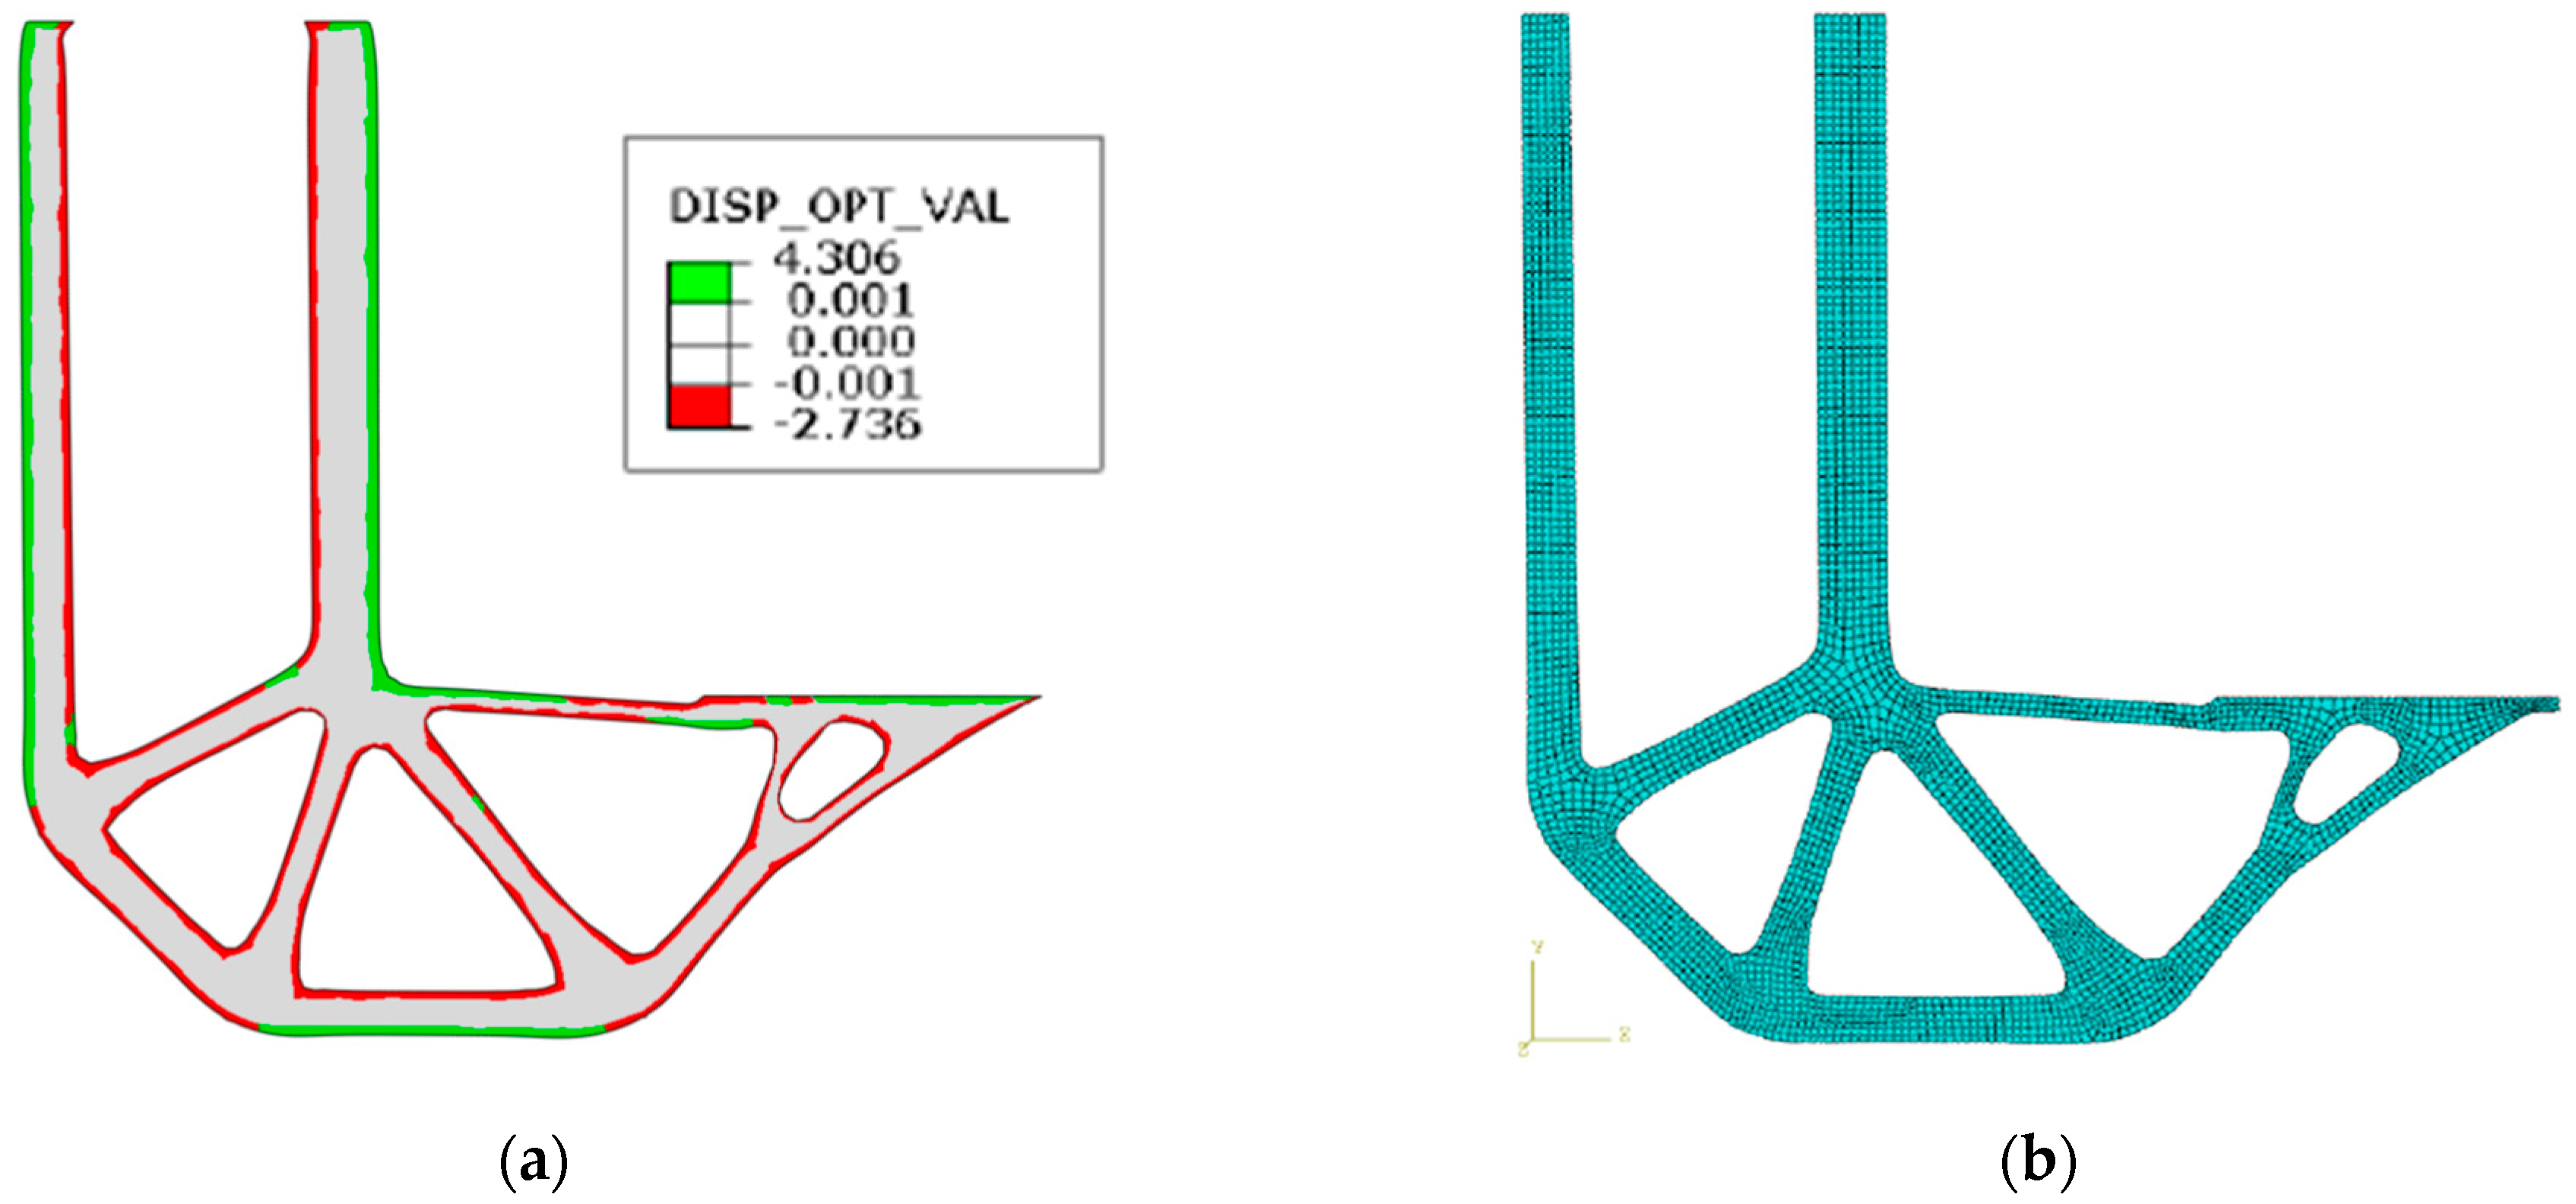
The model whose mesh is shown in Figure 5b was used for the shape optimization. The result of the shape optimization of the structural element at computation cycle n = 20 is shown in Figure 8a.
Figure 8a shows the movement of nodes during the shape optimization. The red color shows the nodes that were shrinking during shape optimization, moving downward into the design, shrinking the design volume. The nodes that grew during the shape optimization, moving outward from the design, increasing the design volume, are shown in green. Nodes that did not change their positions during the shape optimization are plotted in white. The finite element mesh of the model after the shape optimization is shown in Figure 8b and consisted of 3068 elements and 10,131 nodes. The chosen meshing setup generated a suitable mesh for us in most of the regions. In some locations, the mesh was not ideal, but we assumed that it should not negatively affect the correctness of the results of the design element under study. However, if a situation were to arise where the results in those areas were unsatisfactory, a better quality mesh would need to be used in those locations to verify the accuracy of the computations. For example, HyperMesh can be used to better mesh the model.
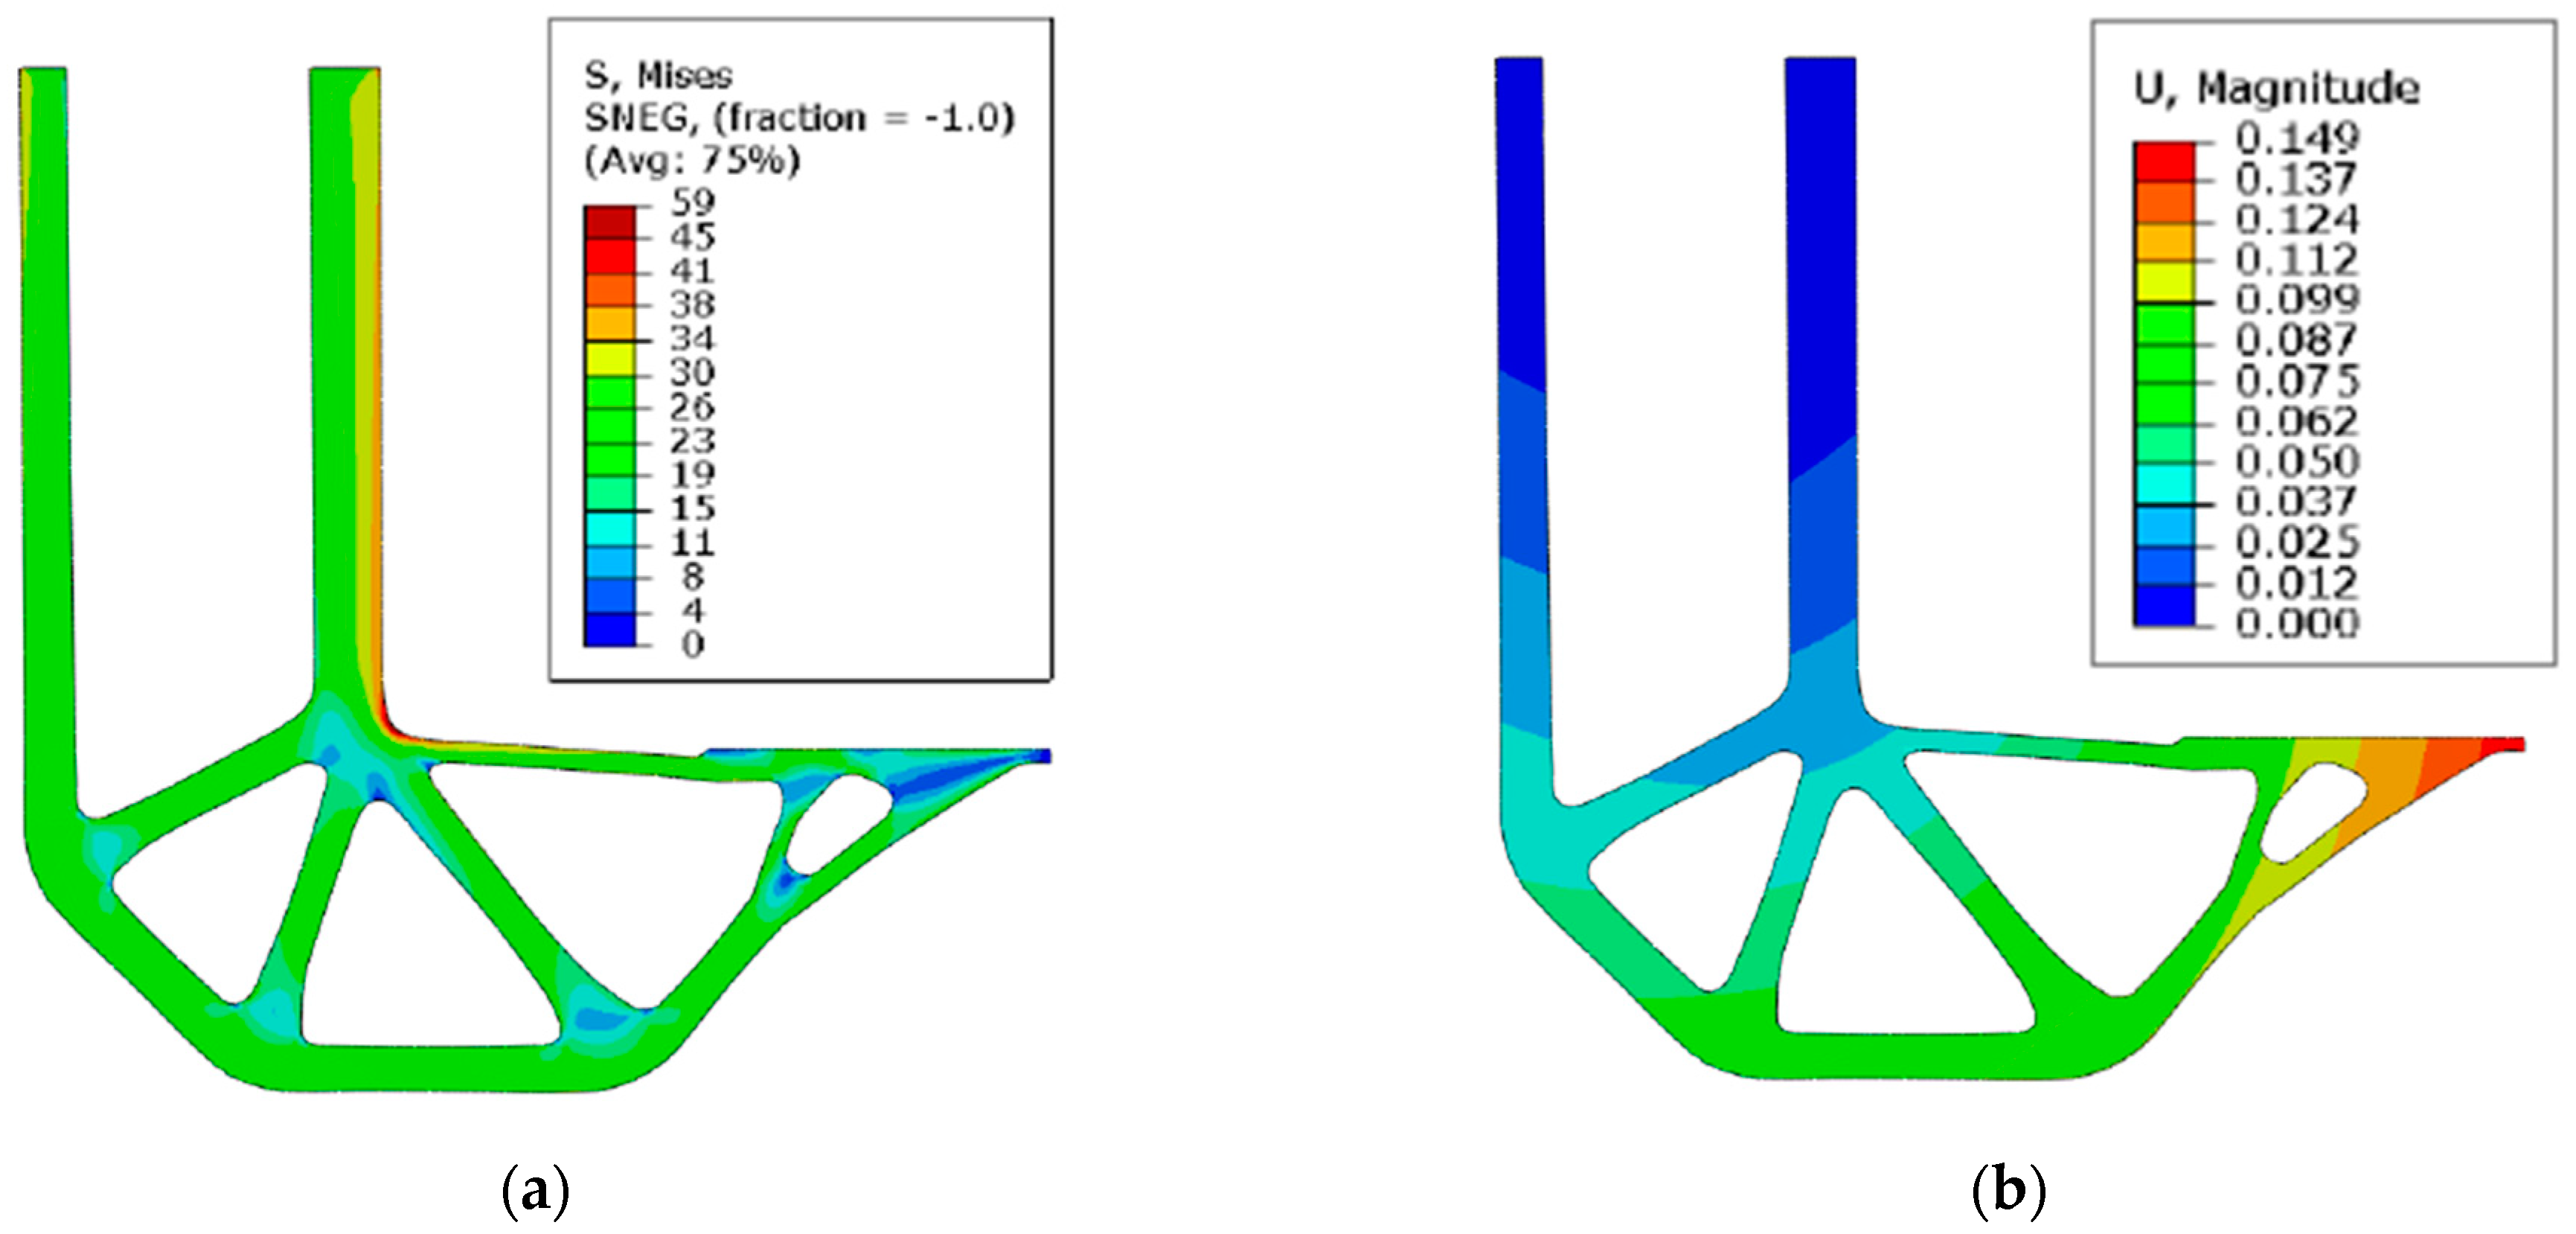
For the model that underwent both topological and shape optimization, a static analysis was performed under the given loading conditions (Figure 9). From the shape of the extracted geometry, it could be observed that the contour lines of the design at the location of the stress concentrator (point A, Figure 2a) were changed by the shape optimization. Thus, a significant decrease in the maximum equivalent stress at that (critical) location could be expected. After the shape optimization, the maximum equivalent stress decreased to σ m a x = 59 MPa (Figure 9a). The stress reduction at the critical location was achieved by changing the geometry (shape) from a sharp edge to a rounded one. The maximum displacement of the structural element after the shape optimization was umax = 0.149 mm (Figure 9b). The difference from the displacements on the model after the topological optimization was negligible in this case since the volume of the part was only minimally changed by the shape optimization.
The results showed that most of the structure was loaded with stresses σ in the range from 15 to 30 MPa. After the shape optimization, the maximum equivalent stress was significantly closer to this interval, and thus, the stress in the structure was more homogeneously distributed than it was after topological optimization.

3. The 3D Structural Element Optimization

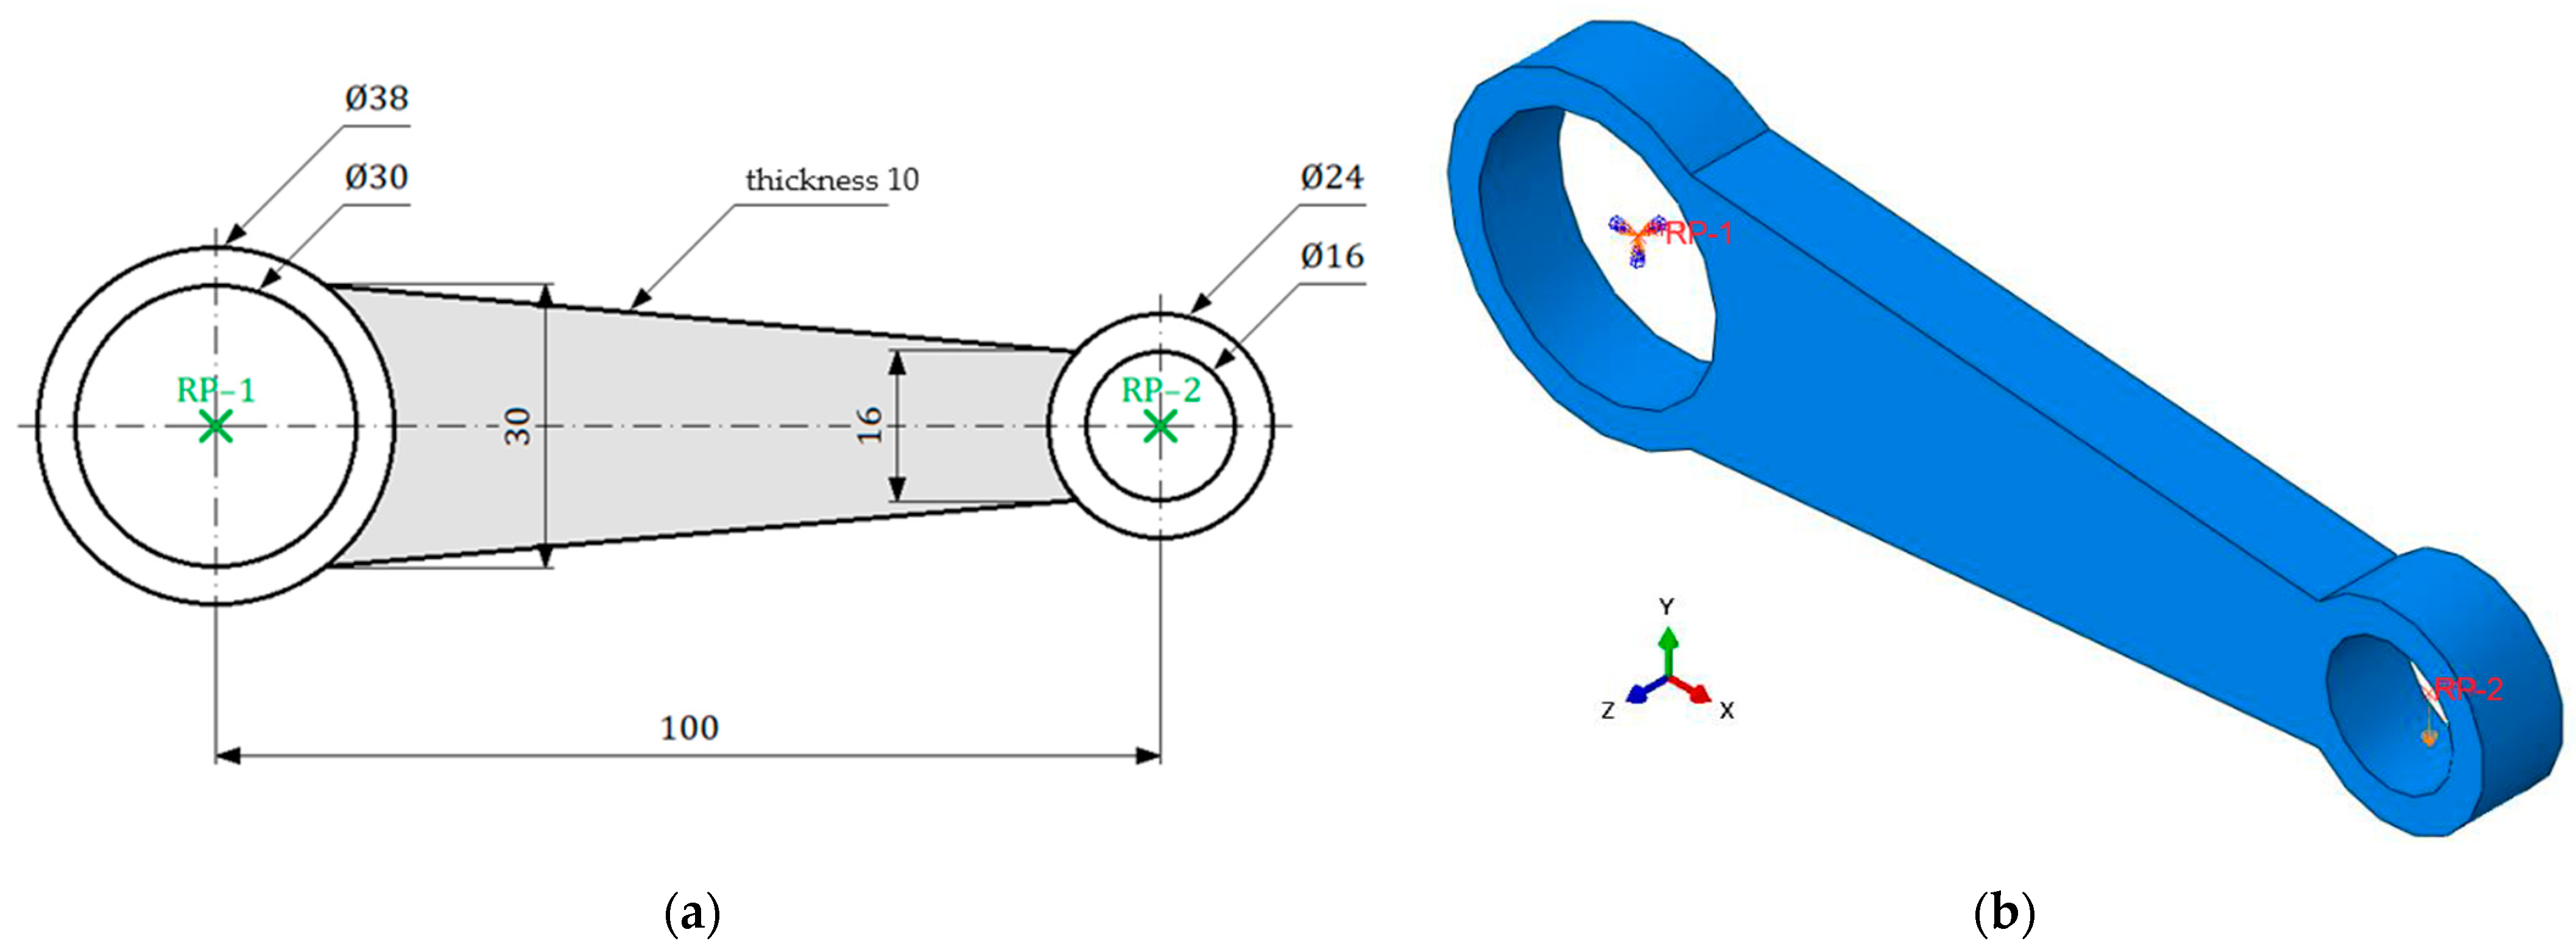
Abaqus allows optimization by the biological growth method also for 3D components. The optimization was performed for a 3D structural element whose boundary conditions are shown in Figure 10a. In this example, the whole model was not optimized but only the gray part rendered in Figure 10a. The same material properties were used for the model: material density ρ = 7850   k g / m 3 , Young’s modulus E = 210   G p a , Poisson’s ratio μ = 0.3 , and yield stress R e = 235   M p a .
Figure 10b shows the defined boundary conditions of the initial design model of the investigated structural element, which was modeled as a 3D model. The boundary conditions were defined for the points R P 1 and R P 2 , which were connected to the inner surface of the holes by a kinematic coupling function. Point R P 1 took away all degrees of freedom for a hole with diameter ϕ 30 mm. At the point R P 2 the force F = 1000   N was defined, which acted in a hole of diameter ϕ 16 mm.
The finite element mesh consisted of hexahedron elements with side length 2.00   m m whose sides were arranged along the contour lines of the design. The element was formed by eight nodes (linear element), with each node having six degrees of freedom. The quadratic element for the 3D model contained 20 nodes, which, although it provided better results, significantly increased the computation time. For this reason, linear elements were chosen for the topological optimization of the 3D component. The finite element model mesh of the initial design of the structural component consisted of 2270 elements and 3366 nodes. For comparison, if the same model were meshed with quadratic elements, we would obtain for 2270 elements up to 12,267 nodes.
Static analysis of the initial design of the 3D structural element is shown in Figure 11, where it can be seen that a maximum stress was σ m a x = 54   M P a . The yield stress of the selected material R e = 235   M p a was located at a sufficient distance from the resulting maximum stress occurring on the loaded structure, even when taking into account computation errors or undesirable effects that were not considered in the model design. Thus, it could be concluded that the investigated structural element was satisfactory for the given loading conditions, which provided us the possibility to optimize its topology in order to lighten the structure.

3.1. Topological Optimization of a 3D Structural Element (SKO Method)

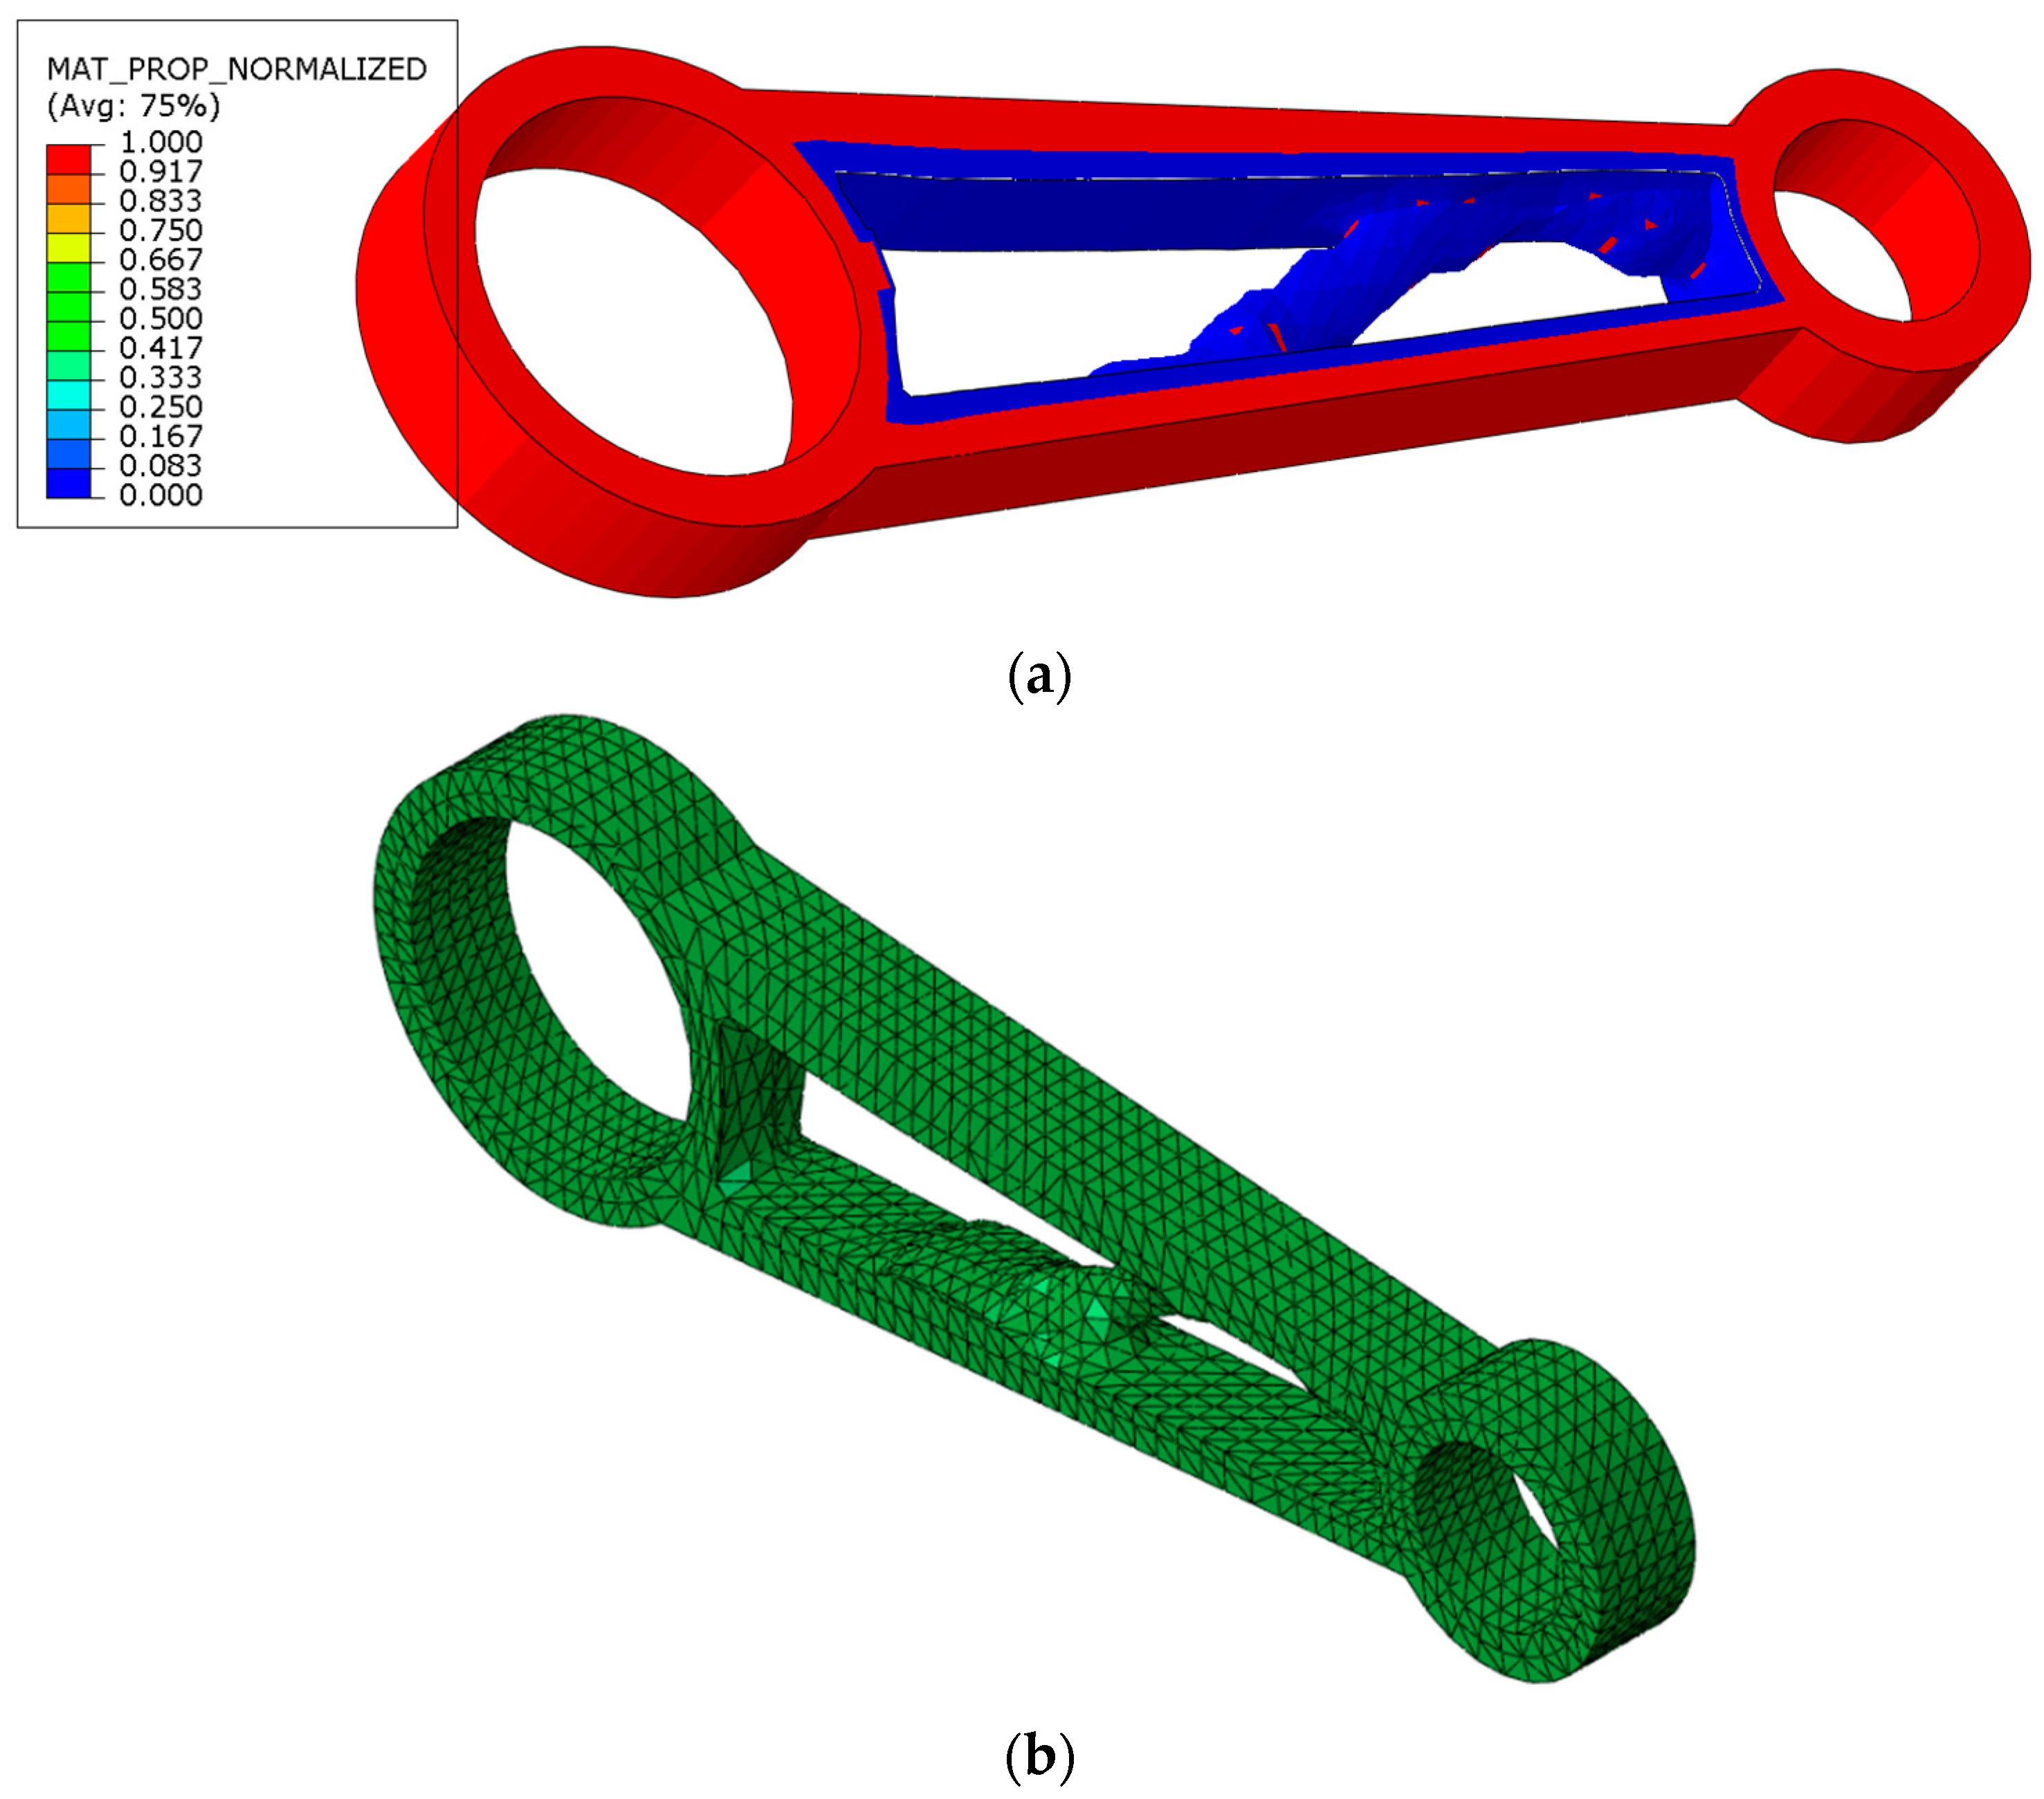
The goal of the topological optimization of the above example (Figure 10) was to minimize the deformation energy of the element, which would lead to an increase in its structural stiffness. Only one optimization constraint was set: the reduction in the design volume by 50 % . In this example, three geometric constraints were also defined: 1. A so-called immobile region whose nodes would not change their position during the topological optimization, i.e., a region for which we were not looking for an optimal topology (the white part of the geometry in Figure 10a); 2. Demold control would ensure obtaining a simpler geometry (creating fewer partitions in the optimized region), which caused it to be more likely that the obtained optimized design would be manufacturable; 3. Symmetry along the plane x y in Figure 10b. The result of the topological optimization of the structural element in the computational cycle n = 15 is shown in Figure 12a.
The mesh of the optimized model was extracted for elements with material density above 20 % . For further computations, the directly extracted mesh with predefined dimensions and element arrangement was used. The only modification of the mesh occurred by manually shifting some nodes into position to obtain smoother design lines. The nodes that were displaced were not at the locations of the stress concentrators, and therefore, their new positions did not have a significant effect on the maximum stresses in the structure. As a rule, after the optimization phase using the programs, the designer still needs to smooth the whole structure and take into account possible technological requirements of the production.
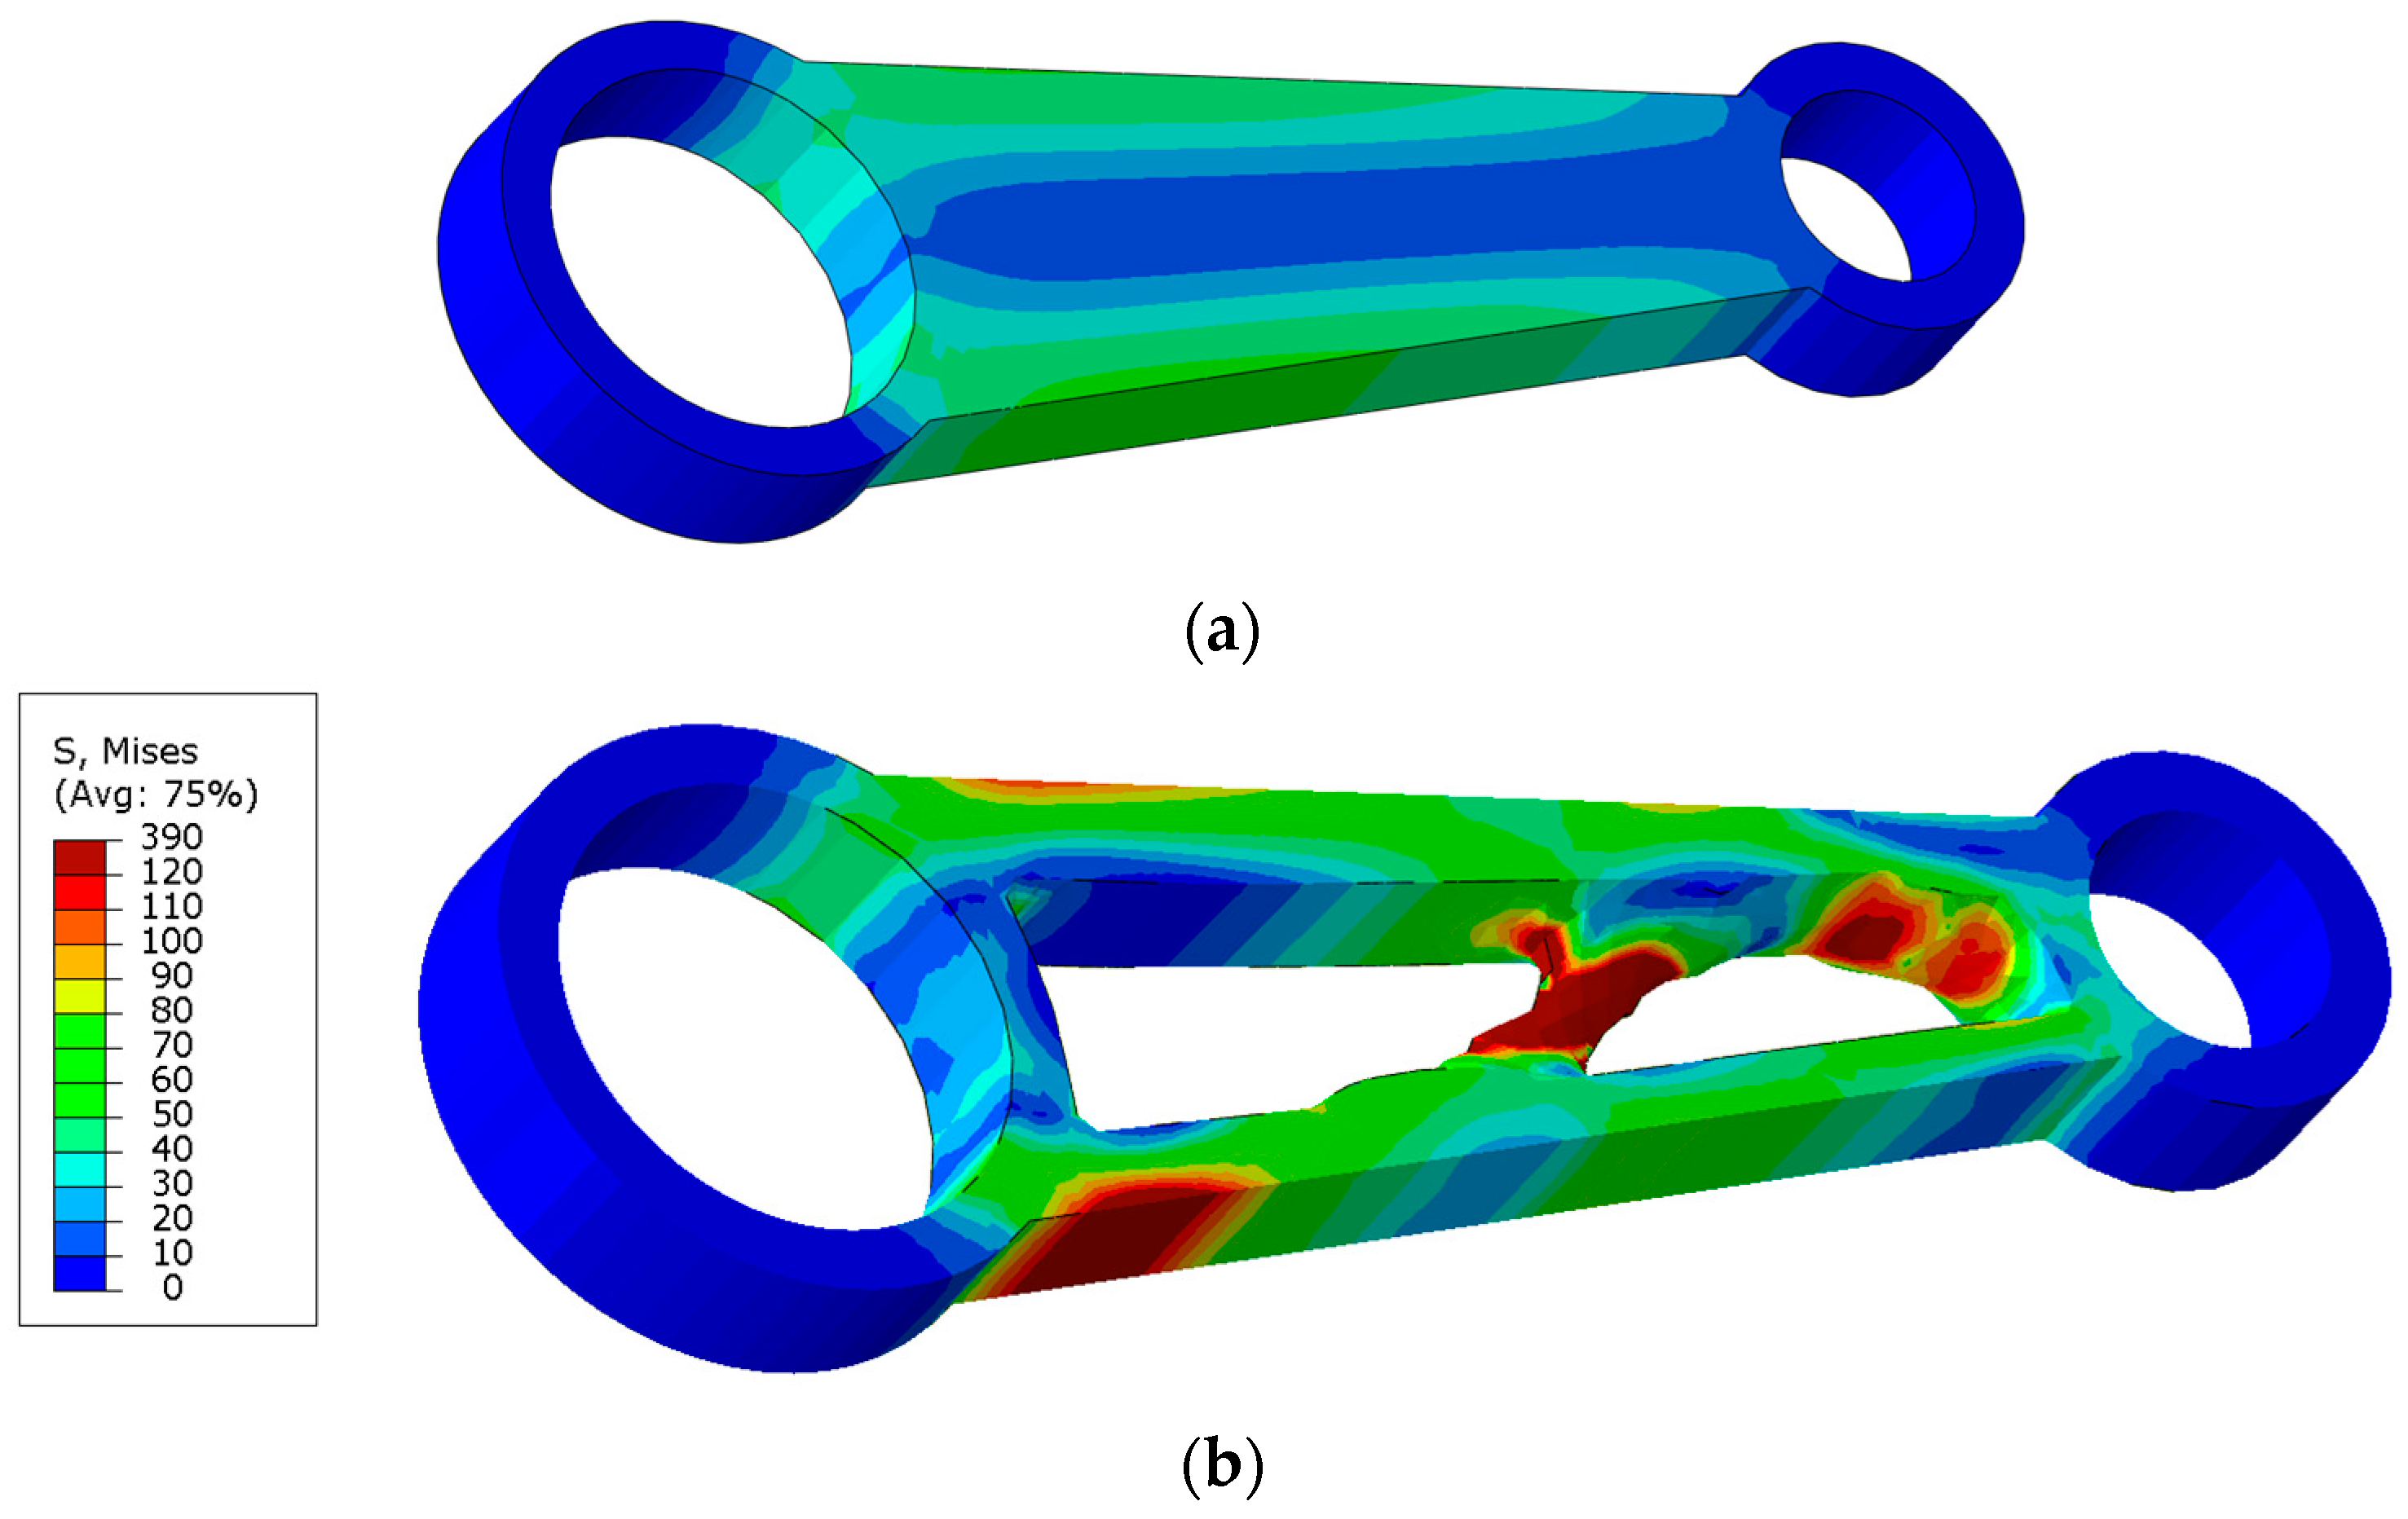
The finite element mesh consisted of tetrahedron elements. An element was made up of 20 nodes (a quadratic element), with each node having six degrees of freedom. The finite element mesh of the model after the topological optimization is shown in Figure 12b. It consisted of 14,279 elements and 23,838 nodes. Figure 13a shows the stress distribution in the structural element before the topological optimization.
The next optimization step was to perform a static analysis under the given load conditions but this time for a model that had already undergone topological optimization. To compare the results with the initial design of the model (Figure 11), we kept the same outputs: the field of equivalent stresses according to von Mises theory (Figure 13b).
In Figure 13b it can be seen that a maximum stress arose for the structural element after the topological optimization, σ m a x = 390   M P a . For a good visualization of the comparison of the results before and after optimization (Figure 13), the upper limit of the colored contours was set to σ = 120   M p a .
A clearer display and comparison of the results of the design element before and after topological optimization is described in Table 1.
From Table 1 it can be read that the main goal of topological optimization was to reduce the weight of the structural element, but at the same time there was an increase in the equivalent stresses. In this case, we achieved a resulting reduction in the mass of the component by 34.62 % and an increase in the equivalent stresses by 622.22 % .

3.2. Shape Optimization of 3D Structural Element (CAO Method)

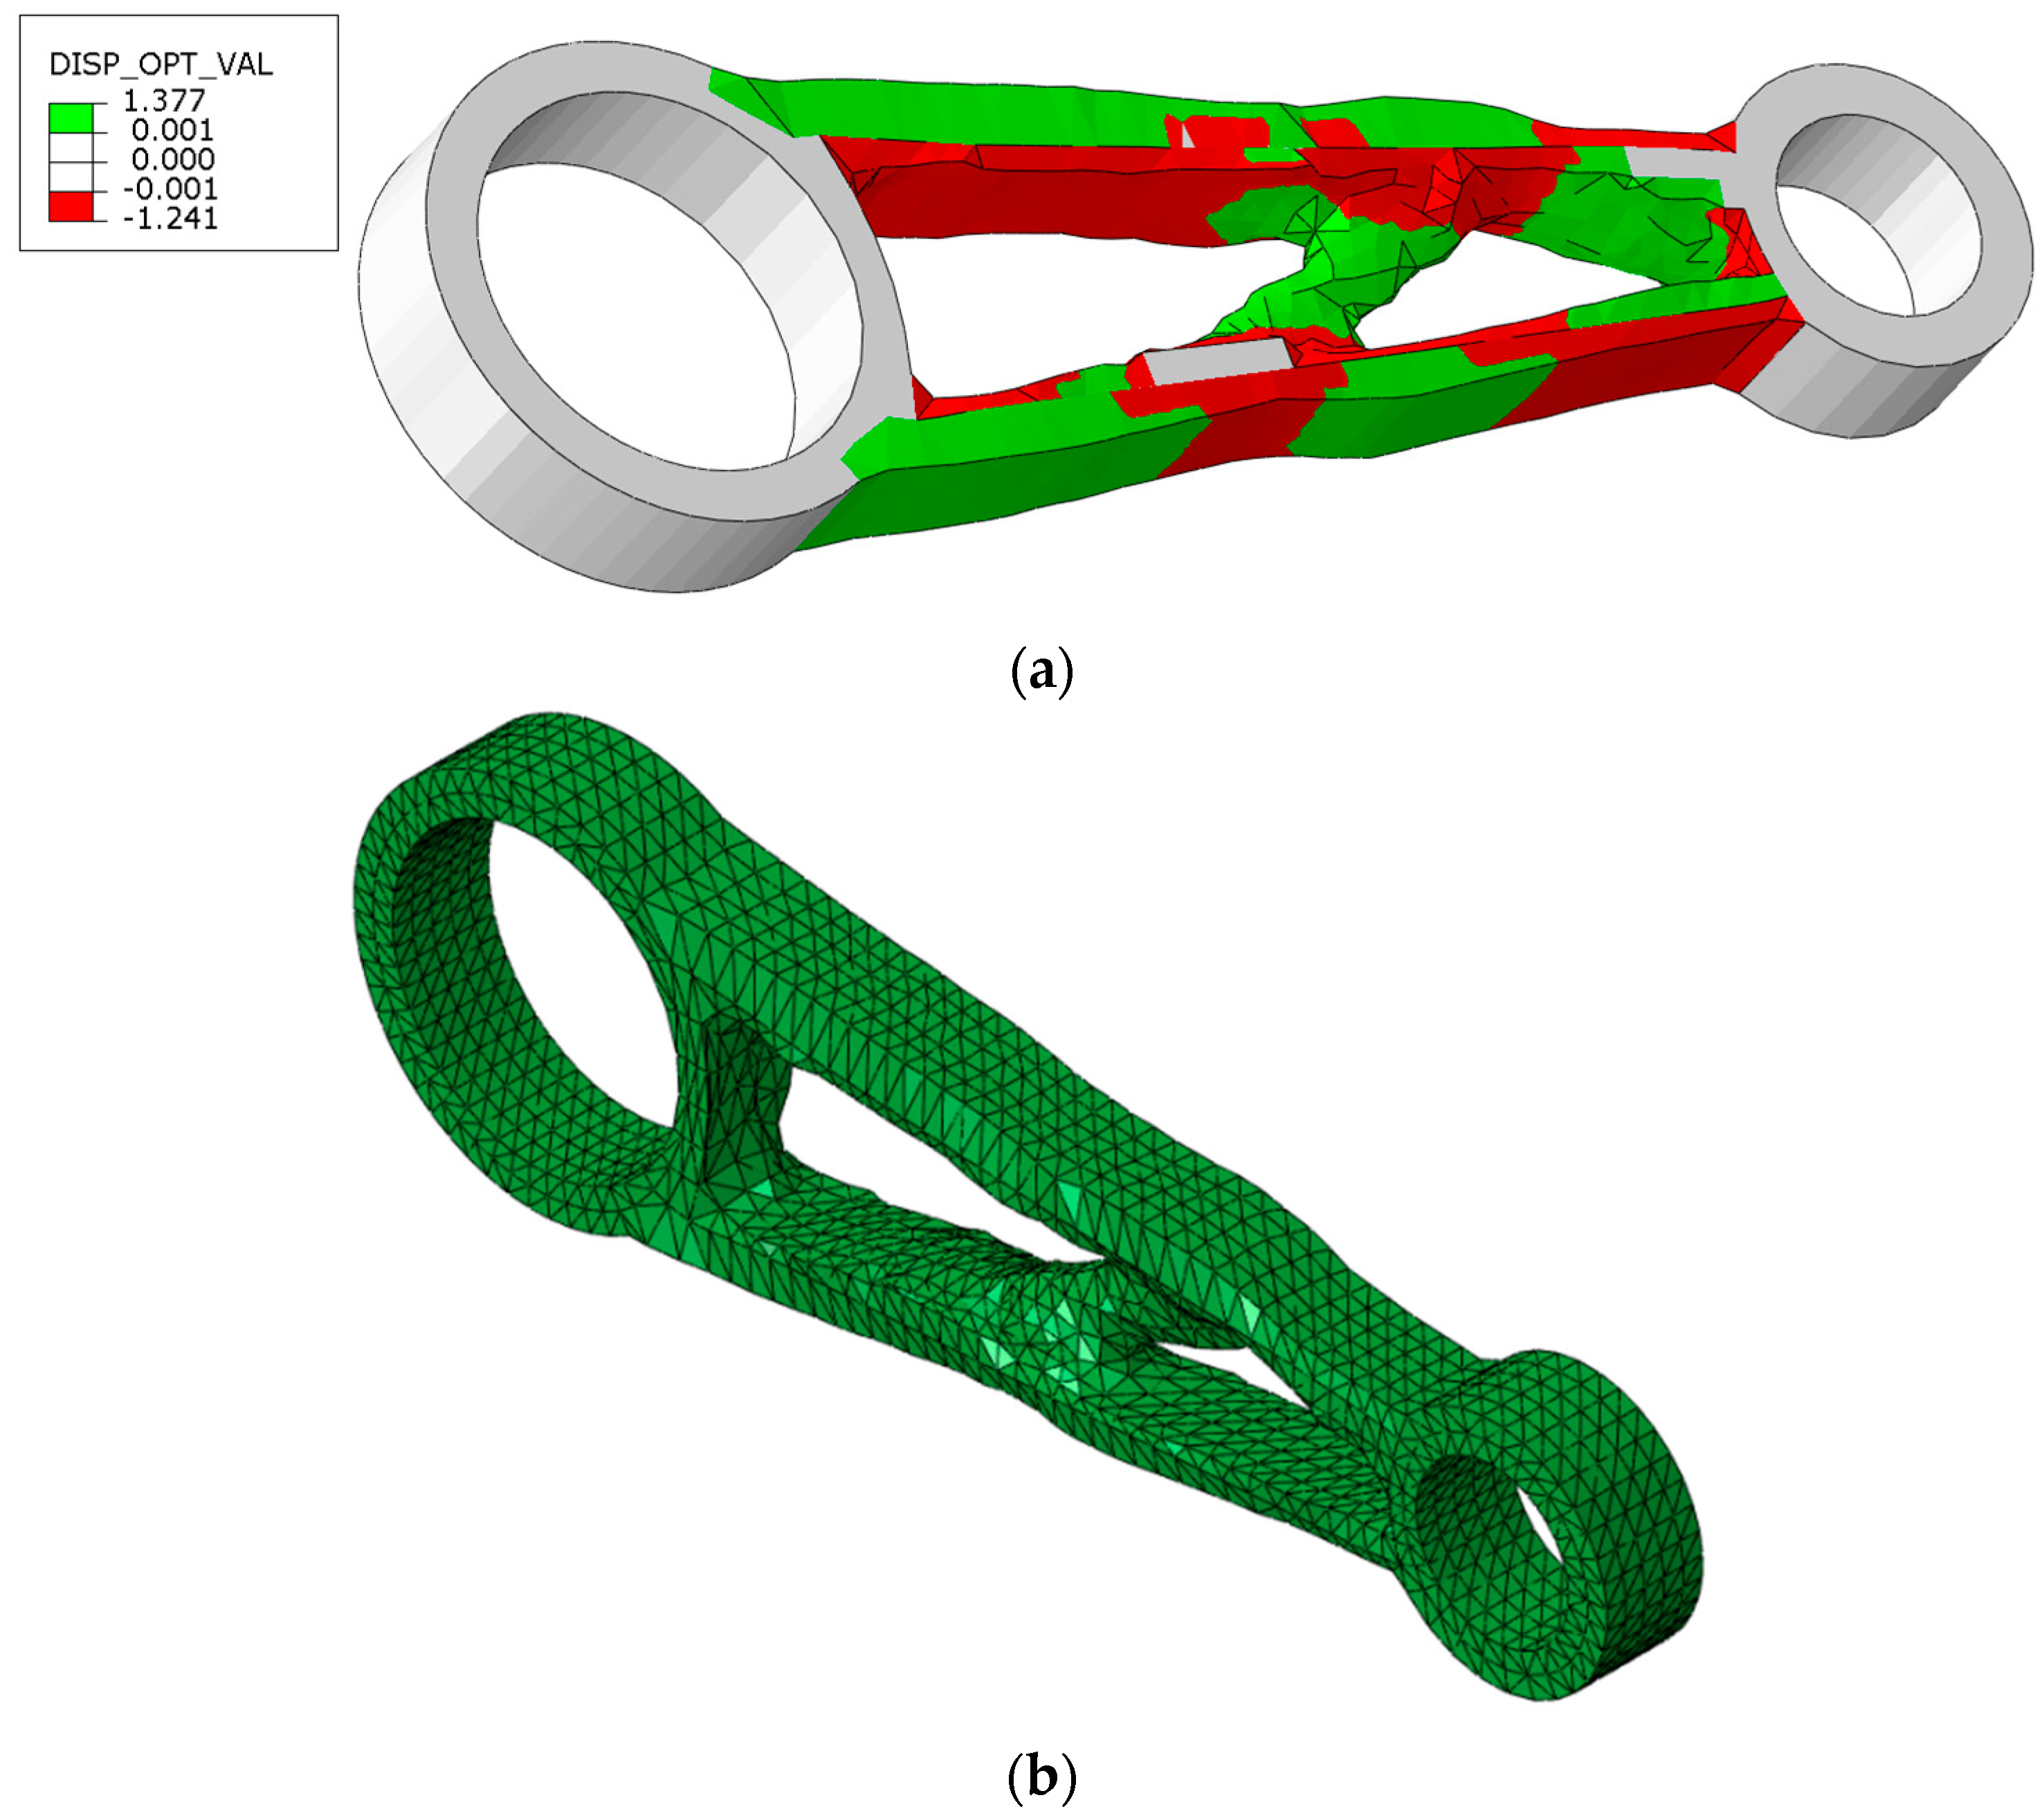
The objective of the shape optimization for the structural element under study was to minimize the maximum stress variations in the design elements. No optimization or geometric constraints were defined in the above example. A model was used for the shape optimization, the mesh of which is shown in Figure 12b. The result of the shape optimization of the structural element in the computational cycle n = 20 is shown in Figure 14a.
In order to perform a static analysis of the structural element after shape optimization, it was necessary to extract its mesh from the results. Also in this case, the directly extracted mesh with predefined dimensions and arrangement of elements was used, with subsequent modification in the form of manually moving some nodes to such a position to obtain smoother design lines. The mesh consisted of tetrahedron elements. An element was made up of 20 nodes (a quadratic element), with each node having six degrees of freedom. The finite element mesh of the model after the shape optimization is shown in Figure 14b. It consisted of 14,385 elements and 23,939 nodes.
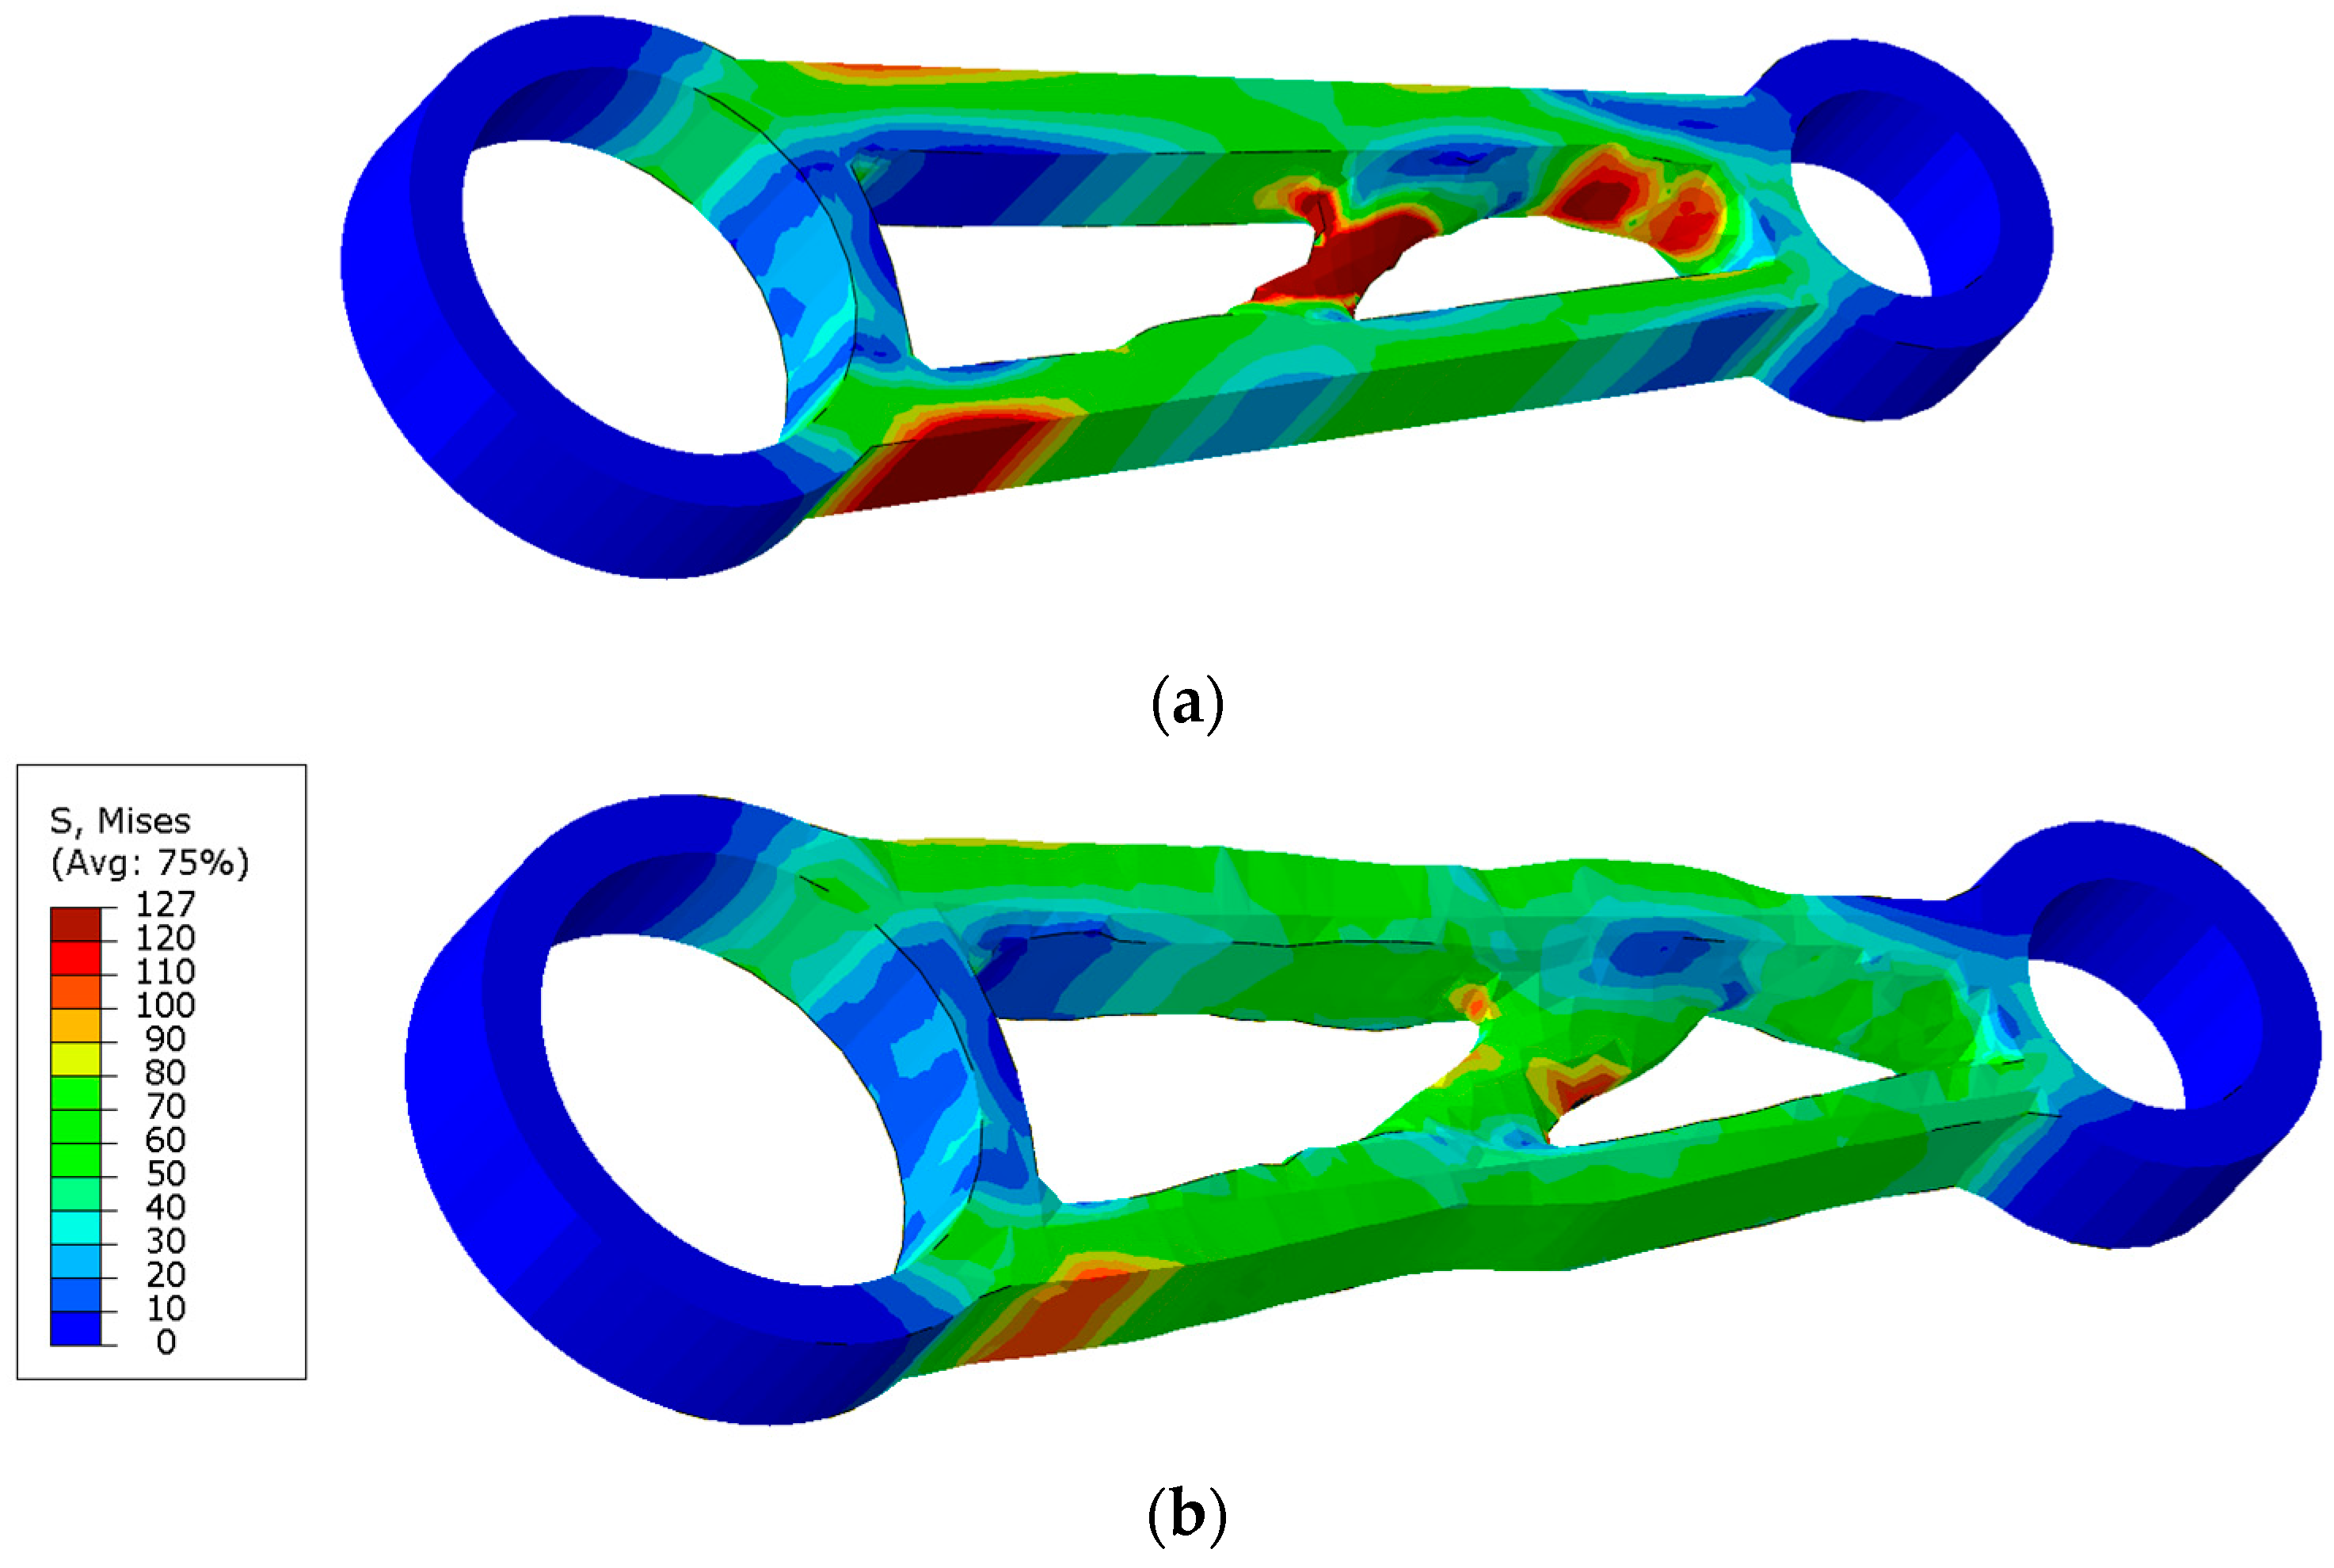
The last step of the optimization by the biological growth method was to perform a static analysis under the given loading conditions but this time for a model that had undergone both topological and shape optimization. To compare the results with those of previous model designs (Figure 11 and Figure 13b), we kept the same outputs: the field of equivalent stresses according to von Mises theory (Figure 15b).
In Figure 15b it can be seen that after the shape optimization, the maximum stress dropped to σ m a x = 127   M P a . The comparison of the stress distribution before and after the shape optimization is shown in Figure 15. For a good visualization, the upper limit of the color contours was set to 120   M p a .
From Table 2 it can be deduced that the main objective of shape optimization was to reduce the maximum stress or to distribute the equivalent stress more homogeneously along the contour lines of the design. The maximum stress in the investigated design element was reduced by the shape optimization by 67.44 % . In Figure 15b it can be seen that most of the optimized region (the gray part in Figure 10a) was loaded with a stress in the range σ = 50 ÷ 70   M P a . After the shape optimization, the maximum stress ( σ m a x = 127   M P a ) was significantly closer to this interval, and thus, the stress in the structure was distributed more homogeneously than is the case in Figure 13b. In this case, the shape optimization had a minimal effect on the change in mass (or volume). The mass of the component increased by 0.84 % , confirming the claim that the shape optimization had no direct effect on it and its change was random in nature.
From Figure 15, it is clear that the optimized shape still needs to be modified by the designer for production purposes in order to smooth out surface irregularities that create local indentations that are unsuitable from aesthetic, production, and user points of view. In this process it is necessary to smooth the surface so that material is not removed from the part and any sharp edges are not created causing new indentations with consequent stress concentration.

4. Discussion of Optimization Results

A clearer display and comparison of the results of the 3D structural element before and after optimization by the biological growth method is described in Table 3.
From Table 3 it can be read that by using the optimization by the biological growth method, we obtained an optimized design with reduced mass, but in this case, there was an increase in the maximum stress compared with the initial design. The main reason for the reduction in the mass of the component was the topological optimization. Thanks to it, we reduced the volume of the design element by 34.62 % (Table 1). Subsequently, by applying the shape optimization, the weight of the structural element was further finely adjusted, which ultimately implied a change in weight from the original m = 0.182   k g to the resulting value m = 0.120   k g . This represented an overall weight reduction of 34.07 % .
The maximum stress after topological optimization increased up to 622.22 % (Table 1), but by performing the shape optimization, we were able to reduce its value partially. The resulting value of the maximum stress in this case increased by 135.19 % from the original σ m a x = 54   M P a to the final value σ m a x = 127   M P a . This was a relatively high increase in the maximum stress compared with the initial design, but its value was still far enough away from the yield strength R e = 235   M P a of the material used. The optimized component could therefore be considered satisfactory for the given loading conditions. It is now up to the designer to decide whether the lightening obtained for a given component is significant enough to replace the initial design with an optimized version.

5. Conclusions

The aim of this work was to perform the optimization by biological growth method. The biological growth optimization method consisted of two main methods: the SKO method (topological optimization) and the CAO method (shape optimization). The introduction describes the methods of solving optimization problems, which are divided into analytical and numerical, and also the principle that guides the computation when running topological (SKO) and shape (CAO) optimizations. Furthermore, the problem of changing the Young’s modulus in the SKO method was mentioned, which can be varied in three different ways, with respect to the computed stress, the incremental stress, and the reference stress.
The optimization of the 3D structural element was performed on the selected structural element using the biological growth method. The structural elements initially consisted of a very simple and indicative design for which a structural analysis was performed. Subsequently, by running the topological optimization (SKO method), we obtained a lightweight design of the structure, which, however, negatively affected the maximum stresses. In order to reduce the maximum stresses and to make the stress distribution in the structural element more homogeneous, shape optimization (CAO method) was performed, by which we obtained the final optimized design of the structural element. At the end of the work, the values of the different designs were compared, especially the change in mass (or volume) and maximum stress between the different optimization methods.
It is clear that the above examples for the application of BGM and the SKO and CAO processes have their shortcomings and limitations. These are, for example, related to the fact that the sensitivity of the process to the whole domain has not been taken into account when removing low-stressed elements.
The importance, contribution, and usefulness of the application examples lie in the fact that they present and put into context the most important aspects that can significantly influence both the structural element optimization process itself and the results obtained by it. The purpose of the presented application examples is to highlight the understanding of the nature and role of the SKO and CAO processes as partial BMG processes. At the same time, the contradictory nature of the obtained adjustments and results, the type and degree of interaction, etc., are also pointed out. In particular, this concerns the opposite tendencies of changes in the characteristics of strength or peaks (extremes) and stress distribution on one hand and the volume or mass of the object on the other hand.

Author Contributions

I.D.—conceptualization, supervision, writing, and visualization; J.B.—draft preparation, computation, and project administration; J.K.—methodology and validation; P.S.—draft preparation and conceptualization; M.F.—methodology and validation. All authors have read and agreed to the published version of the manuscript.

Funding

This work was supported by the Slovak Research and Development Agency under the grant projects VEGA No. 1/0342/24 and VEGA 1/0152/24, as well as KEGA No. 005TUKE-4/2024.

Institutional Review Board Statement

Not applicable.

Informed Consent Statement

Not applicable.

Data Availability Statement

Data is contained within the article.

Conflicts of Interest

The authors declare no conflicts of interest.

References

  1. Michell, A.G.M. LVIII. The limits of economy of material in frame-structures. Lond. Edinb. Dublin Philos. Mag. J. Sci. 1904, 8, 589–597. [Google Scholar] [CrossRef]
  2. Lewiński, T.; Sokół, T.; Graczykowski, C. Michell Structures; Springer: Berlin/Heidelberg, Germany, 2018. [Google Scholar]
  3. Christensen, P.W.; Klarbring, A. An Introduction to Structural Optimization; Springer Science & Business Media: Dordrecht, The Netherlands, 2008. [Google Scholar]
  4. Tang, J.; Fu, C.; Mi, C.; Liu, H. An interval sequential linear programming for nonlinear robust optimization problems. Appl. Math. Model. 2022, 107, 256–274. [Google Scholar] [CrossRef]
  5. Goldberg, D.E. Genetic Algorithms in Search, Optimization and Machine Learning, 1st ed.; Pearson: London, UK, 1989. [Google Scholar]
  6. Mattheck, C.; Burkhardt, S. A New Method of Structural Shape Optimization Based on Biological Growth. Int. J. Fatigue 1990, 12, 185–190. [Google Scholar] [CrossRef]
  7. Delyová, I.; Frankovský, P.; Bocko, J.; Trebuňa, P.; Živčák, J.; Schürger, B.; Janigová, S. Sizing and Topology Optimization of Trusses Using Genetic Algorithm. Materials 2021, 14, 715. [Google Scholar] [CrossRef] [PubMed]
  8. Kaveh, A.; Zaerreza, A. Structural Optimization Using Shuffled Shepherd Meta-Heuristic Algorithm: Extensions and Applications; Springer Nature: Cham, Switzerland, 2023. [Google Scholar]
  9. Xie, Y.M.; Steven, G.P. Evolutionary Structural Optimization; Springer: London, UK, 1997; ISBN 13:978-1-4471-1250-1. [Google Scholar]
  10. Mattheck, C.; Kubler, H. Wood—The Internal Optimization of Trees; Springer: Berlin/Heidelberg, Germany, 1997. [Google Scholar]
  11. Huang, X.; Xie, M. Evolutionary Topology Optimization of Continuum Structures: Methods and Applications; John Wiley & Sons: Hoboken, NJ, USA, 2010. [Google Scholar]
  12. Zhu, J.; Gao, T. Topology Optimization in Engineering Structure Design; Elsevier: Amsterdam, The Netherlands, 2016. [Google Scholar]
  13. Querin, O.M.; Victoria, M.; Gordoa, C.A.; Ansola, R.; Martí, P. Topology Design Methods for Structural Optimization; Butterworth-Heinemann: Oxford, UK, 2017. [Google Scholar]
  14. Gao, J.; Gao, L.; Xiao, M. Isogeometric Topology Optimization. Methods, Applications and Implementations; Springer: Berlin/Heidelberg, Germany, 2022. [Google Scholar]
  15. Li, Y.; Chang, T.; Kong, W.; Wu, F.; Kong, X. Topological Optimization of Bi-Directional Progressive Structures with Dynamic Stress Constraints under Aperiodic Load. Appl. Sci. 2024, 14, 322. [Google Scholar] [CrossRef]
  16. Jiang, Y.; Zhan, K.; Xia, J.; Zhao, M. Topology Optimization for Minimum Compliance with Material Volume and Buckling Constraints under Design-Dependent Loads. Appl. Sci. 2023, 13, 646. [Google Scholar] [CrossRef]
  17. Chen, L.; Zhang, H.; Wang, W.; Zhang, Q. Topology Optimization Based on SA-BESO. Appl. Sci. 2023, 13, 4566. [Google Scholar] [CrossRef]
  18. Pham-Truong, T.; Kawamura, Y.; Okada, T. Bisection Constraint Method for Multiple-Loading Conditions in Structural Topology Optimization. Appl. Sci. 2023, 13, 13005. [Google Scholar] [CrossRef]
  19. Fu, Y.; Li, L.; Hu, Y. An Efficient and Robust Topology Optimization Method for Thermoelastically Damped Microresonators. Appl. Sci. 2023, 13, 8811. [Google Scholar] [CrossRef]
  20. Polak, J.; Nowak, M. From Structural Optimization Results to Parametric CAD Modeling—Automated, Skeletonization-Based Truss Recognition. Appl. Sci. 2023, 13, 5670. [Google Scholar] [CrossRef]
  21. Yago, D.; Cante, J.; Lloberas-Valls, O.; Oliver, J. Topology Optimization Methods for 3D Structural Problems: A Comparative Study. Arch. Comput. Methods Eng. 2022, 29, 1525–1567. [Google Scholar] [CrossRef]
  22. Ambrosi, D.; Amar, B.M.; Cyron, C.J.; De Simone, A.; Goriely, A.; Humphrey, J.D.; Kuhl, E. Growth and Remodelling of Living Tissues: Perspectives, Challenges and Opportunities. J. R. Soc. Interface 2019, 16, 20190233. [Google Scholar] [CrossRef] [PubMed]
  23. Hu, T.; Ding, X.; Shen, L.; Zhang, H. Improved Adaptive Growth Method of Stiffeners for Three-dimensional Box Structures with Respect to Natural Frequencies. Comput. Struct. 2020, 239, 106330. [Google Scholar] [CrossRef]
  24. Dong, X.H.; Ding, X.H.; Xiong, M. Optimal Layout of Internal Stiffeners for Threedimensional Box Structures Based on Natural Branching Phenomena. Eng. Optim. 2018, 51, 590–607. [Google Scholar] [CrossRef]
  25. Baumgartner, A.; Harzheim, L.; Mattheck, C. SKO (soft kill option): The Biological Way to Find an Optimum Structure Topology. Int. J. Fatigue 1992, 14, 387–393. [Google Scholar] [CrossRef]
  26. Mattheck, C.; Bethge, K. The Structural Optimization of Trees. Naturwissenschaften 1998, 85, 1–10. [Google Scholar] [CrossRef]
  27. Mattheck, C.; Bethge, K. Mechanical Optimization in Nature, Principles of. In Encyclopedia of Materials: The Science and Technology; Elsevier: Amsterdam, The Netherlands, 2001; pp. 5247–5250. Available online: https://www.sciencedirect.com/science/article/abs/pii/B0080431526009141 (accessed on 23 November 2023).
  28. Corriou, J.-P. Numerical Methods of Optimization. Numer. Methods Optim. 2021, 187, 505–574. [Google Scholar]
  29. Mattheck, C.; Teschner, M.; Schӓfer, J. Mechanical Control of Root Growth: A Computer Simulation. J. Theor. Biol. 1997, 184, 261–269. [Google Scholar] [CrossRef]
  30. Mattheck, C. Teacher Tree: The Evolution of Notch Shape Optimization from Complex to Simple. Eng. Fract. Mech. 2006, 73, 1732–1742. [Google Scholar] [CrossRef]
  31. Quint, M. Introduction to Shape (CAO) & Topology (SKO) Optimization Derived from the Growing of Trees. Adaptive Biological Growth. NAFEMS-Seminar: 2001. Available online: http://www.xperteez.de/publikationen/docs/NAFEMS/NAFEMS_2001.pdf (accessed on 20 November 2023).
  32. Kara, A.; Eksin, I.; Mugan, A. Parameter and Topology Optimization of Structures in the Frequency Domain under Nevanlinna–Pick Interpolation Constraints. Appl. Sci. 2024, 14, 1278. [Google Scholar] [CrossRef]
  33. İnce, E.G.; Özkal, F.M. Optimization of Structural Steel Used in Concrete-Encased Steel Composite Columns via Topology Optimization. Appl. Sci. 2024, 14, 1170. [Google Scholar] [CrossRef]
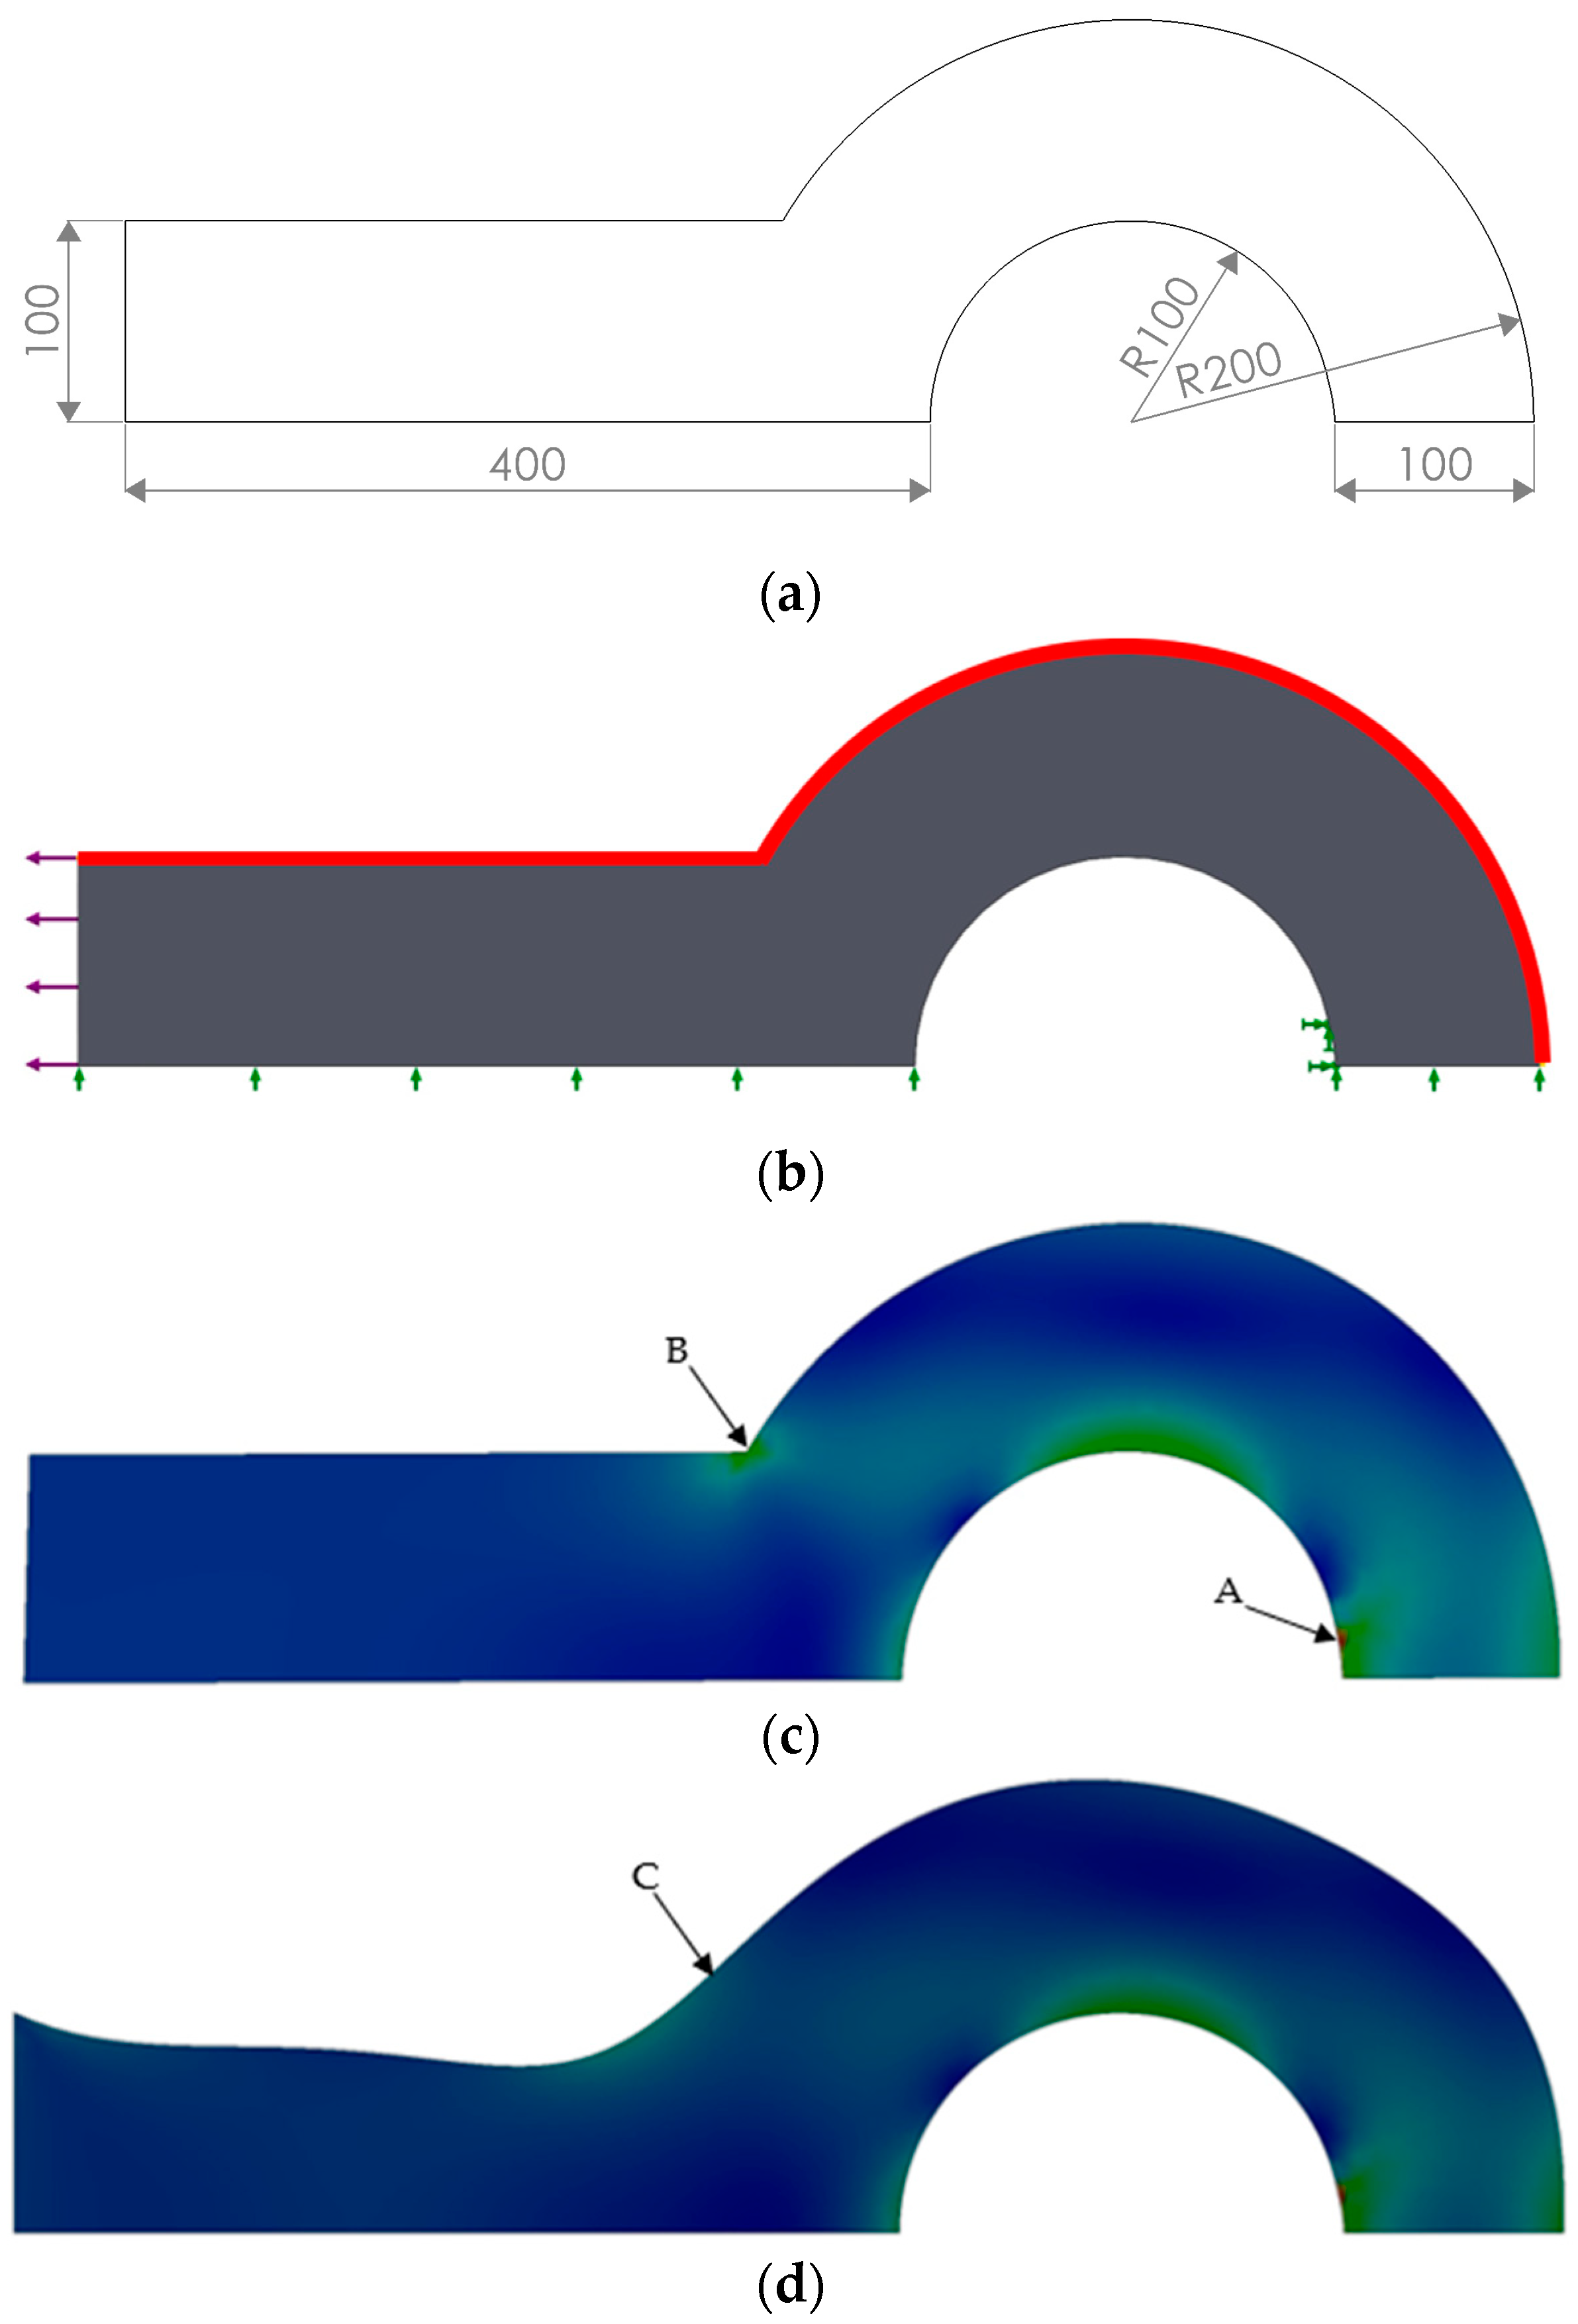
Figure 1. Pull rod (a) dimensions, (b) load and boundary conditions for simulation and optimization, (c) distribution of equivalent von Mises stresses before optimization, and (d) distribution of equivalent von Mises stresses after optimization.
Applsci 14 06245 g001
Figure 2. (a) The 2D structural element and (b) structural element model with boundary conditions.
Applsci 14 06245 g002
Figure 3. Static analysis of the initial design model of the structural element: (a) von Mises field of equivalent stresses and (b) field of resultant displacements.
Applsci 14 06245 g003
Figure 4. Topological optimization at n = 20 computation cycles.
Applsci 14 06245 g004
Figure 5. (a) Structural element after topological optimization. (b) Finite element mesh of the structural element model after topological optimization.
Applsci 14 06245 g005
Figure 6. Static analysis of the 2D structural element model after topological optimization: (a) von Mises field of equivalent stresses and (b) field of resultant displacements.
Applsci 14 06245 g006
Figure 7. Shape optimization in n = 20 cycles.
Applsci 14 06245 g007
Figure 8. (a) Structural element after shape optimization, (b) Finite element mesh of the 2D structural element model after shape optimization.
Applsci 14 06245 g008
Figure 9. Static analysis of the 2D structural element model after shape optimization: (a) von Mises equivalent stress field and (b) resultant displacement field.
Applsci 14 06245 g009
Figure 10. Boundary conditions of (a) 3D structural element and (b) initial design model of 3D structural element.
Applsci 14 06245 g010
Figure 11. Field of equivalent stresses according to von Mises theory [ M p a ] for the initial design model of a 3D structural element.
Applsci 14 06245 g011
Figure 12. (a) Material density for the 3D structural element during topological optimization. (b) Finite element mesh of the 3D structural element model after topological optimization.
Applsci 14 06245 g012
Figure 13. Comparison of stress distribution of 3D structural element (a) before topological optimization and (b) after topological optimization.
Applsci 14 06245 g013
Figure 14. (a) Motion of 3D structural element nodes during shape optimization. (b) Finite element mesh of 3D structural element model after shape optimization.
Applsci 14 06245 g014
Figure 15. Comparison of stress distribution of 3D structural element (a) before shape optimization and (b) after shape optimization.
Applsci 14 06245 g015
Table 1. Comparison of 3D structural element results before and after topological optimization.
Parameters of the Design Element The Difference The Difference in %
Before Topological Optimization After Topological Optimization
σ m a x = 54   M p a σ m a x = 390   M p a σ m a x = + 336   M p a + 622.22
m = 0.182   k g m = 0.119   k g m = 0.063   k g 34.62
Table 2. Comparison of 3D structural element results before and after shape optimization.
Parameters of the Design Element The Difference The Difference in %
Before Shape Optimization After Shape Optimization
σ m a x = 390   M P a σ m a x = 127   M P a σ m a x = 263   M P a 67.44
m = 0.119   k g m = 0.120   k g m = + 0.001   k g + 0.84
Table 3. Comparison of 3D structural element results before and after optimization by biological growth method (BGM).
Parameters of the Design Element The Difference The Difference in %
Before BGM Optimization After BGM Optimization
σ m a x = 54   M P a σ m a x = 127   M P a σ m a x = + 73   M P a + 135.19
m = 0.182   k g m = 0.120   k g m = 0.062   k g 34.07
Disclaimer/Publisher’s Note: The statements, opinions and data contained in all publications are solely those of the individual author(s) and contributor(s) and not of MDPI and/or the editor(s). MDPI and/or the editor(s) disclaim responsibility for any injury to people or property resulting from any ideas, methods, instructions or products referred to in the content.