Review

Effect of the Inter-Ring Delay Time on Rock Fragmentation: Field Tests at the Underground Mine

1
School of Geology and Mining Engineering, Xinjiang University, Urumqi 830046, China
2
School of Resources and Safety Engineering, Central South University, Changsha 410083, China
3
North Blasting Technology Co., Ltd., Beijing 100097, China
*
Author to whom correspondence should be addressed.
Appl. Sci. 2024, 14(14), 6372; https://doi.org/10.3390/app14146372
Submission received: 17 June 2024 / Revised: 15 July 2024 / Accepted: 19 July 2024 / Published: 22 July 2024

Abstract

:
The effect of inter-ring delay time (IRDT) on rock fragmentation in the tunnel excavation blasting was studied at the Xinjiang Beizhan Iron Mine, China, to improve the rock fragmentation and optimize the blast design. Blasting tests were conducted with an IRDT of 50, 100, 150, 200, and 500 ms; each adjacent ring had an equal IRDT, and two replicate tests were conducted. The blasting plan with IRDT of 100 ms was the original blasting plan used in the mine. Two optimized blasting plans were proposed and implemented based on the experimental results, along with a control experiment using the original blasting plan. The fragment size of each blast test was measured and analyzed by the block-analyzed software. Both collision theoretical and field tests indicated that the IRDT plays an important role in rock fragmentation and that as the IRDT increases, the degree of rock fragmentation increases first and then decreases. For example, the fragment sizes X20, X50, and X80 showed an increase followed by a decrease; the percentage of large fragments (1-P750) showed a decline followed by a rise; the percentage of small fragments P25 showed an increase followed by a decline. The blasting plan with an IRDT of 150 ms had the most optimal rock fragmentation effect, with the lowest percentage of large fragments, the highest percentage of small fragments, and the smallest average fragment size of X50. Furthermore, the two optimized blasting plans demonstrated better control over blasting costs and rock fragmentation compared to the original blasting plan.

1. Introduction

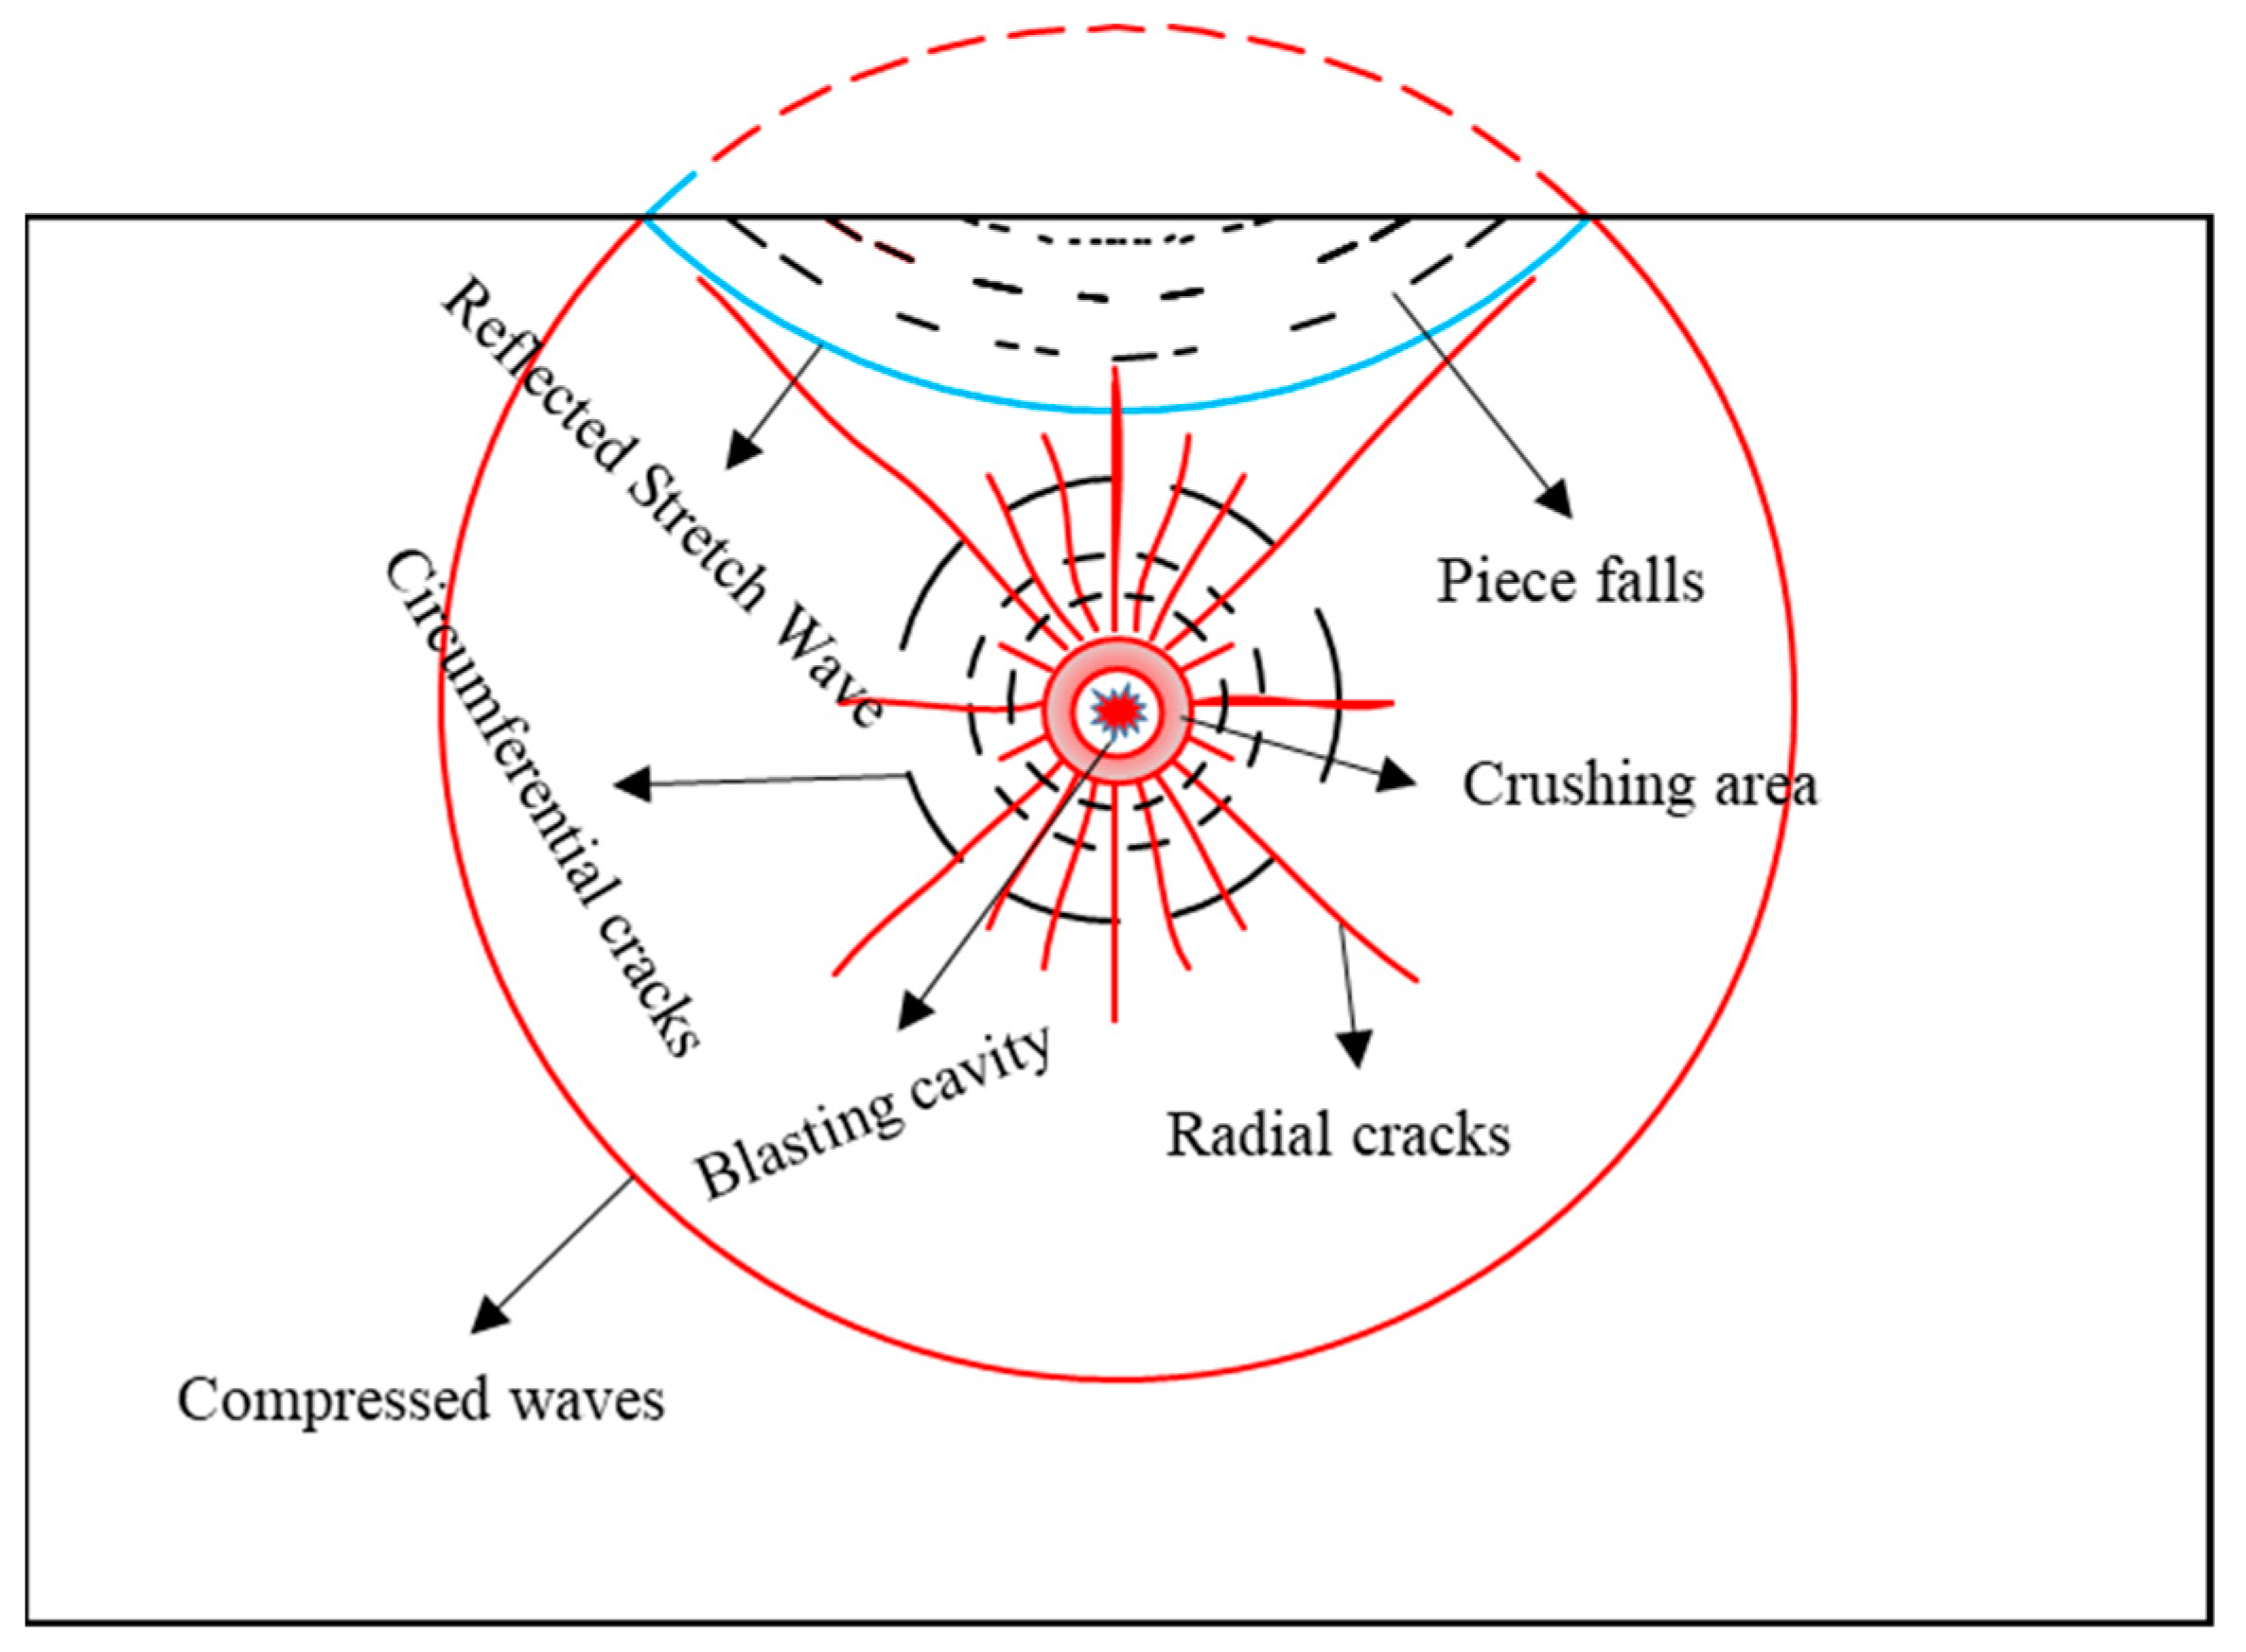
Rock blasting fragmentation is the compression, shear, and tensile failure, gas expansion, and quasi-explosion caused by explosion stress the results of the combined effects of static splitting, and so on. Meanwhile, rock blasting is a complex dynamic process, involving high-speed detonation of explosives, dynamic expansion of explosion cavity, nonlinear deformation of rock under explosion load, and so on. Taking the explosive explosion in infinite rock mass as an example, the process of blasting rock breaking is mainly divided into three stages: the first stage is the radial compression stage of explosion stress wave after explosive explosion; the second stage is the stage of spallation and crack propagation induced by reflected wave; and the third stage is the gas wedge action and throwing action stage of explosive gas. The schematic diagram of blasting rock breaking is shown in Figure 1. The degree of rock fragmentation plays a crucial role in evaluating blast effectiveness, as better fragmentation can enhance downstream processes such as loading and transportation [1,2]. Additionally, in mining operations, the degree of rock fragmentation can also impact grinding, crushing, and ore recovery [3,4] (pp. 411–414). Therefore, many scholars have studied how to control rock fragmentation. Based on previous research, Zhang classified factors that affect rock fragmentation into three categories: Rock, Explosive and initiator, and Energy distribution and efficiency [3] (pp. 414–415). Relevant research indicates that delay time can affect the distribution and efficiency of explosive energy, thus controlling rock fragmentation [5]. In the analysis of the degree of crushing of underground mined ores, the following computer programs and methods are currently in common use: numerical simulation software like FLAC3D 7.0, UDEC 7.0, 3DEC 7.0, etc. Numerical simulation can assist us in predicting and evaluating the impact of blasting on the quality of ore. By accurately simulating the propagation of blast waves within the ore body, it is possible to estimate the degree of ore fragmentation and distribution caused by blasting, thereby forecasting the dilution of the ore. Furthermore, numerical simulation can also assess the impact of blasting on the stability of the surrounding rock, thereby reducing losses and enhancing the efficiency and safety of mining operations. It can simulate the crushing process of underground mining ores and to simulate the mechanical behavior and damage patterns of rocks; image analysis techniques like Unet, RestNet, and other deep learning algorithms to semantically segment the ore, and then identify and measure the lumpiness of the ore; WipFrag SOLO lumpiness real-time monitoring and analysis system to monitor ore lumpiness quickly, accurately, and in real-time, and analyze it based on historical data to optimize the milling process; software CASRock, developed by Wuhan Institute of Geotechnics, Chinese Academy of Sciences, is used to analyze the fracture process of engineered rock bodies, simulating fine-scale fracture mechanisms and macroscopic equivalent mechanical responses. In terms of rock fragmentation, it is commonly believed that delay time affects the distribution and efficiency of explosive energy through stress waves, free surfaces, and collisions. Regarding stress waves, Rossmanith and Kouzniak used stress wave theory to describe how positive effects of stress wave interaction between two blast holes can be achieved with short delay times, improving rock fragmentation [6,7]. Vanbrabant and Espinosa pointed out that the optimal delay time should cause longitudinal wave particle velocities to increase, and the results of the field tests showed an increase in the average fragment size of nearly 50% [8]. It is theoretically feasible to improve rock fragmentation by generating better stress wave interaction through short delay times; however, many researchers have not been able to improve rock fragmentation based on this approach. Cho simulated step blasting with five delay times (0, 100, 500, 1000, and 2000 microseconds), and the results showed that simple stress interactions did not affect rock fragmentation [9]. Sjöberg and Yi, based on numerical simulation results, do not support the idea that short delay times can significantly improve rock fragmentation through stress wave interaction [10,11,12]. Johansson and Ouchterlony conducted a series of detailed small-scale tests, and the results showed no significant differences or improvements in fragmentation compared to the absence of shock wave interaction when the delay was within the range of interaction time [13]. Regarding free faces, Shi proposed that long-delay blasting could produce new free faces for the next detonation hole, increasing rock fragmentation [14]. Zhang pointed out that larger delay times are generally used in blast engineering to provide good free faces for the next row [3] (p. 327). In terms of collisions, it is commonly believed that the optimal delay time should allow for the fragment velocity of the latter blasting hole to be greater than that of the former blasting hole, to strengthen the collision and supplement fragmentation.
The above research is mainly limited to open-pit blasting, analyzing the impact of short delay times between holes on rock fragmentation from the perspective of stress superposition. There is not much literature analyzing the impact of delay time on fragmentation from the perspectives of free surfaces and collisions. Additionally, most research has focused on short delay times between holes, and there is limited research on delay times between rings (rows). Especially in underground mine tunnel excavation blasting, due to the presence of only one free surface in the tunnel and the confinement effect of rocks, longer IRDTs are usually used. However, there has not been a deeper study of the IRDT, so it is necessary to conduct research on the effect of IRDTs on rock fragmentation. In this paper, digital electronic detonators were used to study the inter-ring delay blasting in the Beizhan iron mine, and the effect of IRDTs on rock fragmentation was summarized.

2. Mine Condition

The Beizhan Iron Mine is an underground iron mine located 160 km away in the 327° direction from Xinjiang’s Hejing County. The deposit is located at the eastern end of the Aulal metallogenic belt on the Tarim Plate. The lithology of the ore rocks is dominated by chloridized silica, magnetized silica, and crystalline tuff, with their rock mechanics parameters shown in Table 1. The metal minerals of the ore are magnetite, followed by pyrite and magnetic pyrite, with small amounts of sphalerite and chalcopyrite. According to the statistical results of the RQD values of drill holes, most rocks in the mine area have poor to medium integrity, and the rock quality grade is III to IV.
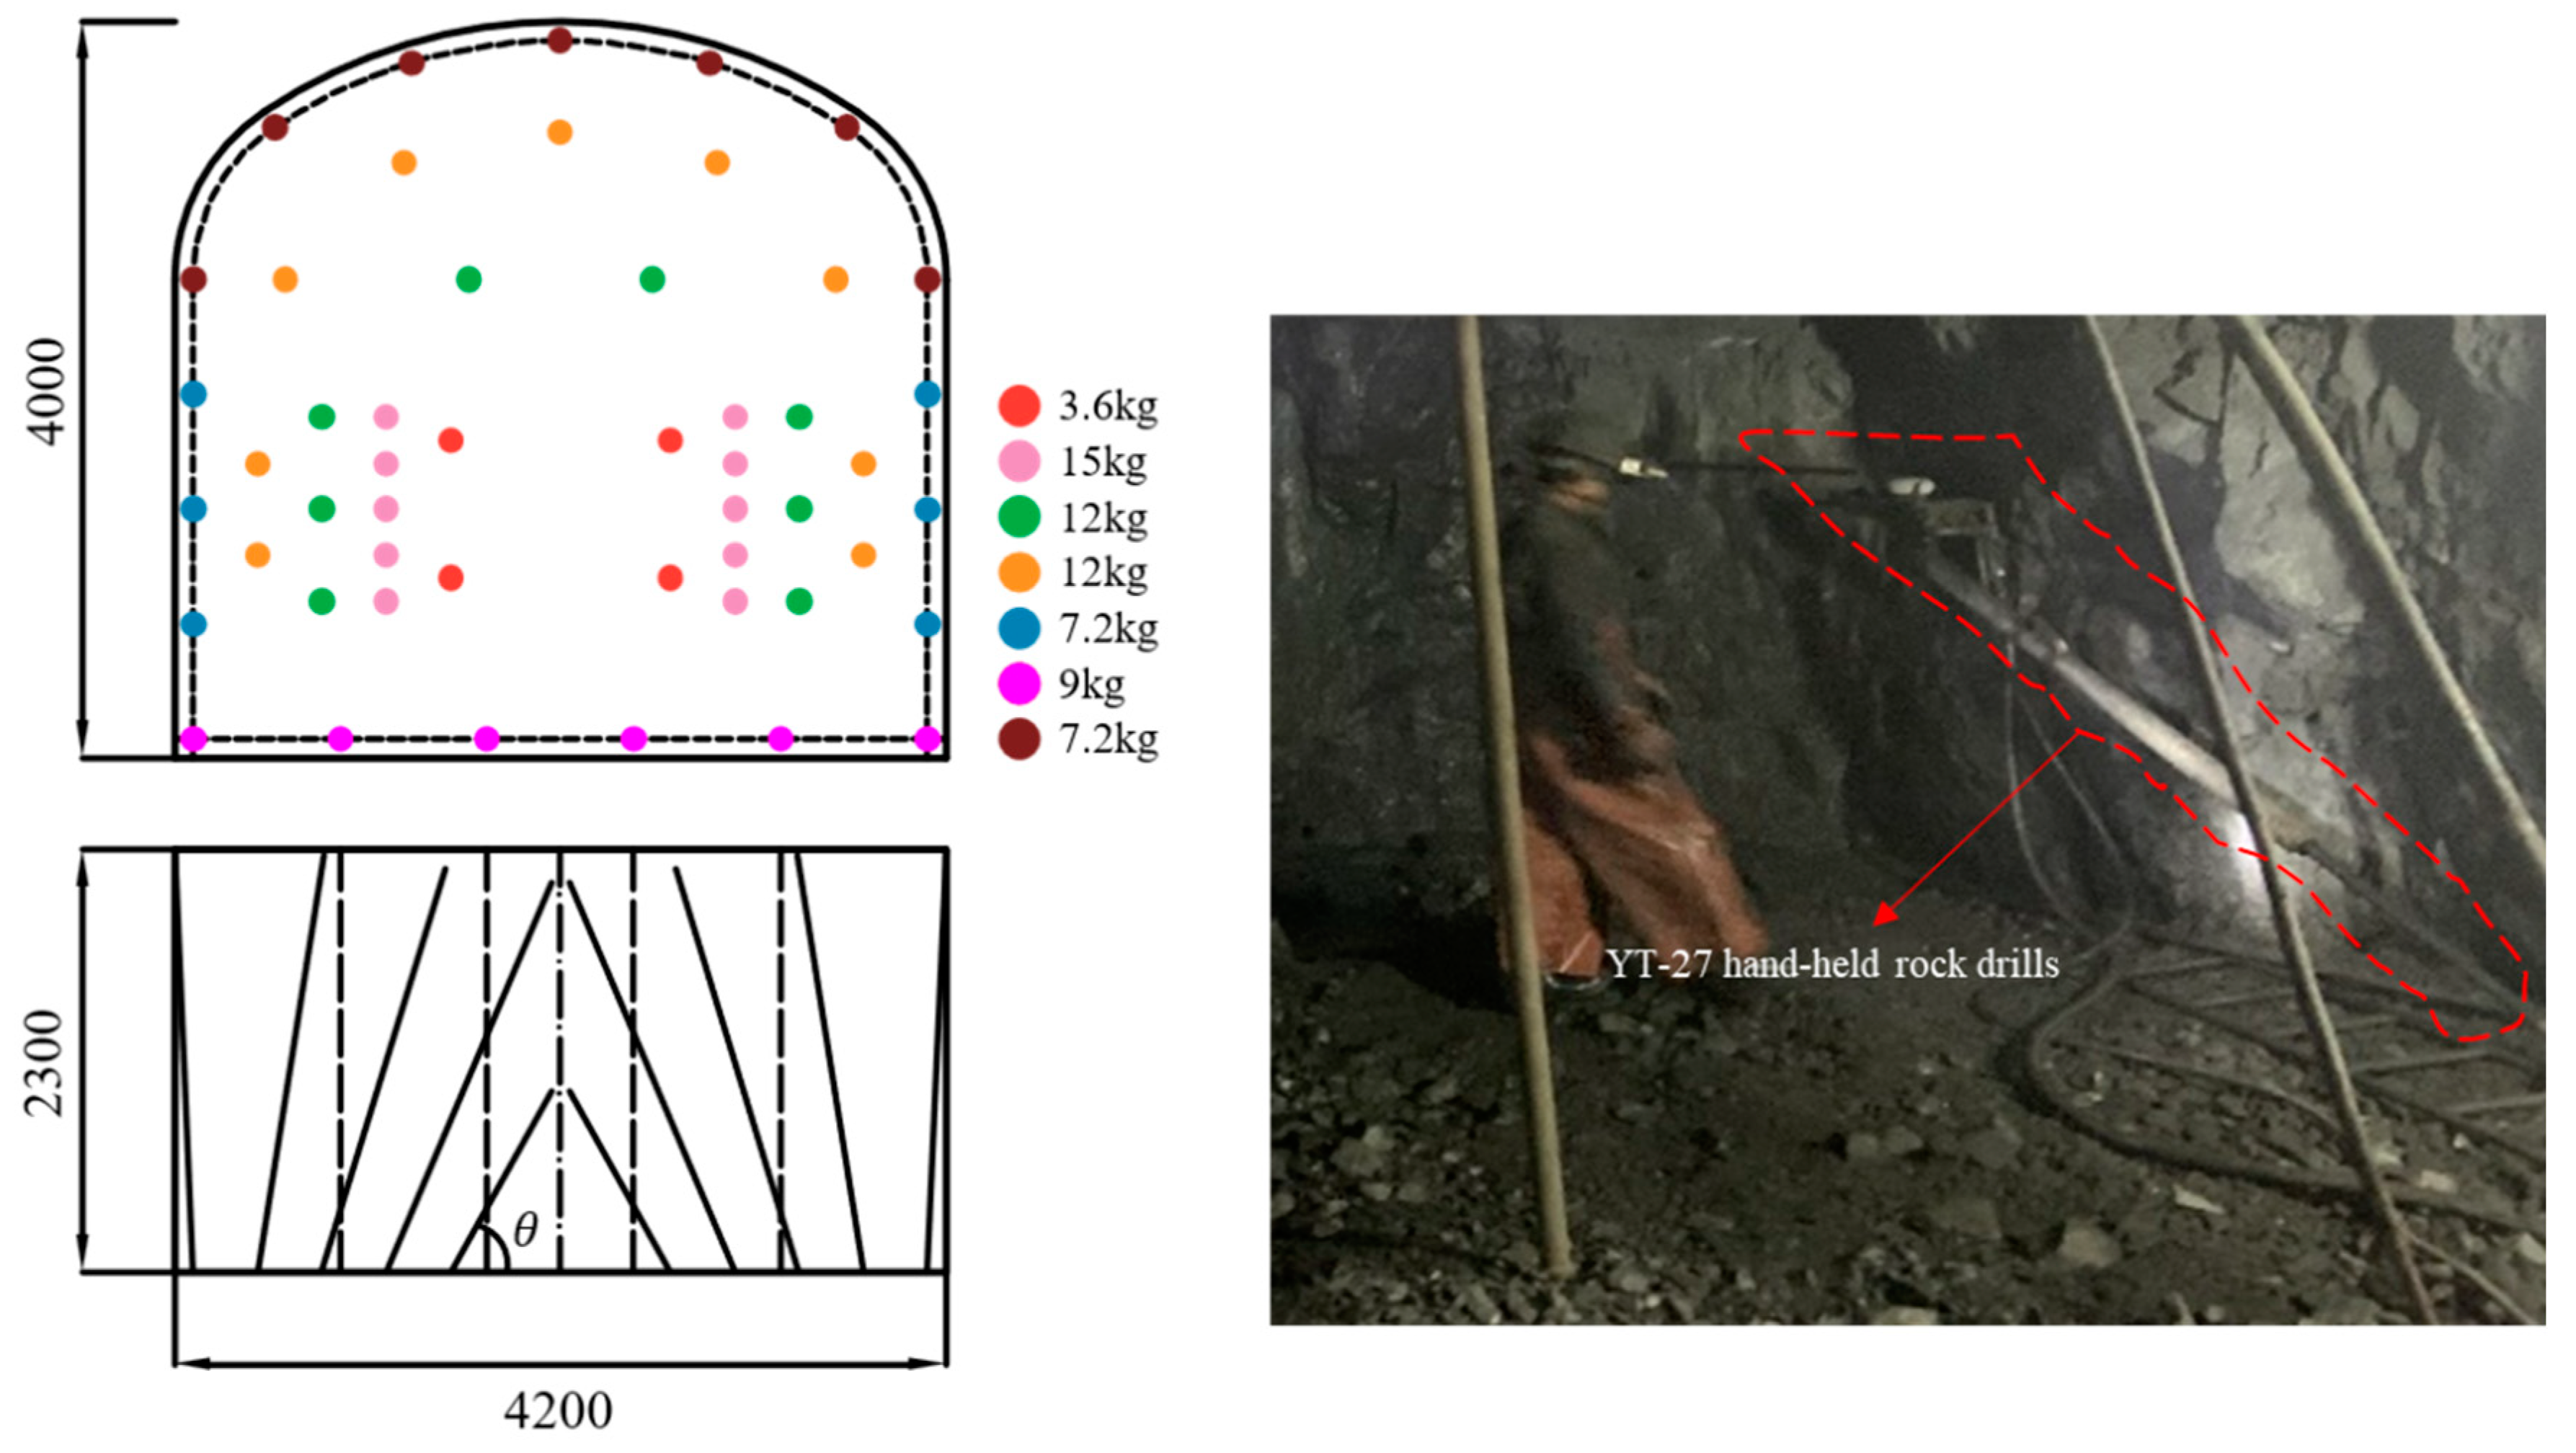
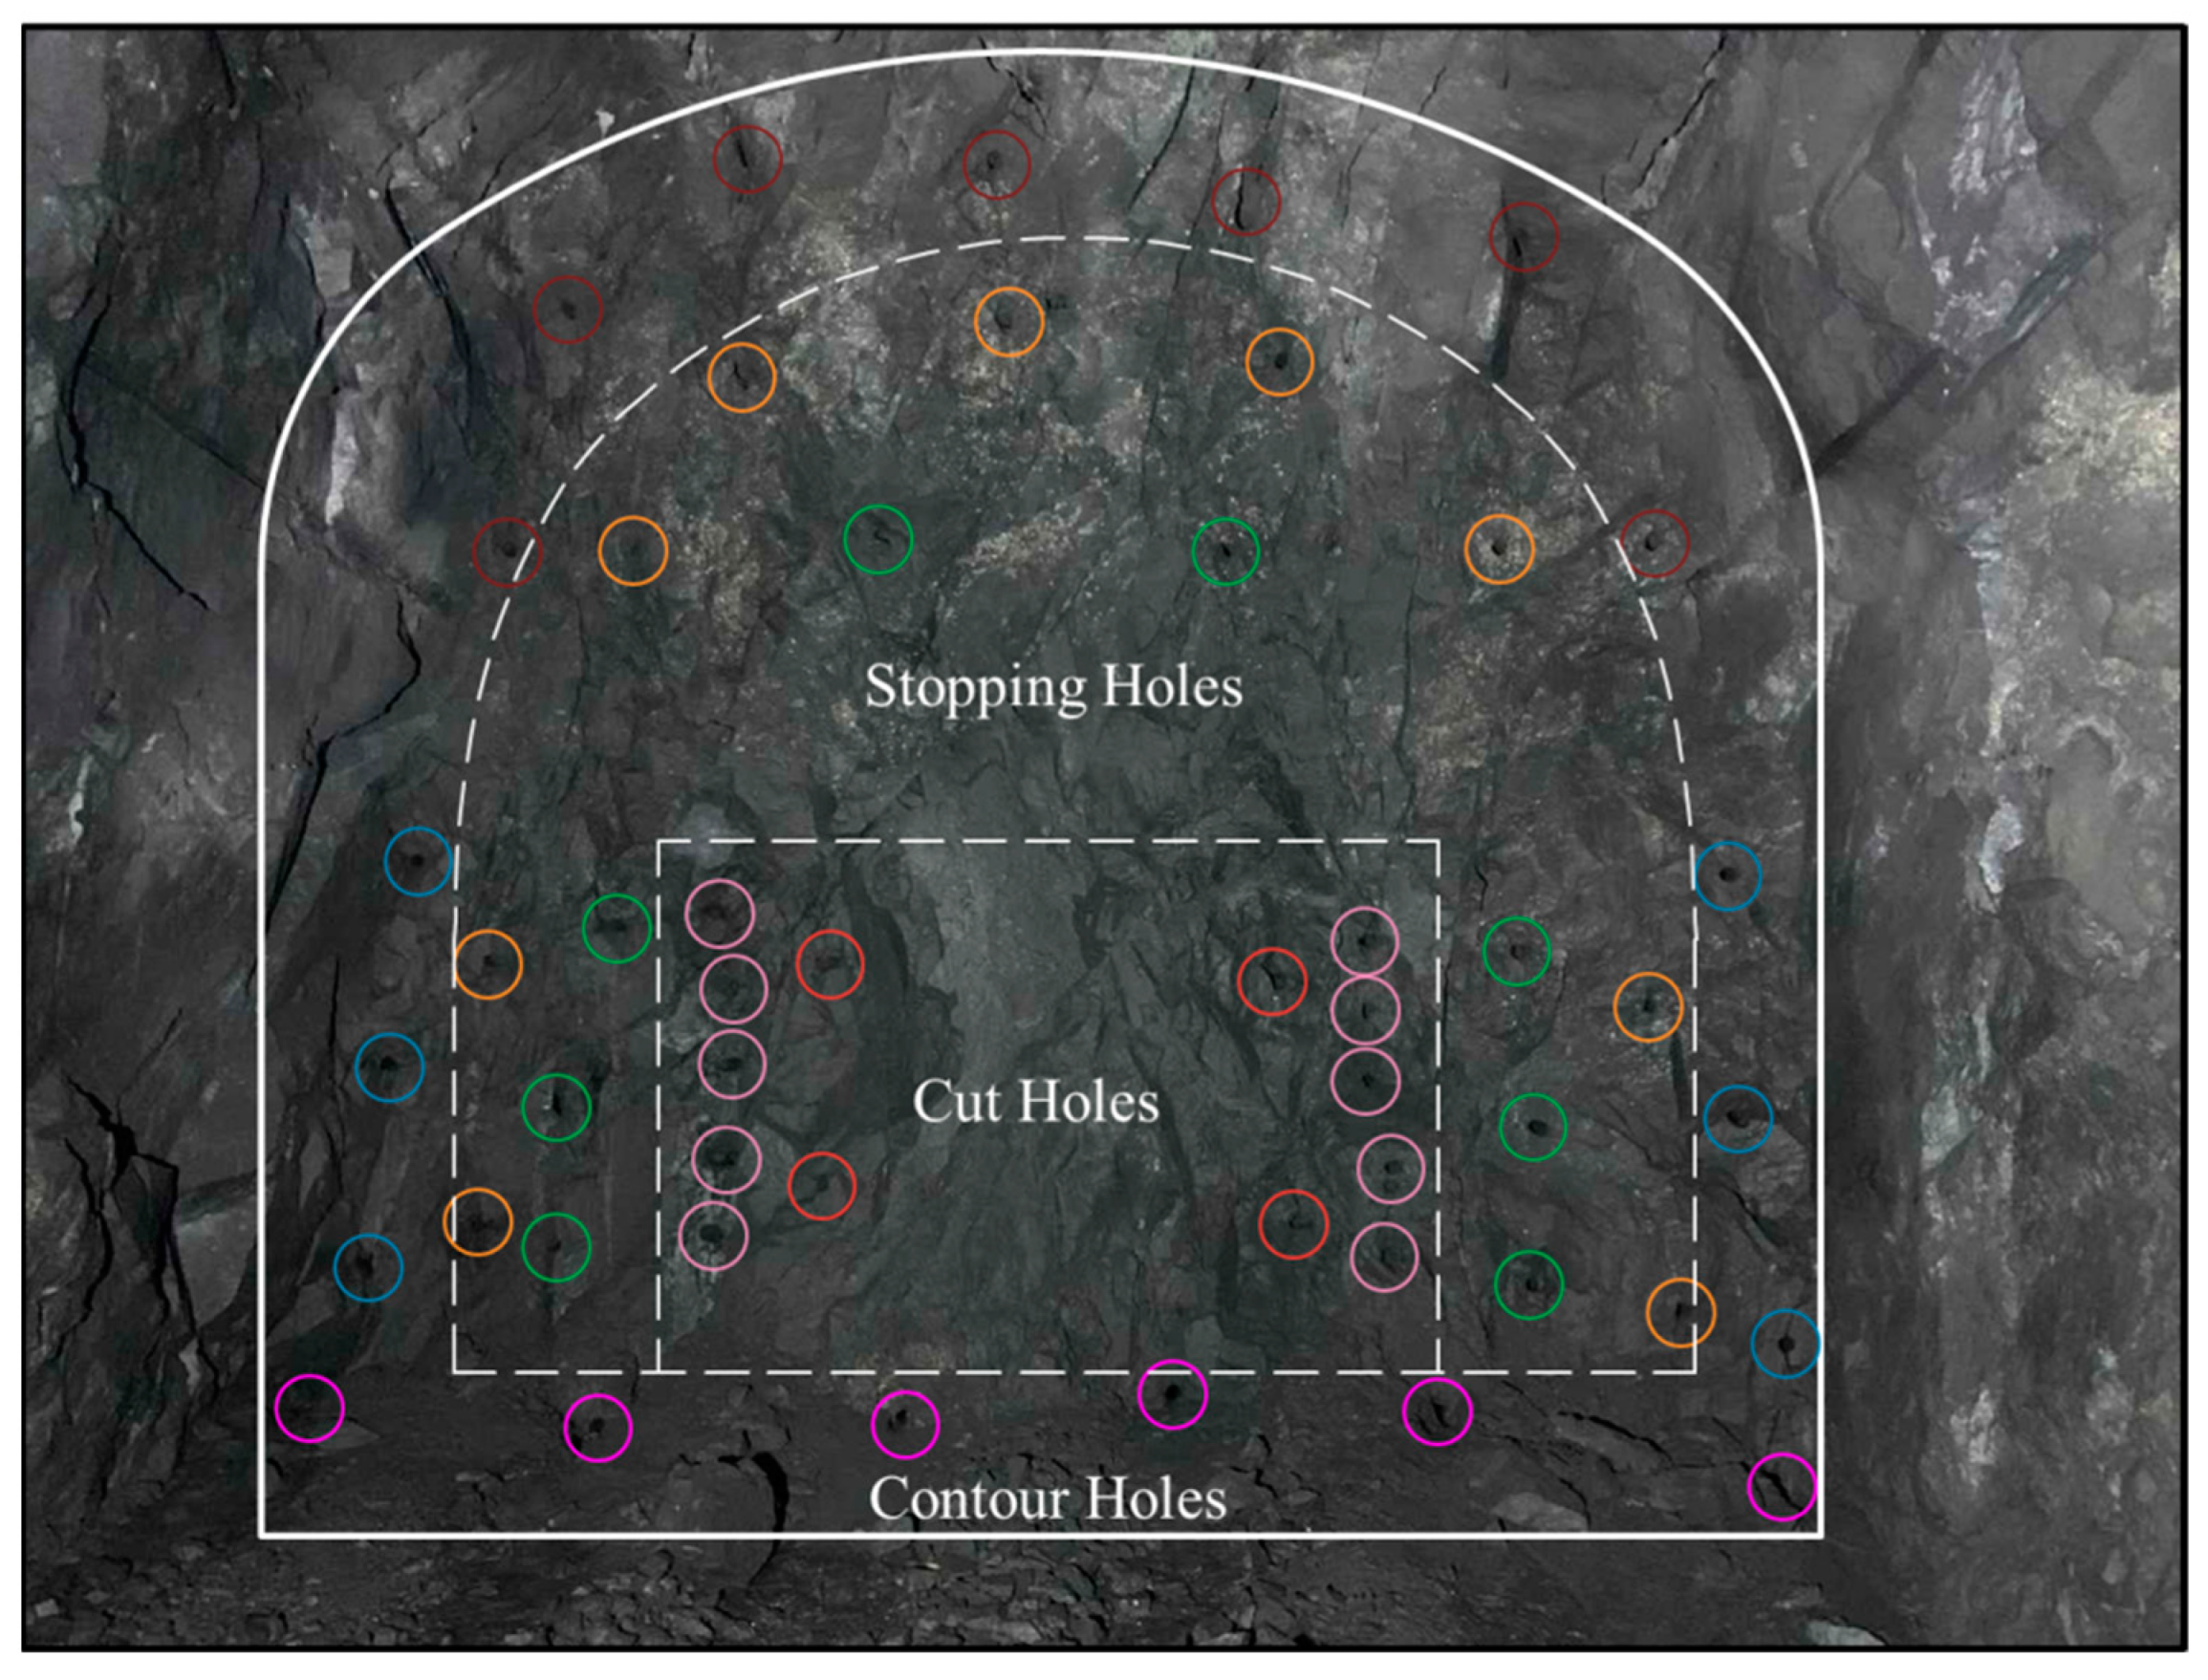
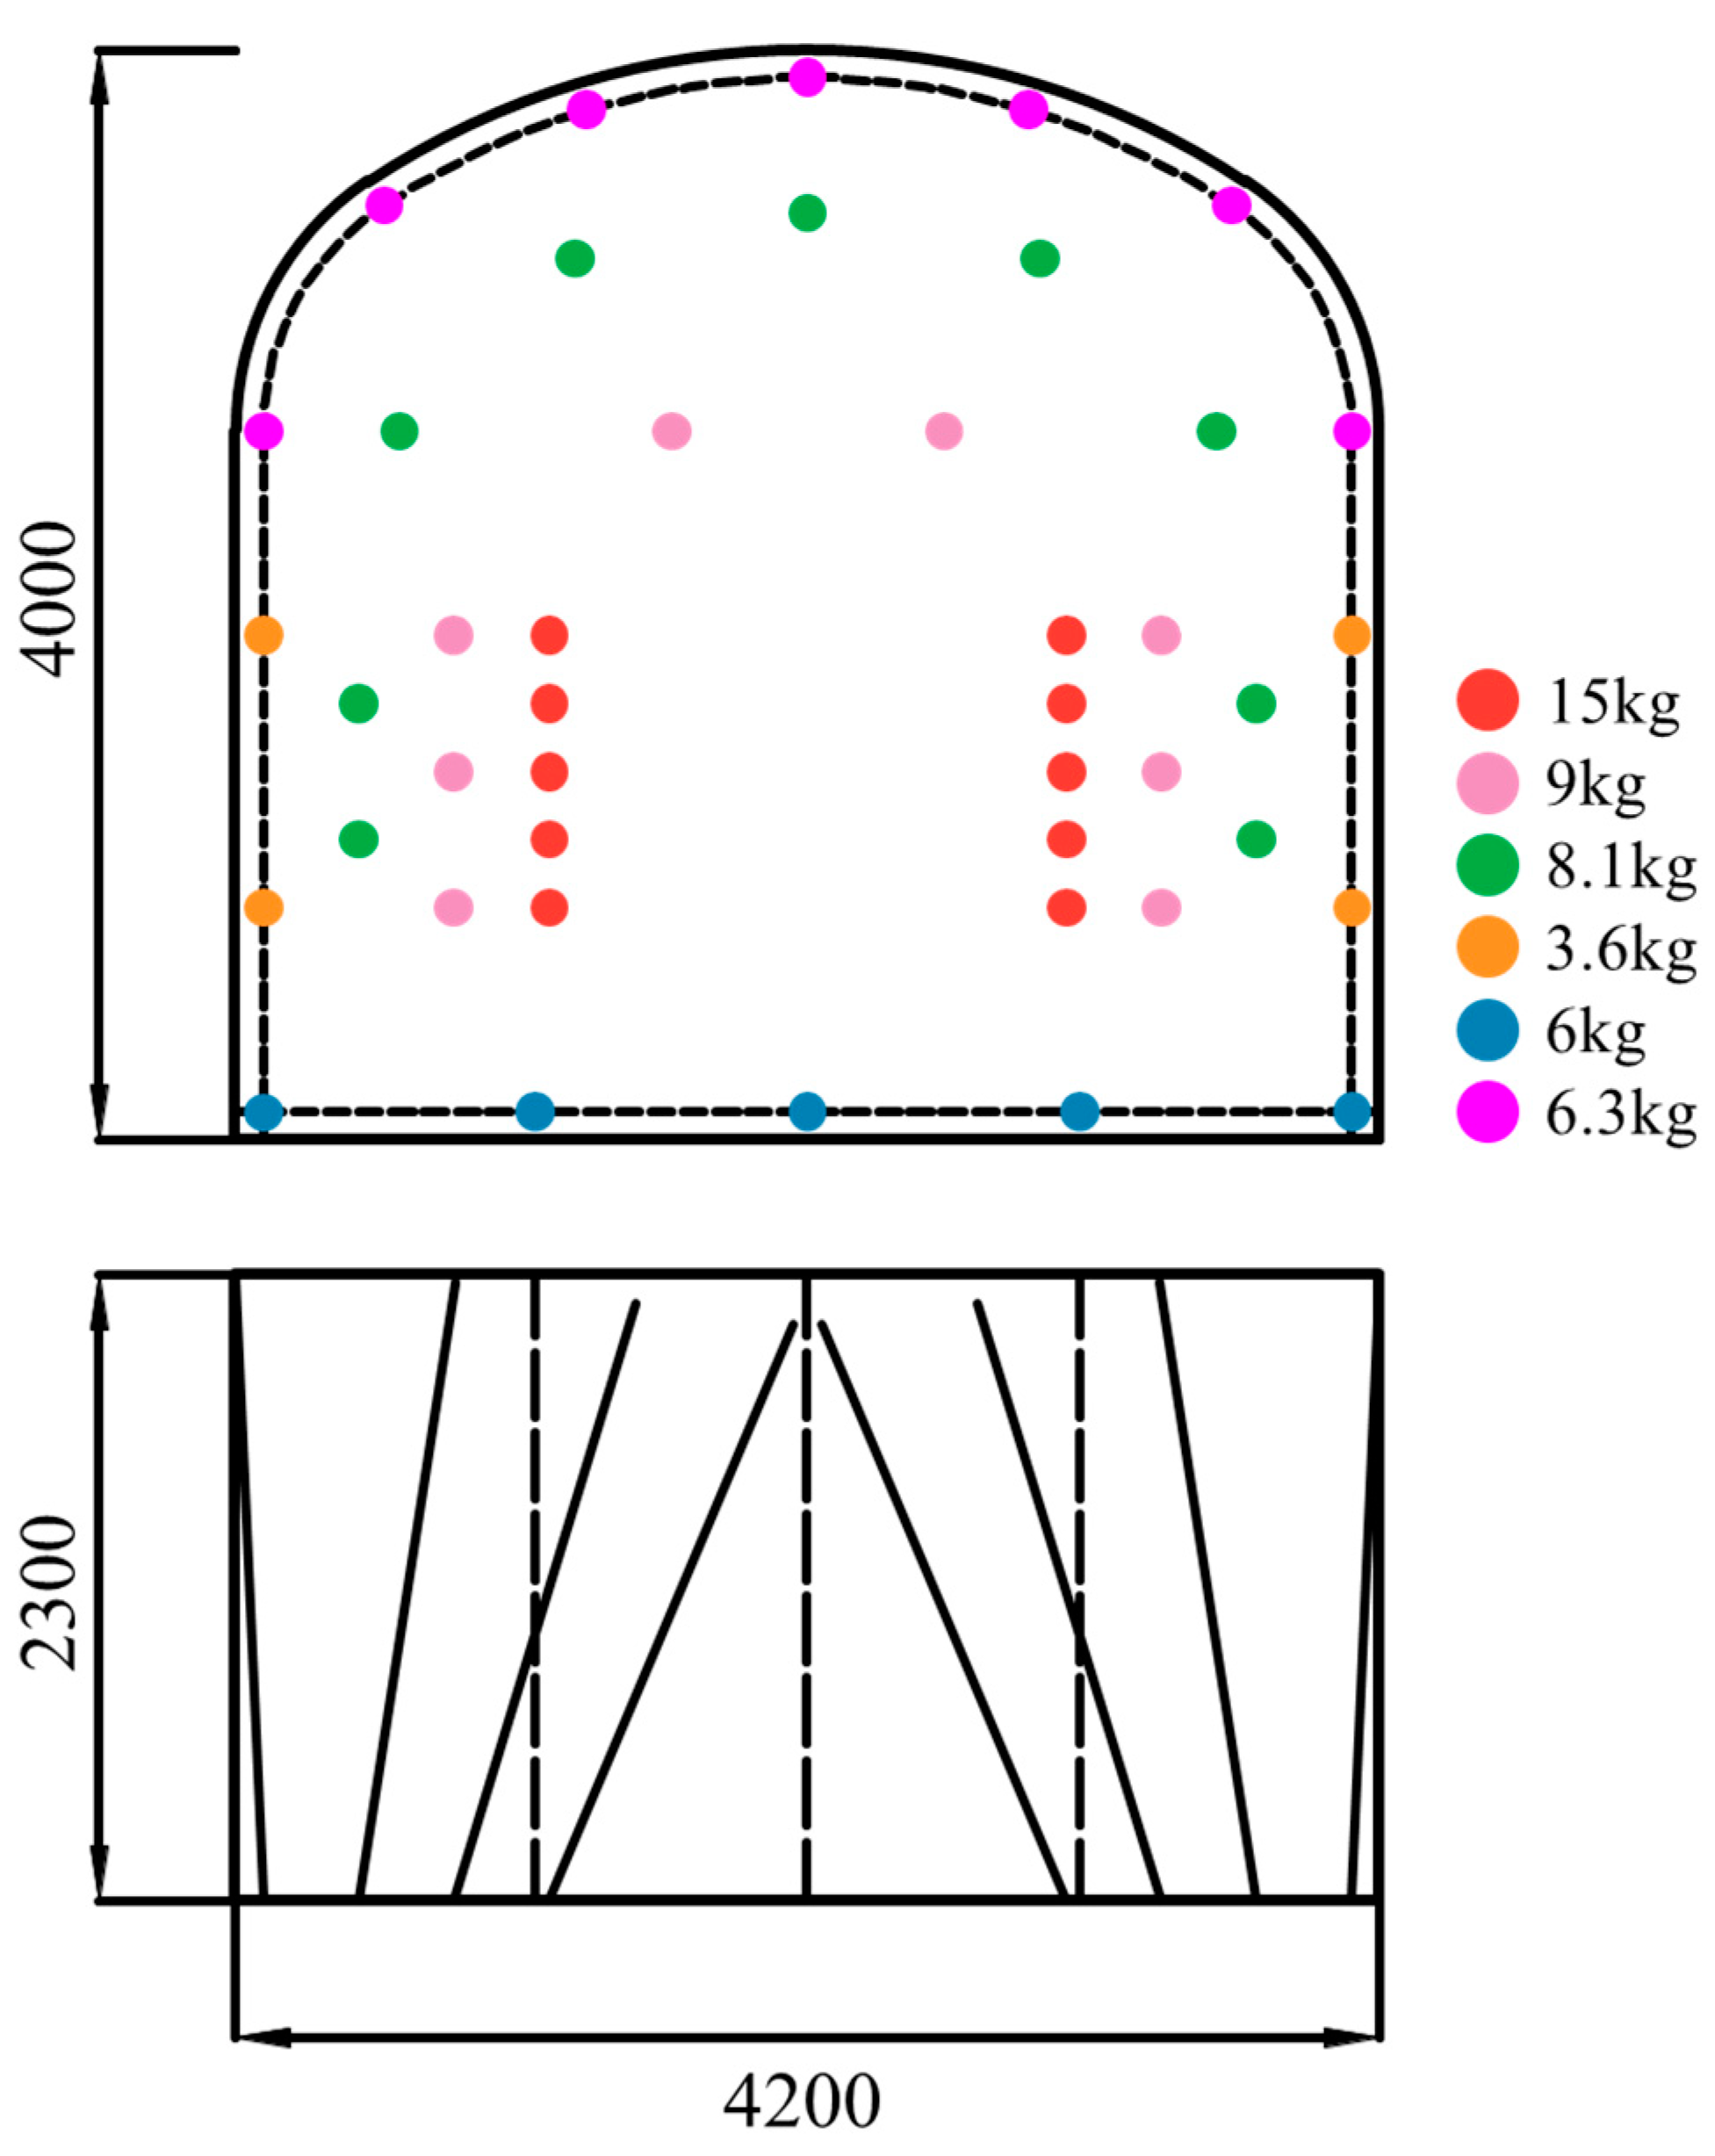
The original blasting pattern is shown in Figure 2. The test tunnel section size was 4.2 m × 4.0 m, and we adopted double wedge cut-smooth blasting. Drilling was performed using a YT-27 hand-held rock drill. Fifty blast holes with a diameter of 44 mm were arranged in the tunnel section, the angle ( θ ) between the blast holes and the free surface on the lower section gradually increasing from the section centerline along the horizontal direction to the contours. The diagram illustrates holes of varying colors, each corresponding to a different charge of explosives, a design consideration that takes into account the intended purposes and expected effects of the blast. Owing to the distribution of energy necessary for rock fragmentation in blasting, the different types of holes—pilot holes, auxiliary holes, peripheral holes, and side holes—play specific roles. Pilot holes are used to commence the rock-breaking process, auxiliary holes assist in enlarging the area of fragmentation, and peripheral and side holes are employed to control the blast pattern and the dispersion of the broken rock material. No. 2 rock emulsion explosives were used for blasting, with a single blasting consumption of 220 rolls and a total of 66 kg. The blasting sequence followed the legend from top to bottom. Two types of detonators, digital electronic detonators and shock tube detonators produced by Xuefeng Company, were used in the mine; each blasting required 50 detonators. For the digital electronic detonators blasting plan, the IRDT of each adjacent ring is equal and the delay time is 100 ms. Due to the high precision and controllable delay of the digital electronic detonators, which can reduce the errors caused by delay time, they were selected for the experiment to investigate the effect of different IRDTs on rock fragmentation.

3. Theoretical Analysis of IRDT in Tunnel Excavation Blasting

3.1. Energy of Rock Fragmentation in Tunnel Excavation Blasting

The energy of rock fragmentation in blasting engineering mainly comes from the energy consumption in drilling and blasting, but according to relevant studies, these two types of energy are not entirely used for rock fragmentation [15,16]. It is estimated that only about 10% of the input energy is used for rock fracturing in rock drilling, while most of the input energy is wasted as heat or other forms of energy [17]. In blasting, the energy used for rock fracture and fragmentation ranges from 5% to 15% [18]. Therefore, it can be concluded that:
E = η a E a + η b E b
where E is the energy of rock fragmentation; E a and E b is the energy consumption in drilling and blasting, respectively; and η a and η b is the energy efficiency in drilling and blasting for rock fragmentation, respectively.
As shown in Equation (1), if the energy efficiency in drilling η a remains constant, to effectively reduce the blasting cost (number of drill holes and amount of explosives) while maintaining a certain degree of rock fragmentation, it is necessary to increase the energy efficiency in blasting η b . Additionally, if the energy efficiency in drilling η a , the energy consumption in drilling and blasting E a and E b remains constant, an increase in the energy efficiency in blasting η b will result in a corresponding increase in the energy of rock fragmentation E , getting better rock fragmentation results.

3.2. Energy Conversion in Collisions

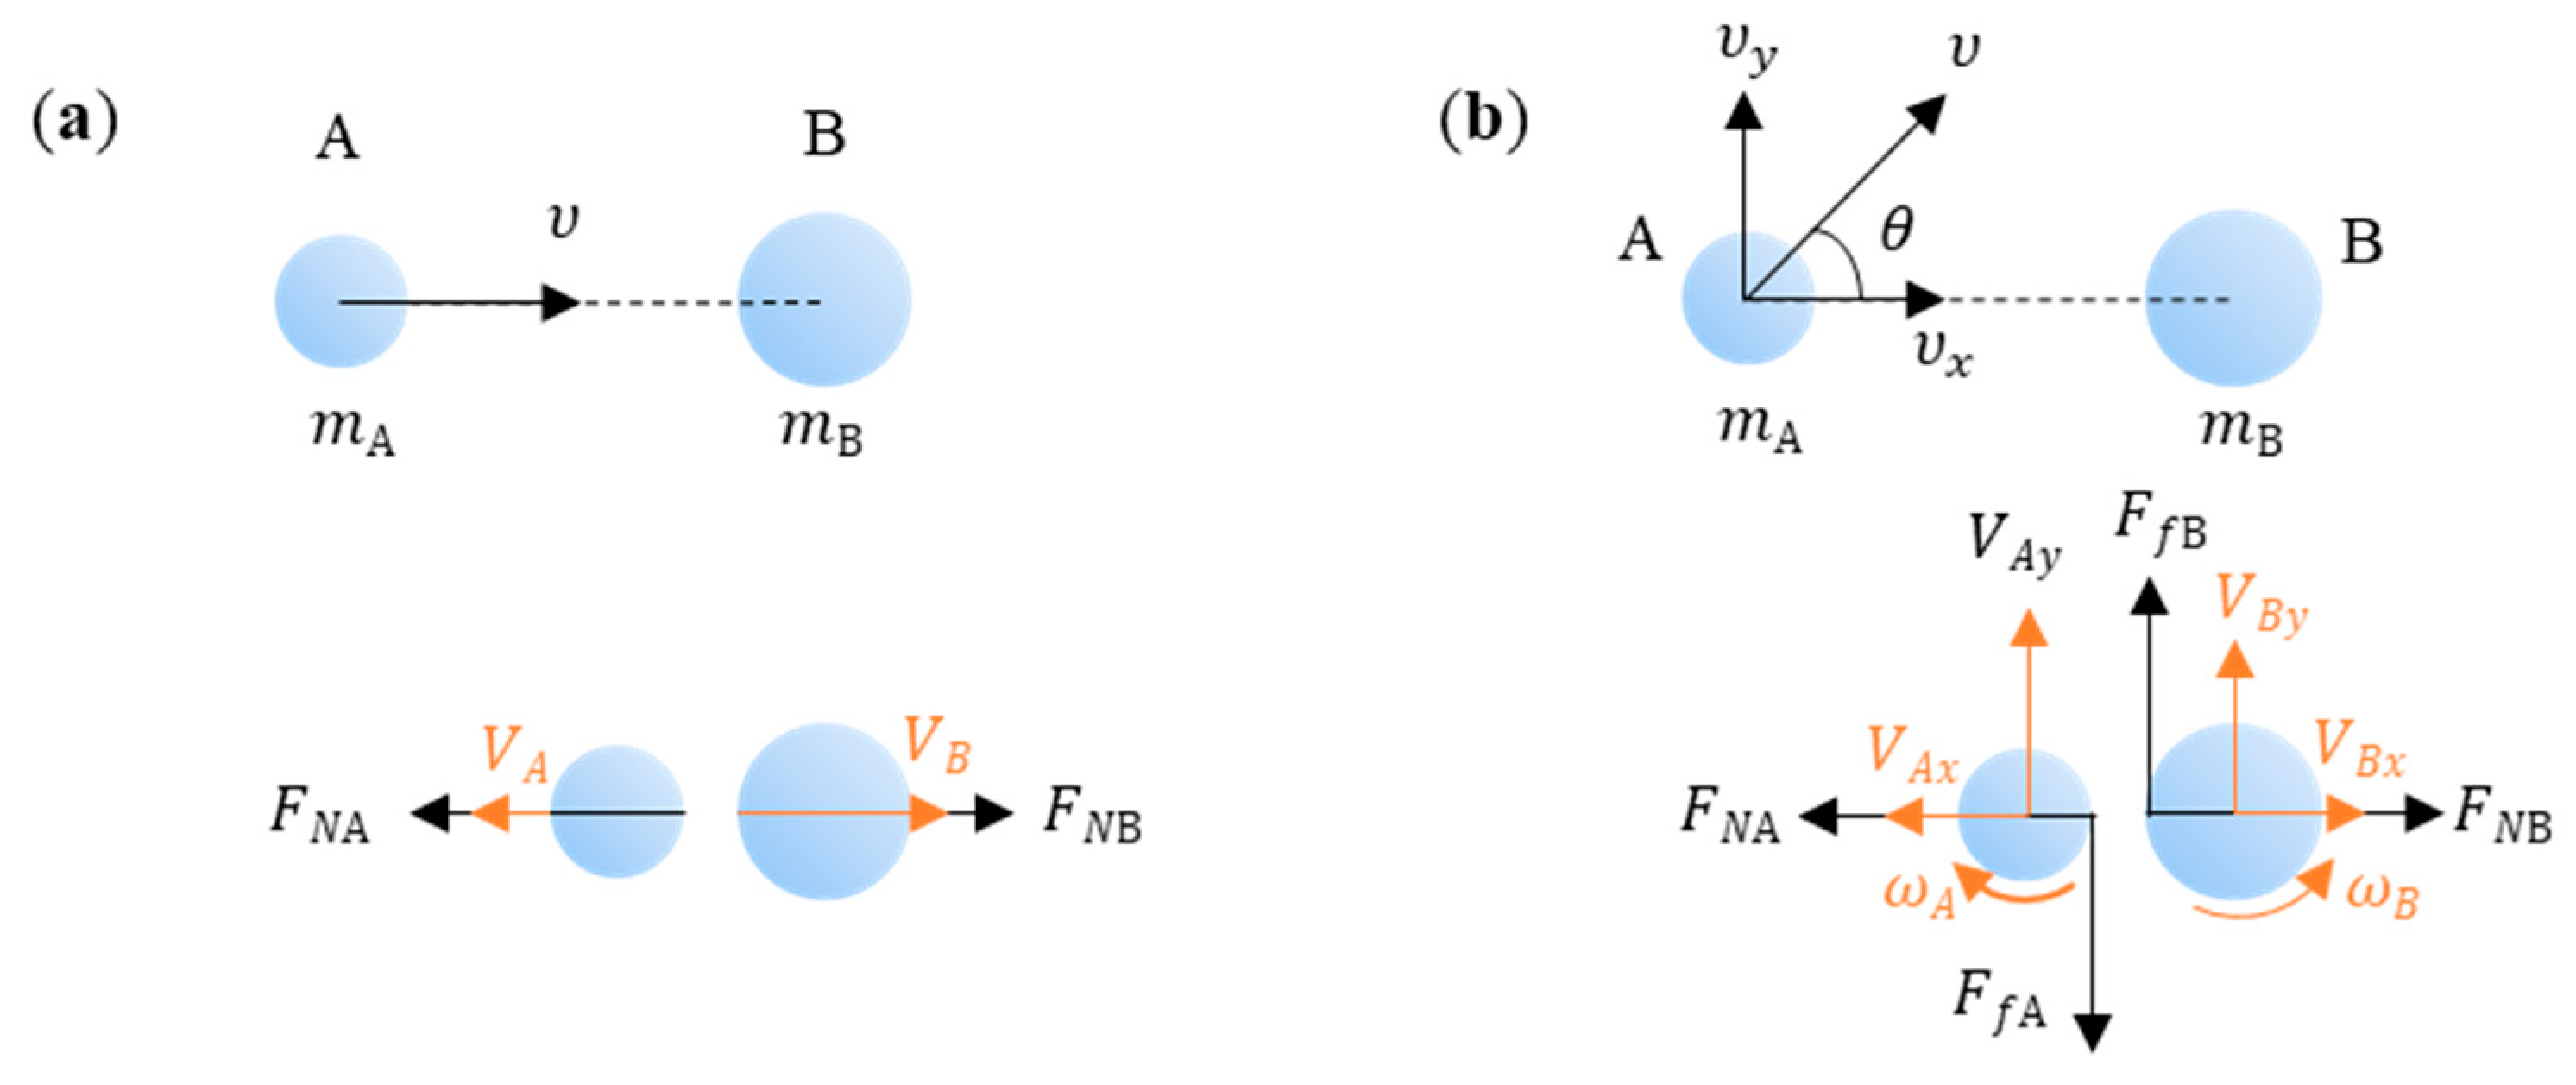
This study analyzed the energy conversion of collision in the perfect model and the effect of IRDT on rock fragmentation. The perfect model for analyzing collisions had two types of central and non-central collisions. As shown in Figure 3, two balls, A and B, were used, with masses m A and m B , respectively, and both had relative velocities υ . Assume that two balls have inelastic properties and rough surfaces.
For a central collision (Figure 3a), the direction of relative velocity at the time of collision coincides with the line joining the centers of the two balls. At the time of the collision, the axial forces F N A and F N B were generated, such as F N A = F N B = F N . The axial force F N A caused the velocity of ball A to decrease V A , and the axial force F N B increased the velocity of ball B to V B . It is noteworthy that during a collision, the axial force F N A causes the velocity of ball A to decrease initially and may reduce to zero before increasing in the opposite direction, but it does not exceed the velocity before the collision. In an inelastic collision, the kinetic energy of ball A decreases while that of ball B increases, but the total kinetic energy is not conserved before and after the collision. This is because the axial forces F N A and F N B cause non-elastic deformation of balls A and B, which is converted into internal energy of the balls and dissipated. Damage occurs when the ball deformation cannot withstand the internal energy gained. According to the law of conservation of momentum, the energy loss during a central collision can be obtained as follows [19] (pp. 26–29):
E k = 1 2 m υ 2 1 e 2
where E k is the energy loss, kJ; m is relative mass m = m A m B / ( m A + m B ) , kg; υ is the relative velocity of A and B at the time of the collision, m/s; e is the recovery coefficient, which is related to the nature of the material, and for inelastic material, 0 < e < 1 .
According to Equation (2), the larger the relative velocity of the ball in an inelastic central collision, the greater the energy loss and the more severe the damage to the ball.
For non-central collision (Figure 3b), the angle between the direction of relative velocity in a collision and the line joining the centers of the two balls is θ ( 0 < θ < π / 2 ) , and the horizontal and vertical components of the relative velocity are υ x and υ y , respectively, where υ x = υ c o s θ and υ y = υ s i n θ . Furthermore, the energy loss at the time of the collision was analyzed in the horizontal and vertical directions.
The horizontal direction was similar to the central collision model. The collision generated the axial forces F N A and F N B , where the axial force F N A decreased the horizontal velocity of ball A to V A x . The axial force F N B increased the horizontal velocity of ball B to V B x . Meanwhile, part of the energy was converted into the internal energy of the ball and loss. The energy loss can be derived as follows:
E k x = 1 2 m υ x 2 1 e 2 = 1 2 m υ c o s θ 2 1 e 2
In the vertical direction, the collision produced frictional forces F f A and F f B for balls A and B, and F f A = F f B The frictional force F f A reduced the velocity of ball A in the vertical direction to V A y , and F f B increased the velocity of ball B in the vertical direction to V B y . Meanwhile, the frictional forces F f A and F f B caused balls A and B to produce rotational angular velocities ω A and ω B , respectively. After a collision in the y-direction, part of the kinetic energy was converted into thermal and angular kinetic energies, which were not conducive to ball destruction [3] (pp. 327–328), so the energy loss was not calculated in this situation.
By analyzing the horizontal and vertical directions, it can be concluded that the damage of the ball in an inelastic non-central collision depends on the relative velocity in the horizontal direction. When the relative velocity υ is constant, the smaller θ is, the more serious the damage to the ball, and the central collision ( θ = 0 ) is more favorable than the non-central collision to the ball destruction.

3.3. Explosive Load and Rock Interaction Processes

The processes of rock damage due to explosive blasts are shown in Figure 4. First, the rock is under the action of the shock wave to form a burst cavity and a crushed area. Second, the shock wave decays into a compressive stress wave, the action of the stress wave in the rock under the circumferential and radial fractures, while the role of explosive gas under the fracture further expands. Again, the compressive stress wave is reflected towards the free surface, generating tensile stress waves that cause spalling of the rock near the free surface and further propagation of radial cracks. Finally, the high temperature and high-pressure burst of gas expands to push the rock mass, forming a bulging phenomenon on the surface of the rock. The study conducted by Hanukayev revealed that initiating blasting in post-blast holes is appropriate when the first blast hole just formed a blast funnel and the blasted rock from the rock formed a 0.8–1.0 cm wide fracture [20]. The formula for calculating the delayed time is given as:
T = t 1 + t 2 + t 3
where is delay time, ms; t 1 is the time for the elastic wave to travel to the free surface and return, ms; t 2 is the time to form a fracture, ms; and t 3 is the time for the broken rock to leave the rock body at a certain distance, ms. It is evident that the length of blast holes and the timing of delays in mine blasting are interrelated and have a significant effect on the ore fragmentation. The blast hole length determines the depth and range to which explosive energy is applied to the rock mass; extended blast holes can impart energy more profoundly, leading to broader rock fracturing. With judicious design of the delay timing, the outcomes of blasting can be optimized; a well-calibrated delay facilitates better interconnection of the fractures induced by the blast, thereby improving the quality of ore fragmentation and the evenness of the fragment size distribution.
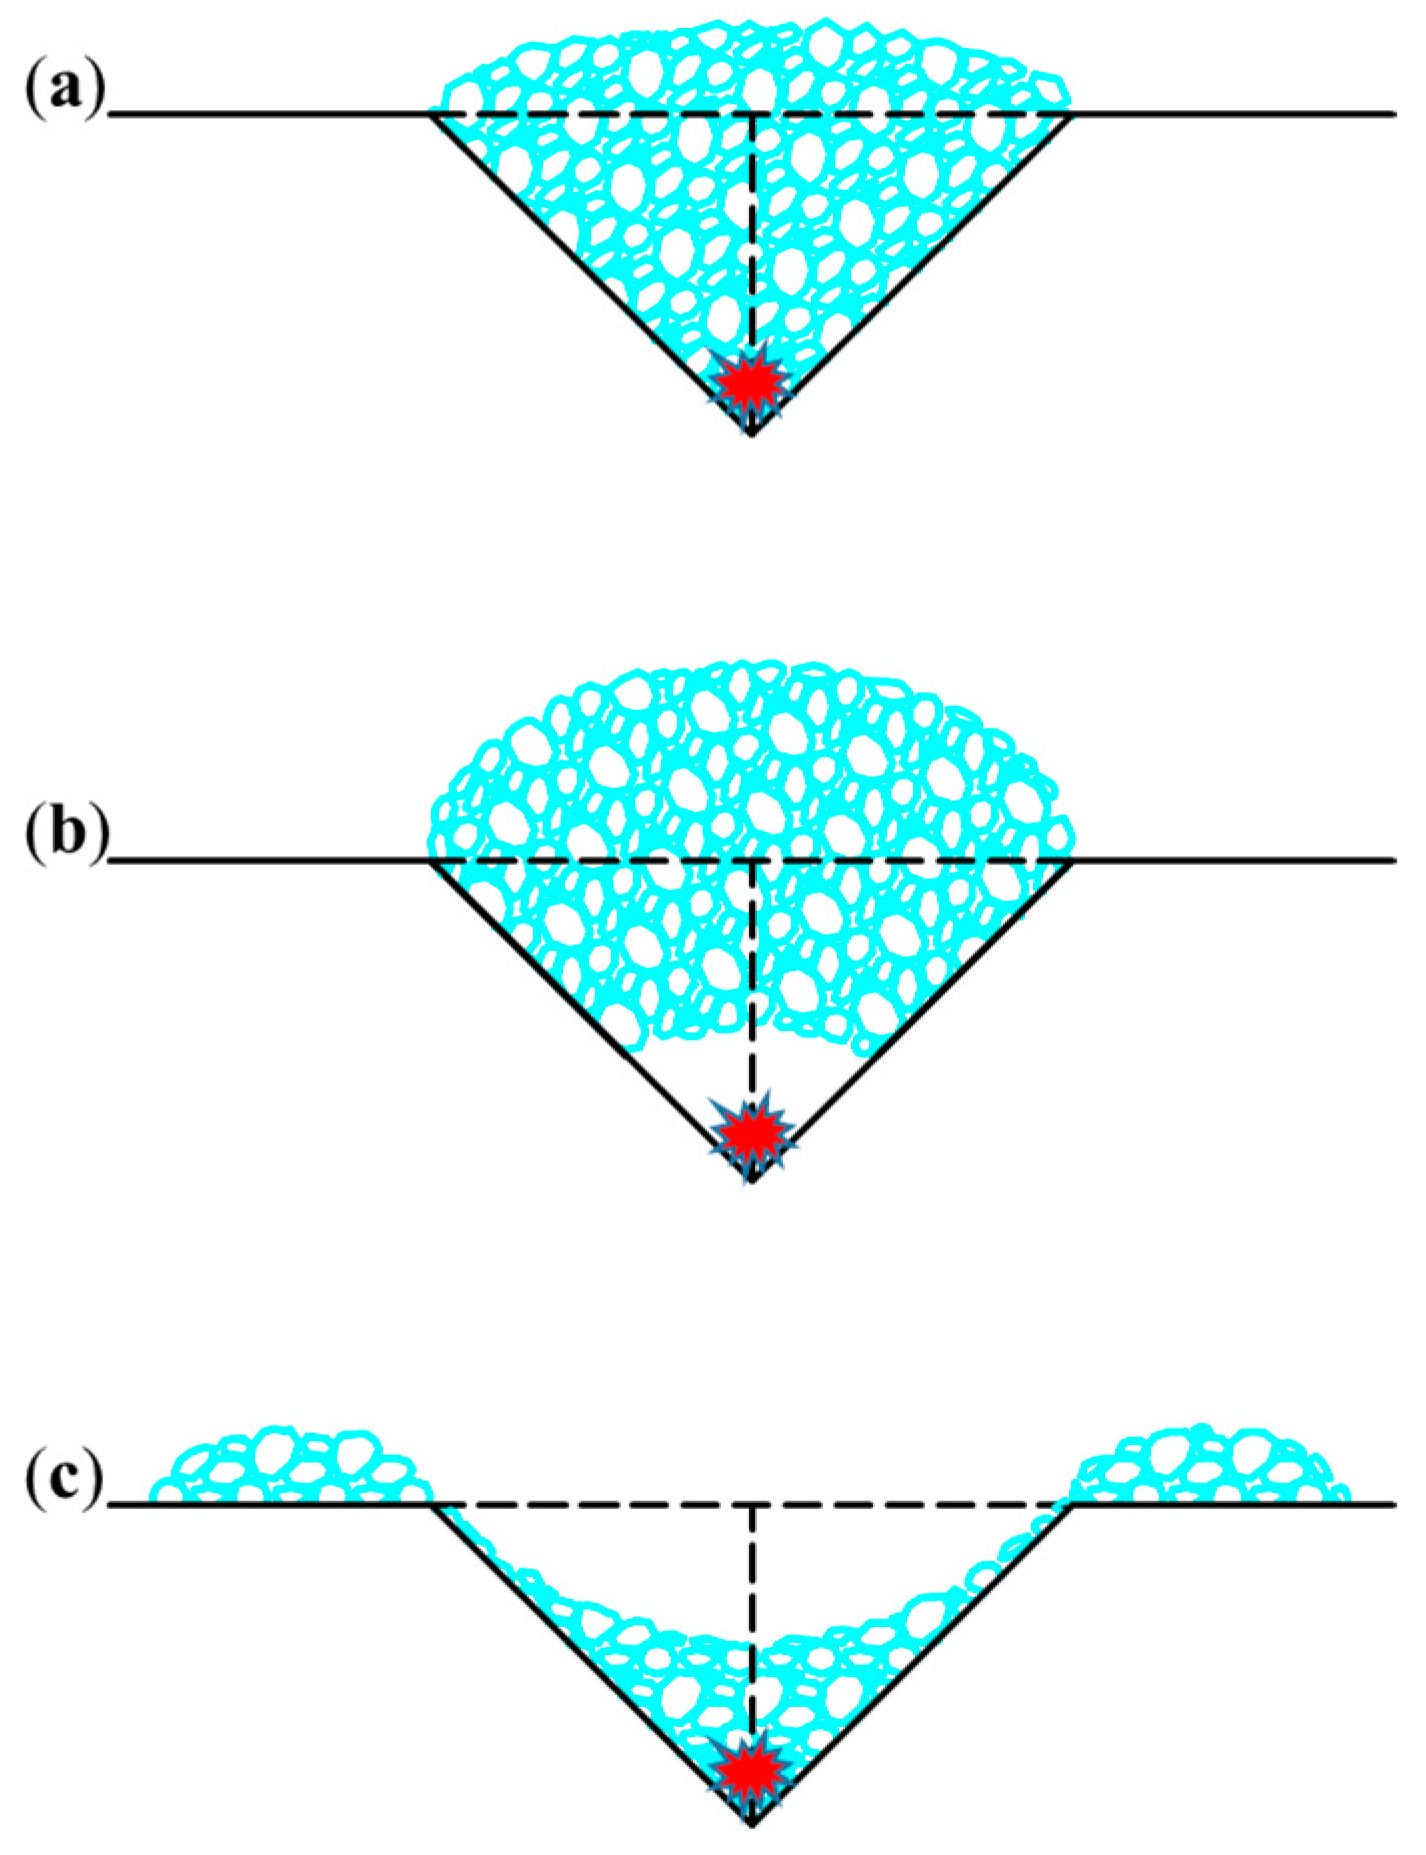
Based on this, the total times t 1 and t 2 were considered to be the time of the free surface formation after the explosive detonation, the action of shock waves and explosive-generated gas, and the fracture has been fully formed, with an obvious blast funnel contour line (Figure 5a). Here, t 3 is the time to throw the rock a certain distance, while the explosive-generated gas continues to expand to throw the debris a certain distance (Figure 5b) until a blasting funnel is formed (Figure 5c).

3.4. Collision of Fragment

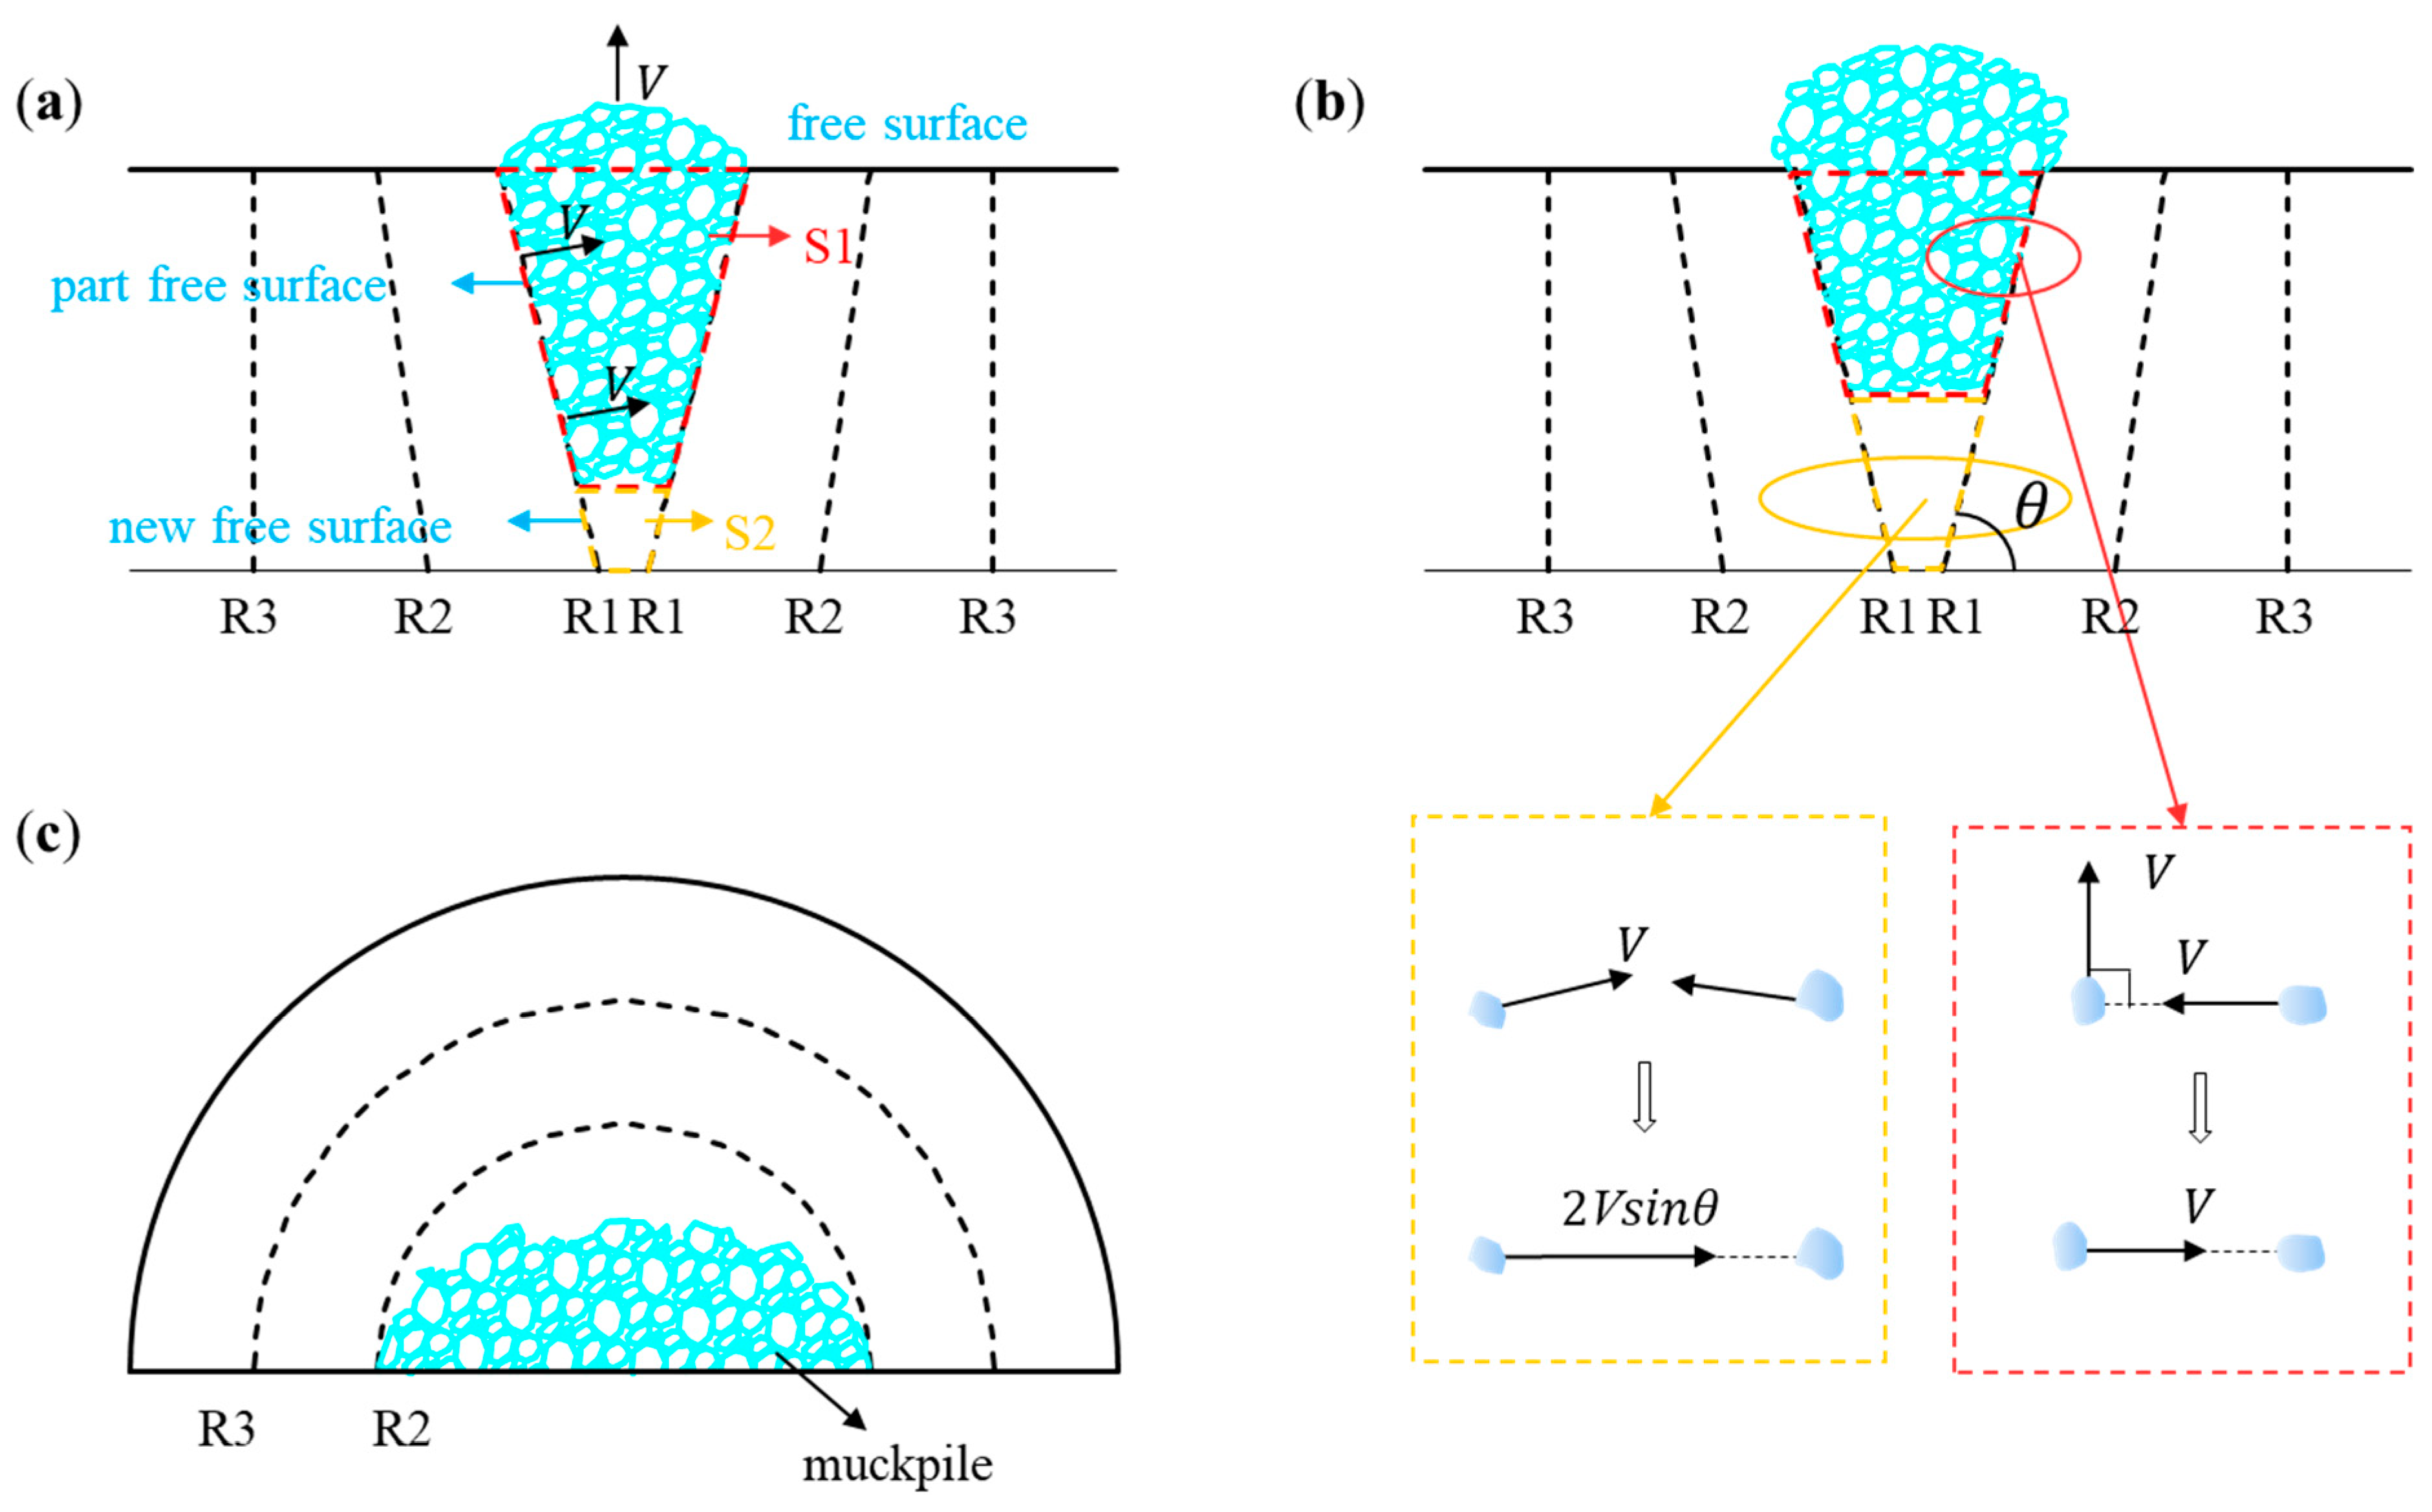
Based on the energy conversion theory in the collision process and blasting process, a tunnel excavation blasting model (Figure 6) was established to analyze the effect of IRDT on rock fragmentation. θ is the angle between the blast hole and the free surface; R1, R2, and R3 represent the cut hole, stopping hole, and contour hole, respectively; the TRDT for R1, R2, and R3 are the same; S1 represents the space of unthrown fragments after the detonation of R1, and S2 represents the new compensating space. The tunnel section is the free surface, the shared face between S2 and R1 forms the new free surface, while the shared face between S1 and R1 forms the part free surface. Additionally, assuming the same time of free surface formation and the same velocity of rock movement after each blast means that the fragments have the same kinetic energy.
As indicated by collision theory, the energy loss during collisions depends on the magnitude and direction of the relative velocity. Therefore, in the analysis of the tunnel excavation blasting process, the influence of collisions among the same-ring blasted rocks on rock fragmentation was considered. Additionally, a comparative analysis was carried out between the effects of rear-ring-blasted rocks impacting front-ring-blasted rocks on rock fragmentation.
The IRDT is denoted as t 1 . As shown in Figure 6a, the blasting took t 1 time. The rock adjacent to the S1 region along the partial free surface is thrown after R2 detonates, whereas the rock at S2 is thrown towards a new free surface. The collision between rocks from the front and rear rings occurs in the S1 region, with a relative velocity of 2   V and an angle of 45° with respect to the horizontal direction. The relative velocity in the horizontal direction is V . The collision between rocks of the same ring occurs at the S2 region, and the relative velocity in the horizontal direction is 2 V s i n θ . As indicated in Section 3.2, the degree of rock fragmentation resulting from a collision depends on the magnitude of the relative velocity in the horizontal direction. Thus, when 0 < θ < π / 6 , V > 2 V s i n θ , the degree of rock fragmentation at S1 is better than that at S2. When π / 6 < θ π / 2 , V > 2 V s i n θ , the degree of rock fragmentation at S2 is better than that at S1. Based on the actual field conditions, the case of 0 < θ < π / 6 is not considered, and only the situation of π / 6 < θ π / 2 is discussed, i.e., the degree of rock fragmentation at S2 is better than that at S1.
When the delay time increases, the IRDT is denoted as t 2 ( t 2 > t 1 ) . As shown in Figure 6b, the blast experience at t 2 time, the kinetic energy dissipated in area S2 after R2 is detonated is greater than that in area S1. This is because more energy is used for collision at S2, improving the fragmentation of the blasted rock and reducing its throw distance. As the delay time t 2 increases compared to t 1 , the S1 region gradually decreases, and the S2 region gradually increases. With the increase in the IRDT, more energy is used for rock fragmentation after R2 is detonated.
Meanwhile, when the delay time continues to increase, take the IRDT as t 3   ( t 3 > t 2 ) . As shown in Figure 6c, after a period of 2 t 3 , R3 starts to detonate. If the delay time t 3 is large enough, the increase in the space S2 of collisions among the same-ring-blasted rocks will result in the reduced throwing energy, producing a muck pile in the blasting cavity, reducing the collision space of the rock fragments generated after R3 initiation. As such, the explosion energy cannot be fully converted into rock fragmentation energy.
In addition, according to the force of the collision process in Section 3.2, it can be seen that the blasting rock of the blast hole R2 collides with the blasting rock of the blast hole R1, which will increase the velocity of the rock mass in the S1 area perpendicular to the free surface and throw farther. Similarly, it can be seen that the rock burst collision between the same ring in the S2 region does not increase the velocity of the rock burst in R2 perpendicular to the free surface. It can be seen that the S1 region is more conducive to rock throwing. It can be seen that compared with the delay time, the S1 region gradually decreases and the S2 region gradually increases. Therefore, with the increase in the delay time between the rings, the rock-throwing distance will gradually decrease. At the same time, it should also be noted that when the delay between the rings is small enough, the throwing effect of the rock may be weakened. This is because R1 may not form a part of the free surface after detonation, and the explosive rock at R2 is made by the rock, which even leads to the failure of roadway excavation blasting.
The above analysis shows that with an increase in the IRDT, the explosive energy is beneficial to rock fragmentation. However, when the delay time exceeds a certain value, the subsequent blasting rock throwing is weakened so that the formation of a muck pile in the blasting cavity reduced the following blasting rock forward collision space, reducing rock fragmentation. If the delay time is too short, the space for collisions among the same-ring-blasted rocks will be too small, which is unfavorable for rock fragmentation.

4. Field Blasting Tests

4.1. Test Blast Design

4.1.1. IRDT Blasting Tests

To investigate the IRDT effect on rock fragmentation, five field blasting tests were conducted with IRDT of 50, 100, 150, 200, and 500 ms; the adjacent inter-rings IRDT are the same. The tests were conducted such that in five sets of blasting tests all blast parameters were the same except for the IRDT, such as the same parameters for the distribution of blast holes, the detonation sequence, and the corresponding blast holes charge. Meanwhile, two repeated tests were carried out. The field distribution of blast holes are shown in Figure 7.

4.1.2. Tunnel Excavation Blasting Optimization

From Equation (1), it can be inferred that there are two methods to effectively improve rock fragmentation: one is to provide more energy to the rocks, and the other is to find stress and energy distributions that are conducive to rock fracture without increasing the total energy input. Based on these, two approaches for optimizing tunnel excavation blasting are proposed: (1) maintaining the cost required for rock fragmentation while improving the degree of rock fragmentation, and (2) maintaining the original degree of rock fragmentation while reducing the required cost.
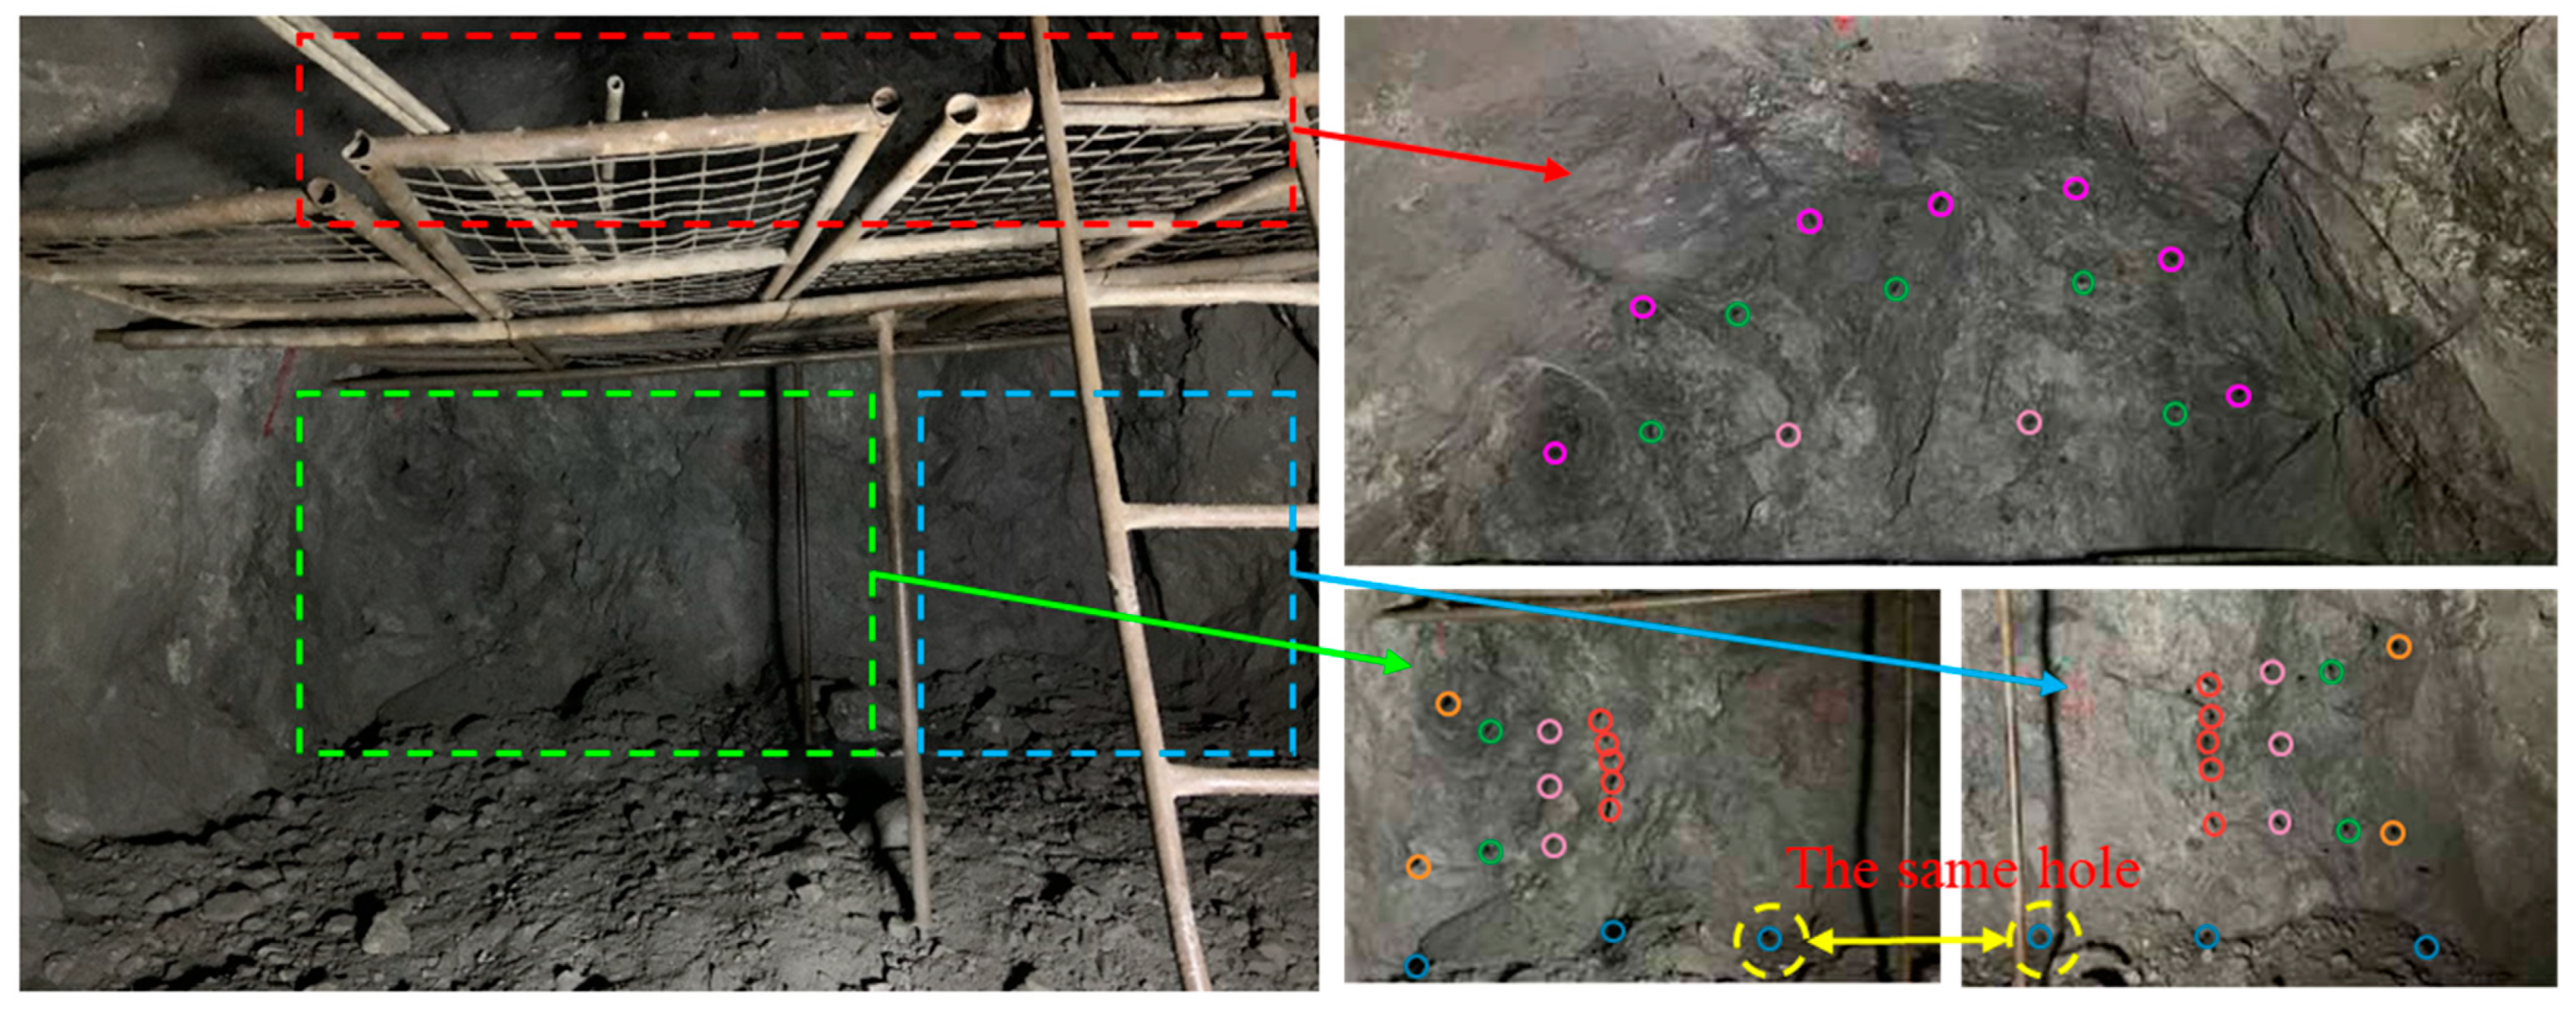
According to IRDT blasting tests, three sets of experiments were designed, namely the original blasting design plan of the mine (control experiment), the optimal inter-hole delay plan (optimization plan 1 based on approach 1, with an optimal delay time of 150 ms as explained later), and a plan that reduces the number of blast holes and the number of explosives based on the optimal inter-hole delay plan (optimization plan 2 based on approach 2). The specific design of optimization plan 2 is shown in Figure 8. Combined with the actual situation of the mine and the physical and mechanical properties of the rock in Table 1, the mine adopts No. 2 rock emulsion explosive, one box of four bags, one bag of 20 volumes, 0.3 kg of single volume explosive, then a bag of 6 kg. To facilitate the use of explosives, the explosive consumption of the second optimization scheme is 48 kg. Under the experimental plan of the optimal IRDT, the number of cut holes, bottom holes, and stopping holes in the original first blasting was reduced, and the method of cut hole excavation was changed from double-wedge-cut to single-wedge-cut, which can reduce the consumption of digital electronic detonators. The charge weight of a few blast holes was adjusted, resulting in a decrease in the overall charge weight. The specific changes in blasting parameters are shown in Table 2. The use of digital electronic detonators and explosives was reduced by 14.0% and 27.27%, respectively, compared to the original plan. The field distribution of blast holes for the blasting plan 2 is shown in Figure 9.

4.2. Test Fields

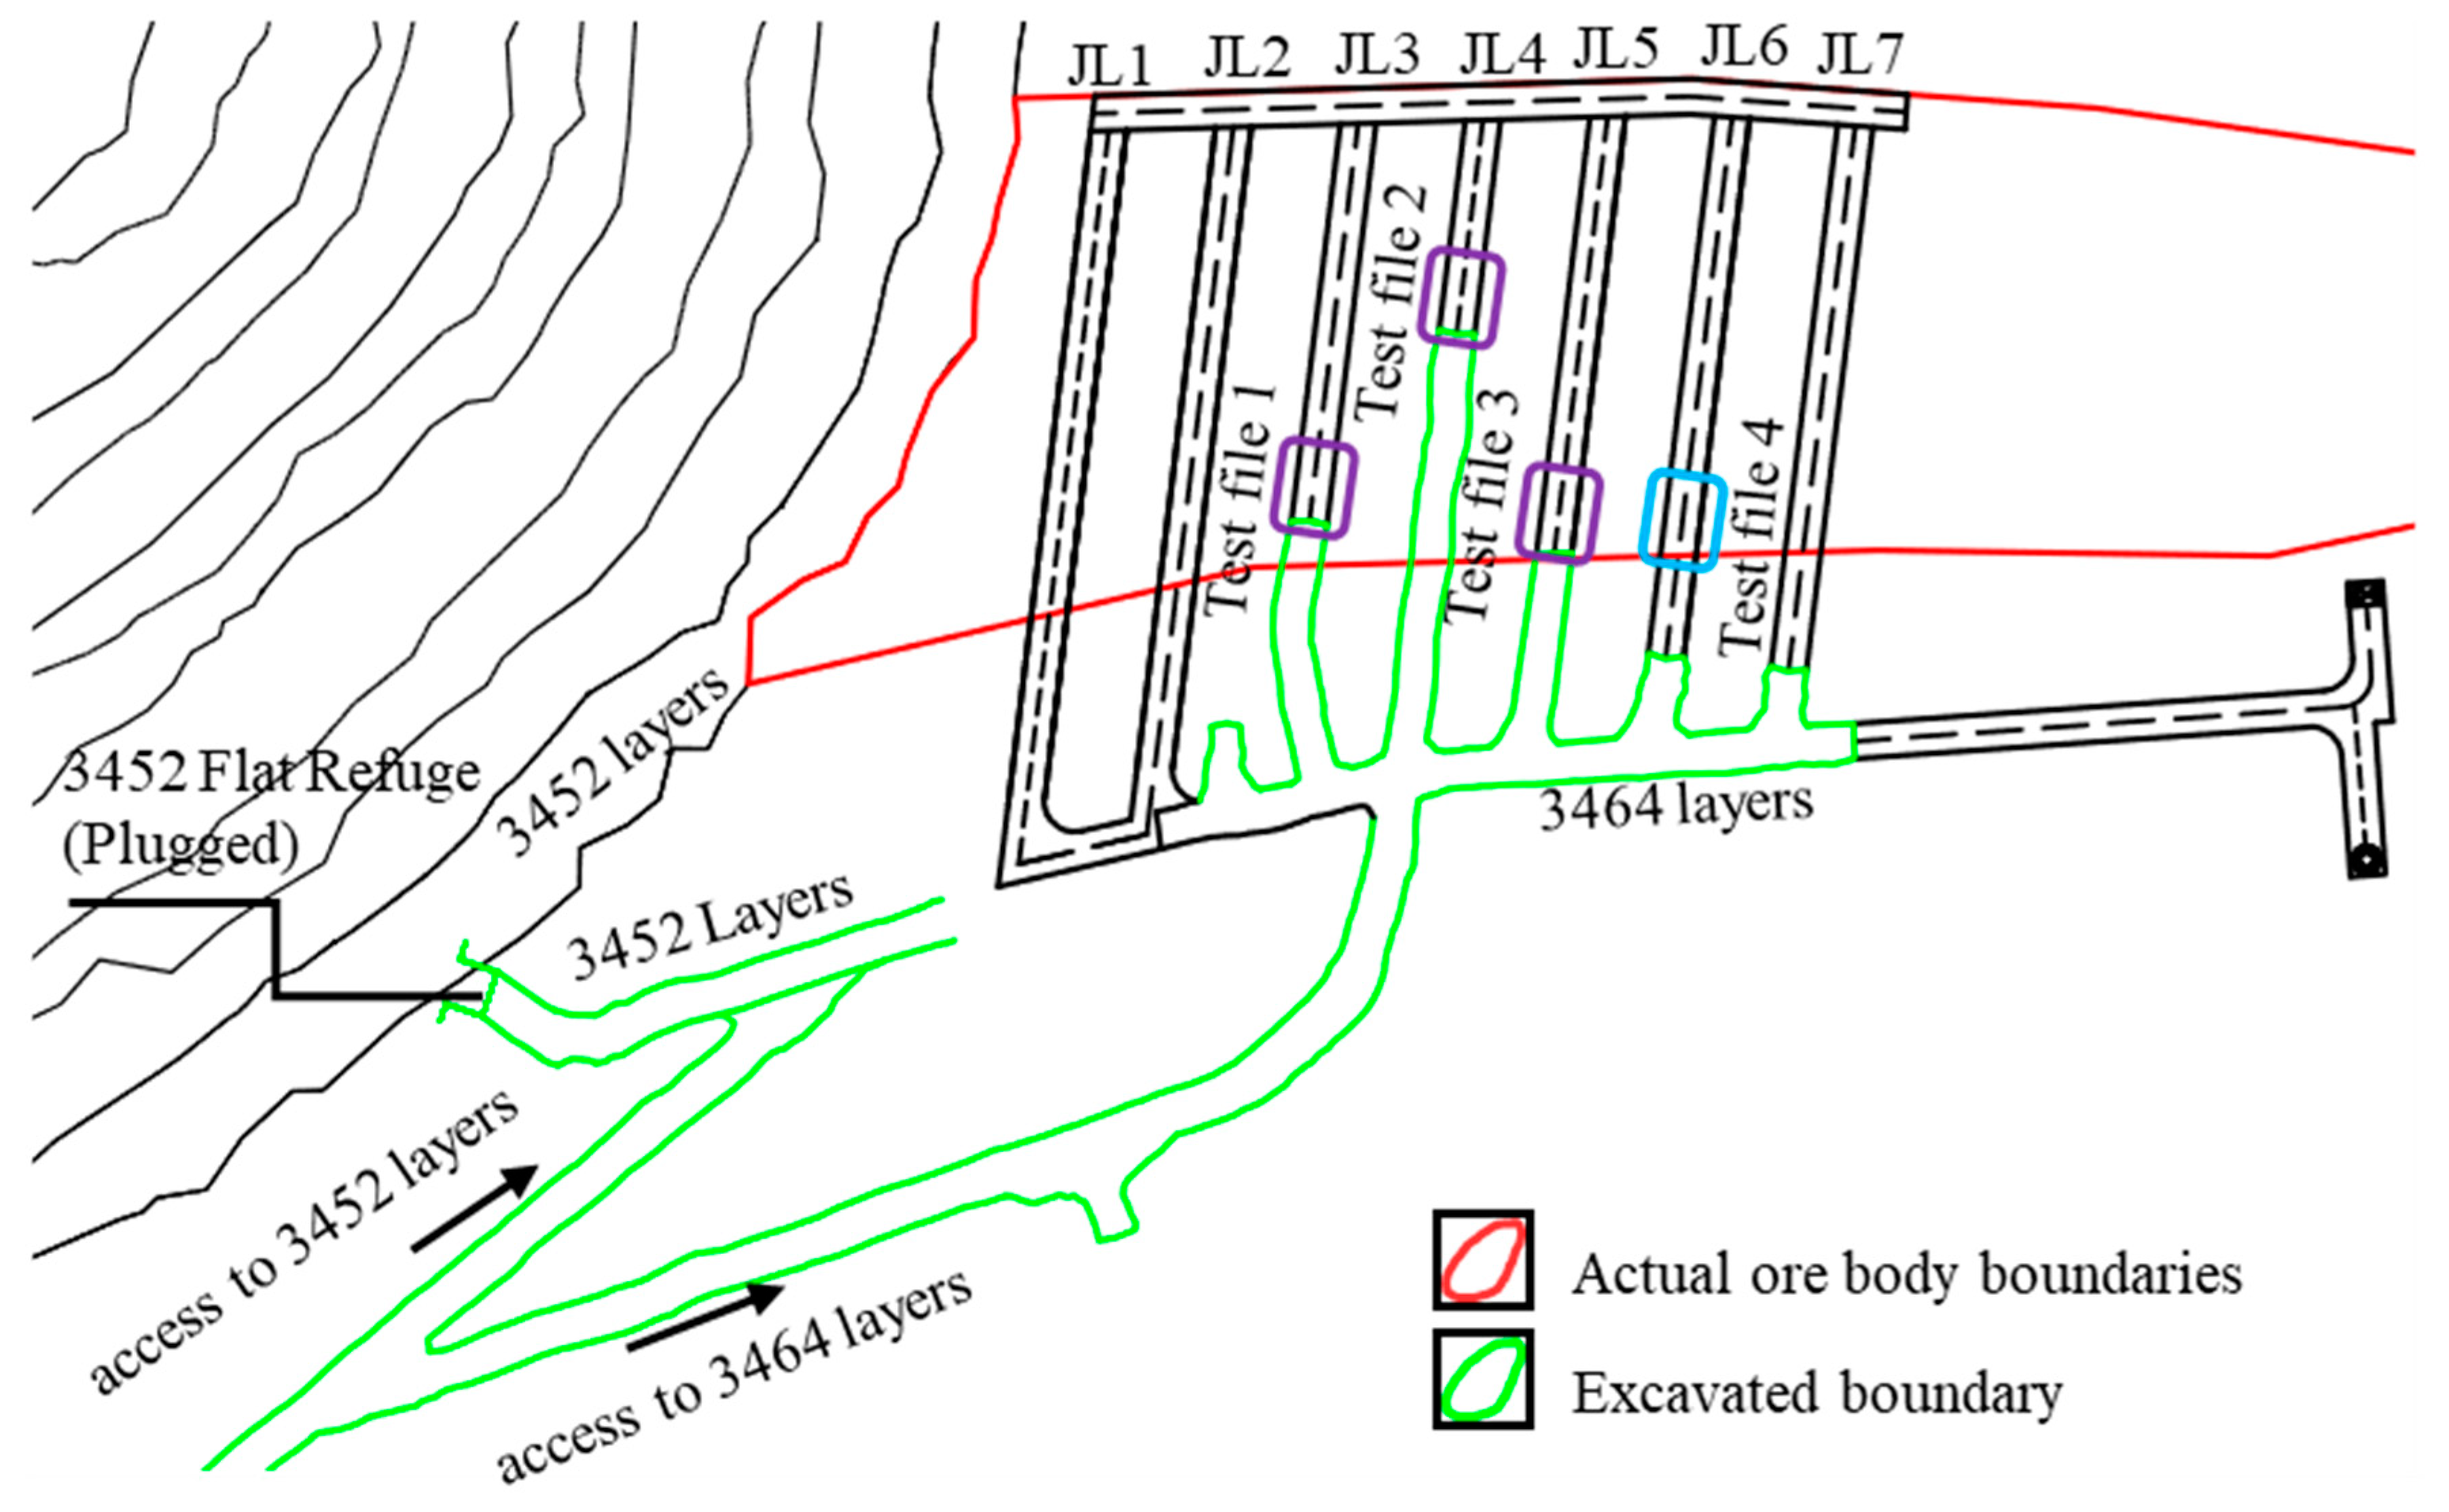
The blasting test was selected for this study at the 3464 level of the Beizhan iron ore mine (Figure 10). To reduce the lithology effect on the test results, the purple and blue areas in Figure 10 were selected as the test locations, and the test areas were located within the ore body. Among them, test areas 1 (3464#JL3), 2 (3464#JL4), and 3 (3464#JL5) were subjected to IRDT blasting tests, and each test area was subjected to five sets of blasting tests with TRDT of 50, 100, 150, 200, and 500 ms, respectively. Test area 4 (3464#JL6) underwent optimized blasting plans and control tests, with a total of three experiments conducted. Safety is always the primary consideration in determining the time required for post-blasting excavation and ventilation. A waiting period of about one hour is necessary after blasting operations to ensure the dissipation of any toxic gases generated, stabilization of the rock mass, and the absence of risk for further collapse.

4.3. Assessment Method of Rock Fragments

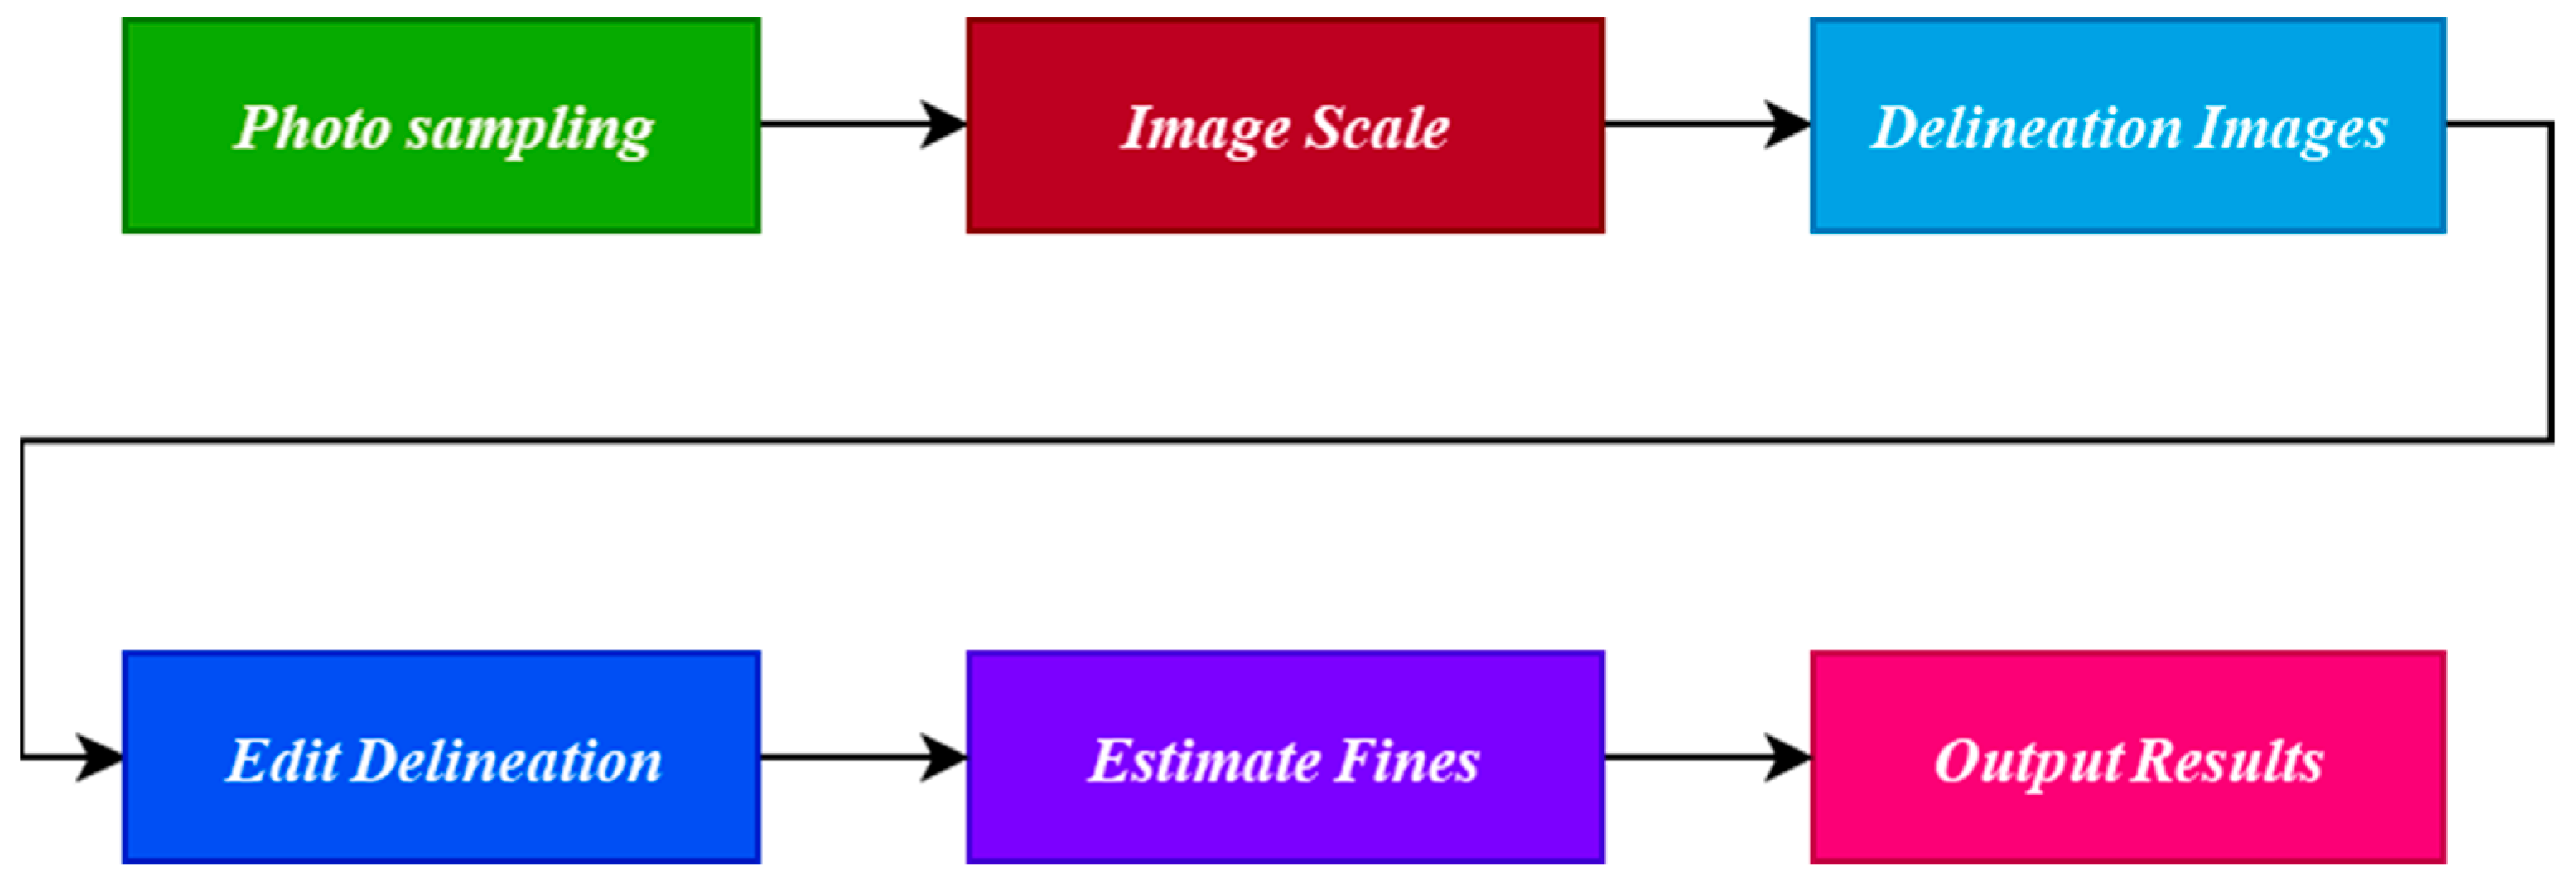
The rock fragmentation size distribution is an essential indicator for evaluating the blasting effect, which is the basis for improving rock fragmentation and conducting blast optimization studies [21]. In this paper, the photographic method was combined with Split Engineering’s Split-Desktop 4.0 software for rock fragmentation size analysis. Figure 11 shows the flowchart of the software realization to obtain the rock fragmentation size distribution data.

4.3.1. Photo Sampling

Photographic samples were obtained by tilting the mobile phone camera and taking a picture every 2 m along the centerline of the tunnel. These samples were analyzed using the block analysis software Split-Desktop 4.0. The block size was calculated based on the number of pixels occupied by each rock. However, tilting the camera may result in different numbers of pixels occupied by the same size in the width and height directions. Therefore, two perpendicular scale bars were placed on the muck pile during photography, as shown in Figure 12a.

4.3.2. Image Scale, Delineation Images, Edit Delineation, Estimate Fines

In Figure 12b, the actual length of the scale bar in the image was marked using the scale tool in the software, where the length of the scale bar is 1 m. Due to insufficient lighting in the underground mining area, the obtained photo samples contain many shadowed areas. The software’s delineation function treated the shadowed areas as small-size rocks and in this analysis treated them as boundaries. The fines factor is medium (50%) for Estimate fines.

4.3.3. Output Results

The description of the rock fragmentation degree uses the fragment sizes of 20% and 80% of the mass passing, percentage of large size fragments, percentage of small size fragments, average fragment sizes, and the largest fragment size [22,23]. The large fragment size is determined by the maximum size acceptable by the excavation or crushing equipment at the construction site or is defined based on engineering requirements. According to the requirement of the Beizhan iron ore concentrating mill, a fragment size less than or equal to 750 mm and larger than 750 mm are defined as the largest size fragments, and the percentage of large size fragments is denoted as (1-P750). Split-Desktop4.0 takes the percentage of size fragments 99.95% as the maximum size (Xmax = X99.95) and assumes Xmax = X99.5 in data processing with negligible error. Fragment sizes smaller than 25 mm are considered small-size fragments. Split-Desktop4.0 can output P25, P750, X20, X50, X80, and Xmax directly by setting the output options.

5. Results

The description of the experimental rock fragmentation results was obtained by image analysis of Split-Desktop 4.0 and Swebrec function analysis. The authors proved that the Swebrec function fitted well with the screened cumulative distribution curve [22]. The Swebrec function proposed by Ouchterlony is [24]:
P x = 1 1 + l n x m a x x l n x m a x x 50 b
where x50 is the average fragment size, xmax is the maximum fragment size, and b is the curve undulation parameter. The Swebrec function has a useful prediction range in X P , where 2 % < P < 100 % .
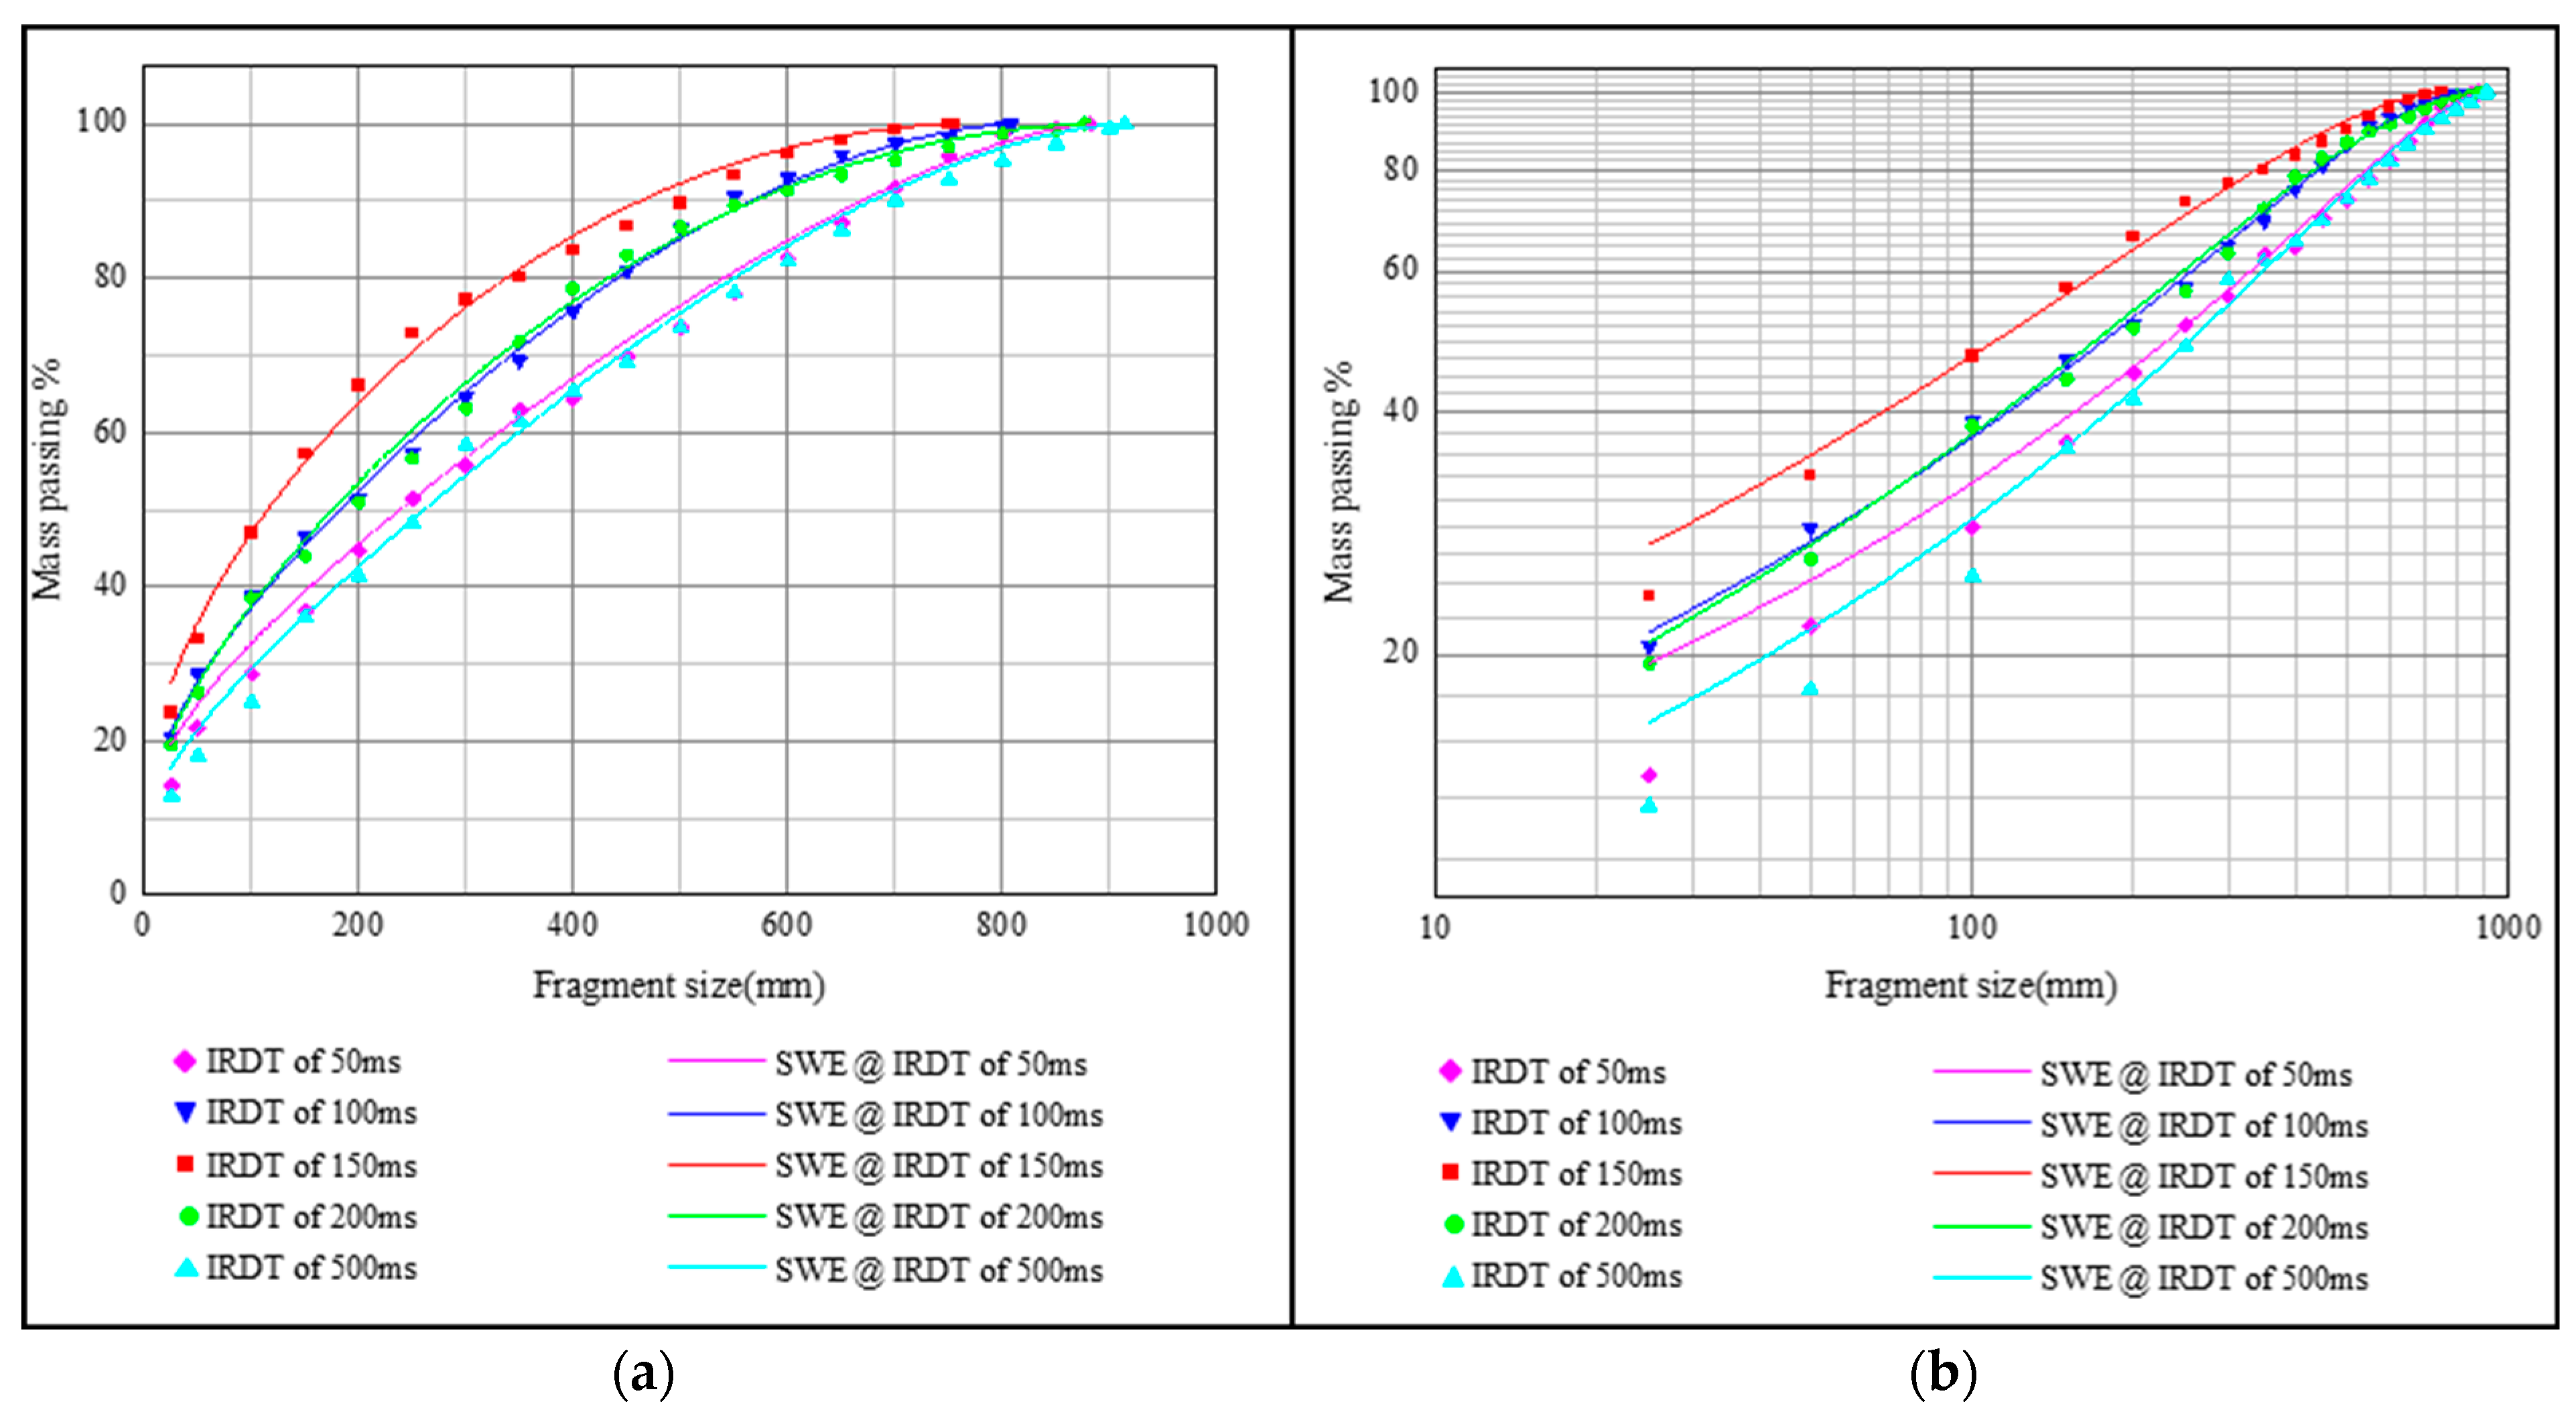
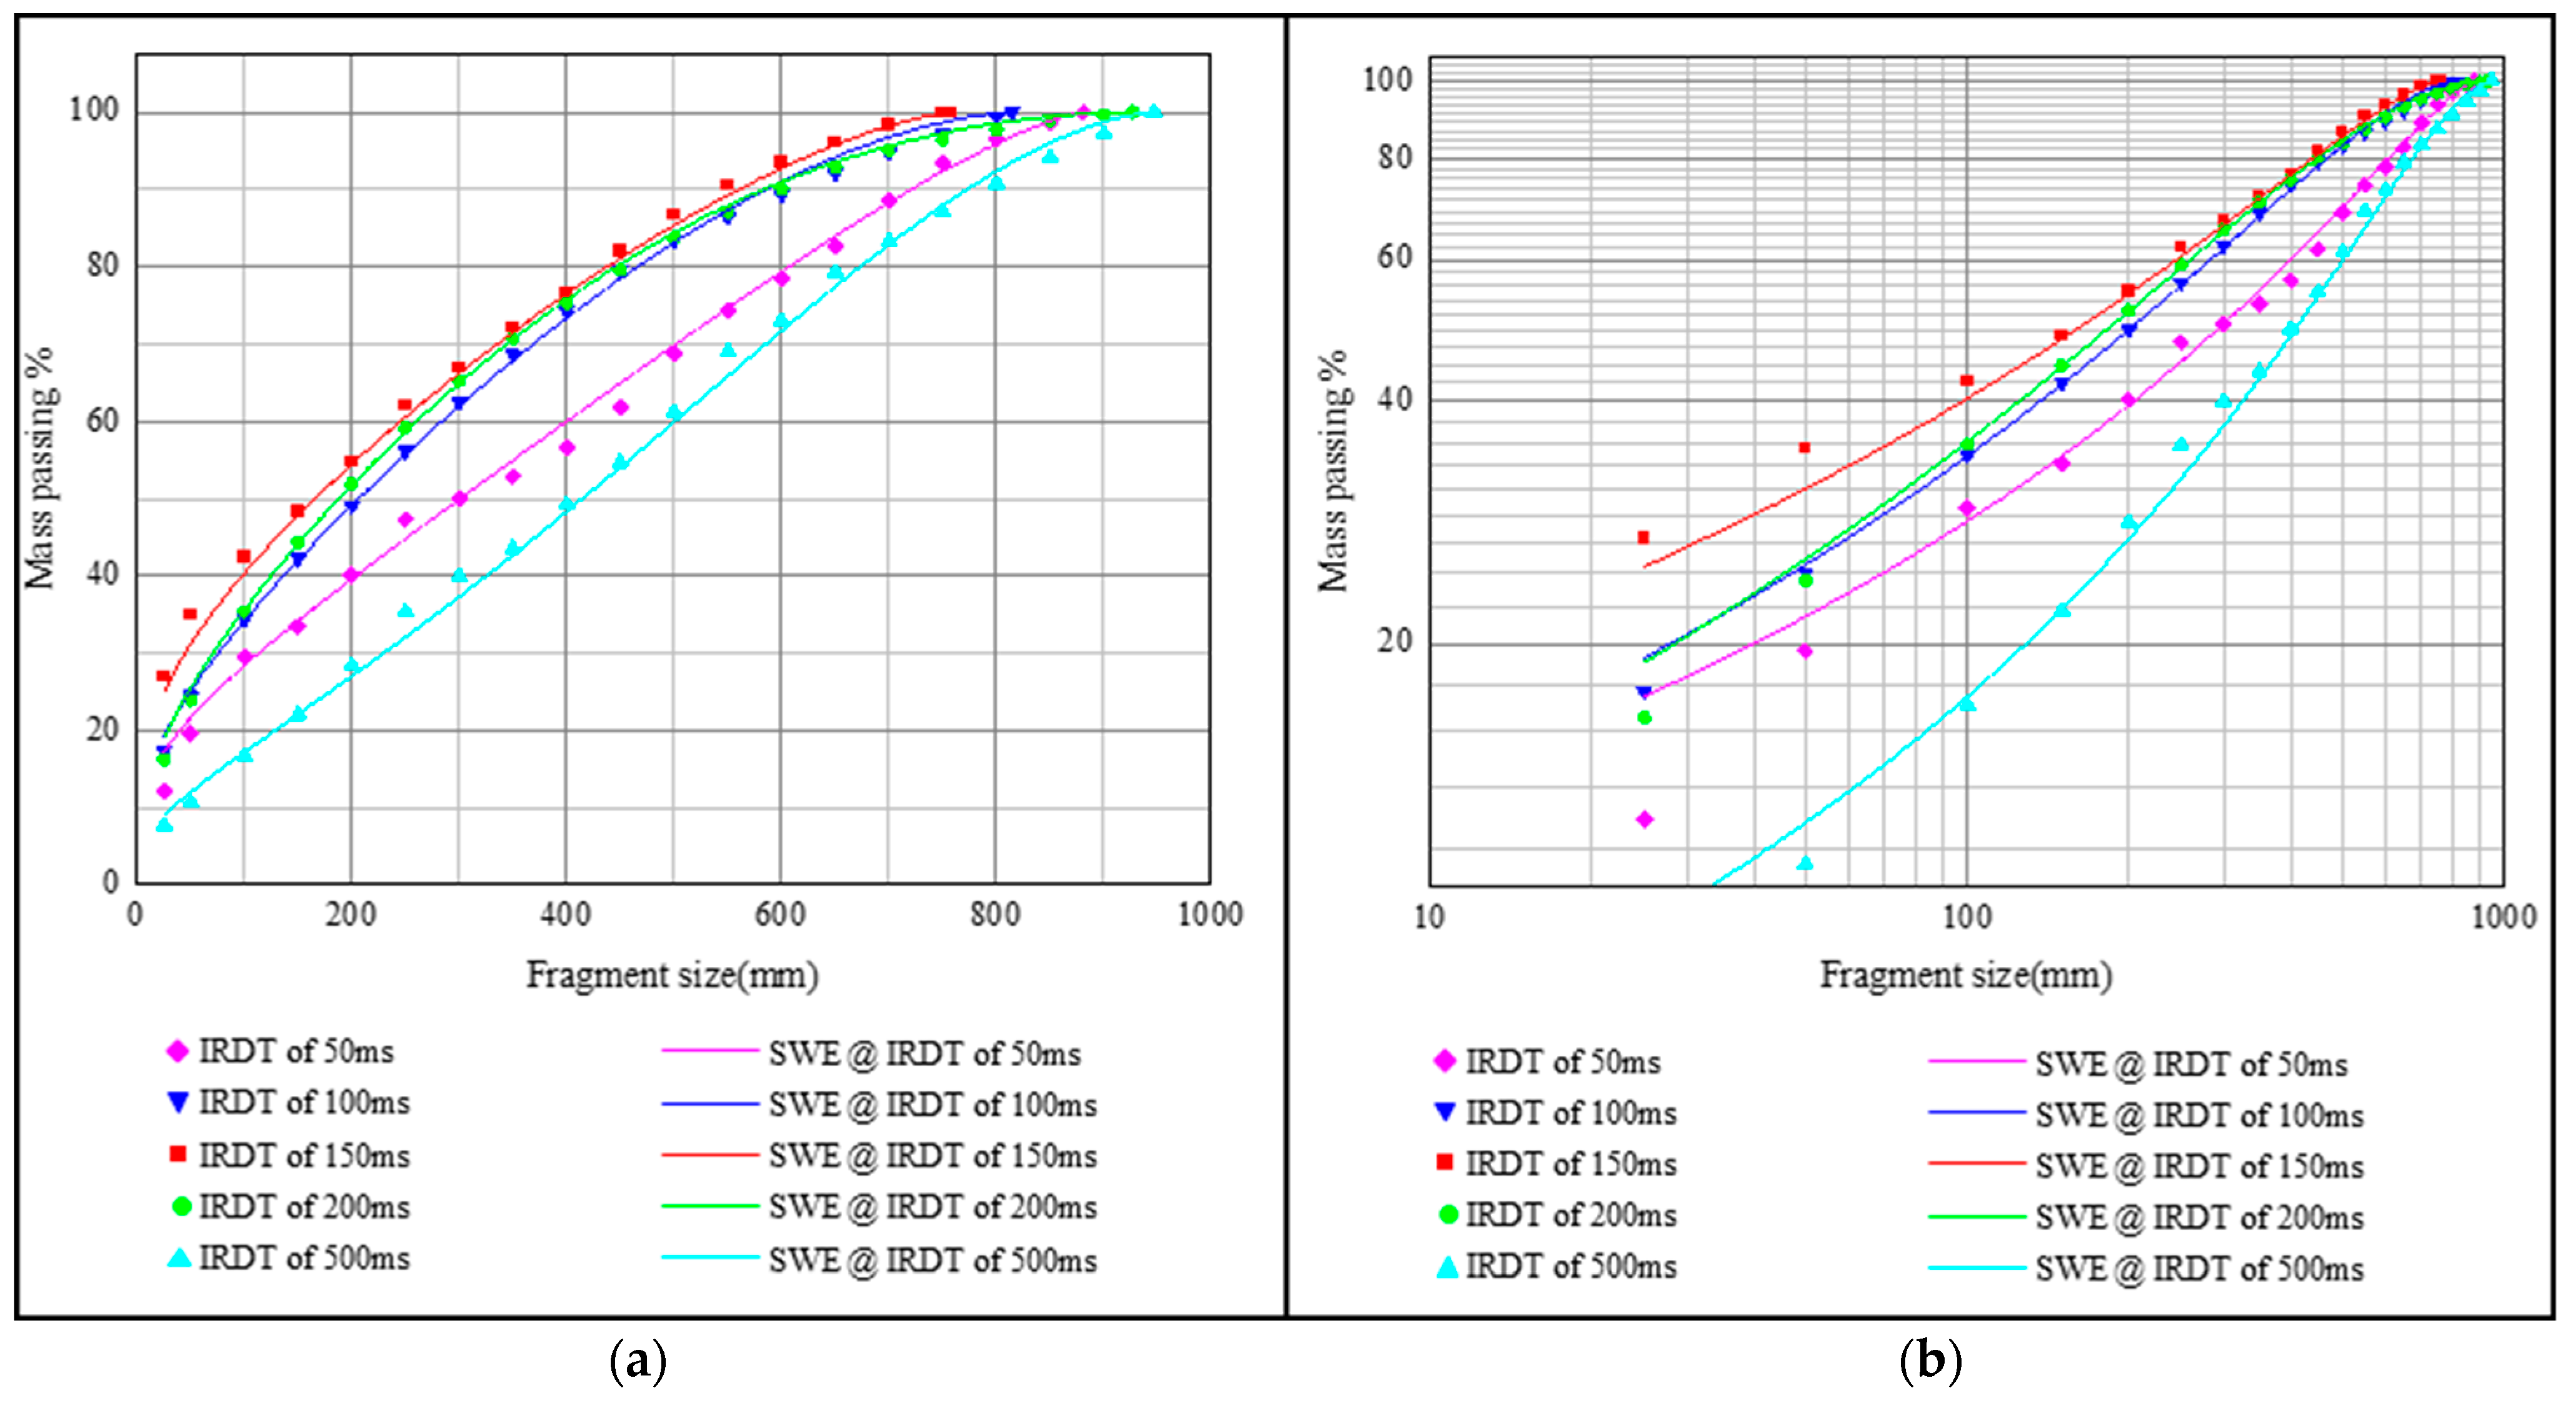
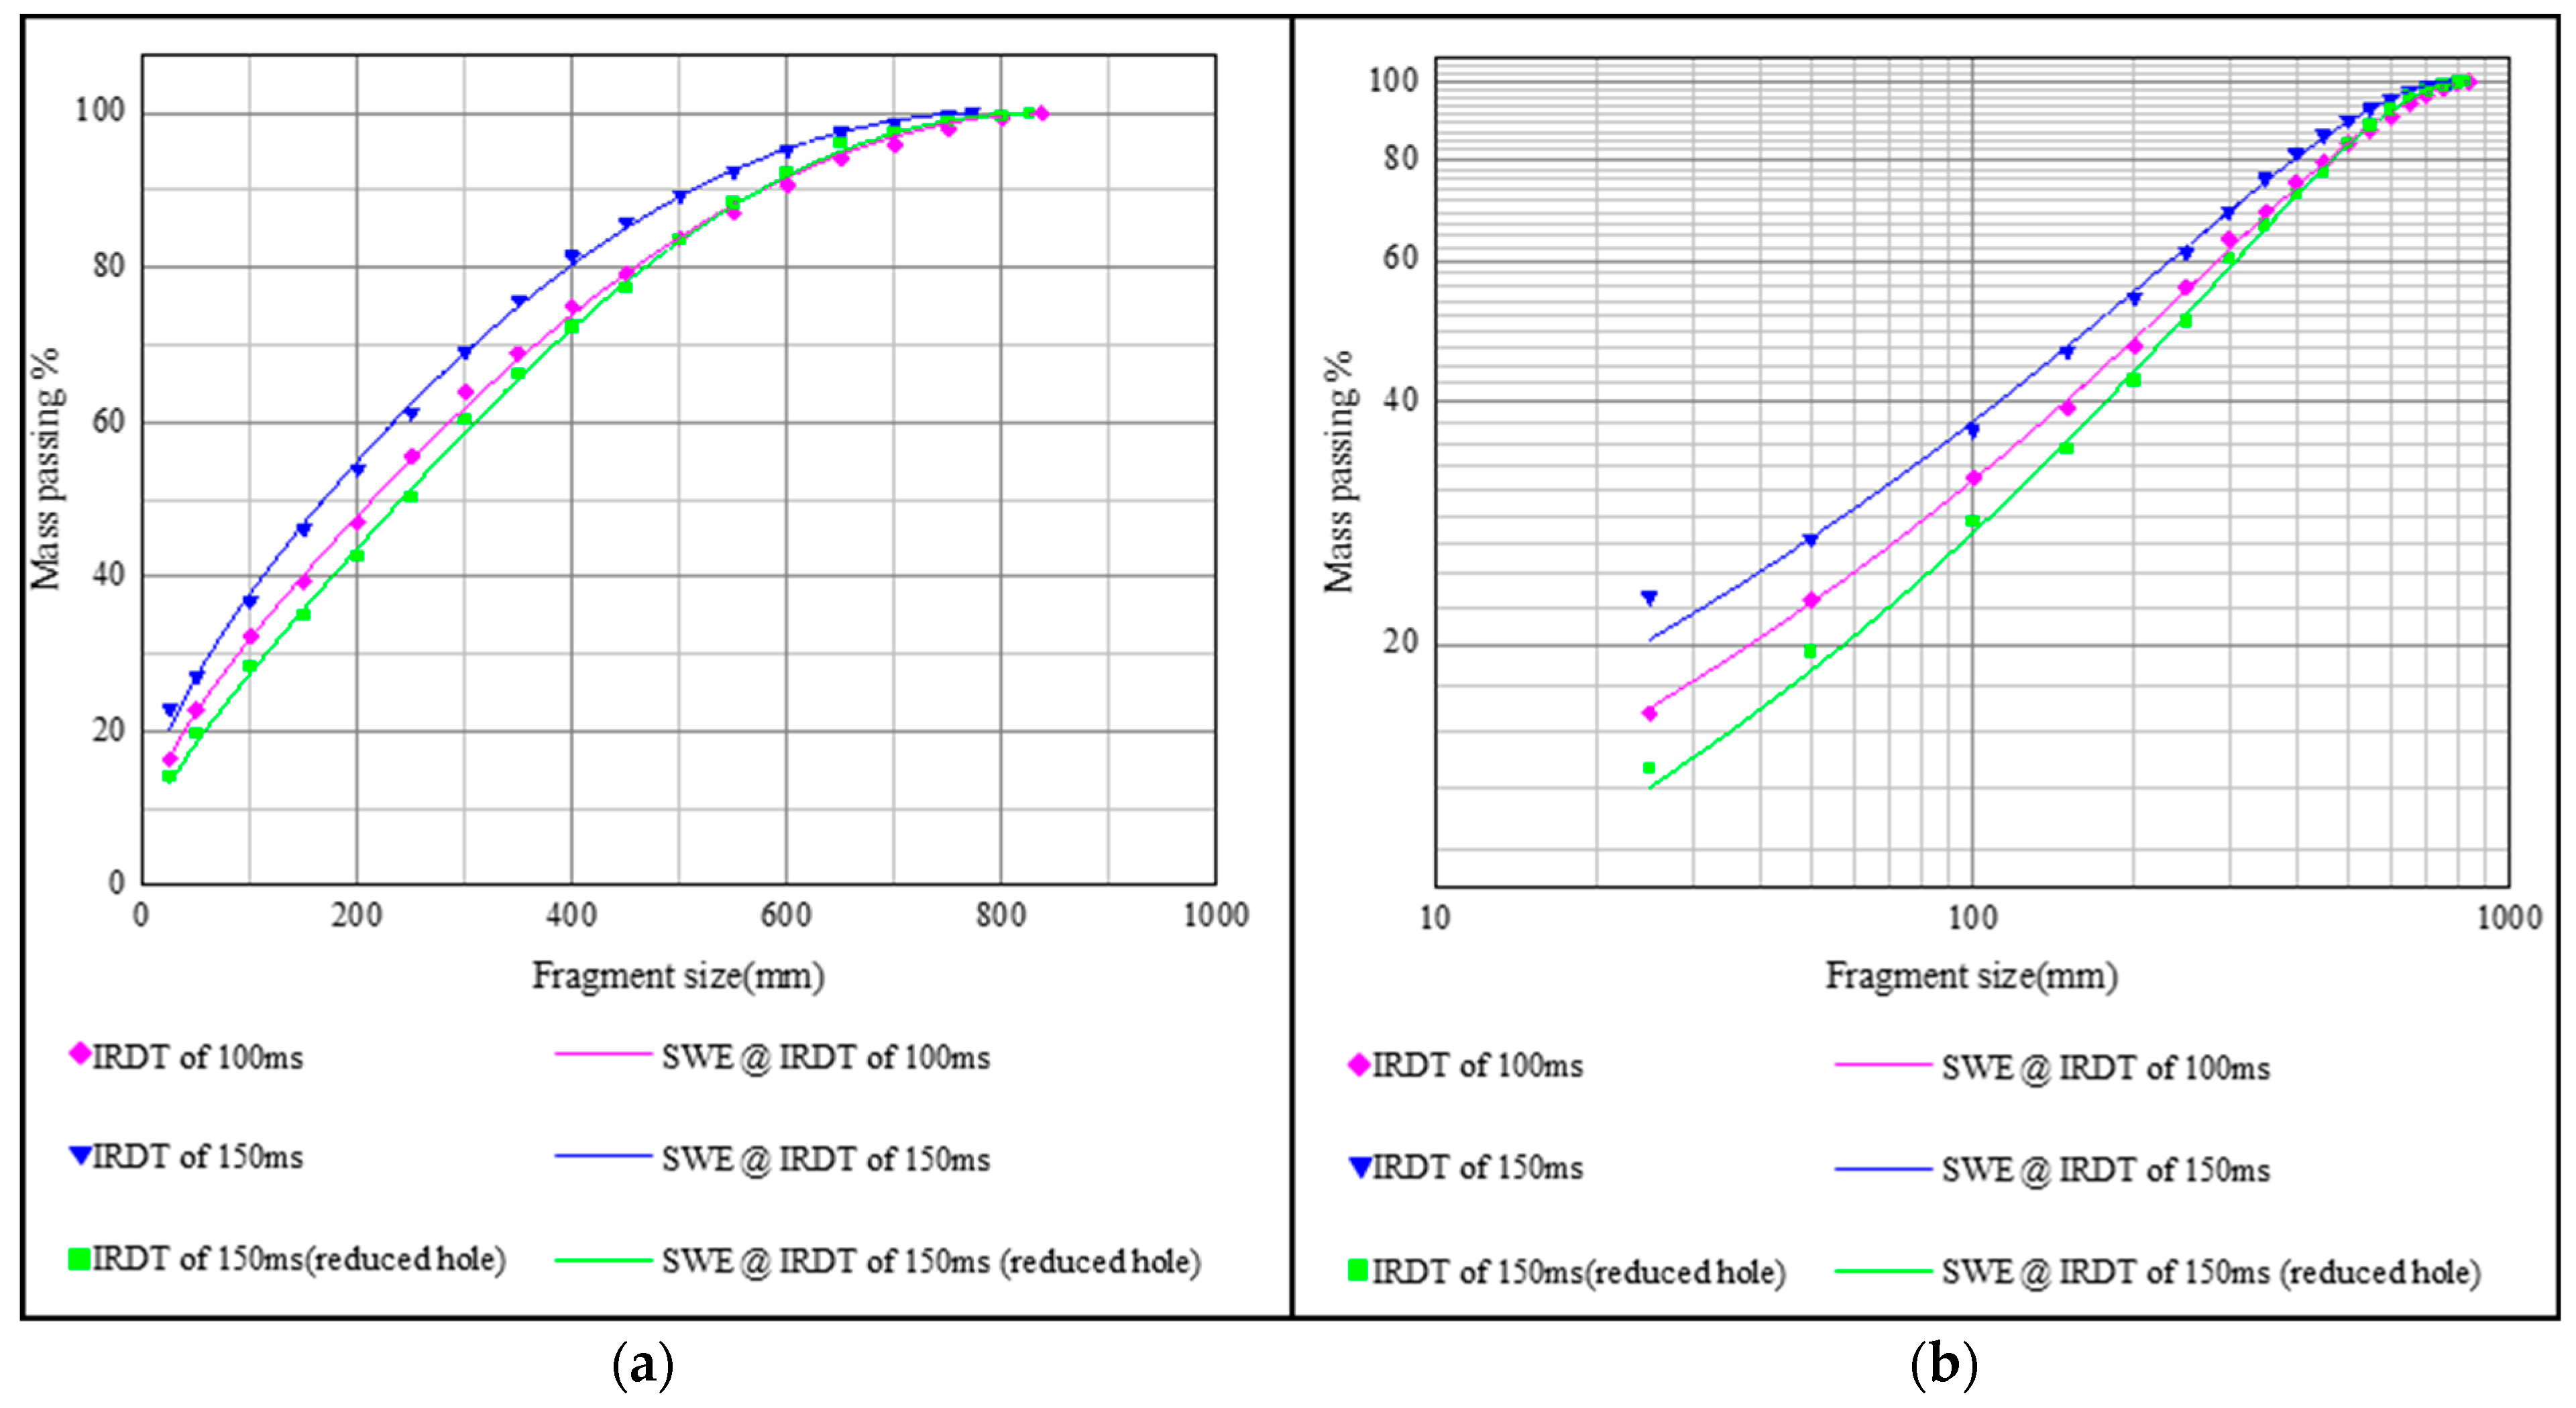
In this study, a total of 18 blast tests were conducted. The corresponding fragment size datasets for each test were obtained using the Split-Desktop 4.0. The Swebrec function was then used to fit each dataset, and the function parameters b , coefficient of determination R2 of each fit, are shown in Table 3. The results of rock fragmentation after blasting are presented in Table 4 and Table 5 and Figure 13, Figure 14, Figure 15 and Figure 16.
The image processing data were compared with those fitted by the Swebrec function. The coefficient of determination R2 ranged from 0.99243 to 0.99931, indicating a good fit, as shown in Table 3.
The blasting tests in test areas 1–3 all exhibited a significant effect of IRDT on rock fragmentation. With the increased IRDT, the percentage of small fragments P25 showed a trend of increasing and then decreasing; the percentage of large fragments (1-P750) showed a trend of decreasing and then increasing. Meanwhile, the percentage of fragment sizes X20, X50, X80, and Xmax all showed a trend of decreasing and then growing with the IRDT, as shown in Table 3 and Table 4 and Figure 13, Figure 14 and Figure 15. The test results were consistent with the IRDT on rock fragmentation mentioned in Section 3.4; the IRDT increased or decreased to a particular value, and the rock fragmentation impact was weakened. The blasting tests in test areas 1–3 also showed that the blasting with an IRDT of 150 ms provided the maximal number of small-sized fragments, the minimal number of large-sized ones, and the smallest average fragment size, indicating that the blasting solution with an IRDT of 150 ms provided more effective rock fragmentation than all other plans.
The results of the three blasting tests in test area 4 are shown in Table 3 and Table 5 and Figure 16. Compared with the control test (original blasting plan), Optimization Plan 1 (blast with an IRDT of 150 ms) reduces the fragment sizes X20, X50, X80, and the percentage of large fragments (1-P750) by 37.37%, 21.21%, 13.45%, and 90.37%, respectively, while increasing the percentage of small fragments P25 by 21.63%. This indicates that the rock fragmentation degree of Optimization Plan 1 is better than that of the original blasting design, which is consistent with the results of the IRDT blasting test. Moreover, this also suggests that, without changing the cost, rock fragmentation can be improved by controlling the IRDT. Compared Optimization Plan 2 (the reduced-hole blast with an IRDT of 150 ms) with the control experiment, the fragment sizes X20, X50, and X80 increased by 49.64%, 12.51%, and 2.05%, respectively, and the percentage of small fragments P25 decreases by 20.31%, but the percentage of large fragments (1-P750) decreases by 25.19%.

6. Discussion

In the case of using explosives to mine deposits, the degree of rock fragmentation is the standard for judging the blasting effect. Therefore, the degree of rock fragmentation is extremely important. For tunnel excavation blasting, due to the confinement effect of rock caused by only one free face, the cut blasting technique is usually used to increase the free surface and compensation space to improve rock fragmentation. Based on Section 3.4, the free face formed by the cut holes was divided into partial free surfaces and new free surfaces. In this regard, the effect of IRDT on the free surface and compensation space was analyzed by the blasting process. Then, the effect of IRDT on rock fragmentation was analyzed through collision theory. The obstructed completely free surfaces (i.e., the new free surface of this article) are more conducive to rock fragmentation than the partial free surfaces [25], based on the blasting process in Section 3.3; this can explain that changes in IRDT will also affect rock fragmentation. However, it is difficult to explain the case where IRDT is large. As shown in Figure 6c, although the R2 detonation forms a muck pile in the blasting cavity, the new free surfaces are still obstructed completely for R3, which is also conducive to rock fragmentation. This is different from the conclusion drawn in this article considering the collision of rocks in the same inter-ring, which is because the effect of inter-ring rock collision may be higher than the effect of obstructed completely free surfaces, or the motion of the obstruction has not been considered for the effect of obstructed completely free surfaces on rock fragmentation, which requires further research in subsequent experiments.
According to the consideration of same-ring rock collision in this article or the conclusion proposed by Zhang [25], to achieve sufficient rock fragmentation, a longer IRDT can be set to provide more collision space and a completely free face for the later blasting. As mentioned in Section 3.4, this will cause the later blasting rock to accumulate in the blasting cavity, reducing the collision space for subsequent blasting. At this time, appropriately reducing the minimum resistance line of the later blast hole can enable the rock thrown after the collision to be completely thrown, increasing the collision space for subsequent blasting and improving rock fragmentation. Therefore, the IRDT needs to be further discussed based on the tunnel width and the inclination angle of the blast holes.
As mentioned above, the IRDT affects the distribution of explosive energy, and further exploration is needed on its specific effects. The energy generated by the explosive can be converted into rock fragmentation, throwing, vibration, and other energy. In this blasting test, for the energy used to break rocks, the increase in inter-delay time shows a trend of first increasing and then decreasing. It is still unknown how IRDT affects the conversion of other energies. Therefore, future investigations can focus on the effects of IRDT on vibration and rock displacement and how it affects the distribution of explosive energy.

7. Conclusions

Based on the analysis of energy conversion in inelastic collision, it can be concluded that the degree of object destruction during collision depends on the relative velocity in the horizontal direction. In the analysis of the effect of IRDT on rock fragmentation in tunnel excavation blasting, the collision factor between the same ring rock was taken into consideration. It was found that the appropriate choice of IRDT influenced the distribution of explosive energy and improved rock fragmentation. When the IRDT was too short or too long, the degree of rock fragmentation was reduced. To address this, the IRDT blasting tests were conducted. Based on the analysis of rock fragmentation energy and the results of IRDT blasting tests, two optimized blasting plans were proposed. Compared with the original blasting plan, both sets of optimized blasting plans achieved better control over blasting cost and rock fragmentation.
  • IRDT blasting tests
    • For blasting tests with IRDTs of 50, 100, 150, 200, and 500 ms, the content of the percentage of small fragments P25 and the fragment sizes X20, X50, X80, and Xmax first increased and then decreased, while the percentage of large fragments (1-P750) decreased first and then increased.
    • Among the test plans, the delay timing of 150 ms resulted in the lowest percentage of large fragments (1-P750) and the highest percentage of small fragments (P25 mm), indicating better rock fragmentation.
  • Optimized blasting tests
    • Compared with the control test (original blasting plan), optimized plan 1 achieved better rock fragmentation without changing the blasting cost. For example, the fragment sizes X20, X50, and X80, and the percentage of large fragments (1-P750) reduced by 37.37%, 21.21%, 13.45%, and 90.37%, respectively, and the percentage of small fragments P25 increased by 21.63%.
    • Furthermore, optimized plan 2 achieved a cost reduction while maintaining the degree of rock fragmentation, with the use of digital electronic detonators and explosives reduced by 14.0% and 27.27%, respectively.

Author Contributions

Conceptualization, H.C. and C.L.; methodology, H.C.; software, H.C. and C.L.; validation, Y.F. and H.Y.; formal analysis, H.C.; investigation, H.C., Y.F. and H.Y.; resources, C.L.; data curation, H.C.; writing—original draft preparation, H.C.; writing—review and editing, C.L. and Y.F.; visualization, H.C.; supervision, H.C.; project administration, H.C.; funding acquisition, H.C. All authors have read and agreed to the published version of the manuscript.

Funding

This research was funded by the Accurate Delay Rock Breaking Mechanism and Key Technology Innovation Team, grant number 2020D14043.

Data Availability Statement

The original contributions presented in the study are included in the article, further inquiries can be directed to the corresponding author.

Acknowledgments

We are grateful to the anonymous reviewers for their insightful and constructive comments for improving the manuscript.

Conflicts of Interest

Yin Feng was employed by the company North Blasting Technology Co., Ltd. (Beijing China). The remaining authors declare that the research was conducted without any commercial or financial relationships that could be construed as a potential conflict of interest.

References

  1. Sanchidrian, J.A.; Ouchterlony, F.; Segarra, P.; Moser, P. Size Distribution Functions for Rock Fragments. Int. J. Rock Mech. Min. Sci. 2014, 71, 381–394. [Google Scholar] [CrossRef]
  2. Sharma, A.; Mishra, A.K.; Choudhary, B.S.; Meena, R. Impact of Blast Design Parameters on Rock Fragmentation in Building Stone Quarries. Curr. Sci. 2019, 116, 1861–1867. [Google Scholar] [CrossRef]
  3. Zhang, Z.-X. Rock Fracture and Blasting: Theory and Applications; Butterworth-Heinemann: Oxford, UK, 2016. [Google Scholar]
  4. Zhang, Z.-X.; Sanchidrian, J.A.; Ouchterlony, F.; Luukkanen, S. Reduction of Fragment Size from Mining to Mineral Processing: A Review. Rock Mech. Rock Eng. 2023, 56, 747–778. [Google Scholar] [CrossRef]
  5. Cardu, M.; Seccatore, J.; Vaudagna, A.; Rezende, A.; Galvão, F.; Bettencourt, J.; de Tomi, G. Evidences of the Influence of the Detonation Sequence in Rock Fragmentation by Blasting—Part II. Rem Rev. Esc. Minas 2015, 68, 455–462. [Google Scholar] [CrossRef]
  6. Rossmanith, H.P. The Use of Lagrange Diagrams in Precise Initiation Blasting. Part I: Two Interacting Blastholes. Fragblast 2002, 6, 104–136. [Google Scholar] [CrossRef]
  7. Rossmanith, H.P.; Kouzniak, N. Supersonic Detonation in Rock Mass-Part 2: Particle Displacements and Velocity Fields for Single and Multiple Non-Delayed and Delayed Detonating Blastholes. Fragblast 2004, 8, 95–117. [Google Scholar] [CrossRef]
  8. Vanbrabant, F.; Espinosa, A. Impact of Short Delays Sequence on Fragmentation by Means of Electronic Detonators: Theoretical Concepts and Field Validation. Fragblast 2006, 8, 326–331. [Google Scholar]
  9. Cho, S.H.; Kaneko, K. Rock Fragmentation Control in Blasting. Mater. Trans. 2004, 45, 1722–1730. [Google Scholar] [CrossRef]
  10. Sjöberg, J.; Schill, M.; Hilding, D.; Yi, C.-P.; Nyberg, U.; Johansson, D. Computer Simulations of Blasting with Precise Initiation. In Proceedings of the ISRM International Symposium-EUROCK 2012, Stockholm, Sweden, 28–30 May 2012; OnePetro: Richardson, TX, USA, 2012. [Google Scholar]
  11. Yi, C.-P.; Johansson, D.; Nyberg, U.; Beyglou, A. Stress Wave Interaction Between Two Adjacent Blast Holes. Rock Mech. Rock Eng. 2016, 49, 1803–1812. [Google Scholar] [CrossRef]
  12. Yi, C.-P.; Sjöberg, J.; Johansson, D.; Petropoulos, N. A Numerical Study of the Impact of Short Delays on Rock Fragmentation. Int. J. Rock Mech. Min. Sci. 2017, 100, 250–254. [Google Scholar] [CrossRef]
  13. Johansson, D.; Ouchterlony, F. Shock Wave Interactions in Rock Blasting: The Use of Short Delays to Improve Fragmentation in Model-Scale. Rock Mech. Rock Eng. 2013, 46, 1–18. [Google Scholar] [CrossRef]
  14. Shi, X.-Z.; Qiu, X.-Y.; Zhou, J.; Wang, Y.; Nie, J.; Li, B.-H. Technology and Case Study of Ultra-Large Section and High Shaft Excavation by Short-Millisecond Spherical-like Blasting. Chin. J. Rock Mech. Eng. 2016, 35, 1659–1667. [Google Scholar]
  15. Gao, X.T. A Review of the Study on Energy Distribution of Explosives in Rock Fragmentation and Prospects. Constr. Eng. 2009, 41, 1–6+10. [Google Scholar] [CrossRef]
  16. Yan, S.L.; Chen, Y.Q. Calculation of Energy Distribution from Concentrated Explosive Charges in Rock. Blasting Equip. 1993, 1–5. [Google Scholar]
  17. Carroll, M.M. Mechanics of Geological Materials. Appl. Mech. Rev. 1985, 38, 1256. [Google Scholar] [CrossRef]
  18. Revnivtsev, V.I. We Really Need Revolution in Comminution. In Proceedings of the XVI International Mineral Processing Congress, Delhi, India, 24–28 September 2012; Elsevier Science Publishers: Amsterdam, The Netherlands, 1988; pp. 93–114. [Google Scholar]
  19. Stronge, W.J. Impact Mechanics; Cambridge University Press: Cambridge, UK, 2000; pp. 26–29. [Google Scholar]
  20. Henrych, J.; Abrahamson, G.R. The Dynamics of Explosion and Its Use. J. Appl. Mech. 1980, 47, 218. [Google Scholar] [CrossRef]
  21. Bamford, T.; Esmaeili, K.; Schoellig, A.P. A Deep Learning Approach for Rock Fragmentation Analysis. Int. J. Rock Mech. Min. Sci. 2021, 145, 104839. [Google Scholar] [CrossRef]
  22. Ylitalo, R.M. Effect of Detonator Position on Rock Fragmentation: Full-Scale Field Tests at Kevitsa Open Pit Mine. Int. J. Rock Mech. Min. Sci. 2021, 147, 104918. [Google Scholar] [CrossRef]
  23. Ouchterlony, F.; Sanchidrián, J.A. A Review of Development of Better Prediction Equations for Blast Fragmentation. J. Rock Mech. Geotech. Eng. 2019, 11, 1094–1109. [Google Scholar] [CrossRef]
  24. Ouchterlony, F. The Swebrec© Function: Linking Fragmentation by Blasting and Crushing. Min. Technol. 2005, 114, 29–44. [Google Scholar] [CrossRef]
  25. Zhang, Z.-X.; Hou, D.-F.; Guo, Z.; He, Z.; Zhang, Q. Experimental Study of Surface Constraint Effect on Rock Fragmentation by Blasting. Int. J. Rock Mech. Min. Sci. 2020, 128, 104278. [Google Scholar] [CrossRef]
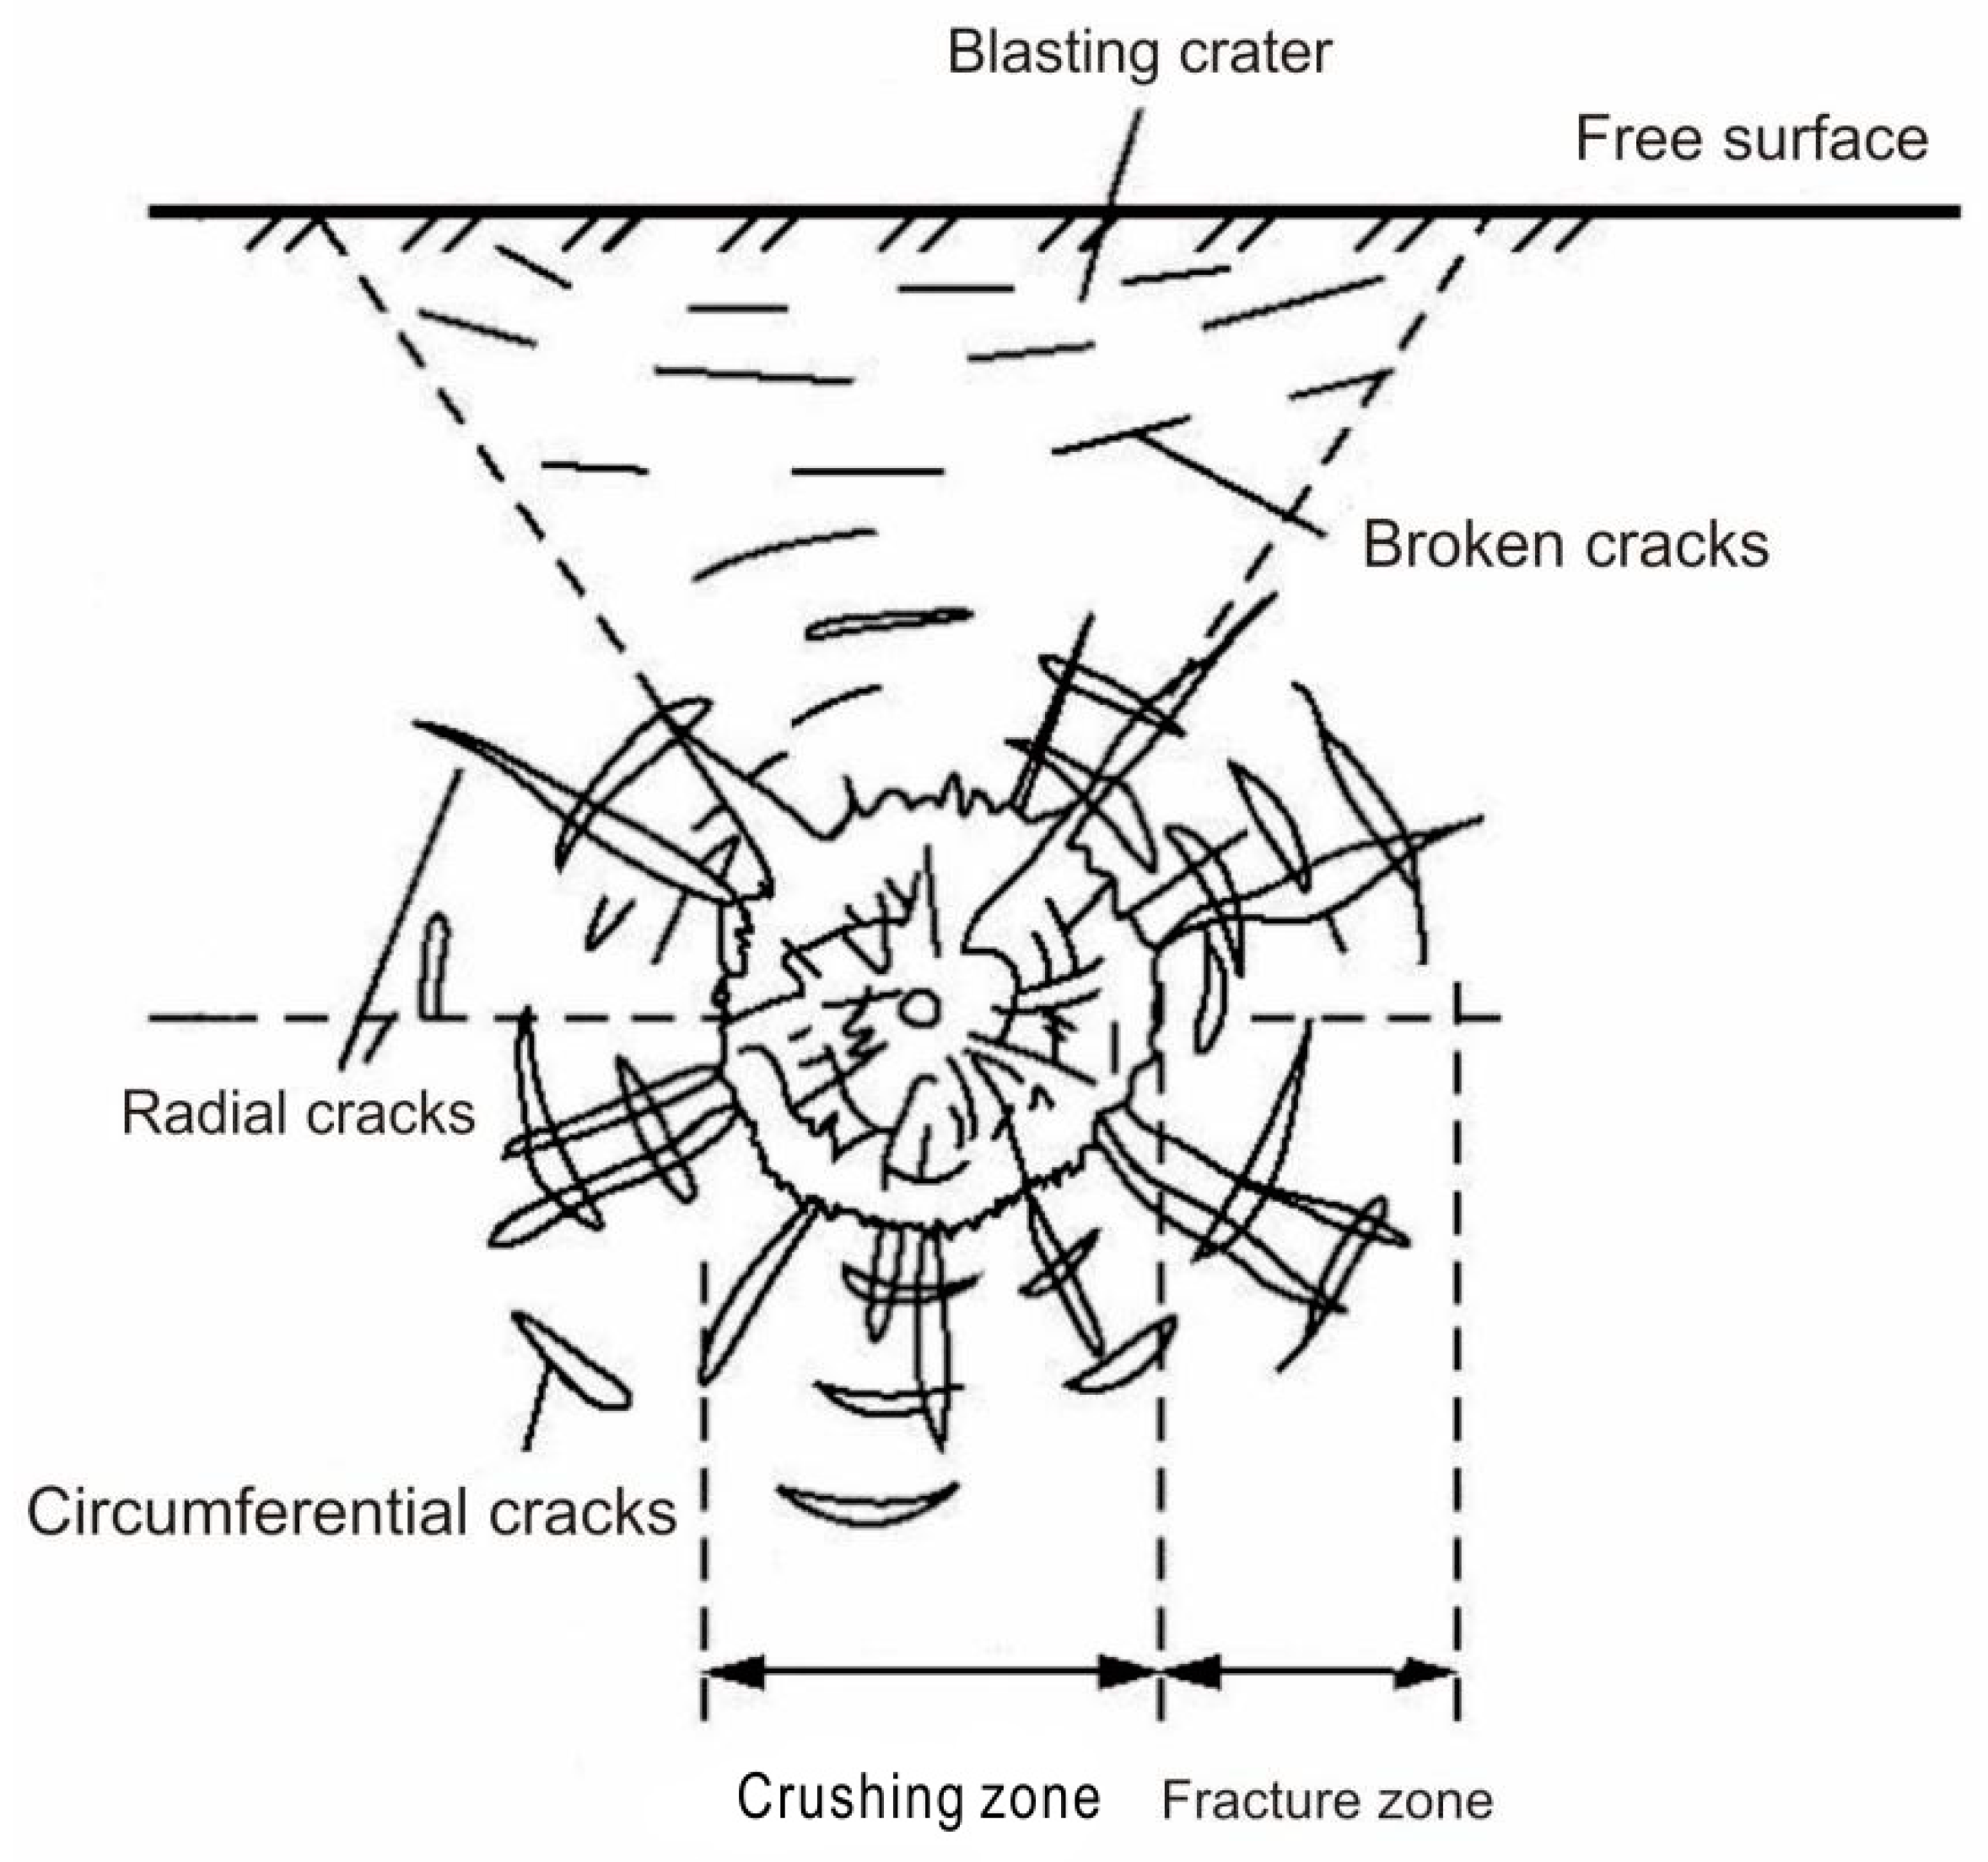
Figure 1. The schematic diagram of blasting rock-breaking.
Applsci 14 06372 g001
Figure 2. Original blasting pattern.
Applsci 14 06372 g002
Figure 3. Schematic diagram of an inelastic collision: (a) a central collision; (b) a non-central collision.
Applsci 14 06372 g003
Figure 4. Rock damage caused by explosive blast.
Applsci 14 06372 g004
Figure 5. Explosive load and rock interaction processes: (a) experience t 1 + t 2 time to form a free surface; (b) experience t 1 + t 2 + t 3 time to form a blasting funnel, where t 3 is the rock throwing time; (c) burst rock is completely thrown.
Applsci 14 06372 g005
Figure 6. Tunnel excavation blasting model with different IRDTs: (a) tunnel excavation blasting model with IRDT of t 1 ; (b) tunnel excavation blasting model with IRDT of t 2 ; (c) tunnel excavation blasting model with IRDT of t 3 ( t 3 is larger); where t 3 > t 2 > t 1 .
Applsci 14 06372 g006
Figure 7. Blast hole field distribution.
Applsci 14 06372 g007
Figure 8. Blast test design for reduced hole.
Applsci 14 06372 g008
Figure 9. Blastholes for the blasting plan 2 field distribution.
Applsci 14 06372 g009
Figure 10. Blasting test area (3464 layers).
Applsci 14 06372 g010
Figure 11. Split-Desktop 4.0 Software Operation Procedure.
Applsci 14 06372 g011
Figure 12. Picture sample and processing picture of muck pile: (a) picture sample; (b) processing picture.
Applsci 14 06372 g012
Figure 13. Accumulated mass passing (%) versus fragment size in the test field 1. (a) In a linear scale; (b) in a logarithm scale.
Applsci 14 06372 g013
Figure 14. Accumulated mass passing (%) versus fragment size in the test field 2. (a) In a linear scale; (b) in a logarithm scale.
Applsci 14 06372 g014
Figure 15. Accumulated mass passing (%) versus fragment size in the test field 3. (a) In a linear scale; (b) in a logarithm scale.
Applsci 14 06372 g015
Figure 16. Accumulated mass passing (%) versus fragment size in the test field 4. (a) In a linear scale; (b) in a logarithm scale.
Applsci 14 06372 g016
Table 1. Physical and Mechanical Parameters of ore rocks.
RuggednessWave Speed
(km/s)
Tensile Strength
(MPa)
UCS
(MPa)
Young’s Modulus
(GPa)
Poisson’s Ratio
Chloritized silica3.247.756.4380.20
Magnetized silica4.1110.282.1440.27
Crystalline tuff3.538.359.3350.20
Table 2. Blasting parameters of optimization plan 1, original plan and optimization plan 2.
ParameterPlans Comparison
Optimization Plan 1 and Original PlanOptimization Plan 2Change (%)
No. of blastholes
(detonators)
5043−14.0%
Total Explosives6648−27.27%
Table 3. Swebrec function parameters of each dataset and corresponding coefficient of determination (R2).
Test field 1, 3464#JL3Xmax (mm)X50 (mm)bR2
50 ms881.48 238.41.412730.99243
100 ms808.71 181.841.541320.99819
150 ms756.89 115.07 1.640630.99419
200 ms877.39 175.251.700780.99591
500 ms913.89 260.881.537950.99393
Test field 2, 3464#JL4Xmax (mm)X50 (mm)bR2
50 ms909.05 259.631.678840.99723
100 ms811.03 204.531.701850.99641
150 ms757.16 128.822.103320.99244
200 ms880.29 196.61.723510.9945
500 ms894.38 264.311.845680.99672
Test field 3, 3464#JL5Xmax (mm)X50 (mm)bR2
50 ms881.16 300.551.311330.99491
100 ms814.74 206.351.542390.99824
150 ms758.22 165.721.362730.99672
200 ms927.16 187.791.776860.99882
500 ms946.83 414.581.56880.9972
Test field 4, 3464#JL6Xmax (mm)X50 (mm)bR2
100 ms836.66 213.92 1.700820.9991
150 ms772.11 168.541.682780.99883
150 ms (Reduced hole)825.73 240.691.797960.99931
Table 4. Fragment sizes ×20, ×50, ×80, percentage of small (<25 mm) and large (>700 mm) size fragments based on the image processing data and the corresponding Swebrec function data in the test field 1,2,3.
Test field 1,
3464#JL3
50 ms100 ms150 ms200 ms500 ms50 ms100 ms150 ms200 ms500 ms
X20 (mm)25.3120.28 8.39 26.24 58.5426.9220.649.4323.0541.67
X50 (mm)238.4181.84115.07 175.25260.88238.4181.84115.07 175.25260.88
X80 (mm)524.56 434.85179.64348.61529.75 539.94440.70336.98430.11549.34
P25 (%)14.1520.4723.6419.4812.9619.5321.3627.4120.6216.50
1-P750 (%)4.241.710.112.997.214.950.990.021.875.51
Test field 2,
3464#JL4
50 ms100 ms150 ms200 ms500 ms50 ms100 ms150 ms200 ms500 ms
X20 (mm)59.32 28.9520.3641.7466.27 51.9836.1424.6830.8667.53
X50 (mm)259.63204.53128.82196.6264.31259.63204.53128.82196.6264.31
X80 (mm)547.29 438.62251.68427.83509.65 525.13440.66302.88450.15503.18
P25 (%)10.7718.5823.6215.299.7214.5717.1220.1318.3712.06
1-P750 (%)5.561.080.133.275.194.120.7502.072.73
Test field 3,
3464#JL5
50 ms100 ms150 ms200 ms500 ms50 ms100 ms150 ms200 ms500 ms
X20 (mm)51.4635.18 9.59 33.54 119.15 39.8627.9211.3128.45128.35
X50 (mm)300.55206.35165.72187.79414.58300.55206.35165.72187.79414.58
X80 (mm)619.27452.36 409.37 455.83 654.25 606.39465.85437.53445.98673.05
P25 (%)12.1117.4627.0316.197.7517.2219.2224.9518.988.19
1-P750 (%)6.572.830.173.5312.917.661.30.122.6912.08
Table 5. Fragment sizes X20, X50, X80, percentage of small P25 and large (1-P750) size fragments, and the change 1 (%) between 100 ms and 150 ms, and the change 2 (%) between 100 ms and 150 ms (Reduced hole) based on the image processing data and the corresponding Swebrec function data in the test field 4.
Test Field 4, 3464#JL3Image Processing DataSwebrec Function
100 ms150 ms150 ms(Reduced Hole)100 ms150 ms150 ms (Reduced Hole)Change 1Change 2
X20 (mm)34.7819.5659.3438.4024.0557.46−37.37+49.64
X50 (mm)213.92168.54240.69213.92168.54240.69−21.21+12.51
X80 (mm)456.67396.38471.19457.50395.98466.88−13.45+2.05
P25 (%)16.4322.9314.0316.6920.3013.30+21.63−20.31
1-P750 (%)2.060.391.061.350.131.01−90.37−25.19
Disclaimer/Publisher’s Note: The statements, opinions and data contained in all publications are solely those of the individual author(s) and contributor(s) and not of MDPI and/or the editor(s). MDPI and/or the editor(s) disclaim responsibility for any injury to people or property resulting from any ideas, methods, instructions or products referred to in the content.