Article

Peak and Residual Shear Interface Measurement between Sand and Continuum Surfaces Using Ring Shear Apparatus

by
Rayed Almasoudi
1,2,*,
Firas Daghistani
1,3 and
Hossam Abuel-Naga
1
1
Department of Engineering, La Trobe University, Bundoora, Melbourne, VIC 3086, Australia
2
Department of Civil Engineering, Umm Al-Qura University, Makkah 24381, Saudi Arabia
3
Department of Civil Engineering, University of Business and Technology, Jeddah 21448, Saudi Arabia
*
Author to whom correspondence should be addressed.
Appl. Sci. 2024, 14(14), 6373; https://doi.org/10.3390/app14146373
Submission received: 24 June 2024 / Revised: 17 July 2024 / Accepted: 19 July 2024 / Published: 22 July 2024

Abstract

:
This study uses a ring shear apparatus to measure the interface shear stress between five types of sand and three surfaces: steel, PVC, and stone. Experiments were conducted under normal stresses of 25, 50, and 100 kPa at a constant shear rate of 0.5 mm/min. The research examines the impact of various sand properties, including particle size distribution, median particle size, particle shape, and initial density, as well as the surface roughness and hardness of continuum materials. The results show that interface shear strength is significantly influenced by the mechanical interlock between sand particles and surface asperities, which is affected by the normalized roughness and hardness of the materials. Machine learning models, including Multiple Linear Regression and Random Forest Regression, were used to predict peak and residual shear strengths, demonstrating high accuracy. Additionally, an empirical equation was generated using eight input parameters, considering the peak and residual interface shear strength as outputs.

1. Introduction

Interface shear describes the resistance to sliding at the boundary between the two materials under shear stress. In geotechnical engineering, the shear strength at the interface between soil and structural materials, such as concrete or steel, is essential for the stability and performance of various structures, including foundations, retaining walls, and embankments. This shear strength is influenced by several factors, including the properties of the interfacing soil and the structural materials. Key soil properties that affect interface shear strength include particle size distribution, median particle size (D50), particle morphology, and density. Furthermore, the surface roughness and hardness of the structural materials play a significant role in determining the interface shear strength [1,2,3,4,5,6,7,8,9,10]. Additionally, studies on graphene-polyethylene nanocomposites have demonstrated that the type and coverage of functional groups can significantly enhance interfacial strength and load transfer, highlighting the critical role of specific material properties [11].
In soil properties, the grading of soil particles and the range of particle sizes and shapes significantly influence the interface shear strength of soils. Research indicates that an increase in the range of particle sizes corresponds with a rise in interface shear strength and dilation rate [12]. In contrast, poorly graded soils tend to exhibit lower interface shear strength [8]. Vangla and Latha [13] explored the impact of particle size on interface behavior using a direct shear device, finding that the optimal alignment of particle size with asperity surfaces results in higher interface shear strength. This phenomenon is attributed to the improved interlocking between sand particles and asperities. The median particle size (D50) also affects the interface shear strength of sand. Frost and Han [5] utilized a modified direct shear apparatus to investigate the peak interface friction, denoted as μp, which can be defined as the tangent of the peak interface friction angle δp. They found that the peak interface friction between Fiber Reinforced Polymer (FRP) composites and sand decreases as the D50 value increases, implying that larger particles tend to reduce frictional resistance at the interface due to fewer contact points per unit area. Rowe [14] supported these findings using a ring shear apparatus, showing that larger particles have a lower friction angle than smaller particles of the same mineralogy when sliding on identical rough surfaces. Particle morphology, namely roundness and sphericity, significantly impacts interface shear strength. Angular particles, with their irregular shapes, often increase the friction angle and interface shear strength due to their ability to interlock and resist movement. In contrast, rounded particles facilitate sliding, resulting in lower shear strength. Dove and Frost [15] indicated that shear mechanisms at the sand-geomembrane interfaces are heavily influenced by particle shape, with angular sands providing higher friction coefficients compared to spherical glass beads, which exhibited the lowest interface friction angles. Their experiments used a simple shear apparatus to compare the effects of different particle shapes. Angular particles create more interlocking and higher resistance to movement, enhancing shear strength, while round particles roll over each other easily, reducing shear resistance. The initial density of sand is another crucial factor affecting its interface shear strength. Sand density influences particle packing and the number of contact points, thereby affecting the internal friction angle and shear resistance. Shaia [16], using a direct shear box apparatus, observed that the interface shear behavior between FRP composites and granular materials significantly depends on the initial density of the soil mass.
In structural material, rough surfaces increase mechanical interlock between sand particles and structural materials, enhancing shear resistance. Uesugi and Kishida [9] introduced the normalized roughness parameter Rn to quantify this effect. Their research, utilizing a direct shear box apparatus, showed that higher Rn values correlate with increased peak interface friction. A study conducted by Abuel-Naga et al. [17] examined the coupling effects of normalized roughness and hardness on peak interface friction. Their research involved four different continuum counter-face surfaces (GFRP, copper, high carbon steel, and mild steel) interacting with glass beads and sand. The findings revealed that peak interface friction increased with higher Rn and the extent of this increase was influenced by the hardness of the counter-face materials. Abuel-Naga, Shaia and Bouazza [17] suggested that the hardness of the counter-face material can significantly impact interface shear strength. They discovered that, for the sand/FRP interface, the relationship between Rn and peak interface friction is dependent on D50. Conversely, for the sand/steel interface, this relationship is independent of D50. This distinction is attributed to the hardness difference between steel and FRP, which affects sand movement and plowing resistance during interface shear. Stachowiak and Batchelor [18] emphasized that hardness, measured through various indentation tests, determines a material’s ability to resist shear at the interface, thereby affecting overall shear strength. Harder surfaces are less likely to deform and provide more consistent shear resistance under load, while softer materials may deform under stress, reducing shear strength at the interface.
The aim of this study is to investigate the interface shear strength between sand and various continuum surfaces using a ring shear apparatus. Unlike our previous study Daghistani and Abuel-Naga [19], which used a direct shear apparatus to measure only peak shear strength, this research considers both peak and residual shear strengths. The study focuses on examining the effects of particle size, morphology, and porosity of the sand, as well as the surface roughness and hardness of the continuum materials. Additionally, we will use machine learning techniques to analyze the data, enhancing our understanding of the complex interactions at the interface.

2. Materials and Methods

2.1. Material

Various sand samples were selected. Two different particle sizes of sand, assigned as Sand-A and Sand-B, were tested to study the impact of sand particle size. According to Australian Standards [20], Sand-A is classified as medium sand with a D50 of 0.51 mm, while Sand-B is classified as coarse sand with a D50 of 1.77 mm.
To examine the influence of soil particle shape, sand samples with varying roundness and sphericity were chosen. Using the Powers [21] chart for estimating roundness and sphericity (Figure 1), Sand-A was classified as rounded, Sand-B as sub-angular, Sand-D as sub-rounded, and Sand-E as angular. The Regularity Index (RI), indicating soil particle shape, was determined by averaging the roundness and sphericity of the particles for each sand sample, as shown in Table 1.
Sand grading was also considered by preparing both well-graded and poorly graded samples to study the effect of particle size distribution. Sand-C was identified as well-graded, with a coefficient of uniformity (Cu) of 6.20 and a coefficient of curvature (Cc) of 1.31. The other samples were classified as poorly graded, as shown in Figure 2.
The Regularity Index (RI) was determined using the Powers [21] chart for estimating roundness and sphericity of sedimentary particles. This involved a detailed microscopic examination of the sand particles, followed by classification according to the chart, and then averaging the roundness and sphericity values for each sand sample.
The coefficient of uniformity (Cu) and the coefficient of curvature (Cc) were calculated based on the particle size distribution obtained from sieve analysis. The coefficient of uniformity (Cu) is defined as Cu = D60/D10, where D60 and D10 are the particle diameters at 60% and 10% finer by weight, respectively. The coefficient of curvature (Cc) is defined as Cc = (D302)/(D10 × D60), where D30 is the particle diameter at 30% finer by weight.
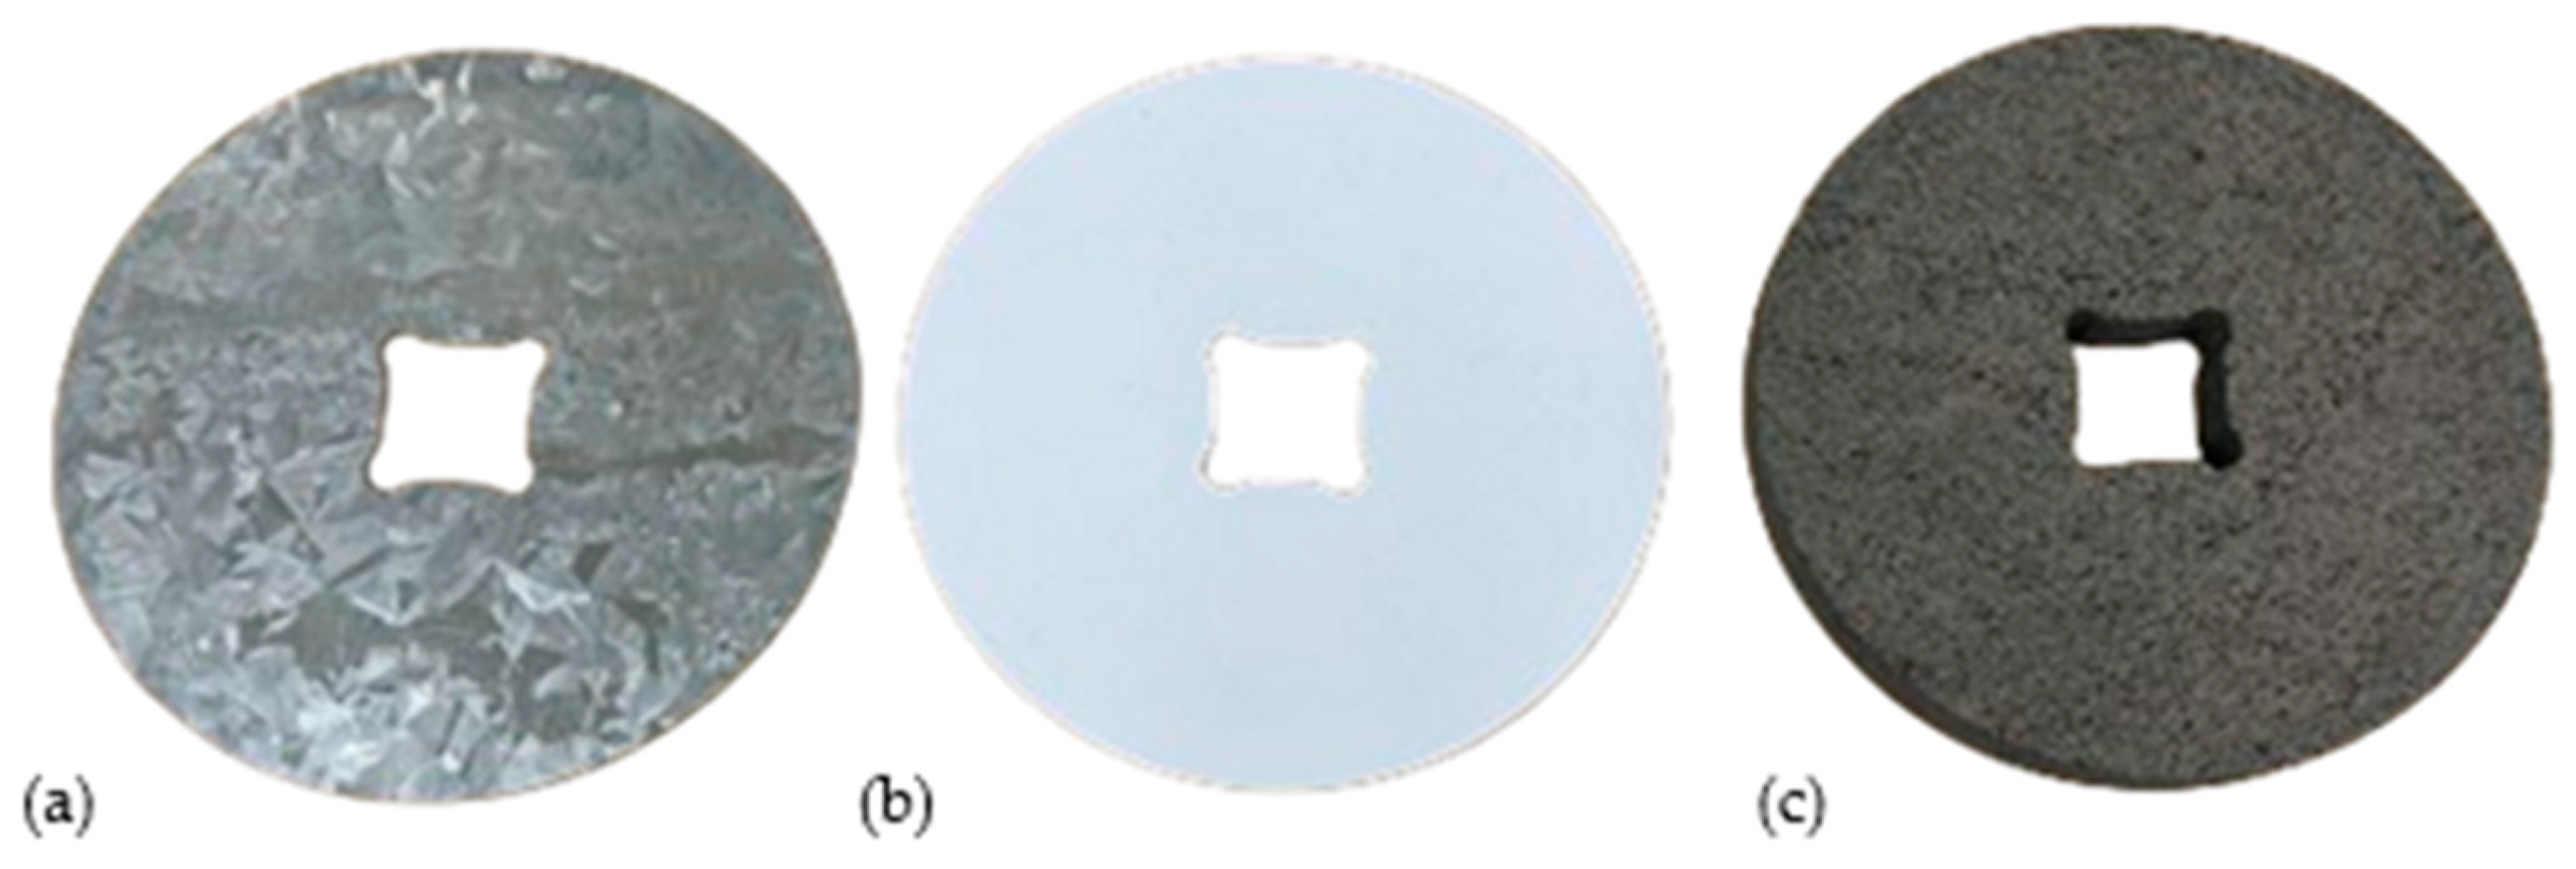
As indicated in Figure 3, three types of continuous surfaces were used: steel, polyvinyl chloride (PVC), and stone. Each type showed different levels of roughness and hardness, as detailed in Table 2. The surface roughness (Rt) of these materials was measured using a stylus profilometer, which traces the surface topology with a fine stylus moving perpendicularly across the material, recording the micro-geometry. Additionally, the surface hardness (HD) was measured using the Vickers hardness test with the DuraScan hardness device, which measures hard materials by pressing a diamond pyramid indenter into the surface and calculating hardness from the indentation size.

2.2. Methods

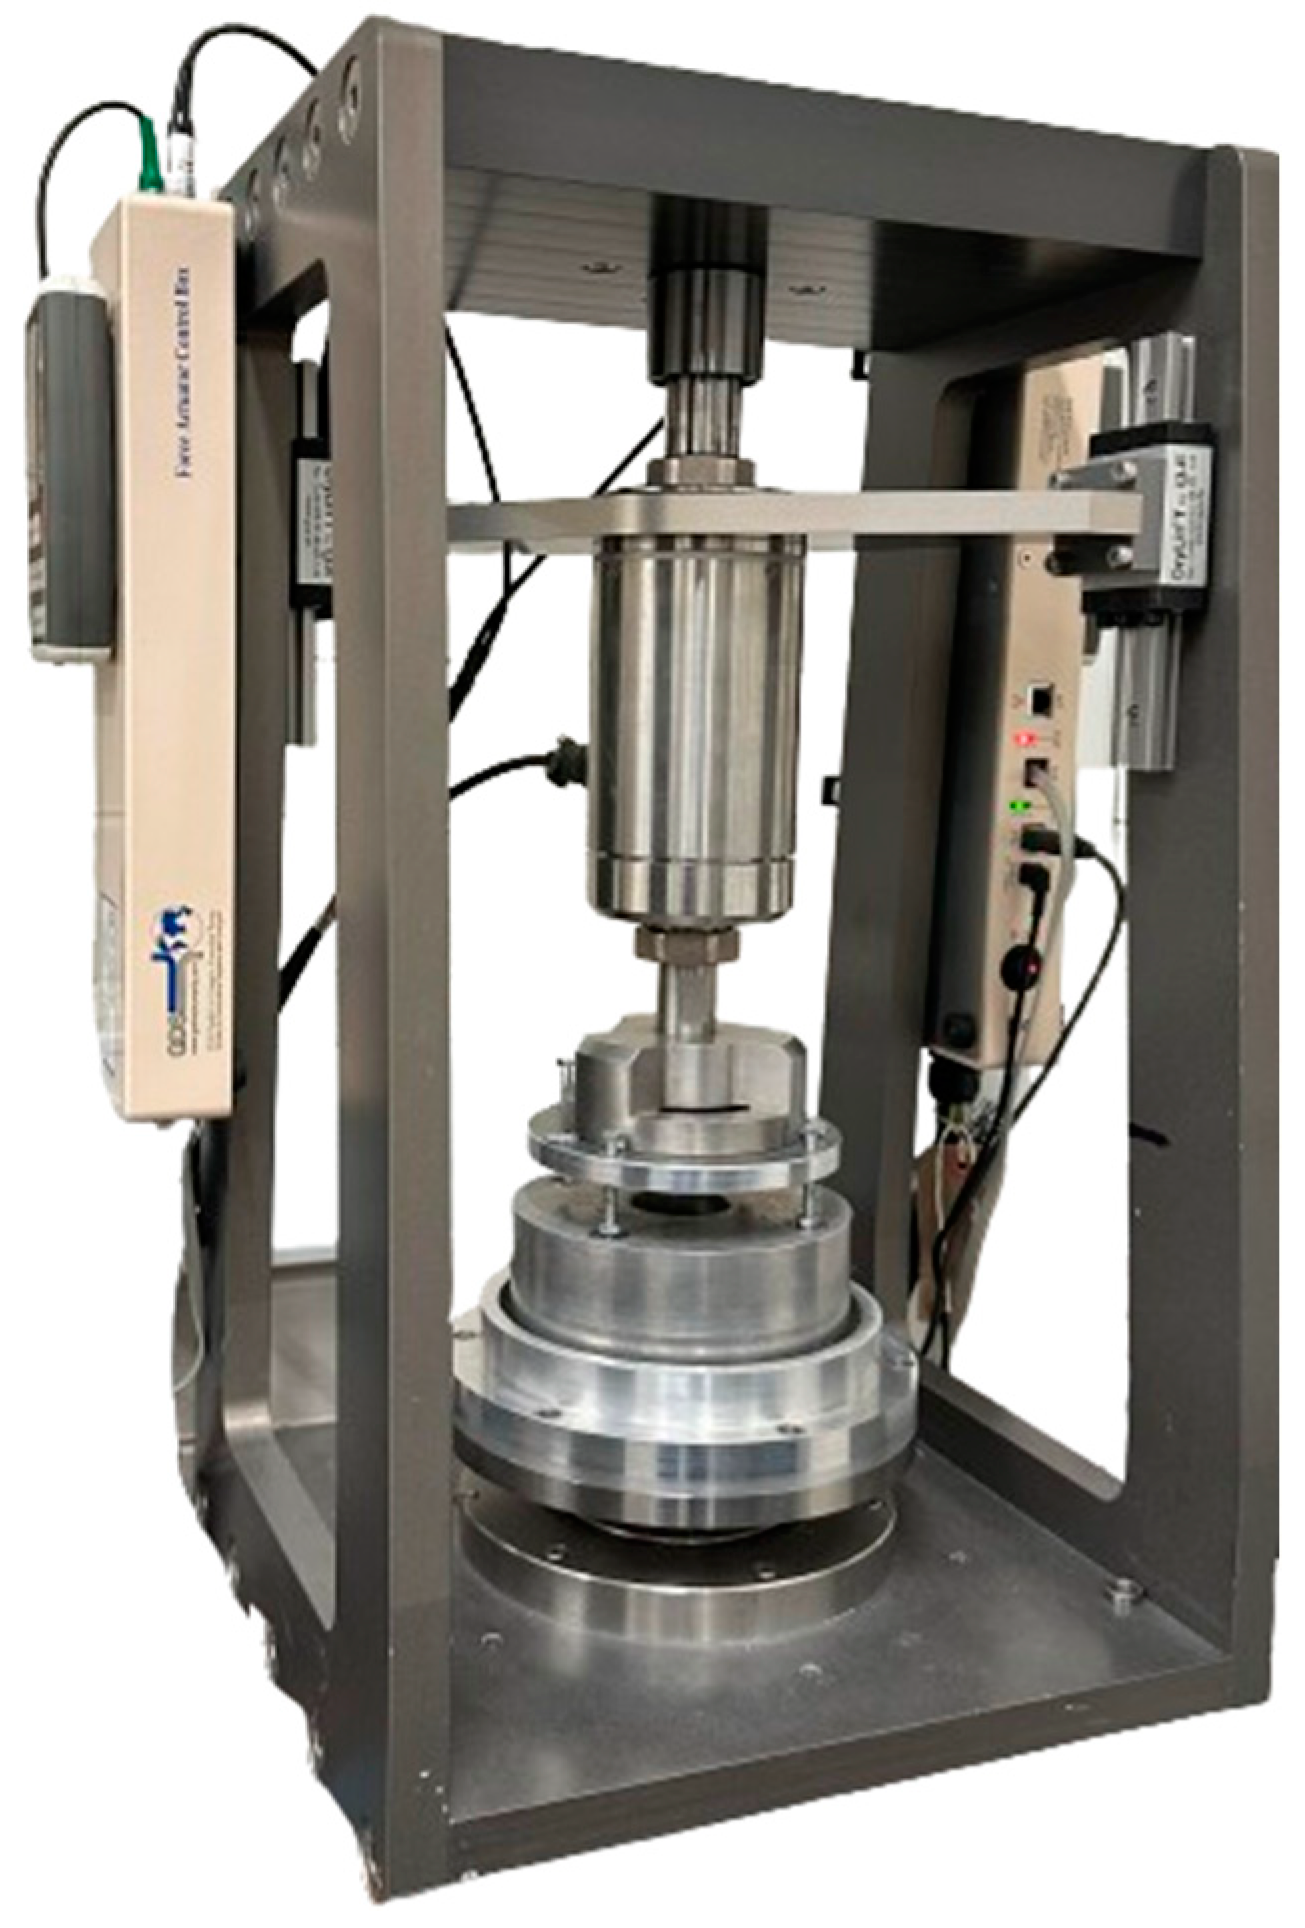
A GDS ring shear apparatus was used in this study, modified by replacing the original rotational mold with a new mold set that allows the sand sample to interface with a continuum during the shearing test, as shown in Figure 4. The new mold set comprises two main components: the shearing mold and the interface plate. The shearing mold features a ring-shaped channel with a depth of 7.8 mm and a width of 15 mm, where the sand sample is placed. The interface plate is installed on the bottom side of the ring shear apparatus, positioned beneath the shearing mold. The continuum material is attached to the surface of the plate, interfacing with the sand sample.
The choice of the Ring Shear Test over the Direct Shear Test is driven by several key advantages that align with the objectives of our study. The Ring Shear Test apparatus allows for continuous shearing of soil samples until a residual shear strength condition is achieved. This continuous shearing capability is crucial for investigating both peak and residual shear strengths, which are central to our study. The Direct Shear Test, with its limited travel distance, often fails to provide reliable residual shear strength measurements. Additionally, the Ring Shear Test ensures a more uniform distribution of normal and shear stresses along the shearing plane, reducing edge effects that are common in Direct Shear Tests. This uniformity leads to more accurate and representative measurements of shear strength parameters. Our study requires an understanding of interface behavior under large deformations. The Ring Shear Test apparatus is designed to handle large displacements without the boundary condition limitations of the Direct Shear Test, making it more suitable for our research. Furthermore, the shearing conditions in the Ring Shear Test more closely simulate the continuous shearing experienced in many field situations, such as landslides or prolonged soil-structure interactions. This relevance to real-world conditions enhances the practical applicability of our findings.
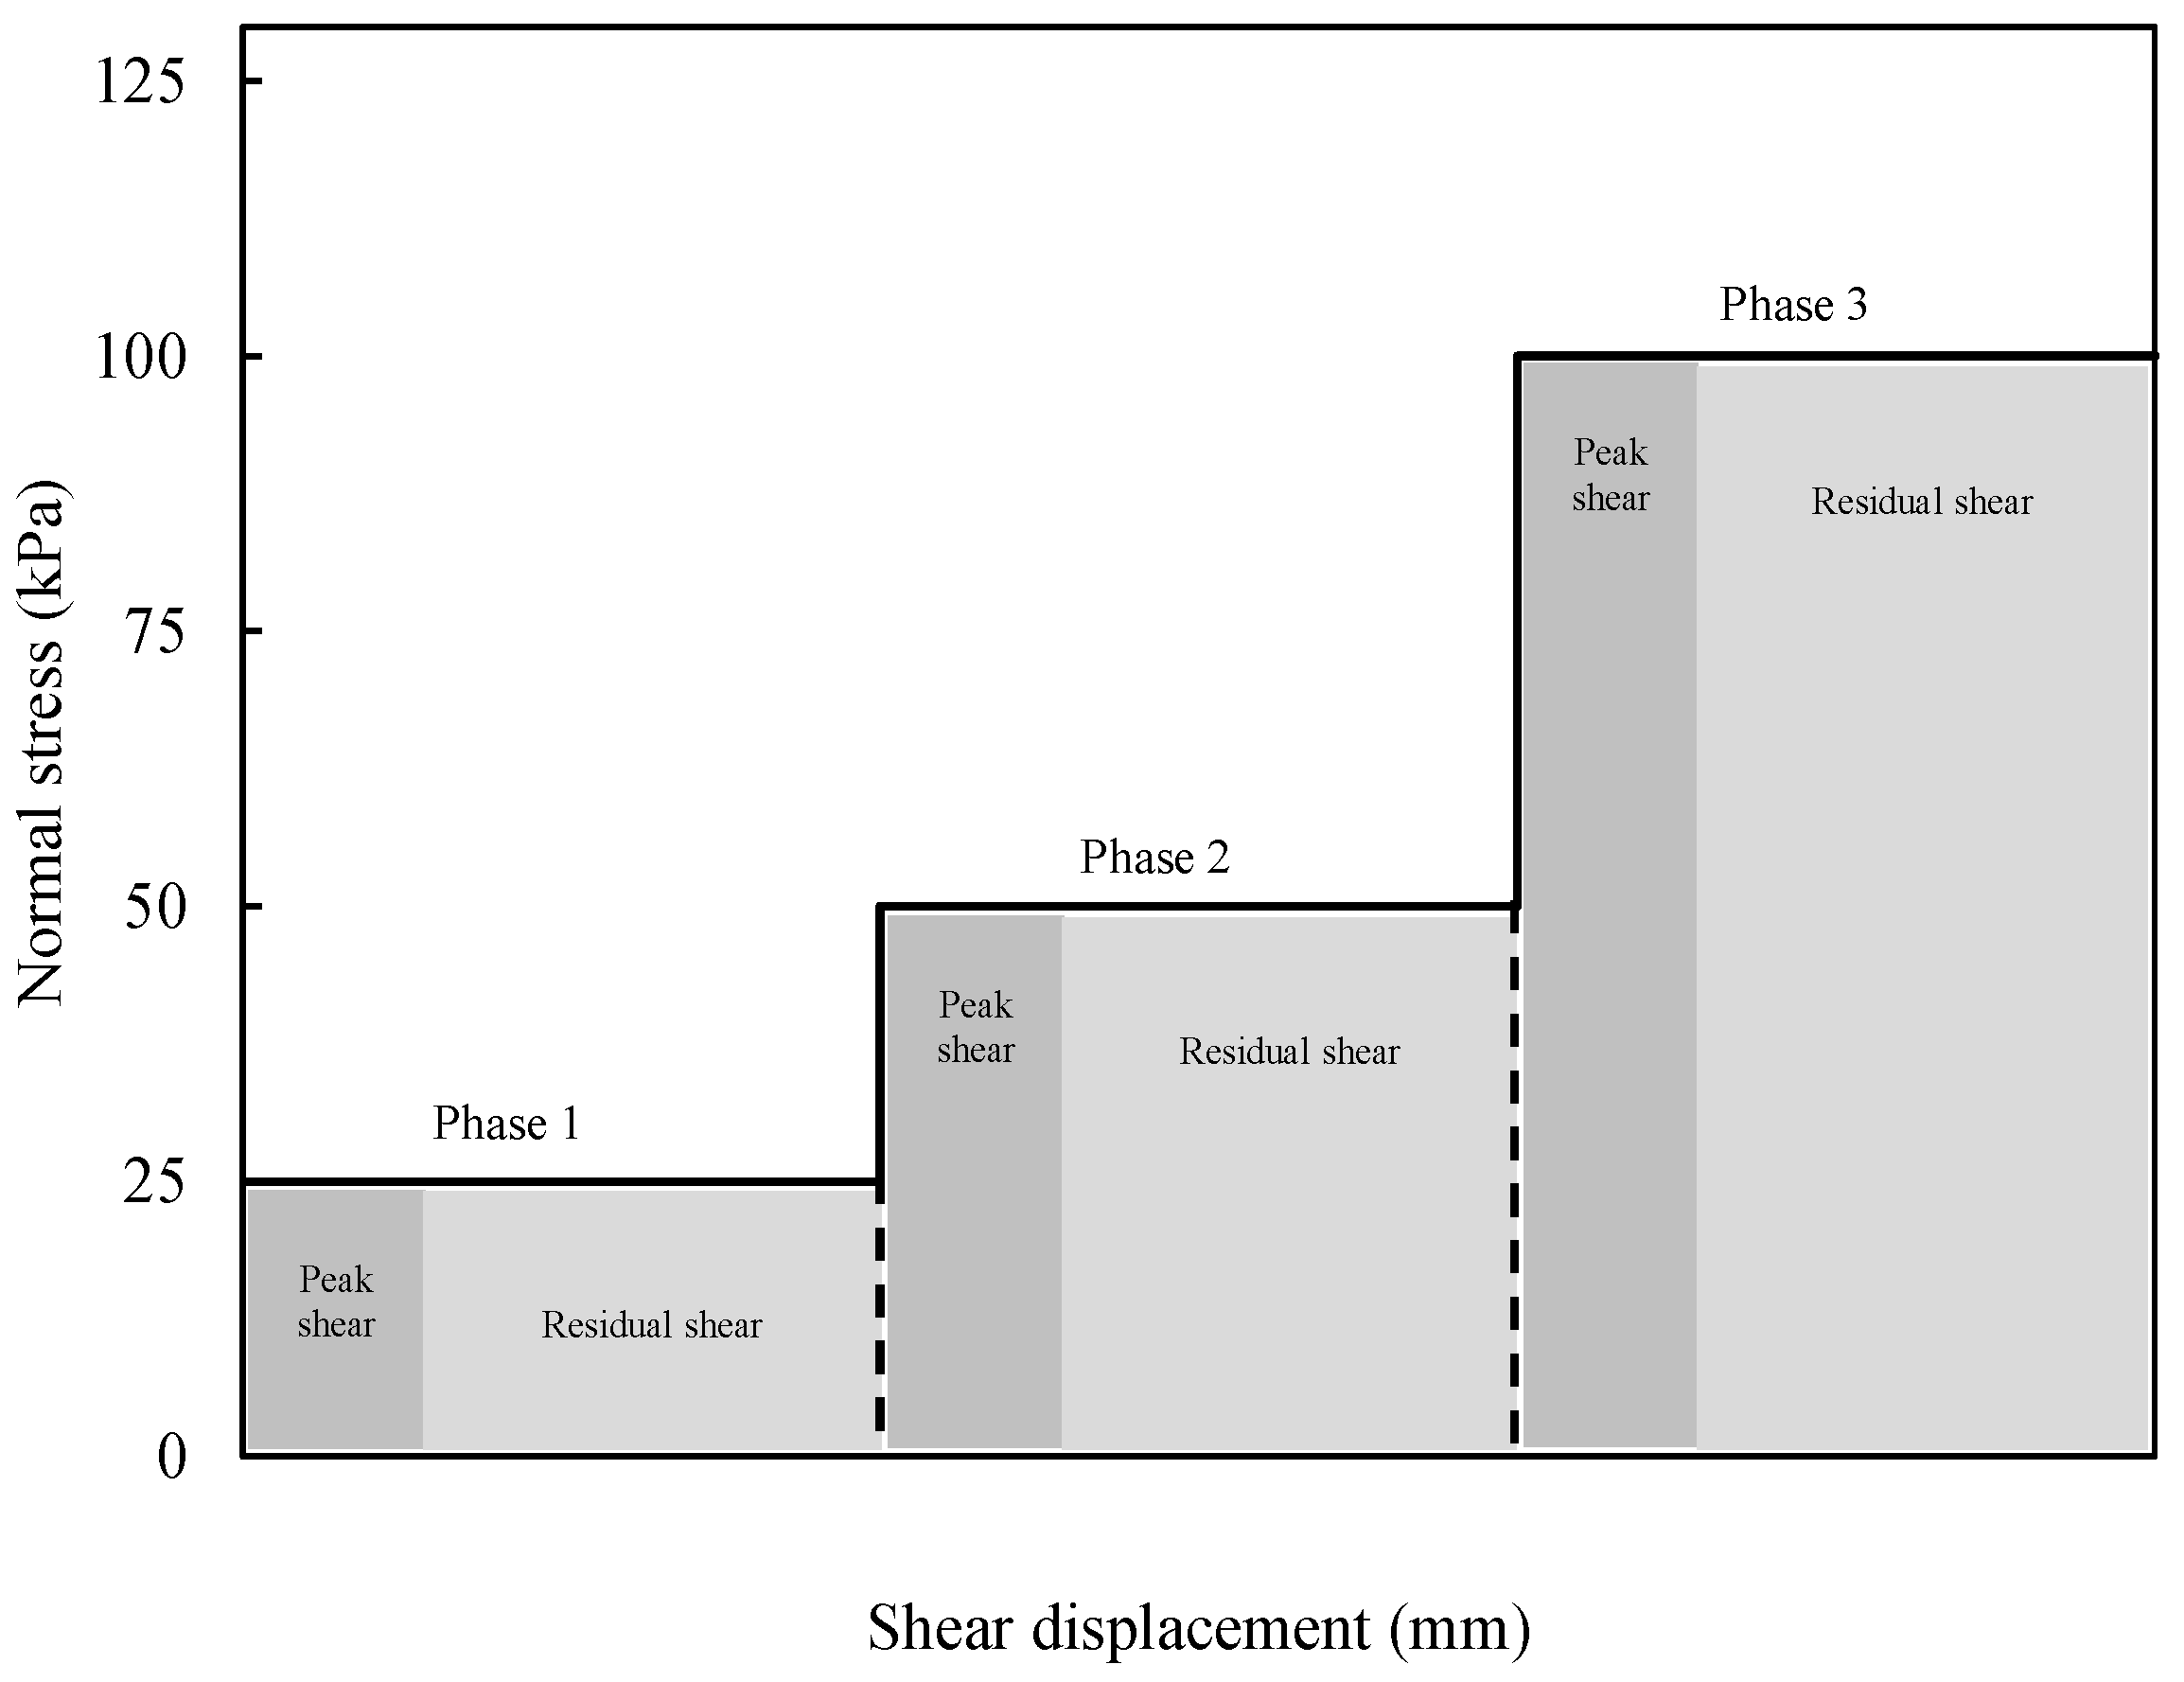
The testing procedure, as shown in Figure 5, involved conducting tests on normal stresses of 25, 50, and 100 kPa applied to each sand sample for each continuum, resulting in a total of 90 tests. The tests were conducted at a constant rotational rate of 0.5 mm/min.
The sand-raining method was utilized to achieve the desired initial soil density by pouring sand through a vertical pipe into the testing mold, allowing the grains to settle naturally under gravity. In this procedure, sand is dropped from a height of one meter to produce a dense sample and from zero distance to produce a loose specimen. Table 3 presents the density of used sand in both loose and dense states during the steel interface tests under 25 kPa.

3. Results and Discussion

3.1. Continuum Surfaces Properties

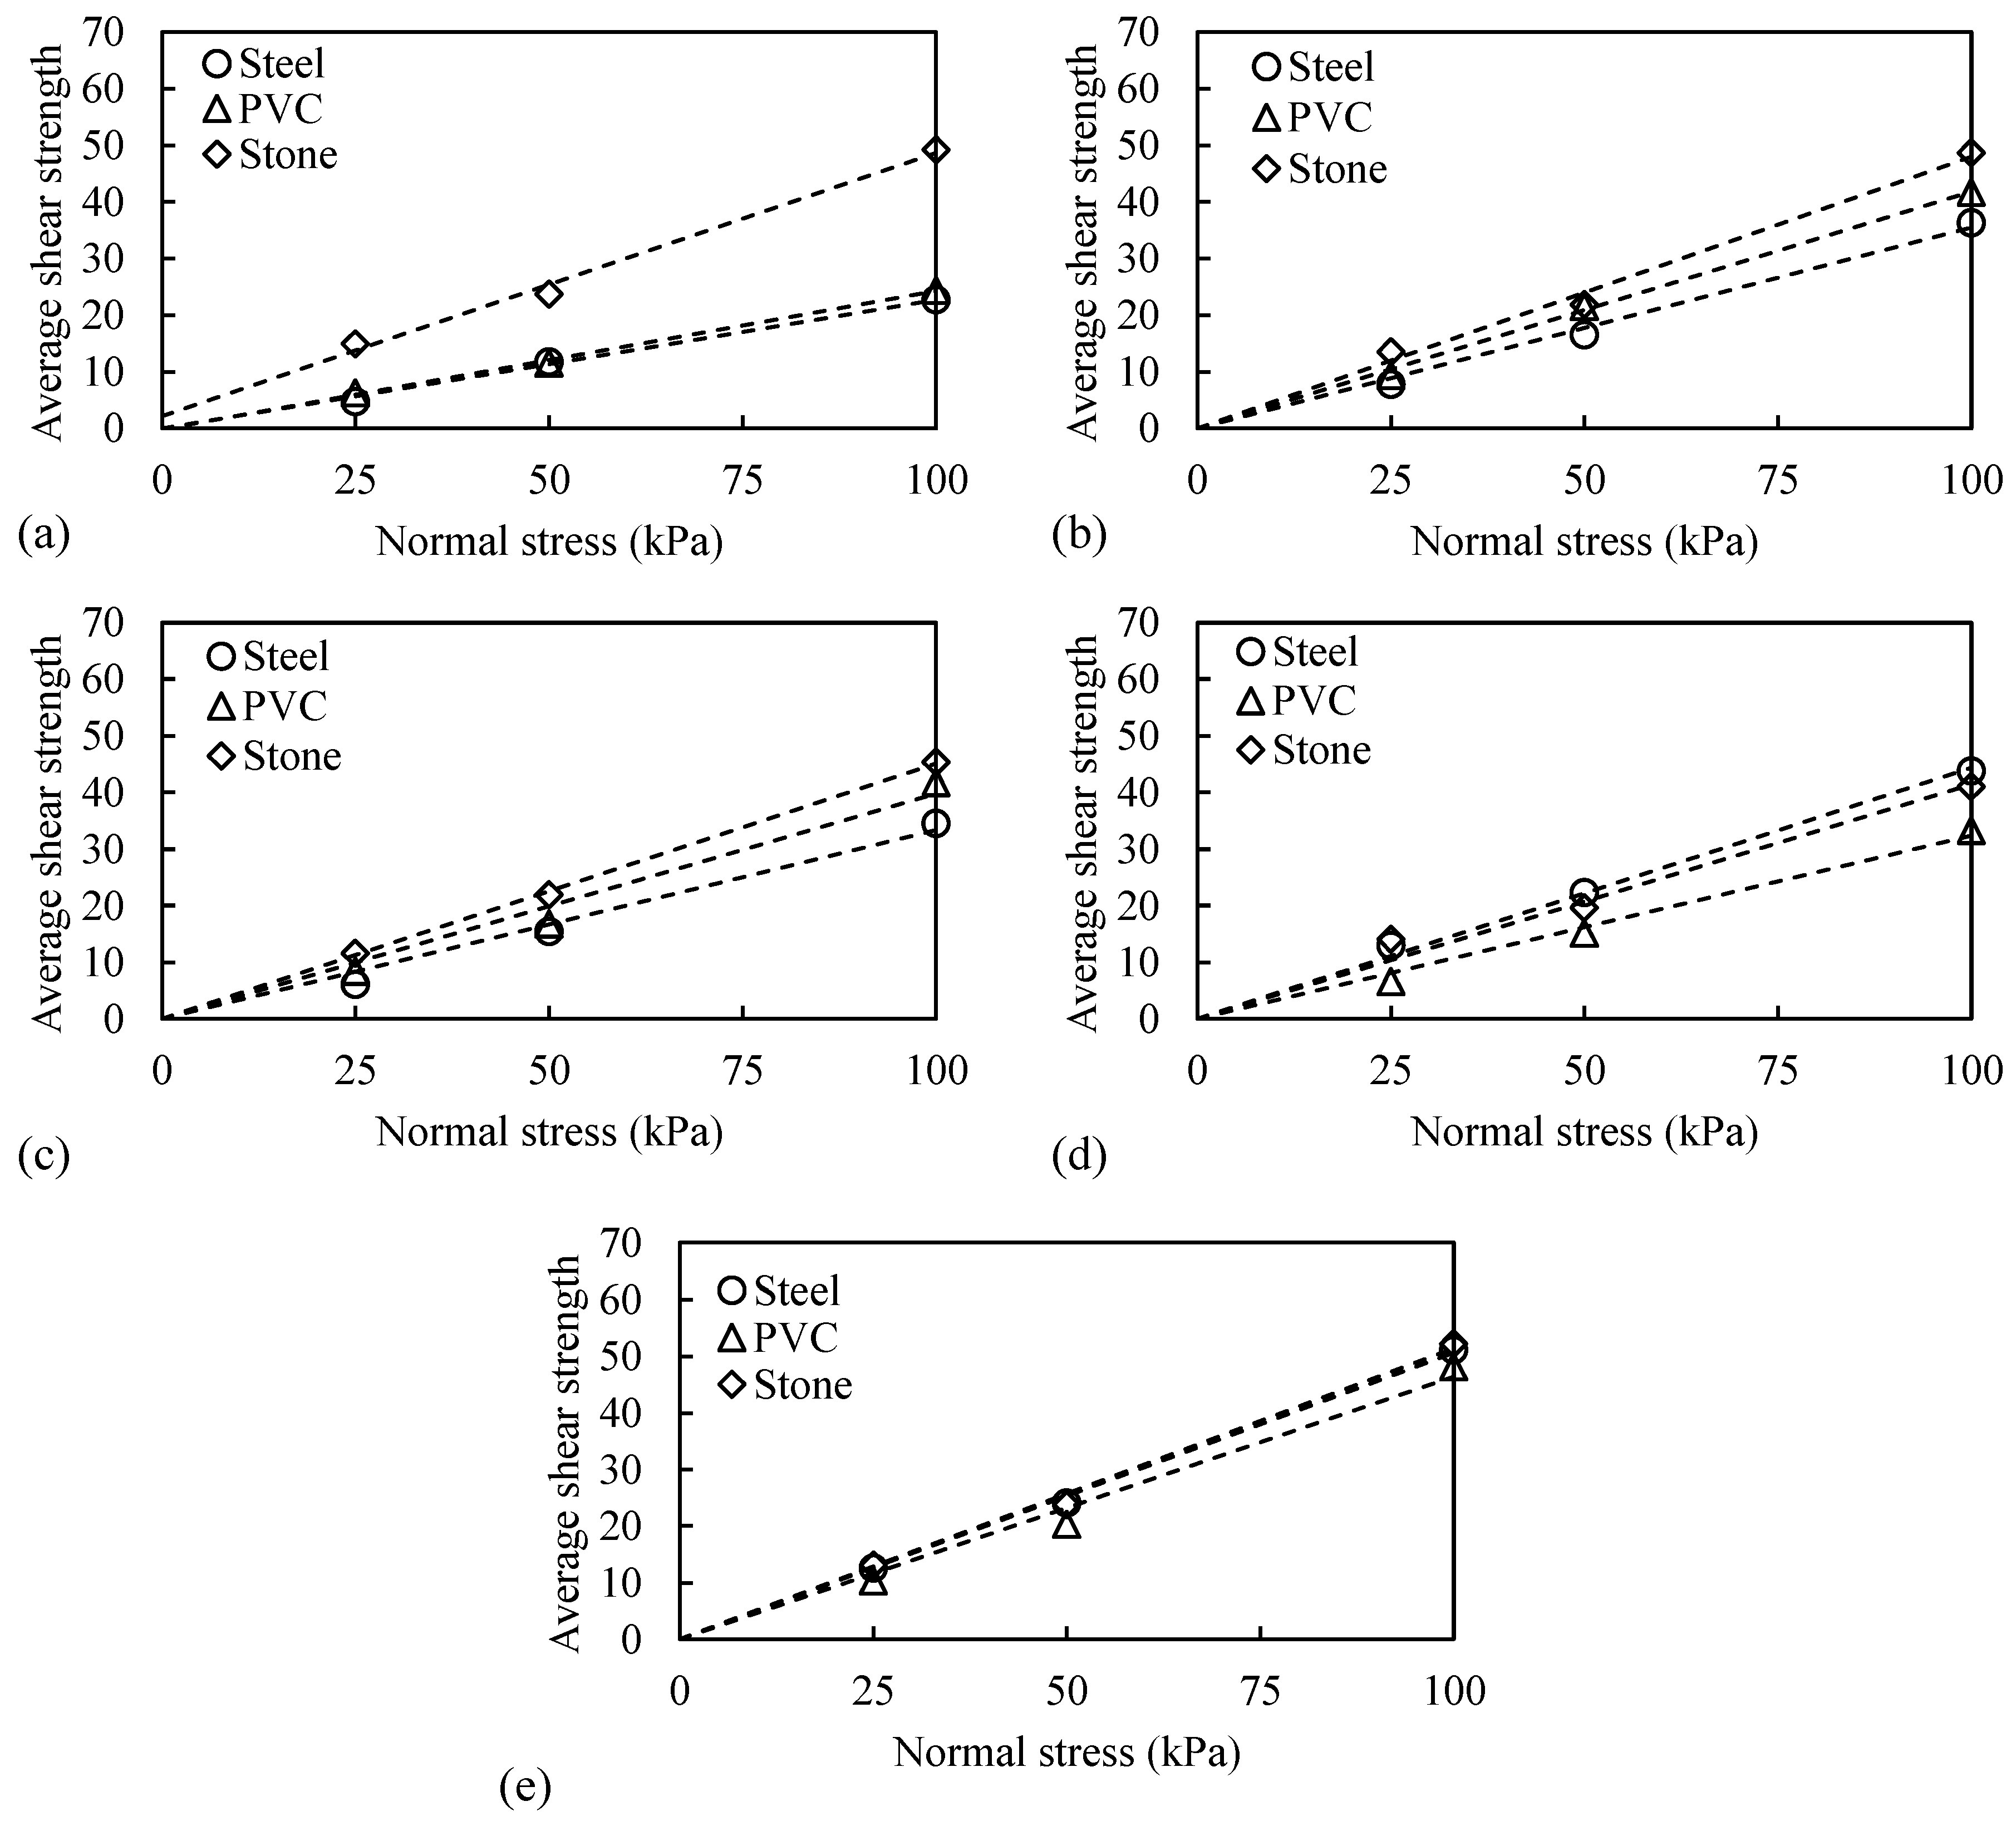
The data used for machine learning are listed in Appendix A, Table A1. As shown in Figure 6, across all soil types, average shear strength, which is the mean of the peak and residual shear strength values, increases with normal stress. Stone surfaces consistently show the highest shear strength, followed by PVC and then steel, indicating that the stone’s higher roughness and hardness provide greater resistance to shear forces. The considerable difference in shear strength observed for Sand-A when interfaced with the stone surface, as depicted in Figure 6a, can be attributed to several factors. The stone surface exhibited significantly higher roughness (Rt = 82.92 μm) and hardness (HD = 795) compared to the steel and PVC surfaces, leading to a greater mechanical interlock with the sand particles and enhancing the shear resistance. This increased roughness allows for more substantial interlocking between the sand particles and the asperities of the stone surface, while the higher hardness provides greater resistance to deformation under shear stress. Additionally, Sand-A, characterized as quartz medium sand with a median particle size (D50) of 0.51 mm and a regularity index (RI) of 0.72, has particle shapes that are more conducive to interlocking with the asperities of rough surfaces like stone. The combination of angular to sub-angular particle shapes in Sand-A enhances the interlocking effect when sheared against a rough and hard surface, leading to significantly higher shear strength compared to smoother surfaces, like steel and PVC. Furthermore, the interaction mechanisms between the sand particles and the continuum surfaces differ significantly based on the surface characteristics. The stone surface, with its high roughness and hardness, promotes plowing and wedging actions, where sand particles dig into the surface and create additional resistance to shear. This phenomenon is less pronounced on smoother surfaces, like steel and PVC, leading to the observed differences in shear strength.
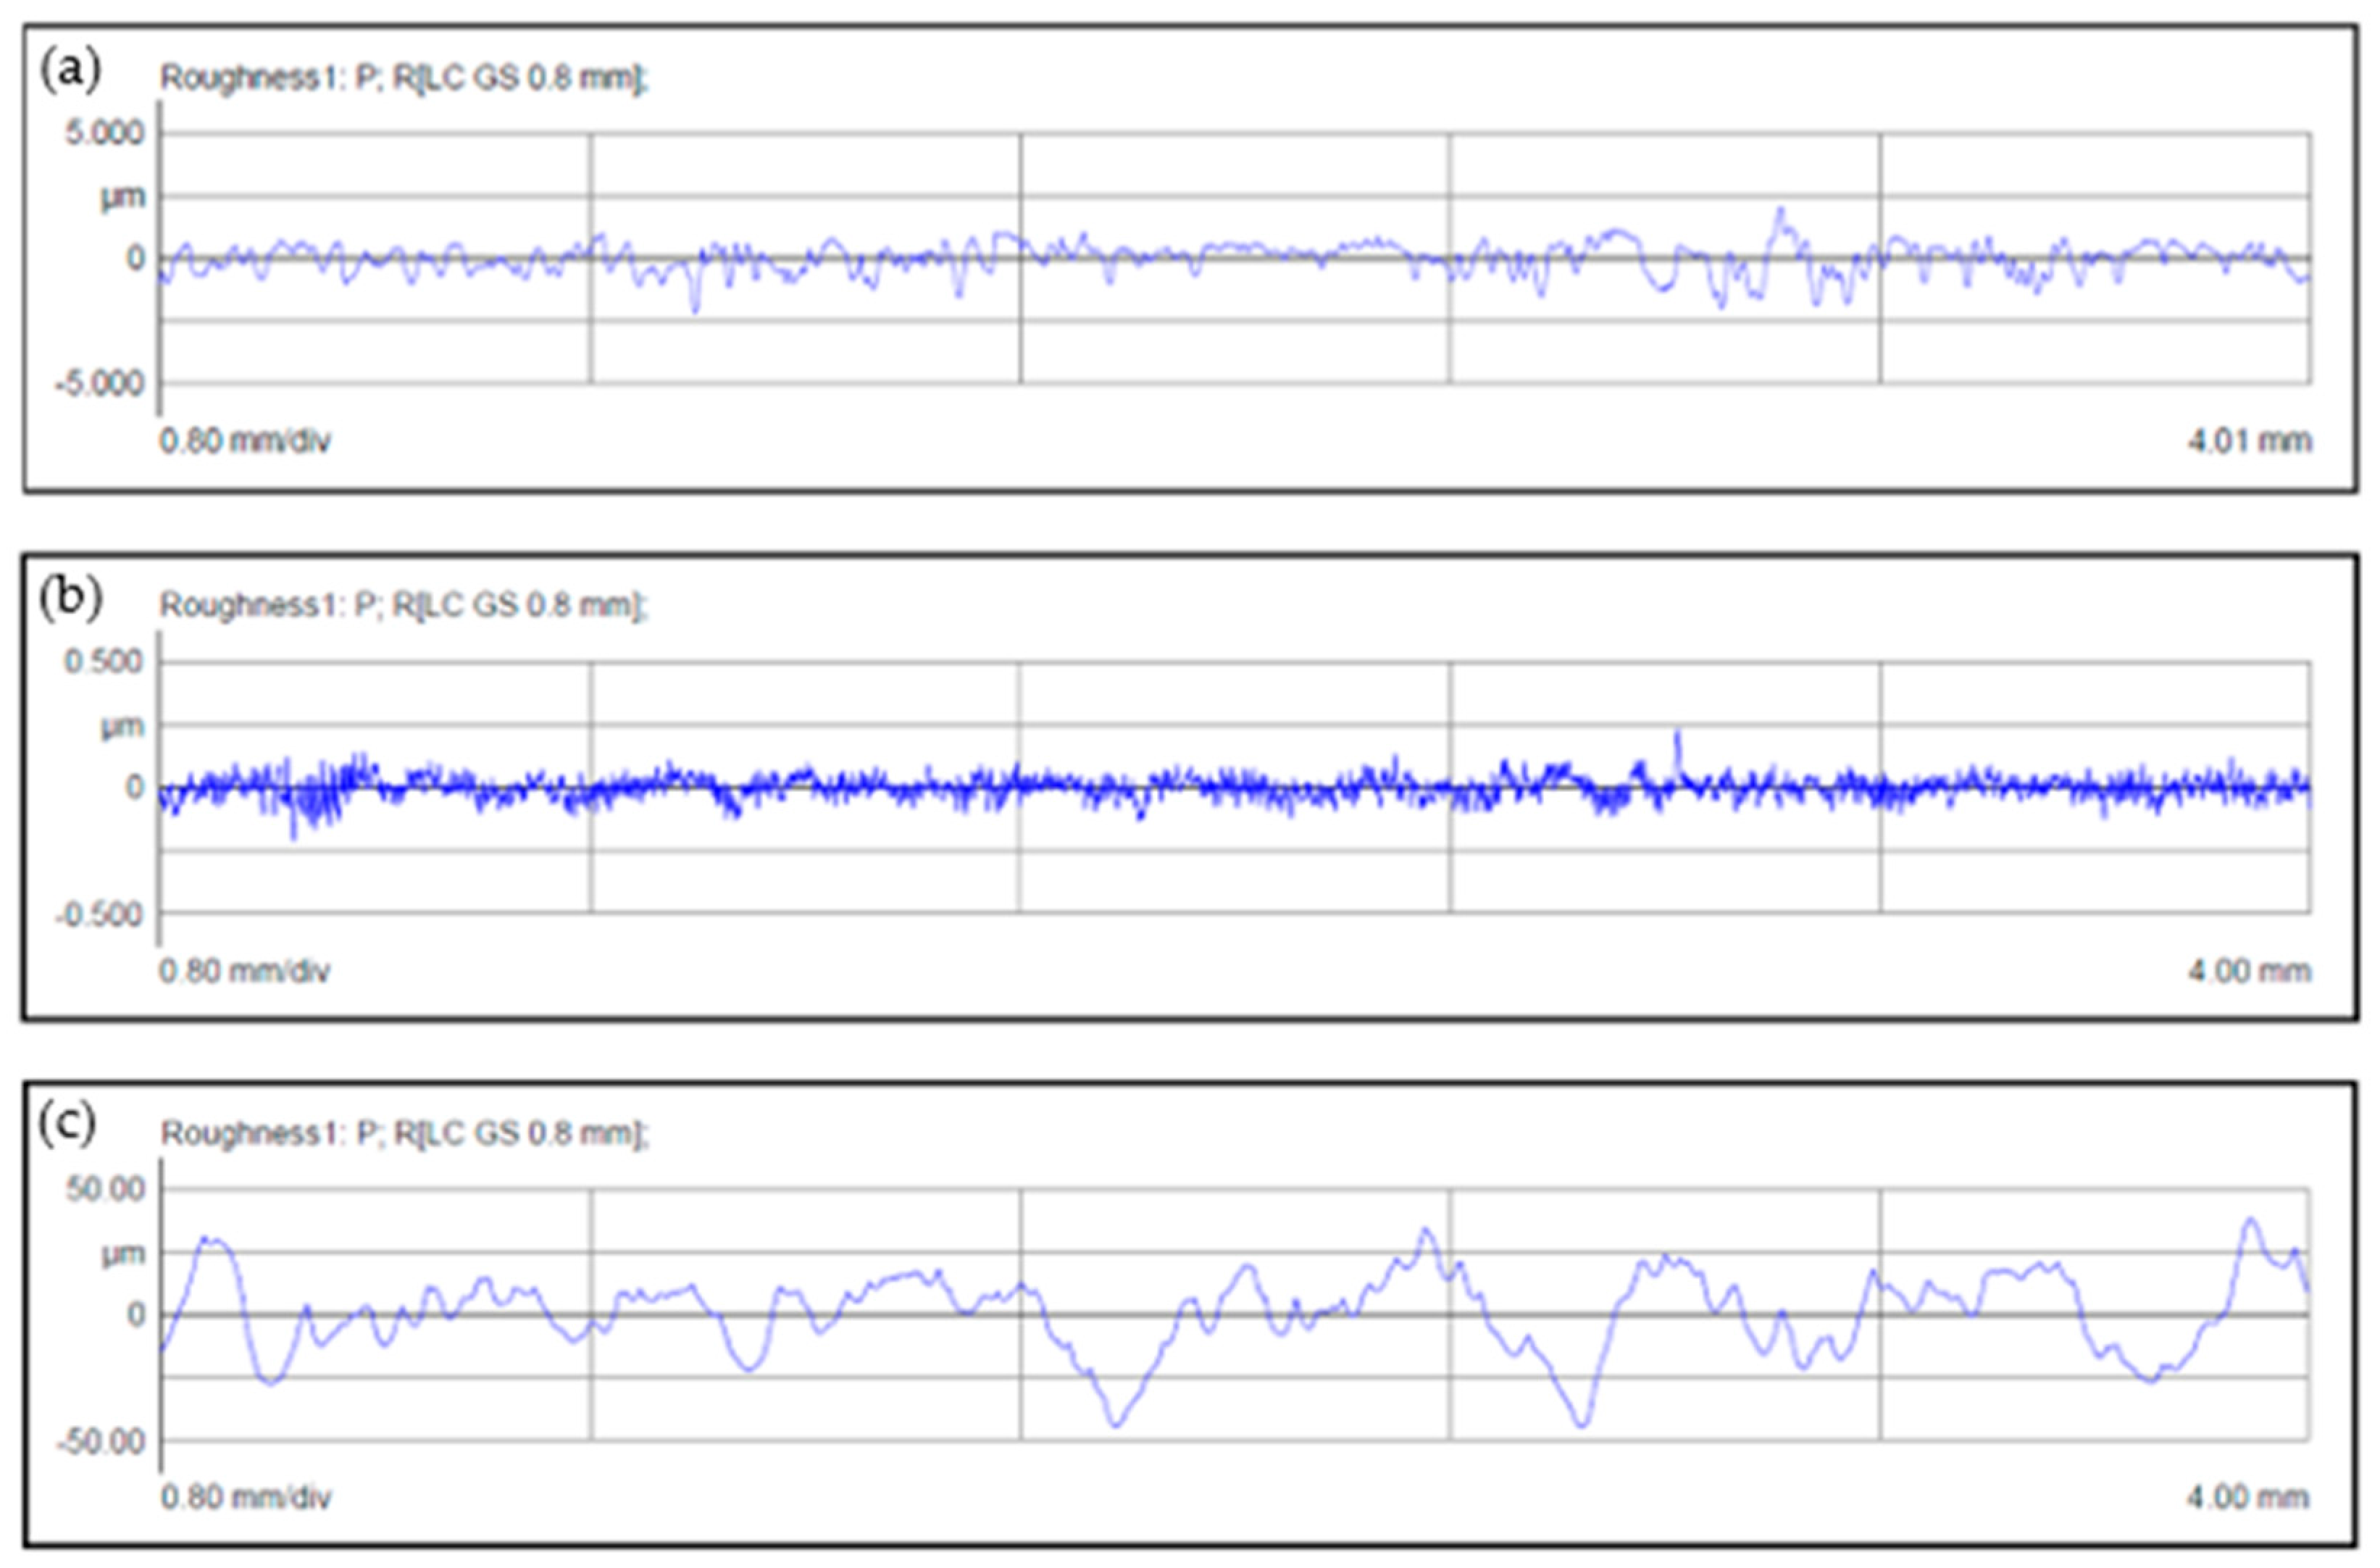
Normalized roughness (Rn), as proposed by Uesugi and Kishida [9], is measured by dividing the Rmax by the D50. Surface roughness measurements of continuum surfaces, as measured by a profilometer, are shown in Figure 7. The results in Figure 7 illustrate the initial roughness contours for the steel, PVC, and stone surfaces. These roughness measurements are critical in understanding the shear strength results.
The pronounced fluctuation in the initial roughness contours of the stone surface, as shown in Figure 7c, is due to the inherent characteristics of the stone material, even when manufactured cut. The stone’s natural composition and structure create a more heterogeneous surface texture compared to synthetic materials, like steel and PVC. These microscopic irregularities result in a more uneven surface profile.
These fluctuations in roughness enhance the mechanical interlock between sand particles and the stone surface, increasing the interface shear strength. This variability in roughness leads to more effective particle interlocking, consistent with the higher shear strength values observed for stone surfaces, resulting in greater resistance to shear forces.
Higher roughness leads to greater mechanical interlocking, which enhances shear resistance. This correlation shows that normalized roughness (Rn) significantly influences the peak interface friction coefficient (μp) for different sand types. As the roughness increases, the μp also increases, demonstrating the direct impact of surface roughness on interface shear strength. The plots in Figure 7 provide the foundational roughness data that explains the variations in shear strength.
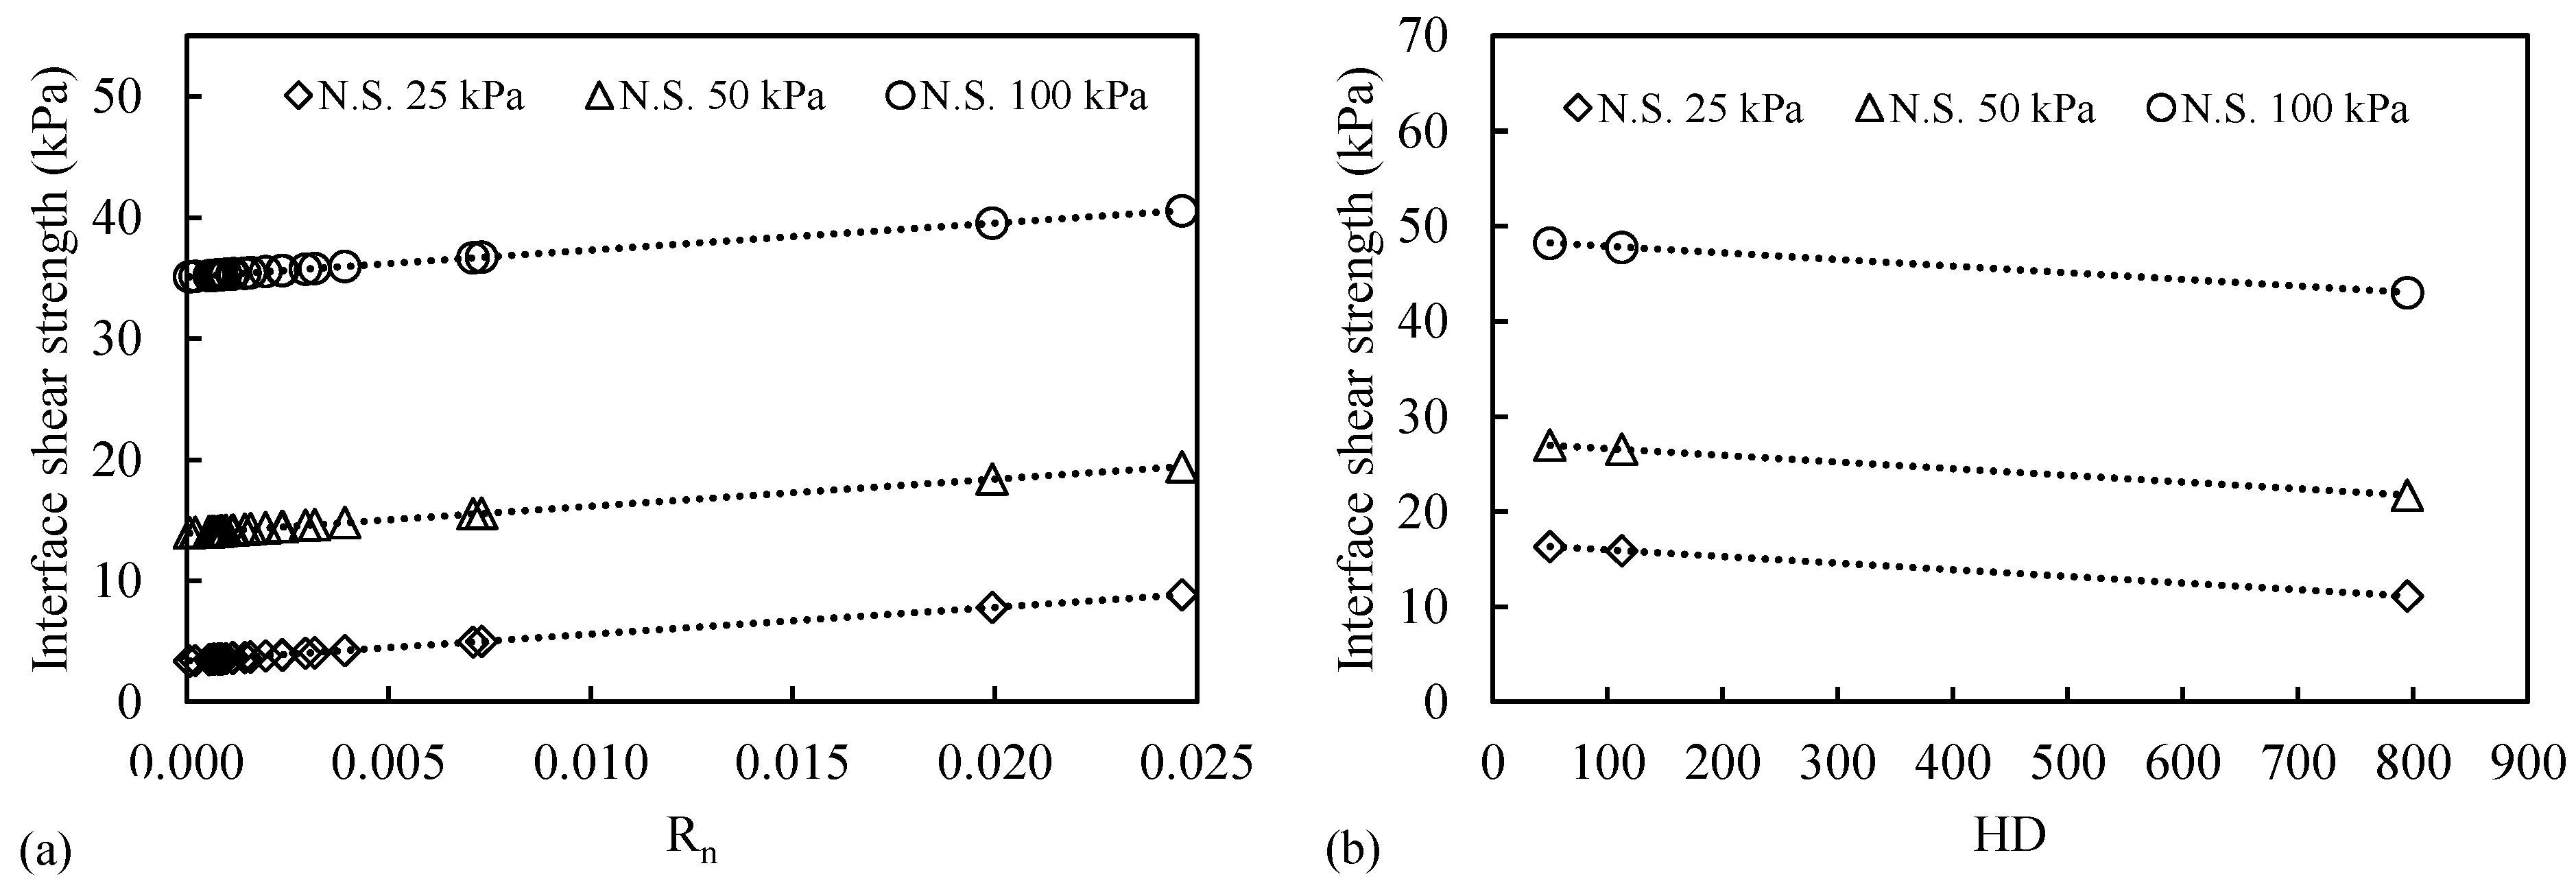
Figure 8a shows that, as the Rn increases, the interface shear strength also increases, which is consistent with the findings of previous studies [2,5,6,9]. The increase in Rn leads to a more significant mechanical interlock between the sand particles and the continuum surface, resulting in greater resistance to shear forces and thus higher peak interface friction.
In terms of hardness (HD), Figure 8b shows that increasing HD reduces interface shear strength, consistent with Abuel-Naga, Shaia and Bouazza [17]. This trend can be attributed to the lower ploughing effect observed with harder surfaces. In the context of soil-structure interactions, the ploughing effect refers to the phenomenon where sand particles dig into and displace the material on the surface. Softer surfaces are more susceptible to this effect, resulting in higher interface shear strength due to increased frictional resistance and better interlocking of particles.

3.2. Sand Properties

As the porosity (n) of sand decreases, the packing of particles becomes denser, increasing the number of contact points between the particles and the interface continuum surface [22]. This results in greater resistance to shear forces, thereby increasing the μp. Figure 9 illustrates this relationship across different normal stress levels (25, 50, and 100 kPa), showing a negative correlation between porosity and μp. Lower porosities (higher dry densities) lead to improved interlocking and frictional resistance, enhancing the overall stability and performance of the soil-structure interface.
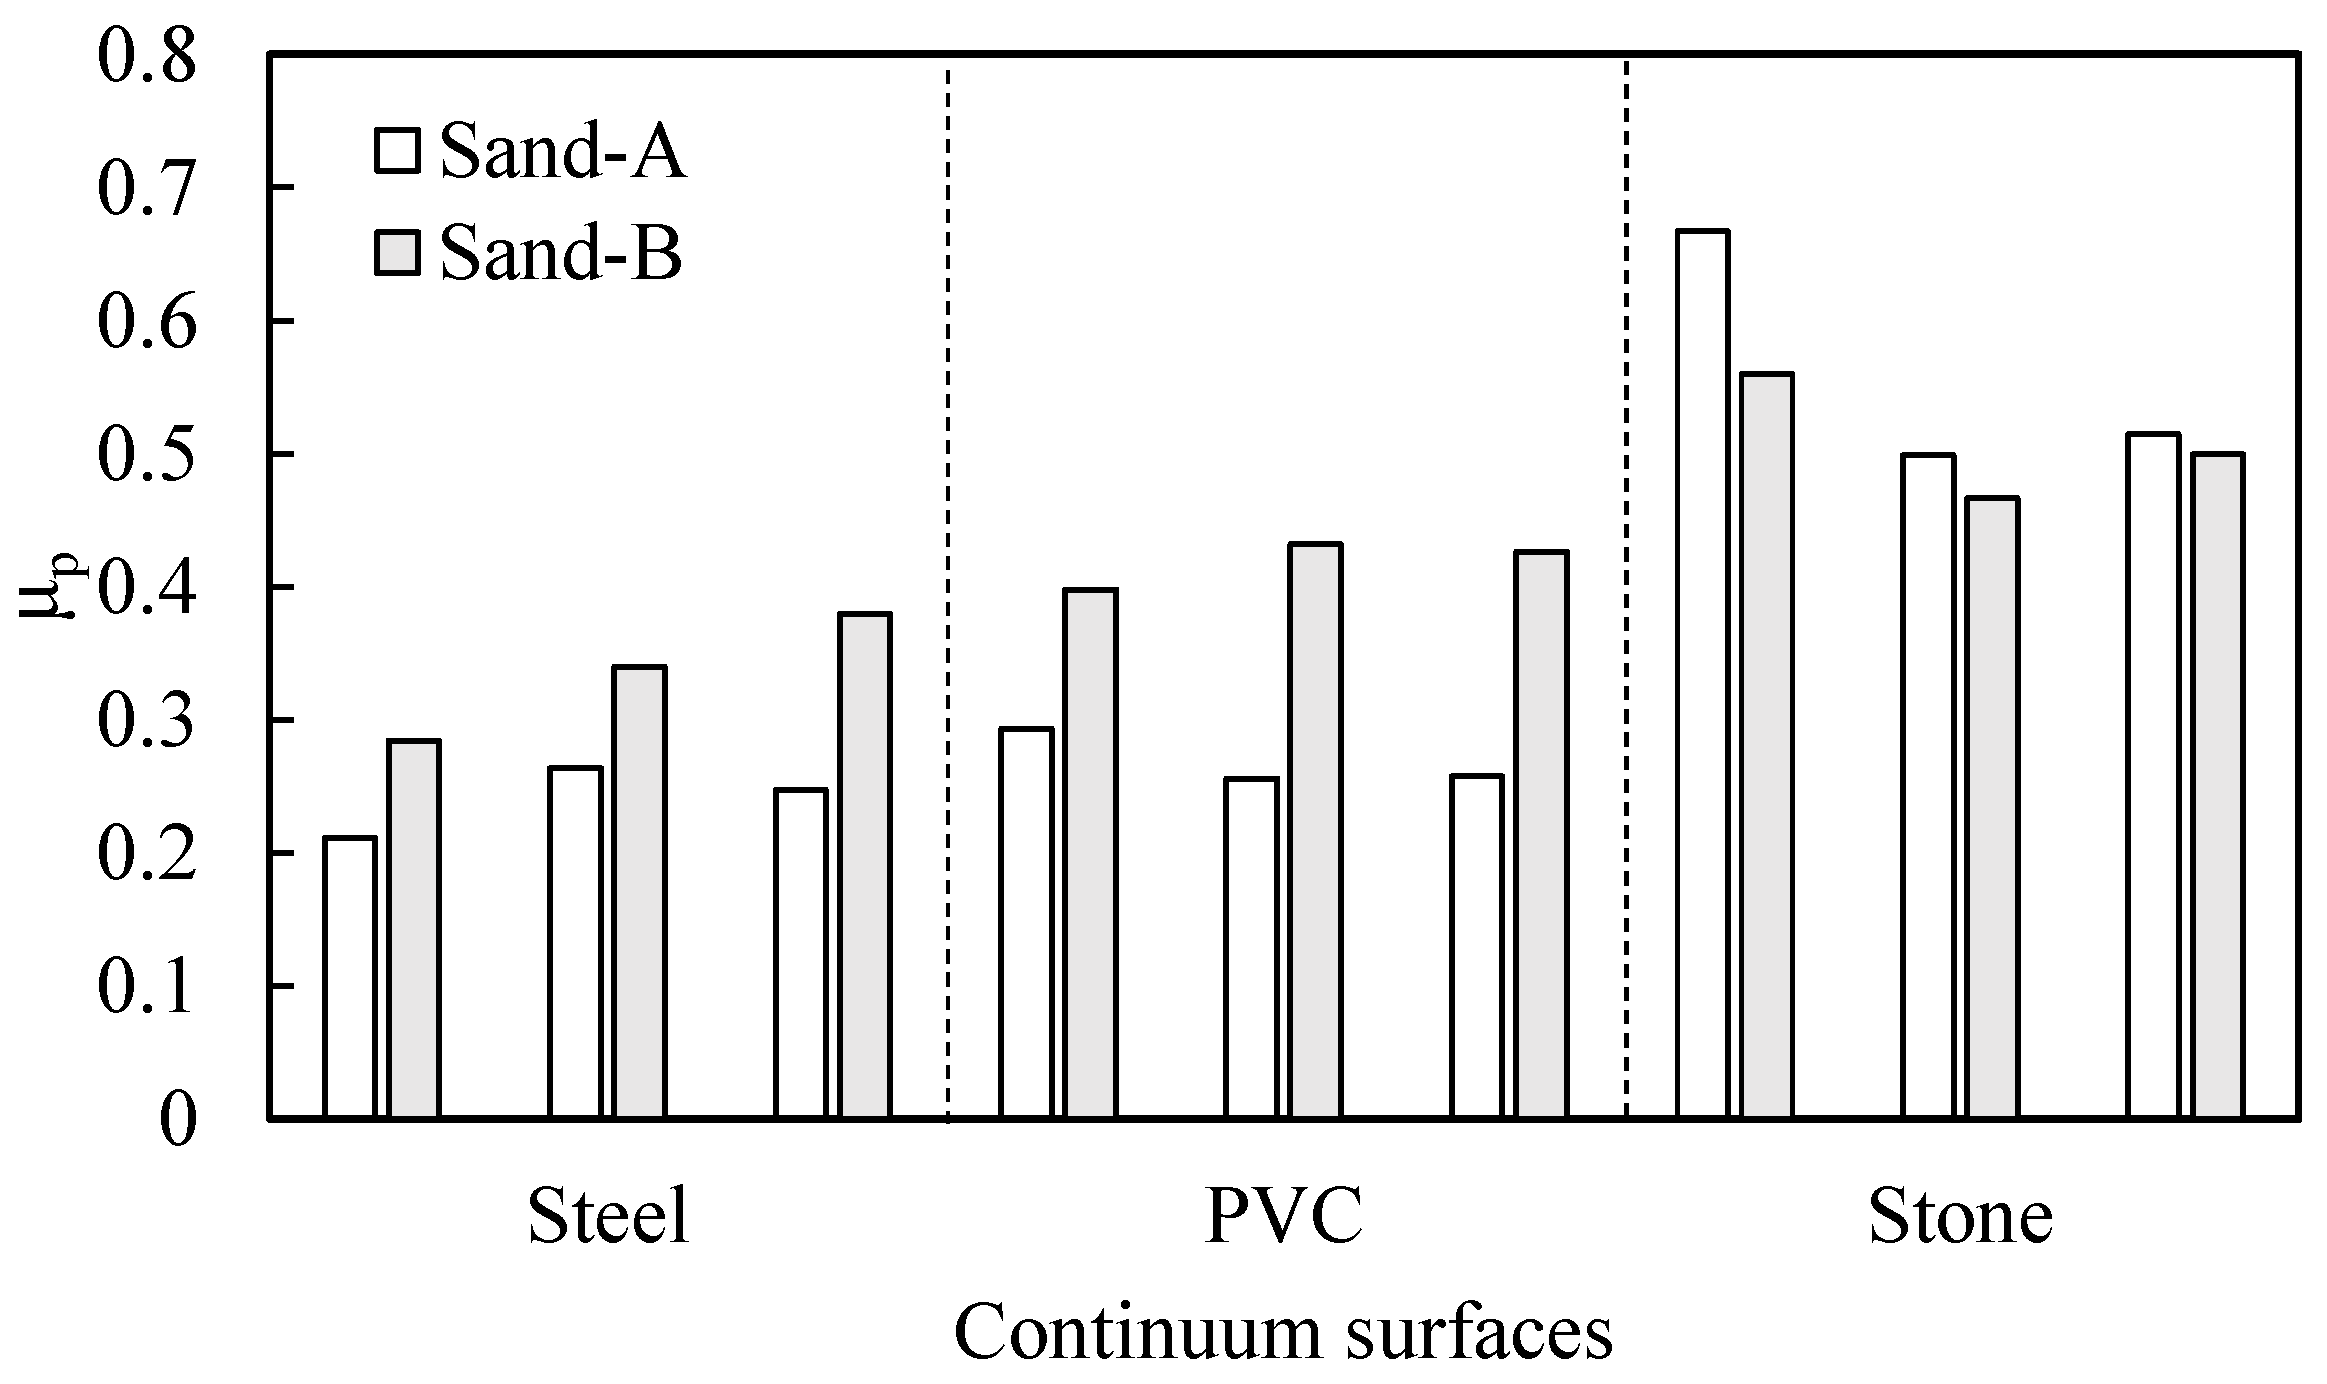
In Figure 10, the coarse sand shows a higher μp with both steel and PVC, similar to the findings of [23]. However, with stone, the medium sand had a higher μp. This difference could be due to the stone’s roughness affecting the Rn.
As shown in Figure 11, the well-graded sand (Sand-C) exhibits a higher μp compared to the poorly graded sand (Sand-A). These findings align with the study conducted by [24]. This is attributed to the higher density of well-graded sand, resulting in greater μp. This trend is evident with both steel and PVC interfaces. However, a different behavior is observed with the stone interface. The stone’s significantly high surface roughness impacts the Rn, thereby affecting the interface friction.

3.3. Multiple Linear Regression

An MLR model was employed to predict the peak and residual interface shear strength, as detailed in Table 4, which presents metrics derived from the training, testing, and 10-fold cross-validation (CV) datasets for both peak and residual shear stress.
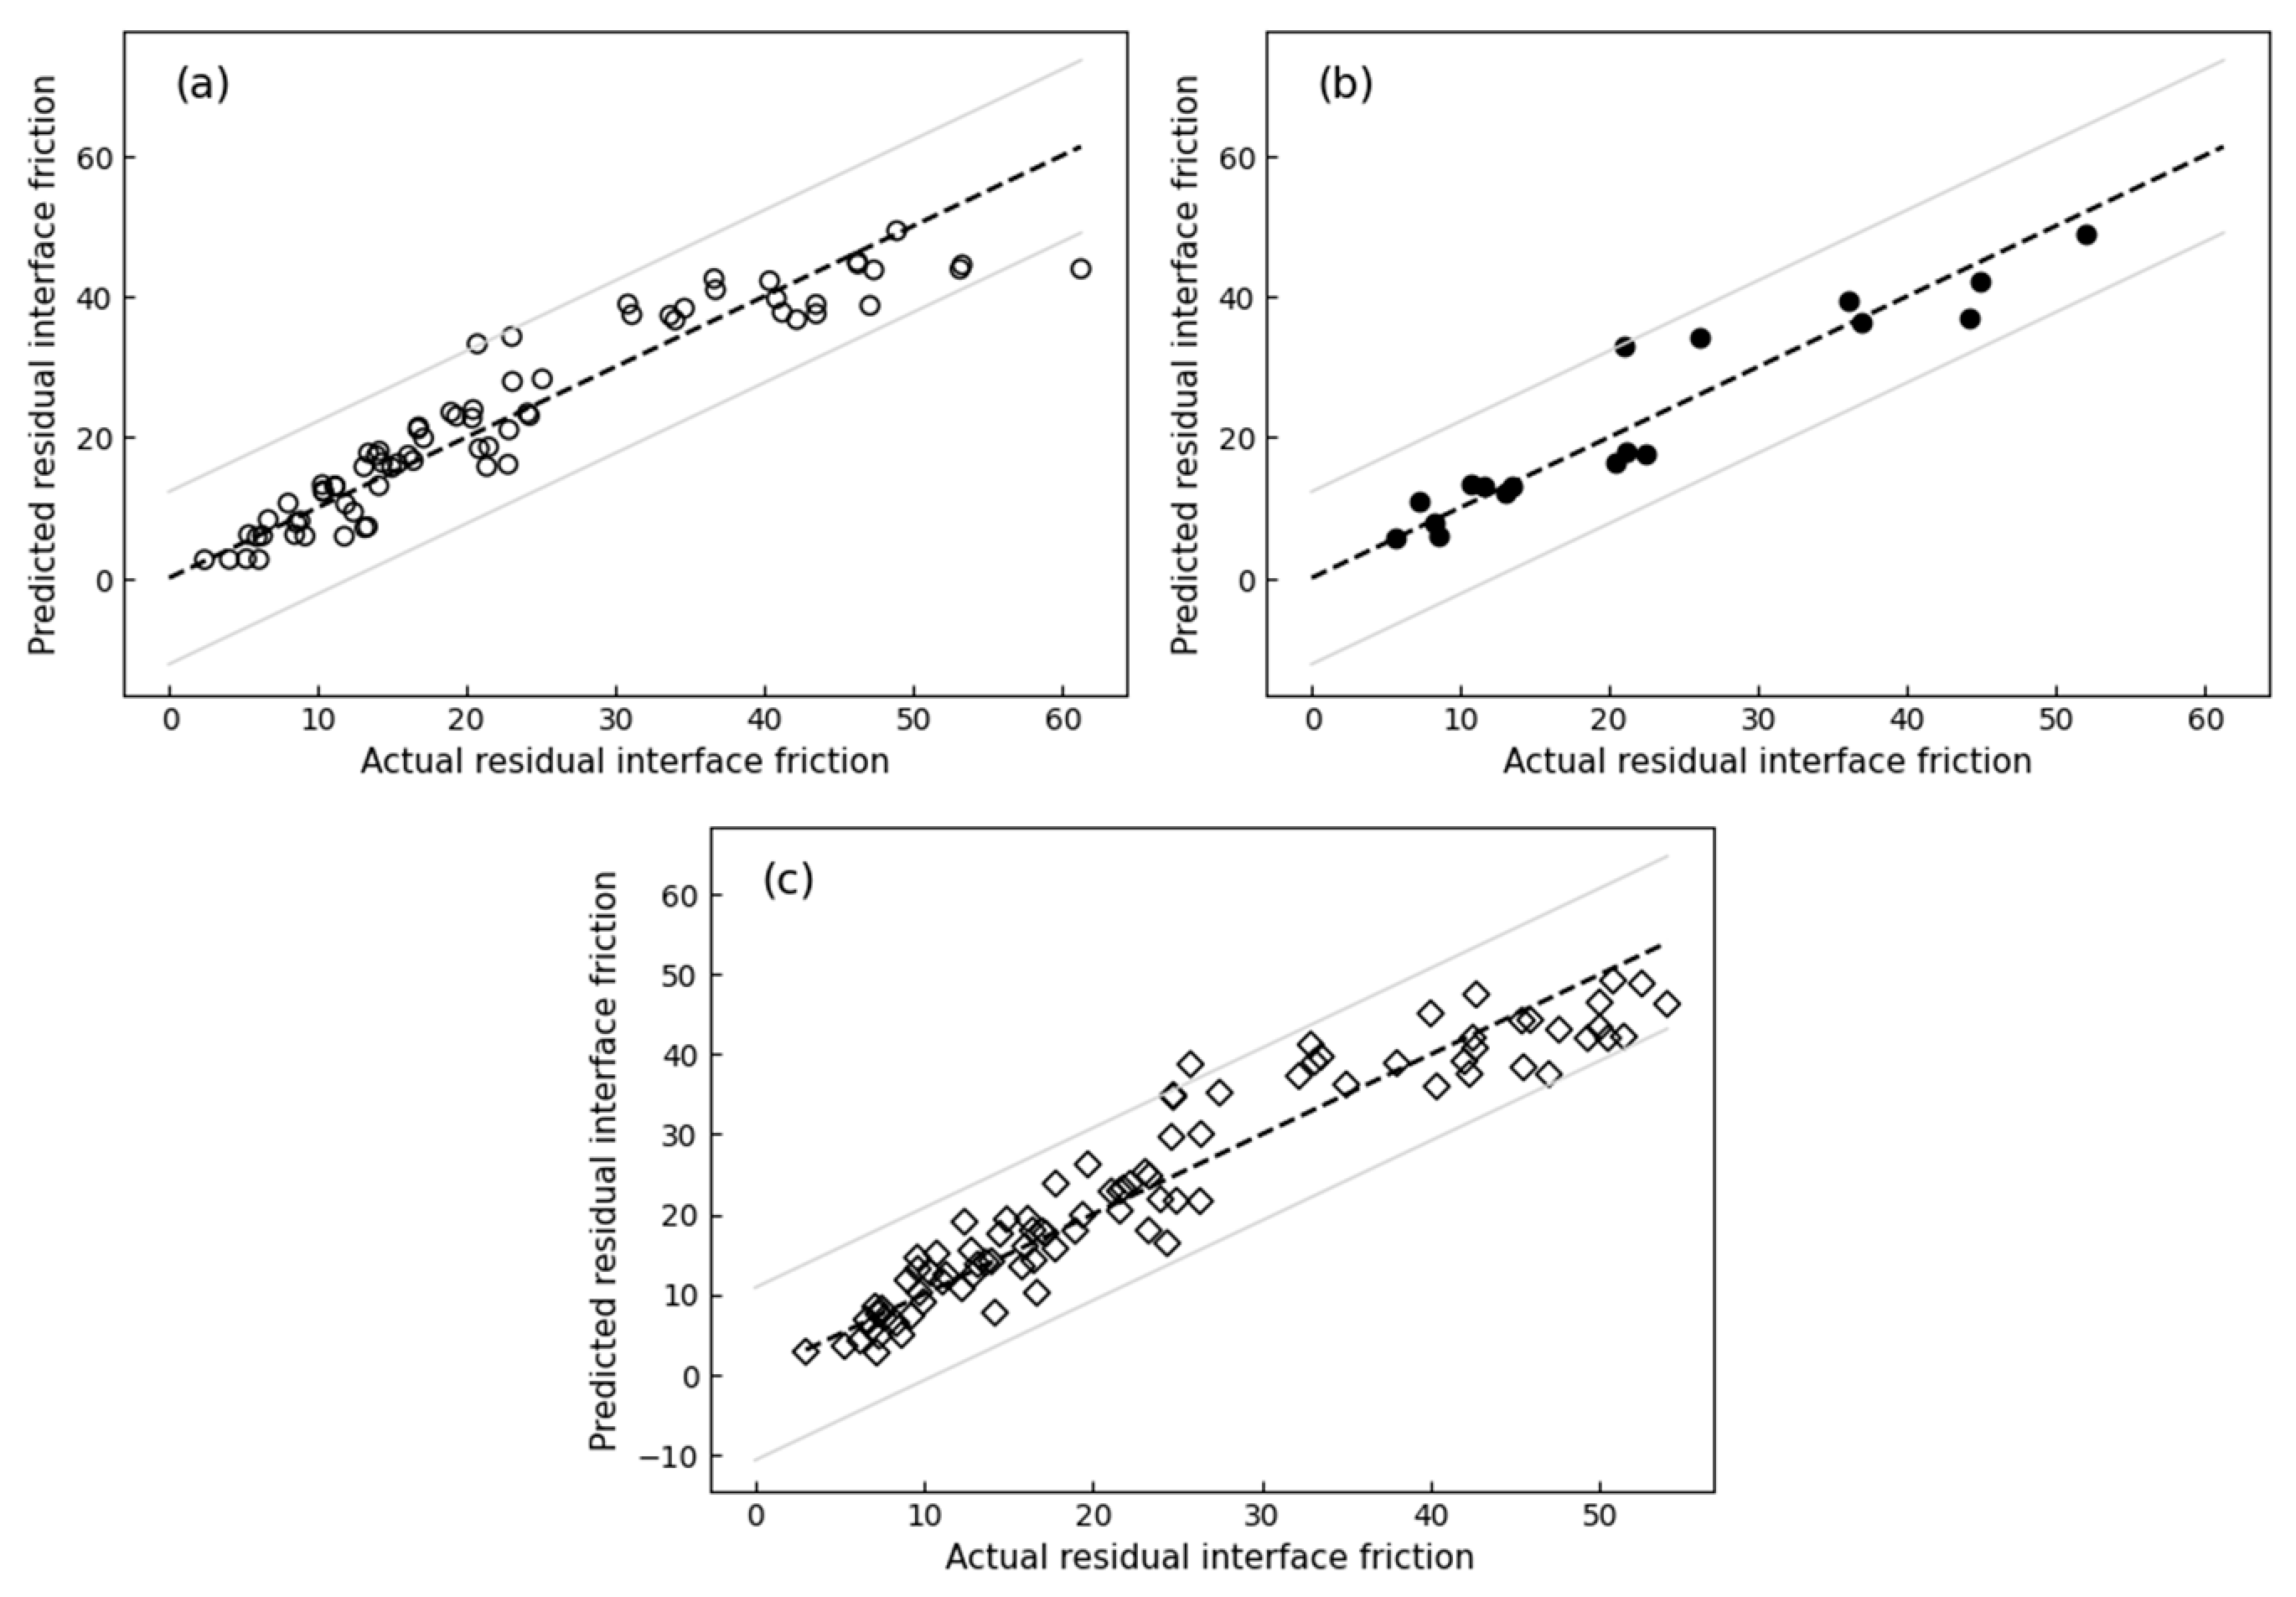
For peak shear stress, the model’s Mean Absolute Error (MAE) indicated higher accuracy during the training phase with a value of 2.98, compared to the testing and cross-validation phases, which scored 3.62 and 3.45, respectively. The Root Mean Square Error (RMSE) exhibited a similar trend, with the training phase achieving the lowest error at 3.93, followed by the cross-validation phase at 4.47, and the testing phase at 4.53. The Root Mean Squared Logarithmic Error (RMSLE) remained consistent between the training and testing phases, both at 0.18 and 0.19, while the cross-validation phase presented a slightly higher error of 0.21. The R2 values reflected the model’s robustness, showing a high degree of fit at 0.92 in the training phase, and a slightly lower yet comparable 0.90 in both the testing and cross-validation phases. These results are visually represented in Figure 12. The empirical equation for estimating the τ p is given by the following equation.
τ p = 63.446 39.664 × R I 4.352 × D 50 + 11.41 × n 8.539 × C u + 95.063 × C c + 0.176 × R t 0.008 × H D + ( 0.428 × σ )
where τ p is the peak interface shear strength, RI is the particle regularity, D 50 is the mean particle size, n is the porosity, C u is the coefficient of uniformity, C c is the coefficient of curvature, R t is surface roughness, H D is surface hardness, and σ is the normal stress.
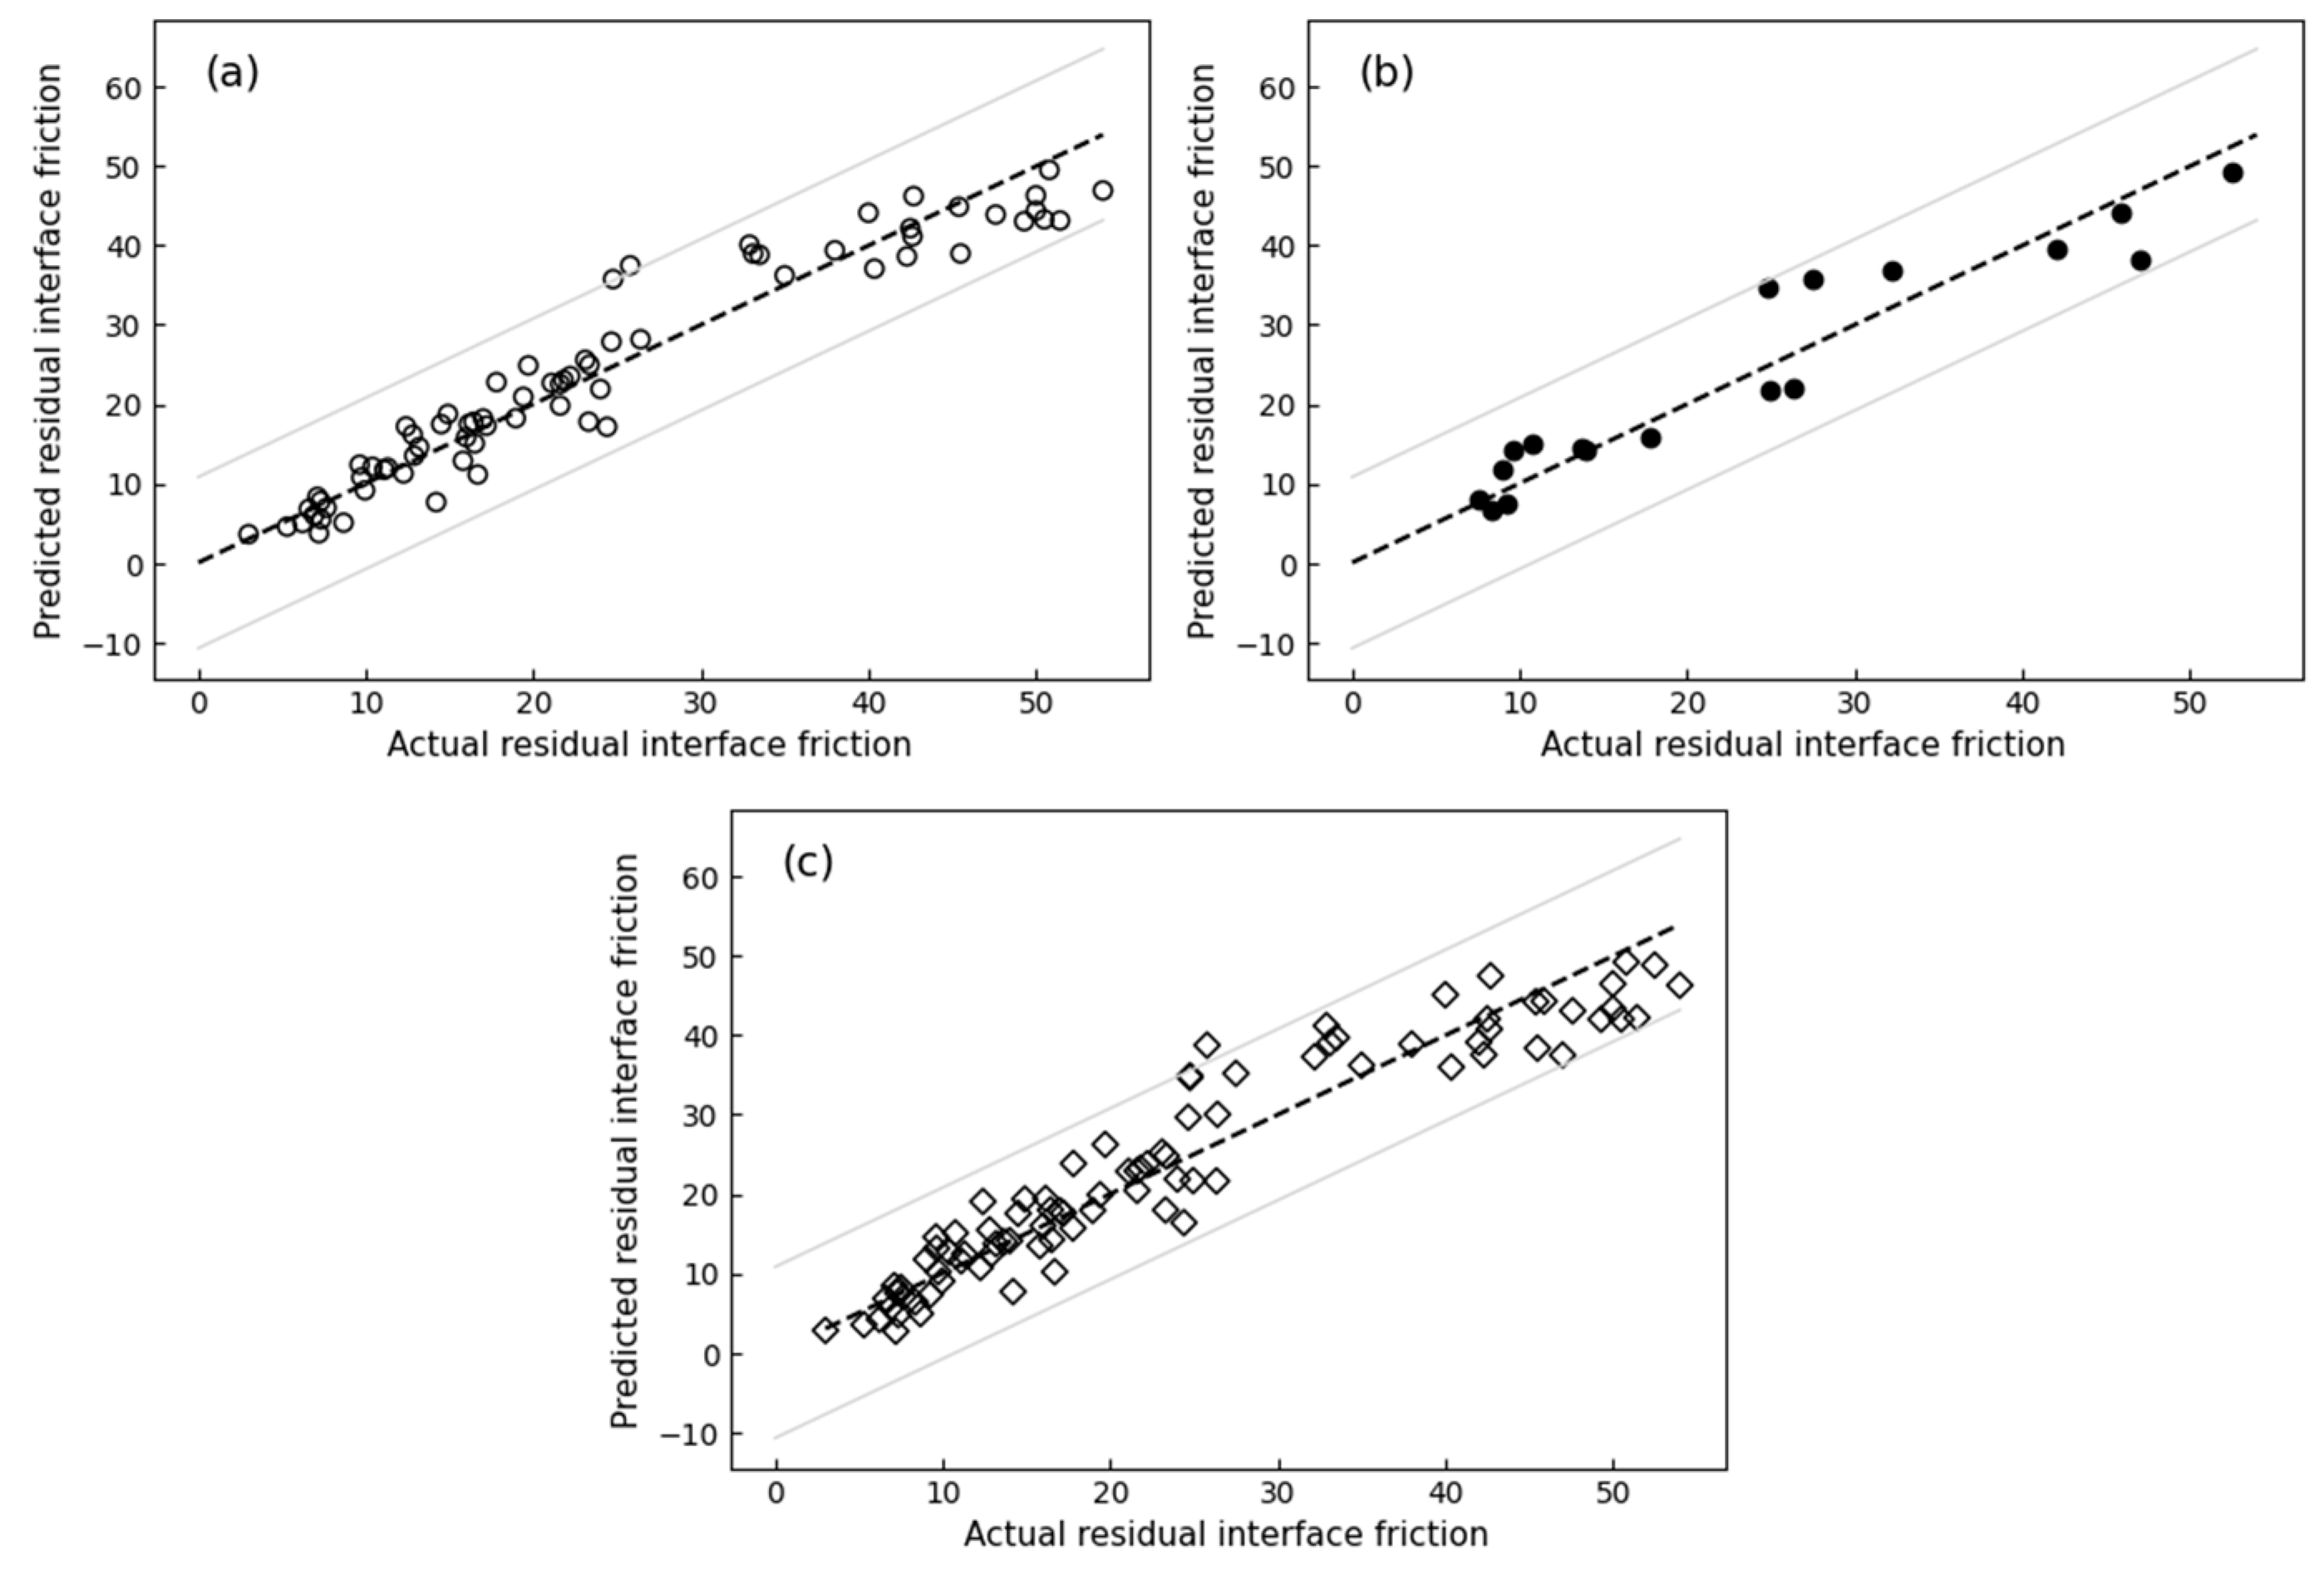
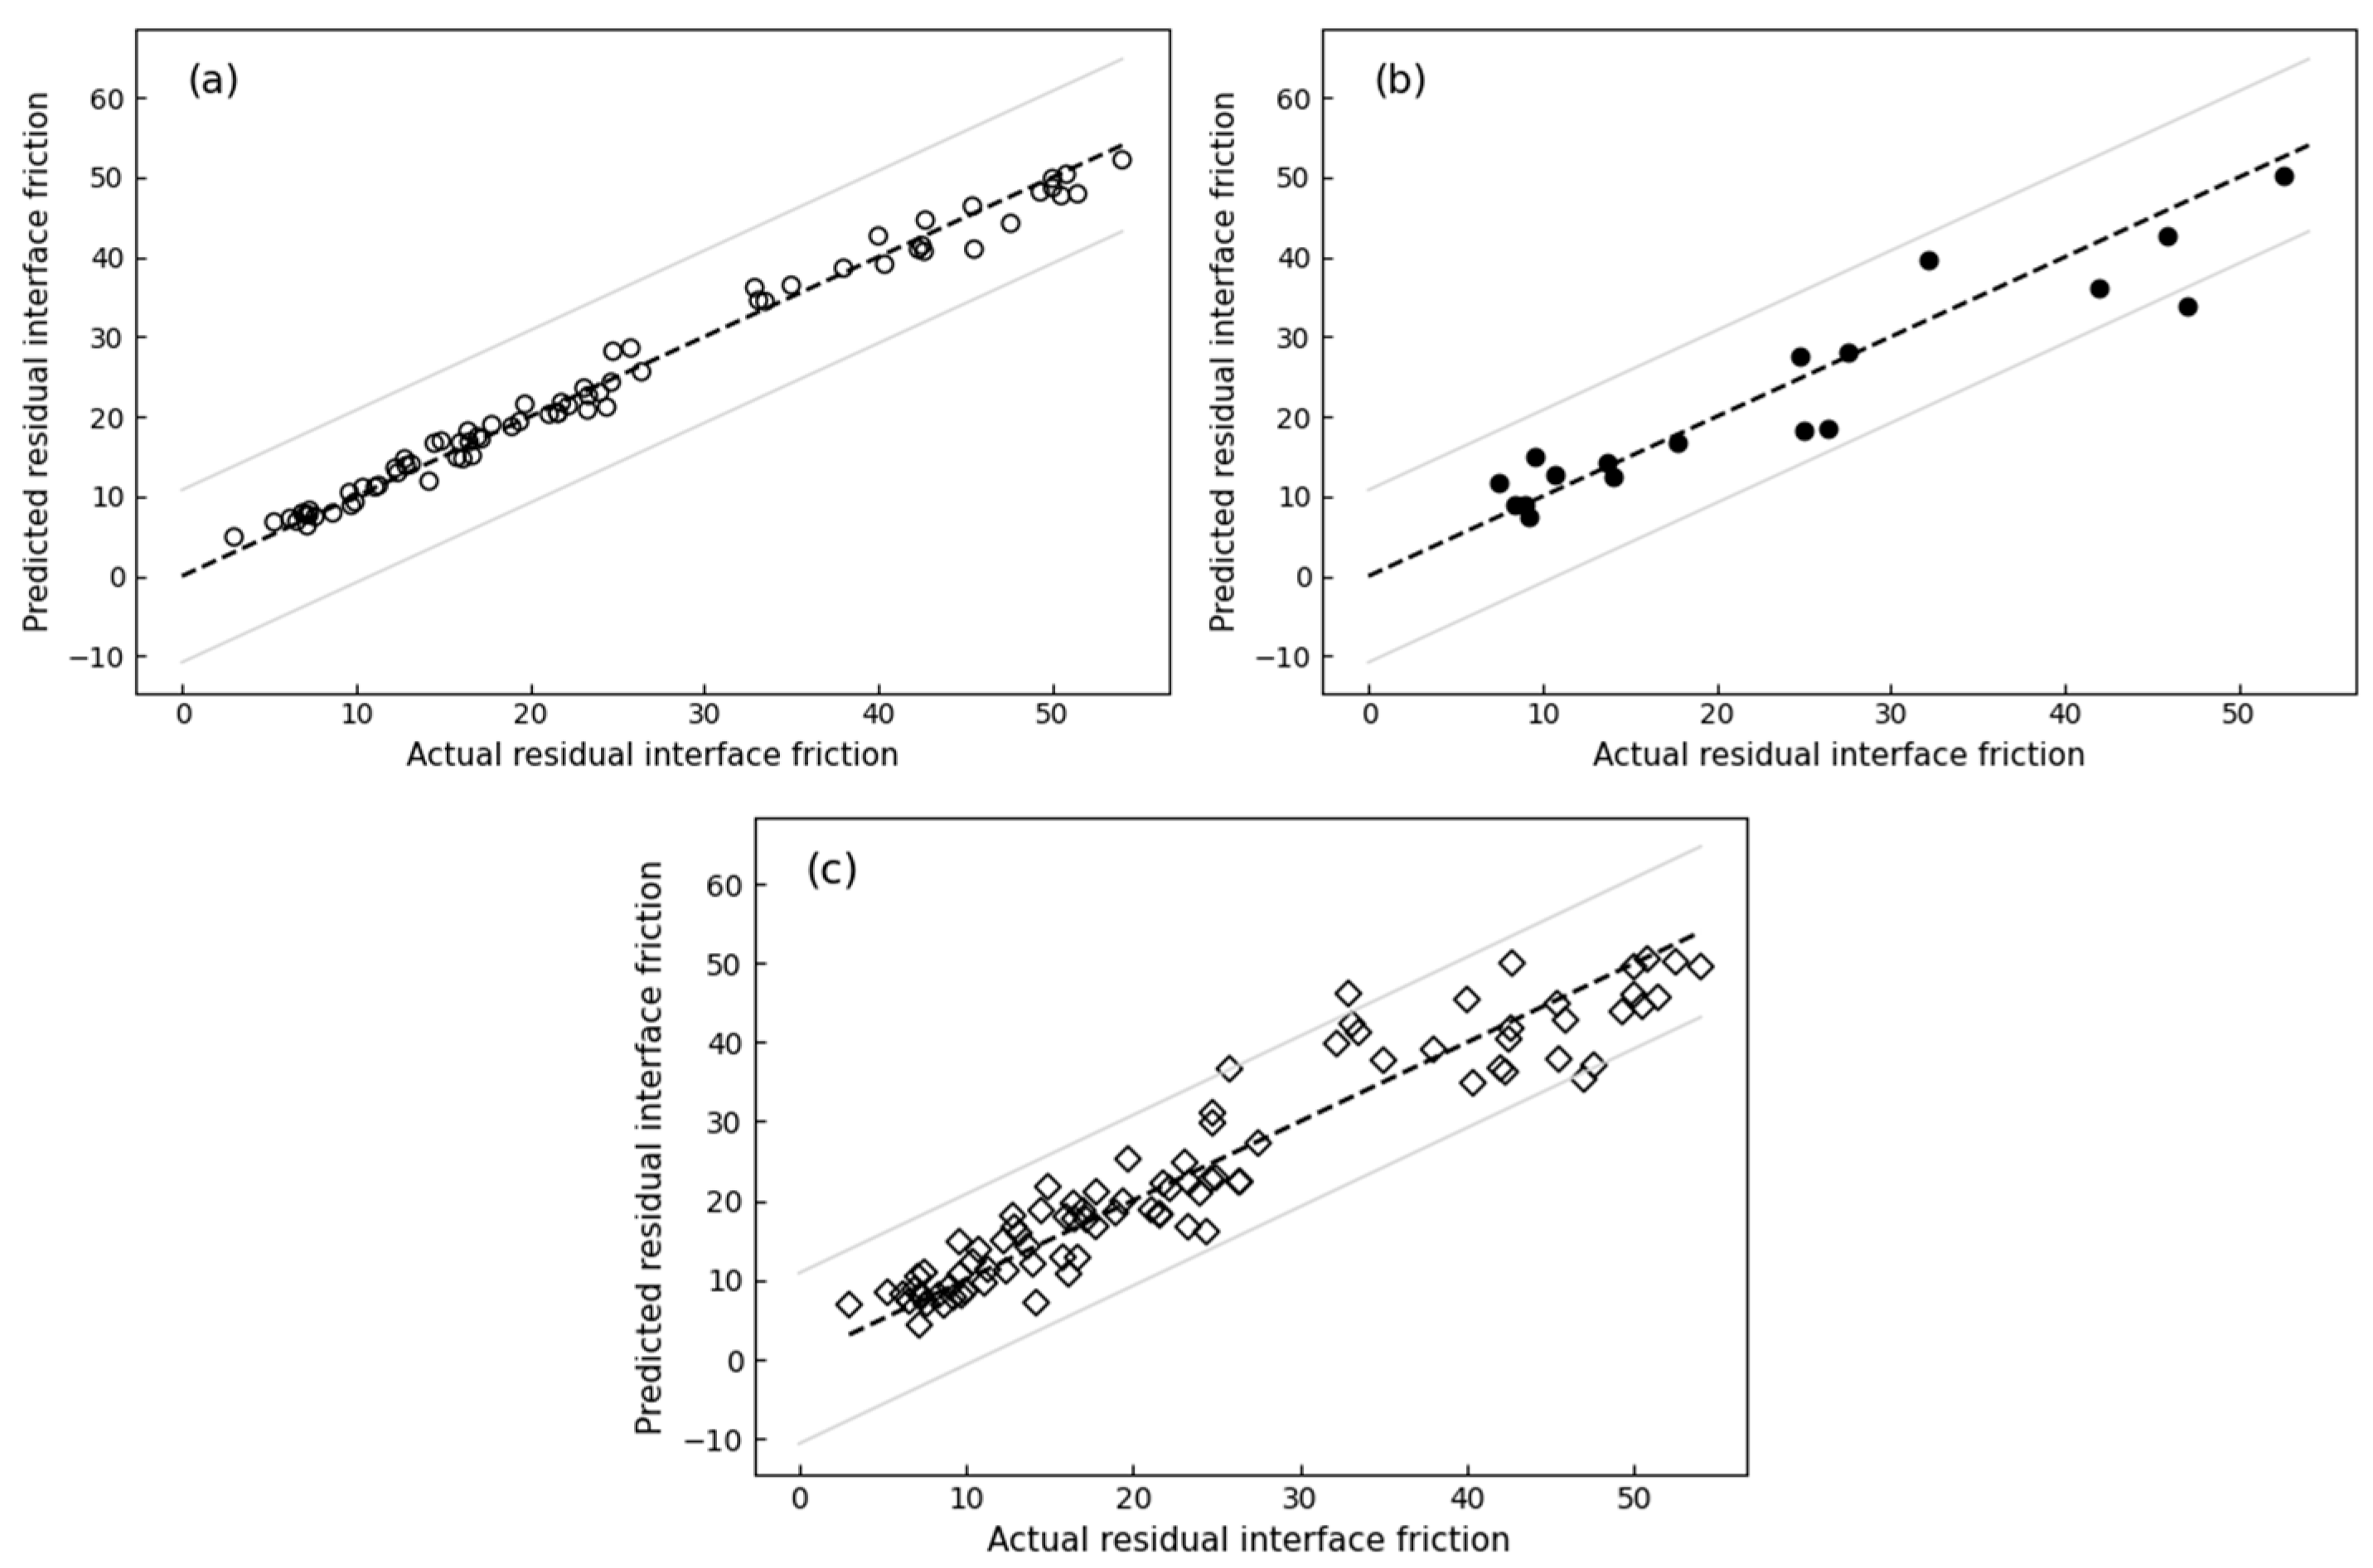
For residual shear stress, the MAE values were 3.61 for the training phase, 3.39 for the testing phase, and 3.45 for the cross-validation phase. The RMSE values followed a similar pattern, with 4.72 for the training phase, 4.52 for the testing phase, and 4.47 for the cross-validation phase. The RMSLE values were 0.23 for the training phase, 0.19 for the testing phase, and 0.21 for the cross-validation phase. The R2 values were slightly lower compared to the peak shear stress, with 0.89 for both the training and testing phases and 0.90 for the cross-validation phase. These results are illustrated in Figure 13. The empirical equation for estimating the τ r is given by the following equation.
τ r = 123.316 48.287 × R I 3.489 × D 50 + 9.889 × n 13.534 × C u + 167.996 × C c + 0.096 × R t 0.002 × H D + ( 0.416 × σ )
The model performed well due to high-quality data and effective feature selection, with low errors in peak and residual shear stress predictions. This highlights the model’s accuracy and robustness.

3.4. Random Forest Regression

The metrics derived from the training, testing, and 10-fold cross-validation (CV) datasets show that the RFR model predicts interface shear strength with excellent accuracy, as shown in Table 5.
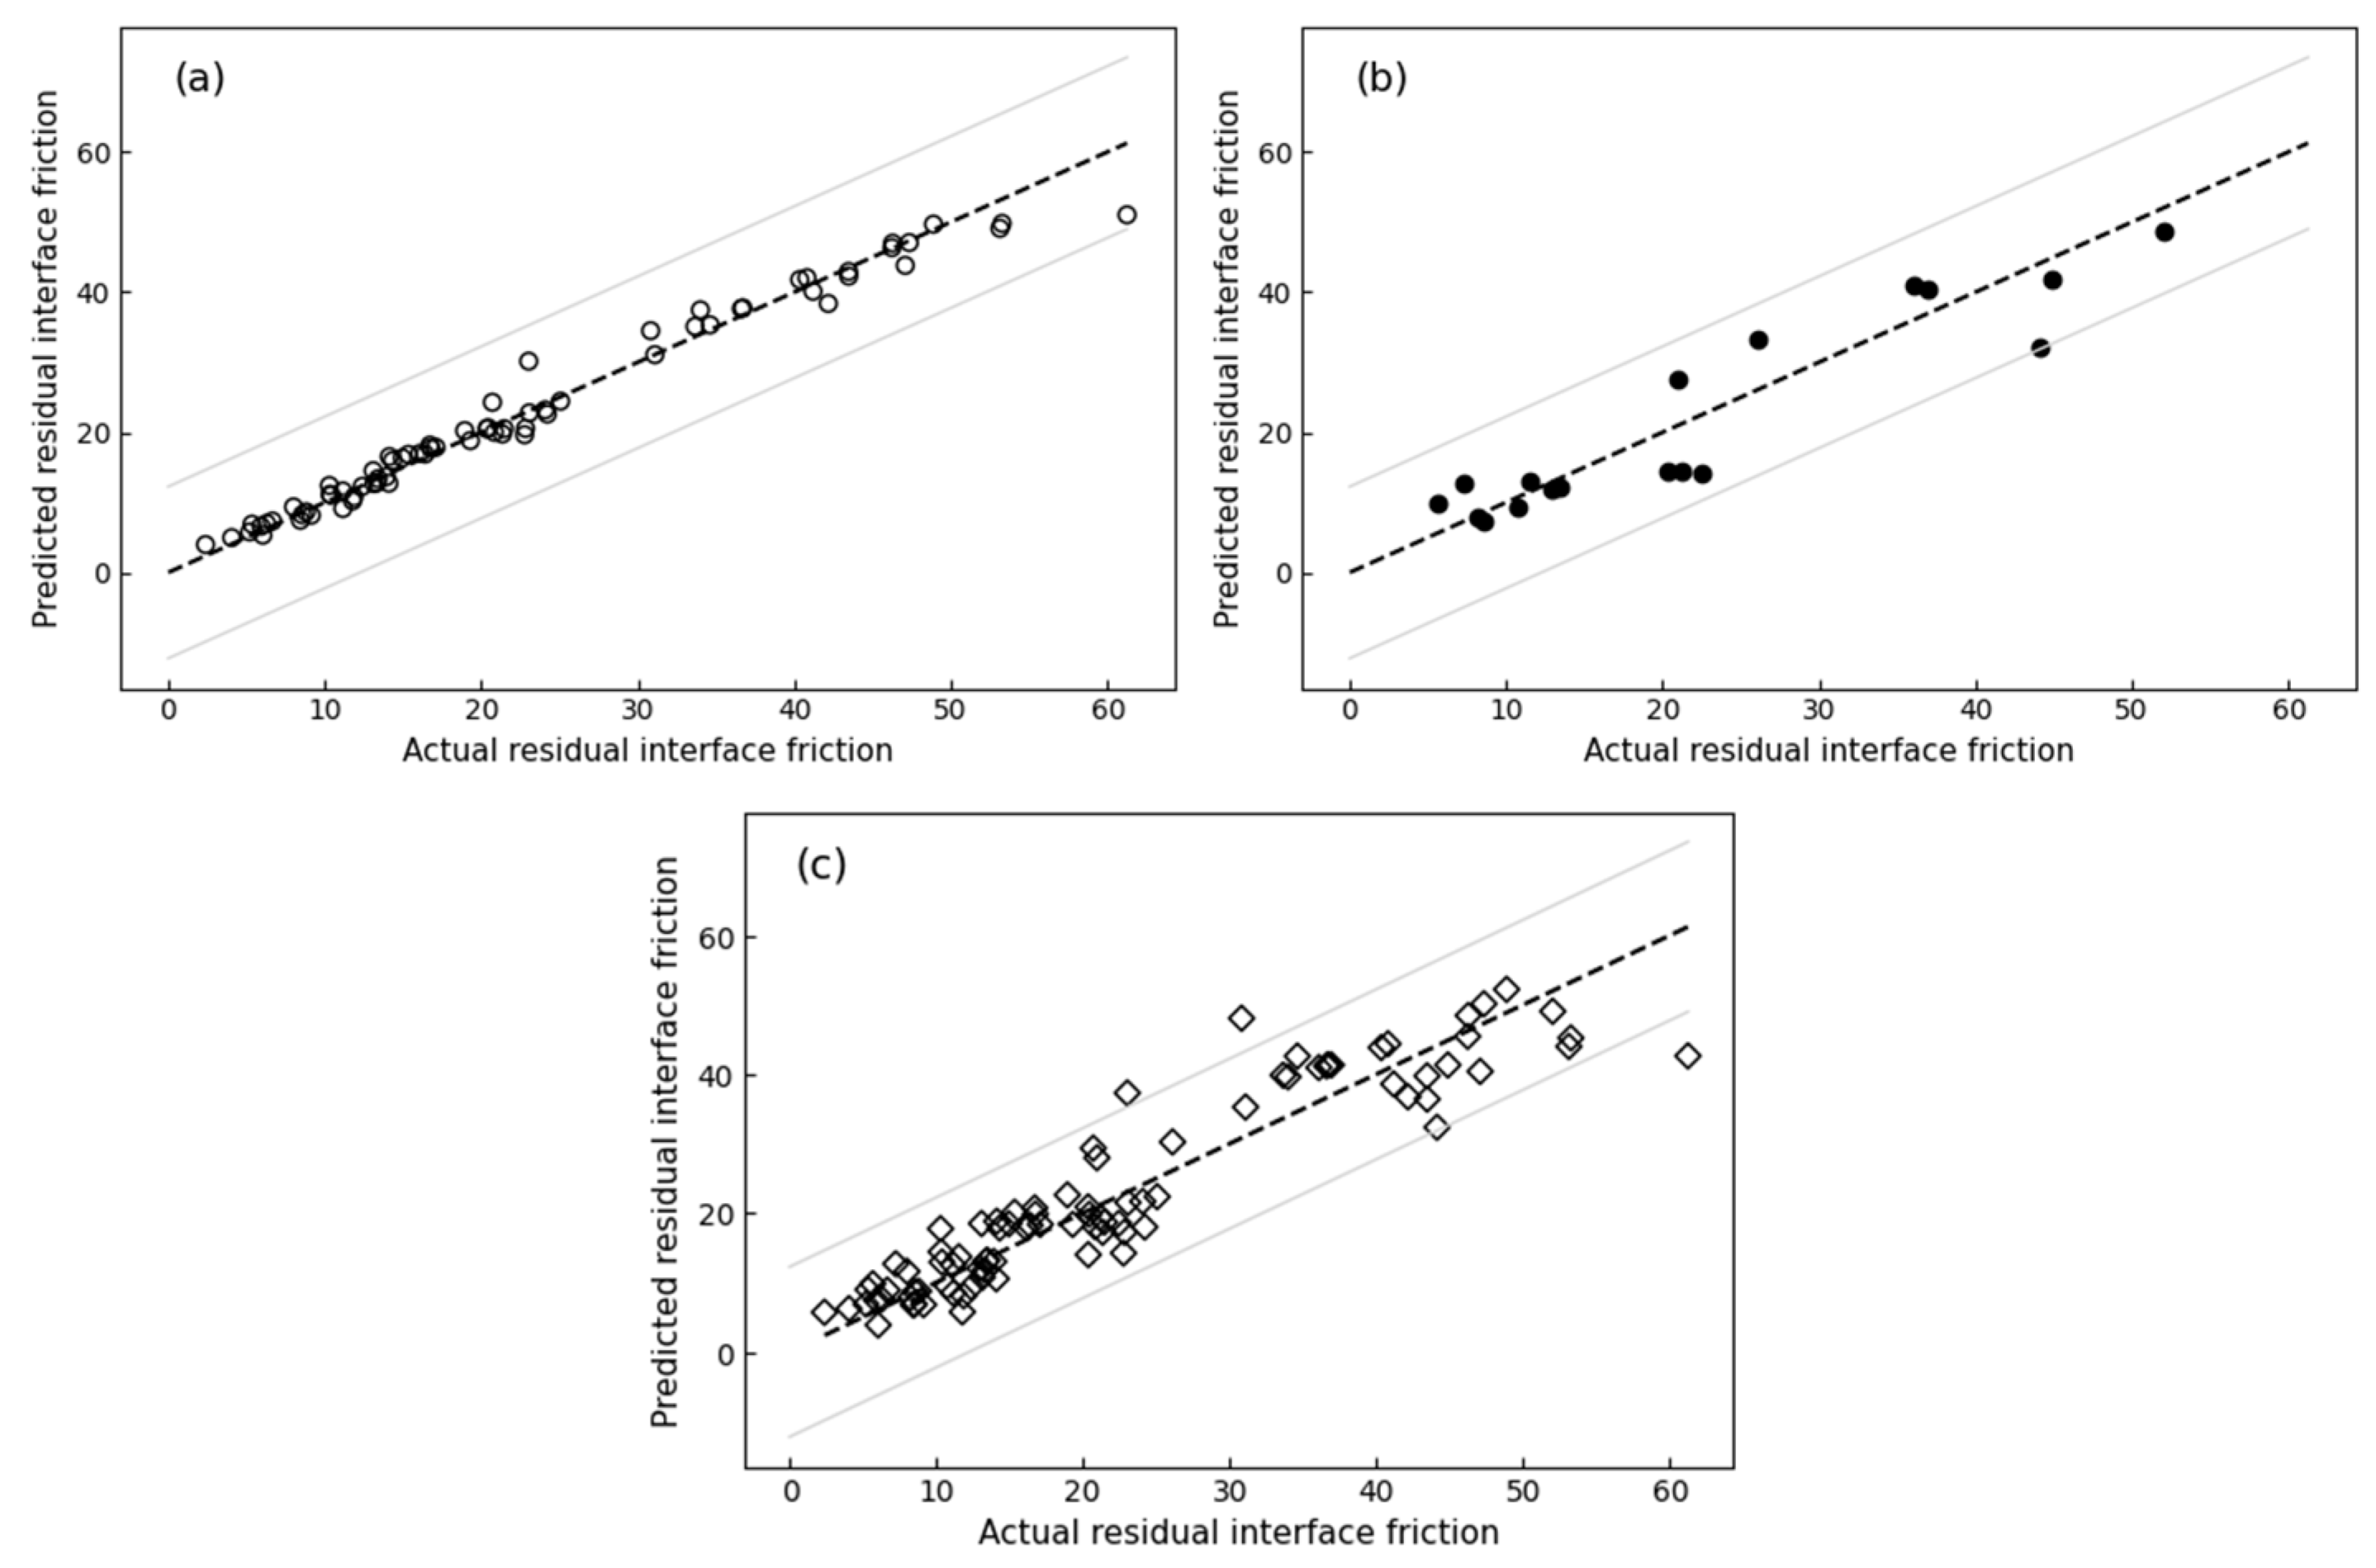
For peak shear stress, in the training phase with 72 observations, the RFR model demonstrates outstanding performance, evidenced by an R2 value of 0.98 and minimal errors (MAE of 1.28, RMSE of 1.60, RMSLE of 0.07). During the testing phase with 18 observations, there was a slight increase in errors, yet the model maintained high predictability with an R2 of 0.88 (MAE of 3.74, RMSE of 4.99, RMSLE of 0.19). Finally, in the 10-fold cross-validation with 90 observations, the error metrics increased (MAE of 3.46, RMSE of 4.48, RMSLE of 0.20), but the model still achieved a strong R2 of 0.90. These results are visually represented in Figure 14.
For residual shear stress, the training phase showed an MAE of 1.53, RMSE of 2.13, RMSLE of 0.09, and an R2 value of 0.97. During the testing phase, the errors increased (MAE of 3.77, RMSE of 4.82, RMSLE of 0.23), with an R2 value of 0.88. In the 10-fold cross-validation, the MAE was 3.97, RMSE was 5.16, RMSLE was 0.24, and the R2 was 0.87. These results are illustrated in Figure 15.

3.5. Method Comparison

An assessment of the performance metrics between the Multiple Linear Regression (MLR) and Random Forest Regression (RFR) models reveals that RFR consistently outperforms MLR in predicting both peak and residual interface shear strength, as shown in Table 6. For peak shear stress, RFR demonstrates lower error measurements (training MAE 1.28, RMSE 1.60, RMSLE 0.07, R2 0.98) compared to MLR (training MAE 2.98, RMSE 3.93, RMSLE 0.18, R2 0.92). In the testing and 10-fold cross-validation datasets, RFR maintains better accuracy with higher R2 values and lower RMSE. Specifically, for the testing phase, RFR achieves an MAE of 3.74, RMSE of 4.99, RMSLE of 0.19, and an R2 of 0.88, while MLR shows an MAE of 3.62, RMSE of 4.53, RMSLE of 0.19, and an R2 of 0.90. In the 10-fold cross-validation, RFR scores an MAE of 3.46, RMSE of 4.48, RMSLE of 0.20, and an R2 of 0.90 compared to MLR’s MAE of 3.45, RMSE of 4.47, RMSLE of 0.21, and R2 of 0.90.
For residual shear stress, RFR again shows higher performance with lower MAE, RMSE, and RMSLE values across all datasets, maintaining high R2 values. Specifically, in the training phase, RFR achieves an MAE of 1.53, RMSE of 2.13, RMSLE of 0.09, and an R2 of 0.97, compared to MLR’s MAE of 3.61, RMSE of 4.72, RMSLE of 0.23, and R2 of 0.89. In the testing phase, RFR scores an MAE of 3.77, RMSE of 4.82, RMSLE of 0.23, and an R2 of 0.88, whereas MLR achieves an MAE of 3.39, RMSE of 4.52, RMSLE of 0.19, and an R2 of 0.89. In the 10-fold cross-validation, RFR achieves an MAE of 3.97, RMSE of 5.16, RMSLE of 0.24, and an R2 of 0.87, compared to MLR’s MAE of 3.45, RMSE of 4.47, RMSLE of 0.21, and R2 of 0.90. Overall, RFR proves to be a more reliable and accurate model for predicting both peak and residual interface shear strength.
It is important to note that training with different seeds can yield varying results, and evaluating models based on random seeds alone may not be fair. The 10-fold cross-validation performed in this study provided a more robust comparison. Both MLR and RFR showed nearly identical results, with MLR occasionally outperforming RFR.

3.6. Important of Input Parameters

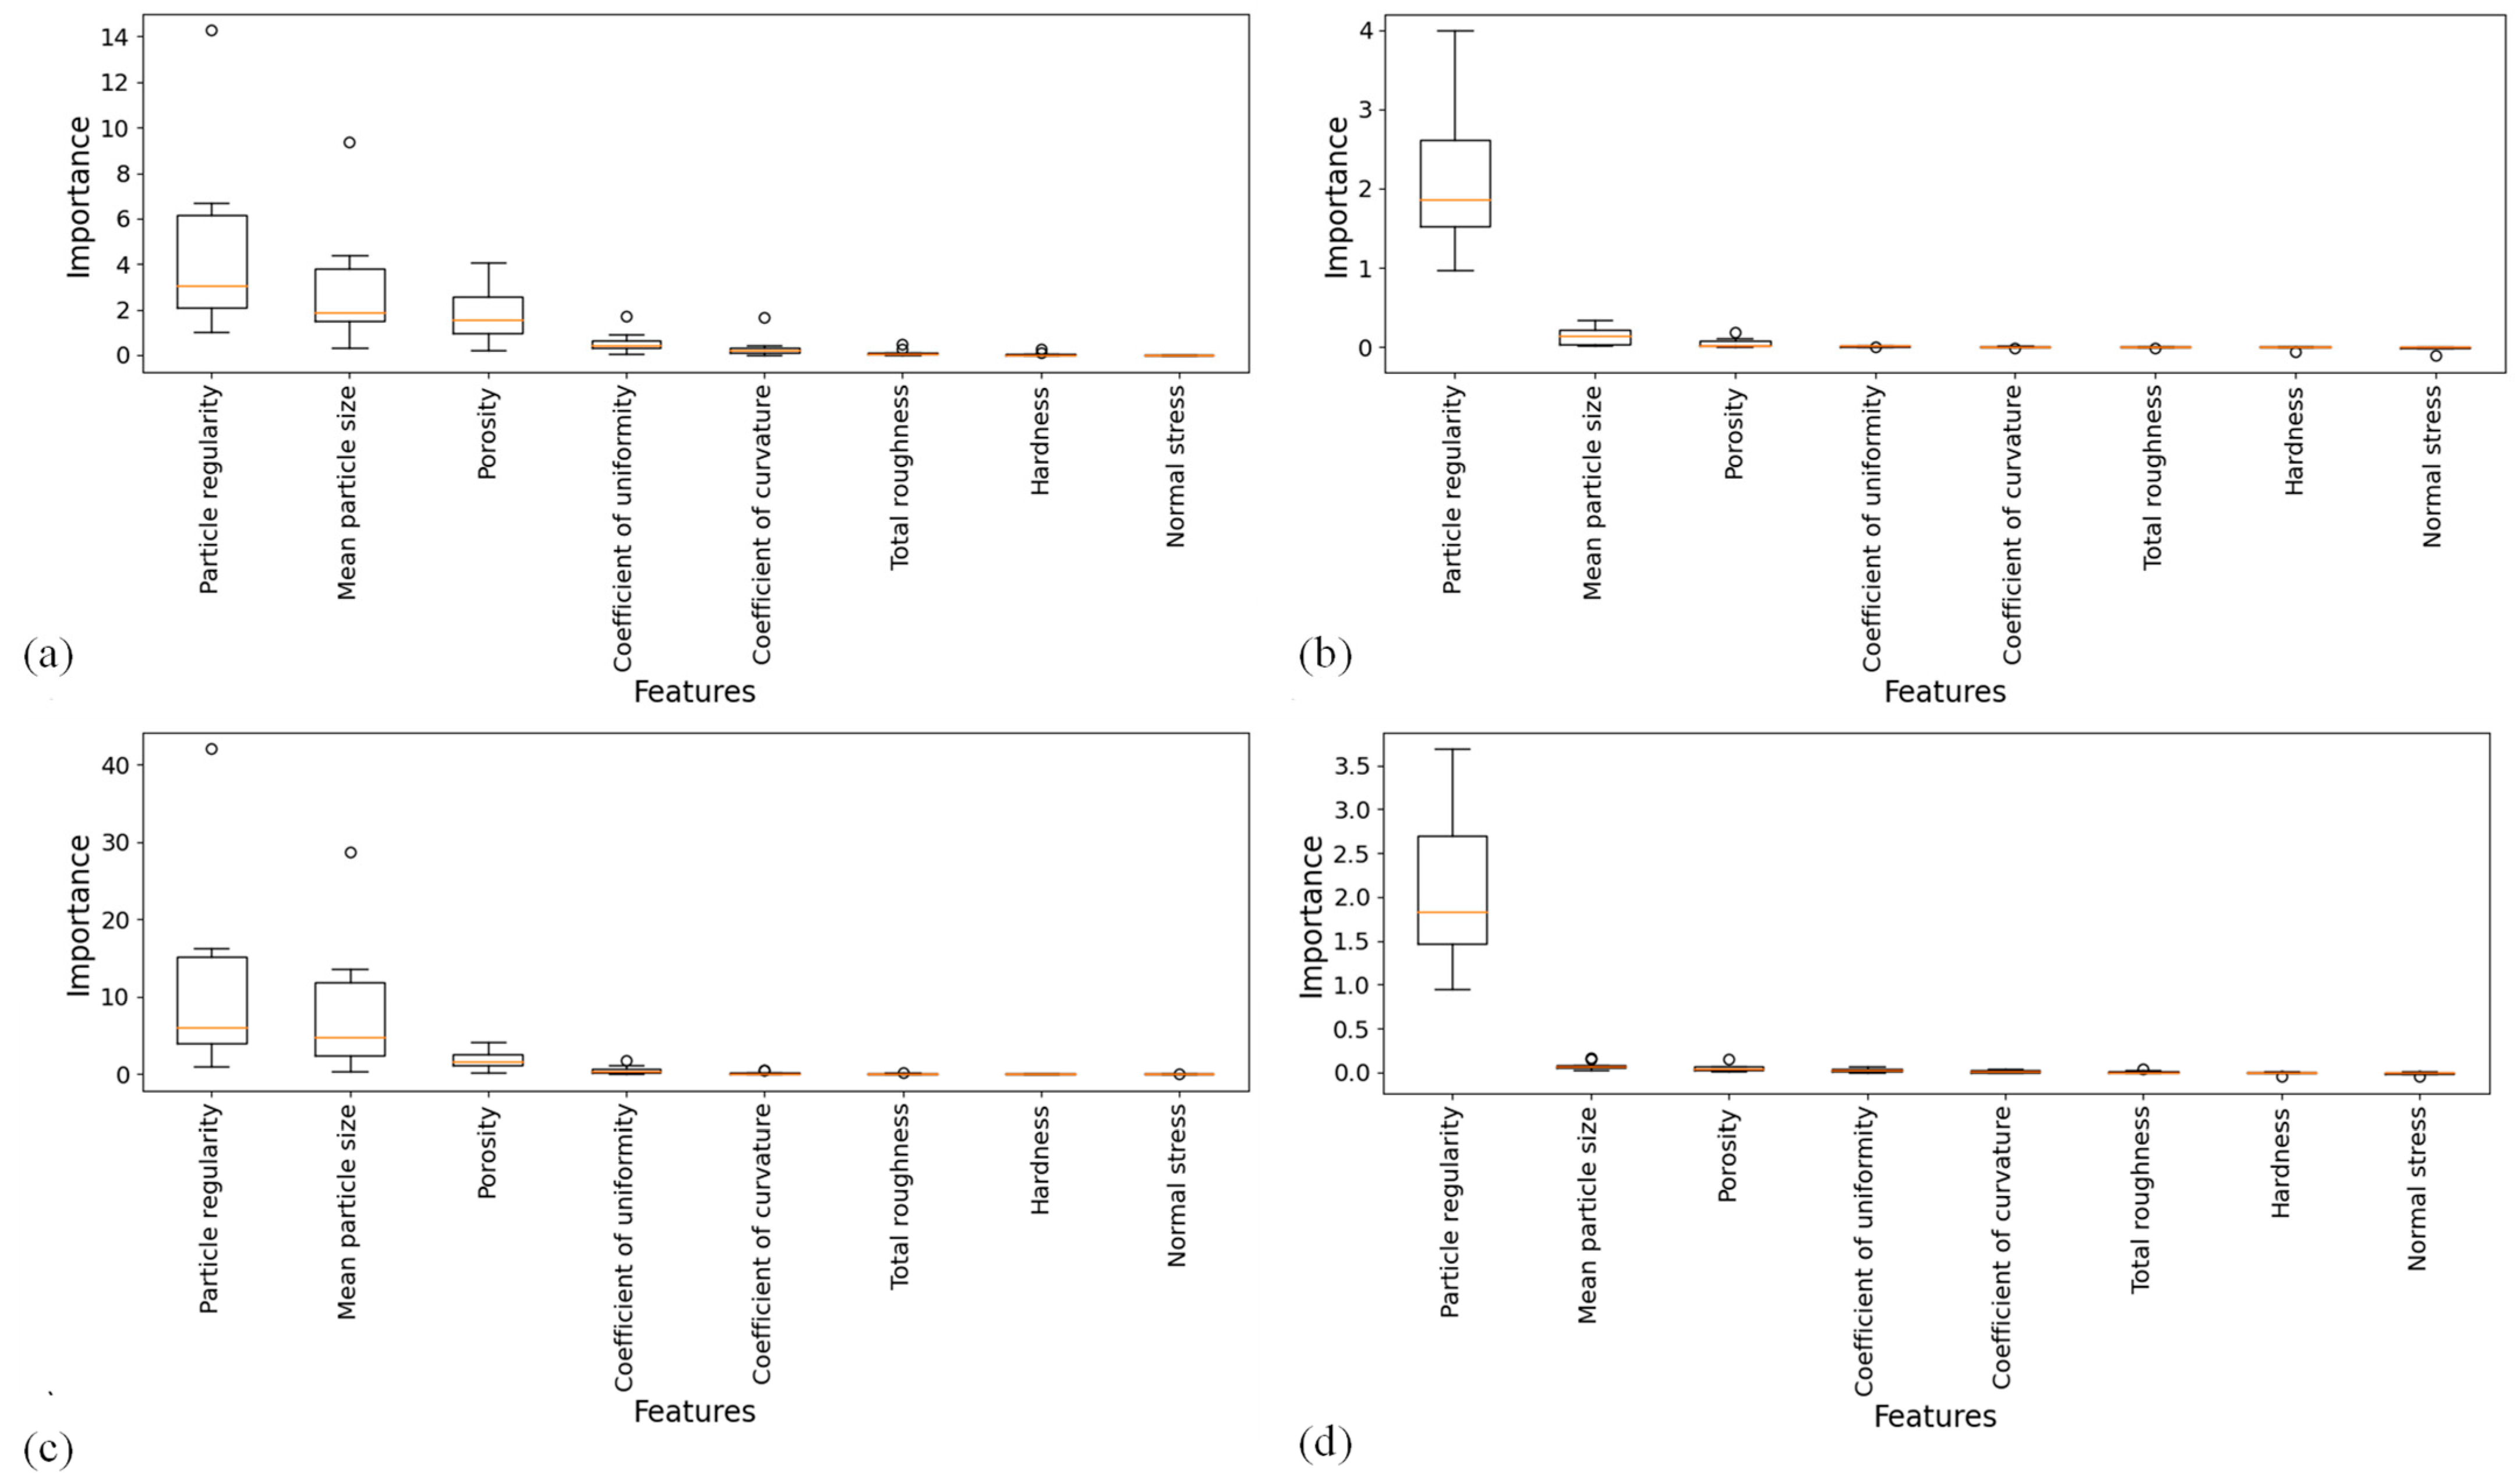
Among the eight input parameters (⍴r, D50, n, Cu, Cc, Rt, HD, and σ) and the output variable τ, Figure 16 shows that both the MLR and RFR models, using the 10-fold cross-validation method, identify particle regularity as the most important feature for predicting peak and residual interface shear strength. The mean particle size follows as the second most influential parameter, and the porosity is the third.

4. Conclusions

This study utilized a ring shear apparatus to measure both peak and residual interface shear strength between five different types of sand and three various continuum surfaces (steel, PVC, and stone) under varying normal stresses (25, 50, 100 kPa) at an interface shear rate of 0.5 mm/min. The key findings from this experiment are as follows:
  • Coarse sand exhibited higher μp with steel and PVC surfaces, while medium sand showed higher μp with stone.
  • Well-graded sand showed a higher μp compared to poorly graded sand.
  • As the sample density increases, the μp also increases.
  • Due to its high roughness and hardness, stone consistently provided the highest interface shear strength values across different sand types, followed by PVC and then steel.
  • The machine learning models (MLR and RFR) demonstrated high accuracy for both peak and residual shear strength. For peak shear strength, the MLR model achieved an R2 of 0.92 during training and 0.90 during testing, while the RFR model achieved an R2 of 0.98 during training and 0.88 during testing. For residual shear strength, the MLR model achieved an R2 of 0.89 during both training and testing, while the RFR model achieved an R2 of 0.97 during training and 0.88 during testing.
  • In the 10-fold cross-validation, the models continued to demonstrate high accuracy. For peak shear strength, both models achieved an R2 of 0.90. For residual shear strength, the MLR model achieved an R2 of 0.90, while the RFR model attained an R2 of 0.87.
  • Among the eight input parameters, particle regularity was identified as the most influential factor for both peak and residual shear strength, followed by mean particle size and porosity.

Author Contributions

Methodology, R.A. and H.A.-N.; writing—original draft preparation, R.A. and F.D.; writing—review and editing, R.A., F.D. and H.A.-N.; supervision, H.A.-N. All authors have read and agreed to the published version of the manuscript.

Funding

This research received no external funding.

Institutional Review Board Statement

Not applicable.

Informed Consent Statement

Not applicable.

Data Availability Statement

The data presented in this study are available in the article.

Conflicts of Interest

The authors declare no conflicts of interest.

Nomenclature

μpPeak interface friction
δpPeak interface friction angle
RIParticle regularity
D50Median particle size
nPorosity
CuCoefficient of uniformity
CcCoefficient of curvature
RtSurface roughness
HDSurface hardness
σNormal stress
τpPeak interface shear strength
τrResidual interface shear stress
MLRMultiple linear regression
RFRRandom Forest regression

Appendix A

Table A1. The ring shear experiment data on interface shear strength employed for machine learning analysis.
#RID50
(mm)
nCuCcRt
(μm)
HDσ
(kPa)
τp
(kPa)
τr
(kPa)
10.7150.510.3771.20.974112.22532.38
20.7150.510.2911.20.974112.25012.8910.39
30.7150.510.2681.20.974112.210024.7620.95
40.7150.510.3511.20.9712112.2255.34.05
50.7150.510.2791.20.9712112.25013.1810.33
60.7150.510.261.20.9712112.210024.7620.70
70.7150.510.4081.20.970.550257.26.04
80.7150.510.4081.20.970.5505013.6811.54
90.7150.510.4081.20.970.55010027.526.10
100.7150.510.3621.20.971550257.345.20
110.7150.510.3621.20.9715505012.810.29
120.7150.510.3621.20.97155010025.7823.02
130.7150.510.3621.20.9782.927952512.2513.33
140.7150.510.3621.20.9782.927955026.3421.17
150.7150.510.3621.20.9782.9279510050.543.45
160.7150.510.3471.20.9782.927952516.6813.14
170.7150.510.3471.20.9782.927955024.9522.44
180.7150.510.3471.20.9782.9279510051.4447.07
190.3951.770.3811.450.968112.2257.36.66
200.3951.770.3061.450.968112.25016.4314.12
210.3951.770.2911.450.968112.210033.1230.81
220.3951.770.3091.450.9616112.2257.118.56
230.3951.770.2191.450.9616112.2501716.06
240.3951.770.2041.450.9616112.21003834.61
250.3951.770.3661.450.96550259.258.24
260.3951.770.3661.450.965505018.9520.83
270.3951.770.3661.450.965501004236.08
280.3951.770.3431.450.961750259.958.81
290.3951.770.3431.450.9617505021.621.46
300.3951.770.3431.450.96175010042.6340.79
310.3951.770.3741.450.9682.927952510.7513.46
320.3951.770.3741.450.9682.927955023.124.07
330.3951.770.3741.450.9682.927951005453.26
340.3951.770.3061.450.9682.92795251412.97
350.3951.770.3061.450.9682.927955023.3520.35
360.3951.770.3061.450.9682.927951005047.33
370.3950.630.3436.21.318112.2256.226.28
380.3950.630.2726.21.318112.25016.513.09
390.3950.630.2536.21.318112.21003533.98
400.370.630.2346.21.3116112.2256.925.35
410.370.630.146.21.3116112.25015.9914.95
420.370.630.1136.21.3116112.210032.236.93
430.370.630.2726.21.31550258.679.13
440.370.630.2726.21.315505017.7720.36
450.370.630.2726.21.3155010040.3643.46
460.370.630.2456.21.311750258.368.51
470.370.630.2456.21.3117505017.216.40
480.370.630.2456.21.31175010042.341.18
490.370.630.2456.21.3182.927952510.48.00
500.370.630.2456.21.3182.927955017.816.71
510.370.630.2456.21.3182.927951004040.33
520.370.630.2346.21.3182.927952511.311.86
530.370.630.2346.21.3182.927955021.122.82
540.370.630.2346.21.3182.9279510045.944.87
550.6350.510.4081.20.978112.2257.658.44
560.6350.510.3571.20.978112.25024.422.76
570.6350.510.3391.20.978112.21004744.13
580.6350.510.3551.20.9716112.22514.211.77
590.6350.510.2961.20.9716112.25023.321.34
600.6350.510.281.20.9716112.210045.542.15
610.6350.510.4031.20.97550256.65.92
620.6350.510.4031.20.975505014.514.32
630.6350.510.4031.20.9755010033.531.08
640.6350.510.3471.20.971750257.55.67
650.6350.510.3471.20.9717505014.915.34
660.6350.510.3471.20.97175010032.933.64
670.6350.510.4161.20.9782.92795259.67.24
680.6350.510.4161.20.9782.927955019.716.76
690.6350.510.4161.20.9782.9279510042.736.60
700.6350.510.2671.20.9782.927952515.812.39
710.6350.510.2671.20.9782.927955022.217.09
720.6350.510.2671.20.9782.9279510045.436.70
730.411.720.3741.691.0112112.2259.7311.15
740.411.720.3171.691.0112112.25019.419.30
750.411.720.3061.691.0112112.210042.561.24
760.411.720.3471.691.0120112.22511.114.09
770.411.720.2941.691.0120112.2502424.21
780.411.720.2721.691.0120112.210049.353.12
790.411.720.4081.691.011550259.0310.75
800.411.720.4081.691.0115505021.620.42
810.411.720.4081.691.01155010047.646.22
820.411.720.3471.691.012250259.6311.15
830.411.720.3471.691.0122505021.818.93
840.411.720.3471.691.0122501005046.26
850.411.720.3891.691.0182.927952516.1413.40
860.411.720.3891.691.0182.927955026.425.06
870.411.720.3891.691.0182.9279510050.848.87
880.411.720.3551.691.0182.927952512.413.92
890.411.720.3551.691.0182.927955024.6623.06
900.411.720.3551.691.0182.9279510052.552.02

References

  1. Abuel-Naga, H.M.; Shaia, H.A.; Bouazza, A. Effect of Surface Roughness and Hardness of Continuum Materials on Interface Shear Strength of Granular Materials. J. Test. Eval. 2017, 46, 826–831. [Google Scholar] [CrossRef]
  2. AS1289.3.6.1; Method of Testing Soils for Engineering Purposes—Soil Classification. Australian Standard: Sydney, Australia, 2009.
  3. Brumund, W.; Leonards, G. Experimental study of static and dynamic friction between sand and typical constuction materials. J. Test. Eval. 1973, 1, 162–165. [Google Scholar] [CrossRef]
  4. Daghistani, F.; Abuel-Naga, H. Advancements in Understanding Interface Friction: A Combined Experimental and Machine Learning Approach Using Multiple Linear and Random Forest Regressions. Geotechnics 2024, 4, 109–126. [Google Scholar] [CrossRef]
  5. DeJong, J.T.; Westgate, Z.J. Role of initial state, material properties, and confinement condition on local and global soil-structure interface behavior. J. Geotech. Geoenviron. Eng. 2009, 135, 1646–1660. [Google Scholar] [CrossRef]
  6. Dove, J.; Bents, D.; Wang, J.; Gao, B. Particle-scale surface interactions of non-dilative interface systems. Geotext. Geomembr. 2006, 24, 156–168. [Google Scholar] [CrossRef]
  7. Dove, J.E.; Frost, J.D. Peak friction behavior of smooth geomembrane-particle interfaces. J. Geotech. Geoenviron. Eng. 1999, 125, 544–555. [Google Scholar] [CrossRef]
  8. Ebrahimian, B.; Bauer, E. Numerical simulation of the effect of interface friction of a bounding structure on shear deformation in a granular soil. Int. J. Numer. Anal. Methods Geomech. 2012, 36, 1486–1506. [Google Scholar] [CrossRef]
  9. Frost, J.; Han, J. Behavior of interfaces between fiber-reinforced polymers and sands. J. Geotech. Geoenviron. Eng. 1999, 125, 633–640. [Google Scholar] [CrossRef]
  10. Frost, J.D.; DeJong, J.; Recalde, M. Shear failure behavior of granular–continuum interfaces. Eng Fract. Mech. 2002, 69, 2029–2048. [Google Scholar] [CrossRef]
  11. Guo, H.; Wang, S.; Guo, C.; Yang, K.; Guo, R.; Fu, J.; Nan, Y.; Tao, M. Effect of grain size distribution on the shear properties of sand. Front. Mater. 2023, 10, 1219765. [Google Scholar] [CrossRef]
  12. Haeri, H.; Sarfarazi, V.; Zhu, Z.; Marji, M.F.; Masoumi, A. Investigation of shear behavior of soil-concrete interface. Smart Struct. Syst. 2019, 23, 81–90. [Google Scholar]
  13. Karimi, M.R.; Abrinia, K.; Hamdia, K.M.; Hashemianzadeh, S.M.; Baniassadi, M. Effects of Functional Group Type and Coverage on the Interfacial Strength and Load Transfer of Graphene-Polyethylene Nanocomposites: A Molecular Dynamics Simulation. Appl. Phys. A 2022, 128, 341. [Google Scholar] [CrossRef]
  14. Pham, H.H.G.; Van Impe, P.; Van Impe, W.; Mengé, P.; Haegeman, W. Shear and interface shear strengths of calcareous sand. In Proceedings of the 19th International Conference on Soil Mechanics and Geotechnical Engineering, Seoul, Republic of Korea, 17–21 September 2017. [Google Scholar]
  15. Potyondy, J.G. Skin friction between various soils and construction materials. Géotechnique 1961, 11, 339–353. [Google Scholar] [CrossRef]
  16. Powers, M.C. A new roundness scale for sedimentary particles. SEPM J. Sediment. Res. 1953, 23, 117–119. [Google Scholar] [CrossRef]
  17. Rowe, P.W. The stress-dilatancy relation for static equilibrium of an assembly of particles in contact. Proc. R. Soc. Lond. Ser. A Math. Phys. Sci. 1962, 269, 500–527. [Google Scholar]
  18. Shaia, H. Behaviour of Fibre Reinforced Polymer Composite Piles: Experimental and Numerical Study. Ph.D. Thesis, The University of Manchester, Manchester, UK, 2013. [Google Scholar]
  19. Stacho, J.; Sulovska, M.; Slavik, I. Analysis of the Shear Strength of a Soil-Geosynthetic Interface. Civ. Environ. Eng. 2023, 19, 452–463. [Google Scholar] [CrossRef]
  20. Stachowiak, G.; Batchelor, A. Engineering Tribology; Butterworth Heinemann Team LRN: Oxford, UK, 2013. [Google Scholar]
  21. Uesugi, M.; Kishida, H. Frictional resistance at yield between dry sand and mild steel. Soils Found. 1986, 26, 139–149. [Google Scholar] [CrossRef] [PubMed]
  22. Vangla, P.; Latha, G.M. Influence of particle size on the friction and interfacial shear strength of sands of similar morphology. Int. J. Geosynth. Ground Eng. 2015, 1, 6. [Google Scholar] [CrossRef]
  23. Zhao, Y.; Yang, G.; Wang, Z.; Yuan, S. Research on the effect of particle size on the interface friction between geogrid reinforcement and soil. Sustainability 2022, 14, 15443. [Google Scholar] [CrossRef]
  24. Zhou, J.; Ban, C.; Zhou, H.; Ren, J.; Liu, Z. Experimental study on the shear strength and failure mechanism of cemented soil–concrete interface. Materials 2023, 16, 4222. [Google Scholar] [CrossRef] [PubMed]
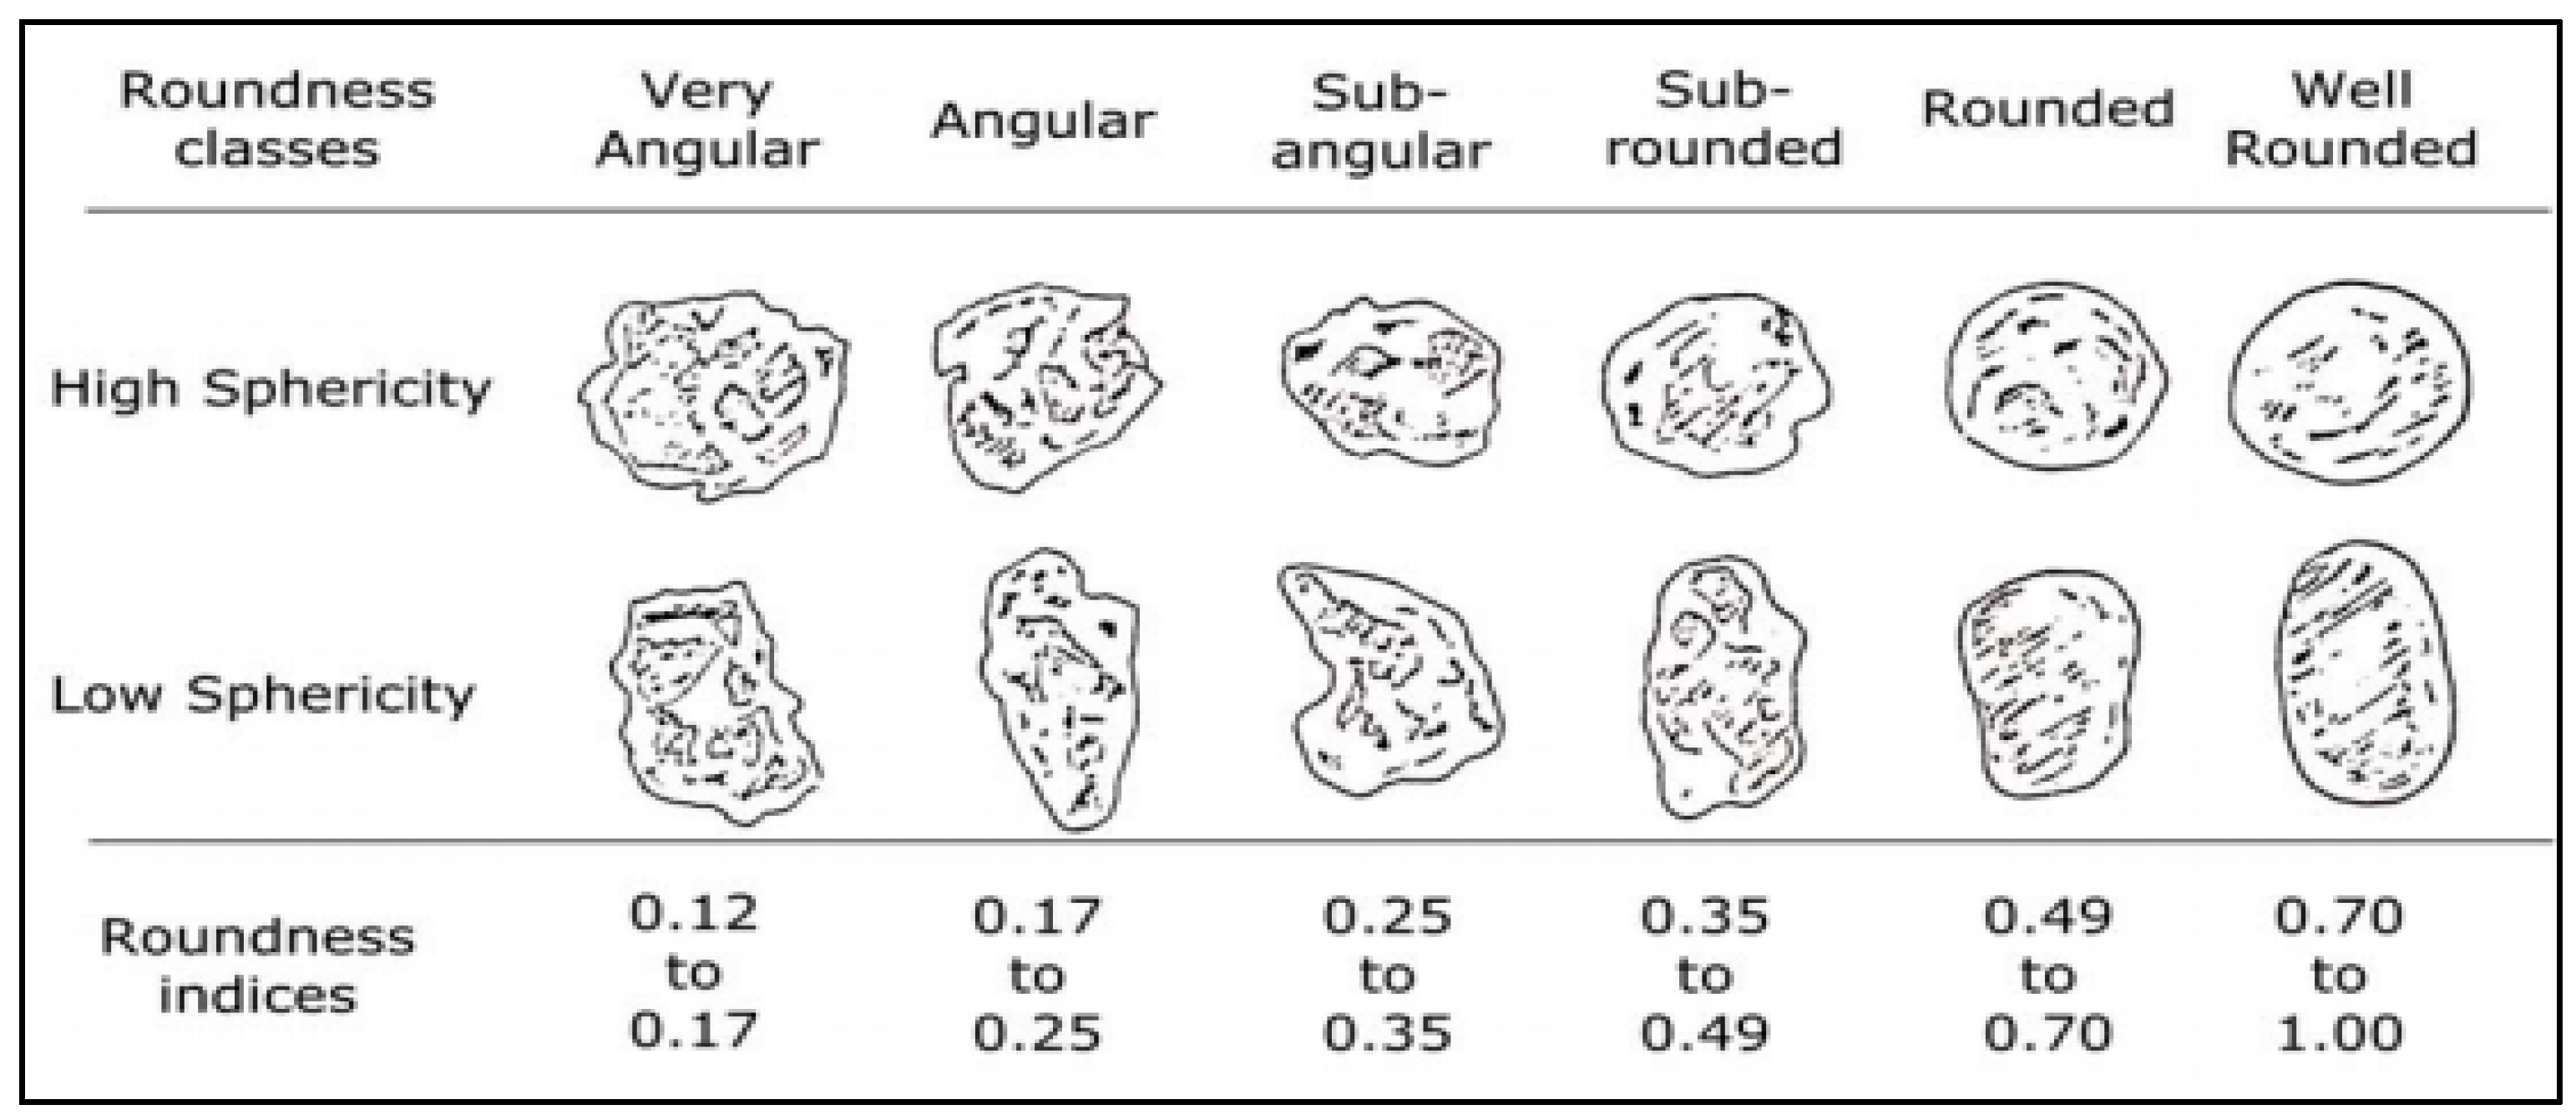
Figure 1. Chart for estimating the roundness and sphericity of sedimentary particles [21].
Applsci 14 06373 g001
Figure 2. Particle size distribution curves for sand samples used in this study.
Applsci 14 06373 g002
Figure 3. Types of continuous surfaces used in the experiments: (a) steel, (b) PVC, and (c) stone.
Applsci 14 06373 g003
Figure 4. The modified ring shear apparatus.
Applsci 14 06373 g004
Figure 5. The testing procedure was used to measure the peak and residual interface shear strength at different normal stresses.
Applsci 14 06373 g005
Figure 6. Average shear strength versus normal stress, where (a) Soil-A, (b) Soil-B, (c) Soil-C, (d) Soil-D, and (e) Soil-E.
Applsci 14 06373 g006
Figure 7. Profilometer Initial Roughness Contours for (a) Steel, (b) PVC, and (c) Stone.
Applsci 14 06373 g007
Figure 8. Interface shear strength versus (a) normalized roughness and (b) hardness.
Applsci 14 06373 g008
Figure 9. Impact of porosity on peak interface fiction coefficient at different normal stress levels.
Applsci 14 06373 g009
Figure 10. Peak interface friction coefficient versus continuum surfaces for medium Sand-A and coarse Sand-B.
Applsci 14 06373 g010
Figure 11. Peak interface friction coefficient versus displacement for Sand-A (poorly graded) and Sand-C (well graded) with interfaces of (a) steel, (b) PVC, and (c) stone.
Applsci 14 06373 g011
Figure 12. Comparison of actual and predicted peak interface shear strength using MLR for (a) the training dataset, (b) the testing dataset, and (c) 10-fold cross-validation.
Applsci 14 06373 g012
Figure 13. Comparison of actual and predicted residual interface shear strength using MLR for (a) the training dataset, (b) the testing dataset, and (c) 10-fold cross-validation.
Applsci 14 06373 g013
Figure 14. Comparison of actual and predicted peak interface shear strength using RFR for (a) the training dataset, (b) the testing dataset, and (c) 10-fold cross-validation.
Applsci 14 06373 g014
Figure 15. Comparison of actual and predicted residual interface shear stress using RFR for (a) the training dataset, (b) the testing dataset, and (c) 10-fold cross-validation.
Applsci 14 06373 g015
Figure 16. Feature importance analysis in 10-fold cross-validation: (a) MLR for peak interface friction, (b) RFR for peak interface friction, (c) MLR for residual interface friction, and (d) RFR for residual interface friction.
Applsci 14 06373 g016
Table 1. Properties of the granular materials used in the study.
SoilTypeGsD50 (mm)CuCcRI
AQuartz Medium Sand2.650.510.970.720.72
BQuartz Coarse Sand2.651.771.450.960.40
CQuartz Well Graded Sand2.650.636.201.310.37
DGranite Sand3.750.511.200.970.64
EQuartz Fine Gravel2.651.721.691.010.41
Table 2. Properties of the continuous surfaces used in the study.
MaterialRt (μm)HD
Steel4.2112.2
PVC0.4550
Stone82.92795
Table 3. Sample initial density of A-Sand at loose and dense states during steel interface tests under 25 kPa.
Sand TypeABCDE
Loose state (g/cm3)1.651.641.742.221.66
Dense state (g/cm3)1.721.832.032.421.73
Table 4. Evaluation of MLR model accuracy in predicting interface shear strength.
Training DatabaseTesting Database10-Fold CV
Observations721890
PeakMAE2.983.623.45
RMSE3.934.534.47
RMSLE0.180.190.21
R20.920.900.90
ResidualMAE3.613.393.45
RMSE4.724.524.47
RMSLE0.230.190.21
R20.890.890.90
Table 5. Evaluation of RFR model accuracy in predicting interface shear strength.
Training DatabaseTesting Database10-Fold CV
Observations721890
PeakMAE1.283.743.46
RMSE1.604.994.48
RMSLE0.070.190.20
R20.980.880.90
ResidualMAE1.533.773.97
RMSE2.134.825.16
RMSLE0.090.230.24
R20.970.880.87
Table 6. Evaluation of MLR versus RFR on training, testing, and 10-fold cross-validation datasets.
Multiple Linear RegressionRandom Forest Regression
Training DataTesting Data10-Fold CVTraining DataTesting Data10-Fold CV
Observation721890721890
PeakMAE2.983.623.451.283.743.46
RMSE3.934.534.471.604.994.48
RMSLE0.180.190.210.070.190.20
R20.920.900.900.980.880.90
ResidualMAE3.613.393.451.533.773.97
RMSE4.724.524.472.134.825.16
RMSLE0.230.190.210.090.230.24
R20.890.890.900.970.880.87
Disclaimer/Publisher’s Note: The statements, opinions and data contained in all publications are solely those of the individual author(s) and contributor(s) and not of MDPI and/or the editor(s). MDPI and/or the editor(s) disclaim responsibility for any injury to people or property resulting from any ideas, methods, instructions or products referred to in the content.