Article

The Validation of the Defensive Reactive Agility Test in Top-Level Volleyball Male Players: A New Approach to Evaluating Slide Speed Using Witty SEM

1
Department of Physical Education & Sport, Faculty of Education, Constantine the Philosopher University in Nitra, 949 01 Nitra, Slovakia
2
Unit of Team Sports Games, Faculty of Physical Education and Sport, Wroclaw University of Health and Sport Sciences, al. I.J. Paderewskiego 35, 51-612 Wroclaw, Poland
3
Unit of Biostructure, Faculty of Physical Education and Sport, Wroclaw University of Health and Sport Sciences, al. I.J. Paderewskiego 35, 51-612 Wroclaw, Poland
*
Author to whom correspondence should be addressed.
Appl. Sci. 2024, 14(15), 6391; https://doi.org/10.3390/app14156391
Submission received: 18 June 2024 / Revised: 15 July 2024 / Accepted: 18 July 2024 / Published: 23 July 2024

Abstract

:
Aim: The aim of the study is to provide a new tool to measure the level of defensive agility objectively. Methods: The sample included 14 elite male volleyball players of the University of Nitra club (22.3 ± 5.7 years). Measurements consisted of body height (BH); body weight (BM); body mass index (BMI), and the defensive agility test (DRAT (test-retest)) with an interval of one week between the two tests using an electronic timer (Witty photocell) and Witty SEM lights (Microgate, ITA). The validation included assessing the equality of mean values in the test and retest (t-Student), effect sizes with Cohen’s d, analysis of variance (ANOVA), intraclass correlation coefficient determinations (ICC model), and random intercept correlation (Φ). Results: The results indicated no significant differences in both tests except for left movement (p = 0.0255). The ICC value of the test time was statistically significant (0.91); standard error of measurement (SEM = 0.02); repeatability coefficient (RC = 0.20); minimal difference (MD = 0.04). Effect sizes were trivial to small (d = ˂−0.05–0.17>; right), medium (d = 0.35; backward) a large (d = −0.67; left). Conclusions: The DRAT test showed excellent reliability in total time (ICC = 0.91). Validation of the DRAT test’s consistency, reliability, accuracy and validity can help coaches make decisions about evaluating and monitoring defensive reactive agility performance in sports games.

1. Introduction

Agility is a comprehensive skill influenced by various physical, technical, and cognitive factors. In general, agility is defined as the ability to change the direction and speed of movement in response to a stimulus [1]. Its importance in relation to game performance has often been emphasized. It has been identified as a crucial component of player performance in non-invasive team sports such as volleyball [2], handball [3], basketball [4], or soccer [5]. It is a distinctive trait characterized by unique features associated with linear acceleration and speed. In sports games, changes of direction are fundamental, and executing strong and explosive lower body movements is decisive in both offense and defense. During the game, players perform various movements. Some studies have quantified the number and types of movements performed by basketball players, estimated at around 1000 movements in a match, with the majority lasting 3 s or less [6]. More than 40% of movements are forward/backward, and about 20% are lateral movements [7].
Agility is a unique trait associated with linear acceleration and speed [8], reaction time [9], decision-making time, and cognitive processes [10]. Physical determinants of reactive agility with a predominant forward movement and direction changes have been extensively studied and explained [11,12,13]. Correlations have been demonstrated between leg explosive strength (p ≤ 0.05) and various change of direction speed tests [14,15], agility and reactive strength [16], acceleration [17], or speed [18]. It has been concluded that reactive strength and sprint acceleration are important for change of direction speed, but assessed physical properties are not linked to defensive agility performance [19].
Considering the intermittent nature of sports games with frequent transitions between defensive and offensive phases, rest and high-intensity activities, rapid and explosive movements in all directions, acceleration and deceleration [20], and defensive activities can be interpreted as an independent performance factor. Defensive agility is a key element in many sports games [21], especially those involving both individual and team defense, such as basketball [22], soccer or futsal [23], and volleyball [24], and it appears to play a significant role in tennis as well [25]. It refers to a player’s ability to move quickly and effectively in the defensive phase, often in response to the opponent’s movements or the ball. It involves either a change in speed, a change in direction, or both, always in response to the movements of the attacker [19]. It is reasonable to assume that defensive movements (mainly lateral and backward movements) have different physical and mechanical determinants than forward movements, mainly due to lower production of reaction force, increased torsion moment of knee extensor, respectively, higher speed of hip extension as well as lowering of body center of gravity during lateral movement [26]. To change direction, an athlete must exert force on the ground, and this force must be in the opposite direction of the movement. Therefore, to enhance the ability to change direction quickly, an athlete must maximize their ability to generate lateral forces depending on traction and slope [27]. The identification of lateral force variables in predictive models [28] suggests that the production of lateral reactive force, in addition to vertical force production, is a predictor of lateral jump distance. However, the efficiency of lateral movement is mainly determined by speed and, subsequently, by distance. Previous studies have shown that performance in vertical and lateral tasks occurs independently [29].
In team sports like volleyball, players are frequently required to change direction, speed, and the composition of body segments in response to a game situation with a high cognitive component [30]. This indicates the need to evaluate the level of agility in tests that correspond to game conditions and include a cognitive factor.
Recently, there has been a growing interest in the factors influencing agility performance, as well as appropriate testing protocols and training strategies for assessing and improving the quality [31]. This study discusses defensive agility, which is related to specific player actions in the defensive phase of the game. Understanding how defensive activities are applied on the field in specific situations is crucial. Agility movements of defenders aim to reduce time and space in relation to the attacker, exerting pressure with the intention of being successful in defense [32]. Required defensive actions of volleyball players include rapid linear and lateral accelerations in different directions, as well as backward movements in field defense. Only a small portion of them include a defensive component or evaluate it as a separate skill [21]. This may be due to the increased complexity of equipping and administering tests. Available tests of defensive agility examine movement time, step length, lateral step angle [33], linear forward and lateral movement speed [34], and lower limb kinematics in defensive agility [35]. McCormick [36] identified a distance of 8 feet (2.44 m) in the Lateral Shuffle test as the most reliable and valid tool for assessing CODS performance laterally.
A wide range of tests is used to assess planned agility, but the absence of a reactive component in these tests indicates their limitations. Including a reactive stimulus necessitates the use of diagnostic procedures for reactive agility [37,38,39,40,41] or tests that combine the physical and cognitive functions of the individual. The application of decision-making performance components in a test can be found in the work of Sheppard et al. [42], where a cognitive stimulus was applied in the form of a directional indicator with random selection. The reliability and validity of a new agility test, which included prediction and decision-making components in response to the individual’s movements, were confirmed by Sheppard et al. [42]. However, most of these tests only assess the ability to change direction quickly.
Considering many volleyball tests, to the best of the knowledge of the authors, there are no studies validating the test of volleyball defensive reactive agility. Moreover, this work is focused on the evaluation of the Witty SEM system used in the evaluation of the functional level of the volleyball. What is more, the study group were top-level male volleyball players. Given that the aim of this study was the validation, i.e., the quality of the volleyball defensive reactive agility test (DRAT) using the Witty SEM system, specifically, we tested the agreement, reliability, accuracy, and validity of the test-retest results.

2. Methods

2.1. Sample Size

The sample size was calculated before starting the examination. It was needed to evaluate the power of the main statistical test in relation to the number of participants possible to study as players in top-level Slovakian volleyball teams as a main test ICC (3.1) was considered. The calculations were made based on the formula presented by Walter et al. [43]. This is a formula when a given measurement is performed by the same person and ensures greater data consistency:
ICC 3.1 = M S B M S W M S B + k 1 M S W
where, M S B = mean square between groups; M S W = mean square within groups; k = number of persons or units assessed.
For the ICC (3.1) model with a minimum acceptable reliability of 0.60, expected reliability of 0.90, alpha-level of 0.05, power (1-beta) of 0.80, two repetitions, and a potential dropout rate of 10%, it was determined that a minimum of 16 participants was needed, while the minimum number of participants assuming the lack of dropout was 14.

2.2. Participants

Fourteen (n = 14) elite male volleyball players, members of the SPU Nitra Men’s elite team, with an average age of 22.3 ± 5.7 years, height of 188.9 cm (SD = 7.4), body weight of 85.4 kg (SD = 10.6), and BMI of 23.9 kg/m2 voluntarily participated in the study. Subjects regularly participated in 8–12 h of training per week, which consisted of strength training (10–30%), game training (50–70%), specific sports exercises (10–20%), and regeneration (10%). The criteria for inclusion of players in the research group were sports experience of a minimum of 10 years, optimal health condition, and willingness to participate in the research. All measurement procedures and potential risks were verbally explained to each participant before obtaining their written informed consent. The study protocol was approved by the Ethics Committee of the Faculty of Education of the University of Nitra (registration number: UKF-2020/1355-1:191013) in accordance with the conclusions of the Declaration of Helsinki.

2.3. Measurement and Procedure

2.3.1. Anthropometrical Measurements

Anthropometric measurements were taken first. Body height measurement was taken with an accuracy of 0.1 cm using an anthropometer (GPM Anthropological Instruments, Bachenbülach, Switzerland). Body weight and body fat mass were measured with the InBody230 body composition analyzer (InBody Co., Ltd., Cerritos, CA, USA). Body mass index (BMI) was then calculated with the formula: BMI = body weight [kg]/body height [m]2.

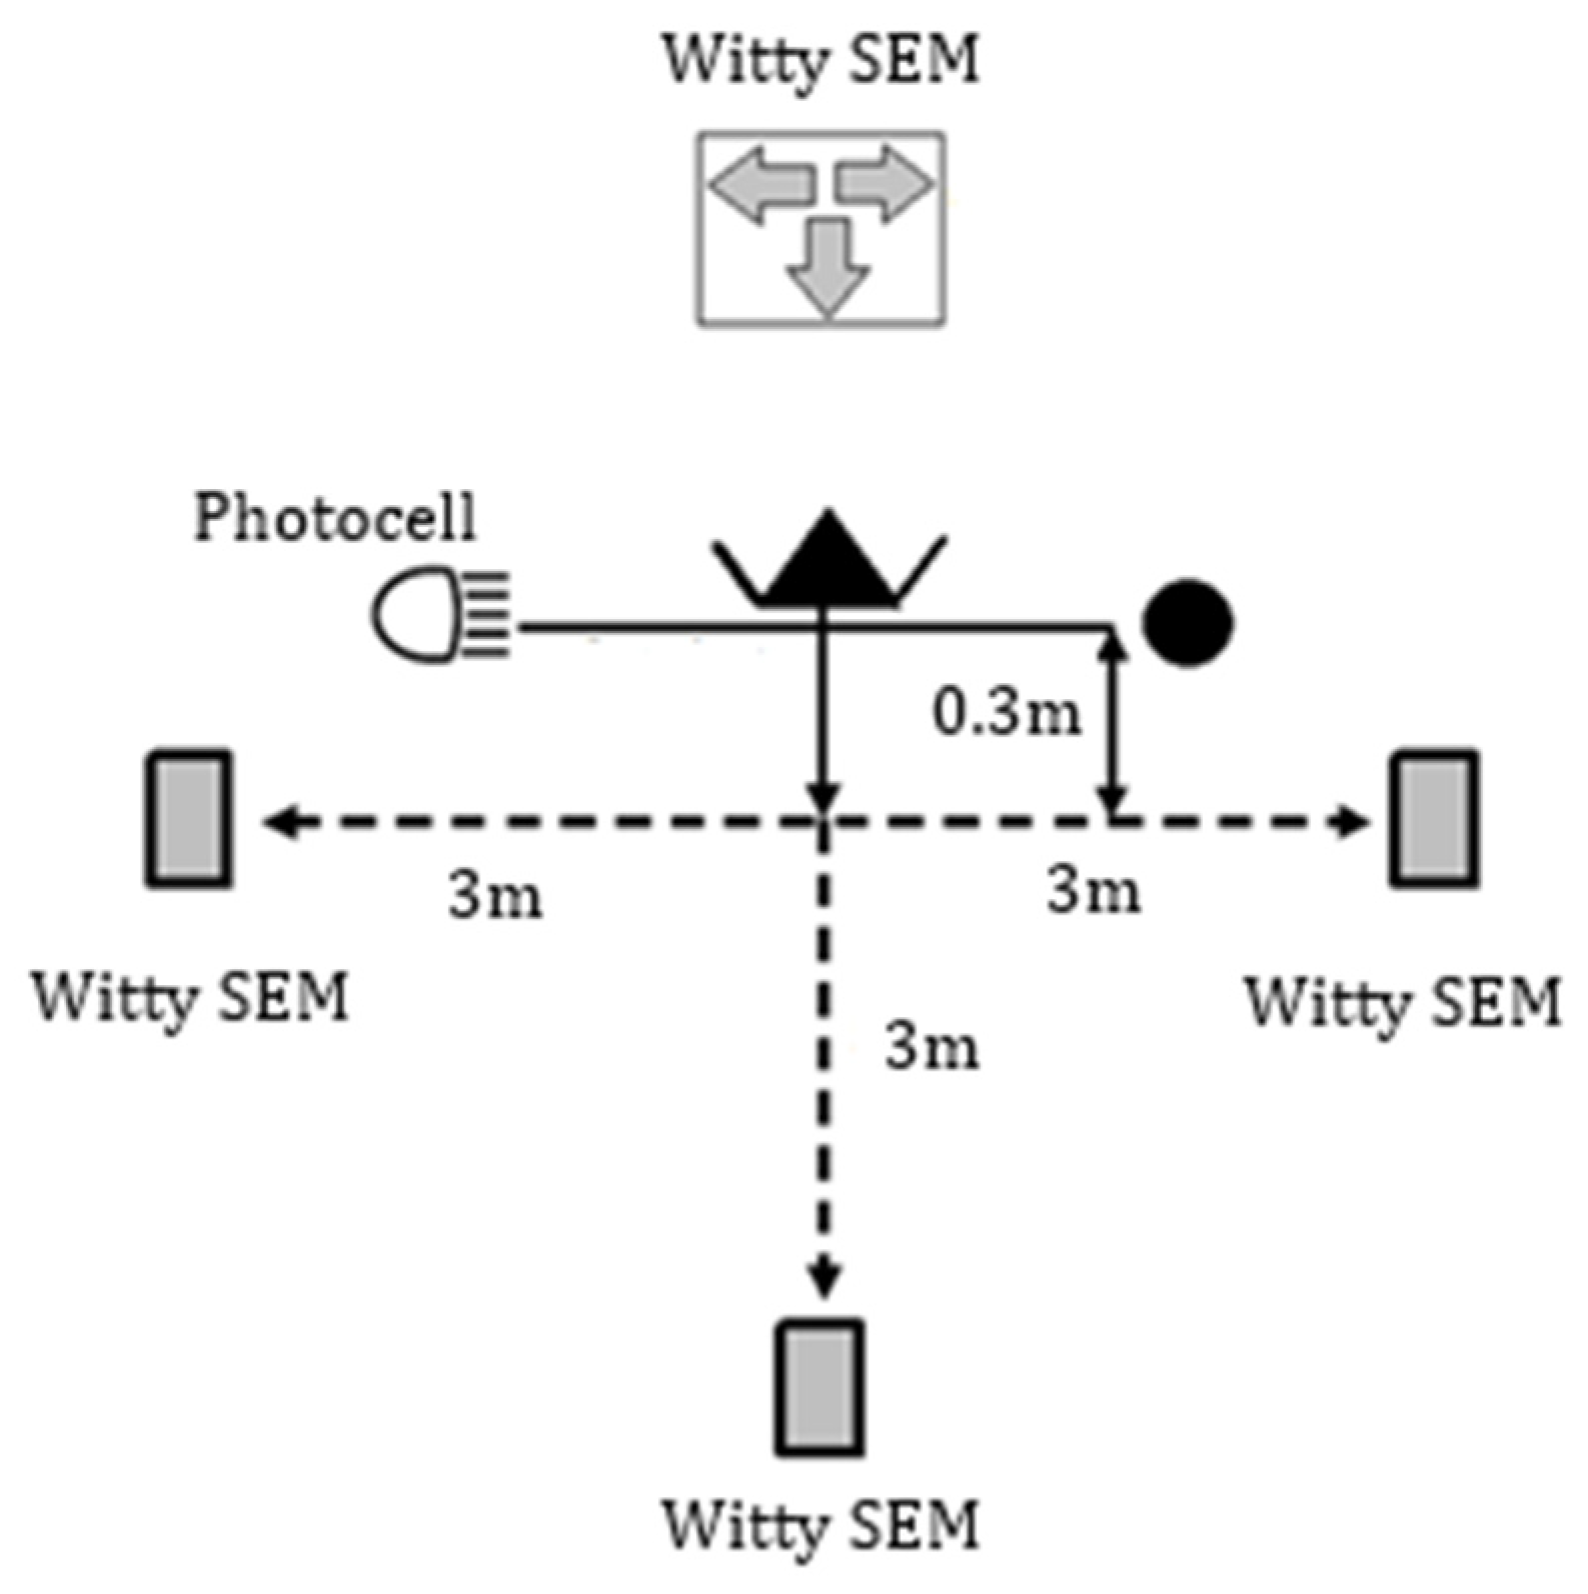
2.3.2. Defensive Reactive Agility Test (DRAT)

The defensive reactive agility test was performed on the test field presented in Figure 1. The subject stood in front of the starting line formed by an electronic timer. He started running backward across the starting line, and once he passed the infrared (IR) beam (Photocell), the timing was started. At the same time, a direction indicator in the form of an arrow in random order (left, right, down) was displayed without delay on the LED light placed in front of the player, and the corresponding LED light turned on at the same time. The athlete had to react to the indicator placed in front of him by moving according to the direction shown and approaching the specific light with an open palm to a distance 0.2 m from the glowing LED light, thus initiating its extinguishing and thereby ending the measurement of the time interval. The person was then supposed to return to the starting position in the same direction of movement, while the time of return was not registered. The delay between consecutive stimuli was 3 s. In the lateral direction (left and right), a person could only move in a defensive slide by running backward. One test series consisted of six repetitions, with the lights coming on in a random order, two times in each direction. The better of the two attempts in each direction was recorded, thus eliminating possible errors in execution.
The total time (TT) of the whole test, as well as the time of three components: left-side slide (LS), right-side slide (RS), and back slide (BS) were registered. The results were then outcomes.
The study was carried out in two phases in December 2024. Measurements consisted of body height (BH), body weight (BM), body mass index (BMI), and the defensive agility test itself. The reliability of the new defensive agility test was determined by having participants perform the test twice, with an interval of one week between the two tests (test-retest). Both tests were conducted by experienced experts specializing in agility research in the presence of the trainer of the researched group. Testing took place at the training unit, always at the same time (6:00 pm). Each player was instructed and verbally encouraged to perform the test to the maximum. The tests were carried out in a sports hall with a wooden deck floor; subjects wore training clothes, and times were recorded with an accuracy of 0.01 s using an electronic timer (WITTY photocell system from Microgate, ITA). Before the actual testing, the subjects were asked about their health and any recent injuries, as only healthy players could participate in the study. During the test period, the air temperature varied from 21 to 24 °C. Before testing, the players warmed up under the coach’s guidance (5–10 min of easy movement activities, 5 min of static stretching, and 7–10 min of dynamic flexibility exercises used to improve coordination, balance, proprioception and speed of movement, and finally 5 min of special high-intensity agility exercises).

2.4. Statistical Analysis

Data are presented as means, a ninety-five percent confidence interval for mean values, and standard deviations (SD). In addition, the variability coefficient (v) was calculated using the formula: v = (SD/Mean) × 100. In the beginning, the Shapiro–Wilk test for normality of distribution and Levene’s test for homoscedasticity were conducted.

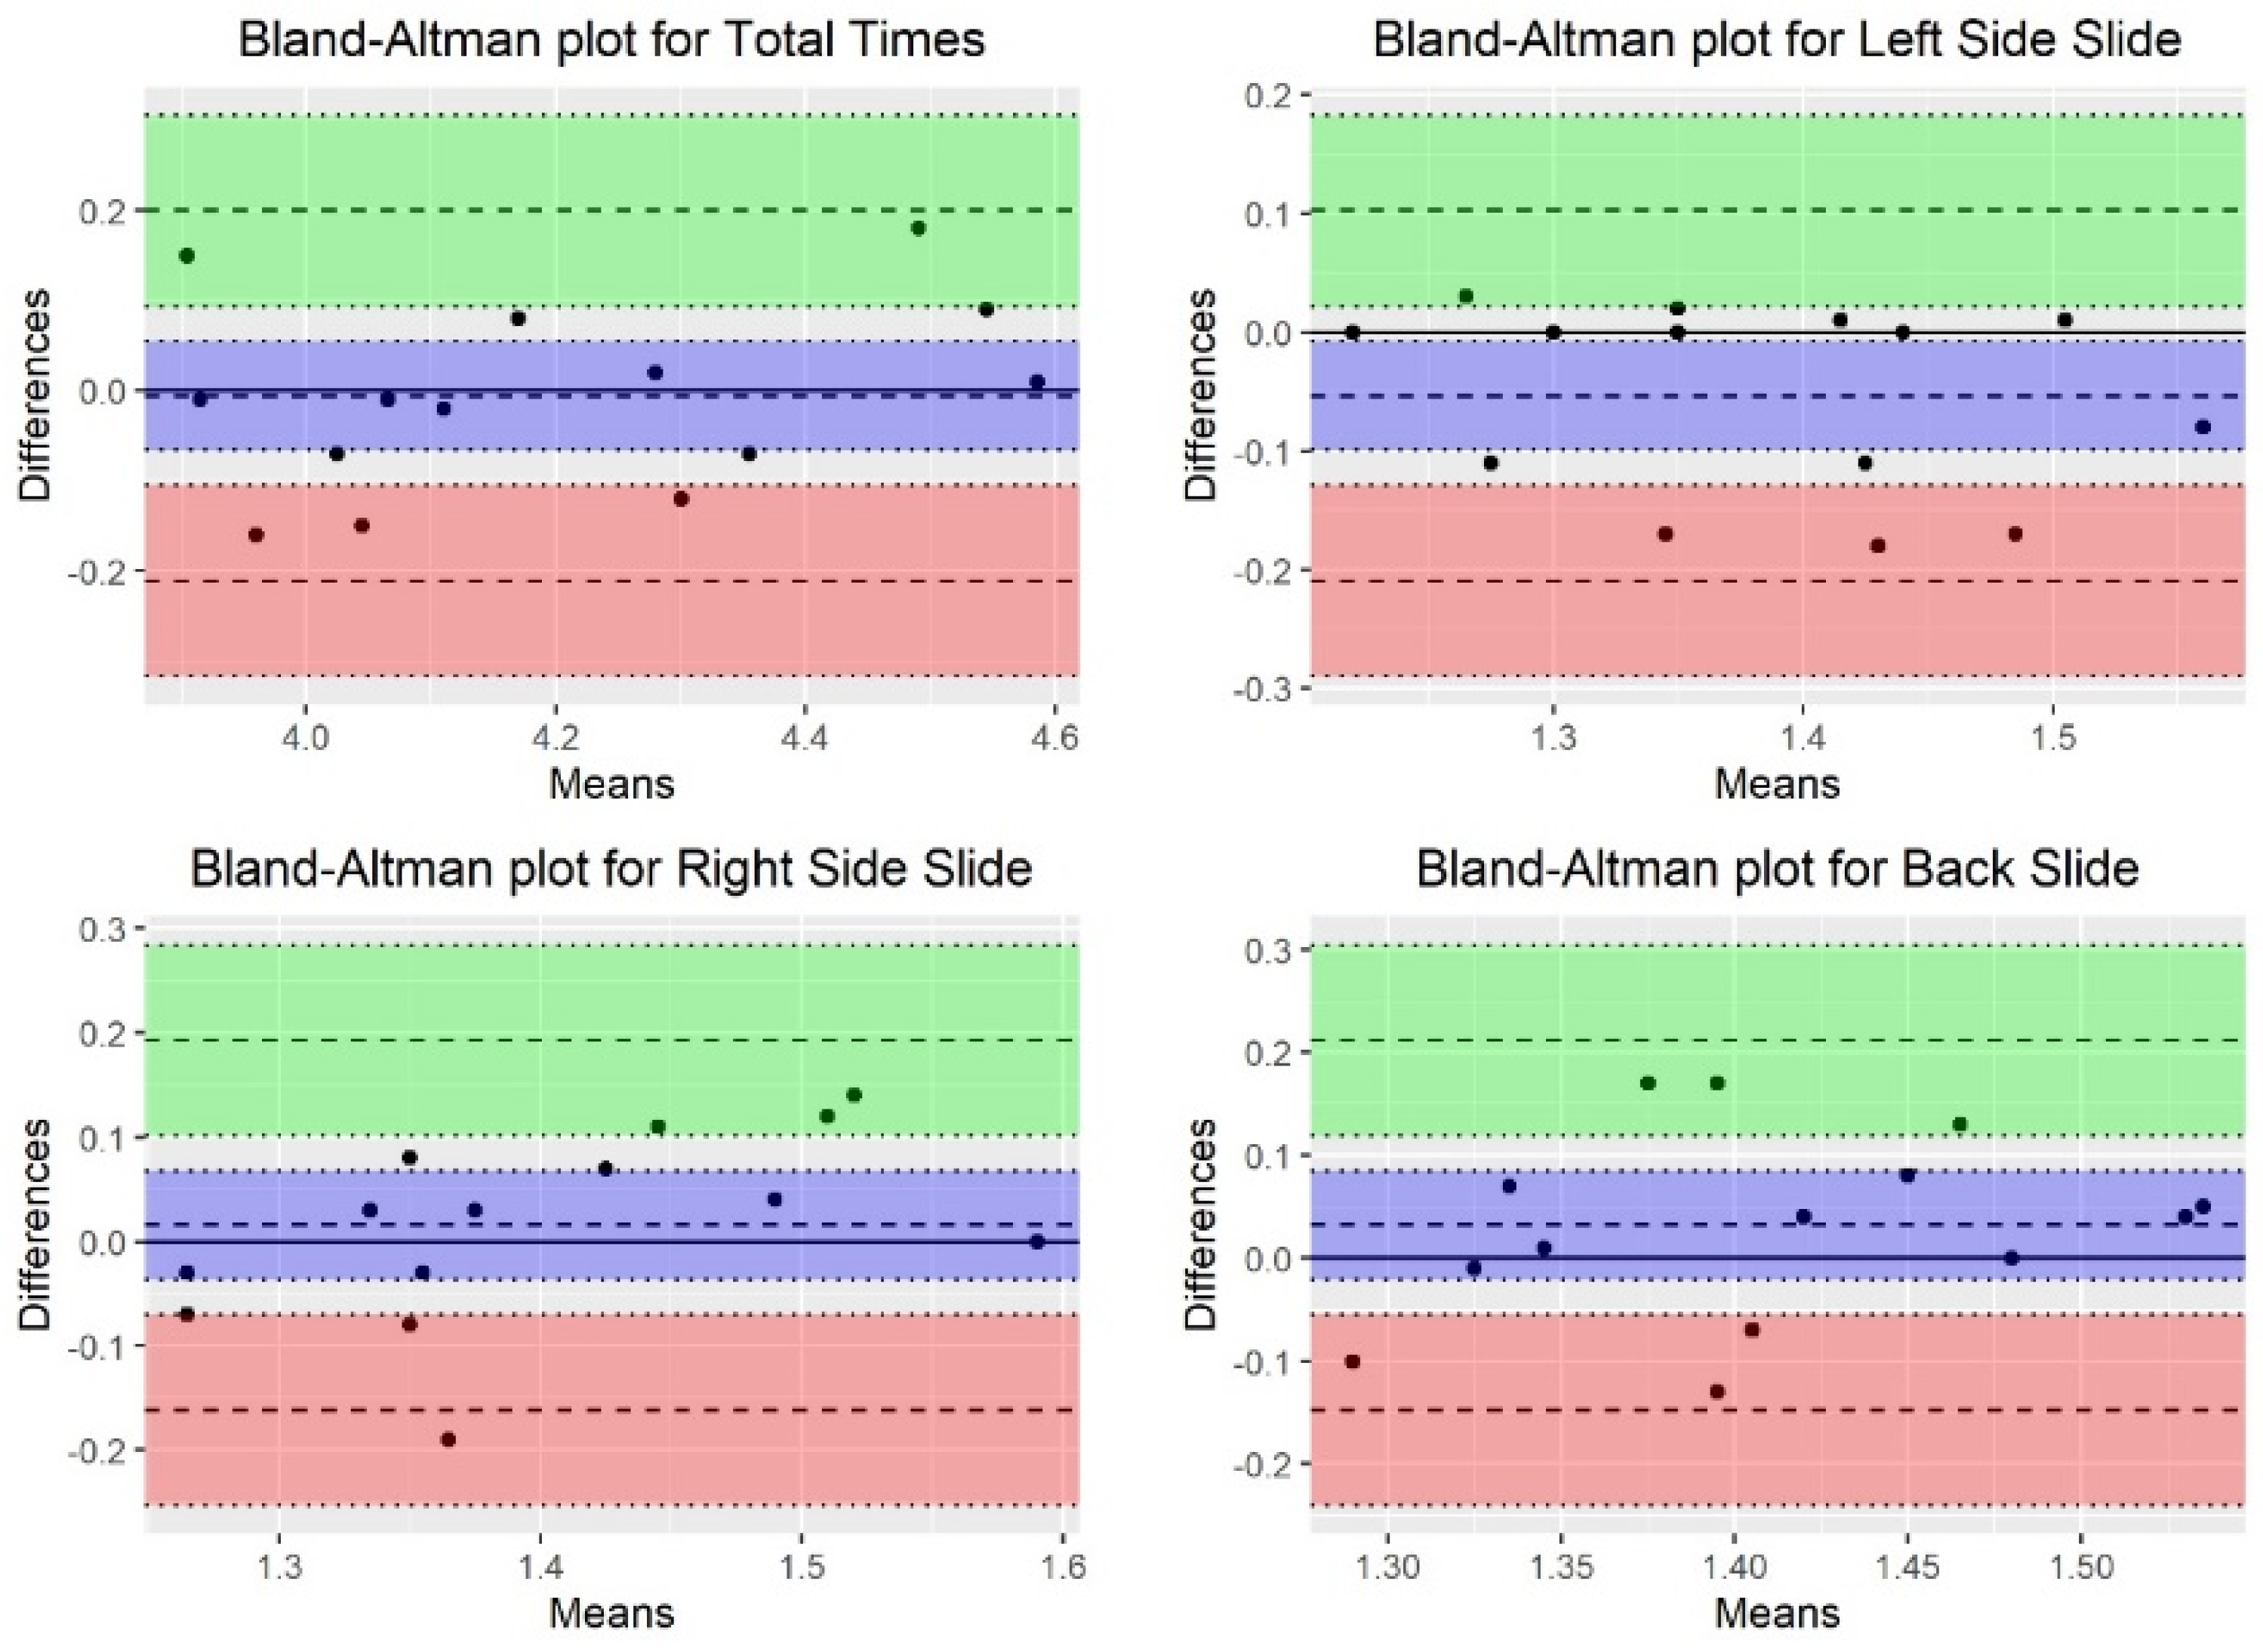
Validation Process—The Quality of the Defensive Reactive Agility Test (DRAT)

The validation process of the defensive reactive agility test (DRAT) was based on a test-retest evaluation of the results.
The analysis included a few steps of assessment:
Agreement—the capacity of the test applied twice on the same respondents under the same conditions to provide strictly identical results [44]; the t-Student pairwise test was used to assess the equality of the mean values in the test and retest. In addition, the effect size with Cohen’s d was calculated, following the rule of thumb when interpreting Cohen’s d: 0.2—small effect size, 0.5—medium effect size, 0.8—large effect size [45]. In addition, the analysis was supplemented with a visual assessment using Bland–Altman plots [46] together with statistics: mean difference and its 95%CI and repeatability coefficient (RC); repeatability coefficient was calculated with the formula: R C = 1.96 × S D p o o l e d , the repeatability coefficient is a number that, if two tests of the same variable under the same conditions are made, the difference between those two measurements will be less than the RC in 95% of cases [47]. The smaller the repeatability coefficient is, the better; however, it is an absolute index of agreement suitable for variables with the same units.
Reliability—the capacity of a test to replicate the same ordering between respondents when measured twice [48]; to study reliability, the intraclass correlation coefficient was used. From among many models, the ICC (3.1) model was applied; this model is preferable because it is the observed correlation between measurements in two real-life trials. In the calculation of the ICC (3.1), it does not matter whether trials are treated as a fixed or a random effect [49]. The ICC (3.1) model, according to the Shrout and Fleiss [50] convention, corresponds with a two-way mixed effect, absolute agreement, and a single rater reporting standard. An intraclass correlation coefficient, according to Koo and Li [51], was classified as less than 0.50, with poor reliability between 0.5 and 0.70, moderate reliability between 0.75 and 0.9, good reliability greater than 0.9, and excellent reliability.
Accuracy—presents how close a given set of measurements (observations or readings) are to their true value. The measurement of the accuracy is the standard error of measurement (SEM), which gives a margin of error that should be expected in an individual test score because of the imperfect reliability of the test. In addition, the minimal difference (MD) needed to be considered for the real difference for total time and each component of the test was also calculated. The following formulas were used [52].
S E M = M S E , where M S E is the mean square error term derived from the repeated measures analysis of variance (ANOVA),
M D = S E M ×   z crit × 2 , where SEM is the standard error of measurement, zcrit is 1.96.
Validity—refers to what characteristics the test measures and how well the test measures those characteristics. The strategy of calculating validity in this study was based on the criterion-related validation method, which requires a demonstration of the correlation (or other statistical relationship between two sets of results [53]); the most usable measure of associations between two measurements is Pearson’s product-moment correlation coefficient (r); however, Pearson’s correlation may not be theoretically appropriate in a repeated measure study as it ignores the correlation of the outcomes from multiple trials within the same subject. Therefore, to avoid violating the assumptions for linear relationship analysis conducted for repeated measures [54], the correlation under random intercept model circumstance (Φ) was calculated [55].
The alpha level was fixed at α = 0.05, and calculated p-values < 0.05 were found to be statistically significant. Calculations employed Statistica 13.0 (StatSoft Poland 2018, Cracow, Poland) and R software with RStudio (PBC, Boston, MA, USA, URL http://www.rstudio.com/ (accessed on 15 January 2023)).

3. Results

The statistical characteristics of the anthropometric measurements at the baseline as well as pre- and retest results, are presented in Table 1. Generally, results showed typical body dimensions for the volleyball players and normal weight-to-height proportions presented by BMI values (however close to the upper border of the range). The internal variation of all the results was low, which was confirmed by standard deviations. Relatively (standard deviation in relation to the mean), the least homogenous was age (v = 13.51%) and weight (v = 12.43%), which is typical for the assessed kind of group. It must be highlighted that low variation within the group in DRAT results, as well as total time results are three components. All variable coefficients were lower than 10%. However, there were differences in deviations between the test and retest, which were studied in-depth in the next part of the paragraph.
Table 2 presents the results of the validation process containing an evaluation of the agreement, reliability, accuracy, and validity of the total time and three components of the DRAT. Total results and left slide, right slide, and back slide components are presented. The statistical measurements of the test quality are t- and p-value derived from pairwise t-test, Cohen’s d effect size coefficient, mean difference and 95%CI from Bland–Altman analysis, repeatability coefficient (RC), intraclass correlation coefficient (ICC (3.1)), standard error of measurement (SEM), minimal difference (MD), and repeated measure correlation coefficient (Φ).
The first step was to assess the agreement between the mean values of pre- and retest. Results presented in Table 1 showed no premise to reject hypothesis zero about equality between mean values of the measured variables (no significant differences) except the left side slide (p = 0.0255). The confirmation of the consistency between mean results in both tests is generally low effect sizes. The total time of test and right-side slide effect sizes were trivial (d = −0.05) and small (0.17), respectively, while the back slide effect size was medium (d = 0.35) and the left side—large (d = −0.67) (Table 1). Visually, the differences in measurements between the two time points are presented in Bland–Altman plots (Figure 1). The agreement of the mean values is presented in the Bland–Altman graph (Figure 2). It is clearly seen that all four variables have good agreement; there are no outliers. and most of the participants are located near and evenly the mean of differences. The confirmation of the good agreement is the values of RC, which are low, 0.20 for total time and below for the rest of the variables.
Each plot illustrates agreement between the test and retest results, as well as identifying outliers. Each participant is represented on the graph by a black dot. A solid black line indicates a potential lack of differences and is located at a value of 0.0. The nearest dashed line represents the real mean of differences, which is related to the bias. Next, dotted lines are 95%CI for this mean (confidence interval bounds are colored blue). Upper and lower dashed lines have a 95% agreement interval. Each coexists with its 95%CI. The upper is colored green, while the lower is colored red.
The results of the reliability are not so clear. Generally, DRAT has excellent reliability, which confirmed a very high and statistically significant ICC value for the total time of the test (ICC = 0.91, p < 0.001) (Table 1). However, the components received different levels of reliability. Left side slide and right-side slide have moderate, but acceptable reliability (ICC = 0.71, p = 0.01; ICC = 0.66, p = 0.004, respectively). The worst and poor reliability was observed for the back slide (ICC = 0.45, p = 0.044).
The next analysis was to calculate the standard error of measurement, which is different from the intraclass correlation coefficient in that the SEM is an absolute index of reliability and indicates the precision of a test. It is called accuracy. The lower the SEM, the higher the accuracy and reliability. The DRAT has very high accuracy (SEM = 0.02) with minimal difference needed to be considered real of 0.04 s. All its components received worse SEM indices showing differences between them. The best results were obtained for the right side slide (SEM = 0.04) with an MD of 0.12 s, the next back slide (SEM = 0.09) with a minimal difference of 0.24 s and the left side slide with an MD of 0.39 s.
At the end, criterion-related validation was conducted with a correlation analysis, as a validity index. The results are presented in Figure 2. The validity of the whole test results was excellent and statistically significant (Φ = 0.90, p < 0.001), while the left-side slide and right-side slide validity were good (Φ = 0.72, p = 0.003 and Φ = 0.64, p = 0.005, respectively). In contrast, the validity of the back slide proved to be poor (Φ = 0.46, p = 0.093).

4. Discussion

The demands of modern sports require high physical performance as well as cognitive skills, which allow one to react and make optimal decisions as fast as possible [42]. The development of technology allows for testing with high accuracy; however, establishing the most appropriate settings is still discussed. Most testing of agility is performed in forward movement, whereas there is a lack of assessment of backward movements in response to stimuli [19]. This can be considered a gap in the literature, and with this study we have tried to fill it.
There are currently no agility tests that assess defensive movement (backward) in volleyball. Mainly are assessed tasks considered as offensive actions (forward movement). Therefore, the main aim of the study was to assess the agreement, reliability, accuracy, and validity of the DRAT. Our findings confirmed the excellent quality of the whole test of the defensive reactive agility in top-level, male volleyball players. However, the internal structure presented different levels of quality between components. Specifically, the reliability, accuracy, and validity of the left and right-side slides were good or moderate, respectively, while the back slide presented the lowest values of the validation indices.
The consistency between the two DRAT tests had small to medium effects. Total test time and right-side slide had small effects (d = −0.05 and d = 0.17), while the back slide and left-side slide had medium and large effects (d = 0.35 and d = −0.67). There was good agreement for all four variables, with no outliers, and most participants were close to the average difference. This strong agreement is confirmed by low RC values, especially 0.20 for total test time and lower for the other variables.
The DRAT test showed excellent reliability in total time (ICC = 0.91). This states a similar value as presented by Hachana et al. [56] for the Illinois Agility Test (ICC = 0.96). The mentioned test was performed in a planned manner, and it can be assumed that planned tasks (COD) depend on their durability and complexity characterized by high ICC values [21]. Also, the coefficient of variation is low in planned tasks [57]. This comparison with the typical COD test strengthens our results and indicates the reliability of our test as excellent. In soccer-specific agility tests, the results of ICC were provided as excellent by Altmann et al. [58]. However, in this test, only forward movements were considered, which did not totally address the demands of team sports. There is a need to consider backward movement in response to the stimulus, which we did in our study. Some doubt provides results of backward movement where ICC was the lowest; therefore, caution is needed when interpreting these results, and further studies are warranted. Previously Vučković et al. [59] validated the reaction time and defensive sliding test (RTADST) in a group of basketball players, which also addressed indicated tasks associated with defensive movements. They also provided high reliability (ICC = 0.86) for the total time of the test, but without analysis of single components. Proposed by Nóbrega et al. [60], the Coimbra reactive agility soccer test (CRAST) also was characterized by high reliability (ICC = 0.95); also, the coefficient of variation was low <10% similar to our study. Generally, the study considers reactive agility ICC range 0.77–0.93, which corresponds to our results [61]. Despite the fact that most analyzed studies consider only two options, in our test, participants had to perform movement in three directions.
When considering accuracy (SEM), our test also, in total time, provided the best results, where components were slightly worse. This was despite the study by Jansen et al. [62], where the analyzed tennis-specific agility test (TAT) for the total time was worse than in DRAT (0.02 vs. 0.34). Also, low SEM was provided in the Y-agility test, which is considered one of the most popular in reactive agility assessment [63]. The provided observation is in line with Chaalali et al. [64], but again, no backward movement was considered, as only the total time was considered. In this regard, it seems the DRAT test will be an indispensable tool for assessing defensive reactive agility in volleyball players in the foreseeable future.
Our study incorporated comprehensive measures of single components of the DRAT test. Ultimately, criterion-related validation was undertaken through correlation analysis, serving as a validity index. The overall time test demonstrated excellent and statistically significant results. Whereas, specifically, the validity for the side slide was good, the validity of the back slide was identified as poor. Some difficulties in discussing our results add to the lack of a more comprehensive approach to analyzed parameters not only for total time but also for partial tasks.
Our study is limited to only one sport discipline, sex, and range of age. The stimulus of the test was light, which is different from a game setting where players react to the ball and opponents’ movement. This is also for considering how the type of stimulus can influence reaction time. On the other hand, our study provides new insight into the field. As emphasized previously, there is a lack of studies which consider backward movement corresponding to the defensive task. In this term, future studies should deepen the analysis of considering the assessment of running back.

5. Conclusions

Despite the fact that the selective structure of the test was different (accuracy and validity of the lateral subtests were good or moderate, and the subtests of backward movements represented the lowest values of the validation indices), the DRAT test showed excellent reliability in the total time.
The DRAT, as a whole test, was valid and showed a very good quality of assessment and usefulness in examining the functional performance of the volleyball players. The results are reliable across repeated trials in top-level male players. Performing with the same player twice is a valid way of examination for coaches. Results may identify the functional potential and give the coaches answers about the present player’s motor skills. We suggest the coaches’ implementation of the DRAT into the specter of the specific volleyball tests. Determining the agreement, reliability, accuracy, and validity of a new approach to examining defensive reactive agility in volleyball top-level male players may help coaches to decide in assessing and monitoring defensive reactive agility performance with the Witty system. In addition, coaches can be more targeted with programming to improve agility and, therefore, sporting performance.

Author Contributions

Conceptualization, J.D. and P.H.; methodology, J.D., M.P., J.Š. and D.K.; software, J.D. and D.K.; validation, J.D.; formal analysis, J.D., Ľ.P. and D.K.; investigation, J.D. and Ľ.P.; data curation, P.H. and J.D.; writing—original draft preparation and editing, J.D. and D.K.; writing—review and editing, M.P., P.H. and J.Š. All authors have read and agreed to the published version of the manuscript.

Funding

The mentioned research was created with the support of the VEGA grants, Ministry of Education, Science, Research and Sport of the Slovak Republic, no. (1/0313/22) titled: Identification of reactive agility factors in team sports. and no. (1/0140/22) titled: Assessment of decision-making functions of athletes in selected team and individual sports.

Institutional Review Board Statement

The study was conducted in accordance with the Declaration of Helsinki and approved by the Senate Research Ethics Committee (registration number: UKF-2020/1355-1:191013).

Informed Consent Statement

Informed consent was obtained from all subjects involved in the study.

Data Availability Statement

The raw data supporting the conclusions of this article will be made available by the authors without undue reservation.

Conflicts of Interest

The authors declare no conflicts of interest.

References

  1. Sheppard, J.M.; Young, W.B. Agility Literature Review: Classifications, Training and Testing. J. Sports Sci. 2006, 24, 919–932. [Google Scholar] [CrossRef] [PubMed]
  2. Rebelo, A. Absolute Reliability, Relative Reliability, and Criterion-Related Validity of Two Reactive Agility Tests Using Two Types of Stimuli in Elite Male Volleyball Players. Pol. J. Sport Tour. 2022, 29, 24–29. [Google Scholar] [CrossRef]
  3. Wagner, H.; Finkenzeller, T.; Würth, S.; von Duvillard, S.P. Individual and Team Performance in Team-Handball: A Review. J. Sports Sci. Med. 2014, 13, 808–816. [Google Scholar] [PubMed]
  4. McClay, I.S.; Robinson, J.R.; Andriacchi, T.P.; Frederick, E.C.; Gross, T.; Martin, P.; Valiant, G.; Williams, K.R.; Cavanagh, P.R. A kinematic profile of skills in professional basketball players. J. Appl. Biomech. 1994, 10, 205–221. [Google Scholar] [CrossRef]
  5. Trajković, N.; Sporiš, G.; Krističević, T.; Madić, D.M.; Bogataj, Š. The importance of reactive agility tests in differentiating adolescent soccer players. Int. J. Environ. Res. Public Health 2020, 17, 3839. [Google Scholar] [CrossRef] [PubMed]
  6. Ben Abdelkrim, N.S.; Fazaa, E.; Ati, J.E. Time-Motion Analysis and Physiological Data of Elite under-19-Year-Old Basketball Players During Competition. Br. J. Sports Med. 2007, 41, 69–75. [Google Scholar] [CrossRef] [PubMed]
  7. McInnes, S.E.; Carlson, J.S.; Jones, C.J.; McKenna, M.J. The Physiological Load Imposed on Basketball Players During Competition. J. Sports Sci. 1995, 13, 387–397. [Google Scholar] [CrossRef] [PubMed]
  8. Scanlan, A.T.; Tucker, P.S.; Dalbo, V.J. A Comparison of Linear Speed, Closed-Skill Agility, and Open-Skill Agility Qualities between Backcourt and Frontcourt Adult Semiprofessional Male Basketball Players. J. Strength Cond. Res. 2014, 28, 1319–1327. [Google Scholar] [CrossRef] [PubMed]
  9. Aouadi, R.; Nawi Alanazi, H.M.; Tim, G. Impact of Physical Exercise on Reactive Time and Cognitive Function in Mentally Deficient Adolescents. J. Clin. Trials 2015, 5, 206. [Google Scholar]
  10. Zwierko, M.; Jedziniak, W.; Popowczak, M.; Rokita, A. Reactive Agility in Competitive Young Volleyball Players: A Gender Comparison of Perceptual-Cognitive and Motor Determinants. J. Human Kinet. 2023, 85, 87–96. [Google Scholar] [CrossRef]
  11. Delextrat, A.; Grosgeorge, B.; Bieuzen, F. Determinants of Performance in a New Test of Planned Agility for Young Elite Basketball Players. Int. J. Sports Physiol. Perform. 2015, 10, 160–165. [Google Scholar] [CrossRef] [PubMed]
  12. Horička, P.; Šimonek, J. Identification of Agility Predictors in Basketball. Trends Sport Sci. 2019, 1, 27–32. [Google Scholar]
  13. Horníková, H.; Jeleň, M.; Zemková, E. Determinants of Reactive Agility in Tests with Different Demands on Sensory and Motor Components in Handball Players. Appl. Sci. 2021, 11, 6531. [Google Scholar] [CrossRef]
  14. Peterson, M.D.; Alvar, B.A.; Rhea, M.R. The Contribution of Maximal Force Production to Explosive Movement among Young Collegiate Athletes. J. Strength Cond. Res. 2006, 20, 867–873. [Google Scholar] [PubMed]
  15. Nimphius, S.; McGuigan, M.R.; Newton, R.U. Relationship between Strength, Power, Speed, and Change of Direction Performance of Female Softball Players. J. Strength Cond. Res. 2010, 24, 885–895. [Google Scholar] [CrossRef] [PubMed]
  16. Young, W.B.; Murray, M.P. Reliability of a Field Test of Defending and Attacking Agility in Australian Football and Relationships to Reactive Strength. J. Strength Cond. Res. 2017, 31, 509–516. [Google Scholar] [CrossRef] [PubMed]
  17. Northeast, J.; Russell, M.; Shearer, D.; Cook, C.J.; Kilduff, L.P. Predictors of Linear and Multidirectional Acceleration in Elite Soccer Players. J. Strength Cond. Res. 2019, 33, 514–522. [Google Scholar] [CrossRef] [PubMed]
  18. Jarvis, P.; Turner, A.; Read, P.; Bishop, B. Reactive Strength Index and Its Associations with Measures of Physical and Sports Performance: A Systematic Review with Meta-Analysis. Sports Med. 2022, 52, 301–330. [Google Scholar] [CrossRef] [PubMed]
  19. Young, W.B.; Miller, I.R.; Talpey, S.W. Physical Qualities Predict Change-of-Direction Speed but Not Defensive Agility in Australian Rules Football. J. Strength Cond. Res. 2015, 29, 206–212. [Google Scholar] [CrossRef]
  20. Ben Abdelkrim, N.; Chaouachi, A.; Chamari, K.; Chtara, M.; Castagna, C. Positional Role and Competitive-Level Differences in Elite-Level Men’s Basketball Players. J. Strength Cond. Res. 2010, 24, 1346–1355. [Google Scholar] [CrossRef]
  21. Brughelli, M.; Cronin, J.; Levin, G.; Chaouachi, A. Understanding Change of Direction Ability in Sport: A Review of Resistance Training Studies. Sports Med. 2008, 38, 1045–1063. [Google Scholar] [CrossRef] [PubMed]
  22. Petway, A.J.; Freitas, T.T.; Calleja-González, J.; Medina Leal, D.; Alcaraz, P.E. Training load and match-play demands in basketball based on competition level: A systematic review. PLoS ONE 2020, 15, e0229212. [Google Scholar] [CrossRef] [PubMed]
  23. Wilson, R.S.; Smith, N.M.A.; Santiago, P.R.P.; Camata, T.; Ramos, S.d.P.; Caetano, F.G.; Cunha, S.A.; de Souza, A.P.S.; Moura, F.A. Predicting the defensive performance of individual players in one vs. one soccer games. PLoS ONE 2018, 13, e0209822. [Google Scholar] [CrossRef]
  24. Kotyal, S.S. Comparison of agility volleyball and basketball players. Int. J. Phys. Educ. Sports Health 2017, 4, 269–270. [Google Scholar]
  25. Salonikidis, K.; Zafeiridis, A. The Effects of Plyometric, Tennis-Drills, and Combined Training on Reaction, Lateral and Linear Speed, Power, and Strength in Novice Tennis Players. J. Strength Cond. Res. 2008, 22, 182–191. [Google Scholar] [CrossRef] [PubMed]
  26. Shimokochi, Y.; Ide, D.; Kokubu, M.; Nakaoji, T. Relationships among performance of lateral cutting maneuver from lateral sliding and hip extension and abduction motions, ground reaction force, and body center of mass height. J. Strength Cond. Res. 2013, 27, 1851–1860. [Google Scholar] [CrossRef]
  27. Conrad, B. The Biomechanics of Basketball Agility. Sport Res. Rev. 2014, 1, 1–8. [Google Scholar]
  28. Reiter, C.R.; Killelea, C.; Faherty, M.S.; Zerega, R.J.; Westwood, C.; Sell, T.C. Force-Plate Derived Predictors of Lateral Jump Performance in Ncaa Division-I Men’s Basketball Players. PLoS ONE 2023, 18, e0284883. [Google Scholar] [CrossRef]
  29. Meylan, C.; McMaster, T.; Cronin, J.; Mohammad, N.I.; Rogers, C.; deKlerk, M. Single-Leg Lateral, Horizontal, and Vertical Jump Assessment: Reliability, Interrelationships, and Ability to Predict Sprint and Change-of-Direction Performance. J. Strength Cond. Res. 2009, 23, 1140–1147. [Google Scholar] [CrossRef]
  30. Heppe, H.; Kohler, A.; Fleddermann, M.T.; Zentgraf, K. The Relationship between Expertise in Sports, Visuospatial, and Basic Cognitive Skills. Front. Psychol. 2016, 7, 904. [Google Scholar] [CrossRef]
  31. Paul, D.J.; Gabbett, T.J.; Nassis, G.P. Agility in team sports: Testing, training and factors affecting performance. Sports Med. 2016, 46, 421–442. [Google Scholar] [CrossRef]
  32. Young, W.; Dos’Santos, T.; Harper, D.; Jefferys, I.; Talpey, S. Agility in Invasion Sports: Position Stand of the Iusca. Int. J. Strength Cond. 2022, 2, 1–25. [Google Scholar] [CrossRef]
  33. Spiteri, T.; Cochrane, J.L.; Nimphius, S. The Evaluation of a New Lower-Body Reaction Time Test. J. Strength Cond. Res. 2013, 27, 174–180. [Google Scholar] [CrossRef]
  34. Spasic, M.; Krolo, A.; Zenic, N.; Delextrat, A.; Sekulic, D. Reactive Agility Performance in Handball; Development and Evaluation of a Sport-Specific Measurement Protocol. J. Sports Sci. Med. 2015, 14, 501–506. [Google Scholar] [PubMed]
  35. Spiteri, T.; Hart, N.H.; Nimphius, S. Offensive and Defensive Agility: A Sex Comparison of Lower Body Kinematics and Ground Reaction Forces. J. Appl. Biomech. 2014, 30, 514–520. [Google Scholar] [CrossRef]
  36. McCormick, B.T. The Reliability and Validity of Various Lateral Side-Step Tests. Int. J. Appl. Sports Sci. 2014, 26, 67–75. [Google Scholar] [CrossRef]
  37. Henry, G.B.; Lay, D.B.; Young, W. Validity of a Reactive Agility Test for Australian Football. Int. J. Sports Phys. Perf. 2011, 6, 534–545. [Google Scholar] [CrossRef] [PubMed]
  38. Kutlu, M.; Yapıcı, H.; Yoncalık, O.; Çelik, S. Comparison of a New Test for Agility and Skill in Soccer with Other Agility Tests. J. Hum. Kinet. 2012, 33, 143–150. [Google Scholar] [CrossRef]
  39. Sekulic, D.; Krolo, A.; Spasic, M.; Uljevic, O.; Peric, M. The Development of a New Stop‘n’go Reactive-Agility Test. J. Strength Cond. Res. 2014, 28, 3306–3312. [Google Scholar] [CrossRef]
  40. Inglis, P.; Stephen, B. Reactive Agility Tests: Review and Practical Applications. J. Aust. Strength Cond. 2016, 24, 62–69. [Google Scholar]
  41. Krolo, A.; Gilic, B.; Foretic, N.; Pojskic, H.; Hammami, R.; Spasic, M.; Uljevic, O.; Versic, S.; Sekulic, D. Agility Testing in Youth Football (Soccer) Players; Evaluating Reliability, Validity, and Correlates of Newly Developed Testing Protocols. Int. J. Environ. Res. Public Health 2020, 17, 294. [Google Scholar] [CrossRef] [PubMed]
  42. Sheppard, J.M.; Young, W.B.; Doyle, T.L.; Sheppard, T.A.; Newton, R.U. An Evaluation of a New Test of Reactive Agility and Its Relationship to Sprint Speed and Change of Direction Speed. J. Sci. Med. Sport. 2006, 9, 342–349. [Google Scholar] [CrossRef] [PubMed]
  43. Walter, S.D.; Eliasziw, M.; Donner, A. Sample Size and Optimal Designs for Reliability Studies. Stat. Med. 1998, 17, 101–110. [Google Scholar] [CrossRef]
  44. Berchtold, A. Test–Retest: Agreement or Reliability? Methodol. Innov. 2016, 9, 1–7. [Google Scholar] [CrossRef]
  45. Cohen, J. Statistical Power Analysis for the Behavioral Sciences, 2nd ed.; Lawrence Erlbaum: Hillsdale, NJ, USA, 1988. [Google Scholar]
  46. Bland, J.M.; Altman, D.G. Statistical Methods for Assessing Agreement between Two Methods of Clinical Measurement. Int. J. Nurs. Stud. 2010, 47, 931–936. [Google Scholar] [CrossRef]
  47. Bland, J.M.; Altman, D.G. Precision of Test Methods 1: Guide for the Determination and Reproducibility for a Standard Test Method (Bs 597, Part 1); Br Stand Institutions: London, UK, 1975. [Google Scholar]
  48. Kottner, J.; Hahnel, E.; Trojahn, C.; Stroux, A.; Dobos, G.; Lichterfeld, A.; Richter, C.; Blume-Peytavi, U. A Multi-Center Prevalence Study and Randomized Controlled Parallel-Group Pragmatic Trial to Compare the Effectiveness of Standardized Skin Care Regimens on Skin Health in Nursing Home Residents: A Study Protocol. Int. J. Nurs. Stud. 2015, 52, 598–604. [Google Scholar] [CrossRef] [PubMed]
  49. Hopkins, W.G. Spreadsheets for Analysis of Validity and Reliability. Sports Sci. 2017, 21, 1–4. [Google Scholar]
  50. Shrout, P.E.; Fleiss, J.L. Intraclass Correlations: Uses in Assessing Rater Reliability. Psychol. Bull. 1979, 86, 420–428. [Google Scholar] [CrossRef]
  51. Koo, T.K.; Li, M.Y. A Guideline of Selecting and Reporting Intraclass Correlation Coefficients for Reliability Research. J. Chiropr. Med. 2016, 15, 155–163. [Google Scholar] [CrossRef]
  52. Weir, J.P.; Vincent, W.J. Statistics in Kinesiology, 5th ed.; Web Resource; Human Kinetics Publishers: Champaign, IL, USA, 2020. [Google Scholar]
  53. Kamphaus, R.W. Authentic Assessment and Content Validity. Sch. Psychol. Q. 1991, 6, 300–304. [Google Scholar] [CrossRef]
  54. Bland, J.M.; Altman, D.G. Statistics Notes: Calculating Correlation Coefficients with Repeated Observations: Part 1—Correlation within Subjects. BMJ 1995, 310, 446. [Google Scholar] [CrossRef] [PubMed]
  55. Shan, G.; Zhang, H.; Jiang, T. Correlation Coefficients for a Study with Repeated Measures. Comput. Math. Methods Med. 2020, 2020, 1–11. [Google Scholar] [CrossRef] [PubMed]
  56. Hachana, Y.; Chaabene, H.; Nabli, M.A.; Attia, A.; Moualhi, J.; Farhat, N.; Elloumi, M. Test-Retest Reliability, Criterion-Related Validity, and Minimal Detectable Change of the Illinois Agility Test in Male Team Sport Athletes. J. Strength Cond. Res. 2013, 27, 2752–2759. [Google Scholar] [CrossRef] [PubMed]
  57. Sporis, G.; Jukic, I.; Milanovic, L.; Vucetic, V. Reliability and Factorial Validity of Agility Tests for Soccer Players. J. Strength Cond. Res. 2010, 24, 679–686. [Google Scholar] [CrossRef] [PubMed]
  58. Altmann, S.; Neumann, R.; Ringhof, S.; Rumpf, M.C.; Woll, A. Soccer-Specific Agility: Reliability of a Newly Developed Test and Correlates of Performance. J. Strength Cond. Res. 2022, 36, 1410–1416. [Google Scholar] [CrossRef] [PubMed]
  59. Vučković, I.; Gadžić, A.; Sekulić, Ž.; Mikić, M.; Boros, Z.; Stojanović, M. Reaction Time and Defensive Sliding Test Versus T-Test: Which Is Better? Rev. Bras. Med. Esporte. 2024, 30, e2022_0684. [Google Scholar] [CrossRef]
  60. Nóbrega, A.; Sarmento, H.; Vaz, V.; Gouveia, V.; Barrera, J.; Martins, A.; Santos, T.; Duarte, J.P. Reliability of the Coimbra Reactive Agility Soccer Test (Crast). J. Funct. Morphol. Kinesiol. 2023, 8, 11. [Google Scholar] [CrossRef] [PubMed]
  61. Morral-Yepes, M.; Moras, G.; Bishop, C.; Gonzalo-Skok, O. Assessing the Reliability and Validity of Agility Testing in Team Sports: A Systematic Review. J. Strength Cond. Res. 2020, 36, 2035–2049. [Google Scholar] [CrossRef] [PubMed]
  62. Jansen, M.G.T.; Huijgen, B.C.H.; Faber, I.R.; Elferink-Gemser, M.T. Measuring Agility in Tennis, Badminton, and Squash: A Systematic Review. Strength Cond. J. 2021, 43, 53–67. [Google Scholar] [CrossRef]
  63. Trecroci, A.; Longo, S.; Perri, E.; Iaia, F.M.; Alberti, G. Field-Based Physical Performance of Elite and Sub-Elite Middle-Adolescent Soccer Players. Res. Sports Med. 2019, 27, 60–71. [Google Scholar] [CrossRef]
  64. Chaalali, A.; Rouissi, M.; Chtara, M.; Owen, A.; Bragazzi, N.L.; Moalla, W.; Chaouachi, A.; Amri, M.; Chamari, K. Agility Training in Young Elite Soccer Players: Promising Results Compared to Change of Direction Drills. Biol. Sport 2016, 33, 345–351. [Google Scholar] [CrossRef] [PubMed]
Figure 1. Defensive reactive agility test (DRAT).
Applsci 14 06391 g001
Figure 2. Bland-Altman plots for test-retest differences between mean values for four variables: total time of the test, left-side slide, right-side slide, and back slide.
Applsci 14 06391 g002
Table 1. Statistical characteristics of the anthropometric and functional performance of the participants.
Test Retest
Mean95%CISDVMean95%CISDv
Age [y]22.320.624.03.013.51
Body height [cm]188.9184.6193.27.43.92
Body weight [kg]85.479.391.610.612.43
BMI [kg/m2]23.922.725.12.08.57
Total time [s]4.194.054.340.256.044.204.074.330.225.27
Left side slide [s]1.361.301.410.107.061.411.341.480.128.27
Right side slide [s]1.411.341.480.138.961.401.351.440.086.00
Back slide [s]1.431.371.480.106.811.391.351.440.085.55
Table 2. Validation results of the test-retest of the defensive reactive agility test (DRAT).
Testt-Valuep-ValueCohen’s d
(95%CI)
meandiff
(95%CI)
RCICC (3.1)
(95%CI)
SEMMDΦ
TT−0.200.8413−0.05
−0.58–0.47
−0.01
−0.21–0.20
0.200.91 *
0.74–97
0.020.040.90 *
LS−2.520.0255−0.67
−1.25–−0.08
−0.05
−0.21–0.10
0.180.72 *
0.33–090
0.140.390.72 *
RS0.650.52730.17
−0.36–0.70
0.02
−0.16–0.19
0.170.66 *
0.21–0.87
0.040.120.64 *
BS1.310.21220.35
−0.20–0.88
0.03
−0.15–0.21
0.180.45 *
−0.078–0.79
0.090.240.46
Footnote: * statistically significant (p < 0.05), TT—total time, LS—left slide, RS—right slide, BS—back slide, meandiff—mean value of the differences between two measurements, RC—repeatability coefficient, t-value—was derived from the t-Student depended test, ICC—intraclass correlation coefficient, SEM—standard error of measurement, MD—minimal difference needed to be considered real, Φ—repeated measures correlation.
Disclaimer/Publisher’s Note: The statements, opinions and data contained in all publications are solely those of the individual author(s) and contributor(s) and not of MDPI and/or the editor(s). MDPI and/or the editor(s) disclaim responsibility for any injury to people or property resulting from any ideas, methods, instructions or products referred to in the content.

