Abstract
Optimizing heat generation capacity is crucial for geothermal system design and evaluation. Computer simulation is a valuable approach for determining the influence of various parameter combinations on a geothermal system’s ability to produce heat. However, computer simulation evaluations are often computationally demanding since all potential parameter combinations must be examined, posing significant hurdles for heat generation performance evaluation and optimization. This research proposes an adaptive Kriging-based heat generation performance optimization method. Firstly, a two-horizontal-well geothermal system with rectangular multi-parallel fractures is constructed. The heat production performance optimization problem is then established, and the temperature and enthalpy of the outlet water are calculated using computer simulation and Kriging. A parameterized lower confidence bounding sampling scheme (PLCB) is developed to adaptively update Kriging in order to strike a compromise between optimization accuracy and computation burden. The outcomes of the optimization are compared to those of the Kriging-based optimization approach and other common infill options to demonstrate the efficiency of the proposed method. The outlet temperature curve obtained with PLCB-AKO-1 rose for a longer time and the heat generation power curve reached a stable output without a downward trend. According to the Friedman and Wilcoxon signed ranks tests, the PLCB-1-AKO technique is statistically superior to alternative strategies.
1. Introduction
Geothermal energy is one of the most economically sustainable, low-carbon, and renewable energy alternatives to traditional fossil fuels owing to its stability, concentrated quality, and purit [1,2]. Geothermal reservoirs, especially hot dry rock (HDR), are of particular interest to researchers due to their great potential for power generation [3]. Developing geothermal energy from HDR is made possible by reforming the reservoir to create a permeable fracture system and then pumping the working fluid into the fracture to extract heat from high-temperature HDR [4].
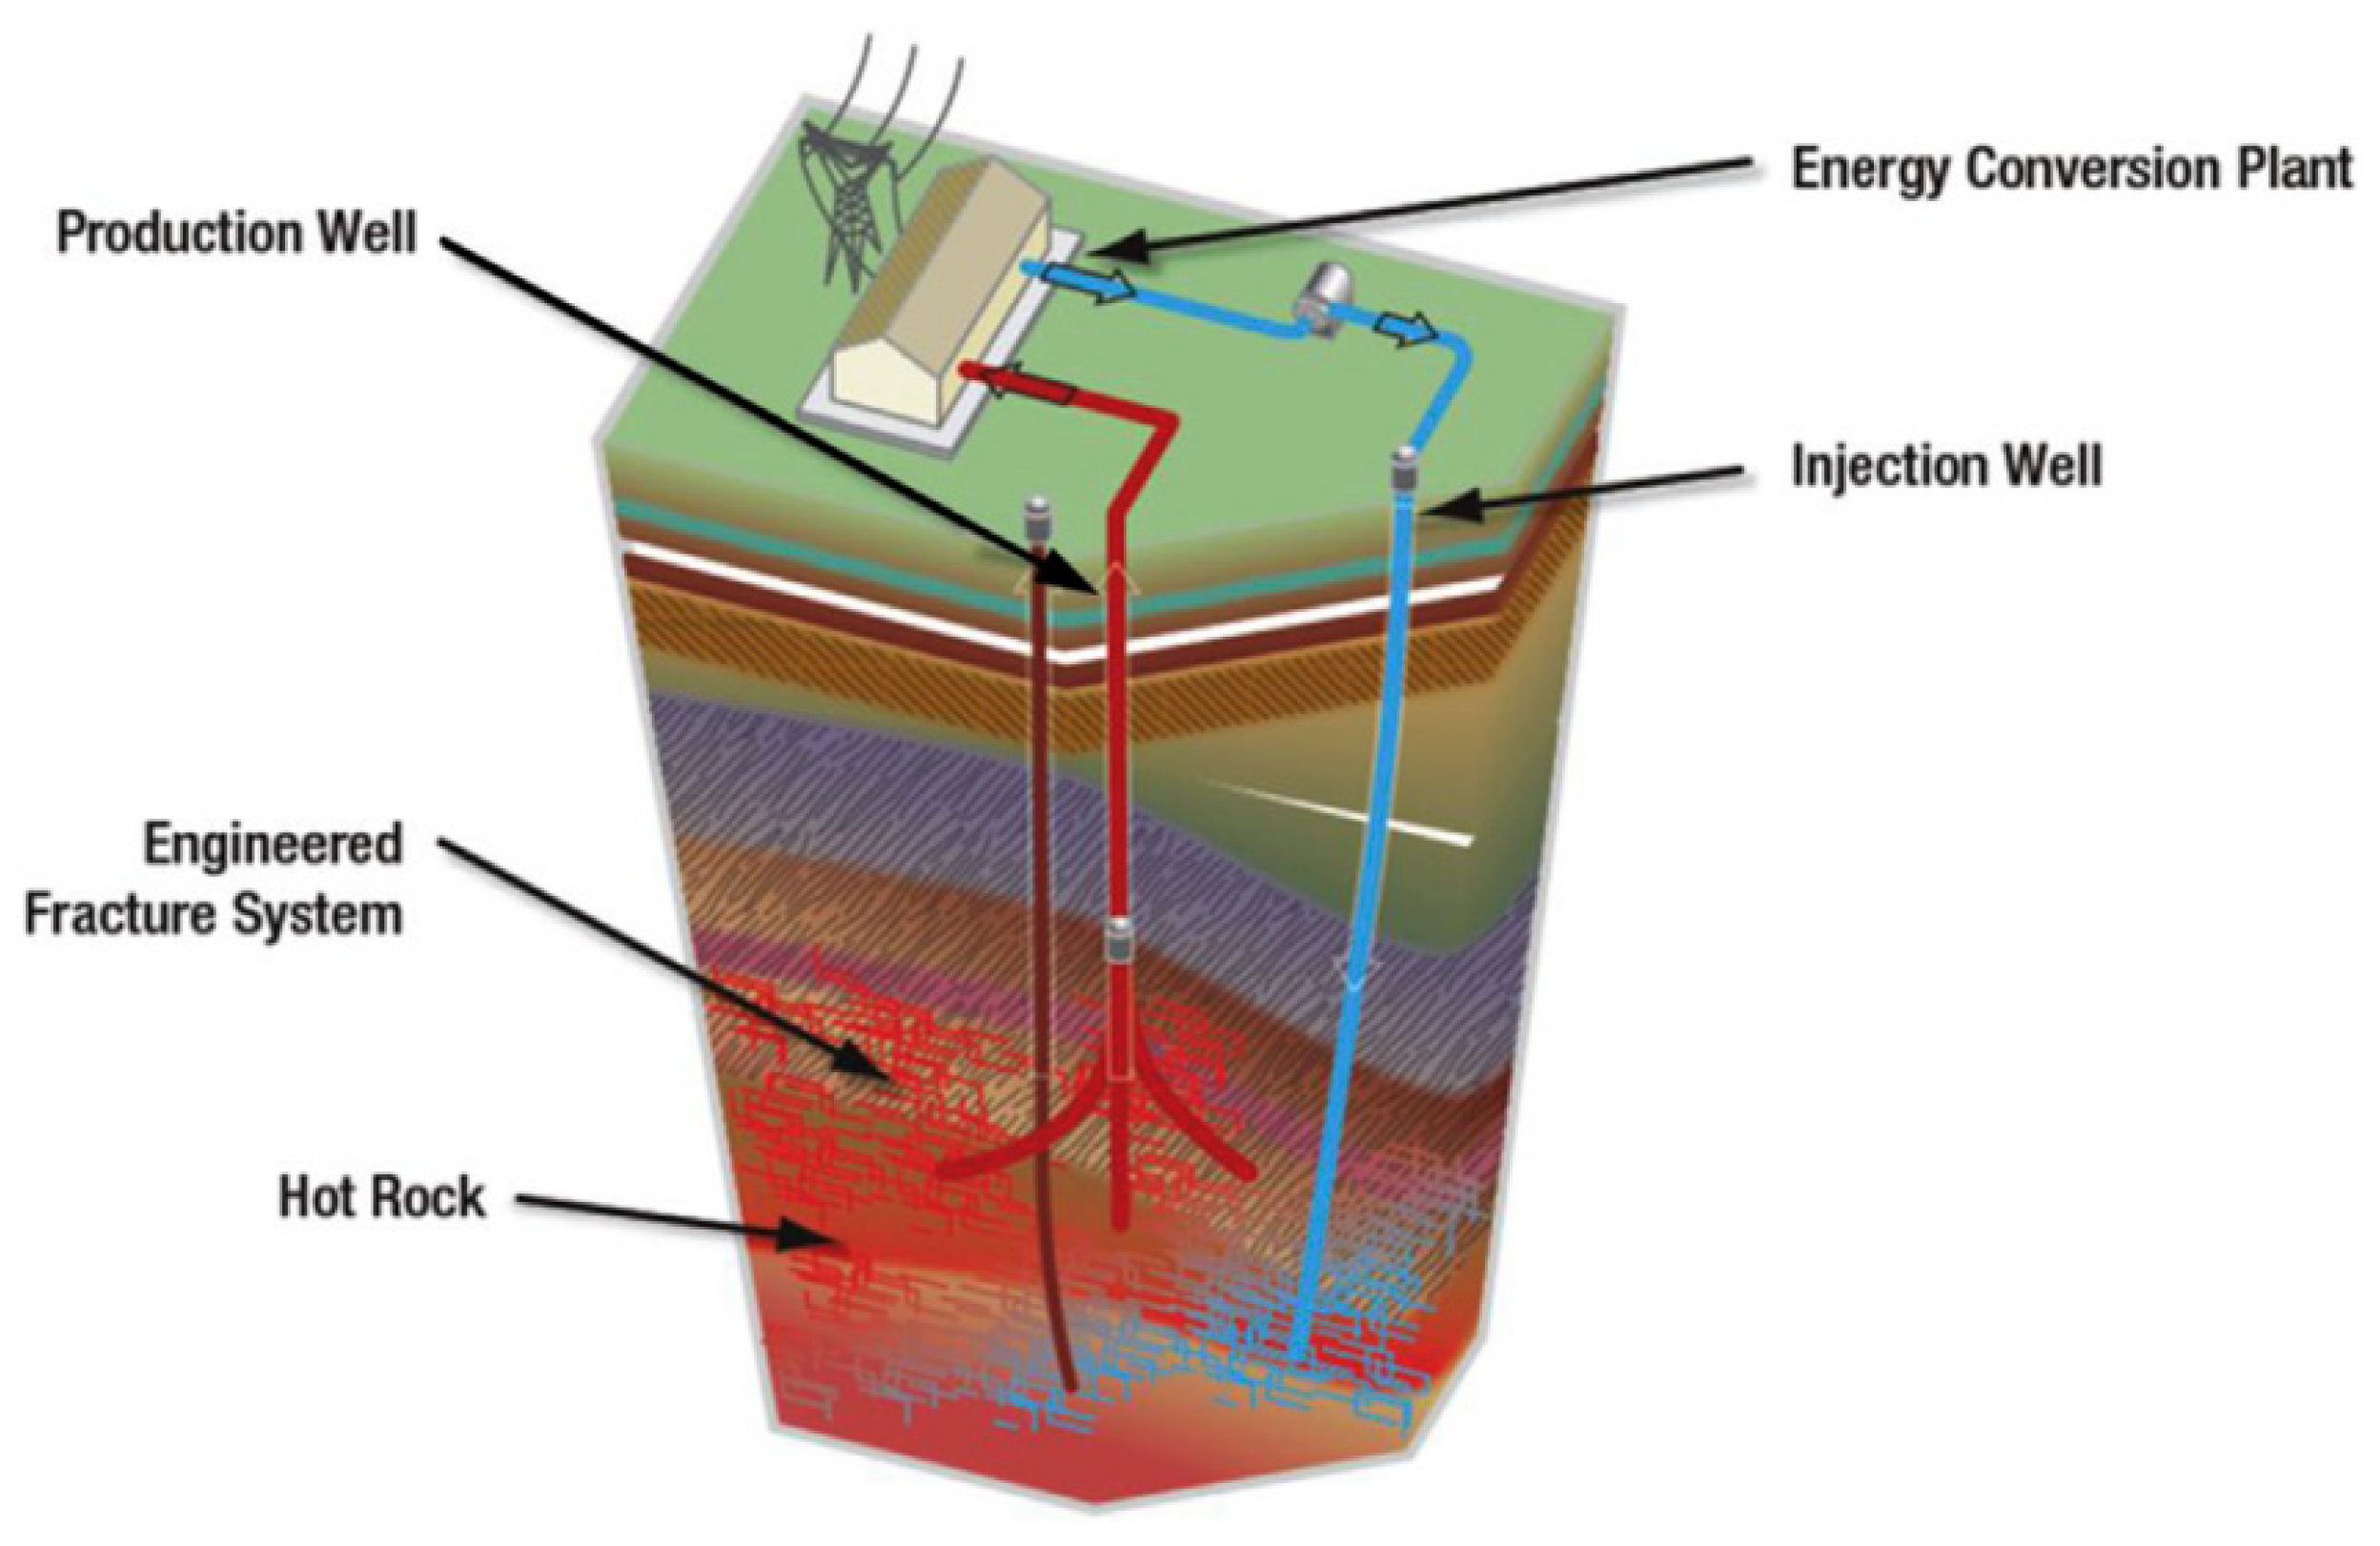
Due to the large capital expenditure required to develop an effective system, the geothermal system should be meticulously planned in advance to maximize its profitability. Figure 1 depicts a basic configuration of a geothermal facility. When designing a geothermal system, optimal heat extraction performance and low development costs are desired. As a result, the prediction and optimization of heat production performance is a key technology that affects the development cost and operational life of a specific geothermal system [5]. Conducting computer simulations to evaluate various parameter combinations to improve performance is a common practice [6]. The effects of fluid flow rate, temperature, lateral well spacing fracture number, fracture breadth, and production time on a horizontally fractured geothermal reservoir have been studied in the literature [7].

Figure 1.
Type geothermal plant layout of HDR.
The previous studies help us to comprehend the importance of choosing the appropriate parameters. The heat production performance of a certain geothermal system is significantly influenced by the thermal reservoir characteristics, fracture conditions, and injection parameters of the circulation fluid. Particularly, the circulation fluid flow and, consequently, the effectiveness of thermal extraction are significantly influenced by the characteristics of the thermal reservoir, such as reservoir volume, permeability, and fracture characteristics, such as length, opening, roughness, and tortuosity [8]. In other words, a variety of factors impact heat production performance, and the underlying effect mechanism is complex, making its prediction extremely difficult [9]. Furthermore, the impact of various factors on geothermal performance has not been well examined. One solution to this problem is to investigate all potential parameter combinations and then select the optimal combination. However, because all potential combinations must be analyzed, it is frequently computationally demanding [10].
Using approximations instead of computationally expensive experiments/simulations is an effective solution to this computationally intensive problem [11]. By revealing the connections between the variables and objective functions, approximations can provide insights into the optimization problem [12]. Due to their ability to handle black-box and computationally demanding functions, approximation models could be used in practically all sorts of optimization problems [13]. When establishing an approximation model, samples are anticipated to be scattered over the whole design space in order to extract as much information as possible about the real experiments or simulations to be substituted. Additionally, the sampling technique has a significant impact on the approximation accuracy [14]. In general, a larger sample size allows approximations to explore the design/optimization area more thoroughly [15]. Large sample sizes of experiments/simulations, however, are impractical to implement, especially when computational costs are an overburden [16]. To enhance approximation approaches even further, the adaptive sampling methodology was created [17]. Researchers have lately switched from standard (or static) to adaptive techniques, known as dynamic or adaptive approximations, for approximation-based analysis and optimization [18].
Multiple fracturing technology and horizontal wells have significantly advanced during the last few years, improving gas and oil output [19]. The employment of multiple fracturing technology and horizontal wells have also attracted wide attention recently. Yu et al. developed a 3D thermal-hydrological-mechanical model with contacting cracks and assessed the efficacy of its heat extraction [20]. To examine the impact of numerous hydraulic fractures on geothermal energy extraction performance, geothermal systems with multiple fractured horizontal wells were analyzed [21]. Research shows that horizontal wells are preferable to vertical wells for connecting injection and production wells [19]. Additionally, a geothermal system with a horizontal well and several fractures might guarantee a constant in-situ stress and temperature field in the fractures at the same depth, preventing major flow short circuit between the fractures [22]. In addition to boosting heat extraction, it may also significantly reduce produced seismicity compared to a single fracture because of the decreased individual energy release from each fracture [6].
The adaptive Kriging approximation and numerical simulations are integrated in this study to optimize heat production performance for a geothermal system with two horizontal wells and rectangular multi-parallel fractures. In the beginning, a numerical model for a two-horizontal-well geothermal system with rectangular multi-parallel fractures is developed. The heat production performance optimization issue is then constructed using the heat generating power calculation. A substantial processing burden and a “black box” problem come from the computer simulation investigation. In order to offer production-specific enthalpy and outlet temperature responses, Kriging approximation is employed and adaptively updated to take the role of the computer simulation. We use a parameterized lower confidence bounding scheme (PLCB), a sequential sampling technique that was recommended in our earlier work, to update the Kriging approximation with dynamically identified sample sites in order to strike a compromise between optimization accuracy and efficiency. As a result, the approximation update is led by both the optimization accuracy and the approximation’s expected uncertainty. The optimization outcome is compared to that of the Kriging-based optimization approach. Furthermore, the effectiveness of the PLCB system is proved through comparisons with other commonly used infill schemes.
2. Method
2.1. Heat Production Performance Optimization Problem Formulation
As a high temperature geothermal resource, HDR is primarily used for power production. The capacity of heat generation power must be addressed when developing a geothermal system. As a result, heat generating capacity is taken as an assessment indicator to evaluate heat production performance. The following equation is widely used to compute heat generating power according to the First Law of Thermodynamics:
where We stands for the heat generation power, MW; q represents the circulation mass flow rate, kg/s; hpro and hinj stand for the enthalpy of the producing water and injection specific enthalpy, J/kg, respectively; T0 is the injection temperature, while Tpro is the outlet temperature; and 0.45 is the thermal energy conversion coefficient. The mass flow rate q could be calculated according to , where stands for the density of the circulating working fluid, kg/m3; represents the injection velocity of circulating working fluid, m/s; while A denotes the injection pipe’s cross sectional area, m2.
Therefore, the calculation formula of total power generation Q within a certain time is as follows:
The total power generation Q is employed to reflect the heat production performance, which would be optimized to obtain the best performance. The production specific enthalpy and outlet temperature Tpro are obtained through the computer simulations described in Section 2.3, which is a black-box issue. A Kriging model is employed to replace the production specific enthalpy and outlet temperature Tpro in the optimization problem to benefit the whole optimization procedure with easy implementation and much less computational burden. In this work, the fracture space W, mass flow rate of injected circulating working fluid q, and well space L are taken as the design parameters to gain the maximum heat generation power. The well spacing L can be decomposed into L1 and L2 in the vertical and horizontal directions.
Therefore, the optimization problem could be formulated as follows:
The optimization objective function is to maximize the total power generation Q. The fracture space W, mass flow rate of injected circulating working fluid q, and well space L are the variables, which are employed in the numerical simulation model to obtain the production specific enthalpy. There is a cut-off outlet temperature constraint (presented as Tpro ≥ 393.15 K) considering the system lifetime; that is, an outlet temperature less than 393.15 K is considered to have no development and utilization value.
2.2. Adaptive Kriging-Based Heat Production Performance Optimization
To solve the total power generation maximization problem proposed in the preceding section, an adaptive Kriging-based heat production performance optimization is proposed in this section.
The design parameters for the heat production performance optimization problem are specifically fracture space, injection flow rate, and well space. The performance of heat production is taken into account while calculating the heat producing power. Figure 2 illustrates how the suggested adaptive Kriging-based heat generation performance optimization is carried out. Computer simulations based on the numerical model for a geothermal system with rectangular multi-parallel fractures conducted in Section 2.3 are employed to obtain the production specific enthalpy and outlet temperature Tpro at the sample points. The heat generation power in Equation (2) is then calculated based on the simulated response of production specific enthalpy and outlet temperature Tpro. A relationship is established between the heat generation performance and the input parameters (fracture space, injection flow, and well spacing) through the use of Kriging modeling. Additionally, a sequential sampling technique is used to update the Kriging model. The PLCB sampling method proposed in our previous work [15], which aims to adaptively balance the exploration/exploitation procedure, is employed to locate new samples to adaptively update the Kriging approximation.
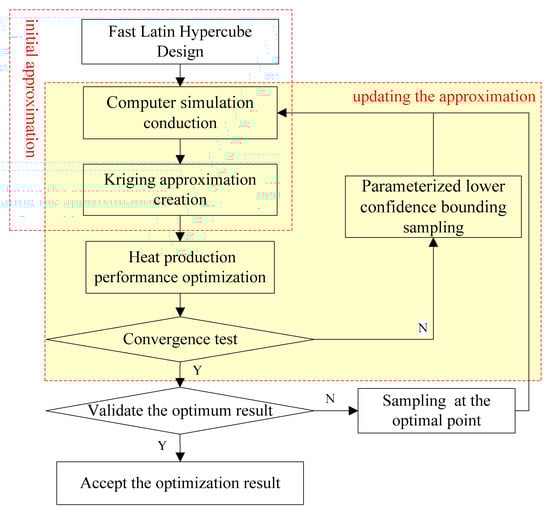
Figure 2.
Procedure of the adaptive Kriging-based heat production performance optimization.
2.3. Numerical Simulation for a Two-Horizontal-Well Geothermal System
The numerical simulation technique for a two-horizontal-well geothermal system with rectangular multi-parallel fractures is detailed in this section. In this research, the computational fluid dynamics software, ANSYS Fluent 16, is used as the simulation solution. It is widely used for simulating and analyzing fluid flow and heat transfer through porous media, multiphase flow, and phase transition in various engineering applications [23]. The convergence condition of the numerical simulation in this work is that the residual value of energy is set to 10−6 and the other variables’ residual values are set to 10−3.
2.3.1. Numerical Model Description
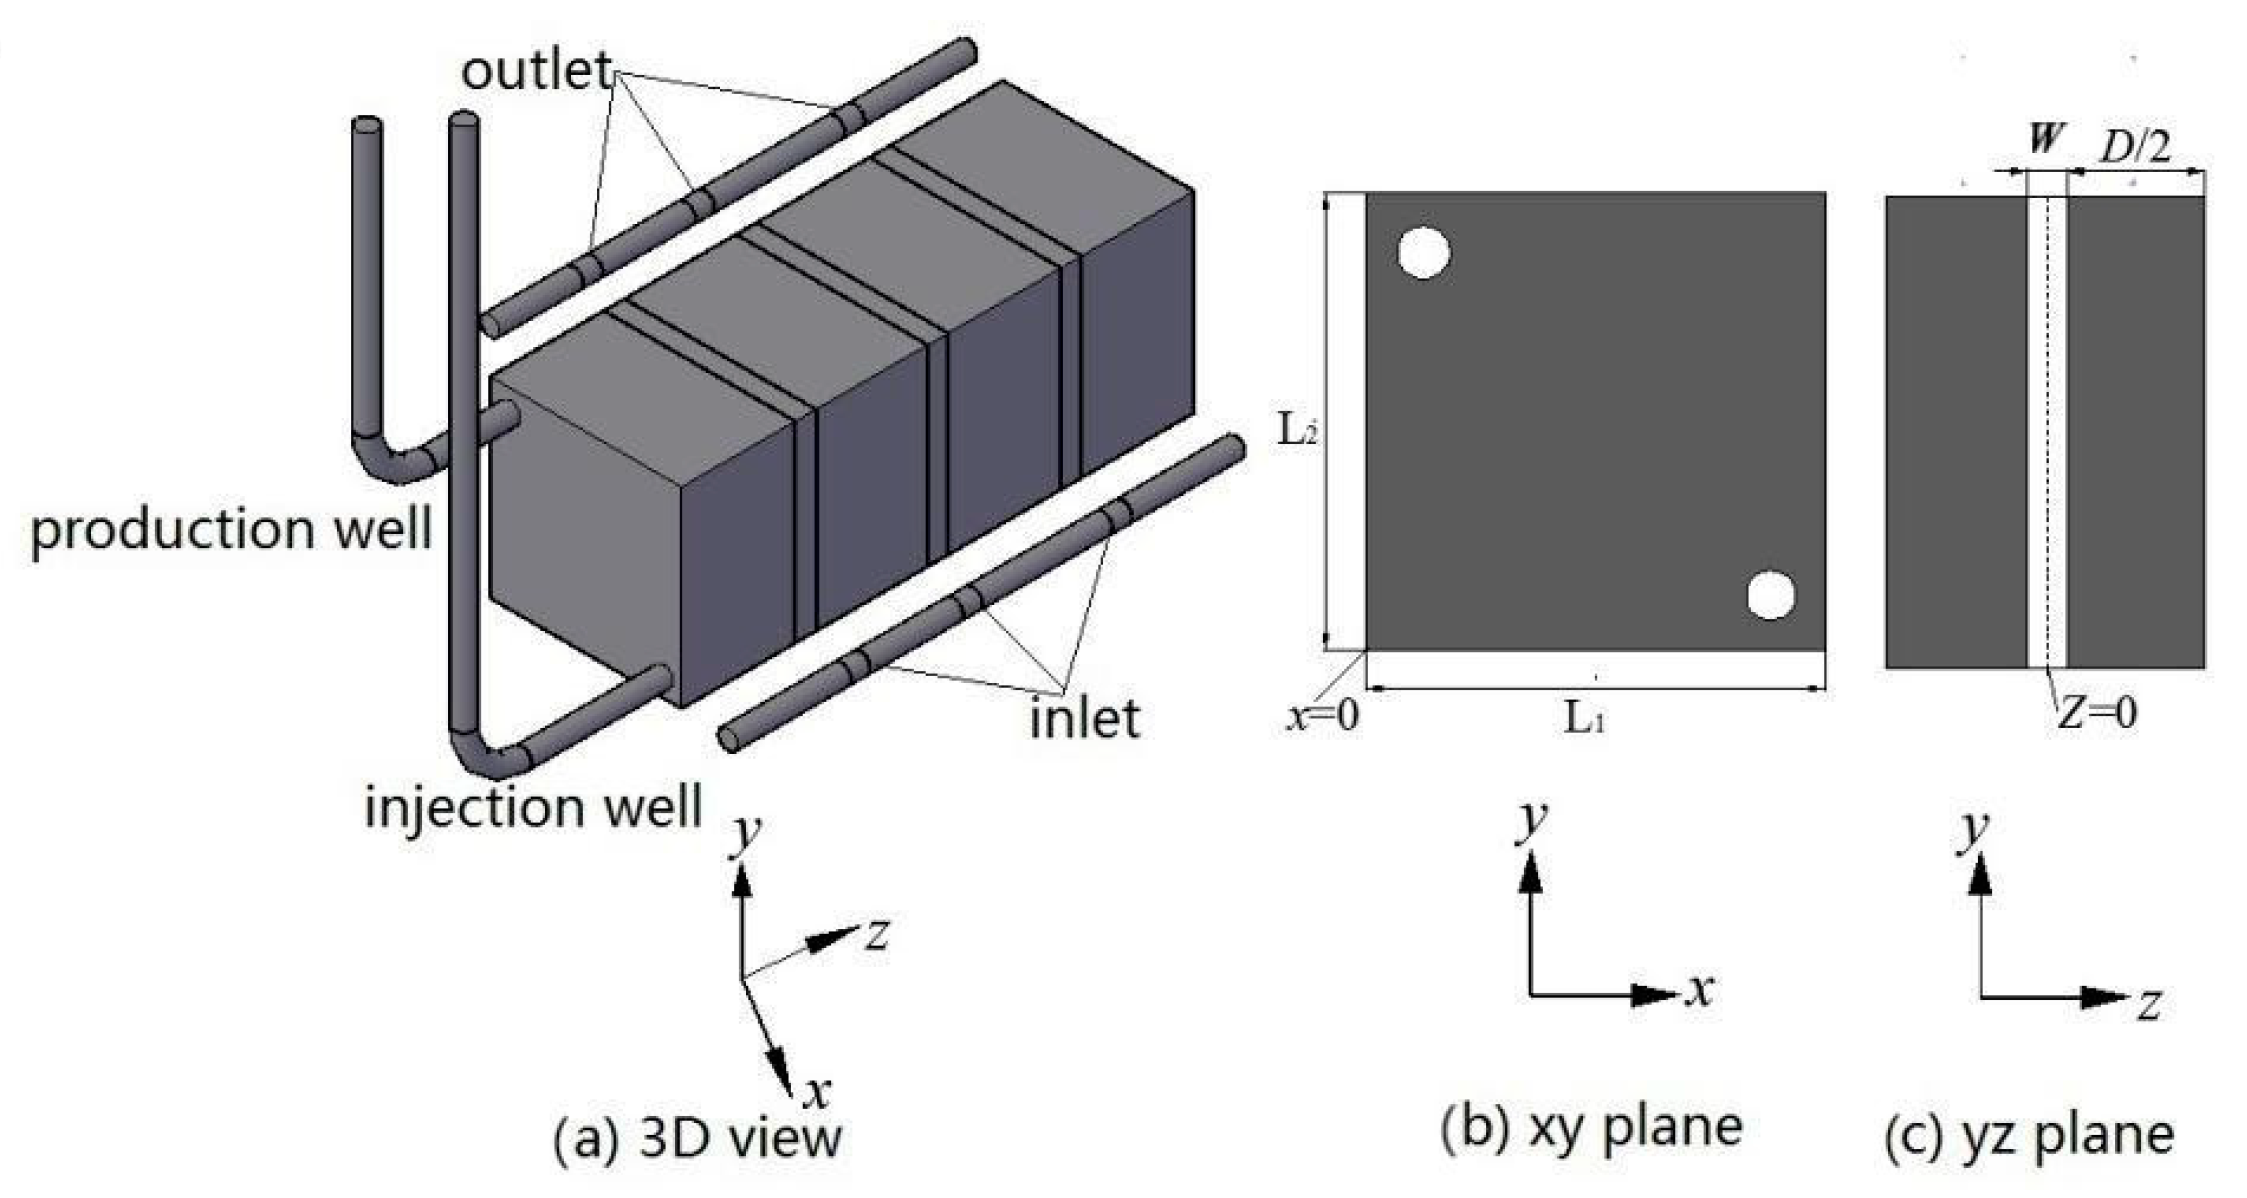
The fractured zone and the impermeable rock mass zone are represented by a numerical model with rectangular multi-parallel cracks. Figure 3 depicts the conceptual model. As Figure 3b,c demonstrate, L1, L2, W and D represent the fracture length, the fracture height, the fracture aperture, and the fracture space, respectively. Taking the boundary impact into account, there is a reserve distance of 25 m between the inlet and outflow and the edge. Because the well diameter is just 0.3 m, which is significantly less than the dimension of the rock mass, the flow heat transfer within the well is considered insignificant. Therefore, fracture interfaces with the injection well are considered as inlets, while interfaces with the producing well are treated as the outlets. Thus, the model is periodic along the z axis. Figure 3c demonstrates one period, in which Z = 0 is the fracture’s central axis.
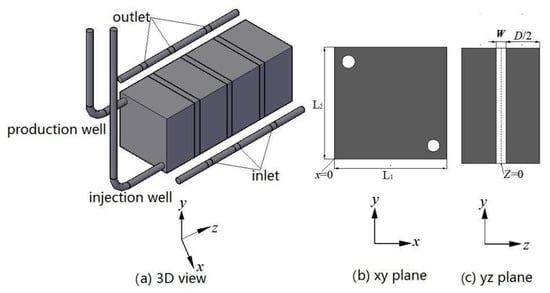
Figure 3.
Conceptual model of a two-horizontal-well geothermal system.
2.3.2. Governing Equations
The continuity equation is described as follows:
where t denotes the time (s); is the porosity, which equals 1 when the fractures are completely open; represents the fluid density (kg/m3); K is the second-order area porosity tensor; U stands for the velocity vector; is the gradient operator.
Ignoring the convective acceleration and diffusion terms of the momentum equation, the momentum equation can be simplified to Darcy’s law.
where is the dynamic viscosity of the fluid (Pa·s); P is the pressure of the fluid (Pa); g is the gravitational acceleration (m/s2).
The local energy governing equation is described as follows.
where is the specific heat capacity of the fluid, J/(kg·K); T is fluid Temperature (K); is the effective thermal conductivity of the crack, W/(m·K); is fluid shear stress, Pa.
2.3.3. Boundary and Hypotheses
(1) The model in Figure 3 has a repetitive characteristic of periodism in the z axis direction, the left and right walls are configured to be the periodic wall, while the interface between the fluid zone and the rock mass zone is set to the coupled wall.
(2) The matrix rock area is simplified to be homogeneous and isotropic impermeable blocks, namely the matrix permeability ≤9.87 × 10⁻¹⁶ m2. Chemical interactions between water and the rock matrix are also not taken into account.
(3) The rock’s thermal diffusion coefficient is low so that the thermal conduction between the reservoir model in Figure 3 and the surrounding rock is ignored. Therefore, except for the above boundary, there is no heat flow over the other surfaces.
(4) Ignore the influence of temperature and pressure condition variety on the thermal property of the system. Thus, thermal conductivity coefficient, specific heat capacity and density of rock and water are constant during the whole mining stage.
(5) With a temperature gradient of 6 K/100 m (y axis), the initial average temperature of the rock mass is 473.15 K, but it may also range from 461.15 K to 485.15 K. There is no water loss during water circulation since the intake has been designated as a mass-flow inlet with an injection temperature of 60 °C. The outlet is used as a pressure-outlet.
2.3.4. Parameters Selection
Based on geothermal exploration findings and prior study experiences [24,25,26], a fundamental scenario of the Gonghe Basin in Qinghai was chosen as the research background to guide the selection of parameters. Table 1 contains the exact numerical model parameters for this instance. The model size is 400 m × 400 m × 400 m. The fracture aperture is settled as 0.002 m according to the literature and experience in hydrothermal geothermal systems [27]. The thermo-physical properties of matrix rock vary generally between 2–3.5 W/(mK), and 2.5 W/(mK) was employed. A geothermal examination of the Gonghe Basin in Qinghai found that the temperature can exceed 473.15 K at 3000 m below the surface and that the geothermal gradient is approximately 6–7 K/100 m [28]. As a result, the starting average temperature of the rock mass is set at 473.15 K and dispersed with a 6 K/100 m temperature gradient. According to Zeng’s research, the water density in a broken reservoir ranges from 857 kg/m3 to 992 kg/m3 [29], and in this work, the average value of 925 kg/m3 is used. The fracture fluid is regarded as a porous medium, and the modified Cubic Law [30] is used to estimate the permeability of the rough fracture while taking the influence of fracture roughness on heat transfer into account:
where k stands for the fracture permeability after reservoir stimulation such as hydraulic fracturing; W represents the fracture aperture; f denotes the Lomize roughness coefficient, which is calculated according to Equation (8); a stands for the asperity height, and is set to be 0.0005 m according to Wang’s research [31].

Table 1.
Parameters of the reservoir rock matrix in the numerical model.
By this method, the fracture permeability after reservoir reformation is calculated as 1.9 × 10⁻⁷ m2, which was employed in the computer simulation.
It is also taken into account how temperature affects the mechanical and physical properties of water. The calculations below illustrate that the water’s density, heat conductivity, heat capacity, and dynamic viscosity are all variables [6].
2.3.5. Domain Discretization
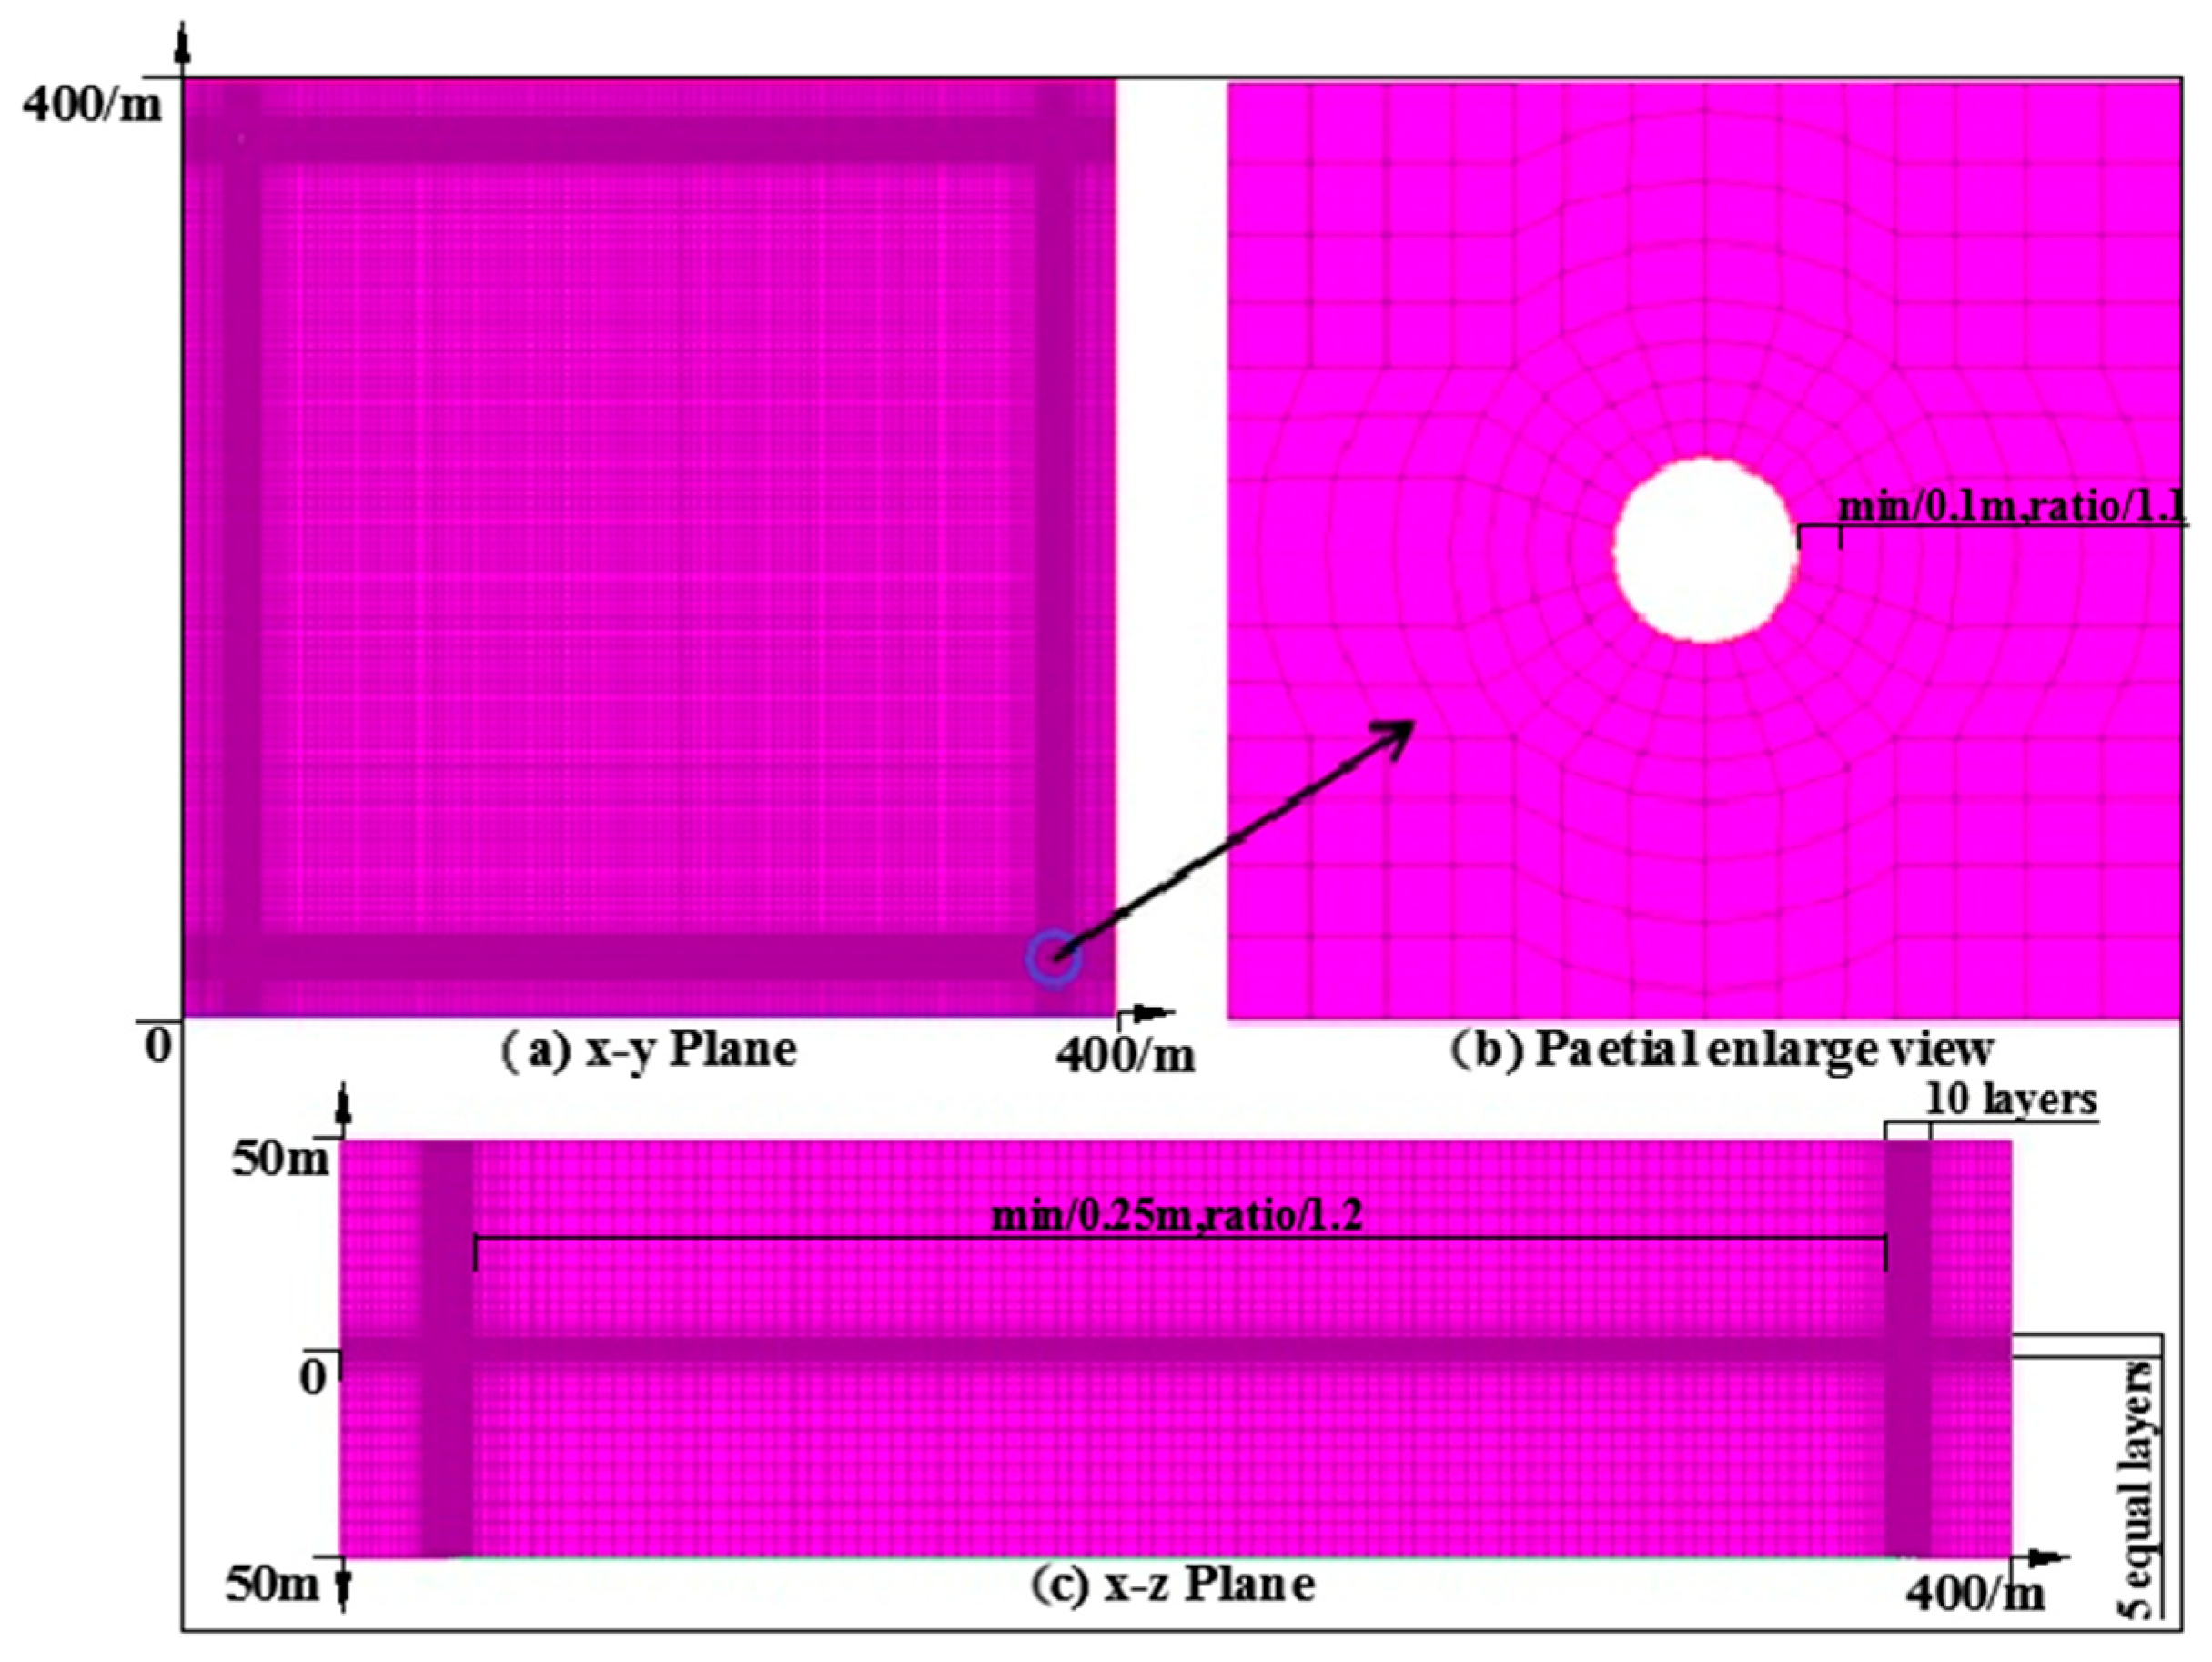
Figure 4 shows how the fracture, entry, and exit areas mesh. The region surrounding the well is split by an O-shape in the xy plane. The model is meshed into 10 layers with a minimum grid size of 0.1 m and a growth ratio of 1.1 inside a 1.6 m region close to the well. The grid size is raised by a factor of 1.2 in the region 1.6 m out from the well, with a minimum mesh size of 0.25 m. The fracture region is separated into 5 equal layers along the z-axis since the fracture aperture is only 2 mm wide. Each layer is equally 0.4 mm and permeability of each layer is 1.9 × 10⁻⁷ m2. The model is partitioned into 10 boundary layers with a minimum grid size of 0.5 mm and a growth ratio of 1.1 in the rock mass region of 8 mm close to the fracture zone. Meshing occurs in the rock mass beyond the 8 mm fracture zone at a growth ratio of 1.3 and a minimum size of 13 mm.

Figure 4.
Meshing in the computational domain.
2.4. PLCB-Based Sequential Sampling Methods
The lower bounding function, which is a linear mix of approximation uncertainty and the anticipated value, is minimized in Cox and John’s method to global optimization. The Lower Confidence Bounding (LCB) formulation is demonstrated as follows:
where is the predicted optimal value, is the predicted uncertainty. The exploration/exploitation balance is regulated by a user-controlled variable b. Cox and John suggested . By incorporating a parameter for the expected value, we proposed a cooling technique to address the challenge of selecting a well-working . The original LCB function is therefore slightly updated to become as follows:
In the above equation, and fluctuate during the whole optimization process and sampling procedure. The newly developed cooling method is regularly carried out by oscillating and monotone-decreasing control functions. When a larger value is assigned to , the predicting uncertainty has bigger weight, and the LCB minimization in Equation (11) focuses on the global search (exploration). Conversely, a smaller value of assigns a bigger weight to local search (exploitation). Bigger is suggested at an earlier stage, and then, smaller is expected. As the sampling process proceeds, the value of varies periodically to balance exploration and exploitation intelligently. The parameters and are formulated as follows:
In the above equation, stands for the iteration number (also known as the sequence sampling number), controls the varying cycle and could be defined via users’ preference.
An alternative method is to set the parameter a = 1, and then vary the parameter b according to the three control formulations as provided in the following:
where stands for the iteration number, and b0 represents the initial value of parameter b. Compared to Equation (12), formulations in Equations (13)–(15) are monotone-decreasing while Equation (12) is also an oscillating function.
3. Results and Discussion
3.1. Model Verification
Through a comparison of the dimensionless temperature, or TD, between the works in this study and research in the literature [32], the suggested numerical simulation model is validated in this part. TD is defined as TD = (Tpro − Tinj)/(T0 −Tinj). Figure 5 demonstrates TD of a 1D numerical model [32], 2D numerical model [33], and numerical model in this work. The evolution tendency of TD in various stimulation models is essentially the same, as illustrated in Figure 5. The early stage’s temperature is steady or increasing throughout the first year. However, the progress of TD has steadily stagnated as mining time has increased. During the course of 20 years, TD of the 2D numerical model decreases by about 42%, TD of the 1D numerical model decreases by about 43.3%, and TD of the numerical model in this work has a 45.6% drop. The comparison result shown in Figure 5 verify the rationality and effectiveness of the numerical model proposed in this paper.
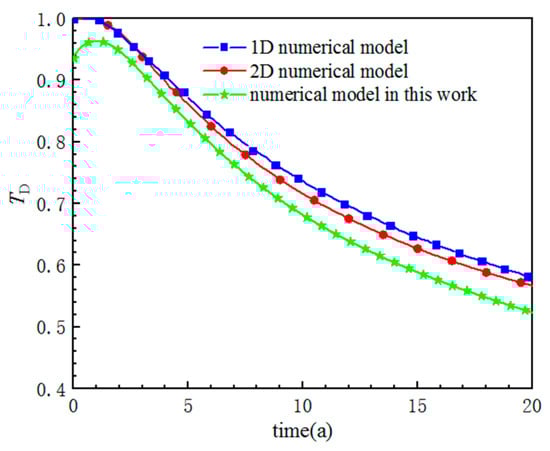
Figure 5.
Comparison of dimensionless temperature of different numerical models.
3.2. Simulation Running
The numerical simulation method described in Section 2.3 is executed to obtain the outlet temperature of the circulation fluid. Figure 6 demonstrates the fluid field’s simulated temperature distribution in the x-y plane (z = 0) after 20 years in a situation where the fracture space W is 100 m, injection flow q is 8 kg/s, and well spacing L is 990 m. Because circular zones of low temperature form and spread evenly around the entrance, it may be assumed that the outflow temperature is not altered in the early stages (Figure 6a–c). The isotherm starts to bulge toward the outlet at 0.88 years (as shown in Figure 6d), which implies that the heat exchange between the flowing fluid and the high-temperature rock mass has altered the temperature in the vicinity of the outlet regions. Thus, the outlet temperature, Tpro, starts to drop (see Figure 7), and as the heat extraction time increases, the low temperature zones eventually expand to the complete areas (as shown in Figure 6e–i). Additionally, it shows that because the starting temperature of the rock mass is distributed in a gradient, the temperature at the lower left side of the entire fluid region is always higher than the top right side.
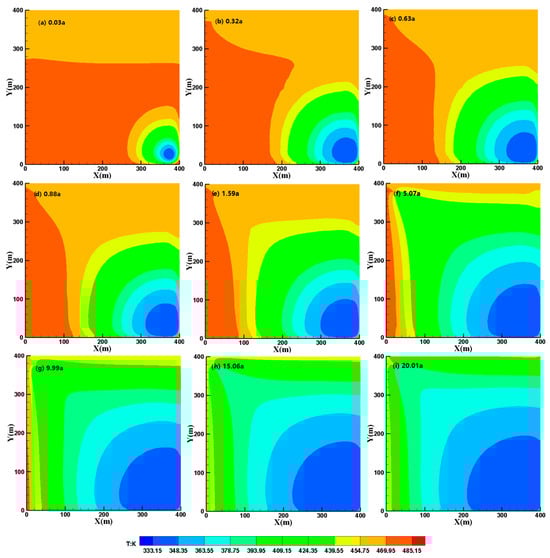
Figure 6.
Simulated temperature distribution of the fluid field in the xy planes.
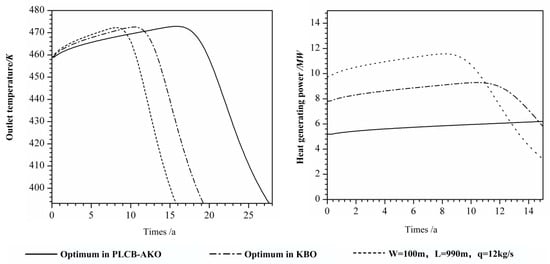
Figure 7.
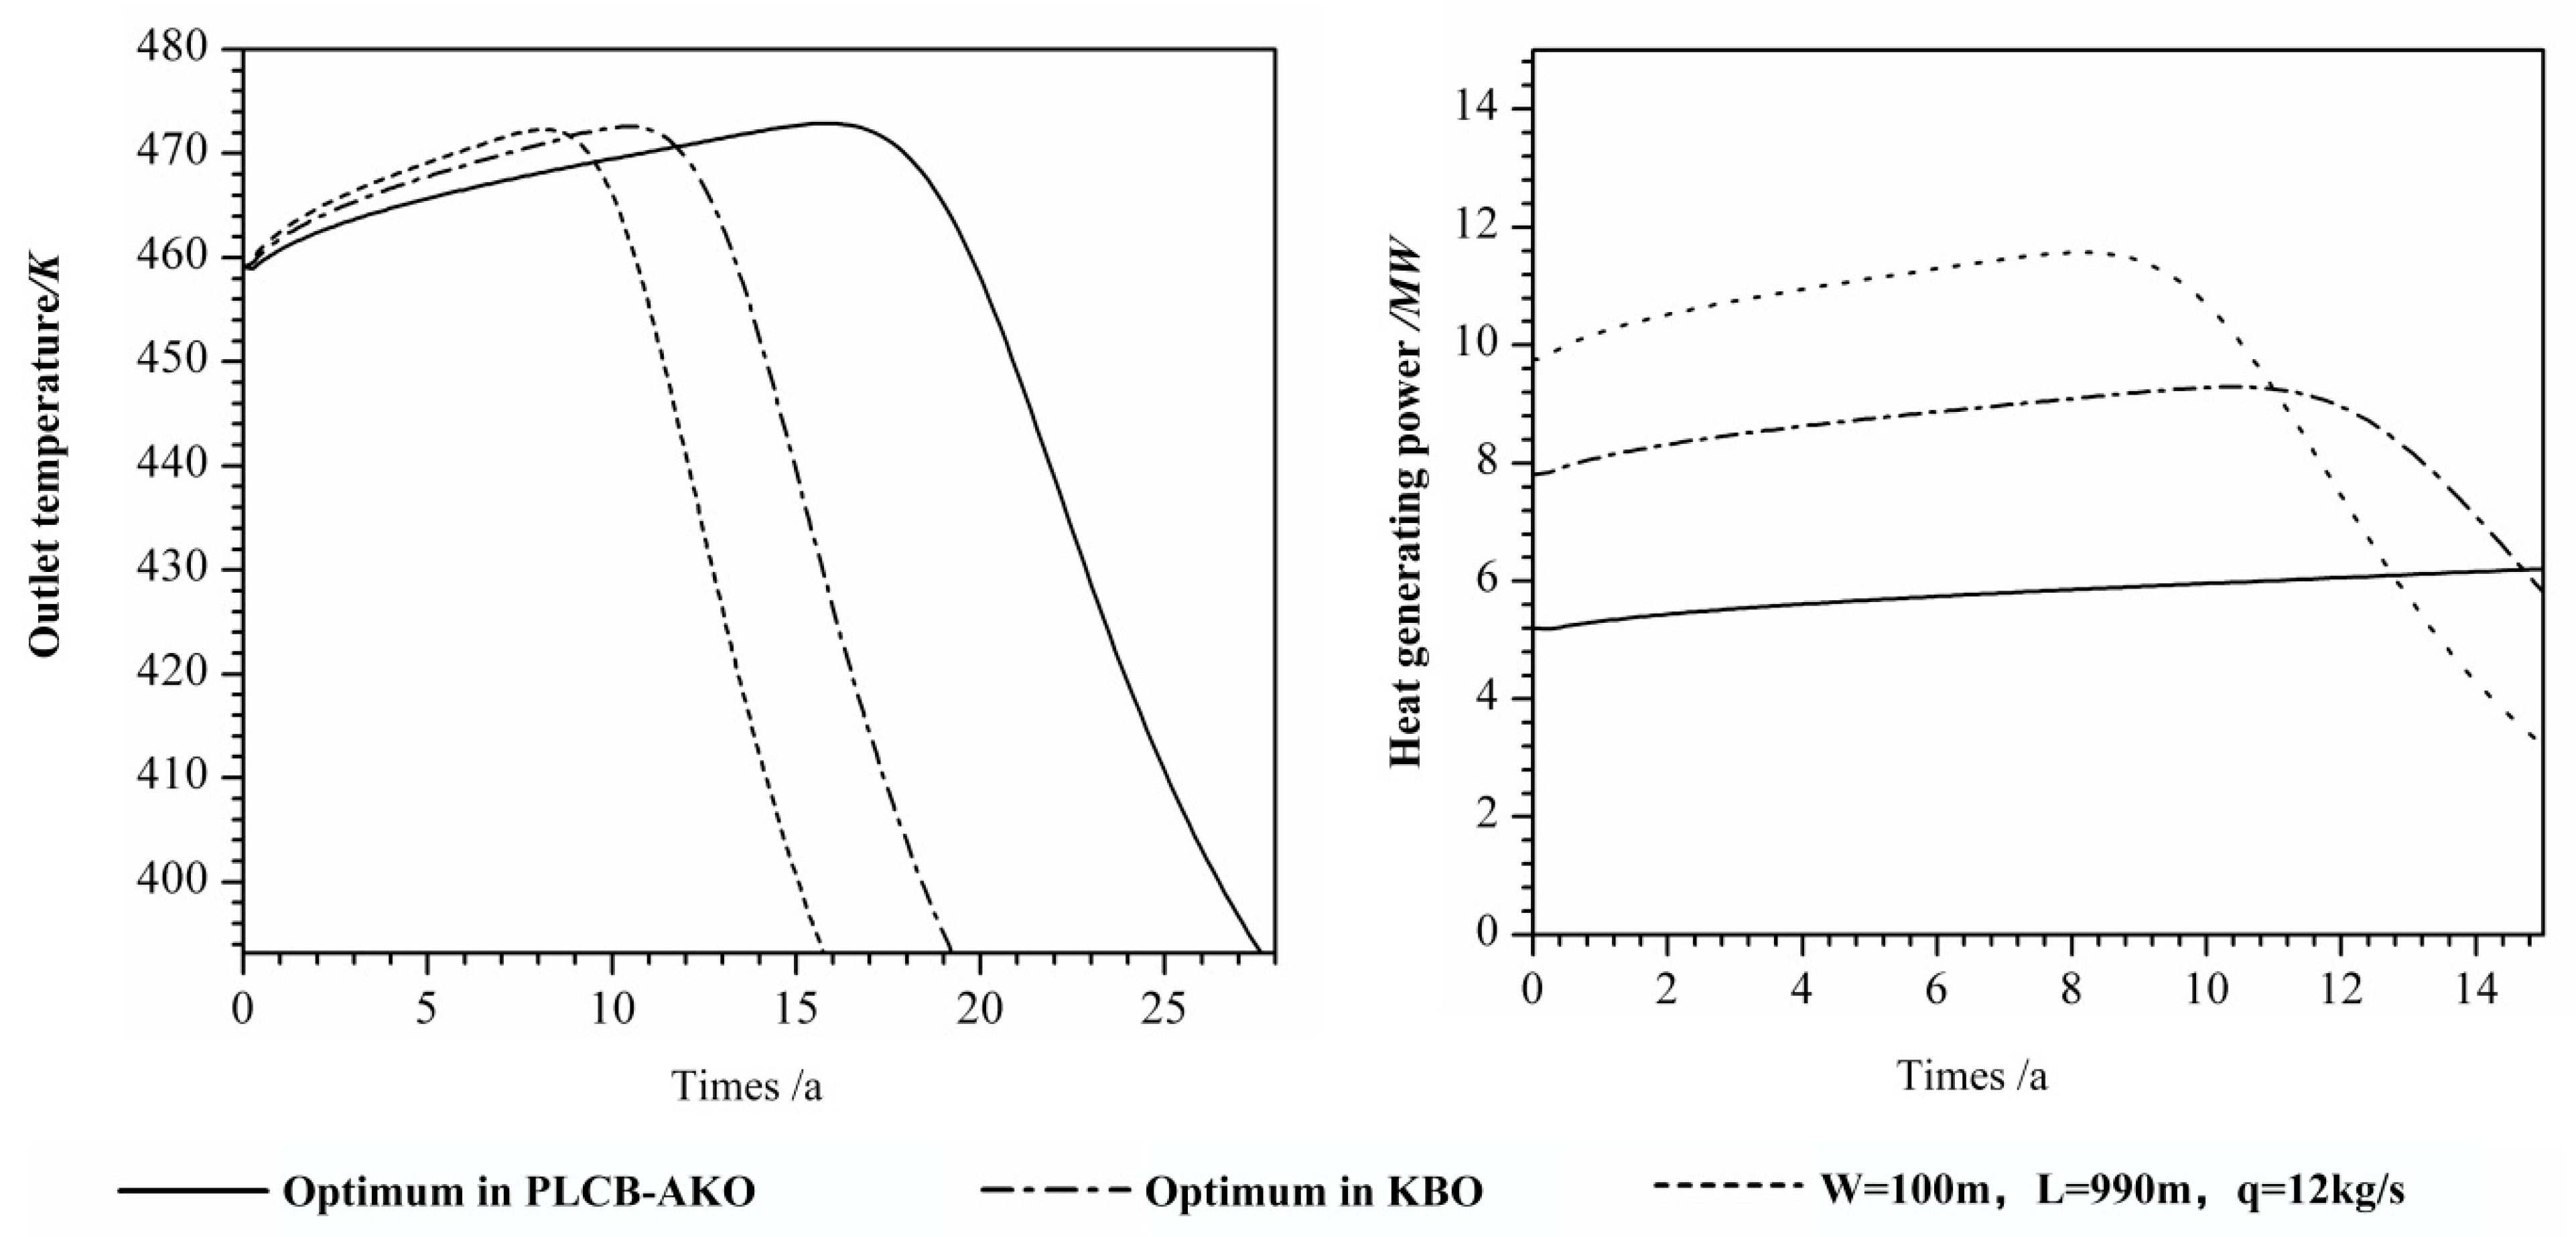
Outlet temperature and heat-generating power of different schemes.
Figure 7 depicts the development of the outlet temperature and heat-generating power of the optimum scheme through different approaches, in which the scheme (with w = 100 m, L = 990 m and q = 12 kg/s) is used as a reference group. It is obvious that the outlet temperature rose for a very brief period of time and then dropped to 393.15 K at 15.78 a in the reference scheme, while the optimum scheme of PLCB-AKO-1 dropped to 393.15 K at 27.16 a. Therefore, in the heat generation power curve, the optimum scheme of PLCB-AKO reached a stable output of 5.2 MW without a downward trend, while the heat-generation power curve drops at about 8 a and 14.5 a in the other two schemes.
3.3. Comparison with Kriging-Based Optimization
For comparison, the Kriging-based optimization approach is used to tackle the heat generation performance optimization problem (which is called KBO for short in this paper). Both the PLCB-based adaptive Kriging optimization method (PLCB-AKO for short) and KBO employ the fast LHD to generate the initial sample points.
When using the KBO technique, sample sizes of 30, 40, and 50 are set, and the starting sample size for Kriging in the suggested PLCB-AKO approach is set at 20. LHD is used to select sample points for Kriging modeling in KBO. To assess the precision of the Kriging approximation at the last iteration, three metrics are calculated: (1) relative root mean square error (RRMSE), (2) relative maximum absolute error (RMAE) and (3) relative average absolute error (RAAE). An estimate is more accurate if RRMSE and RAAE are smaller. On the other side, a big RMAE indicates that there is a localized sector of the design space where there is poor approximation. RMAE is therefore anticipated to be as minimal as is feasible. The three error measurements mentioned above are stated as follows:
in which N is the total number of validation points; and stand for the observed mean values and the actual responses, respectively, while indicates the predicted value.
Table 2 shows the prediction accuracy of the Kriging approximation using various sample sizes in the KBO technique. It is obvious from Table 2 that the prediction accuracy of the Kriging approximation rises as the sample size grows.
Table 2.
Prediction accuracy of Kriging in KBO approach.
Table 3 presents the PLCB-AKO approach’s prediction accuracy during the most recent iteration, during which nine new samples were added using PLCB. It is proved that the proposed PLCB-AKO strategy used far fewer sample points, which results in far fewer computer simulations being run and a significant reduction in computing load.
Table 3.
Prediction accuracy comparison of Kriging in PLCB-AKO and KBO.
3.4. Survey of Different Infill Strategies
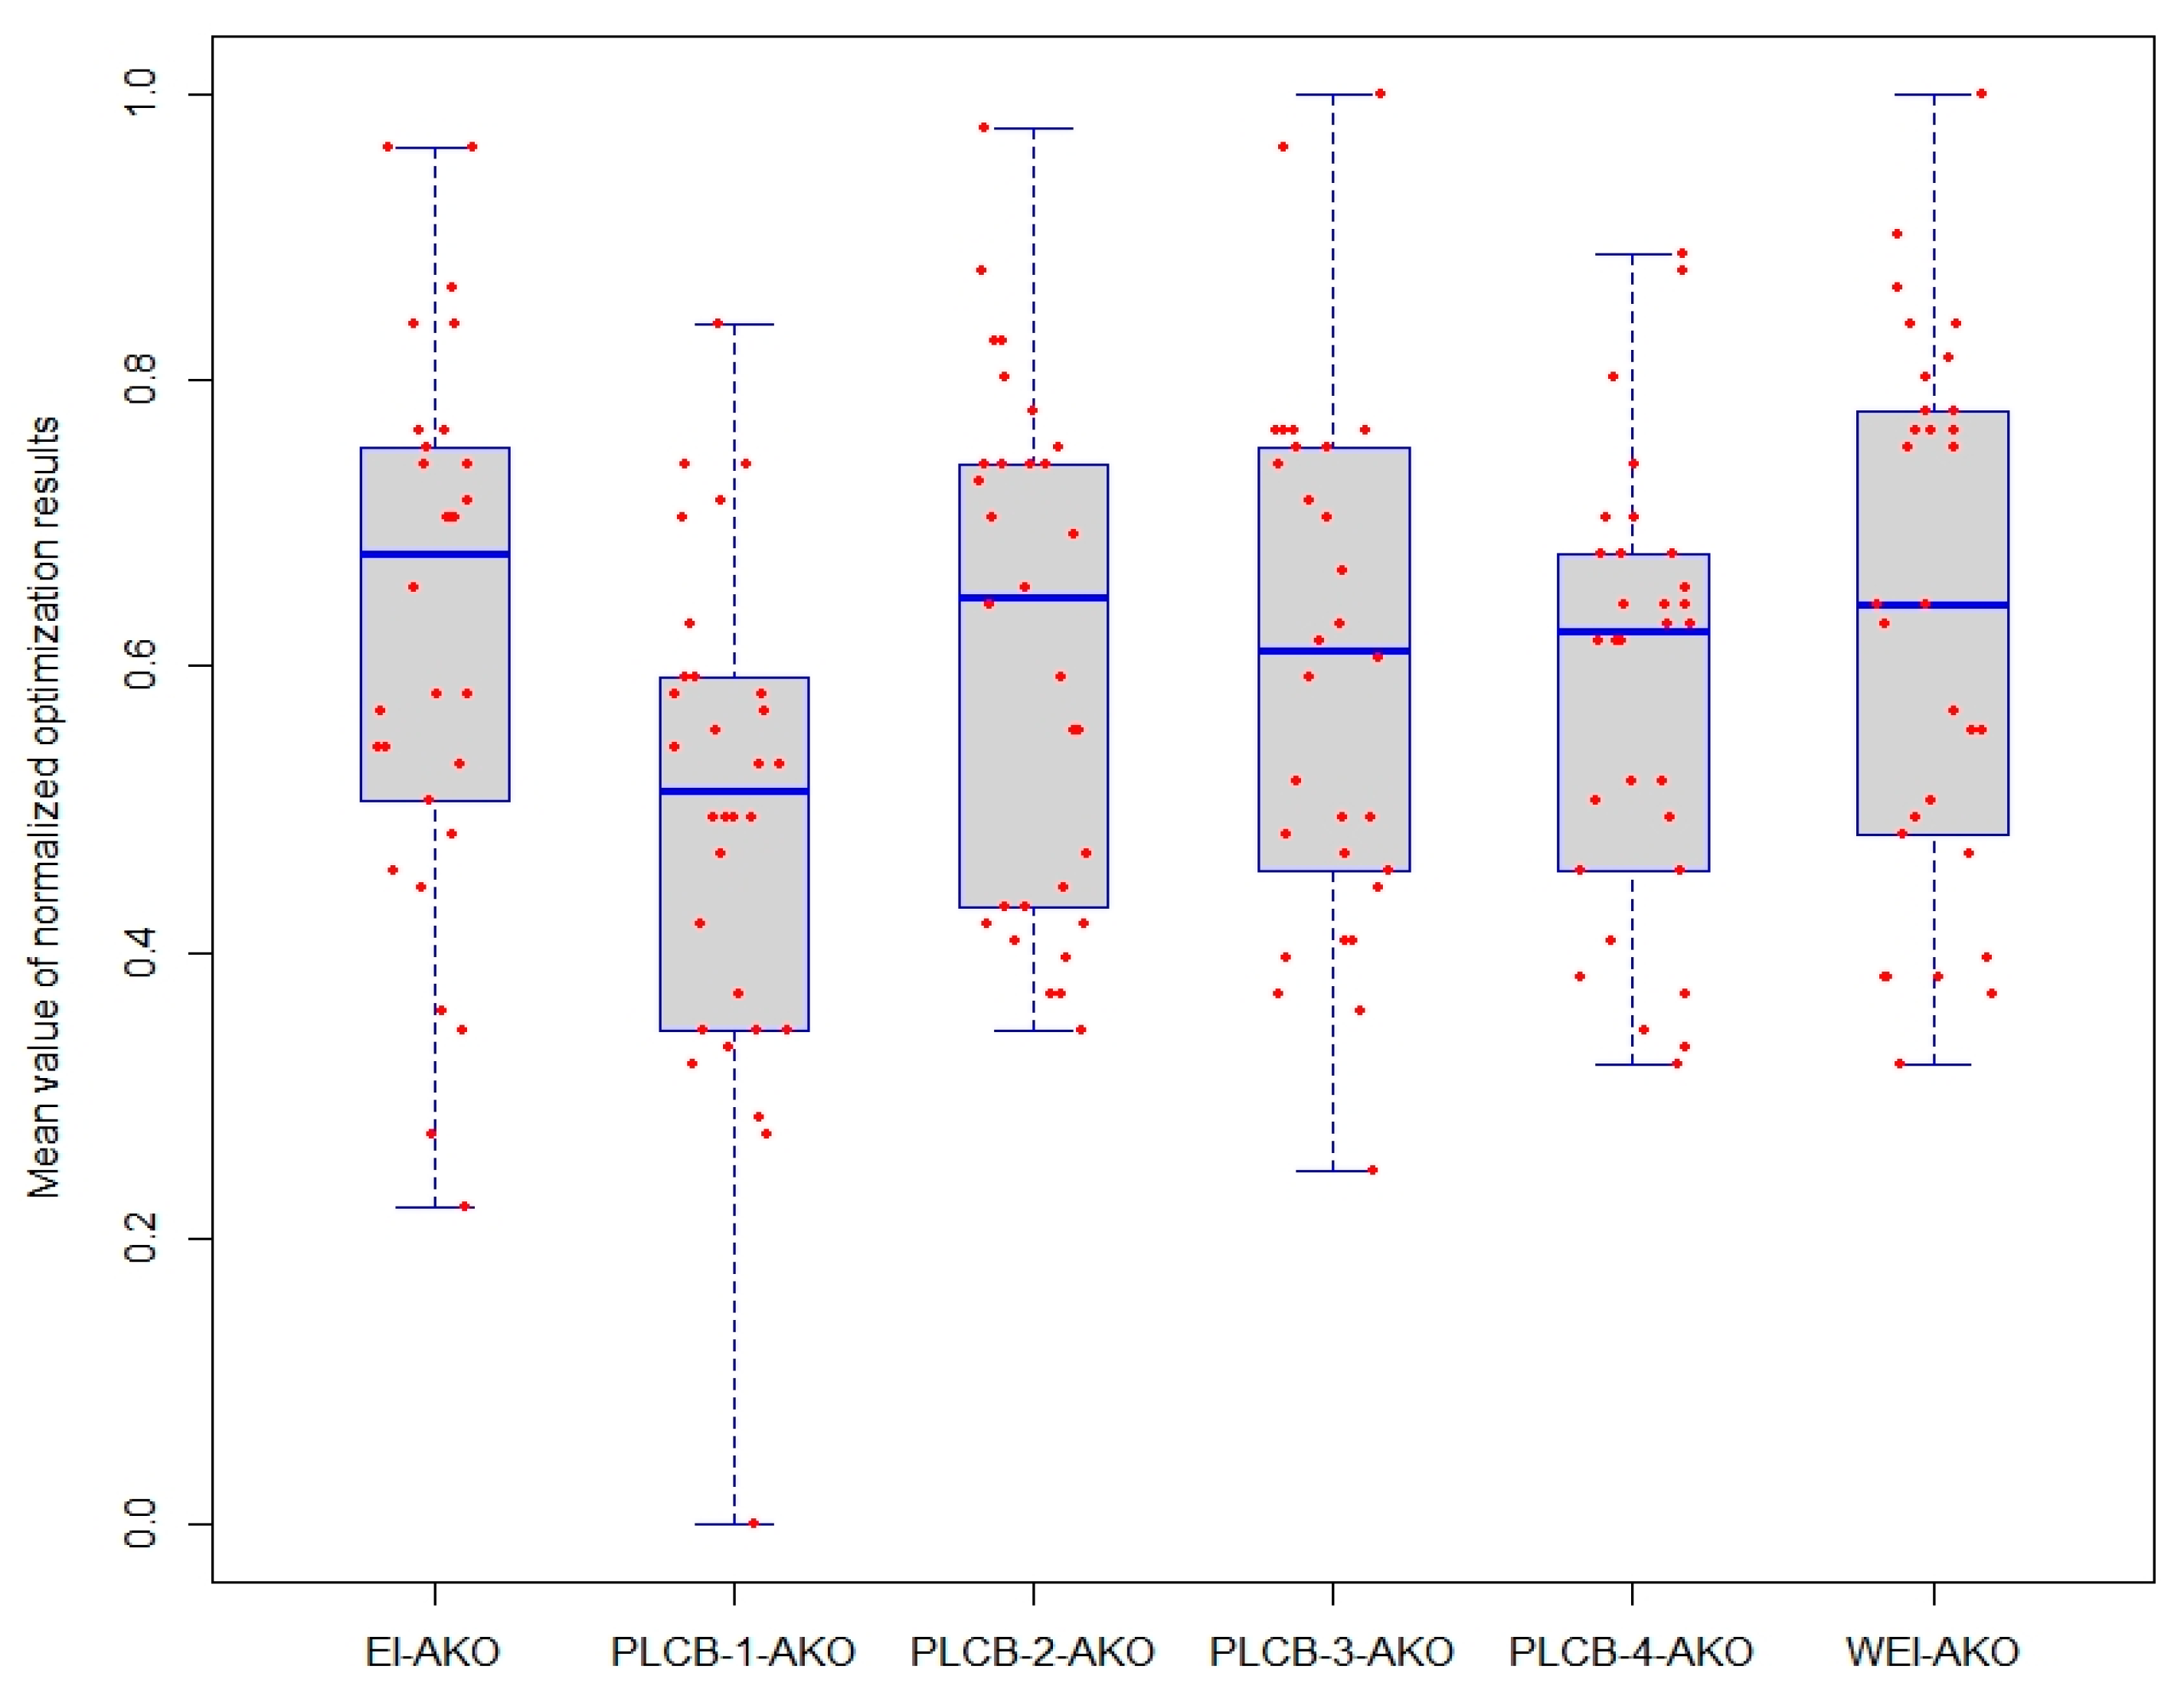
Different sequential sample infill strategies are compared in order to determine the most effective infill strategies for the suggested strategy. The original LCB [15] and the often used Expected improvement (EI) and extensions of EI (weighted EI, WEI), which have received a lot of attention over the last 10 years [34], are explored and compared with the suggested PLCB. The original LCB, EI, and weighted EI computations as well as the PLCB regulating functions as expressed in Equations (15)–(18) are also carried out in the Matlab environment. For each strategy, the same initial samples are located using the LHD method. PLCB, LCB, EI, and weighted EI are used to implement the sequential sampling technique. For simplicity, EI infill strategy within the proposed adaptive Kriging optimization is abbreviated to EI-AKO. Similar phrases include LCB-AKO for original LCB and WEI-AKO for weighted EI in adaptive Kriging optimization. Each technique was used 30 times separately to remove chance. Table 4 shows the mean and variance of normalized optimization outcomes obtained using various methods, where PLCB-1, PLCB-2, PLCB-3, and PLCB-4, respectively, stand for the controlling formulations in Equations (12)–(15). Figure 8 shows a box plot of the experimental data. The proposed PLCB-1-AKO approach clearly achieved the minimal mean of optimization.
Table 4.
Mean and variance via different approaches.
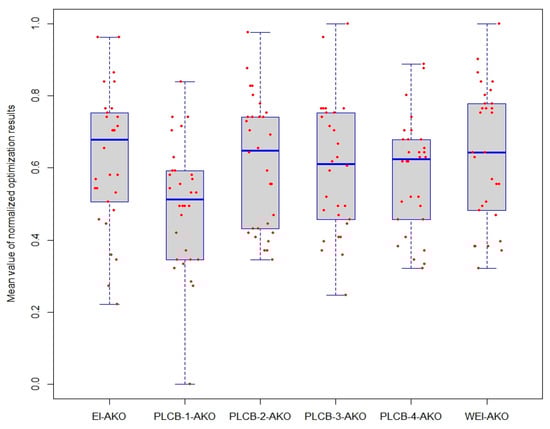
Figure 8.
Box plot of normalized optimization results through different approaches.
Figure 9 depicts the lifetime power generation of different schemes when the cut-off temperature of current generation is 393.15 K. As the result of the adaptive Kriging-based method will not be exactly the same during each run, the average of total power generation obtained via EI-AKO, PLCB-AKO, WEI-AKO are demonstrated in Figure 9, which indicates little difference in total power generation, namely, 4.13 × 10⁹ MJ, 4.23 × 10⁹ MJ, 4.29 × 10⁹ MJ, respectively.
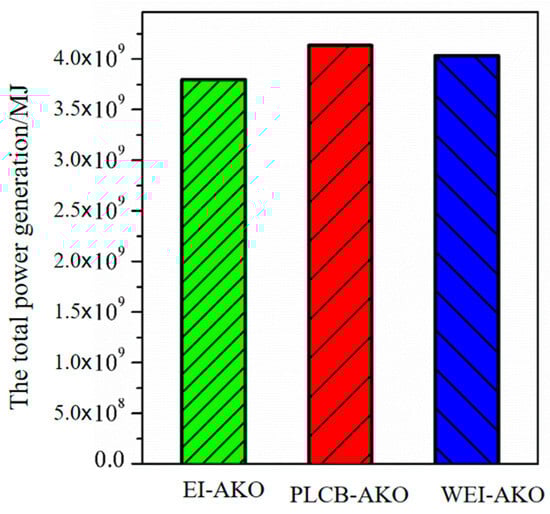
Figure 9.
Lifetime power generation of different schemes.
The six aforementioned solutions are contrasted with one another in order to discover the optimal sample infill technique. The six sample infill procedures were subjected to the Friedman test [35,36], a well-known and often-employed non-parametric statistical test suited for multiple comparisons. Table 5 lists the results of the Friedman test’s individual rankings and p-value calculations. Table 5 obviously demonstrates that the PLCB-1-AKO technique has a higher optimization statistical outcome among the evaluated options. The PLCB-1-AKO approach that has been suggested is suitable for the problem of optimizing heat generation performance.
Table 5.
Results obtained through the Friedman test for different approaches.
The Wilcoxon signed ranks tests [35,37], a non-parametric statistical test for pairwise comparisons, were adopted in this work to further investigate which of the five infill strategies is statistically different with respect to the suggested adaptive Kriging-based heat production performance optimization approach. The Wilcoxon signed ranks test findings for a pairwise comparison of the six alternative techniques are presented in Table 6 as a summary. The p-values in Table 6 show that, at the 0.05 level of significance, the suggested PLCB-1-AKO technique is statistically superior to alternative strategies.
Table 6.
Results obtained through the Wilcoxon signed ranks for different approaches.
4. Conclusions
In this research, a heat production performance optimization issue is addressed by combining an adaptive Kriging approximation with numerical simulations. An adaptive Kriging-based heat production performance optimization is developed for a two-horizontal-well geothermal system with rectangular multi-parallel fractures. The heat production performance optimization problem is formulated with Kriging approximation of heat generation power calculation. A PLCB-based adaptive strategy is introduced to update the Kriging approximation to balance the optimization accuracy and efficiency with newly located sampling points. The comparison with the Kriging-based optimization method shows that the suggested PLCB-based optimization method uses far fewer computer simulations and reduces the computational load significantly. The outlet temperature curve obtained with PLCB-AKO-1 rose for a longer time and dropped to 393.15 K at 27.16 a, while the heat generation power curve reached a stable output of 5.2 MW without a downward trend. Additionally, a comparison of other infill tactics shows that the suggested approach, which uses a control function that monotonically decreases and oscillates, achieves the best statistical optimization outcome. In the future, the heat losses and exchange in the tube segment from and to the ground surface would be taken into consideration in the heat production performance optimization problem for a two-horizontal-well geothermal system. A stochastic representation of the fracture distances and apertures considering the fracture surface roughness would be another interesting research direction.
Author Contributions
H.L. conceptualized this work and wrote the manuscript; J.Z. established the numerical model and completed the simulation; W.S. provided financial support for this study, B.D. participated in data analysis and manuscript writing. All authors have read and agreed to the published version of the manuscript.
Funding
This research was supported by The National Key Research and Development Programs of Henan Province, grant number 231111320800, The Open Fund of Shanghai Shallow Geothermal Energy Engineering Technology Center, grant number DRZX-202303, Geological Exploration Project of Qinghai Province Bureau of Geology and Mineral Exploration and Development, grant number Qingdikuangke [2023] No. 33, Qinghai Provincial Party Committee Talent Work Leading Group, grant number Qingrencaizi [2023] No. 1.
Institutional Review Board Statement
Not applicable.
Informed Consent Statement
Not applicable.
Data Availability Statement
All data, models, or code that support the findings of this study are available from the corresponding author upon reasonable request.
Conflicts of Interest
The authors declare that they have no competing interests.
References
- Li, P.; Guan, P.; Zheng, J.; Dou, B.; Tian, H.; Duan, X.; Liu, H. Field Test and Numerical Simulation on Heat Transfer Performance of Coaxial Borehole Heat Exchanger. Energies 2020, 13, 5471. [Google Scholar] [CrossRef]
- Goričanec, D.; Ivanovski, I.; Krope, J.; Urbancl, D. The Exploitation of Low-Temperature Hot Water Boiler Sources with High-Temperature Heat Pump Integration. Energies 2020, 13, 6311. [Google Scholar] [CrossRef]
- Zheng, J.; Li, P.; Dou, B.; Fan, T.; Tian, H.; Lai, X. Impact research of well layout schemes and fracture parameters on heat production performance of enhanced geothermal system considering water cooling effect. Energy 2022, 255, 124496. [Google Scholar] [CrossRef]
- Zhang, B.; Tian, H.; Dou, B.; Zheng, J.; Chen, J.; Zhu, Z.; Liu, H. Macroscopic and microscopic experimental research on granite properties after high-temperature and water-cooling cycles. Geothermics 2021, 93, 102079. [Google Scholar] [CrossRef]
- Caf, A.; Urbancl, D.; Trop, P.; Goricanec, D. Exploitation of low-temperature energy sources from cogeneration gas engines. Energy 2016, 108, 86–92. [Google Scholar] [CrossRef]
- Zheng, J.; Fan, T.; Dou, B.; Cui, G.; Tian, H. A Thermal-Hydraulic-Mechanical Coupling Simulation of Fluid Flow and Heat Transfer Specifically in Crossed-Rough Fractures in a Geothermal Reservoir. J. Energy Eng. 2022, 148, 04022032. [Google Scholar] [CrossRef]
- Aliyu, M.D.; Chen, H.-P. Optimum control parameters and long-term productivity of geothermal reservoirs using coupled thermo-hydraulic process modelling. Renew. Energy 2017, 112, 151–165. [Google Scholar] [CrossRef]
- Zhang, C.; Jiang, G.; Jia, X.; Li, S.; Zhang, S.; Hu, D.; Hu, S.; Wang, Y. Parametric study of the production performance of an enhanced geothermal system: A case study at the Qiabuqia geothermal area, northeast Tibetan plateau. Renew. Energy 2019, 132, 959–978. [Google Scholar] [CrossRef]
- Wang, G.; Song, X.; Shi, Y.; Yang, R.; Yulong, F.; Zheng, R.; Li, J. Heat extraction analysis of a novel multilateral-well coaxial closed-loop geothermal system. Renew. Energy 2021, 163, 974–986. [Google Scholar] [CrossRef]
- Wang, G.; Song, X.; Shi, Y.; Zheng, R.; Li, J.; Li, Z. Production performance of a novel open loop geothermal system in a horizontal well. Energy Convers. Manag. 2020, 206, 112478. [Google Scholar] [CrossRef]
- Zheng, J.; Shao, X.; Gao, L.; Jiang, P.; Li, Z. A hybrid variable-fidelity global approximation modelling method combining tuned radial basis function base and kriging correction. J. Eng. Des. 2013, 24, 604–622. [Google Scholar] [CrossRef]
- Schnoerr, D.; Sanguinetti, G.; Grima, R. Approximation and inference methods for stochastic biochemical kinetics—A tutorial review. J. Phys. A Math. Theor. 2017, 50, 093001. [Google Scholar] [CrossRef]
- Shuai, W.; Li, E.; Wang, H.; Li, Y. Space mapping-assisted optimization of a thin-walled honeycomb structure for battery packaging. Struct. Multidiscip. Optim. 2020, 62, 937–955. [Google Scholar] [CrossRef]
- Blatman, G.; Sudret, B. Efficient computation of global sensitivity indices using sparse polynomial chaos expansions. Reliab. Eng. Syst. Saf. 2010, 95, 1216–1229. [Google Scholar] [CrossRef]
- Zheng, J.; Li, Z.; Gao, L.; Jiang, G. A parameterized lower confidence bounding scheme for adaptive metamodel-based design optimization. Eng. Comput. 2016, 33, 2165–2184. [Google Scholar] [CrossRef]
- Zheng, J.; Lu, C.; Li, Z.; Jiang, G.; Zhao, H. Adaptive metamodel-based analytical target cascading for natural gas hydrates coring tool design optimization. Eng. Optim. 2021, 54, 1089–1109. [Google Scholar] [CrossRef]
- Hu, W.; Yao, L.G.; Hua, Z.Z. Optimization of sheet metal forming processes by adaptive response surface based on intelligent sampling method. J. Am. Acad. Dermatol. 2008, 197, 77–88. [Google Scholar] [CrossRef]
- Serani, A.; Pellegrini, R.; Wackers, J.; Jeanson, C.-E.; Queutey, P.; Visonneau, M.; Diez, M. Adaptive multi-fidelity sampling for CFD-based optimisation via radial basis function metamodels. Int. J. Comput. Fluid Dyn. 2019, 33, 237–255. [Google Scholar] [CrossRef]
- Li, M.; Gou, Y.; Hou, Z.; Were, P. Investigation of a new HDR system with horizontal wells and multiple fractures using the coupled wellbore–reservoir simulator TOUGH2MP-WELL/EOS3. Environ. Earth Sci. 2015, 73, 6047–6058. [Google Scholar] [CrossRef]
- Yu, P.; Dempsey, D.; Archer, R. A three-dimensional coupled thermo-hydro-mechanical numerical model with partially bridging multi-stage contact fractures in horizontal-well enhanced geothermal system. Int. J. Rock Mech. Min. Sci. Géoméch. Abstr. 2021, 143, 104787. [Google Scholar] [CrossRef]
- Gong, F.; Guo, T.; Sun, W.; Li, Z.; Yang, B.; Chen, Y.; Qu, Z. Evaluation of geothermal energy extraction in Enhanced Geothermal System (EGS) with multiple fracturing horizontal wells. Renew. Energy 2020, 151, 1339–1351. [Google Scholar] [CrossRef]
- Jiang, F.; Luo, L.; Chen, J. A novel three-dimensional transient model for subsurface heat exchange in enhanced geothermal systems. Int. Commun. Heat Mass Transf. 2013, 41, 57–62. [Google Scholar] [CrossRef]
- Rybdylova, O.; Al Qubeissi, M.; Braun, M.; Crua, C.; Manin, J.; Pickett, L.M.; De Sercey, G.; Sazhina, E.M.; Sazhin, S.S.; Heikal, M. A model for droplet heating and its implementation into ANSYS Fluent. Int. Commun. Heat Mass Transf. 2016, 76, 265–270. [Google Scholar] [CrossRef]
- Shaik, A.R.; Rahman, S.S.; Tran, N.H.; Tran, T. Numerical simulation of Fluid-Rock coupling heat transfer in naturally fractured geothermal system. Appl. Therm. Eng. 2011, 31, 1600–1606. [Google Scholar] [CrossRef]
- Xia, Y.; Plummer, M.; Mattson, E.; Podgorney, R.; Ghassemi, A. Design, modeling, and evaluation of a doublet heat extraction model in enhanced geothermal systems. Renew. Energy 2017, 105, 232–247. [Google Scholar] [CrossRef]
- Waples, D.W.; Tirsgaard, H. Changes in matrix thermal conductivity of clays and claystones as a function of compaction. Pet. Geosci. 2002, 8, 365–370. [Google Scholar] [CrossRef]
- Zhang, J.; Standifird, W.B.; Roegiers, J.-C.; Zhang, Y. Stress-Dependent Fluid Flow and Permeability in Fractured Media: From Lab Experiments to Engineering Applications. Rock Mech. Rock Eng. 2007, 40, 3–21. [Google Scholar] [CrossRef]
- Ma, Y.; Zhang, Y.; Huang, Y.; Zhang, Y.; Hu, Z. Experimental study on flow and heat transfer characteristics of water flowing through a rock fracture induced by hydraulic fracturing for an enhanced geothermal system. Appl. Therm. Eng. 2019, 154, 433–441. [Google Scholar] [CrossRef]
- Zeng, Y.-C.; Su, Z.; Wu, N.-Y. Numerical simulation of heat production potential from hot dry rock by water circulating through two horizontal wells at Desert Peak geothermal field. Energy 2013, 56, 92–107. [Google Scholar] [CrossRef]
- Cheng, Y.; Zhang, Y.; Yu, Z.; Hu, Z.; Ma, Y.; Yang, Y. Experimental and numerical studies on hydraulic fracturing characteristics with different injection flow rates in granite geothermal reservoir. Energy Sci. Eng. 2020, 9, 142–168. [Google Scholar] [CrossRef]
- Huang, W.; Chen, J.; Cen, J.; Cao, W.; Li, Z.; Li, F.; Jiang, F. Heat extraction from hot dry rock by super-long gravity heat pipe: Effect of key parameters. Energy 2022, 248. [Google Scholar] [CrossRef]
- Cheng, A.H.; Ghassemi, A.; Detournay, E. Integral equation solution of heat extraction from a fracture in hot dry rock. Int. J. Numer. Anal. Methods Géoméch. 2001, 25, 1327–1338. [Google Scholar] [CrossRef]
- Zeng, Y.-C.; Wu, N.-Y.; Su, Z.; Wang, X.-X.; Hu, J. Numerical simulation of heat production potential from hot dry rock by water circulating through a novel single vertical fracture at Desert Peak geothermal field. Energy 2013, 63, 268–282. [Google Scholar] [CrossRef]
- Kleijnen, J.P.C.; van Beers, W.; van Nieuwenhuyse, I. Expected improvement in efficient global optimization through bootstrapped kriging. J. Glob. Optim. 2011, 54, 59–73. [Google Scholar] [CrossRef]
- Derrac, J.; García, S.; Molina, D.; Herrera, F. A practical tutorial on the use of nonparametric statistical tests as a methodology for comparing evolutionary and swarm intelligence algorithms. Swarm Evol. Comput. 2011, 1, 3–18. [Google Scholar] [CrossRef]
- Zheng, J.; Lu, C.; Gao, L. Multi-objective cellular particle swarm optimization for wellbore trajectory design. Appl. Soft Comput. 2019, 77, 106–117. [Google Scholar] [CrossRef]
- Zheng, J.; Li, Z.; Dou, B.; Lu, C. Multi-objective cellular particle swarm optimization and RBF for drilling parameters optimization. Math. Biosci. Eng. 2019, 16, 1258–1279. [Google Scholar] [CrossRef]


Disclaimer/Publisher’s Note: The statements, opinions and data contained in all publications are solely those of the individual author(s) and contributor(s) and not of MDPI and/or the editor(s). MDPI and/or the editor(s) disclaim responsibility for any injury to people or property resulting from any ideas, methods, instructions or products referred to in the content. |
© 2024 by the authors. Licensee MDPI, Basel, Switzerland. This article is an open access article distributed under the terms and conditions of the Creative Commons Attribution (CC BY) license (https://creativecommons.org/licenses/by/4.0/).