Article

On the Footsteps of Active Faults from the Saronic Gulf to the Eastern Corinth Gulf: Application of Tomographic Inversion Using Recent Seismic Activity

by
Andreas Karakonstantis
1,* and
Filippos Vallianatos
1,2
1
Institute of Physics of the Earth’s Interior and Geohazards, UNESCO Chair on Solid Earth Physics and Geohazards Risk Reduction, Hellenic Mediterranean University Research Center (HMURC), 73133 Chania, Greece
2
Section of Geophysics–Geothermy, Department of Geology and Geoenvironment, National and Kapodistrian University of Athens, Zografou, 15784 Athens, Greece
*
Author to whom correspondence should be addressed.
Appl. Sci. 2024, 14(15), 6427; https://doi.org/10.3390/app14156427
Submission received: 2 July 2024 / Revised: 17 July 2024 / Accepted: 22 July 2024 / Published: 23 July 2024
(This article belongs to the Special Issue Advances in Geosciences: Techniques, Applications, and Challenges)

Abstract

:
This study examines the body-wave velocity structure of Attica, Greece. The region is located between two major rifts, the Gulf of Corinth and the Euboekos Gulf, and has experienced significant earthquakes throughout history. The distribution of seismic activity in the area necessitates a thorough investigation of geophysical properties, such as seismic velocities, to reveal the extent of significant fault zones or the presence of potential hidden faults. This case study utilized over 3000 revised events to conduct a local earthquake tomography (LET). P- and S-wave travel-time data were analyzed to explore small- to medium-scale (~10 km) anomalies that could be linked to local neotectonic structures. The study presents a detailed 3-D seismic velocity structure for Attica and its adjacent regions. The results of the study revealed strong lateral body-wave velocity anomalies in the upper crust were related to activated faults and that a significant portion of the observed seismicity is concentrated near the sites of the 1999 and 2019 events.

1. Introduction

Greece, located at the southeastern end of Europe, has been a witness to significant geological processes, such as the Alpine orogeny, which led to the uplift of major mountain ranges like the Dinaric Alps and the Pindus mountain range. This orogenic phase was also the driving force behind the formation of complex tectonic structures. The Hellenic Arc, a prime example of this, is a fascinating mix of thrust tectonics, strike-slip faulting, and normal faults in the back-arc region (Figure 1). These tectonic structures are a testament to the ongoing geological activity in the region [1,2].
This study centers on Attica Prefecture and neighboring areas, which are significant due to their location between two major rifts, the Gulf of Corinth and the Euboekos Gulf. Several studies indicate that the present tectonic system in Central Greece is due to back-arc extension and transtensional tectonic regimes [3,4,5,6,7]. The morphotectonic structure of the Attica region is intricate, consisting of tectonic horsts and grabens. The primary fault zones are Kifissos, Aegaleo–Parnitha, and Thriassio–Kamatero (Figure S1).
Figure 1. Main tectonic features in Greece and Western Turkey. The purple rectangle contains the study area. Abbreviations—HT: Hellenic Trench; NAT: North Aegean Trough; SAVA: South Aegean Volcanic Arc; CLTFZ: Cephalonia–Lefkas Transform Fault Zone; CG: Corinth Gulf. Fault traces (red lines) derived by [8,9]. Black and white arrows indicate trend of the major (S1) and minor (S3) principal stress axes; yellow arrows show the strike-slip motion on the projected faults [10].
Applsci 14 06427 g001
The Athens area has been primarily affected by earthquakes located at distances <100 km outside the city, with most of them occurring near the coasts of the Eastern Gulf of Corinth, according to historical evidence. Among the largest recent earthquakes was a sequence of three Mw > 6.0 earthquakes that took place in 1981 in the Eastern Gulf of Corinth [11,12,13]. Since 1984, the largest recorded earthquake in the area has been an MS = 4.5 event, lasting for around 15 years [14]. However, on 7 September 1999, an earthquake with a magnitude of 6.0 struck 20 km NW of Athens, on the southern slopes of the Parnitha Mountain [15,16,17,18,19,20] (Figure 2; Table S1). This event caused significant damage to the Greek capital, with over 100 buildings collapsing, 143 fatalities, and an estimated cost of over USD 3 billion. In the aftermath of the Athens earthquake in 1999, studies have highlighted a significant horizontal element on the marginal faults of the Athens basin and an uplift of the SE slopes of Mt Parnitha, caused by block rotation [3,4,5,6,7].
In the following period, seismicity was notably limited in both number and size range (ML < 4.5). Among the few instances, a cluster was observed in Villia near the Eastern Corinth Gulf [21,22], and some scattered seismic activity was recorded on the southern coasts of Attica. Ref. [23] further highlighted the occurrence of spatial clusters on the Fyli and Thrakomakedones faults, a rare phenomenon. Additionally, a significant portion of the recorded microseismicity was located in the Thriassion basin, in hypocentral depths ~20 km. Nearly twenty years after the Mw = 6.0 earthquake, a seismic event with a moderate magnitude (Mw = 5.1) took place in the NW of the Thriassio basin. The location of the aftershocks was mainly observed near the mainshock’s hypocenter, while some other events were clustered at the central part of the Thriassio basin, near the location of the 7 September 1999 mainshock [24]. Severe damages were accounted for in the western outskirts of Athens despite the magnitude of the event [25].
Figure 2. Distribution of focal mechanisms of the significant earthquakes that occurred between 1981 and 2019 (M > 5.0) [26]. The color of the focal mechanism represents the depth (km) of each event. The details of the focal mechanism solutions are shown in the Supplementary Material, Table S1. Abbreviations—ECG: Eastern Corinth Gulf; SEvG: Southern Evia Gulf; TNF: Thriassion Normal Fault; FyNF: Fyli Normal Fault; PNF: Palaiokoudoura Normal Fault. Fault traces as in Figure 1.
Applsci 14 06427 g002
In recent years (2020–today), more than 3000 events have been situated in the following areas:
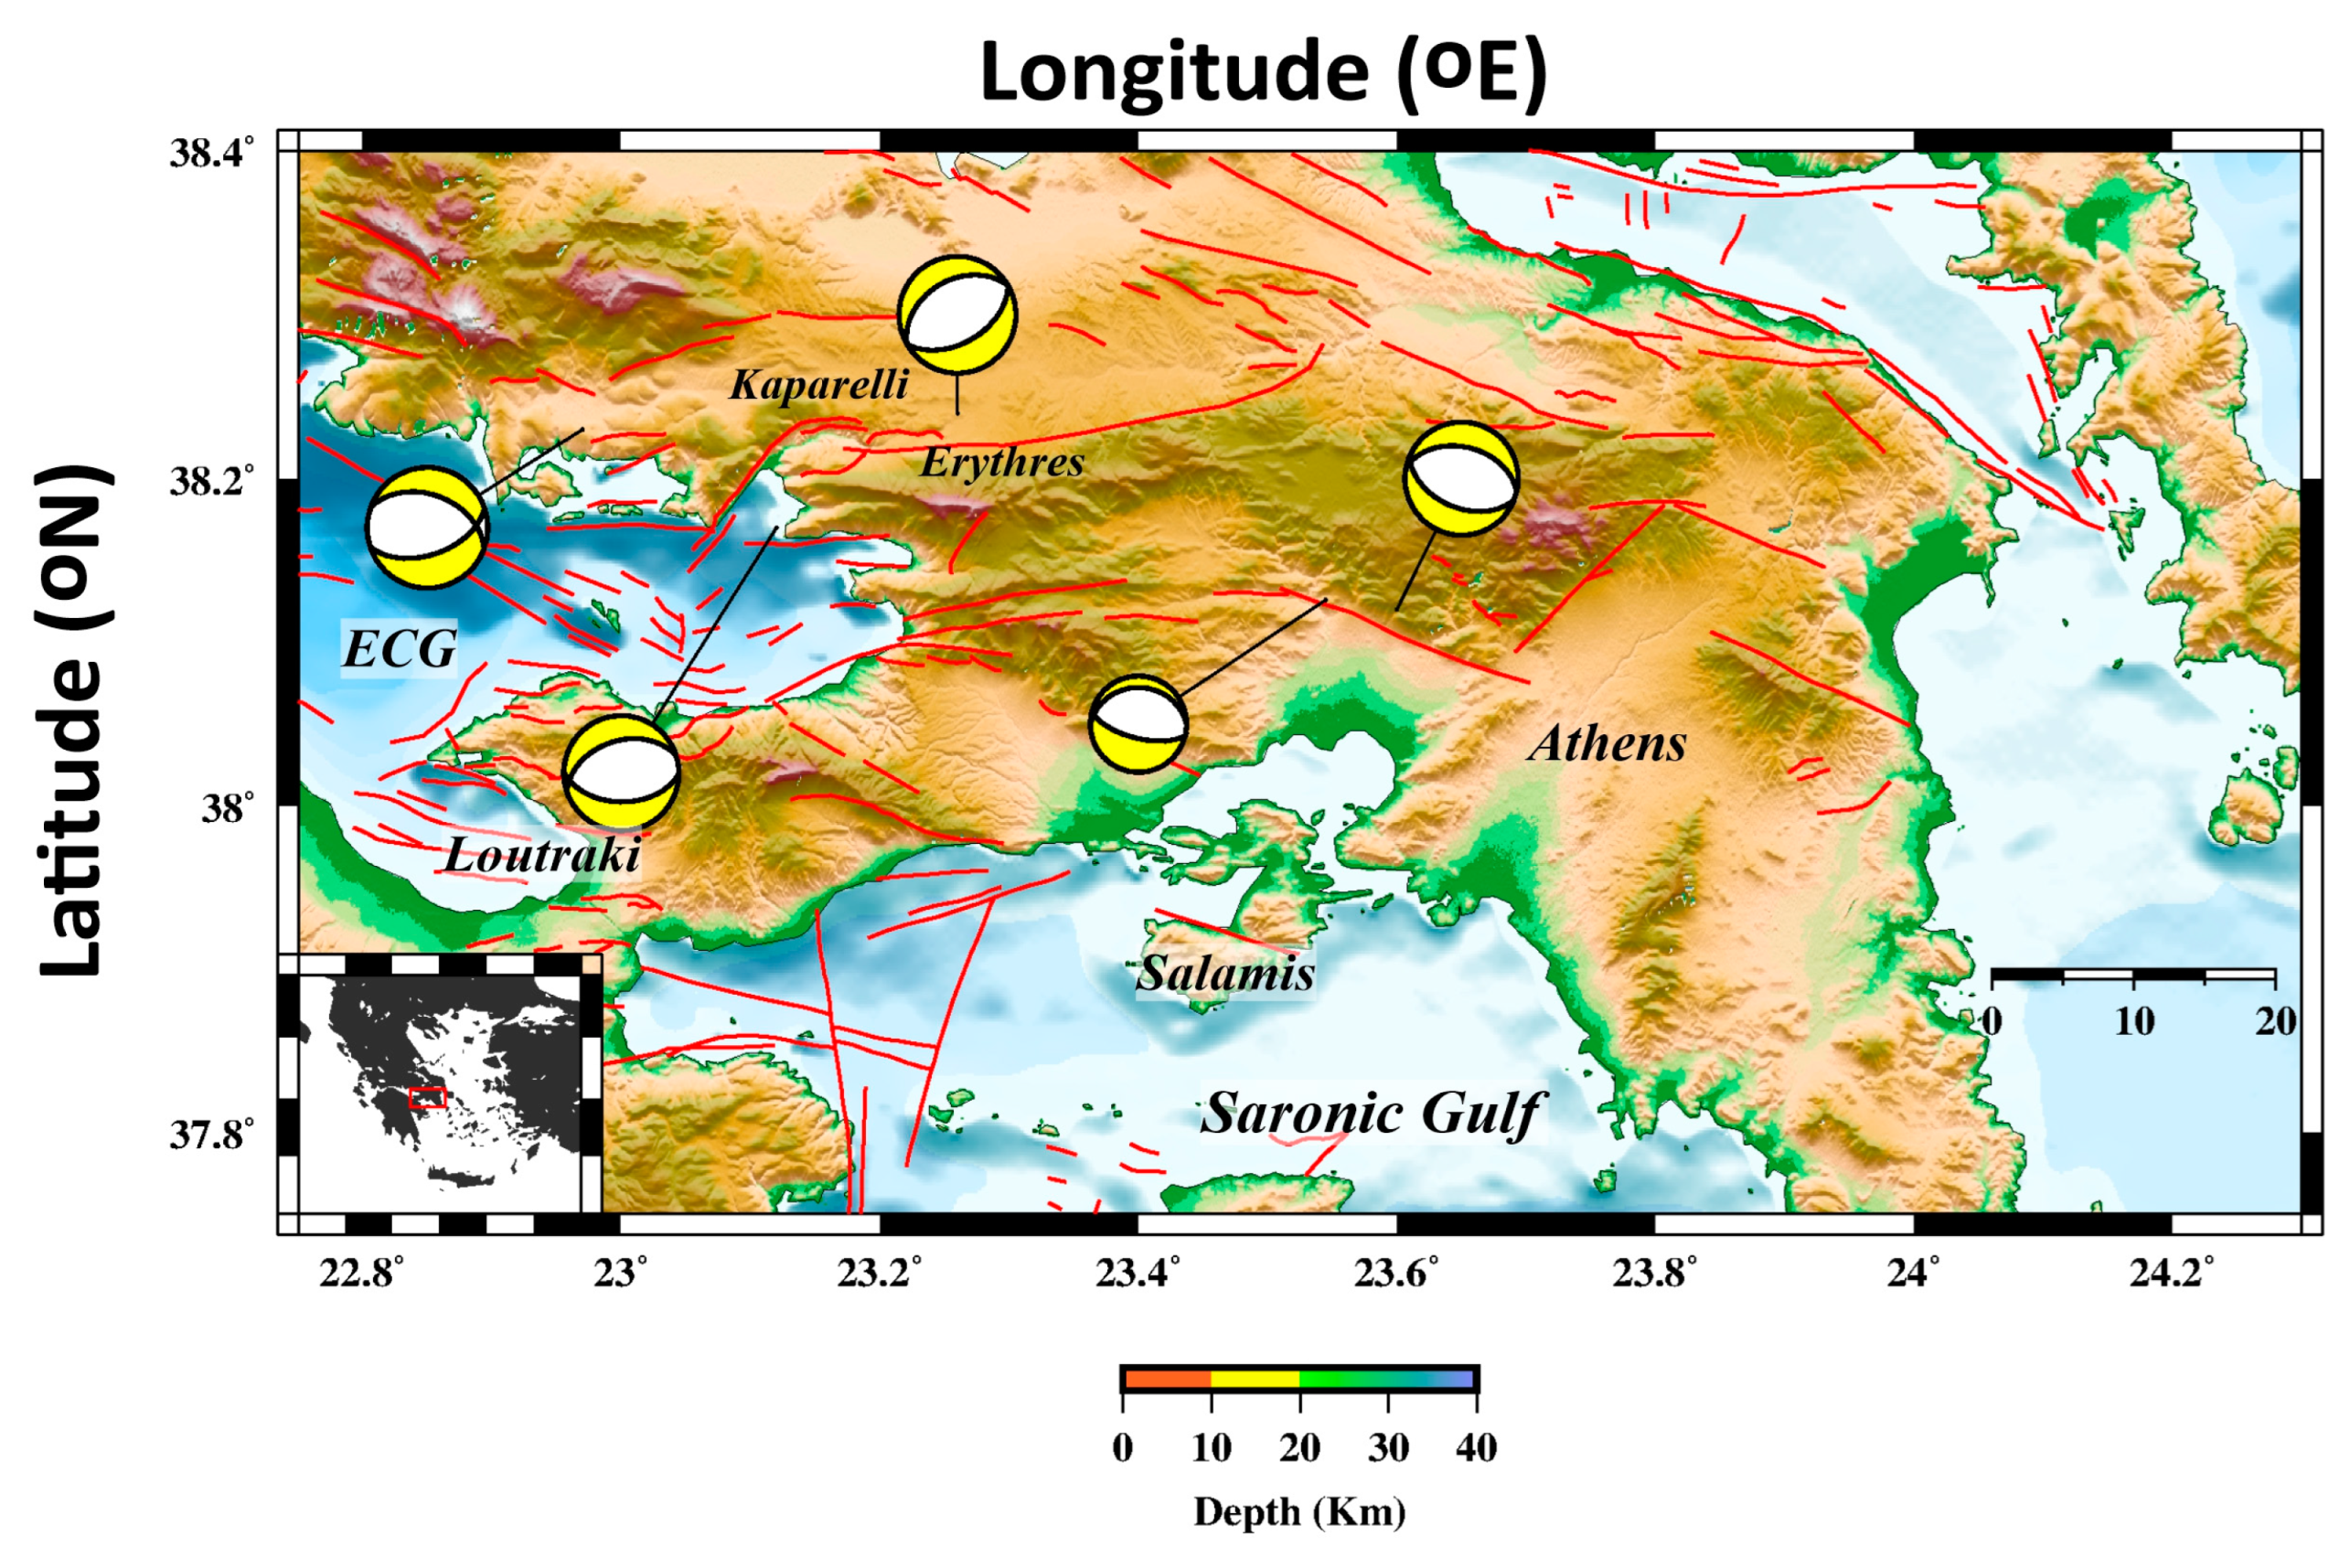
The Perachora peninsula (Eastern Corinth Gulf), where an intense earthquake sequence was initiated during the 2020–2021 time interval, presenting the characteristics of swarm activity [27].
The southern shores of Attica, in an area of approximately WNW–ESE direction, between Piraeus and Glyfada.
The area along the Leuces islands, north of Aegina.
The northern suburbs, near the Olympic facilities, near the ML = 3.2 event that occurred on 16 January 2015.
The region between Mt Penteli and Marathon Bay [28].
The Thriassion plain and its extension in the Athens basin.
A notable spatiotemporal earthquake cluster was located along the southern shores of Attica. The most notable events in this region occurred on 7 and 13 October 2023, with ML = 3.9 and 3.8, respectively, in the area east of Keratea (SE Attica).
While most earthquakes occur on faults with surface expression, some have been identified in areas where this does not apply, such as the cluster of earthquakes in the northern suburbs of the city. Blind faults in major cities are a type of fault that can be difficult to detect and monitor. Unlike surface faults, which can be identified by visible features such as cracks or ridges on the ground, blind faults do not have any surface expression. The utilization of earthquake tomography as a technique to identify this kind of structure in metropolitan areas can be extremely beneficial for city planners and emergency management officials.
The study is focused on the investigation of the crustal structure in Attica and nearby areas near the Eastern Corinth Gulf, utilizing manually located events. To gain a comprehensive understanding of the local fault systems, we used P- and S-wave travel-time data from over 3000 seismic events recorded by the Hellenic Unified Seismological Network (HUSN) [29]. These seismic events were recorded between 2018 and the present day, providing us with an extensive and rich dataset. With this dataset, we were able to meticulously examine the intricate details of the local fault systems. These findings form the backbone of our research, enabling us to gain valuable insights into the local faults and geology.

2. Dataset and Methodology

This study focuses on Attica and its neighboring areas in Central Greece. Several permanent Hellenic Unified Seismological Network (HUSN) stations operate in this area, complemented by 6 temporary stations of the Geodynamics Institute of the National Observatory of Athens (GI-NOA), around the 19 July 2019 aftershock zone. The earthquake catalog consists of 3468 earthquakes (1 January 2019–25 March 2024), with local magnitude (ML) ranging between 0.6 and 5.1, recorded by the broad-band and strong motion stations of the Hellenic Unified Seismological Network (HUSN; http://eida.gein.noa.gr/ (accessed on 31 March 2024) [30,31,32,33,34,35]). The hypocentral parameters were determined using a local 1-D velocity model proposed by [24] (Figure 3).
The data selection was performed under the following criteria:
  • The nearest station epicentral distance should be less than 50 km.
  • The number of the P- and S-arrival picks per event should be equal to or larger than 10.
  • Temporal residual should not be larger than 0.4 s.
The application of these criteria led to a slightly reduced dataset of 3397 seismic events, including 42,122 P and 32,738 S picks (Figure S2).
In the framework of this study, the analysis was performed using the LOcal TOmographic Software (LOTOS-12) by [36]. The program provides us with two options: either the VP–VS scheme, using P and S travel-time residuals (dtP and dtS), or the VP–VP/VS scheme, selecting the available dtP and differential residuals, dtS − dtP. During the tomographic inversion, we used both schemes to obtain more information as they matter for the VP and VS anomalies [36,37]. Body-wave travel times and ray paths (Figures S2–S6) were calculated based on the bending method as proposed by [38]. The calculations are extensively described in supportive material (Section 2).
The procedure was performed simultaneously for the body-wave velocities, as well as for the source parameters (dx, dy, dz, and dt) and the station corrections. The LSQR algorithm was used for the inversion [39]. The stability of the procedure was controlled by damping and flattening. To minimize the differences in the solutions from neighboring nodes, we employed a technique to flatten the velocity anomalies. This was achieved by adding equations with two non-zero elements having opposite signs, corresponding to all pairs of neighboring nodes. The best values for the flattening parameters were determined through synthetic modeling for the most accurate model recovery. It is important to note that the number of iterations has a similar effect to damping changes. Therefore, we consistently applied five iterations and only adjusted the flattening parameters. In total, we used five iterations to derive the final models.
The resolution of the available dataset was evaluated using the checkerboard synthetic test [40] and it is described in the supportive information (Section 3; Figures S7–S12). This method involves applying alternating anomalies of positive and negative velocity perturbations on a 1-D gradient model that is evenly distributed in a checkerboard pattern throughout the model. The optimal values for P- and S-wave amplitude damping and smoothing, as well as the corrections for station and source coordinates and origin times, were determined based on the results of these tests, as described in [36,41,42].

3. Results

The obtained body-wave travel-time residuals are shown in Figure 4. The initial P-wave travel time residuals were mainly distributed in the range of ±0.75 s, and the average travel time residuals were 0.26 s. In comparison, the P-wave travel time residuals were mainly distributed in the range of 0.5 s after relocation, and the average residuals were reduced to 0.17 s. Figure 4b shows the residuals of the initial and the final S-wave travel times (Table 1).
In Figure 5, the eight (8) performed cross-sections are projected in map view (seven in NE–SW orientation and the last one in WNW–ESE orientation).
Figure 6, Figure 7 and Figure 8 depict the distribution of body-wave velocity perturbations (%), as well as the VP/VS ratio in four horizontal slices at depths 5, 10, 15, and 20 km. Additionally, eight (8) cross-sections, seven (7) perpendicular to the Parnitha faults and one (1) parallel to these tectonic features, are shown in Figure 9, Figure 10, Figure 11, Figure 12 and Figure 13. The interpretation of the obtained velocity anomalies is limited to model portions with satisfactory reconstruction of the checkerboard and ray coverage. For P-waves, velocity perturbations range from ±10% in the shallow depth layers, while S-waves show changes of up to ±15%. The VP/VS ratio varies between 1.65 and 2.01 (as shown in Figure 8). The 3-D inversion results can be confidently interpreted as the velocity models have high resolution and dense ray coverage down to 20 km depth (as shown in Figures S3 and S4).
According to tomograms between 5 and 15 km depth, the negative body-wave (dVP, dVS) velocity anomalies (%) were mainly found in the Thriassion and Megara basins, as well as the Athenian plain. On the other hand, the positive velocity anomalies were mainly associated with the areas that are located near the mountain masses of Parnitha, Aegaleo, and Geraneia mountains. This pattern was also observed in past studies in Attica [43,44,45], which adds to the model’s credibility. In the tomogram of 5 km depth, near Thriassion basin, we can see relatively low VP/VS ratio values (~1.68), while in deeper parts of the crust (depth slices of 10 and 15 km), these rise more than 1.80. The same distribution appears in the Athenian plain and Megara basin. Strong lateral body-wave velocity anomalies were primarily identified at depths of 5 and 10 km. This is likely due to the concentration of seismic events in this area, which could be introducing larger anomalies. This underscores the relevance of our research, as understanding these results could provide valuable insights into the seismic activity of this region. At a shallower depth, a WNW–ESE zone of negative S-wave velocity perturbations is observed on the eastern edge of the region (Figure 7). This observation could be linked to the offshore S-SE Attica faults that were activated during this period. At 20 km depth, this image tends to change with a positive anomaly extended from the Athenian plain in the east to the Eastern Corinth Gulf to the west, near the differentiation of the average direction of the local faults from WNW–ESE to approximately NE–SW. The general picture of both body-wave velocity and VP/VS ratio anomalies appears to be well correlated with medium- to large-scale (>10 km) faults. The interpretation of these results is more difficult in the central, eastern Saronic Gulf and southeastern Attica, mainly due to poor ray coverage (region east of Keratea), which results in limited resolution and hinders the analysis of the spatial clusters that occurred in the period of study.
Profiles of VP and VP/VS are crucial in providing further constraints on the crustal structures of Attica Prefecture since they have yielded significant findings. Figure 9, Figure 10 and Figure 11 present the vertical distribution of P and S velocity perturbations (%) as well as the VP/VS ratio values. From WNW to ESE, profiles 1 to 7 demonstrate the different faults we encounter, the relation between the surface expression of these tectonic elements, and the gradual deepening of some of these faults in the Athenian plain (profiles 5–7). Despite the relatively low ray coverage at the SE of the area, inside the Athenian plain, profiles 5, 6, and 7 reveal a clear south-dipping fault plane in the tomographic images of the absolute body-wave velocities (Figure 12 and Figure 13). More specifically, between the 9 and 16 km depth range, we can observe some sharp contrasts of body-wave perturbations (~5–6%), VP/VS, and absolute velocities in profiles 6 and 7 (Figure 9, Figure 10, Figure 11, Figure 12 and Figure 13).
As we move inside the basin, these observations appear differentiated from the ones of the west (TNF), interrupting the continuity of the Thriassion fault zone. This discontinuity cross-cuts the Athenian basin and can be associated with the activity observed since the 16 January 2015 ML = 3.2 earthquake. This zone emerged after geophysical investigations and minor faults in Central and Western Attica [43].
The velocity structure throughout the area at shallow depths (~5 km) is expressed by higher values of VP anomalies (%) and high VP/VS ratio values (>1.85). This is mainly related to unconsolidated Plio-Pleistocene and Holocene formations [7,46] (Figure S1), such as the ones on the southern shores of Attica.
Profiles 1–8 show a negative P-wave anomaly (~−8%) between 0 and 15 km depth in the NE and SW edges. The velocity anomalies (15–25 km distance in the sections), combined with the high VS anomalies, form an area of lower VP/VS ratio in this rectangular region (~1.70–1.74).
On 19 July 2019, the Mw = 5.1 earthquake occurred in an area that is characterized by a low body-wave velocity perturbation of about −10%. This anomaly is seen in both P and S models at a depth of 10–14 km in profile 8. At shallower depths in the same area, positive anomalies are seen, which indicates higher absolute body-wave velocities. The main shock of that sequence was located at a depth of approximately 8 km and coincided with the boundary where high- and low-velocity anomalies meet. When these anomalies are transformed into absolute velocities, the highest VP of 6.7 km/s is observed at a depth of nearly 20 km in the same area. On the other hand, the lower to minimum values of VP (4.9–5.2 km/s) are observed in the shallower eastern half of the study area, where younger sediments are located, and at a depth of around 12 km, east of Thrakomacedones, where the plioseismal area was situated.

4. Discussion and Conclusions

In this study, we present the results of the seismic tomography study in the Attica region in Greece, focusing on the 3-D distribution of P- and S-wave velocity anomalies and the VP/VS ratio. The data used come from a part of Greece that is densely covered by seismic stations of HUSN. The inversion results were evaluated in terms of their fidelity with checkerboard synthetic tests, and the trustworthy region was defined based on the ray coverage. The interpretation of the velocity anomalies and ratios focused on their relation to the region’s known tectonic structures and seismic activity.
The results highlight distinct velocity anomalies and patterns in different depths, which are interpreted concerning the region’s tectonic structures and seismic activity. The shallow negative velocity anomalies obtained in the region are primarily found in sedimentary basins (Thriassion, Megara, Athenian plain), while positive anomalies are associated with mountainous areas (Parnitha, Aigaleo, Geraneia). The VP/VS ratio shows lateral variations, with lower values in the basins and higher values at greater depths.
The 19 July 2019 Mw = 5.1 earthquake was in an area with a low body-wave velocity anomaly, near the border between high- and low-velocity zones. Ref. [43] reached similar results, since that area was also connected to the destructive 7 September 1999 Mw = 6.0 earthquake. This was caused by the aftershock zone located in the hanging wall of the fault, which was disconnected from the fault itself. The high fracturing of the region led to the existence of low velocities and could be observed in the distribution of events to the depth. The extension of the discontinuity between positive (north) and negative (south) body-velocity perturbations (%) may be an indication of a possible continuation of either the TNF or FyNF towards the west, in the mountainous region near Erythres, before the final change in the overall fault orientation as we head to the Eastern Corinth Gulf (Figure 6 and Figure 7).
In the northern suburbs of Athens, seismic activity was located between 12 and 14 km depth, trending approximately in the WNW–ESE direction (Figure 14). Since the upgrade of HUSN in 2008, the detectability of such microseismic activity was increased, allowing us to have a richer earthquake catalog. In January 2015, an earthquake with an ML = 3.2 was felt by many residents of the metropolitan area, and it was particularly interesting. The same region that is identified through negative velocity perturbations of the initial VP model in this study lies between Kamatero (south) and Menidi (north) fault zones, as mapped in the work of [47], where the urban area with severe damages lies. Ref. [48] noticed a similar pattern while examining the postseismic displacement of the 1999 Mw = 6.0 earthquake. They observed that the fault rupture was becoming shallower inside the Athens basin, and it was assumed that this structure was ruptured in 1999 and continued at depth inside the Athens basin, crossing the alpine basement of both Parnitha and Aigaleo mountains at a right angle. The results of LET, though, lead to distinct fault zones to the west (Thriassion Normal Fault) and east (Kamatero Fault Zone) of Aigaleo mountain, respectively. In the Athenian plain, seismic activity and the distribution of body-wave anomalies and absolute velocities appear to be linked to a deeper (>9 km) subvertical structure, an observation that may be taken into account for the future plans of the Earthquake Planning and Protection Organization (EPPO).
In addition, a WNW–ESE trending zone of negative S-wave velocity anomalies was also observed at 5 km depth on the eastern edge of the region, potentially linked to offshore faults. At 20 km depth, a positive anomaly extending from the Athenian plain to the Eastern Corinth Gulf, coinciding with a change in the fault direction, was also observed. The 3-D seismic velocity models and VP/VS ratio are generally well correlated with medium- to large-scale faults.
The study provided a high-resolution 3-D crustal velocity structure in Attica and neighboring regions. The observed velocity anomalies and patterns offer insights into the region’s tectonic evolution which may be used in future seismic hazard studies. The correlation between the obtained body-wave velocity structure and local faults can help identify areas of increased seismic activity. The LET has revealed interesting contrasts in the epicentral region of 1999 and 2019 aftershocks by analyzing the distribution of body-wave velocity perturbations as well as the VP/VS ratio in both horizontal slices and vertical profiles. The presence of velocity anomalies in this region suggests a possible continuation towards the W-NW of the causative fault. This may have played a key role in the relatively surprising 2019 event, which occurred 20 years after the Mw = 6.0 earthquake that caused severe damage in the metropolitan area of Athens and its suburbs.

Supplementary Materials

The following supporting information can be downloaded at https://www.mdpi.com/article/10.3390/app14156427/s1: Figure S1: Geological map of Attica and neighboring areas. Toponyms are the respective ones we see in Figure 2; Figure S2: Total P- (blue) and S-ray (yellow) distribution; Figures S3 and S4: Normalized ray density of P- and S-waves; Figures S5 and S6: Distribution of P- and S-rays in the performed cross-sections; Figures S7–S9: Reconstruction of VP, VS, and VP/VS for the depth slices of 5, 10, 15, and 20 km and cell size of 10 km; Figures S10–S12: Checkerboard tests for checking the vertical resolution of VP, VS, and VP/VS; Table S1: Focal parameters of the significant earthquakes of Figure 2. Source: Ref. [26] Significant earthquakes 2003–2024, Seismological laboratory of NKUA. References [7,24,26,38,49] are cited in the supplementary materials.

Author Contributions

Conceptualization, A.K.; methodology, A.K. and F.V.; software, A.K.; validation, A.K. and F.V.; formal analysis, A.K. and F.V.; investigation, A.K. and F.V.; resources, A.K. and F.V.; data curation, A.K. and F.V.; writing—original draft preparation, A.K.; writing—review and editing, A.K. and F.V.; visualization, A.K.; supervision, A.K. All authors have read and agreed to the published version of the manuscript.

Funding

This research received no external funding.

Institutional Review Board Statement

Not applicable.

Informed Consent Statement

Not applicable.

Data Availability Statement

All data products generated in this study (velocity models, earthquake catalogs) are available from the authors upon request.

Acknowledgments

We would like to thank the scientists, post-graduate students, and personnel who participated in the installation or maintenance of the stations belonging to the HUSN and assisted with the signal processing and manual location of the recorded seismicity and the two reviewers for their creative comments and suggestions that upgraded the details of this work. We used data from the following seismic networks: HL (Institute of Geodynamics, National Observatory of Athens, doi:10.7914/SN/HL), HP (University of Patras, doi:10.7914/SN/HP), HT (Aristotle University of Thessaloniki, doi:10.7914/SN/HT), HA (National and Kapodistrian University of Athens, doi:10.7914/SN/HA), HC (Seismological Network of Crete, doi:10.7914/SN/HC). and HI Institute of Engineering Seismology and Earthquake Engineering, doi:10.7914/SN/HI) networks.

Conflicts of Interest

The authors declare no conflicts of interest.

References

  1. Papazachos, B.C.; Papazachou, C. The Earthquakes of Greece; Ziti Publ.: Thessaloniki, Greece, 2003; p. 286. (In Greek) [Google Scholar]
  2. Aksu, A.E.; Calon, T.J.; Hiscott, R.N.; Yasar, D. Anatomy of the North Anatolian fault zone in the Marmara Sea, western Turkey: Extensional basins above a continental transform. GSA Today 2000, 6, 3–7. [Google Scholar]
  3. McKenzie, D. Active tectonics of the Alpine-Himalayan belt: The Aegean Sea and surrounding regions Geophys. J. R. Astr. Soc. 1978, 55, 217–254. [Google Scholar] [CrossRef]
  4. Pichon, L.X.; Chamot-Rooke, N.; Lallemant, S. Geodetic determination of kinematics of central Greece with respect to Europe: Implications for eastern Mediterranean tectonics. J. Geophys. Res. 1995, 100, 12675–12690. [Google Scholar]
  5. Armijo, R.; Lyon-Caen, H.; Papanastassiou, D. East-west extension and Holocene normal-fault scarps in the Hellenic arc. Geology 1992, 20, 491–494. [Google Scholar] [CrossRef]
  6. Ganas, A.; Parsons, T. Three-dimensional model of Hellenic Arc deformation and origin of the Cretan uplift. J. Geophys. Res. 2009, 114, B06404. [Google Scholar] [CrossRef]
  7. Katsikatsos, G. La structure tectonique de l’ Attique et de l’ ile de Eubée. Bull. Geol. Soc. Fr. 1976, 19, 75–80. [Google Scholar]
  8. Ganas, A.; Tsironi, V.; Efstathiou, E.; Konstantakopoulou, E.; Andritsou, N.; Georgakopoulos, V.; Tsimi, C.; Fokaefs, A.; Madonis, N. The National Observatory of Athens active faults of Greece database (NOAFAULTs), Version 2023. In Past Earthquakes and Advances in Seismology for Informed Risk Decision-Making, Book of Abstracts, Proceedings of the 8th International Colloquium on Historical Earthquakes, Palaeo—Macroseismology and Seismotectonics, Kefalonia, Greece, 17–20 September 2023; Special Publication; Bulletin of the Geological Society of Greece: Athens, Greece, 2023; pp. 36–38. ISBN 978-618-86841-1-9. [Google Scholar]
  9. Caputo, R.; Chatzipetros, A.; Pavlides, S.; Sboras, S. The Greek Database of Seismogenic Sources (Gredass): State-of-the-Art for Northern Greece. Ann. Geophys. 2012, 55, 859. [Google Scholar]
  10. Kapetanidis, V.; Kassaras, I. Contemporary crustal stress of the Greek region deduced from earthquake focal mechanisms. J. Geodyn. 2019, 123, 55–82. [Google Scholar] [CrossRef]
  11. Ambraseys, N.N.; Jackson, J.A. Seismicity and associated strain of central Greece between 1890 and 1988. Geophys. J. Int. 1990, 101, 663–708. [Google Scholar] [CrossRef]
  12. King, G.C.P.; Ouyang, Z.X.; Papadimitriou, P.; Deschamps, A.; Gagnepain, J.; Houseman, G.; Jackson, J.A.; Soufleris, C.; Virieux, J. The Evolution of the Gulf of Corinth (Greece): An Aftershock Study of the 1981 Earthquakes. Geophys. J. Int. 1985, 80, 677–693. [Google Scholar] [CrossRef]
  13. Papadimitriou, P.; Kassaras, I.; Rigo, A.; Lyon-Caen, H.; Hatzfeld, D.; Makropoulos, K.; Drakopoulos, J. Source parameters of large and small earthquakes in Corinth Gulf (C. Greece). In Proceedings of the XXIV General Assembly of ESC, Athens, Greece, 19–24 September 1994; Volume II, pp. 848–858. [Google Scholar]
  14. Papadopoulos, G.A.; Drakatos, G.; Papanastassiou, D.; Kalogeras, I.; Stavrakakis, G. Preliminary Results about the Catastrophic Earthquake of 7 September 1999 in Athens, Greece. Seismol. Res. Lett. 2000, 71, 318–329. [Google Scholar] [CrossRef]
  15. Papadopoulos, G.A.; Ganas, A.; Pavlides, S. The problem of seismic potential assessment: Case study of the unexpected earthquake of 7 September 1999 in Athens, Greece. Earth Planets Space 2002, 54, 9–18. [Google Scholar] [CrossRef]
  16. Voulgaris, N.; Pirli, M.; Papadimitriou, P.; Kassaras, J.; Makropoulos, K. Seismotectonic characteristics of the area of Western Attica derived from the study of the 7 September 1999 Athens earthquake aftershock sequence. Bull. Geol. Soc. Greece 2001, 34, 1645–1651. [Google Scholar] [CrossRef]
  17. Ganas, A.; Papadopoulos, G.; Pavlides, S. The 7th September 1999 Athens 5.9Ms earthquake: Remote sensing and digital elevation model inputs towards identifying the seismic fault. Int. J. Remote Sens. 2001, 22, 191–196. [Google Scholar] [CrossRef]
  18. Louvari, E.; Kiratzi, A. Source parameters of the September 7, 1999 Athens (Greece) earthquake based on teleseismic data. J. Balk. Geophys. Soc. 2001, 4, 51–60. [Google Scholar]
  19. Papadimitriou, P.; Voulgaris, N.; Kassaras, I.; Kaviris, G.; Delibasis, N.; Makropoulos, K. The Mw = 6.0, 7 September 1999 Athens Earthquake. Nat. Hazards 2002, 27, 15–33. [Google Scholar] [CrossRef]
  20. Pyrli, M. A Contribution to Earthquake Location in Greece with the Use of Seismic Arrays. Ph.D. Thesis, University of Athens, Athens, Greece, 2005. (In Greek). [Google Scholar]
  21. Kaviris, G.; Kapetanidis, V.; Kravvariti, P.; Karakonstantis, A.; Bozionelos, G.; Papadimitriou, P.; Voulgaris, N.; Makropoulos, K. Anisotropy Study in Villia, 2nd ed.; ECEES: Istanbul, Turkey, 2014. [Google Scholar]
  22. Kaviris, G.; Zymvragakis, A.; Bonatis, P.; Kapetanidis, V.; Voulgaris, N. Probabilistic and Scenario-Based Seismic Hazard Assessment on the Western Gulf of Corinth (Central Greece). Appl. Sci. 2022, 12, 11152. [Google Scholar] [CrossRef]
  23. Konstantinou, K.; Mouslopoulou, V.; Saltogianni, V. Seismicity and Active Faulting around the Metropolitan Area of Athens, Greece. Bull. Seismol. Soc. Am. 2020, 110, 1924–1941. [Google Scholar] [CrossRef]
  24. Kapetanidis, V.; Karakonstantis, A.; Papadimitriou, P.; Pavlou, K.; Spingos, I.; Kaviris, G.; Voulgaris, N. The 19 July 2019 earthquake in Athens, Greece: A delayed major aftershock of the 1999 Mw = 6.0 event, or the activation of a different structure? J. Geodyn. 2020, 139, 101766. [Google Scholar] [CrossRef]
  25. Kouskouna, V.; Sakkas, G.; Cecic, I.; Tsimpidaros, V.I.; Sakkas, S.; Kaviris, G.; Tertulliani, A. Earthquake induced crises: Game Tree approached risk communication and lessons learnt. Ann. Geophys. 2020, 63, 1–25. [Google Scholar] [CrossRef]
  26. Makropoulos, K.; Kaviris, G.; Kouskouna, V. An Updated and Extended Earthquake Catalogue for Greece and Adjacent Areas since 1900. Nat. Hazards Earth Syst. Sci. 2012, 12, 1425–1430. [Google Scholar] [CrossRef]
  27. Michas, G.; Kapetanidis, V.; Spingos, I.; Kaviris, G.; Vallianatos, F. The 2020 Perachora peninsula earthquake sequence (Εast Corinth Rift, Greece): Spatiotemporal evolution and implications for the triggering mechanism. Acta Geophys. 2022, 70, 2581–2601. [Google Scholar] [CrossRef]
  28. Kaviris, G.; Spingos, I.; Millas, C.; Kapetanidis, V.; Fountoulakis, I.; Papadimitriou, P.; Voulgaris, N.; Drakatos, G. Effects of the January 2018 seismic sequence on shear-wave splitting in the upper crust of Marathon (NE Attica, Greece). Phys. Earth Planet. Inter. 2018, 285, 45–58. [Google Scholar] [CrossRef]
  29. D’Alessandro, A.; Papanastassiou, D.; Baskoutas, I. Hellenic Unified Seismological Network: An evaluation of its performance through SNES method. Geophys. J. Int. 2011, 185, 1417–1430. [Google Scholar] [CrossRef]
  30. Hellenic Mediterranean University Research Center (Former Technological Educational Institute of Crete). Seismological Network of Crete; 10.7914/SN/HC International Federation of Digital Seismograph Networks: Crete, Greece, 2006. [Google Scholar]
  31. Institute of Geodynamics-National Observatory of Athens. Hellenic Seismological Network, University of Athens, Seismological Laboratory [Data Set]. International Federation of Digital Seismograph Networks. 2008. Available online: https://www.fdsn.org/networks/detail/HL/ (accessed on 31 March 2024).
  32. University of Athens. Hellenic Seismological Network, University of Athens, Seismological Laboratory [Data Set]. International Federation of Digital Seismograph Networks. 2008. Available online: https://www.fdsn.org/networks/detail/HA/ (accessed on 31 March 2024).
  33. Aristotle University of Thessaloniki. Aristotle University of Thessaloniki Seismological Network [Data Set]. International Federation of Digital Seismograph Networks. 1981. Available online: https://www.fdsn.org/networks/detail/HT/ (accessed on 31 March 2024).
  34. Institute of Engineering Seimology Earthquake Engineering (ITSAK), Greece. 1981. Available online: https://www.fdsn.org/networks/detail/HI/ (accessed on 31 March 2024).
  35. University of Patras, Seismological Laboratory, HP. 2000. Available online: https://www.fdsn.org/networks/detail/HP/ (accessed on 31 March 2024).
  36. Koulakov, I. LOTOS code for local earthquake tomographic inversion: Benchmarks for testing tomographic algorithms. Bull. Seismol. Soc. Am. 2009, 99, 194–214. [Google Scholar] [CrossRef]
  37. Jaxybulatov, K.; Koulakov, I.; Ibs-von Seht, M.; Klinge, K.; Reichert, C.; Dahren, B.; Troll, V.R. Evidence for high fluid/melt content beneath Krakatau volcano (Indonesia) from local earthquake tomography. J. Volcanol. Geotherm. Res. 2011, 206, 96–105. [Google Scholar] [CrossRef]
  38. Um, J.; Thurber, C.A. Fast algorithm for two-point seismic ray tracing. Bull. Seismol. Soc. Am. 1987, 77, 972–986. [Google Scholar] [CrossRef]
  39. Nolet, G. Seismic wave propagation and seismic tomography. In Seismic Tomography; Springer: Dordrecht, The Netherlands, 1987; pp. 1–23. [Google Scholar]
  40. Humphreys, E.; Clayton, R.W. Adaptation of back projection tomography to seismic travel time problems. J. Geophys. Res. 1988, 93, 1073–1085. [Google Scholar] [CrossRef]
  41. Koulakov, I.; Burov, E.; Cloetingh, S.; El Khrepy, S.; Al-Arifi, N.; Bushenkova, N. Evidence for Anomalous Mantle Upwelling beneath the Arabian Platform from Travel Time Tomography Inversion. Tectonophysics 2016, 667, 176–188. [Google Scholar] [CrossRef]
  42. Koulakov, I.; Boychenko, E.; Smirnov, S.Z. Magma Chambers and Meteoric Fluid Flows Beneath the Atka Volcanic Complex (Aleutian Islands) Inferred from Local Earthquake Tomography. Geosciences 2020, 10, 214. [Google Scholar] [CrossRef]
  43. Drakatos, G.; Melis, N.; Papanastassiou, D.; Karastathis, V.; Papadopoulos, G.; Stavrakakis, G. 3-D P-wave Crustal Velocity Structure from Inversion of Local Earthquake Data in Attiki (Central Greece) Region. Nat. Hazards 2000, 27, 1–14. [Google Scholar] [CrossRef]
  44. Drakatos, G.; Karastathis, V.; Makris, J.; Papoulia, J.; Stavrakakis, G. 3D crustal structure in the neotectonic basin of the Gulf of Saronikos. Greece Tectonophys. 2005, 400, 55–65. [Google Scholar] [CrossRef]
  45. Makris, J.; Papoulia, J.; Drakatos, G. Tectonic deformation and microseismicity of the Saronikos Gulf, central Greece. Bull. Seismol. Soc. Am. 2004, 94, 920–929. [Google Scholar] [CrossRef]
  46. Bornovas, J.; Rondoyanni-Tsiambaou, T. Geological Map of Greece, Scale: 1: 500,000; Institute of Geology and Mineral Exploration: Athens, Greece, 1983. [Google Scholar]
  47. Mariolakos, I.; Fountoulis, I. The Athens earthquake September 7th, 1999 Neotectonic regime and geodynamic phenomena. In Earth and Environment Sciences, Integration of Earth Sciences Research on the Turkish and Greek 1999 Earthquakes; NATO Science, Series; Gorur, N., Papadopoulos, G.A., Okay, N., Eds.; Kluwer Academic Publishers: Dordrecht, The Netherlands, 2002; pp. 113–126. [Google Scholar]
  48. Atzori, S.; Manunta, M.; Fornaro, G.; Ganas, A.; Salvi, S. Postseismic displacement of the 1999 Athens earthquake retrieved by the Differential Interferometry by Synthetic Aperture Radar time series. J. Geophys. Res. 2008, 113, B09309. [Google Scholar] [CrossRef]
  49. Kasatkina, E.; Koulakov, I.; West, M.; Izbekov, P. Structure of magma reservoirs beneath the Redoubt volcano inferred from local earthquake tomography. J. Geophys. Res. Solid Earth 2014, 119, 4938–4954. [Google Scholar] [CrossRef]
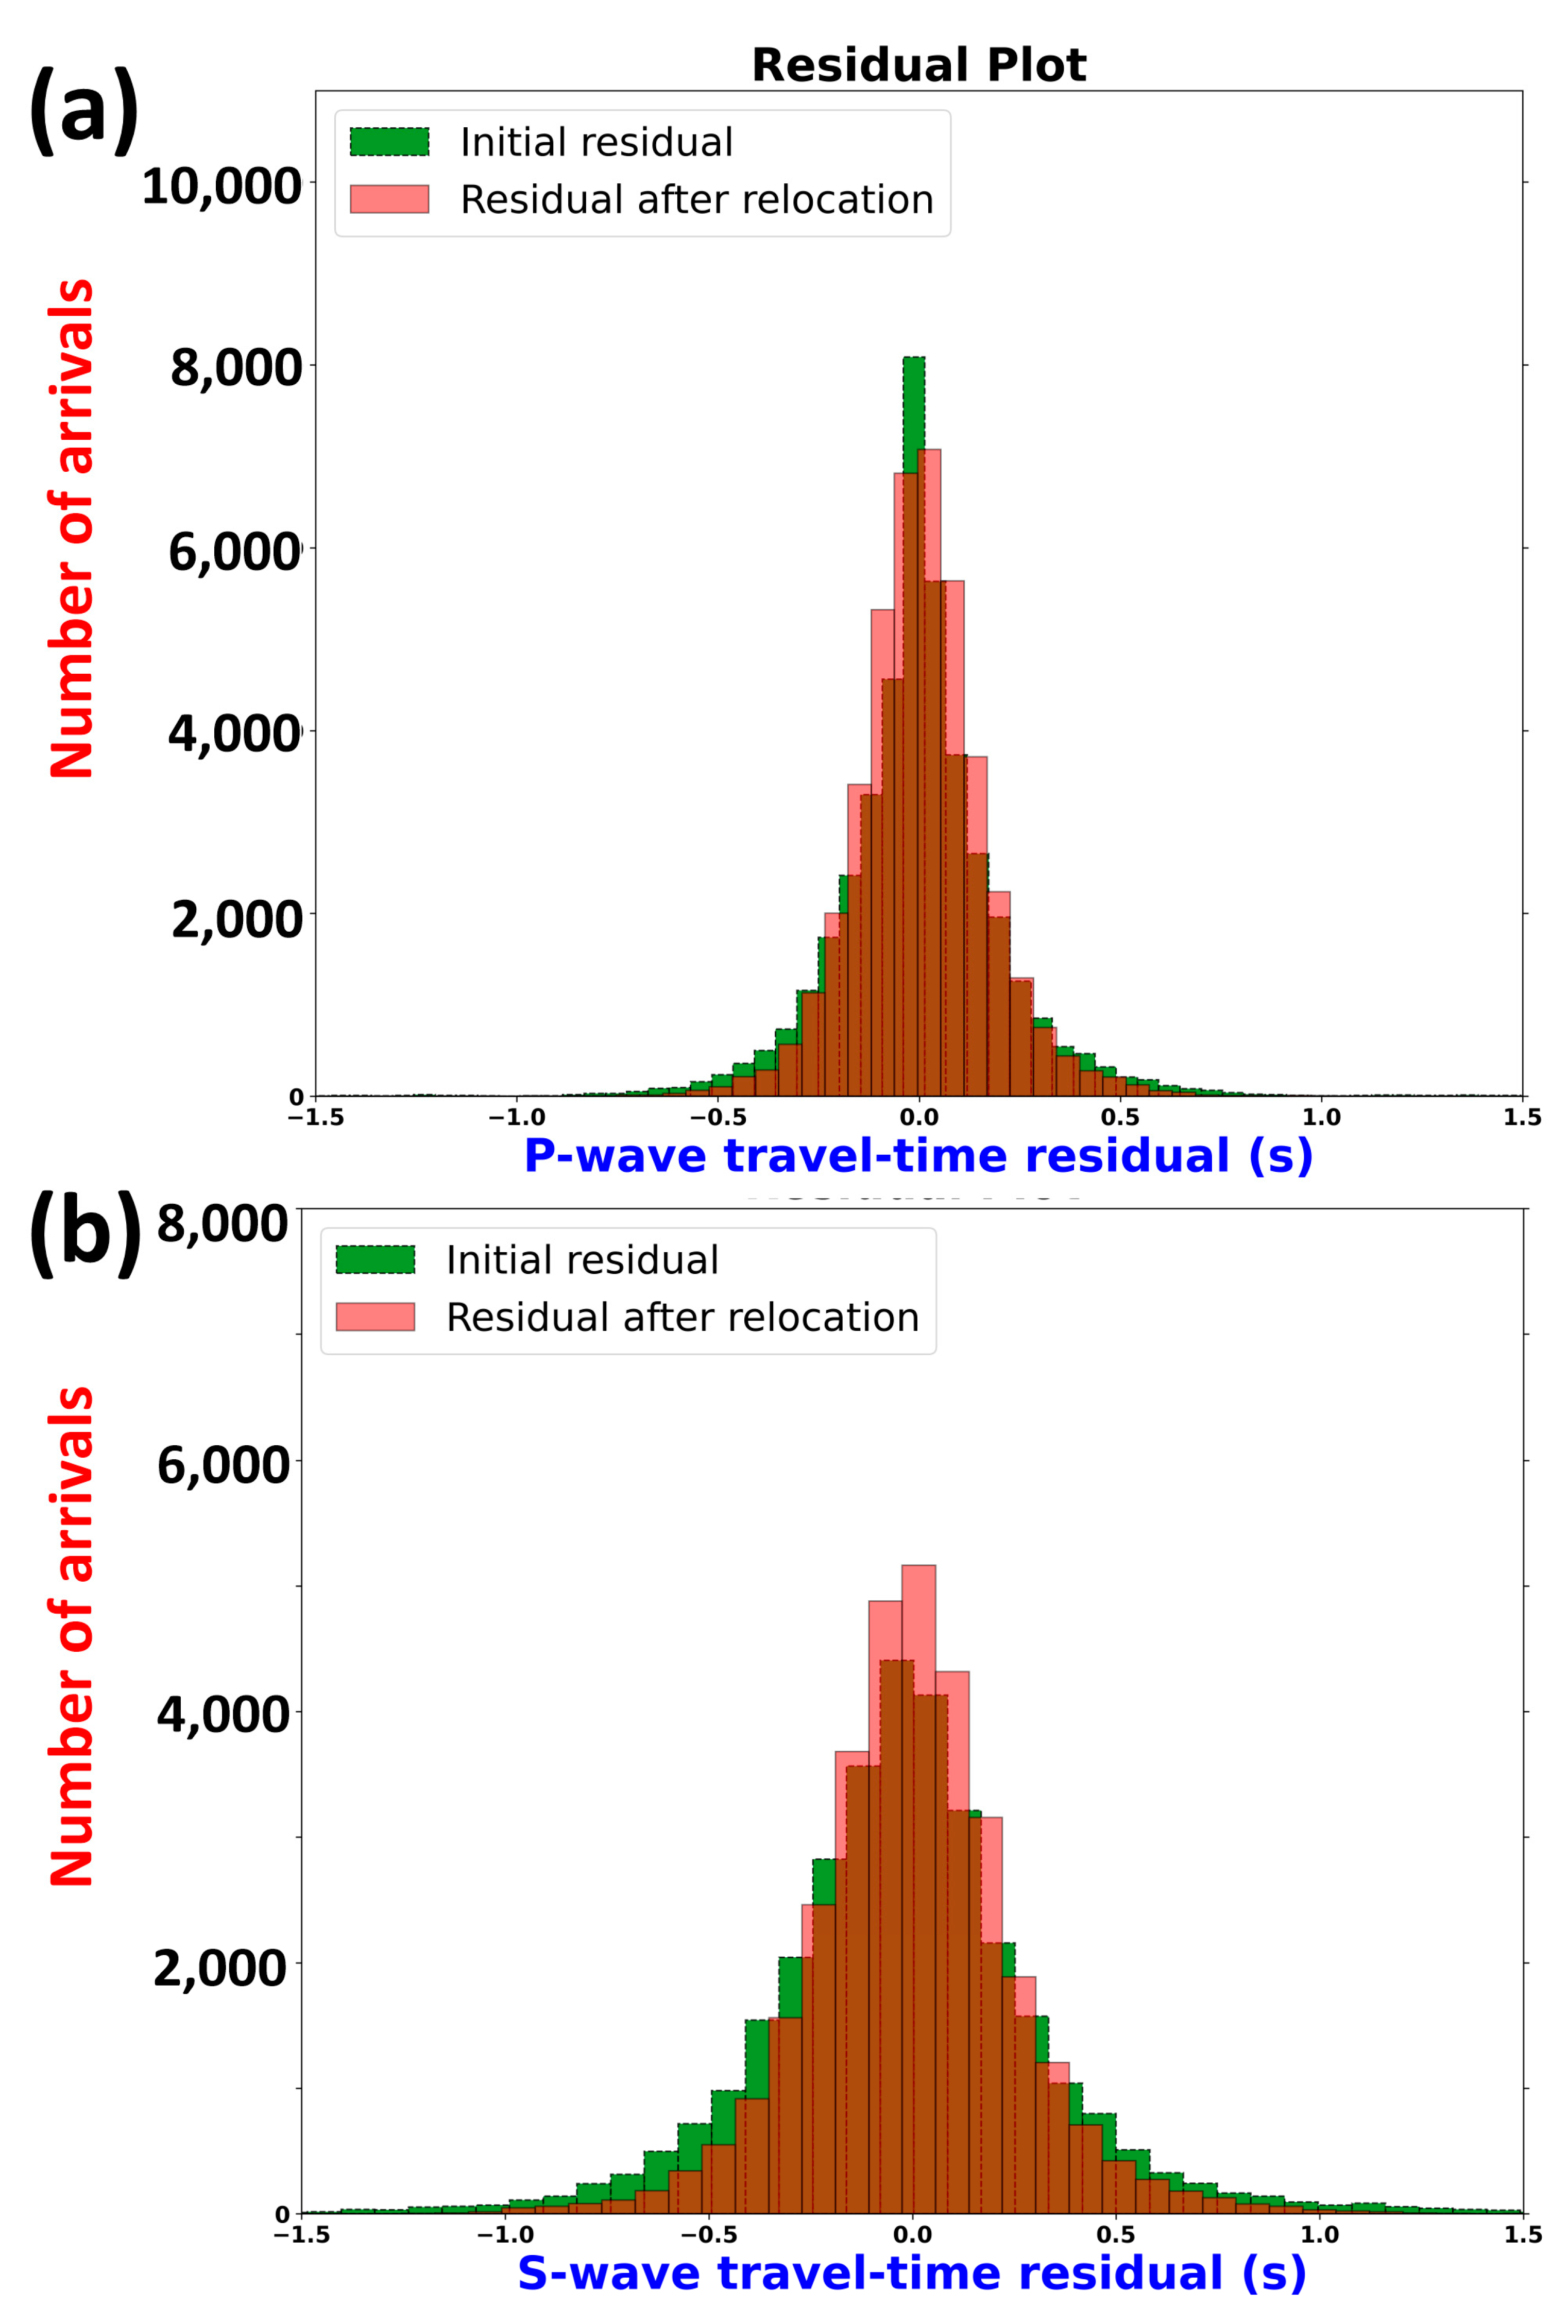
Figure 3. Location of the initial 3468 events (ML ≥ 0.6) from January 2019 to March 2024. HUSN stations are depicted in blue triangles. Fault traces as in Figure 1.
Applsci 14 06427 g003
Figure 4. Histograms of (a) P-wave and (b) S-wave travel-time residuals prior to (green) and after (red) the inversion procedure.
Applsci 14 06427 g004
Figure 5. On the map, there are the locations of the eight (8) cross-sections performed. The width of each section is 2 km (±1 km from the mark of the section). Seismic events are marked in red color, while the stations of HUSN are in blue triangles. Letters indicate the direction of each section. Hypocentral depths in Figure 3. Fault traces as in Figure 1.
Applsci 14 06427 g005
Figure 6. Tomograms of lateral VP (%) variations at 5, 10, 15, and 20 km depth. Regions with low resolution are masked. Black circles indicate the recorded seismicity. Toponyms as in Figure 1 and Figure 2.
Applsci 14 06427 g006
Figure 7. Tomograms of lateral VS (%) variations at 5, 10, 15, and 20 km depth. Regions with low resolution are masked. Black circles indicate the recorded seismicity. Toponyms as in Figure 1 and Figure 2.
Applsci 14 06427 g007
Figure 8. Tomograms of lateral VP/VS ratio at 5, 10, 15, and 20 km depth. Regions with low resolution are masked. Black circles indicate the recorded seismicity. Toponyms as in Figure 1 and Figure 2.
Applsci 14 06427 g008
Figure 9. Distribution of VP (%) variations in the performed cross-sections. Regions with low resolution are masked. Black circles indicate the recorded seismicity. Map projection of cross-sections in Figure 5. Possible faults are marked in red dashed lines, while their projection along with the toponym’s name is viewed on the surface of the topography. Abbreviations—AthP: Athens Plain; TNF: Thriassion Normal Fault; FyNF: Fyli Normal Fault; PNF: Palaiokoudoura Normal Fault.
Applsci 14 06427 g009
Figure 10. Distribution of VS (%) variations in the performed cross-sections. Areas with lower resolution are masked. Black circles indicate the recorded seismicity. Map projection of cross-sections in Figure 5. Possible faults are marked in red dashed lines, while their projection along with the toponym’s name is viewed on the surface of the topography. Abbreviations—AthP: Athens Plain; TNF: Thriassion Normal Fault; FyNF: Fyli Normal Fault; PNF: Palaiokoudoura Normal Fault.
Applsci 14 06427 g010
Figure 11. Distribution of VP/VS ratio values in the performed cross-sections. Areas with lower resolution are masked. Black circles indicate the recorded seismicity. Map projection of cross-sections in Figure 5. Possible faults are marked in red dashed lines, while their projection along with the toponym’s name is viewed on the surface of the topography. Abbreviations—AthP: Athens Plain; TNF: Thriassion Normal Fault; FyNF: Fyli Normal Fault; PNF: Palaiokoudoura Normal Fault.
Applsci 14 06427 g011
Figure 12. Distribution of the absolute VP in the performed cross-sections. Areas with lower resolution are masked. Black circles indicate the recorded seismicity. Map projection of cross-sections in Figure 5. Possible faults are marked in red dashed lines, while their projection along with the toponym’s name is viewed on the surface of the topography. Abbreviations—AthP: Athens Plain; TNF: Thriassion Normal Fault; FyNF: Fyli Normal Fault; PNF: Palaiokoudoura Normal Fault.
Applsci 14 06427 g012
Figure 13. Distribution of the absolute VS in the performed cross-sections. Areas with lower resolution are masked. Black circles indicate the recorded seismicity. Map projection of cross-sections in Figure 5. Possible faults are marked in red dashed lines, while their projection along with the toponym’s name is viewed on the surface of the topography. Abbreviations—AthP: Athens Plain; TNF: Thriassion Normal Fault; FyNF: Fyli Normal Fault; PNF: Palaiokoudoura Normal Fault.
Applsci 14 06427 g013
Figure 14. (a) Location of the seismic events with ML ≥ 0.6 from January 2019 to March 2024 combined with the surface mapped faults [8,47] and blind fault segments of TNF and KFZ [47]. (b) A morphological map of the study area showing absolute P-wave velocities along profile 8, which runs in a WNW–ESE direction. Abbreviations—ECG: Eastern Corinth Gulf; ThrM: Thracomacedones; TNF: Thriassion Normal Fault; FyNF: Fyli Normal Fault; PNF: Palaiokoudoura Normal Fault; MFZ: Menidi Fault Zone; KFZ: Kamatero Fault Zone.
Applsci 14 06427 g014
Table 1. Mean residuals in L1 norm and their variance reductions during the iterative inversion procedure.
IterationP-Residual (s)P-Residual
Reduction (%)
S-Residual (s)S-Residual
Reduction (%)
10.2270.000.5730.00
20.18418.790.34918.10
30.17522.890.30220.56
40.17124.750.28622.66
50.16925.540.27823.95
Disclaimer/Publisher’s Note: The statements, opinions and data contained in all publications are solely those of the individual author(s) and contributor(s) and not of MDPI and/or the editor(s). MDPI and/or the editor(s) disclaim responsibility for any injury to people or property resulting from any ideas, methods, instructions or products referred to in the content.

