Article

Sustainable Energy Solutions: Utilising UGS for Hydrogen Production by Electrolysis

1
Podzemno Skladište Plina d.o.o., Veslačka 2-4, 10000 Zagreb, Croatia
2
Faculty of Mining, Geology and Petroleum Engineering, University of Zagreb, 10000 Zagreb, Croatia
3
Plinacro d.o.o., Savska Cesta 88a, 10000 Zagreb, Croatia
*
Author to whom correspondence should be addressed.
Appl. Sci. 2024, 14(15), 6434; https://doi.org/10.3390/app14156434
Submission received: 27 June 2024 / Revised: 17 July 2024 / Accepted: 18 July 2024 / Published: 24 July 2024

Abstract

:
Increasing the share of renewable energy sources (RESs) in the energy mix of countries is one of the main objectives of the energy transition in national economies, which must be established on circular economy principles. In the natural gas storage in geological structures (UGSs), natural gas is stored in a gas reservoir at high reservoir pressure. During a withdrawal cycle, the energy of the stored pressurised gas is irreversibly lost at the reduction station chokes. At the same time, there is a huge amount of produced reservoir water, which is waste and requires energy for underground disposal. The manuscript explores harnessing the exergy of the conventional UGS reduction process to generate electricity and produce hydrogen via electrolysis using reservoir-produced water. Such a model, which utilises sustainable energy sources within a circular economy framework, is the optimal approach to achieve a clean energy transition. Using an innovative integrated mathematical model based on real UGS production data, the study evaluated the application of a turboexpander (TE) for electricity generation and hydrogen production during a single gas withdrawal cycle. The simulation results showed potential to produce 70 tonnes of hydrogen per UGS withdrawal cycle utilising 700 m3 of produced field water. The analysis showed that hydrogen production was sensitive to gas flow changes through the pressure reduction station, underscoring the need for process optimisation to maximise hydrogen production. Furthermore, the paper considered the categorisation of this hydrogen as “green” as it was produced from the energy of pressurised gas, a carbon-free process.

1. Introduction

Recognising climate change and environmental degradation as major threats to global society, the European Commission has introduced the EU Green Deal [1] as a comprehensive plan intended to make the EU’s economy sustainable. It encompasses various policies and initiatives to reduce carbon dioxide (CO2) emissions by at least 55% compared with 1990 levels and aims to achieve climate neutrality by 2050, promote clean energy, and preserve biodiversity. The circular economy is one of the key components of the EU Green Deal. In a circular economy approach, there is a focus on maximising resource efficiency and minimising material inputs, with waste-to-energy (WtE) projects as examples of best practices [2,3,4].
The need to create a sustainable society through clean energy and a circular economy is recognised in the Sustainable Development Goals (SDGs), which were adopted by all member states of the United Nations in 2015. These goals aim to eradicate poverty, reduce inequality, and promote peaceful and prosperous societies by 2030. Goal 7 (SDG 7) in particular provides for universal access to clean, affordable, reliable, and modern energy for all. At the same time, SDG 12 prescribes sustainable consumption and production patterns that are an integral part of the principles of a circular economy [5].
As one of the main objectives of integrated climate–energy policy is to increase the production of electricity from renewable energy sources (RES) [6], the share of renewables in the total electricity supply has increased significantly over the last ten years thanks to various incentives. Nevertheless, the REPowerEU plan envisages that the share of electricity generation from renewable energy sources should increase to 72% by 2030, compared with 44% in 2023 [7]. However, in some countries, the overproduction of electricity from renewable energy sources has meant that the electricity generated cannot be fed into the grid due to the limitations of the grid and the impossibility of storing the energy generated. One of the options being considered to solve this problem is the so-called power-to-gas (P2G) technology. In principle, P2G involves the conversion of electrical energy into gases, hydrogen, or methane [8,9,10]. The advantage of this technology is that large amounts of energy can be transported more flexibly and easily, and there are fewer limiting factors (such as the problem of energy storage). This technology is favoured by the fact that the capacity of gas pipelines and gas storage facilities is much higher than the capacity of electricity transmission lines, whose lack of capacity limits the generation of electricity from renewable energy sources [11,12,13,14].
Serving as a feedstock, fuel, or energy carrier and storage medium, it is believed that hydrogen (H2) will play an important role in future integrated energy systems. Currently, it participates only with a small fraction of the global and EU-wide energy mix, primarily derived from fossil fuels, leading to the release of 70 to 100 million tonnes of CO2 annually in the EU. However, to achieve climate neutrality, energy production must be decarbonised so that the share of hydrogen in the energy mix is 13–14% by 2050. This objective is feasible if at least 6 GW of renewable hydrogen electrolysers are installed by 2024 and 40 GW by 2030 [15].
Several strategic documents contribute strongly to the objectives of the European Green Deal. However, the Hydrogen Strategy for a Climate Neutral Europe (COM/2020/301) [14] and the Strategy for the Energy Systems Integration (COM/2020/299) [15] are crucial for the hydrogen economy. The integration of energy systems is about the connection between different energy sources and the end-use sector, which makes it possible to optimise the entire energy system. While today’s energy systems involve linear flows with a lot of wasted energy, such future systems would allow flows between users and producers, resulting in less wasted energy. At the same time, a high share of renewable energy sources (RES) would be engaged [16].
Hydrogen can be produced using various processes. Possible processes for hydrogen production with their advantages and disadvantages, costs, and technical efficiencies are presented in Anwar et al. [17]. However, the two most common processes for hydrogen production are steam–methane reforming and electrolysis. Only 4% of today’s global hydrogen production is derived from water electrolysis. While water splitting powered by renewable energy is considered the most environmentally friendly method for producing green hydrogen [18,19,20], renewable and low-carbon hydrogen types are not yet competitive compared with fossil-based hydrogen [15]. This means that the majority of hydrogen is currently produced by steam–methane reforming, producing around 830 million tonnes of carbon dioxide per year [21].
However, according to Marouani et al. [20], several challenges need to be overcome. These include controlling production costs; building a robust infrastructure for storage, distribution, and use in different sectors; and further developing innovative technologies. Specialised techniques are essential to prevent the leakage of hydrogen and to increase safety in storage, transport, and use. In addition, uncertainties remain regarding aspects of “green” hydrogen production, such as the impact on land use and greenhouse gas emissions over the entire life cycle [22]. These factors highlight the need for continued rigorous assessment and development to fully realise the potential of “green” hydrogen as a sustainable energy solution. Today, great efforts are being made to develop new materials, models, and storage methods, as evidenced by recent publications [23,24,25,26,27].
Nevertheless, achieving the required production capacities through water electrolysis necessitates enormous amounts of electricity [26]. In addition, the use of freshwater for large-scale hydrogen production is considered unsustainable [27]. On average, proton exchange membrane (PEM) electrolysis consumes the least water per kilogramme of hydrogen produced (17.5 L), followed by alkaline electrolysis (22.3 L/kg). Steam–methane reforming with carbon capture, utilisation, and storage (SMR-CCUS) and autothermal reforming (ATR)-CCUS consume even more at 24.2 L/kg and 32.2 L/kg, respectively. This means that around 2.2 billion m3 of freshwater is currently used for hydrogen production, which corresponds to 0.6% of the total freshwater withdrawal in the energy sector. However, the projected increase in hydrogen production would lead to a threefold increase in freshwater withdrawals for global hydrogen production by 2040 and a sixfold increase by 2050, equivalent to 12.1 billion m3. The use of seawater for hydrogen production and cooling is therefore an option for coastal areas affected by freshwater shortages [21]. Seawater, which constitutes nearly 97% of the world’s total water resources, could be a viable alternative, but the desalination treatment required to make seawater suitable for electrolysis is not cost-effective and also has a significant environmental footprint. The hugest issue associated with direct seawater splitting is the chlorine evolution reaction, which takes place at the anode due to the presence of chloride anions and competes with the oxygen evolution reaction [28,29,30].
Utilising reservoir (formation) water for hydrogen production is an innovative approach that would fit into the circular economy as hydrogen is produced from the water produced during oil and gas extraction. However, various aspects such as water composition, treatment requirements, optimisation of the electrolysis process, and environmental aspects related to the use of formation water as a feedstock for hydrogen production need to be investigated and clarified.
Al-Baghdadi et al. [31] published a paper in which solar energy was used for the electrolysis of water produced during oil and gas activities in an oil production field in Libya. The water content was determined using standard chemical methods. The hydrogen production rate is given for different values of solar radiation during the year. The study showed that a small plant with solar panels of 10 × 10 m2 could produce a total of 9700 m3/year of hydrogen.
Furthermore, the efficient operation of electrolysers means not only the provision of renewable electricity but also the utilisation of waste energy. At a time when prices for primary energy are rising, the use of energy-efficient technologies in existing process plants is becoming profitable and relevant. Energy recovery from natural gas transport or distribution networks is a growing area of research. The process of reducing the pressure of natural gas, which is usually achieved by conventional chock valves, can be upgraded implementing turbo expander technology, enabling energy recovery from the pressure drop. The use of expansion turbines in the natural gas transport system was analysed by more authors [32,33,34]. The exergy potential available in the LNG transport chain was analysed by Kaneko et al. [35] and by Szargut [36] and Szargut and Szczygiel [37]. Some recent publications provide up-to-date insights into the latest advances, technologies, and methods related to the use of turboexpanders for energy recovery in gas pressure reduction stations (PRSs). Currently, only a few energy recovery systems are installed in PRSs, mostly consisting of radial turboexpanders coupled to combined heat and power combustion engines or gas-fired heaters that provide the necessary preheating [38].
Borelli et al. [39] present a novel plant configuration consisting of a two-stage expansion system whose energy performance is analysed using numerical dynamic simulations. By comparing the energy efficiency of PRS with high- and low-temperature configurations, it is shown that the two-stage expansion is more energy efficient and can be effectively integrated with low-enthalpy heat sources.
Saied et al. (2022) [40] investigate the potential of energy recovery in the gas extension pipeline, through which energy waste can be effectively utilised to supply green energy to the city of New Al-Alamein in Egypt.
Static and dynamic simulations of energy recovery from natural gas pressure reduction stations were carried out by Bielka and Kuczyński [41] to investigate the possibilities of using the electricity generated to meet the needs of the reduction and measurement stations. Analyses were done regarding the possibility of reselling surplus electricity. An increase in the electricity purchase price and a reduction in the natural gas purchase price may help to make the investment worthwhile in the future [41].
The pressure-related potential that is considered exploitable can be described with the concept of “exergy”, i.e., the maximum work that can be recovered from the system considering the environmental conditions. This paper focuses primarily on the utilisation of exergy in the conventional gas reduction station of the underground gas storage (UGS) to produce electricity and ultimately hydrogen through the electrolysis system and using the produced formation water. The use of the turboexpander (TE) to generate electricity and hydrogen via the electrolysis system was analysed in a simulation case study. A mathematical model was created in industrial process software, and the dependencies of the process parameters were simulated for the UGS gas reduction station. This research uses a mathematical model that integrates several commercial software packages, each specialising in different parts of the system, to predict the dynamic response of the entire gas storage system. This approach, which is commonly used in oil and gas production optimisation, enables the analysis of the impact of gas storage parameters on operating characteristics under different pressure conditions. The model was developed and calibrated based on actual field production and hydrodynamic data to ensure its applicability in different scenarios. It effectively predicts the maximum possible gas extraction rate and thus the available power at TE as a function of the pressure in the gas storage facility. The paper also analyses and hypothesises that the hydrogen produced by this type of exergy could be considered “green hydrogen”, as it is produced with electricity, which is also “carbon-free” and comes from the energy of the stored gas. As formation water is used, which is a waste product from oil and gas extraction, the proposed concept is in line with the concept of waste to energy mentioned earlier. Although formation water can serve as a potential water source for electrolysis-based hydrogen production, appropriate treatment and purification may be required to ensure optimal performance and environmental compatibility. The suitability of formation water therefore depends on its composition, purity, and compatibility with electrolysis technology, and this issue needs to be investigated in detail to determine the feasibility of the solution.

2. Methodology and Concept Description

A unique concept and methodology for the total achievable hydrogen production from energy transformations during the gas withdrawal process from a specific UGS facility in Croatia was proposed. The amount of electricity needed to produce 1 kg of H2 was about 50–70 kWh with the PEM electrolysis system [12], and assuming a system efficiency of 65% and ever-lower prices of electrolysers, the mentioned concept became a commercially interesting technology. The gas storage process and the parallel production of hydrogen through an energy process due to pressure reduction were simulated using technical software [41,42] and real storage operation data. The computer had the following features: Ram memory, DIMM 64 GG 2133 MHz; CPU, Intel Xeon E3-1535M [email protected] GHz; L2 Cash, 1024 KB; L3 Cash, 8192 KB; operative system, Win 10 pro; graphic card, NVIDIA Quadro M500M 8 GB DDR5. When gas was withdrawn from the storage reservoir, associated water was also produced alongside the gas. Utilising generated simulation scenarios, the investigation aimed to determine the sustainability of the hydrogen production process, in particular whether the amount of water produced per withdrawal cycle could meet the quantities required for hydrogen production. A mathematical model of an underground gas storage facility was utilised to simulate the total energy output at TE during a standard gas withdrawal cycle. Considering the reservoir pressure drop during gas withdrawal process, it was possible to realistically simulate the total hydrogen production via the TE generator and electrolysis process. This simulation helped ascertain the required amount of formation water necessary for hydrogen production, which was the main objective of this research.

2.1. UGS Facility Description

The underground gas storage facility considered for the case study was located in the central part of Croatia about 55 km southeast of Zagreb. The facility was developed in 1986, with 26 working wells having a maximum gas withdrawal capacity of 5,760,000 m3/d and a working gas storage volume of 450 × 106 m3 [43]. The gas was stored in three separate sand layers labelled a1–a3, bounded from above by impermeable rock and from below by an aquifer. The average depth of the reservoir was approximately 1850 m, with a maximum reservoir pressure of 19.6 MPa and an average reservoir temperature of 185 °C. The gas storage facility was physically connected to the main gas transportation system of the Republic of Croatia. The technical process involved two cycles: the gas withdrawal cycle and the gas injection cycle. Figure 1 shows a simplified technical scheme of the UGS “Okoli” process.
The gas flowed from the reservoir through withdrawal wells, all of which were equipped with gas filters and an adjustable nozzle for flow regulation. After flow regulation, the well stream gas passed through a flow measuring point and a two-phase separator, where the liquid phase was separated from a gas stream and then sent to the facility’s gas reduction station. The gas from the wells flowed to the gas heater and then to the pressure reduction station; after pressure reduction the gas was dried in the dehydration columns, and the dry gas was filtered, measured, and sent to the national gas transportation system. During the withdrawal cycle, all formation water was collected in the main process plant separator and disposed of in an environmentally sustainable manner. The annual reservoir water production ranged from 380 m3 to 800 m3. The water analysis of a representative sample and the formation water production data are shown in Table 1 and Table 2.

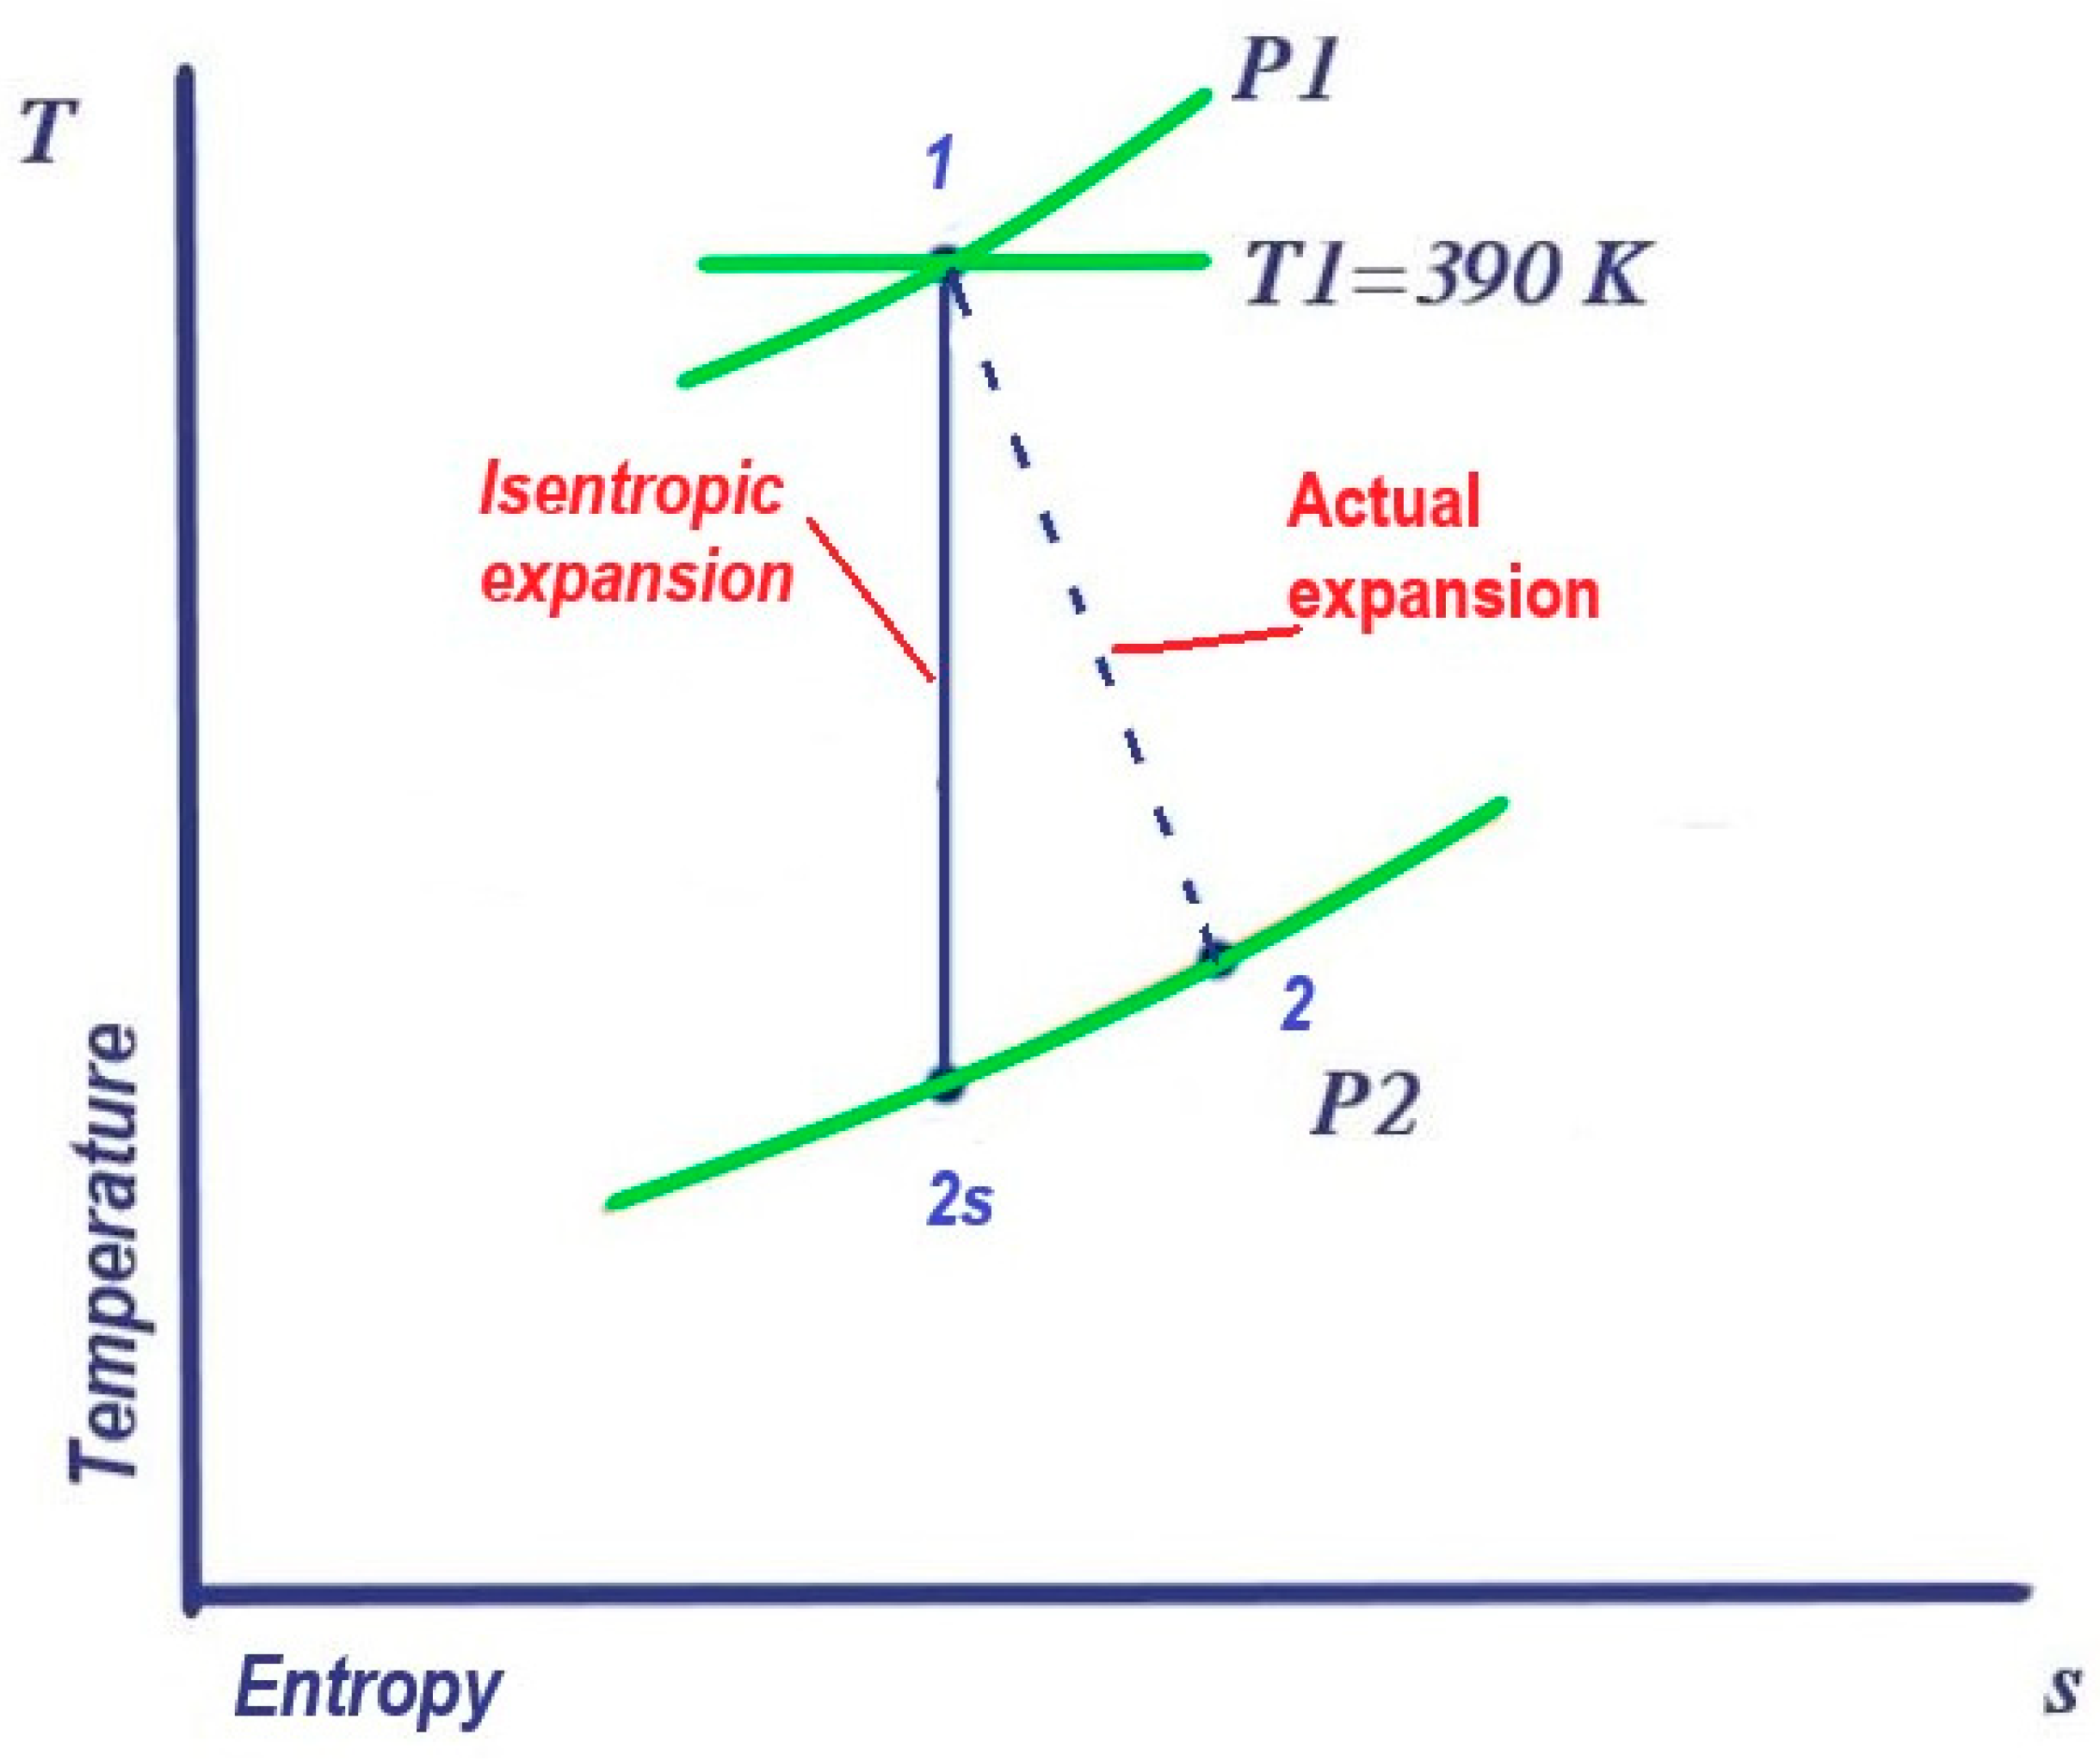
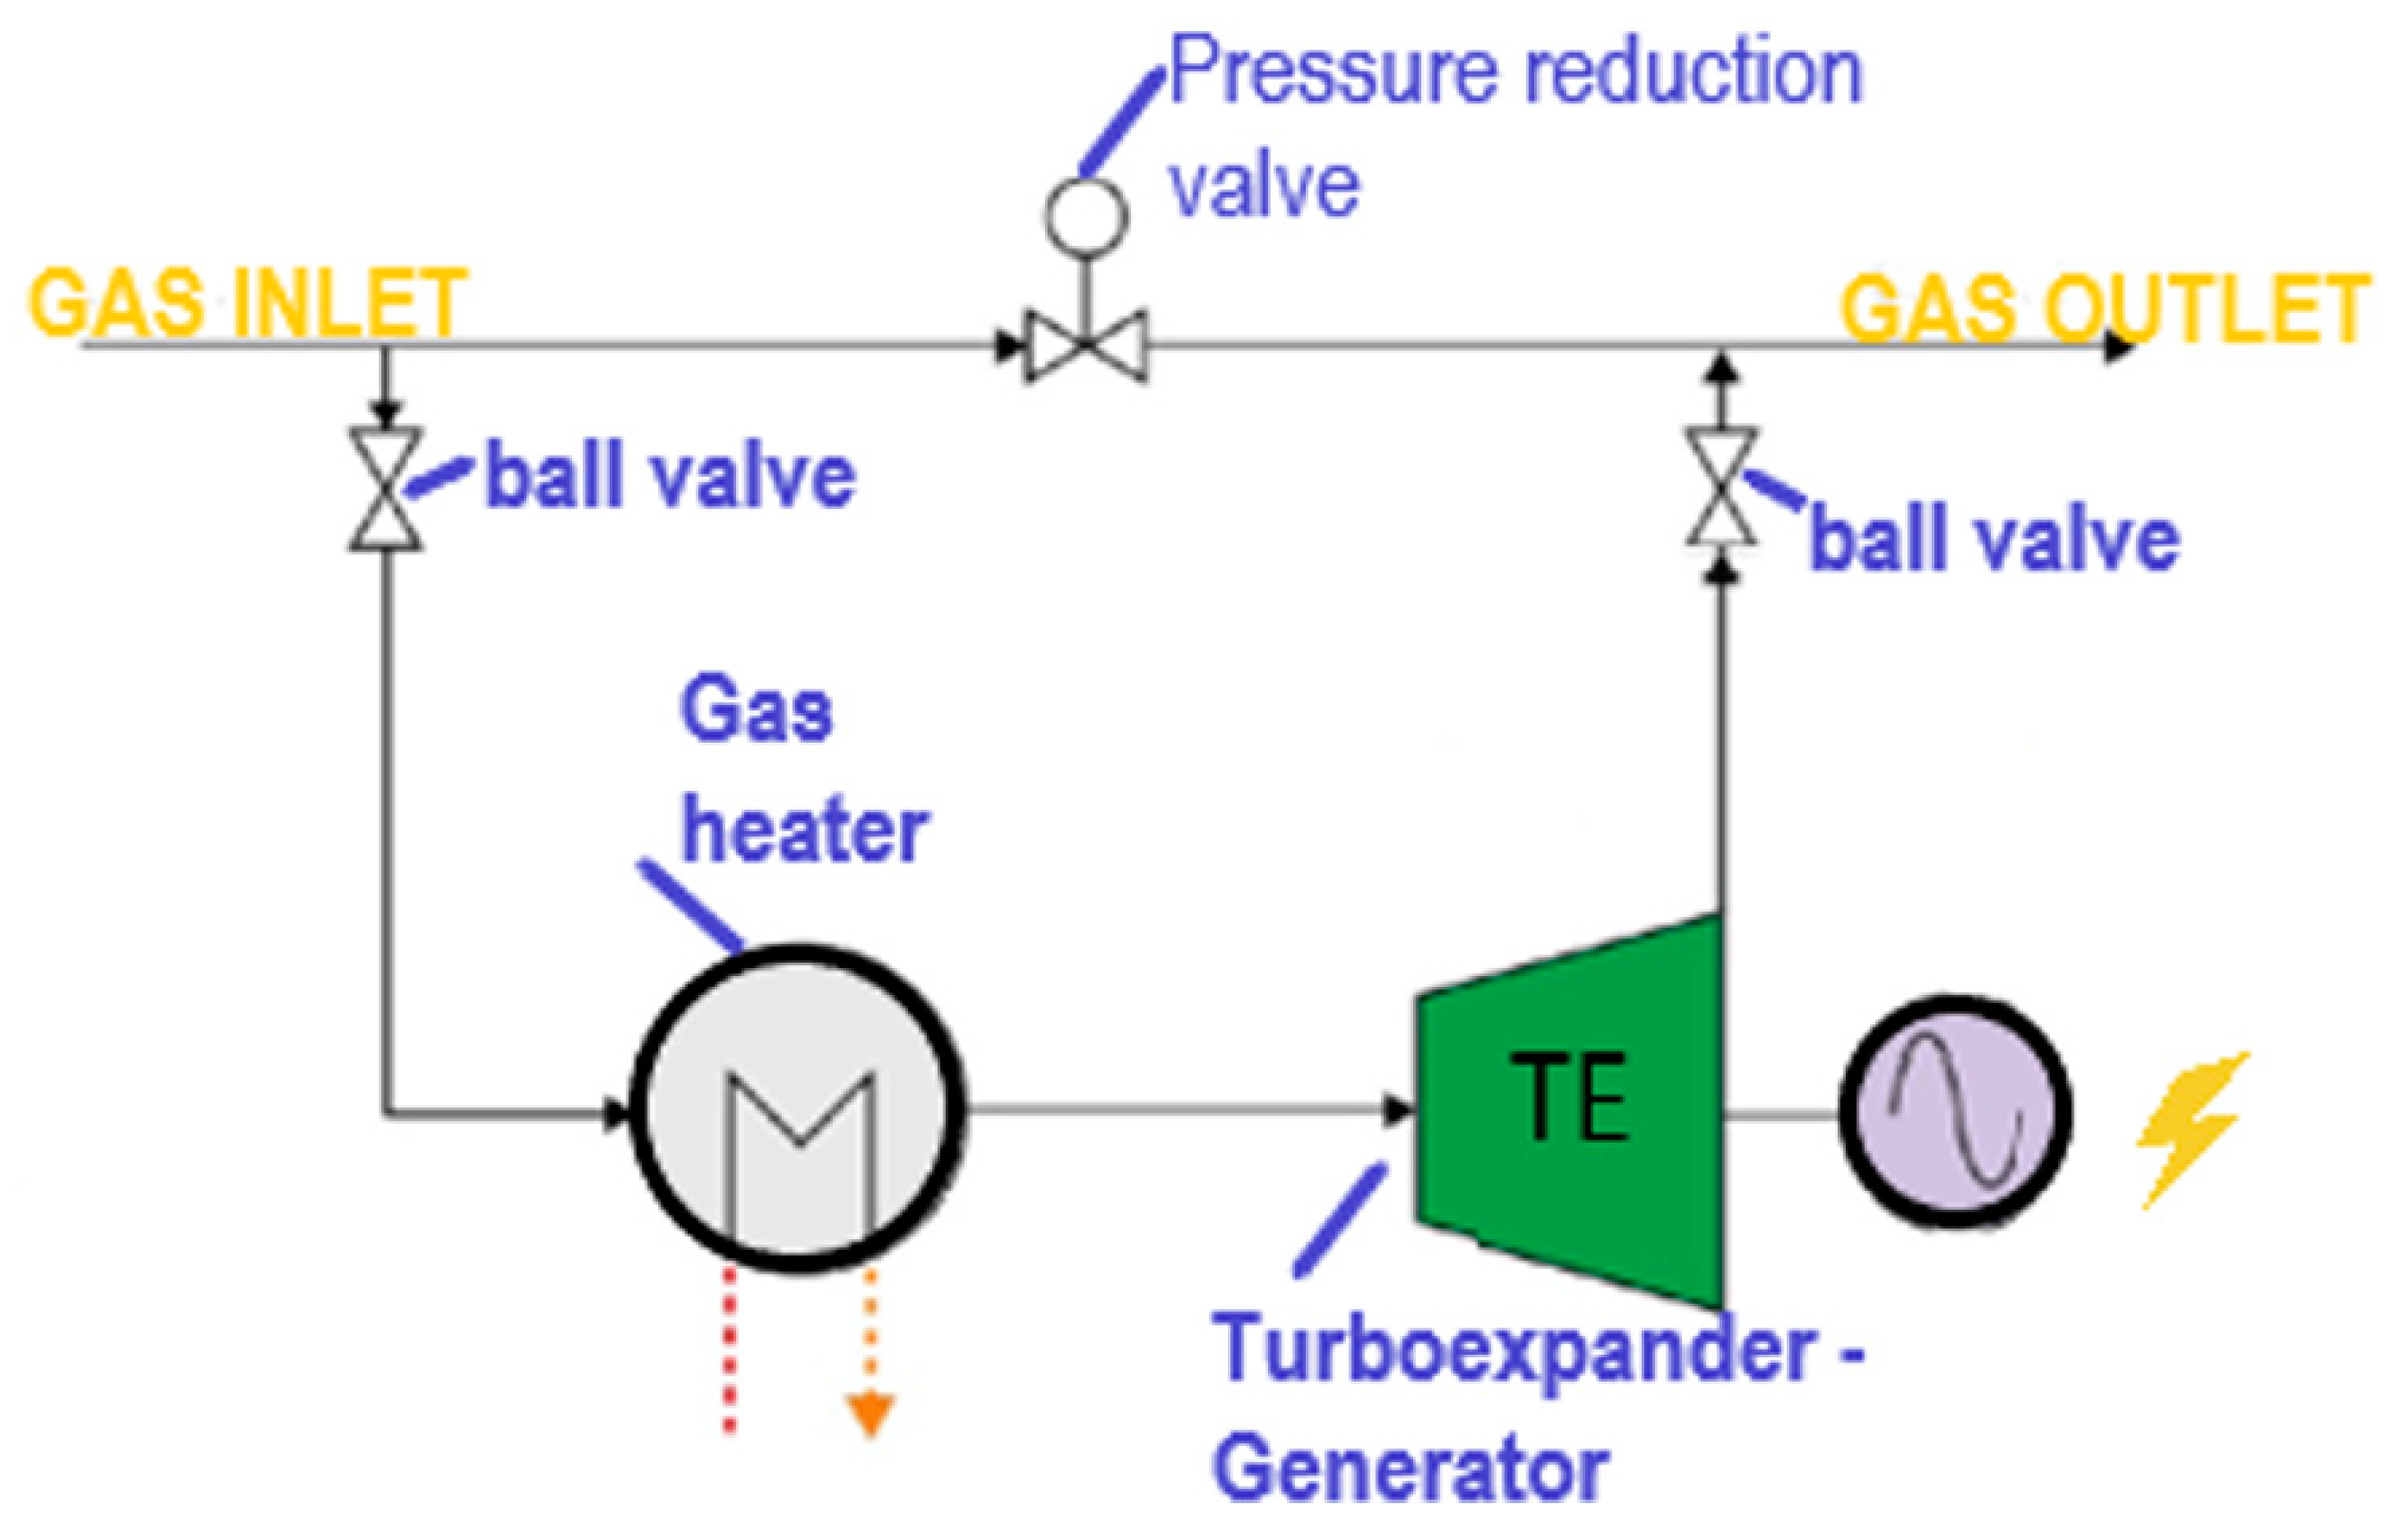
2.2. Exergy Process Description in Pressure Reduction Station at UGS Facility

During the gas withdrawal cycle, the high-pressure gas (19.6 MPa) from the reservoir was pressure reduced via regulating valves before it entered the low-pressure gas transportation network. Each year, approximately 450 × 106 Sm3 of high-pressure gas passed through three reduction valves, with each reduction valve located on a separated and parallel gas reduction line, each with 80,000 Sm3/h of gas flow capacity. The highest feasible pressure before the reduction valve was 17 MPa with constant pressure after the reduction valve at 4.5 MPa. Prior to pressure reduction, the gas was heated to a temperature of 30–50 °C using gas heaters. By installing a turboexpander with a power generator in parallel to the existing pressure reduction valves lines, electricity could be generated by expanding the gas in the turboexpander using the exergy process. Turboexpanders are devices that make it possible to convert the potential energy of the high gas pressure into mechanical work and thus into electricity. They are manufactured as single-stage expanders (for smaller pressure reduction condition) or multi-stage (up to four reduction stages) for greater pressure reduction. The gas enters the expander impeller radially and exits axially. In most process plants, the work generated at the expander wheel is absorbed by a single-stage centrifugal compressor as compression is almost always required downstream of the expander to restore the gas to sale gas pressure [44]. In cases where compression is not required, the expander can drive a generator to produce electricity. Expander efficiencies are quite high, approaching 85% (isentropic) for new installations operating under design conditions. The theoretical thermodynamic path through an expander is isentropic. The theoretical work is calculated on the basis of an isentropic path and corrected to the actual using an expander efficiency (Figure 2).
In the case of multi-component flows and condensation across the expander, the calculation is iterative and is almost always performed on a computer. The expander work could be expressed as follows [44]:
W = m × ∆hisen × Eisen,
where
Eisen—isentropic efficiency,
m—mass flow rate, kg/s
∆hisen—isentropic enthalpy change (head), kJ/kg
W—work, kW
A proposed model of power generation system and hydrogen production and utilisation is shown in Figure 3. The turbo-expander was installed parallel to the existing pressure reduction automatic valve ensuring that the reliability and operational efficiency of the gas withdrawal process was not compromised. During expansion in a TE, natural gas experienced rapid cooling due to the Joule–Thomson effect, with the temperature dropping by approximately 15–20 °C per MPa [32]. The temperature of the gas at the outlet of the TE must be kept above the hydrocarbon and water dew point to avoid condensation and hydrate formation; therefore, a preheater was required to maintain the required outlet temperature of the gas. In the withdrawal cycle, the high pressure (19.6 MPa) of the gas produced was reduced via regulating valves before it entered the low-pressure gas transportation network. Every year, approximately 450 × 106 Sm3 of high-pressure gas passed through three reduction valves, and each reduction valve was located on a separate and parallel gas reduction line.

3. Mathematical Model Description

In this study, a comprehensive mathematical model of a UGS facility was used for the simultaneous simulation of real-time gas flow from the porous rock through the production string and surface equipment and electricity production incorporating a turboexpander. The model was based on an earlier mathematical UGS model described in detail in [45]. It consisted of several individual mathematical models (a reservoir model, a well model, and a surface pipeline model), which have now been upgraded and integrated with the GCAP model used for modelling the turboexpander parameters and calculating the power output. Using model-generated predictive case scenarios, it was possible to examine the immediate effect of uneven gas flow and pressure variation (resulting from gas storage natural working regime) on energy production via the turboexpander and to calculate the cumulative generated electricity via the turboexpander device during a typical withdrawal cycle. A mathematical model of the UGS facility was developed and validated using real field data from the Croatian UGS facility collected during both the production and injection storage work cycles, as documented in reference [43]. The model was validated on the production/injection history and was suitable as both a prediction and a simulation tool for the UGS process in Croatia. The data uncertainty was checked by a sensitivity analysis. Eclipse 100 software was used for the dynamic modelling of the reservoir, while the fluid flow in wells and process lines was modelled using the IPM 13.5 software package. The power output of the TE as a function of gas flow and inlet pressure was modelled using GCAP 9.3 software [41], and the IPM programme RESOLVE [42] was used for software coupling and integration.

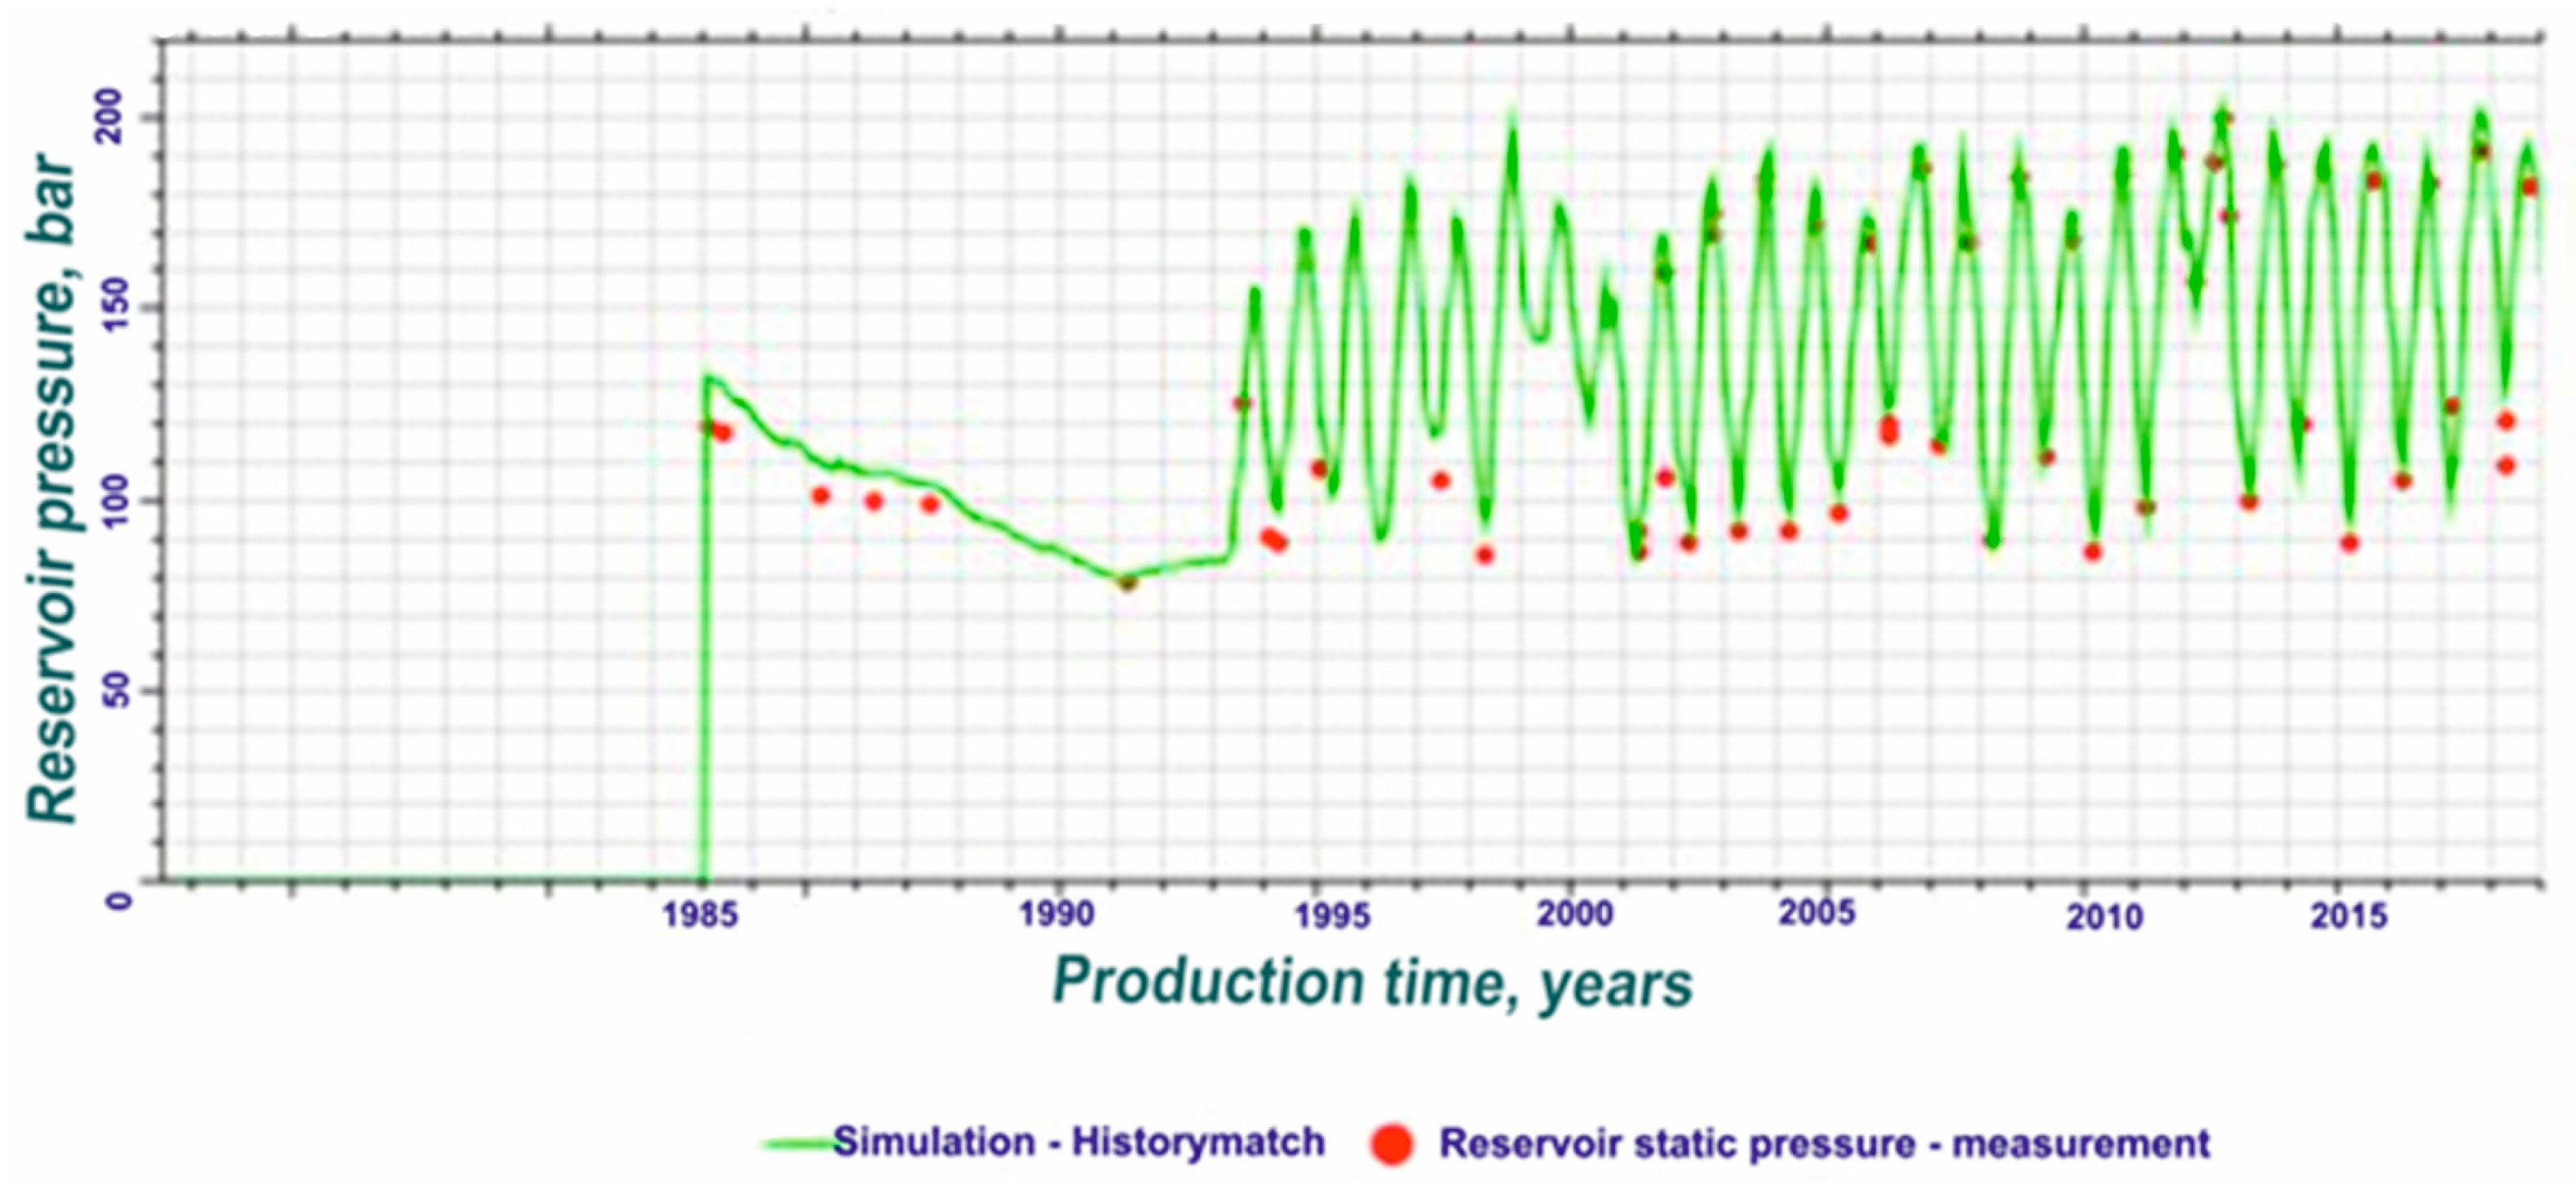
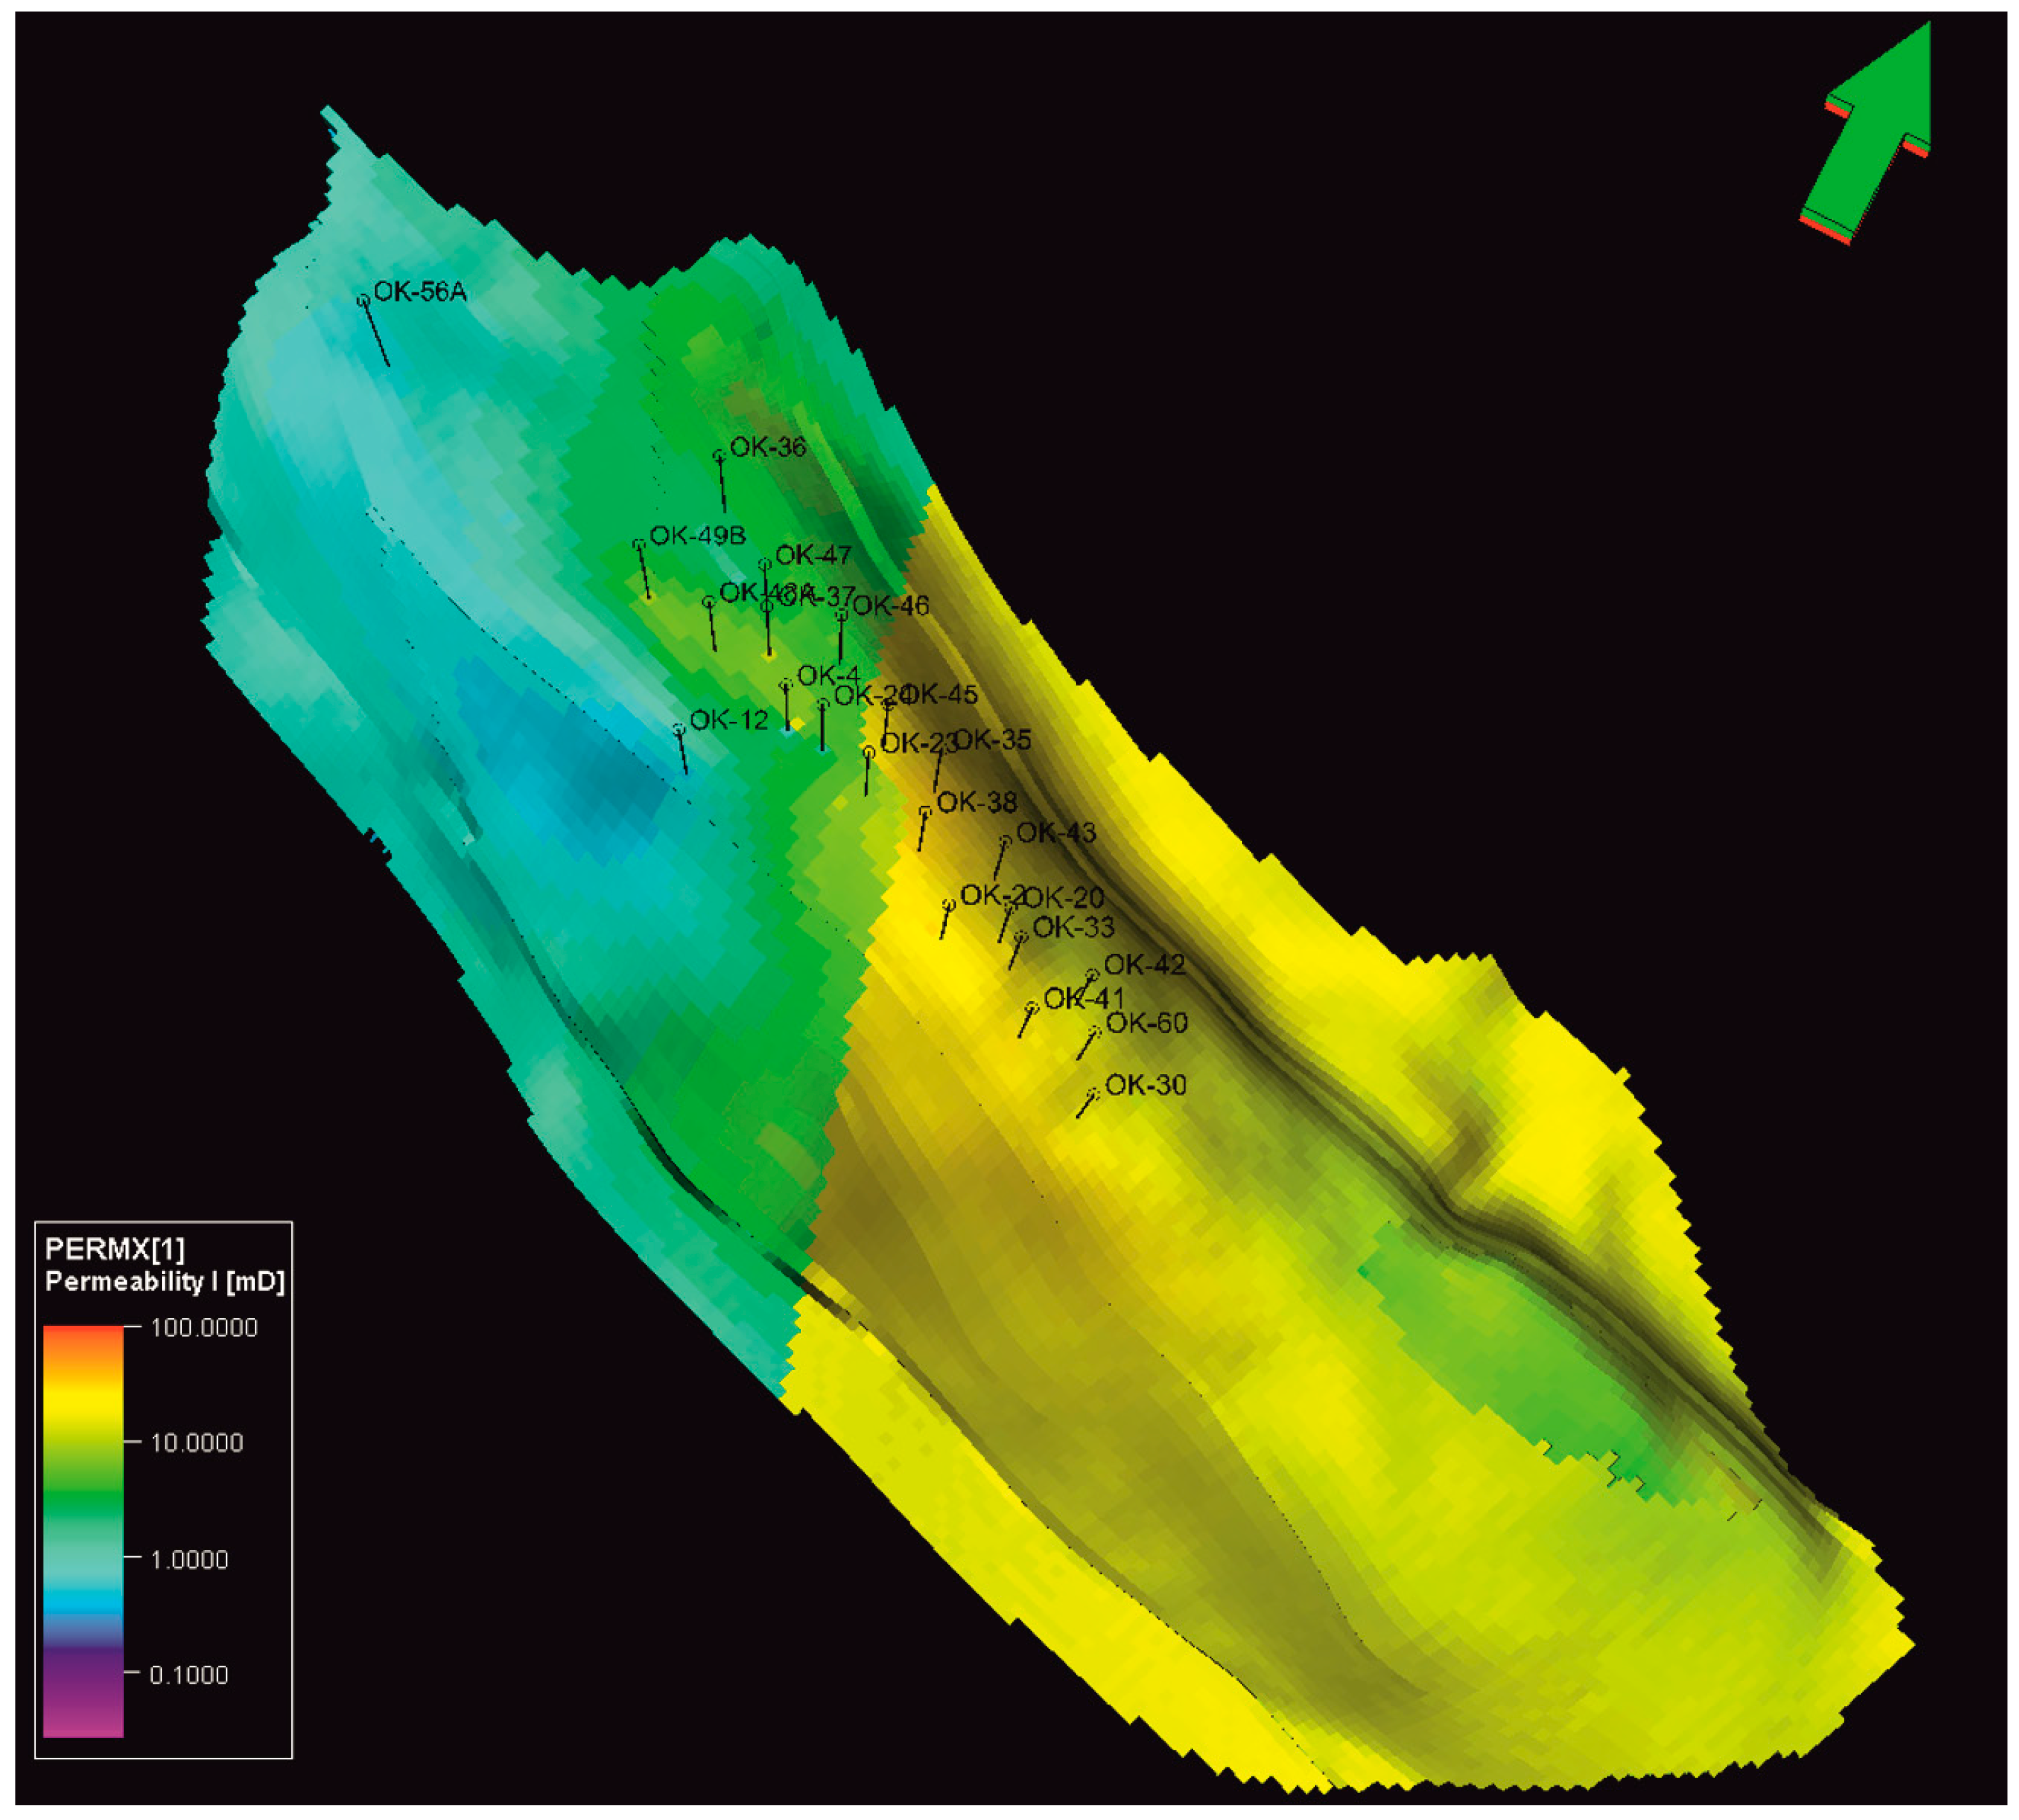
3.1. Reservoir Model Definition

Based on the 3D seismic interpretation of the reservoir, well logging, and reservoir cores data analysis, a static geological model of the underground gas storage was created, which formed the basis for a dynamic UGS reservoir model for injection and gas production process simulation. The dynamic model of the reservoir was created in the Eclipse 100 software, which is described in detail in the literature [43] and was based on the existing geological statical model created in the Petrel 2022.1 software. The model consisted of 181 × 71 × 26 cells (334,126 cells in total), with an average cell size of 50.4 m in the X-direction and 49.8 m in the Y-direction. The reservoir model was history matched with historical gas storage injection and production data. A summary of the basic UGS gas field data is shown in Table 3, the dynamic 3D reservoir model in Eclipse 100 was calibrated using data on production history and the injection/withdrawal cycles (see Figure 4), and the permeability model distribution and the 3D view of the UGS reservoir are shown in Figure 5.
The reservoir model consisted of three separate sandstone layers, which also represented three separate hydrodynamic units. Sandstone deposits were separated by impermeable clay layers. Gas production and injection into the reservoir was performed through working wells, which also served as injection wells. The relevant reservoir parameters are given in Table 3.

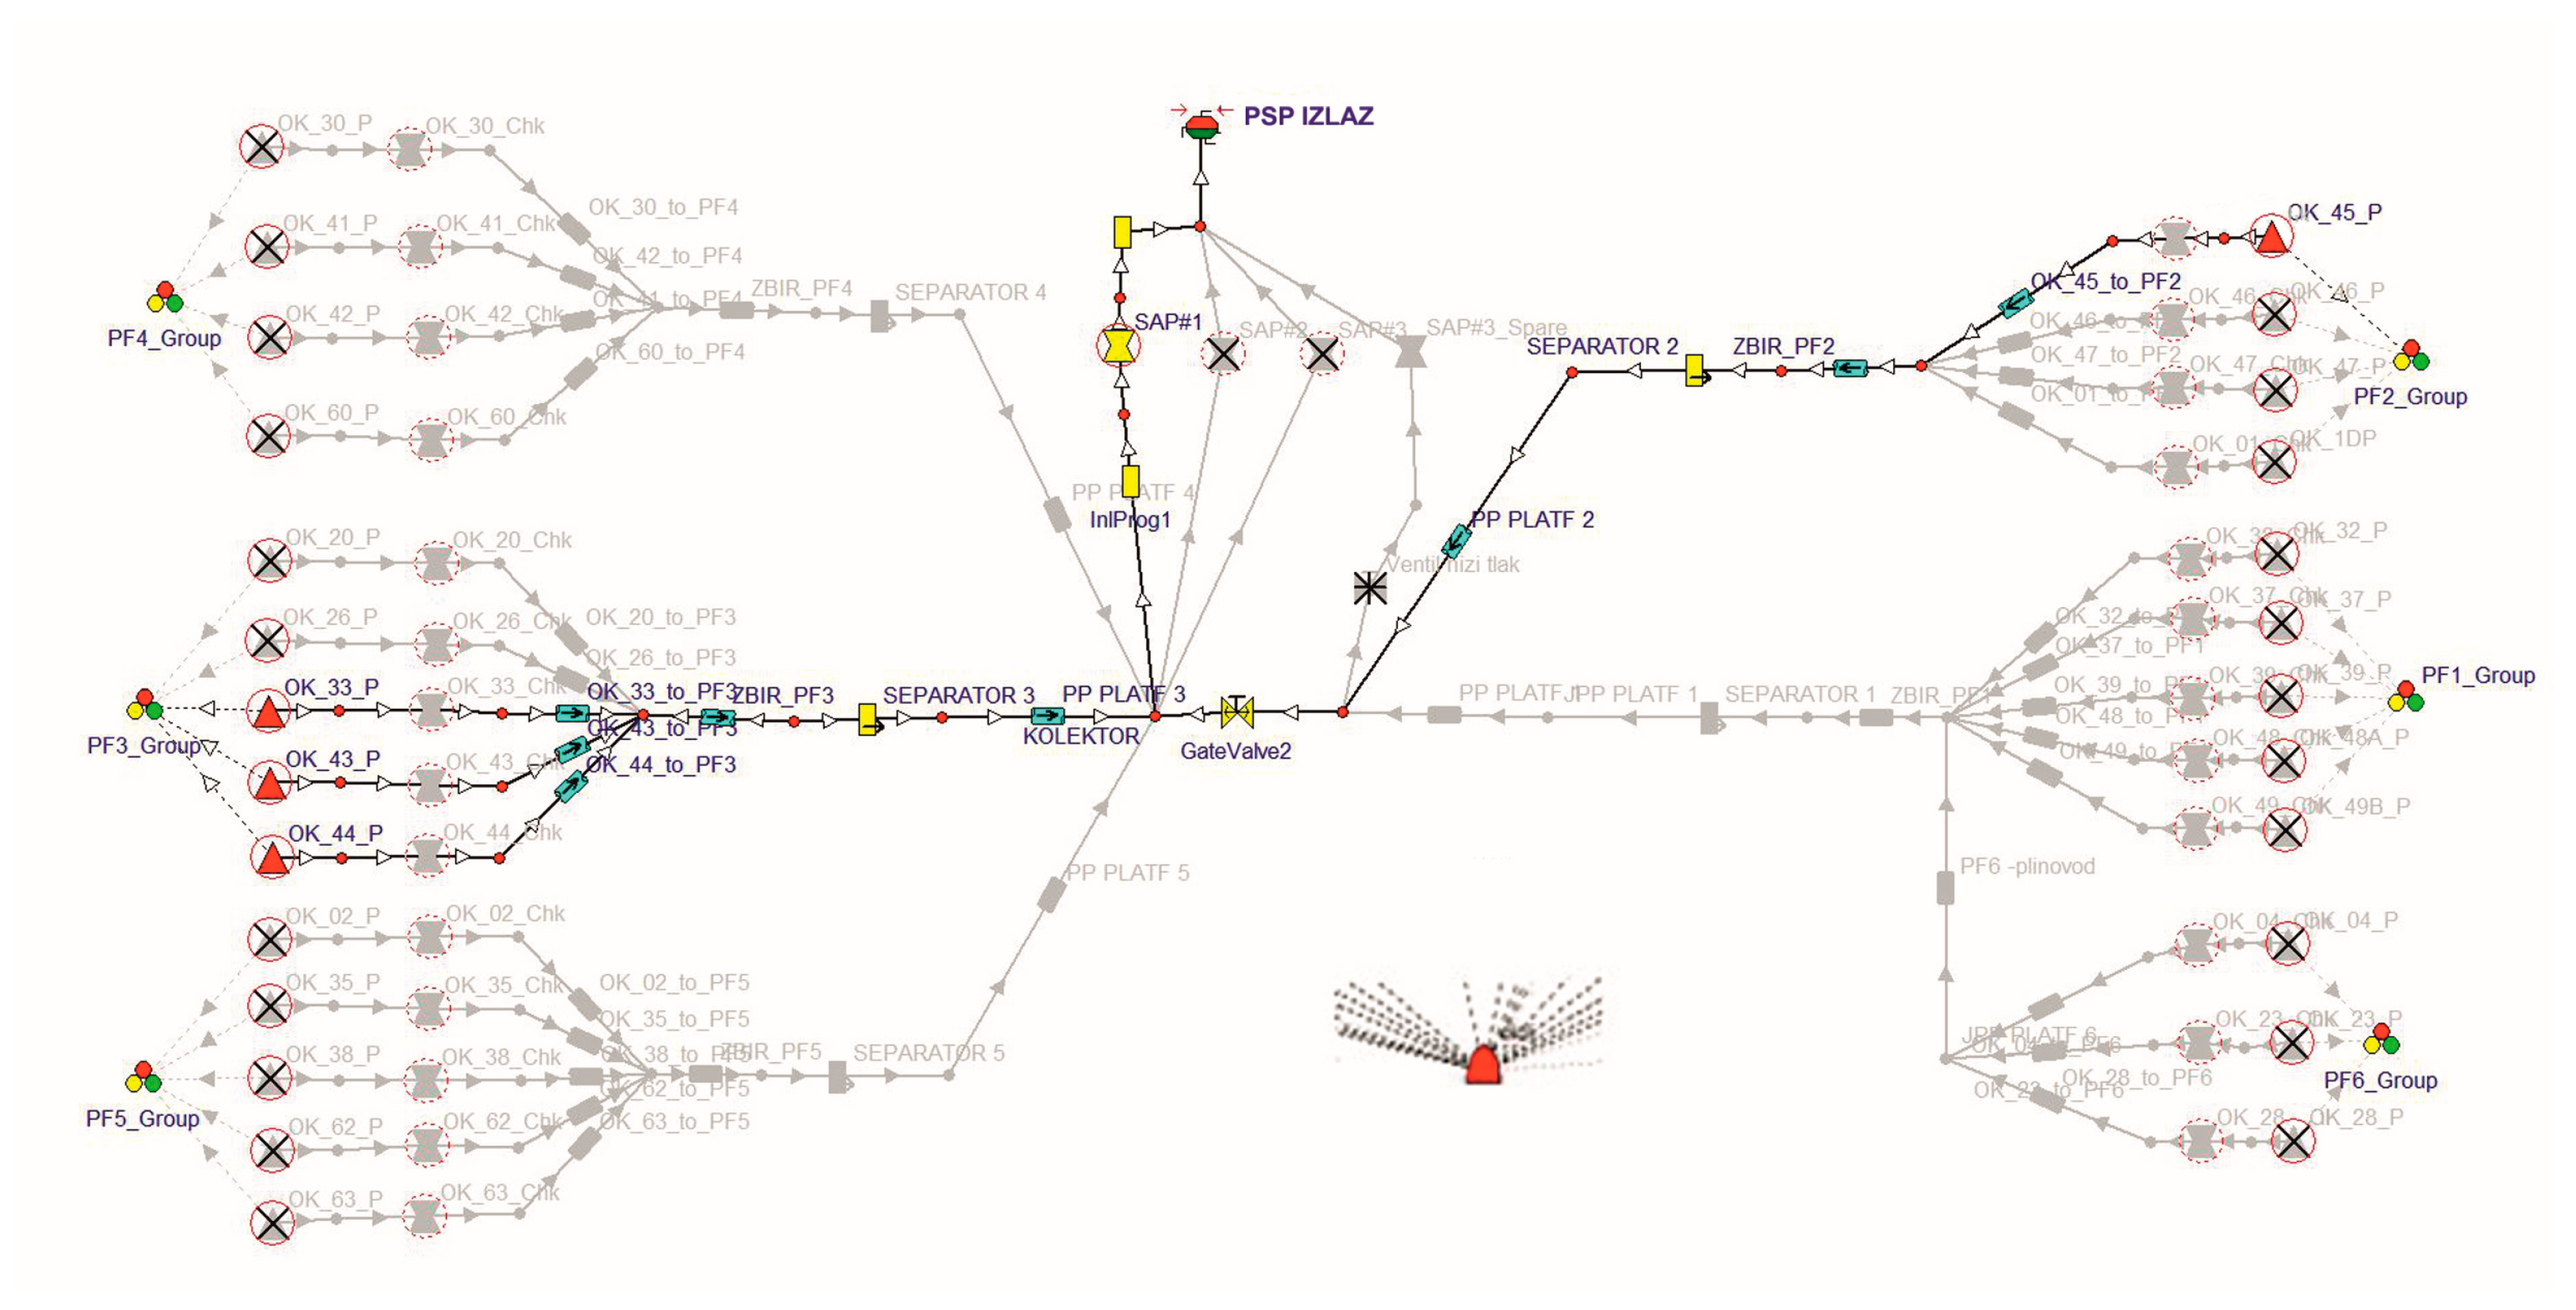
3.2. Pipeline Surface Model and Wells Model

A steady-state thermodynamic model was used to model the fluid flow from the working wells to the two-phase gas separator that represented the last node pressure in the surface model. Inlet gas pressures, temperatures, and gas flow rate data varied, and they were determined by the reservoir and well model. The pressure loss in the surface pipelines was calculated using the Weymouth equation in the GAP 9.3 software developed by Petroleum Experts Ltd. (Edinburgh, UK) (as referenced in [43]); a model screenshot is presented in Figure 6. The following assumptions were made in the surface pipeline model:
  • Pressure gradient kinetic component was negligible;
  • Horizontal steady-state flow;
  • Pressure and temperature differentials across pipelines were calculated based on mass balances and energy incremental;
  • The same pipe material was assumed for all pipes, and heat transfer to the ground was assumed to be at steady state.
Figure 6. GAP model of UGS field.
Applsci 14 06434 g006
A model of the surface gathering system was matched on real dynamic production data (pressure and temperature drops through pipes and restrictions). The productivity index (PI) of all gas storage withdrawal and injection wells was determined regarding data obtained from modified isochronal tests performed on gas storage wells during injection and withdrawal cycles. The well completion and the injection/withdrawal productivity index are described in the literature [44,46]. The GAP 13.5 software was used to calculate the pressure drop from the wellhead to the last point of the process system (inlet–outlet separator).

3.3. Gas Composition and PVT Model of Reservoir Fluid

The composition of reservoir gas utilised in model is shown in Table 4. Black Oil tables was used for generating the thermodynamic properties of the natural gas in the model, following the method of Kameshwar et al. [47], which described the properties of reservoir fluids under various conditions of pressure and temperature. The main PVT (pressure-volume-temperature) properties of fluids tabulated for different ranges of pressure and temperature of 100 °C were obtained using the Peng–Robinson equation of state [47,48]. The calculated data are listed in Table 5 for the gas composition given in Table 4.

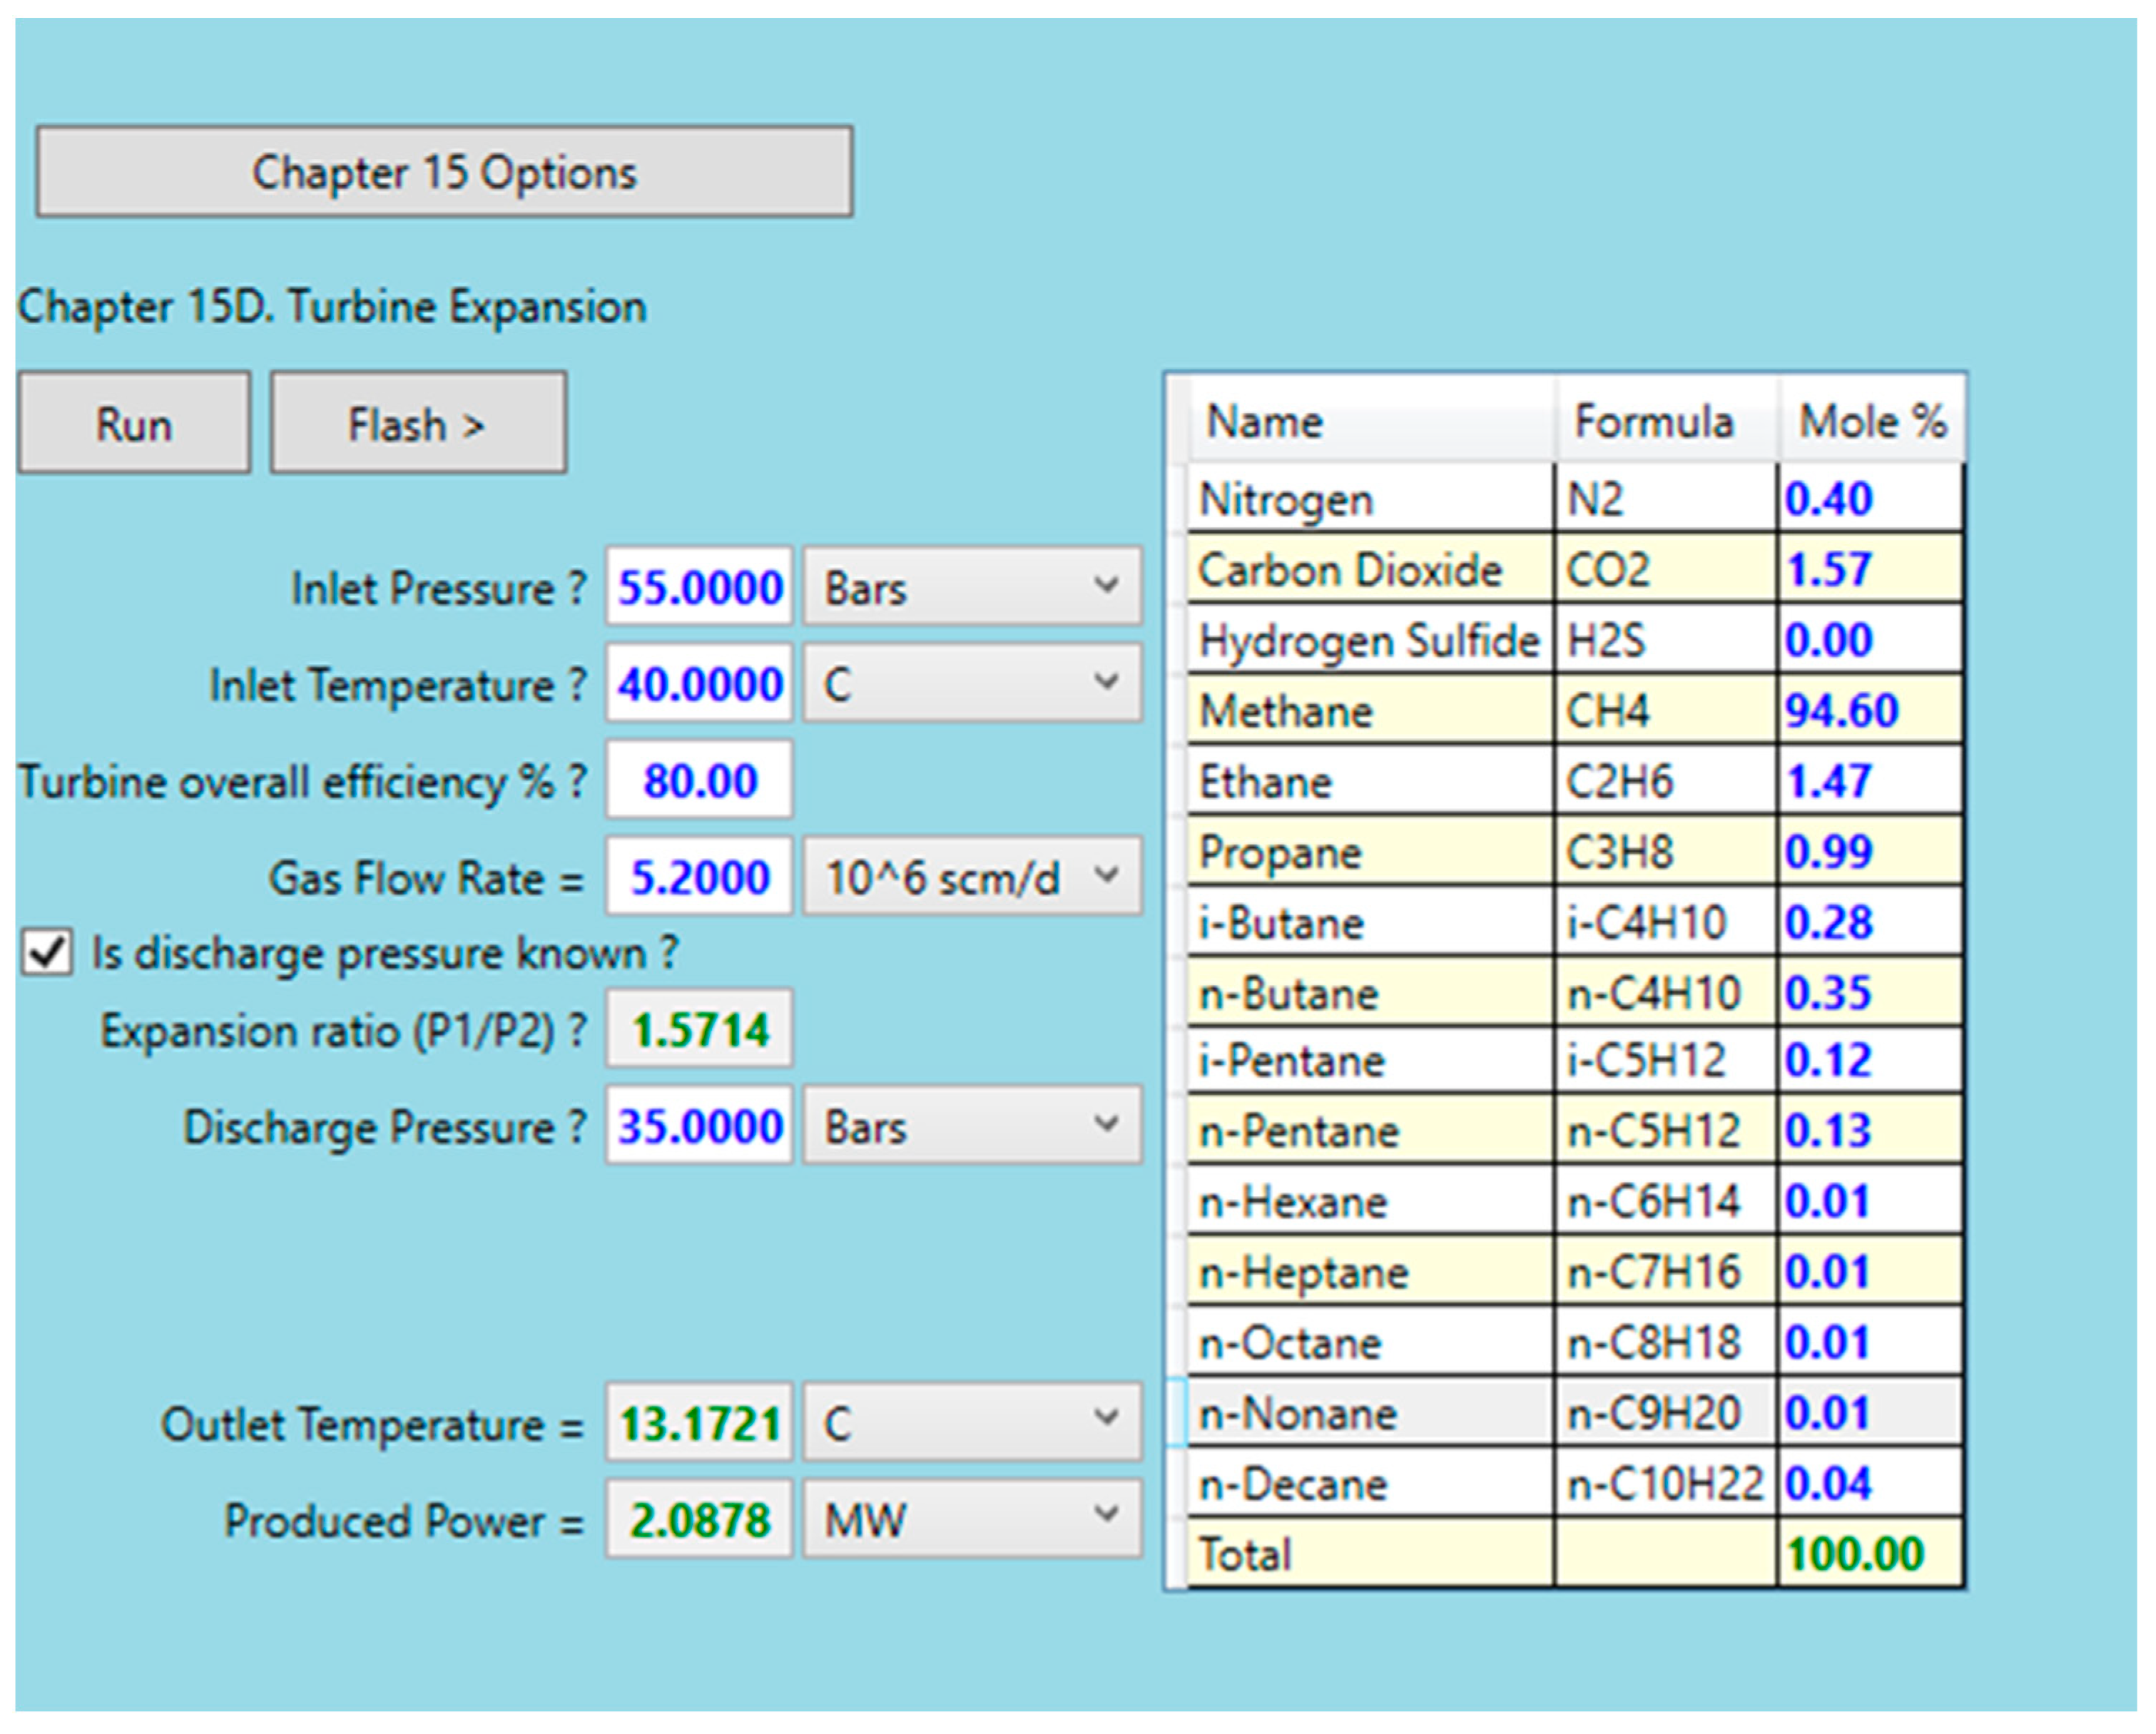
3.4. Integration of Turboexpander in Mathematical Model, and Case Scenario Definition

The technological process of gas flow and pressure reduction through TE was simulated with the GCAP 9.3 software [41]. The model assumed that the gas reduction valve inside the gas reduction station was replaced by a turboexpander–generator device. In the software the expander and generator were combined in an equipment model shown in Figure 7.
The required input parameters are entered for material stream “1”, and the simulation results for steady gas flow are shown in stream “4” and “q100”. The input parameters consists of the following:
  • Gas inlet pressure, MPa;
  • Gas inlet temperature, K;
  • Mole fraction of individual gas component, –;
  • Gas flow rate, kg/h.
The model in GCAP assumed a fixed pressure drop value of 2 MPa across a turboexpander. Considering that the model results for the fixed pressure drop and variable gas flow of the selected TE showed an almost linear dependence between the TE power generated and the gas inlet volume flow, the TE model was integrated in the GAP 13.5 model for simplicity via programme code using the “Inline Programmable Element” option describing the linear dependency of the gas flow and the available power and TE (Figure 8). The model was configured for a fixed pressure value before the turboexpander at 5.5 MPa and the last node separator pressure of 3.5 MPa.
The RESOLVE® 13.5 programme (Petroleum experts 13.5 Ltd. (Edinburgh, UK) [42]) was used as a platform for managing and integrating the individual models. After integration, the logic of each simulation step was programmed within the RESOLVE in terms of adhering to the model restrictions and the achievement of the simulation objective. The possibility of transferring the data from one application (individual model) to another facilitated dynamic communication between all individual models (wells, surface network, and reservoir).
The following input settings and restrictions applied in the RESOLVE model for calculating the amount of hydrogen produced per withdrawal cycle:
  • Last system node pressure (gas separator pressure) = 3 MPa;
  • Number of active withdrawal wells = 22;
  • Maximum drawdown available at each well = 3 MPa;
  • Maximum allowable gas production = 220,000 Sm3/h;
  • Fixed pressure upstream of the turboexpander (IGPE) = 5.5 MPa;
  • Maximum permitted gas rate for injection = 160,000 m3/h;
  • Limit value for withdrawal gas rate = 240,000 m3/h;
  • Minimum average reservoir pressure = 8 MPa;
  • Maximum average reservoir pressure = 19.6 MPa;
  • Minimum permissible pressure at the wellhead = 5.5 MPa;
  • Maximum permissible downhole pressure value = 21 MPa;
  • The withdrawal cycle began on the first of October and ended at the beginning of April. The injection cycle began on the first of April and ended at the beginning of October.
Depending on the reservoir pressure drop, the productivity index of the wells in operation, and the pressure drop due to the hydraulic resistance of the well string and the process equipment, the output data of the model provided values for the maximum possible gas production from the storage, the current water production, and the available electric power at the electrolyser required for hydrogen production at any given time. A graphical representation of the results obtained is provided in Section 4. The RESOLVE 13.5 model integration is shown in Figure 9.

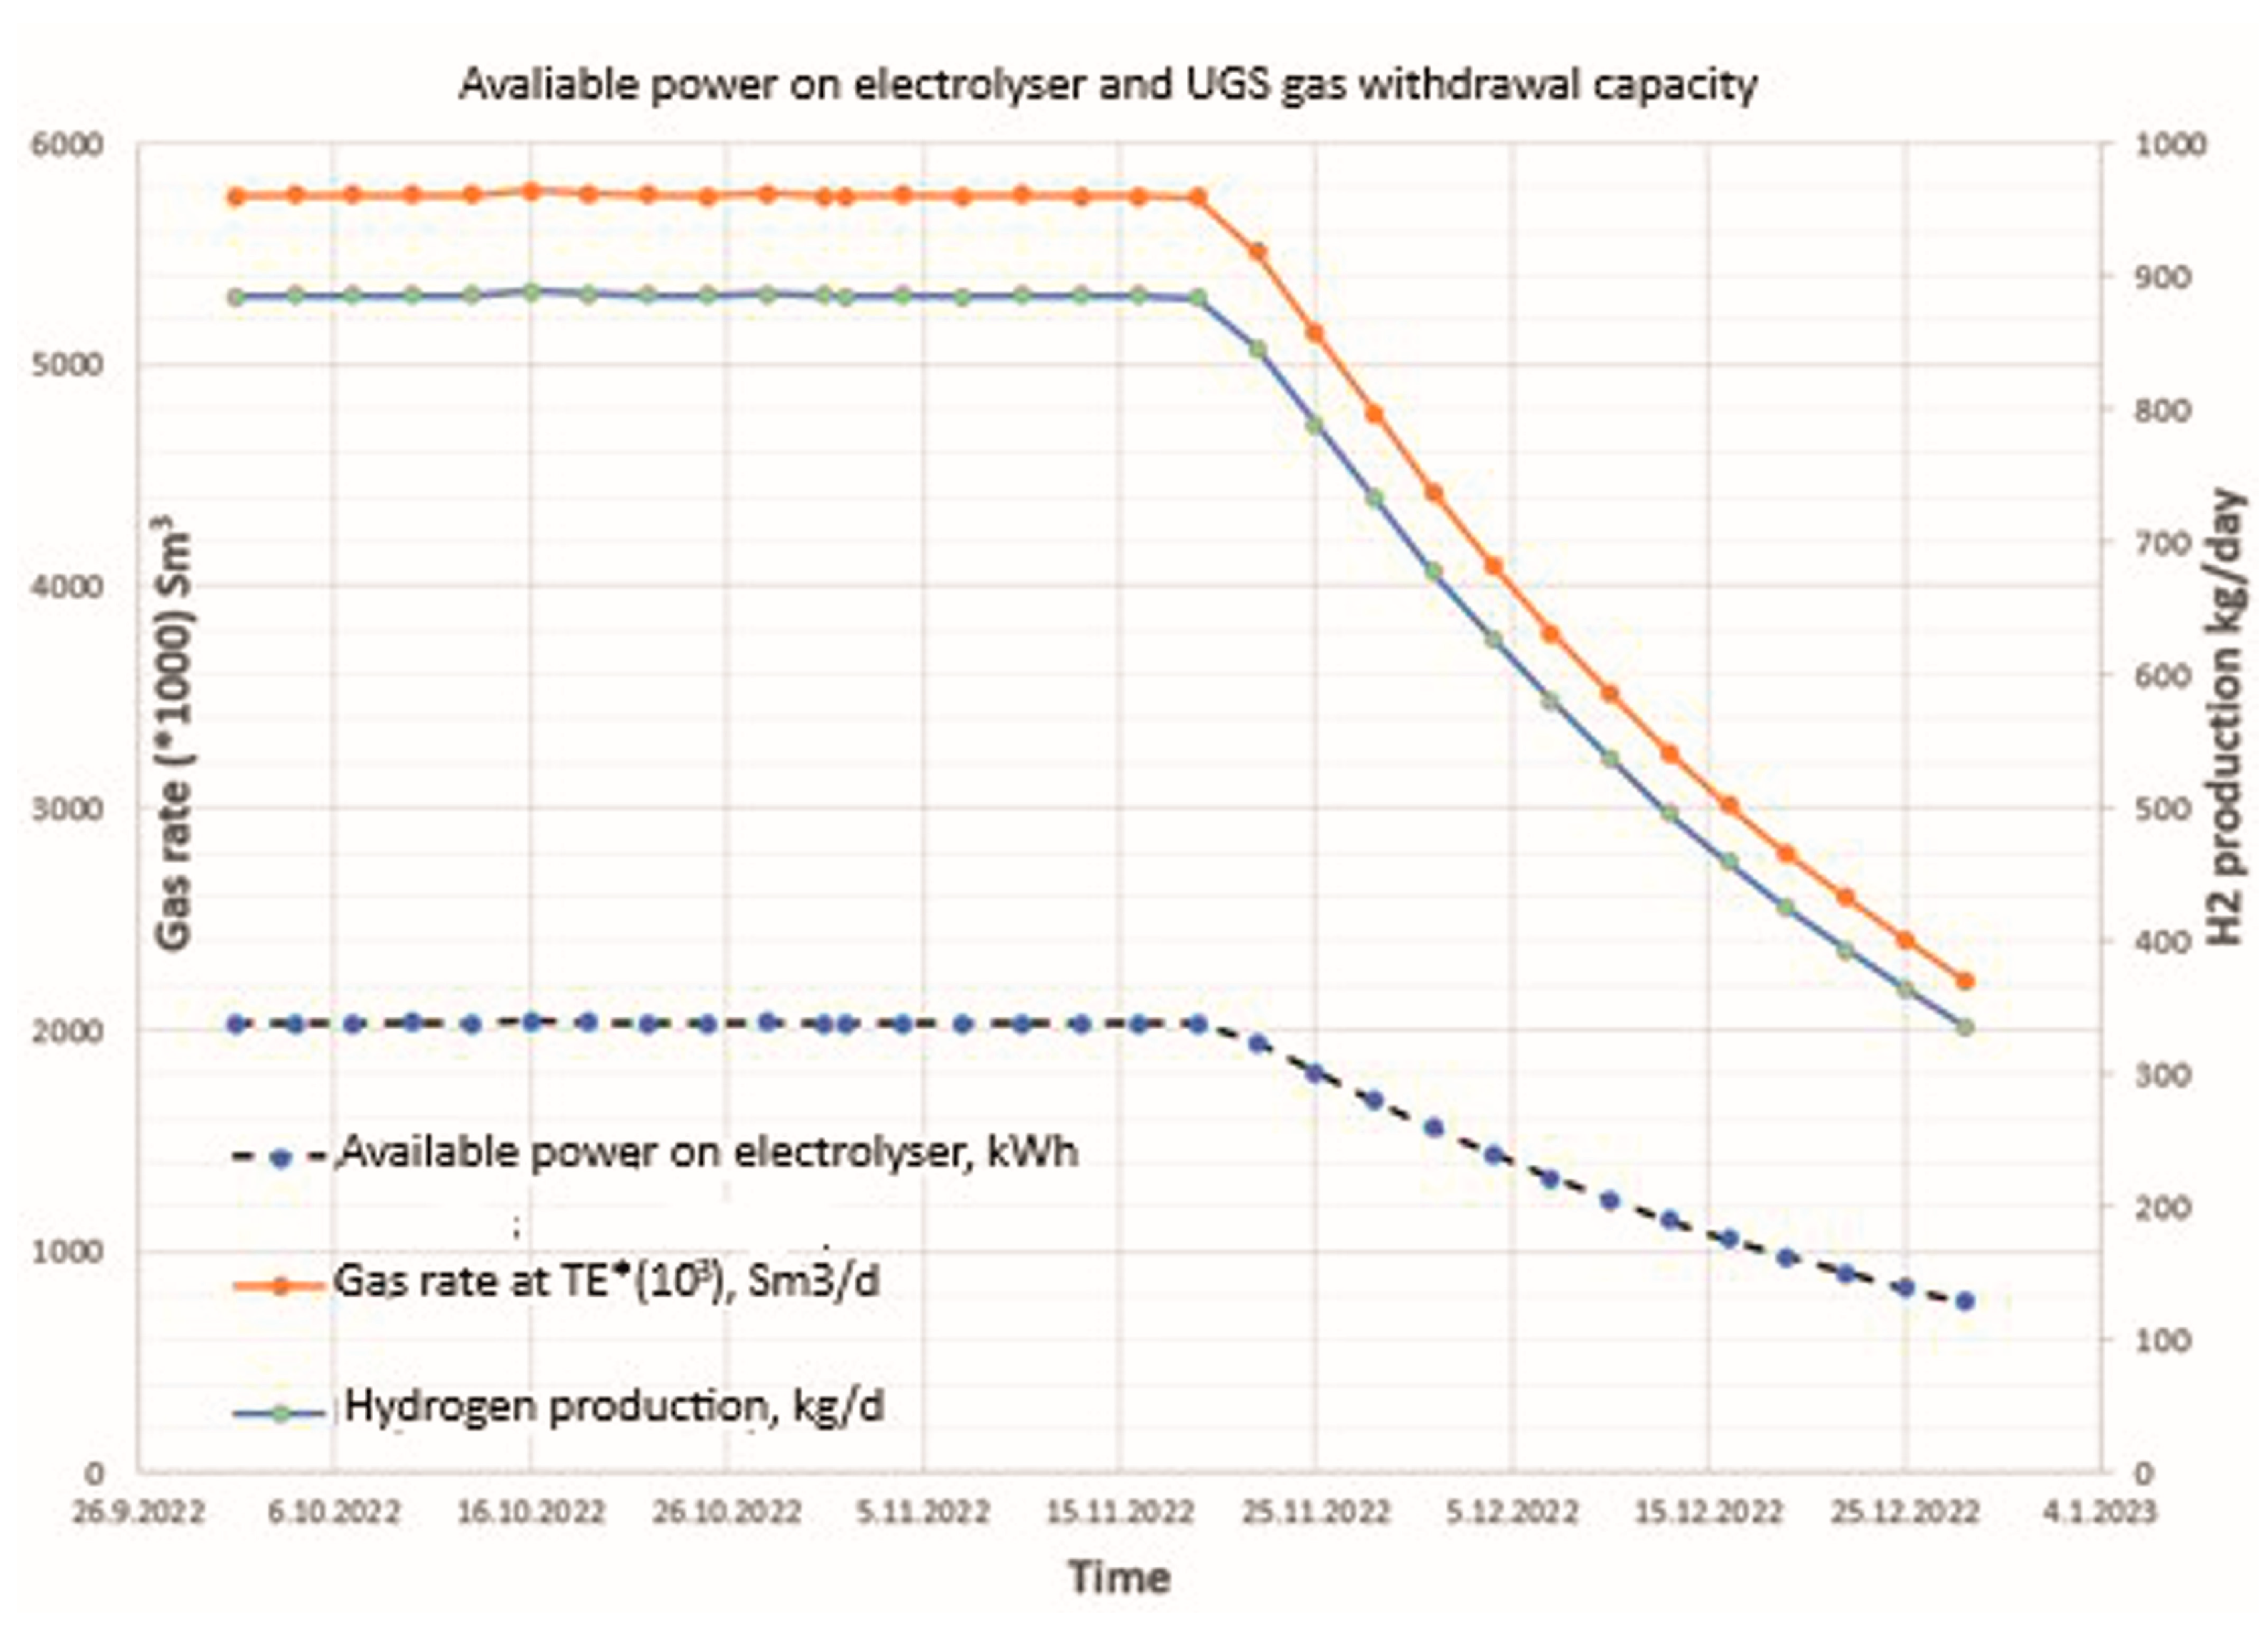
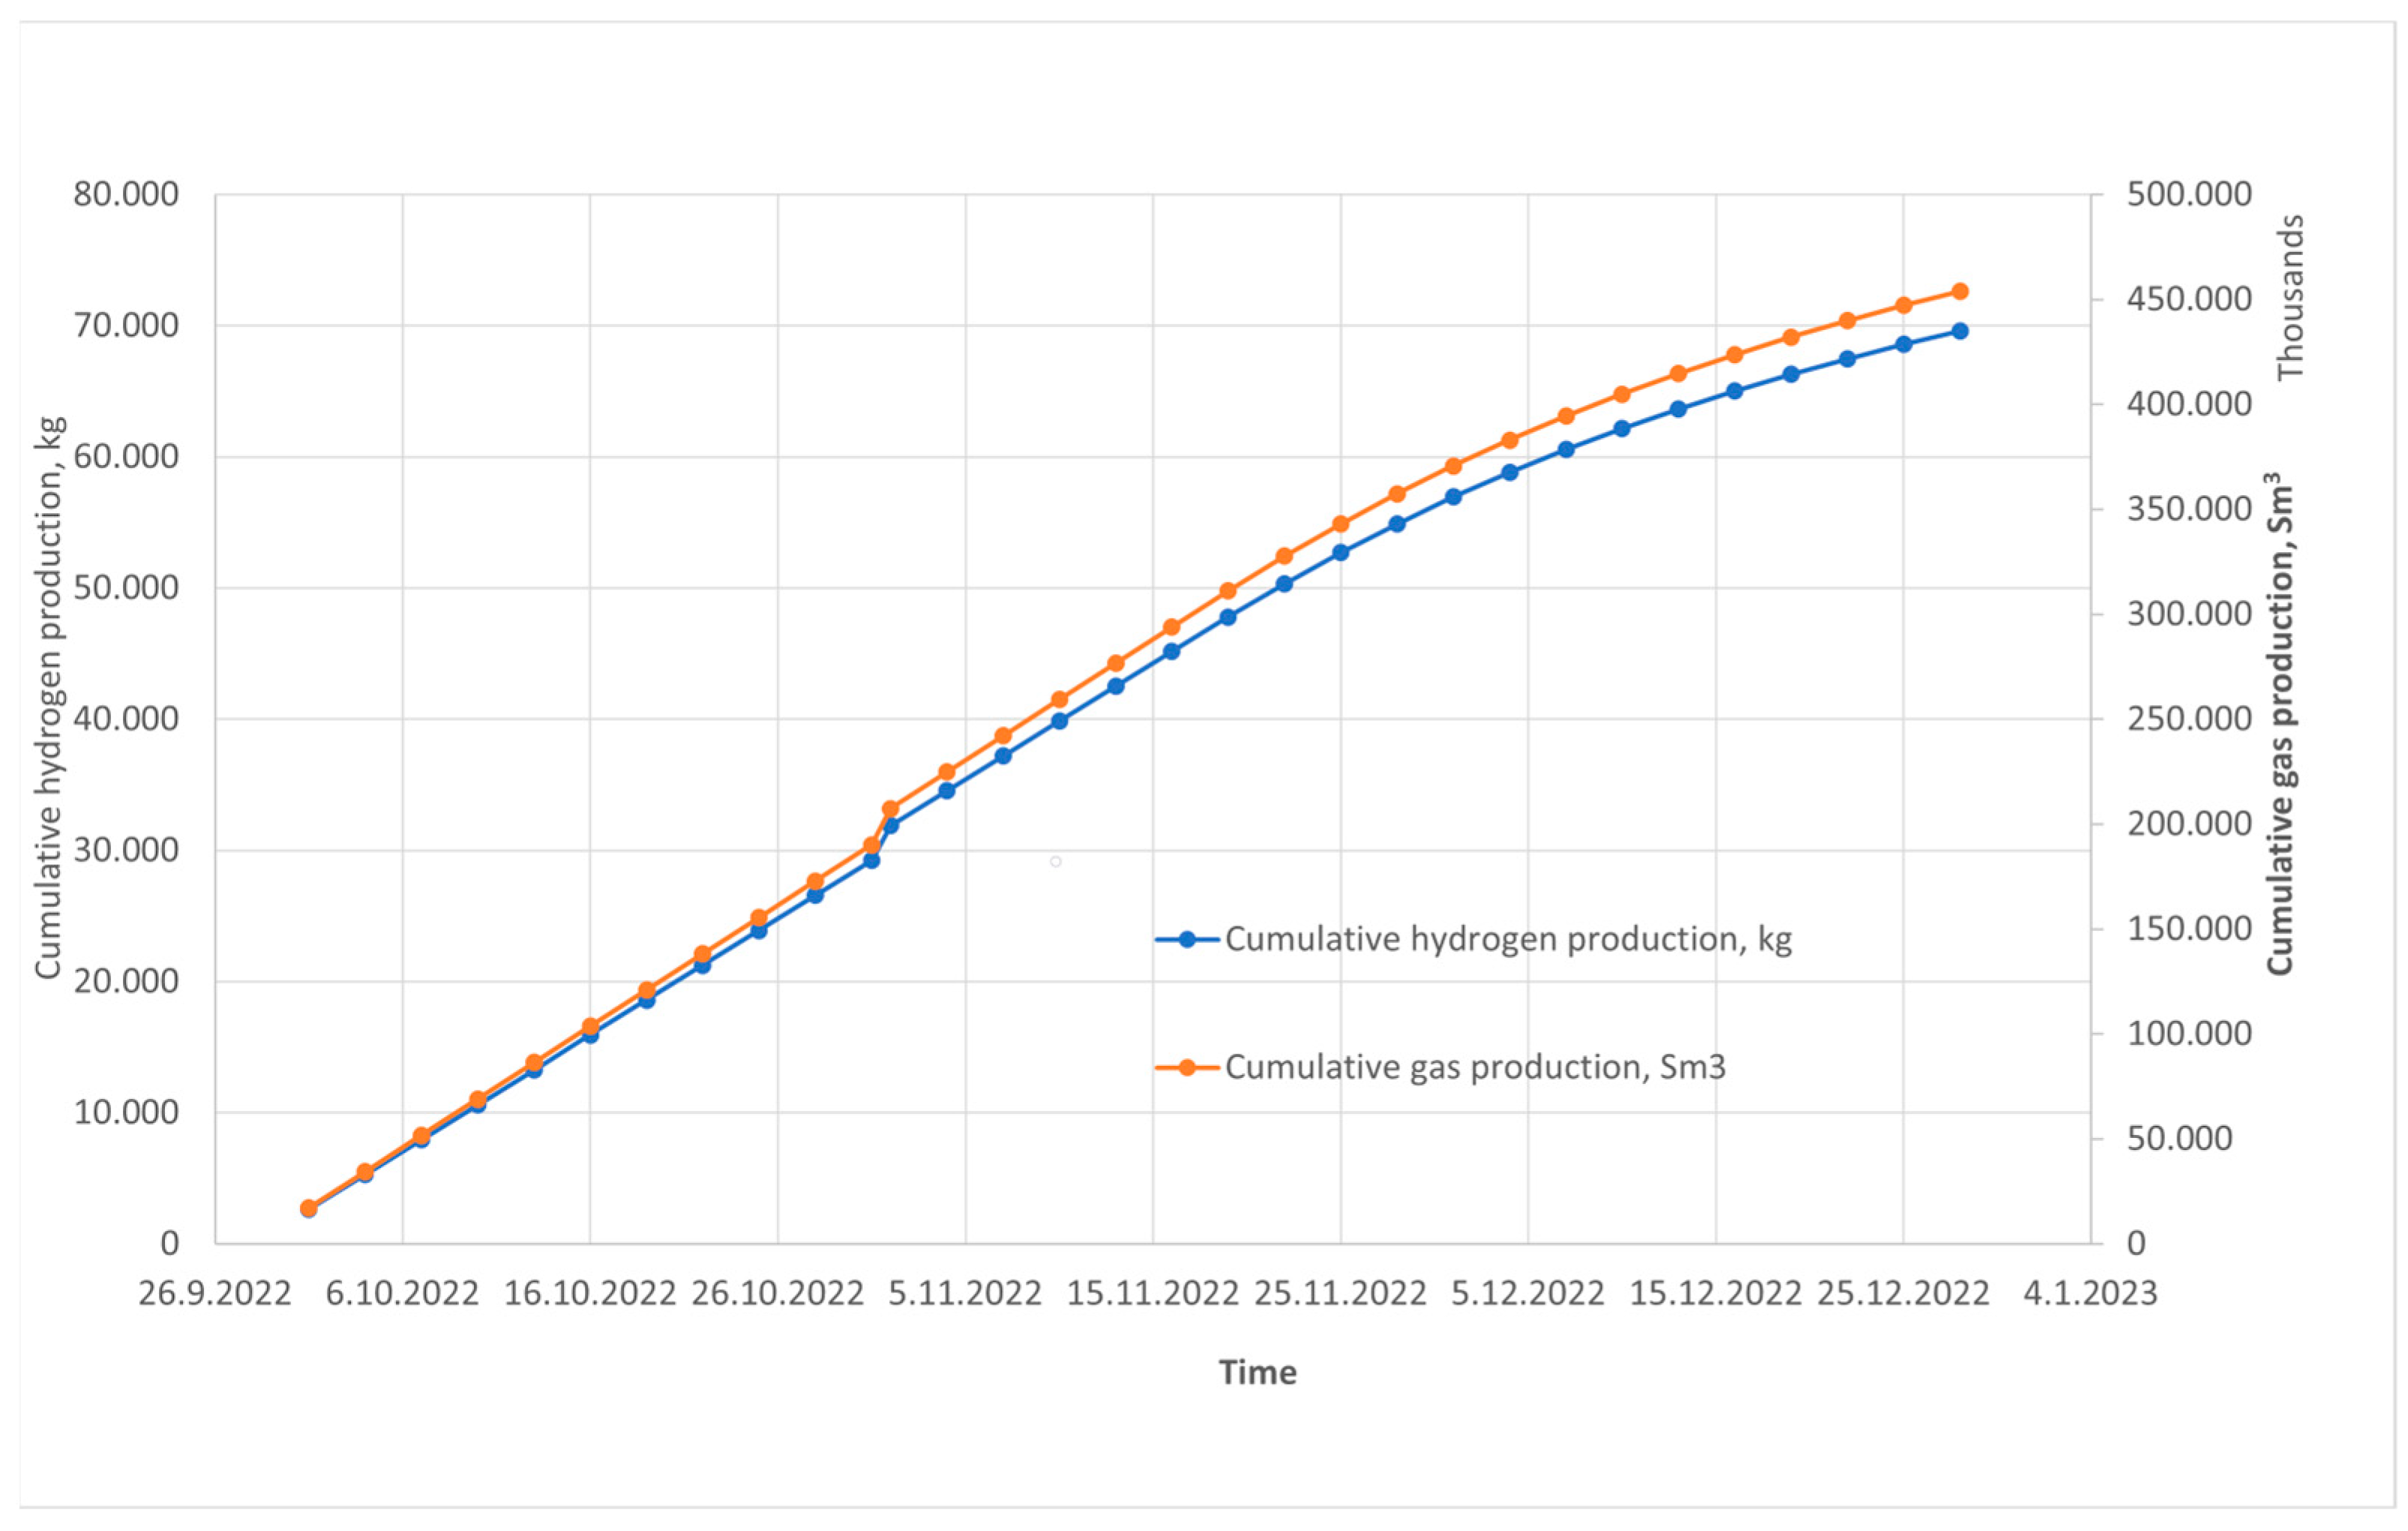
4. Simulation Model Results and Discussion

The UGS gas withdrawal cycle was simulated using an integrated mathematical model. The dependence of hydrogen production on the gas withdrawal capacity and the electrical energy generated is illustrated in Figure 10.
During the gas withdrawal process, when the intensity of the reservoir pressure still allowed maintaining a maximum constant gas extraction plateau, the available power at the turboexpander-generator remained constant at approximately 2000 kWh. As the output capacity of the storage decreased, the available electrical energy also decreased, amounting to 760 kWh at the end of the withdrawal cycle at a gas flow rate of 200,000 Sm3/day. Figure 9 also describes the simultaneous hydrogen production via the PEM electrolysis system, which depends on the current availability of electrical energy at the TE generator. Depending on the gas flow rate through the pressure reduction station, the model results showed a direct dependency between the calculated hydrogen production and the volumetric flow of gas through the pressure reduction station. At 844 kg/day the production was almost continuous for almost two months before dropping to 335 kg/day towards the end of the withdrawal cycle. Since the simulation of the gas withdrawal process ran continuously at the maximum possible output capacities, the simulated withdrawal cycle lasted about 90 days. During this period, it was possible to produce the entire working gas volume from the storage (440 million m3) and generate about 70 tonnes of H2, as shown in Figure 11.
As can be seen from Figure 12, the maximum daily hydrogen production was possible until the reservoir pressure of 11 MPa, which corresponded to approximately 60 withdrawal days.
After this period, the hydrogen production began to fall to its minimum value of 335 kg/day at a reservoir pressure of 8 MPa. As this was a water-drive gas reservoir with low aquifer strength, significant quantities of produced formation water could only be expected towards the end of the gas withdrawal cycle, after the gas–water contact had increased due to the lower reservoir pressure. In this phase of gas withdrawal, a smaller amount of electrical energy was generated on the TE side, thus reducing the water consumption required for electrolysis during this withdrawal period. Figure 13 shows the dynamic trend of the gas temperature at the inlet and outlet of the TE. It can be seen that the temperature drop at the outlet was greater towards the end of the gas withdrawal cycle, corresponding with a decrease in the inlet gas temperature at the TE and a reduction in the gas withdrawal capacity from the reservoir. The initial outlet gas temperature from the TE was about 2 °C and dropped to −57 °C at the end of the withdrawal cycle. It can therefore be concluded that the gas must be reheated before entering the TE in order to prevent the formation of hydrates due to the Joule–Thomson effect in the final phase of the gas withdrawal process.
The total amount of electrical energy generated by a turboexpander during a single gas withdrawal cycle from the storage was approximately 3.82 TWh. Considering that the production of 1 kg of hydrogen via the PEM electrolysis system requires about 10 L of deionised water with a purity of 5.0 [49], the estimated water consumption for the production of 70 tonnes of hydrogen per gas storage cycle would be about 700 m3. Historical data on formation water production at the underground gas storage indicate that it varies depending on the withdrawal cycle duration and that between 400 and 850 m3 of water is extracted per gas withdrawal cycle. If the entire working volume was withdrawn from the storage, the water production was closer to the average values of around 800 m3 per cycle. From this, it can be concluded that the annual volumes of water produced per storage operation cycle would meet the requirements for hydrogen production.

5. Conclusions

The energy transition is a crucial process that society must undergo in order to reduce its dependence on fossil fuels and move towards clean, sustainable, and renewable sources of energy. At the centre of this transition is the “hydrogen paradigm”—the increasing importance of hydrogen as a key element in achieving this goal. Through a detailed analysis in this study, the potential application of underground gas storage technology for the sustainable production of clean energy and hydrogen was demonstrated. Our research showed that components of underground gas storage technology could be utilised for carbon-free energy production and, through the synergy of water production at the gas storage facility during the withdrawal cycle, for sustainable and closed-loop hydrogen production. The use of a turboexpander-generator-electrolyser system for hydrogen production was investigated as a method of recovering the pressurised gas energy lost during the gas withdrawal process from underground storage facilities. By applying an integrated mathematical model for UGSs, insights were gained into the potential of recovering lost pressurised gas energy to generate electricity and hydrogen during a single gas withdrawal cycle. This approach not only enables additional energy savings for gas storage facilities but also has the potential to improve the efficiency of energy resource utilisation.
The exclusive use of commercial, industry-standard software (IPM 13.5 PETEX package, Schlumberger Petrel RE 2022.1, Eclipse 100, etc.) in our methodology does impose certain limitations on the direct reproducibility of our model results, but despite these limitations, the procedures outlined should enable sufficiently qualified experts to reproduce conceptually similar models for any other gas storage facility.
The results of the simulation model indicated an extraordinary potential for the integration of turboexpanders into existing underground gas storage processes for the production of electrical energy and hydrogen. Based on the given analyses, approximately 70 tonnes of hydrogen per UGS withdrawal cycle could be produced in parallel to 3.82 TWh of electricity generated by the expander (at a constant pressure differential of 2 MPa across the turboexpander) and the utilisation of produced field water. Furthermore, the analysis of the results showed that hydrogen production was sensitive to changes in gas flow through the pressure reduction station, highlighting the importance of process optimisation to maximise hydrogen production. Additionally, a linear relationship was found between the gas flow rate and the available power of the turboexpander, further emphasising the importance of precise process control. The electrical energy generated by this pressure differential can be categorised as “clean” or “green” energy. Consequently, the hydrogen produced under these conditions should also be categorised as green hydrogen. Future regulatory frameworks should support the transportation of this green hydrogen through the gas transmission systems to end users, in order to meet environmental sustainability goals and promote the adoption of cleaner energy solutions.
Also noteworthy was the persistent correlation between the total average water produced from the reservoir during a single gas withdrawal cycle and the total electrical energy generated by the exergy process, which suggested that all water production during a gas withdrawal cycle could be utilised or converted into hydrogen.
Our current energy and climate path requires a reduction in greenhouse gas emissions. However, we cannot predict in advance what innovations will be available when we need solutions. Our research emphasises the crucial role of integrating innovative technologies into existing energy processes to achieve a transition towards a more sustainable and cleaner energy system. In this context, it is essential to advance techno-economic assessments. These assessments will provide essential insights into expected costs, establish verification criteria, and develop optimal operational strategies for the integration of turboexpanders into existing energy processes to enhance energy efficiency and reduce greenhouse gas emissions. The road ahead is challenging, but with the right approach and commitment, a balance between energy demand and environmental preservation can be achieved.

Author Contributions

I.Z. conceptualization, investigation and data analysis, data curation, software, writing original draft; K.N.M. conceptualization, investigation, methodology, writing orifinal draft, funding aquisition, writing and review editing, supervision; I.M. writing and review editing, visualization, supervision, funding acquisition; and D.P. writing and review editing, validation, supervision. All authors have read and agreed to the published version of the manuscript.

Funding

This research was funded by the institutional project “Sustainable Technology Solutions in the Oil & Gas Industry, ORNI”, Faculty of Mining, Geology and Petroleum Engineering, University of Zagreb, Croatia.

Institutional Review Board Statement

Not applicable.

Informed Consent Statement

Not applicable.

Data Availability Statement

Data are available from the corresponding authors by request.

Conflicts of Interest

Author Ivan Zelenika is employed by the company: Podzemno skladište plina d.o.o. Author Darko Pavlović is employed by the company Plinacro d.o.o. The remaining authors declare that the research was conducted in the absence of any commercial or.financial relationships that could be construed as a potential conflict of interest.

References

  1. European Commission (EC). Communication from the Commission to the European Parliament, the Council, the European Economic and Social Committee and the Committee of the Regions. The Role of Waste-to-Energy in the Circular Economy; European Commission (EU COM): Brussels, Belgium, 2017. [Google Scholar]
  2. European Commission (EC). Communication from the Commission. The European Green Deal; European Commission (EU COM): Brussels, Belgium, 2019. [Google Scholar]
  3. Caferra, R.; D’Adamo, I.; Morone, P. Wasting energy or energizing waste? The public acceptance of waste-to-energy technology. Energy 2023, 263, 126123. [Google Scholar] [CrossRef]
  4. Moustakas, K.; Loizidou, M.; Klemes, J.; Hao, J.L.; Varbanov, P. New developments in sustainable waste-to-energy systems. Energy 2023, 284, 129270. [Google Scholar] [CrossRef]
  5. UN General Assembly (UN). Transforming Our World: The 2030 Agenda for Sustainable Development, A/RES/70/1; UN General Assembly GAOR, 70th sess., Suppl. no. 49; 2015. Available online: https://sdgs.un.org/ (accessed on 26 June 2024).
  6. European Commission (EC); International Renewable Energy Agency (IRENA). Renewable Energy Prospects for the European Union; European Union: Maastricht, The Netherlands; IRENA: Abu Dhabi, United Arab Emirates, 2018; pp. 1–120. [Google Scholar]
  7. Brown, S.; Jones, D.; Fulghum, N.; Bruce-Lockhart, C.; Candlin, A.; Ewen, M.; Czyżak, P.; Rangelova, K.; Heberer, L.; Rosslowe, C.; et al. European Electricity Review. EMBER 2024, 1–95. Available online: https://ember-climate.org/app/uploads/2024/02/European-Electricity-Review-2024.pdf (accessed on 26 June 2024).
  8. Bailera, M.; Lisbona, P.; Romeo, L.M.; Espatolero, S. Power to Gas projects review: Lab, pilot and demo plants for storing renewable energy and CO2. Renew. Sustain. Energy Rev. 2017, 69, 292–312. [Google Scholar] [CrossRef]
  9. Mazza, A.; Bompard, E.; Chicco, G. Applications of power to gas technologies in emerging electrical systems. Renew. Sustain. Energy Rev. 2018, 92, 794–806. [Google Scholar] [CrossRef]
  10. Glenk, G.; Holler, P.; Reichelstein, S. Advances in power-to-gas technologies: Cost and conversion efficiency. Energy Environ. Sci. 2023, 16, 6058–6070. [Google Scholar] [CrossRef]
  11. Melaina, M.W.; Antonia, O.; Penev, M. Blending Hydrogen into Natural Gas Pipeline Networks: A Review of Key Issues; Technical Report NREL/TP-5600-51995; National Renewable Energy Laboratory: Golden, CO, USA, 2013; pp. 1–131.
  12. Zelenika, I.; Pavlović, D.; Rajič, P.; Kovačić, T.; Srpak, M. Hydrogen Underground Storage as a Critical Factor in the Energy Transition Period. Tech. Gaz. 2021, 28, 1480–1487. [Google Scholar]
  13. Sorgulu, F.; Dincer, I. Analysis and techno-economic assessment of renewable hydrogen production and blending into natural gas for better sustainability. Int. J. Hydrogen Energy 2022, 47, 19977–19988. [Google Scholar] [CrossRef]
  14. Erdener, B.C.; Sergi, B.; Guerra, O.J.; Chueca, A.L.; Pambour, K.; Brancucci, C.; Hodge, B.M. A review of technical and regulatory limits for hydrogen blending in natural gas pipelines. Int. J. Hydrogen Energy 2023, 48, 5595–5617. [Google Scholar] [CrossRef]
  15. European Commission (EC). Communication from the Commission to the European Parliament, the Council, the European Economic and Social Committee and the Committee of the Regions. Powering a Climate-Neutral Economy: An EU Strategy for Energy System Integration; European Commission (EU COM): Brussels, Belgium, 2020. [Google Scholar]
  16. European Commission (EC). Communication from the Commission to the European Parliament, the Council, the European Economic and Social Committee and the Committee of the Regions. A Hydrogen Strategy for a Climate-Neutral Europe; European Commission (EU COM): Brussels, Belgium, 2020. [Google Scholar]
  17. Anwar, S.; Khan, F.; Zhang, Y.; Djire, A. Recent development in electrocatalysts for hydrogen production through water electrolysis. Int. J. Hydrogen Energy 2021, 46, 32284–32317. [Google Scholar] [CrossRef]
  18. Voitic, G.; Pichler, B.; Basile, A.; Iulianelli, A.; Malli, K.; Bock, S.; Hacker, V. Hydrogen production. In Fuel Cells and Hydrogen, 1st ed.; Hacker, V., Mitsushima, S., Eds.; Elsevier: Amsterdam, The Netherlands, 2018; pp. 215–241. [Google Scholar]
  19. Idriss, H. Hydrogen production from water: Past and present. Curr. Opin. Chem. Eng. 2020, 29, 74–82. [Google Scholar] [CrossRef]
  20. Marouani, I.; Guesmi, T.; Alshammari, B.M.; Alqunun, K.; Alzamil, A.; Alturki, M.; Hadj Abdallah, H. Integration of renewable-energy-based green hydrogen into the energy future. Processes 2023, 11, 2685. [Google Scholar] [CrossRef]
  21. International Energy Agency (IEA). The Future of Hydrogen: Seizing Today’s Opportunities; OECD: Paris, France, 2019. [Google Scholar]
  22. IRENA and Bluerisk. Water for Hydrogen Production; International Renewable Energy Agency, Bluerisk: Abu Dhabi, United Arab Emirates, 2023. [Google Scholar]
  23. Alamiery, A. Advancements in materials for hydrogen production: A review of cutting-edge technologies. ChemPhysMater 2024, 3, 64–73. [Google Scholar] [CrossRef]
  24. Folgado, H.J.; Isaías González, I.; Antonio José Calderón, A.J. PEM Electrolyzer Digital Replica based on internal resistance determination applied to hydrogen energy storage. J. Energy Storage 2024, 75, 109694. [Google Scholar] [CrossRef]
  25. Zainal, B.S.; Ker, P.J.; Mohamed, H.; Ong, H.C.; Fattah, I.M.R.; Rahman, S.M.A.; Nghiem, L.D.; Mahlia, T.M.I. Recent advancement and assessment of green hydrogen production technologies. Renew. Sustain. Energy Rev. 2024, 189, 113941. [Google Scholar] [CrossRef]
  26. Xu, Y.; Zhou, Y.; Li, Y.; Ding, Z. Research Progress and Application Prospects of Solid-State Hydrogen Storage Technology. Molecules 2024, 29, 1767. [Google Scholar] [CrossRef]
  27. El-Shafie, M. Hydrogen production by water electrolysis technologies: A review. Results Eng. 2023, 20, 101426. [Google Scholar] [CrossRef]
  28. Loomba, S.; Khan, M.W.; Haris, M.; Mousavi, S.M.; Zavabeti, A.; Xu, K.; Tadich, A.; Thomsen, L.; McConville, C.F.; Li, Y.; et al. Nitrogen-doped porous nickel molybdenum phosphide sheets for efficient seawater splitting. Small 2023, 19, 2207310. [Google Scholar] [CrossRef] [PubMed]
  29. Hsu, S.H.; Miao, J.; Zhang, L.; Gao, J.; Wang, H.; Tao, H.; Hung, S.F.; Vasileff, A.; Qiao, S.Z.; Liu, B. An earth-abundant catalyst-based seawater photoelectrolysis system with 17.9% solar-to-hydrogen efficiency. Adv. Mater. 2018, 30, 1707261. [Google Scholar] [CrossRef] [PubMed]
  30. Yu, L.; Zhu, Q.; Song, S.; McElhenny, B.; Wang, D.; Wu, C.; Qin, Z.; Bao, J.; Yu, Y.; Chen, S.; et al. Non-noble metal-nitride based electrocatalysts for high-performance alkaline seawater electrolysis. Nat. Commun. 2019, 10, 5106. [Google Scholar] [CrossRef]
  31. Kuang, Y.; Kenney, M.J.; Meng, Y.; Hung, W.H.; Liu, Y.; Huang, J.E.; Prasanna, R.; Li, P.; Li, Y.; Wang, L.; et al. Solar-driven, highly sustained splitting of seawater into hydrogen and oxygen fuels. Proc. Natl. Acad. Sci. USA 2019, 116, 6624–6629. [Google Scholar] [CrossRef] [PubMed]
  32. Al-Baghdadi, M.A.S.; Abdolhamid, H.R.; Mkhatresh, O.A. Using of produced water associated with oil and gas production as a source of hydrogen: Solar electrolysis cell application. Ovidius Univ. Ann. Chem. J. 2009, 20, 44–47. [Google Scholar]
  33. Poživil, J. Use of expansion turbines in natural gas pressure reduction stations. Acta Montan. Slovaca 2004, 3, 258–260. [Google Scholar]
  34. Kostowski, W. The possibility of energy generation within the conventional natural gas transport system. Strojarstvo 2010, 52, 429–440. [Google Scholar]
  35. Kaneko, K.I.; Ohtani, K.; Tsujikawa, Y.; Fuji, S. Utilization of the cryogenic exergy of LNG by a mirror gas-turbine. Appl. Energy 2004, 79, 355–369. [Google Scholar] [CrossRef]
  36. Szargut, J. Exergy Method: Technical and Ecological Applications, 1st ed.; WIT Press: Southampton, UK, 2005; pp. 1–161. [Google Scholar]
  37. Szargut, J.; Szczygiel, I. Utilization of the cryogenic exergy of liquid natural gas (LNG) for the production of electricity. Energy 2009, 34, 827–837. [Google Scholar] [CrossRef]
  38. Danieli, P.; Carraro, G.; Lazzaretto, A. Thermodynamic and Economic Feasibility of Energy Recovery from Pressure Reduction Stations in Natural Gas Distribution Networks. Energies 2020, 13, 4453. [Google Scholar] [CrossRef]
  39. Borelli, D.; Devia, F.; Cascio, E.L.; Schenone, C. Energy recovery from natural gas pressure reduction stations: Integration with low temperature heat sources. Energy Convers. Manag. 2018, 159, 274–283. [Google Scholar] [CrossRef]
  40. Saied, O.; Abdellatif, A.; Shaaban, S.; Elsafty, A.F. Efficient Energy Recovery Scenarios from Pressure-Reducing Stations Intended for New Al-Alamein City in Egypt. Energies 2022, 15, 9077. [Google Scholar] [CrossRef]
  41. Bielka, P.; Kuczyński, S. Energy Recovery from Natural Gas Pressure Reduction Stations with the Use of Turboexpanders: Static and Dynamic Simulations. Energies 2022, 15, 8890. [Google Scholar] [CrossRef]
  42. GCAP [Software]. Available online: https://www.jmcampbell.com/gcap-software.php (accessed on 15 July 2024).
  43. Petroleum Experts Ltd. Integrated Production Modelling Toolkit (IPM) [Software]. Available online: http://www.petex.com/products/ipm-suite/ (accessed on 15 July 2024).
  44. Zelenika, I. The Underground Gas Storage Volume Modelling with Respect to Reservoir Parameters and Production Equipment. Ph.D. Thesis, University of Zagreb, Faculty of Mining, Geology and Petroleum Engineering, Zagreb, Croatia, 2017. [Google Scholar]
  45. Campbell, J.M.; Hubbard, R.A. Gas Conditioning and Processing: The Equipment Modules, 8th ed.; John, M., Ed.; Campbell and Company: Norman, OK, USA, 2004; Volume 2. [Google Scholar]
  46. Brkić, V.; Zelenika, I.; Mijić, P.; Medved, I. Underground gas storage process optimisation with respect to reservoir parameters and production equipment. Energies 2021, 14, 4324. [Google Scholar] [CrossRef]
  47. Singh, K.; Fevang, Ø.; Whitson, C.H. Whitson Consistent Black-Oil PVT Table Modification. In Proceedings of the SPE Annual Technical Conference and Exhibition, Anaheim, CA, USA, 11–14 November 2007. [Google Scholar]
  48. Peng, D.Y.; Robinson, D.B. A New Two-Constant Equation of State. Ind. Eng. Chem. Fundam. 1976, 15, 59–64. [Google Scholar] [CrossRef]
  49. Available online: https://assets.new.siemens.com/ (accessed on 15 July 2024).
Figure 1. UGS Okoli simplified process scheme.
Applsci 14 06434 g001
Figure 2. Theoretical thermodynamic path through an expander.
Applsci 14 06434 g002
Figure 3. Theoretical thermodynamic path through an expander.
Applsci 14 06434 g003
Figure 4. Comparison of reservoir model simulation results and history reservoir pressure data.
Applsci 14 06434 g004
Figure 5. Permeability model distribution and 3D view of the UGS reservoir.
Applsci 14 06434 g005
Figure 7. Expander and generator model in GCAP 9.3 software.
Applsci 14 06434 g007
Figure 8. Integration of turboexpander and UGS mathematical model.
Applsci 14 06434 g008
Figure 9. Model integration in the RESOLVE 13.5 programme.
Applsci 14 06434 g009
Figure 10. Hydrogen production as a function of gas withdrawal capacity.
Applsci 14 06434 g010
Figure 11. Cumulative hydrogen production depending on average reservoir pressure.
Applsci 14 06434 g011
Figure 12. Display of cumulative production of natural gas and hydrogen per one gas withdrawal cycle.
Applsci 14 06434 g012
Figure 13. Inlet/outlet gas temperatures at TE and UGS gas withdrawal rate.
Applsci 14 06434 g013
Table 1. List of water properties.
Water Properties
Salinity (NaCl)7352 mg/dm3
Electric resistivity0.862 Ohm·m
pH6.31
Density1005 kg/dm3
TDS (Total dissolved solids)8720 mg/dm3
Cations (Na+, Ca2+, Mg2+, Fe3+)3260 mg/dm3
Anions (Cl, HCO3, SO42−)5550 mg/dm3
Fe (ICP)284 mg/dm3
Table 2. Field water production during UGS withdrawal process.
Month/Year20202019201820172016201520142013
November2.400.600000.53
December78.2053.1908.200.9230.03
January53.72.778.742.243.814.3314.3586.28
February150.327150.5135.7124.752.07123.46159.29
March370107.5280.76214.8114.8177.03181.18152.63
April103.1160.3212.5100.6200.7174.18285.585.95
May36.474.42433.74.88.23236.710
Σ/year, m3794.1371.9800.25527497425.84842.2434.71
Table 3. Basic UGS reservoir data summary.
Trap TypeAnticline
HC contact70 m
FormationKloštar Ivanić Formation
Average net thickness (a1 + a2 + a3)16 m + 19 m + 7 m
Porosity5.5–23%
Permeability0.1–170 mD
Water saturation29%
Rock compressibility5.476 × 10−6
Reservoir temperature185 °C
Initial pressure196.2 bar
Storage working pressure range80–196 bar
Gas–water contact1800 m
Table 4. Gas composition of reservoir fluid [44].
Gas ComponentMol (%)
N20.400
CO21.570
C194.604
C21.470
C30.990
iC40.280
nC40.351
iC50.122
nC50.132
C60.005
C70.010
C80.014
C90.010
C110.042
Table 5. PVT properties of reservoir fluid for constant temperature (100 °C) [44].
Pressure (bar)Bg (m3/m3)µg (cP)Pressure (bar)Bg (m3/m3)µg (cP)
1.001.325680.01357181.520.006710.01794
13.030.100460.01367193.550.006310.01845
25.070.051630.01379205.590.005960.01898
37.100.034510.01394217.620.005650.01952
49.140.025810.01411229.660.005380.02007
61.170.020550.01432241.690.005130.02064
73.210.017040.01455253.720.004920.02121
85.240.014530.01481265.760.004720.02180
97.280.012660.01510277.790.004550.02238
109.310.011220.01542289.830.004390.02297
121.350.010070.01577301.860.004240.02356
133.380.009140.01615313.900.004110.02415
145.410.008370.01656325.930.003990.02474
157.450.007720.01700337.970.003880.02533
169.480.007180.01746350.000.003780.02592
Disclaimer/Publisher’s Note: The statements, opinions and data contained in all publications are solely those of the individual author(s) and contributor(s) and not of MDPI and/or the editor(s). MDPI and/or the editor(s) disclaim responsibility for any injury to people or property resulting from any ideas, methods, instructions or products referred to in the content.

