Article

Impact of Dual-Depth Head-Up Displays on Vehicle Driver Performance

by
Chien-Yu Chen
1,*,
Tzu-An Chou
2,
Chih-Hao Chuang
3,
Ching-Cheng Hsu
1,
Yi-Sheng Chen
4 and
Shi-Hwa Huang
4
1
Color, Imaging, and Illumination Center, National Taiwan University of Science & Technology, Taipei 106335, Taiwan
2
Graduate Institute of Photonics and Optoelectronics, Department of Electrical Engineering, National Taiwan University of Science & Technology, Taipei 106335, Taiwan
3
Department of Photonics, Feng Chia University, Taichung City 407102, Taiwan
4
Graduate Institute of Applied Science and Technology, National Taiwan University of Science & Technology, Taipei 106335, Taiwan
*
Author to whom correspondence should be addressed.
Appl. Sci. 2024, 14(15), 6441; https://doi.org/10.3390/app14156441
Submission received: 12 June 2024 / Revised: 3 July 2024 / Accepted: 3 July 2024 / Published: 24 July 2024
(This article belongs to the Special Issue Virtual Models for Autonomous Driving Systems)

Abstract

:
In recent years, the display information of head-up displays for vehicles has gradually developed from single-depth to multi-depth. To reduce the workload of driving and the number of eye adjustments, researchers use the visual perception of human eyes to realize the image information integrated with the real world. In this study, HoloLens2 is used to demonstrate head-up displays of different depths. An electroencephalogram, an electro-ophthalmogram, and a NASA-TLX questionnaire were used to evaluate the fatigue of drivers during long-term driving. The results showed that a dual-depth head-up display could effectively reduce the driver’s workload.

1. Introduction

Driving is a work of multiple perceptions, including vision, hearing, touch, etc. According to past studies, many accidents are caused by distraction or fatigue [1]. Although the use of a head-up display has been proven to distract drivers [2,3,4], it can reduce the number of times the driver looks down at traditional instruments and reduce the time of eye movement [5,6]. By focusing on the road’s condition to reduce the driver’s fatigue, so to reduce the driver’s burden, the development of driving assistance equipment has become an important issue. To reduce the mental burden and visual fatigue of driving, the Oldsmobile Automobile Company produced the first car equipped with a head-up display in 1988, which used a vacuum fluorescent tube (VFD) and optical reflectors to generate a speed indicator and virtual image [7], and projected the information on the windshield glass in front of the driver, in the driver’s field of vision, in an attempt to reduce the driver’s mental burden and visual fatigue. At present, most of the navigation information is displayed through the screen or head-up display (HUD). In recent years, to reduce the burden on drivers, many researchers project a lot of driving information on the HUD screen and try to project navigation information in the distance. From the traditional single-depth head-up display to the present AR-HUD, the HUD has gradually become one of the auxiliary devices of today’s cars. As the line of sight is an important factor for driving, Inuzuka et al. studied the influence of the HUD’s position, distance, font size, brightness, and color on driving line of sight [5]. Comparing city and highway driving viewpoint positions, the results show that screen-fixed and world-fixed ICONS, where the plane of sight is located within a 5-degree radius of the eye’s fovea, are annoying to drivers. To solve the problem of HUD clutter and its possible negative effects and maximize the benefits of the HUD, Weintraub, and Ensign et al. used two HUDs as display modes [8]: one was responsible for displaying the screen below the line of sight, and the other displaying the screen superimposed in front of the driver’s field of vision. Thus far, the multi-depth HUD has been gradually developed to realize the concept of the AR HUD [9]. The AR HUD can provide an interface for a more intuitive and immersive experience [10]. Compared with the traditional HUD, the AR HUD can identify the turning position earlier [10]. According to the research of Yost et al., increasing the viewing distance and size can improve cognition and performance [11]. Although the AR-HUD can improve the driver’s understanding of the real world, empirical studies have also pointed out that the AR-HUD graphics’ prominence, frequent changes, and visual confusion will attract the driver’s attention [2]. Avoiding the distraction caused by information depends on the graphical elements on the display and the perceptual form of the interface [2,12]. Since vision is a highly complex task, many factors must be considered in designing HUD information, such as color, position, size, light source, background complexity, etc. [9].
Human eye visual perception:
Visual perception has a moderate to high correlation with driving results [13,14]. Visual perception is easily affected by many reasons, such as depth and distance perception [15,16,17], color contrast [18], environmental complexity [19], light source [20], etc. To solve the problem caused by looking down at the instrument information while driving, the eyes need to focus repeatedly on a closer distance; numerous studies have demonstrated that the frequent switching of eye pairs’ focal distance will increase visual fatigue [21,22,23]. Inuzuka et al. pointed out that the visual adjustment ability of different age groups will affect the speed of recognizing HUD text [5], and the elderly will see an increase in the adjustment time of their eyes when viewing information smaller than 2.5 m. According to Rantanen and Goldberg, under different mental load conditions, the FOV size also has an impact [24]. Visual fatigue caused by a long-term accumulation during working or reading will also relatively increase the blink rate. Although there are many uncertainties in the AR HUD, depth perception is particularly important for driving safety [9]. According to Cutting and Vishton et al.’s research on the differences in depth perception [25], the monocular cue is very effective between 1.5 m and 30 m. Above 30 m will be a monocular cue, so the monocular cue is sufficient to be applied in the automotive field [9]. According to Schmidt and Thews, the foveal vision with a distance of 2 m from the line of sight has the fastest and most sensitive perceptual speed [26]. Today, many studies use the human eye’s limitations on depth perception to obtain AR-HUD information. The rest of the structure of this paper is as follows: The Section 2 introduces the experimental design and instrument. The Section 3 analyzes and discusses the data, the Section 4 discusses the significance of the data, and the Section 5 summarizes the paper.

2. Materials and Methods

A 
Design Specifications
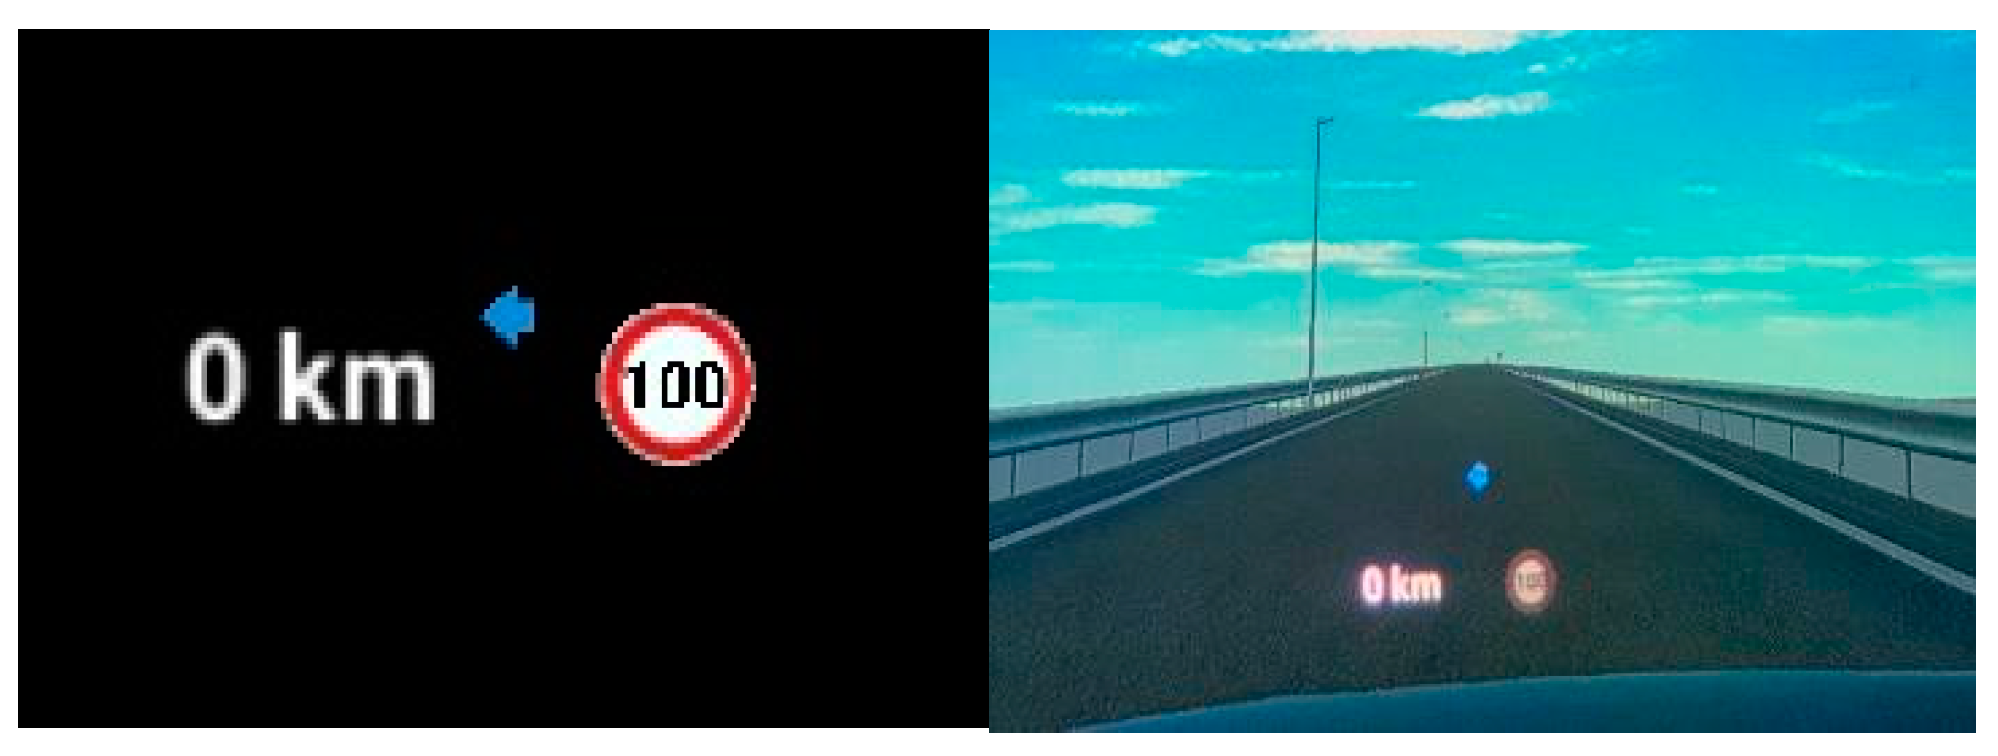
To verify the effectiveness of dual-depth HUD in reducing driving fatigue, the design of this paper is based on the importance of the top three pieces of driving information as HUD display contents [5], which are speed, speed limit, and navigation information, respectively, and compares the differences between single-depth HUD and dual-depth HUD. All the information of single-depth HUD is located at a distance of 2.5 m. Please refer to Figure 1. The speed and speed limit information of the dual-depth HUD are located at 2.5 m, and the navigation is at 6 m; please refer to Figure 2. When the human eye sees a distance of more than 6 m, visual perception usually integrates the virtual world with the real world [17]. To achieve the effect of AR-HUD and provide more intuitive navigation information, we set the navigation information at 6 m.
B 
Participants
This study recruited a total of 31 volunteers, 20 male and 11 female, with an average age of 27 years old, all of whom held a Republic of China automobile driver’s license and met the minimum vision requirements for obtaining a driver’s license. All of them had sufficient sleep and did not drink alcohol or caffeine before the experiment. This study was approved by the Behavioral and Social Sciences Research Ethics Committee, National Taiwan University, Case No. 202110EM002.
C 
Apparatus
Microsoft HoloLens2:
In this study, Microsoft HoloLens2 (Microsoft, Redmond, WA, USA) headset augmented reality glasses were used as a display tool for head-up displays with the following specifications: resolution: 2k 3:2 light engines, holographic density: ˃2.5 k radiants (light points per radian), the maximum brightness of 500~600 nit, FOV 43° × 29° (diagonal 52°), and IR camera that can track the position of human eyes to display images.
EEG:
In this study, the BIOPAC MP150 System (Biopac, Goleta, CA, USA) and EEG100C signal amplifier (Biopac) were used to record the EEG of the subjects during the whole driving process. The EEG electrode positions of the 10–20 system were adopted, and the measuring electrode points were F3, F4, P3, P4, O1, and O2. The brainwave energy of each electrode was calculated to evaluate the change in brainwave energy of the subjects at different periods.
EOG:
In this study, BIOPAC MP150 System combined with the EOG100C signal amplifier was used to record the electro-ophthalmogram of subjects driving throughout the whole process and calculate the change in blink frequency of subjects (times/min). According to Stern et al., when people are visually fatigued, blink frequency will increase significantly [27]. Therefore, this study evaluated the changes in visual fatigue of subjects at different periods by measuring blink rate.
NASA-TLX:
Hart and Staveland et al. proposed a set of questionnaires for multi-dimensional workload assessment in 1988 [28]. NASA-TLX workload questionnaire defined six dimensions, including mental load, physiological load, time load, performance, effort level, and frustration level. In this study, the NASA-TLX questionnaire was used for subjective assessment of driving workload. The questionnaire was filled out after the experiment, and the score of the questionnaire was used as the basis of workload. The higher the score, the higher the subjective feeling of workload; the lower the score, the lower the subjective feeling of workload.
Experimental environment (experimental space and driving simulator):
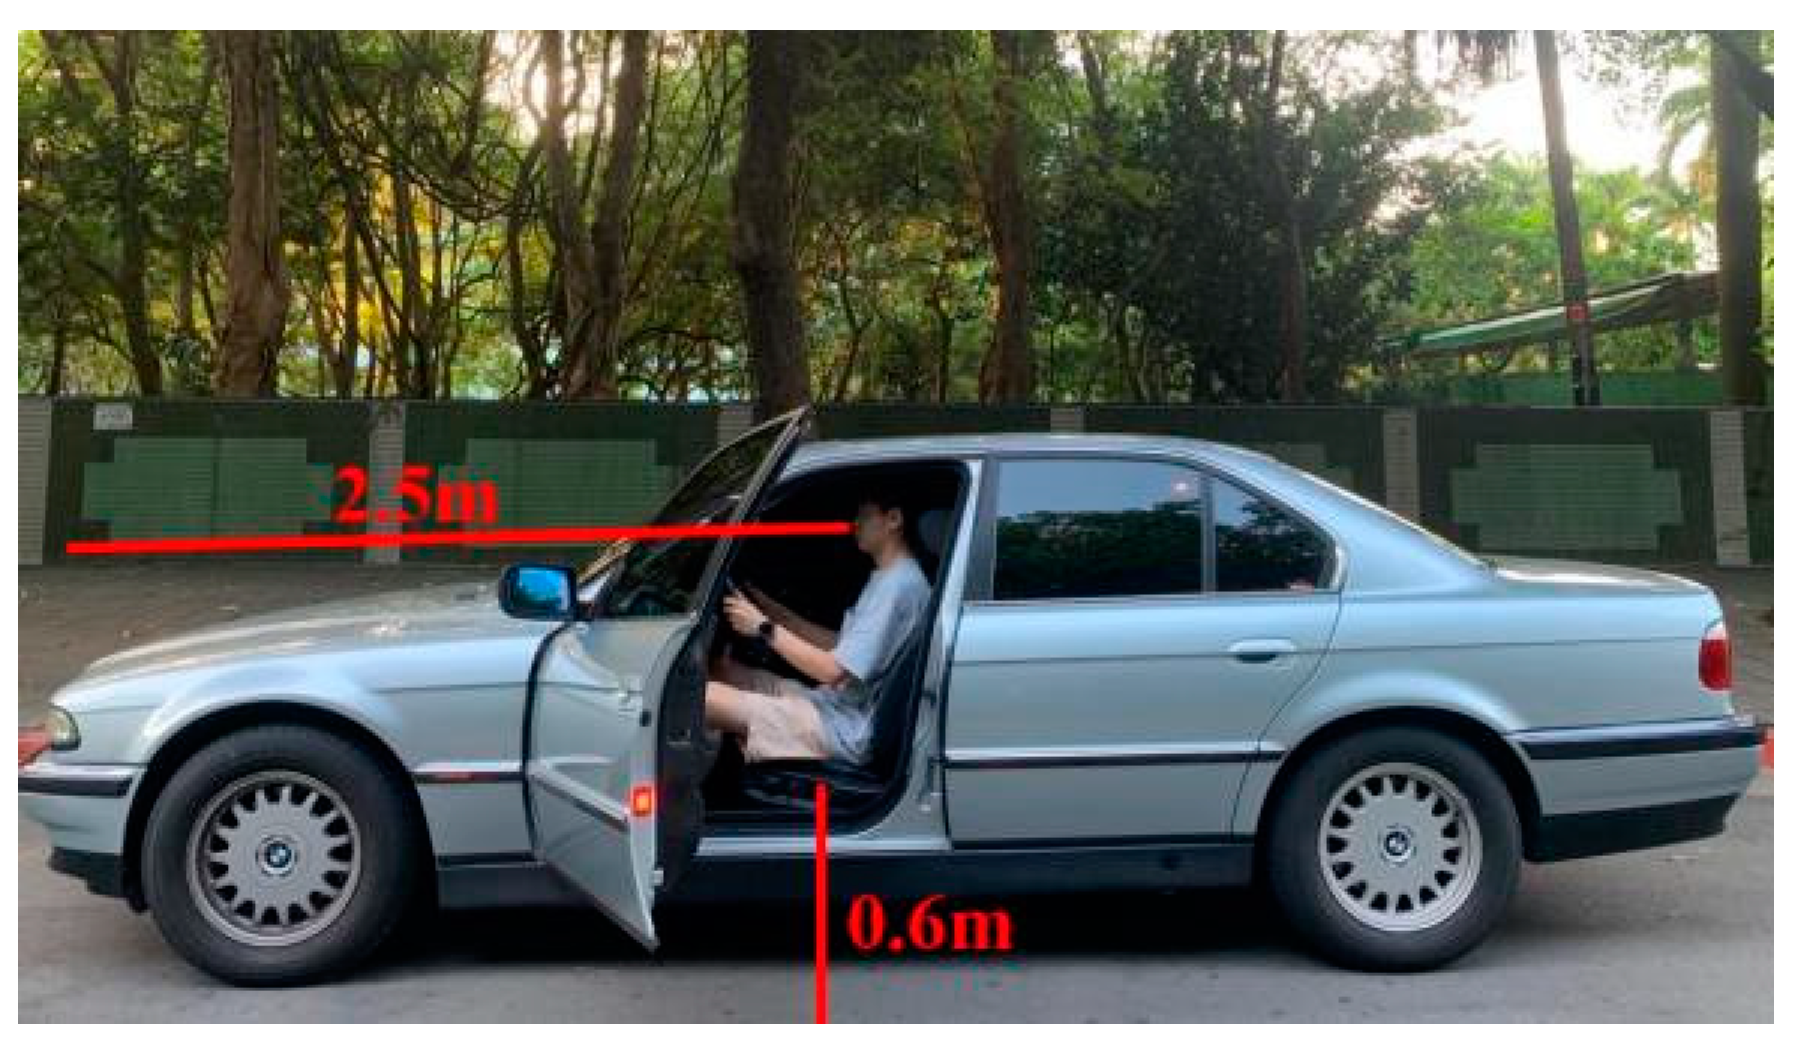
To ensure the consistency of the viewing quality of the subjects, the test site was set in a dark room that was not interfered with by external light; there were no other noisy sounds around, and the indoor temperature was controlled at 24 ± 1 °C. To increase the sense of driving reality, the body size of the BMW 728 was used as the specification of the driving simulator, as shown in Figure 3. The projection screen is projected 2.5 m in front of the seat, the width of the projection screen is 2.6 m, the width of the vehicle is 1.8 m, and the height of the seat is 0.6 m from the ground, as shown in Figure 4.
We used Unity 2020.3.25f1 and the plugins Fantastic City, EasyRoads3D Pro v3 for scene construction, and NWH Vehicle Physics 2 for vehicle physics engine as the simulated driving environment in this article. In this paper, two scenes were constructed, namely, an urban scene (Figure 5) and a straight monotonous road (Figure 6). The urban scene included buildings, traffic signals, trees, etc., and we drove about 10 min to reach the data recording starting point according to navigation instructions and speed limits. The urban scene was not included in the data analysis for familiarizing participants with the operation of equipment.
(a) 
Procedure
Each participant needs to complete two experiments, and the total time of each experiment is about 125 min. First, participants should read the informed consent document of the experiment, and the explanation of the experiment process. Before the experiment, basic visual strength measurement (color blindness and visual acuity of 0.6 or above) should be carried out. First of all, the subjects will be familiar with the operation of the equipment, so they will first be asked to drive on the urban road and arrive at the expressway according to the navigation instructions, which will take about ten minutes. Then, the experiment will officially be started. EEG and EOG data will be measured throughout the experiment, and the NASA-TLX questionnaire will be filled in after the experiment is over (Figure 7).

3. Results

(a) 
Statistical Methods
IBM SPSS 22 statistical software was used for the data analysis, and the experimental results of the electroencephalogram, electro-ophthalmogram, and NASA-TLX questionnaire were, respectively, discussed. The data samples were collected by the single-blind test method, and the sequence of experimental samples was randomly assigned. The experimental variables were divided into two types, namely, the single-depth HUD and the double-depth HUD. Therefore, the statistical method of the paired-sample t-test was used for analysis in this study. The Shapiro–Wilk test was used to confirm whether the data were paired with a normal distribution (p ˃ 0.05); the paired-sample test was used for a normal distribution, and the Wilcoxon sign-rank test was used for the paired-sample t-test in a non-normal distribution to observe whether the statistical results were significant (p ˃ 0.05). For example, p ˃ 0.05 was regarded as statistical difference, and the average of the statistical analysis results was used as the basis for determining the brainwave energy, blink frequency, and workload.
(b) 
EEG Analysis Results (Driving Fatigue)
According to the Jap study on the EEG driving fatigue calculation formula (θ + α)/β [29], the driving brainwave energy is calculated through this formula, and the brainwave changes of participants during the whole experiment from 1 to 90 min are compared. From Table 1, it is found that P3 (left parietal lobe) (p = 0.004) and O2 (the right occipital lobe) (p = 0.000) have statistically significant differences, while the other points (F3: left frontal lobe, F4: right frontal lobe, and P4: right parietal lobe) have no significant differences. The results from P3 show that the brainwave energy intensity of the single-depth HUD is significantly higher than that of the dual-depth HUD in most periods. The results at O2 show that the brainwave energy intensity of the dual-depth HUD is significantly higher than that of the single-depth HUD; please refer to Figure 8.
(c) 
EEG Discussion
The brainwave energy changes of EEG points F3, F4, P3, P4, O1, and O2 were measured in this study. It can be seen from Figure 8 that the P3 point of the single-depth HUD is less than that of the dual-depth HUD only from minute 11 to minute 20, and the mental load of the single-depth HUD is greater than that of the dual-depth HUD in the rest of the periods. The mental load of the O2 point in the dual-depth HUD is less than that of te single-depth HUD only at the first to tenth point and is greater than that of the single-depth HUD in other periods. The NASA-TLX questionnaire results show that the subjective workload of the single-depth HUD is statistically significantly higher than that of the dual-depth HUD; please refer to Table 2. According to the above results, P3 is located in the parietal lobe of the brain, which mainly controls the motor nerve center and processes various sensory information. Therefore, it can be confirmed that the single-depth HUD spends more energy in processing complex information and controlling the motor nerve than the dual-depth HUD. O2 is located in the occipital lobe of the brain and mainly processes visual-related information. It can be confirmed from the results that the mental consumption of the dual-depth HUD in processing vision-related information is greater than that of the single-depth HUD. This study is the same as that of Kong et al.’s study on the relationship between the NASA-TLX workload questionnaire and EEG fatigue [30]: when the mental state shifts from alertness to fatigue, the energy of the frontal and parietal lobes will increase significantly, and the driver’s workload will increase according to complexity [31]. It can be seen from the results that participants have a higher workload when using the single-depth HUD than the dual-depth HUD most of the time.
(d) 
EOG Analysis Results (Number of Blinks)
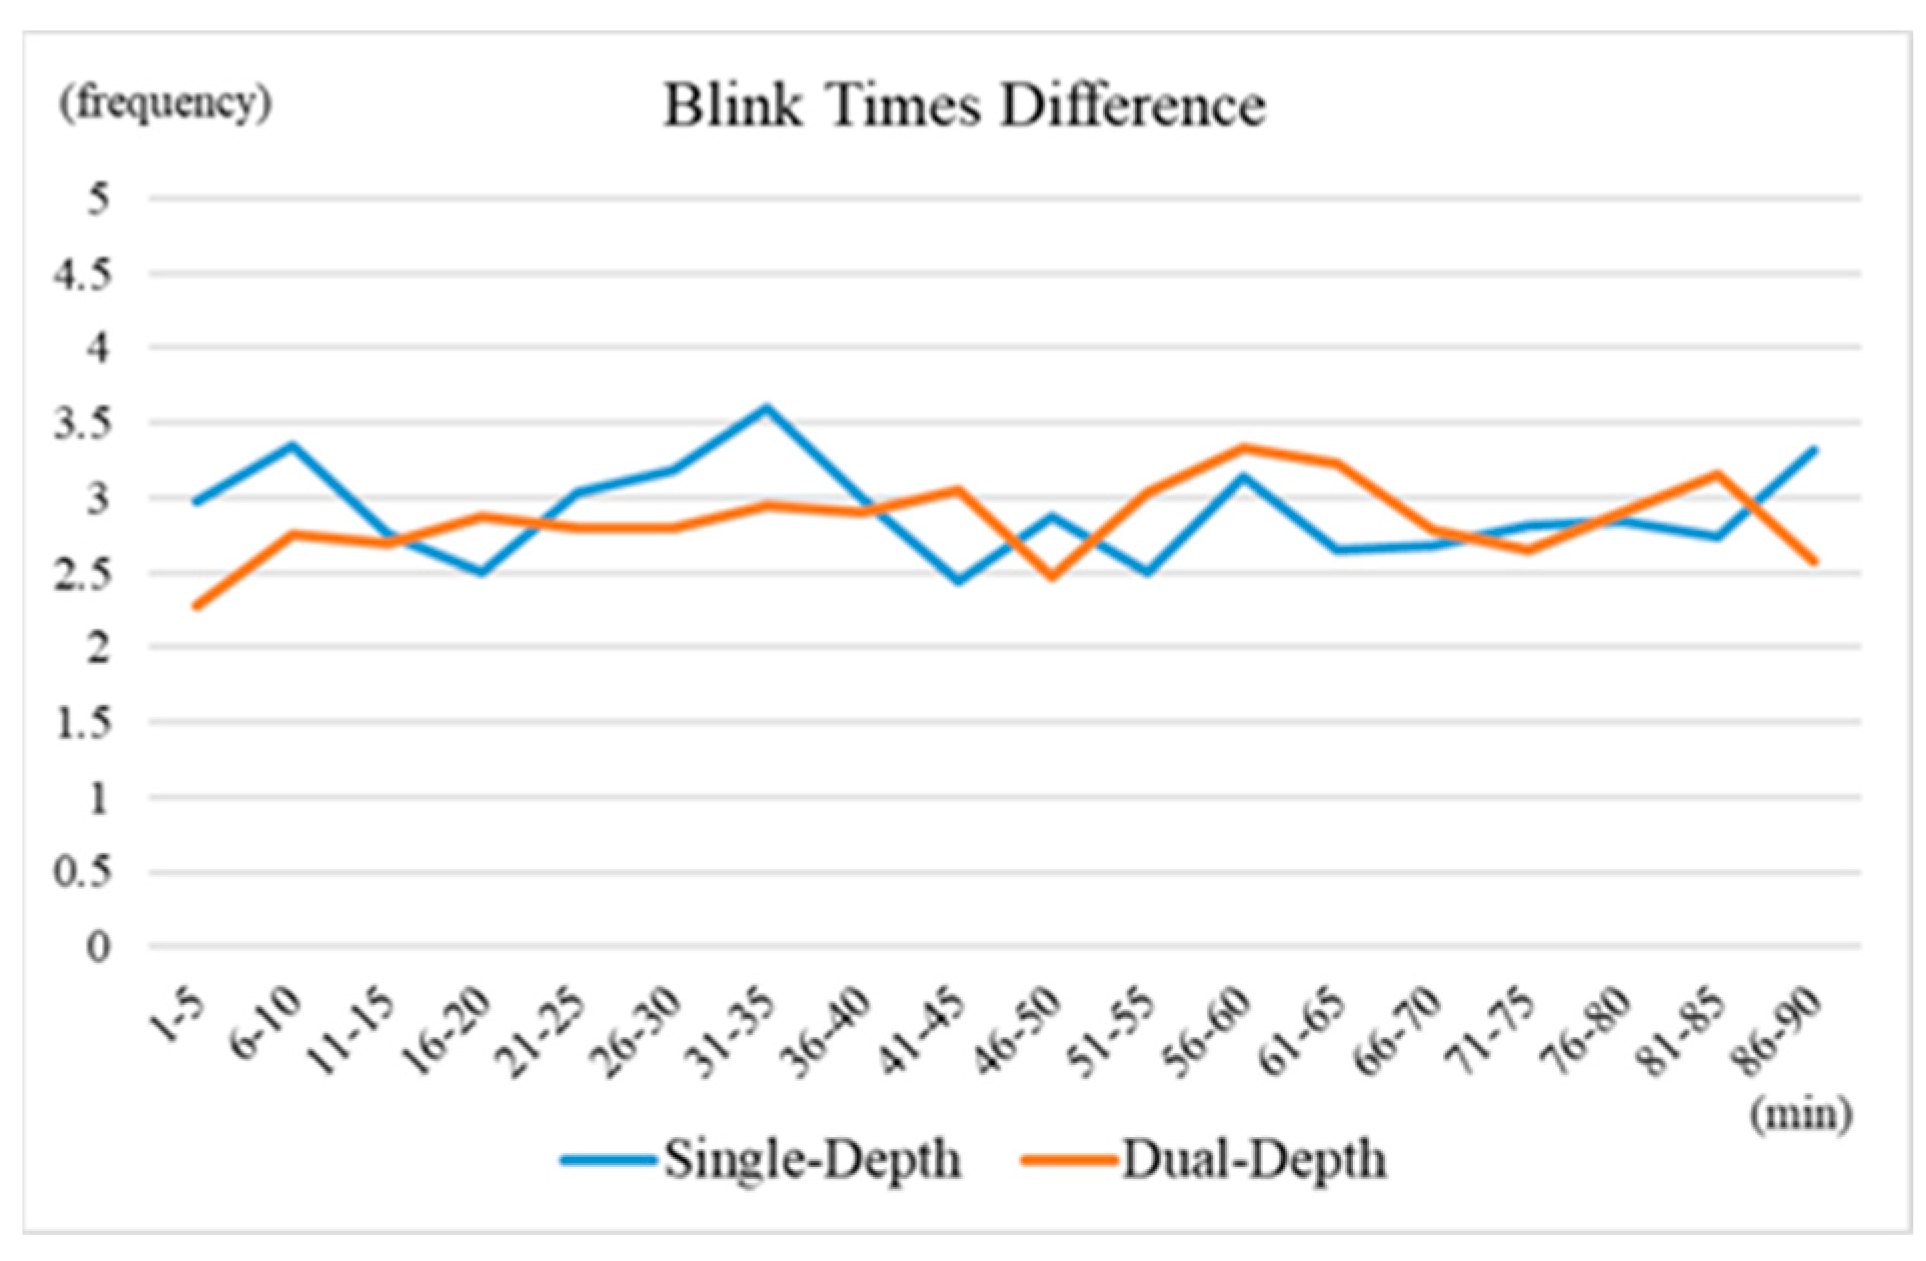
To reduce the inconsistency in blink frequency caused by individual differences, the average blink frequency of the first minute to the fifth minute of the individual sample is taken as the baseline, and the blink frequency of each period is subtracted from the baseline of the individual sample to obtain the blink frequency difference. Please refer to Figure 9. If the blink frequency difference increases, this indicates that visual fatigue increases. To observe the change in blink frequency, we divided the time data of 90 min into a total of 18 paragraphs with 5-min intervals. The results showed that statistically significant differences were found between the first and fifth minutes (p = 0.037), and the single-depth HUD’s result was significantly higher than that of the double-depth HUD, while no significant differences were found in the remaining periods. To observe the changing trend in blink rate, this paper calculated the average value by adding the difference of blink times from the 1st to 45th, and 46th to 90th, and compared it to the change in average blink times. Please refer to Table 3.
(e) 
EOG Discussion:
The experiment time was divided into 1 to 45 min in the first half, and 46 to 90 min in the second half, as shown in Table 3. There was a significant difference only in the first to fifth minutes, and the blink times of the single-depth HUD were significantly higher than those of the dual-depth HUD. Although there was no significant difference in other periods, a significant difference could be found from the average data. The blink frequency of the single-depth HUD in the first half of the experiment (45 min before) was higher than that of the double-depth HUD, indicating that the visual fatigue degree of the single-depth HUD in the first 45 min was higher than that of the double-depth HUD, and the blink frequency of the double-depth HUD in the second half of the experiment (46 min after) was higher than that of the single-depth HUD. This indicates that the degree of visual fatigue of the dual-depth HUD after 46 min tends to be higher than that of the single-depth HUD; please refer to Figure 9.
(f) 
NASA-TLX Analysis Result
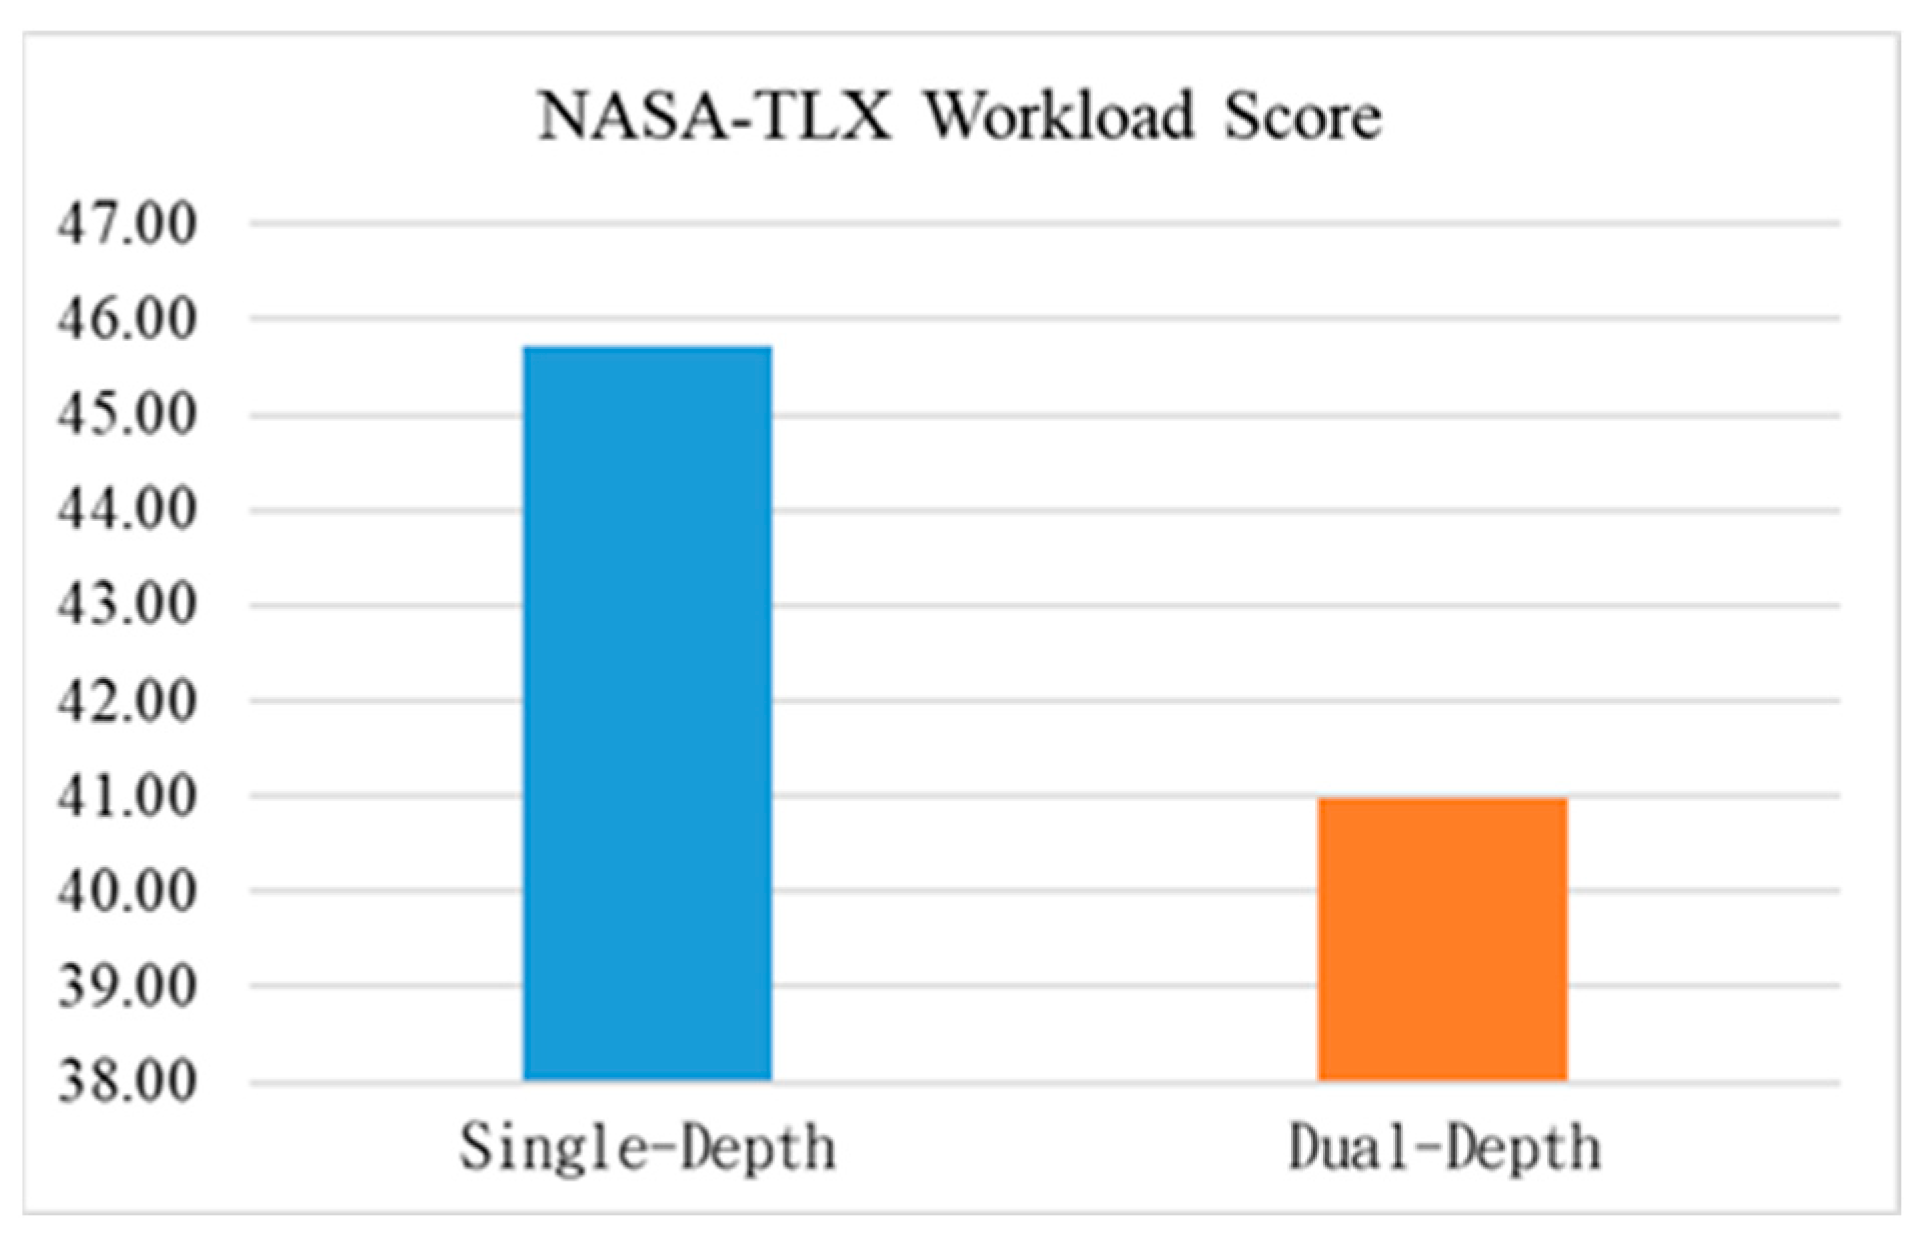
The NASA-TLX questionnaire showed statistically significant differences (p = 0.048). According to the average value, it can be found that the workload required for the single-depth HUD is higher than that for the dual-depth HUD; please refer to Table 2.
(g) 
NASA-TLX Discussion:
By filling out questionnaires, the subjective workload of participants using the single-depth HUD and double-depth HUD was collected. Through the average of the statistical results, it was found that the workload of the single-depth HUD was significantly higher than that of the double-depth HUD. We also found, through the study results of the EEG measurement, that the single-depth HUD is significantly better than the dual-depth HUD in processing complex perception and action. Therefore, consistent results have been obtained using physiological signals and subjective questionnaires, and effective verification has been obtained. Please refer to Table 2 and Figure 10.

4. Discussion

Combining the results of the above three experiments, the following differences between the use of the single-depth HUD and the dual-depth HUD by participants can be observed. First of all, it is found, through the EEG, that the driving fatigue of the single-depth HUD in most periods is significantly higher than that of the dual-depth HUD; conversely, the dual-depth HUD consumes less mental energy than the single-depth HUD in most periods. Then, the NASA-TLX questionnaire was discussed. From the NASA-TLX questionnaire, it can be found that the workload required for the use of the single-depth HUD is significantly higher than that of the double-depth HUD, so we can obtain consistent results from the questionnaire results and the EEG.
In this study, the blink times of participants were also measured by an electro-oculogram to observe the difference in visual fatigue between the single-depth HUD and the double-depth HUD. The results showed a significant difference in the first five minutes of the experiment, while there was no significant difference in the rest of the period. In the first half of the experiment (45 min ago), the blink frequency of the single-depth HUD in most periods is higher than that of the double-depth HUD, indicating that the single-depth HUD has higher visual fatigue during this period, as shown at 46 min.
After 46 min, it was found that the blinking times of the double-depth HUD were higher than that of the single-depth HUD in most periods, indicating that the double-depth HUD had higher visual fatigue during this period. According to Gabbard et al., information is usually distributed between the real world and the virtual environment, which makes users constantly change the focus of their eyes, which can easily cause visual fatigue and a reduction in task performance [32]. According to Gabbard et al., a comparison of text viewing effects with near-eye displays shows that the use of a laser light source will produce light spots, which will reduce the image quality. The light spots may affect the clarity of small information and illustrations at a distance [33], and make the degree of visual fatigue more obvious [34]. Kim also pointed out that the depth provided by near-eye displays is different from the visual cues of artificial depth in the real world. Therefore, it may cause serious visual fatigue [32]. Kalra et al. pointed out that different levels of complex tasks [35] would produce different levels of visual fatigue. In summarizing the above studies, there are multiple reasons for why visual fatigue would have different levels of impact, so further in-depth research on all levels is still needed.
Begum et al. used heart rate variability to predict the mental state of drivers.
The management system [36] evaluated their mental state through finger temperature, skin conductivity, respiratory rate, and other parameters, and found that the proposed HRV monitoring system had a similar performance with professional-grade equipment and also showed a higher sensitivity in the time and frequency domain, and a better performance in heart rate specificity and accuracy. Although this study did not use physiological signals such as an electrocardiogram and electromyography for more detailed signal analysis, due to the significant differences between the EEG and NASA-TLX, different types of physiological signal measurements should be added in the future to increase the reliability of the results at more levels.
According to the research results of the EEG and NASA-TLX, the dual-depth HUD makes it easier to process complex perception than the single-depth HUD. According to Christmas et al., when the human eye looks at a distance of more than 6 m, the visual focus is located at infinity [17], resulting in a fusion effect between the information and the road. Then, the effect of the AR-HUD can be realized, which can provide a more intuitive and immersive experience [10]. According to Bark et al.’s study on the impact of the depth of car head-up displays on drivers [10], the result shows that the 3D-HUD can enable drivers to identify turning positions earlier. And the visual effect of the AR-HUD is a very important factor in the interface space, and this argument is consistent with the results of this study.
The results of this study are the same as those of Bark et al. [10]. The use of the head-up display with depth can help us more intuitively understand the navigation information [10], thus reducing the mental load of driving and focusing on the road. On the part of visual fatigue, the use of the near-eye display in the experiment results in the more frequent adjustment of the eyes. In terms of visual fatigue, this is consistent with the results of Gabbard et al. [34].

5. Conclusions

To ensure that the multi-depth HUD will not significantly increase the driver’s mental load and visual fatigue, this paper uses a single-depth HUD (2.5 m) and a dual-depth HUD (2.5 m and 6 m) as the depth distances used in the head-up display experiment to compare the distance difference displayed by navigation information, so that the driver can view the navigation information. In addition to reducing the number of eye adjustments, this increases visual comfort, reduces mental load, and provides more intuitive navigation information.
In this study, physiological signals and subjective questionnaires were used to evaluate the changes in the mental load, visual fatigue, and driving performance of the single-depth HUD and dual-depth HUD during long-term driving. The results of the EEG and NASA-TLX studies showed that the dual-depth HUD could effectively reduce mental load, and the dual-depth HUD had a higher mental energy consumption on vision. The influence of the single-depth HUD and dual-depth HUD on driving fatigue proposed in this study can be used as a reference for automotive designers. In particular, the differences in display distance, display position, color brightness, and contrast of the dual-depth HUD can easily cause discomfort to drivers or affect their reaction speed, so it is necessary to conduct a more in-depth discussion on all aspects.

Author Contributions

Methodology, C.-H.C.; Investigation, T.-A.C.; Data curation, S.-H.H.; Writing—original draft, C.-C.H.; Writing—review & editing, Y.-S.C.; Project administration, C.-Y.C. All authors have read and agreed to the published version of the manuscript.

Funding

National Science and Technology Council. R.O.C (111-2218-E-011 -013 -MBK -).

Institutional Review Board Statement

National Taiwan University Research Ethics Committee (202110EM002).

Informed Consent Statement

Informed consent was obtained from all subjects involved in the study.

Data Availability Statement

The data that support the findings of this study are openly available in Depositar at https://data.depositar.io/dataset/impact-of-dual-depth-head-up-displays-on-vehicle-driver-performance, reference number [Version 2024-01-31T03:20:37.848602]. [Depositar] [https://data.depositar.io/dataset/impact-of-dual-depth-head-up-displays-on-vehicle-driver-performance] [ID 4884096] (accessed on 2 July 2024).

Conflicts of Interest

The authors declare no conflict of interest.

References

  1. Park, H.S.; Park, M.W.; Won, K.H.; Kim, K.; Jung, S.K. In-Vehicle AR-HUD System to Provide Driving-Safety Information. ETRI J. 2013, 35, 1038–1047. [Google Scholar] [CrossRef]
  2. Kim, H.; Gabbard, J.L. Assessing Distraction Potential of Augmented Reality Head-Up Displays for Vehicle Drivers. Hum. Factors 2019, 64, 852–865. [Google Scholar] [CrossRef] [PubMed]
  3. Martens, M.; Van Winsum, W. Measuring Distraction: The Peripheral Detection Task; TNO Human Factors: Soesterberg, The Netherlands, 2000. [Google Scholar]
  4. Faria, N.d.O. Evaluating Automotive Augmented Reality Head-up Display Effects on Driver Performance and Distraction. In Proceedings of the 2020 IEEE Conference on Virtual Reality and 3D User Interfaces Abstracts and Workshops (VRW), Atlanta, GA, USA, 22–26 March 2020; pp. 553–554. [Google Scholar] [CrossRef]
  5. Inuzuka, Y.; Osumi, Y.; Shinkai, H. Visibility of Head up Display (HUD) for Automobiles. Proc. Hum. Factors Soc. Annu. Meet. 1991, 35, 1574–1578. [Google Scholar] [CrossRef]
  6. Alotaiby, T.; El-Samie, F.E.A.; Alshebeili, S.; Ahmad, I. A review of channel selection algorithms for EEG signal processing. EURASIP J. Adv. Signal Process. 2015, 2015, 66. [Google Scholar] [CrossRef]
  7. Weihrauch, M.; Meloeny, G.G.; Goesch, T.C. The First Head Up Display Introduced by General Motors; SAE International: Warrendale, PA, USA, 1989; SAE Technical Paper 890288. [Google Scholar] [CrossRef]
  8. Weintraub, D.J.; Ensing, M. Human Factors Issues in Head-Up Display Design: The Book of HUD; Crew System Ergonomics Information Analysis Center: Dayton, OH, USA, 1992. [Google Scholar]
  9. Gabbard, J.L.; Fitch, G.M.; Kim, H. Behind the Glass: Driver Challenges and Opportunities for AR Automotive Applications. Proc. IEEE 2014, 102, 124–136. [Google Scholar] [CrossRef]
  10. Bark, K.; Tran, C.; Fujimura, K.; Ng-Thow-Hing, V. Personal Navi: Benefits of an Augmented Reality Navigational Aid Using a See-Thru 3D Volumetric HUD. In Proceedings of the 6th International Conference on Automotive User Interfaces and Interactive Vehicular Applications, Seattle, WA, USA, 17–19 September 2014. [Google Scholar] [CrossRef]
  11. Yost, B.; Haciahmetoglu, Y.; North, C. Beyond visual acuity: The perceptual scalability of information visualizations for large displays. In Proceedings of the SIGCHI Conference on Human Factors in Computing Systems, New York, NY, USA, 28 April–3 May 2007; pp. 101–110. [Google Scholar] [CrossRef]
  12. Ma, X.; Jia, M.; Hong, Z.; Kwok, A.P.K.; Yan, M. Does Augmented-Reality Head-Up Display Help? A Preliminary Study on Driving Performance Through a VR-Simulated Eye Movement Analysis. IEEE Access 2021, 9, 129951–129964. [Google Scholar] [CrossRef]
  13. Anstey, K.J.; Wood, J.; Lord, S.; Walker, J.G. Cognitive, sensory and physical factors enabling driving safety in older adults. Clin. Psychol. Rev. 2005, 25, 45–65. [Google Scholar] [CrossRef] [PubMed]
  14. De Raedt, R.; Ponjaert-Kristoffersen, I. The Relationship Between Cognitive/Neuropsychological Factors and Car Driving Performance in Older Adults. J. Am. Geriatr. Soc. 2000, 48, 1664–1668. [Google Scholar] [CrossRef]
  15. Lisle, L.; Merenda, C.; Tanous, K.; Kim, H.; Gabbard, J.L.; Bowman, D.A. Effects of Volumetric Augmented Reality Displays on Human Depth Judgments: Implications for Heads-Up Displays in Transportation. Int. J. Mob. Hum. Comput. Interact. IJMHCI 2019, 11, 1–18. [Google Scholar] [CrossRef]
  16. Smith, M.; Doutcheva, N.; Gabbard, J.L.; Burnett, G. Optical see-through head up displays’ effect on depth judgments of real world objects. In Proceedings of the 2015 IEEE Virtual Reality (VR), Arles, France, 23–27 March 2015; pp. 401–405. [Google Scholar] [CrossRef]
  17. Christmas, J.; Smeeton, T.M. Dynamic Holography for Automotive Augmented-Reality Head-Up Displays (AR-HUD). SID Symp. Dig. Tech. Pap. 2021, 52, 560–563. [Google Scholar] [CrossRef]
  18. Gabbard, J.L.; Smith, M.; Merenda, C.; Burnett, G.; Large, D.R. A Perceptual Color-Matching Method for Examining Color Blending in Augmented Reality Head-Up Display Graphics. IEEE Trans. Vis. Comput. Graph. 2020, 28, 2834–2851. [Google Scholar] [CrossRef]
  19. Currano, R.; Park, S.Y.; Moore, D.J.; Lyons, K.; Sirkin, D. Little Road Driving HUD: Heads-Up Display Complexity Influences Drivers’ Perceptions of Automated Vehicles. In Proceedings of the 2021 CHI Conference on Human Factors in Computing Systems, New York, NY, USA, 7–17 May 2021; pp. 1–15. [Google Scholar] [CrossRef]
  20. Koulieris, G.A.; Akşit, K.; Stengel, M.; Mantiuk, R.K.; Mania, K.; Richardt, C. Near-Eye Display and Tracking Technologies for Virtual and Augmented Reality. Comput. Graph. Forum 2019, 38, 493–519. [Google Scholar] [CrossRef]
  21. Hoffman, D.M.; Girshick, A.R.; Akeley, K.; Banks, M.S. Vergence–accommodation conflicts hinder visual performance and cause visual fatigue. J. Vis. 2008, 8, 33. [Google Scholar] [CrossRef] [PubMed]
  22. Gur, S.; Ron, S.; Heicklen-Klein, A. Objective evaluation of visual fatigue in VDU workers. Occup. Med. 1994, 44, 201–204. [Google Scholar] [CrossRef]
  23. Yano, S.; Ide, S.; Mitsuhashi, T.; Thwaites, H. A study of visual fatigue and visual comfort for 3D HDTV/HDTV images. Displays 2002, 23, 191–201. [Google Scholar] [CrossRef]
  24. Rantanen, E.M.; Goldberg, J.H. The effect of mental workload on the visual field size and shape. Ergonomics 1999, 42, 816–834. [Google Scholar] [CrossRef]
  25. Cutting, J.E.; Vishton, P.M. Perceiving Layout and Knowing Distances: The Integration, Relative Potency, and Con-Textual Use of Different Information about Depth; Academic Press: Cambridge, MA, USA, 1995; p. 49. [Google Scholar]
  26. Schmidt, R.F.; Thews, G. Physiologie des Menschen; Springer: Berlin/Heidelberg, Germany, 2013. [Google Scholar]
  27. Stern, J.A.; Boyer, D.; Schroeder, D. Blink Rate: A Possible Measure of Fatigue. Hum. Factors 1994, 36, 285–297. [Google Scholar] [CrossRef]
  28. Hart, S.G.; Staveland, L.E. Development of NASA-TLX (Task Load Index): Results of empirical and theoretical research. In Advances in Psychology; Elsevier: Amsterdam, The Netherlands, 1988; Volume 52, pp. 139–183. [Google Scholar] [CrossRef]
  29. Jap, B.T.; Lal, S.; Fischer, P.; Bekiaris, E. Using EEG spectral components to assess algorithms for detecting fatigue. Expert Syst. Appl. 2009, 36, 2352–2359. [Google Scholar] [CrossRef]
  30. Kong, W.; Zhou, Z.; Jiang, B.; Babiloni, F.; Borghini, G. Assessment of driving fatigue based on intra/inter-region phase synchronization. Neurocomputing 2017, 219, 474–482. [Google Scholar] [CrossRef]
  31. Faure, V.; Lobjois, R.; Benguigui, N. The effects of driving environment complexity and dual tasking on drivers’ mental workload and eye blink behavior. Transp. Res. Part F Traffic Psychol. Behav. 2016, 40, 78–90. [Google Scholar] [CrossRef]
  32. Kim, Y.; Kim, J.; Hong, K.; Yang, H.K.; Jung, J.-H.; Choi, H.; Min, S.-W.; Seo, J.-M.; Hwang, J.-M.; Lee, B. Accommodative Response of Integral Imaging in Near Distance. J. Disp. Technol. 2012, 8, 70–78. [Google Scholar] [CrossRef]
  33. Laser-Based Displays: A Review. Available online: https://opg.optica.org/ao/abstract.cfm?uri=ao-49-25-f79 (accessed on 17 August 2022).
  34. Gabbard, J.L.; Mehra, D.G.; Swan, J.E. Effects of AR Display Context Switching and Focal Distance Switching on Human Performance. IEEE Trans. Vis. Comput. Graph. 2019, 25, 2228–2241. [Google Scholar] [CrossRef] [PubMed]
  35. Kalra, P.; Karar, V. Impact of Symbology Luminance and Task Complexity on Visual Fatigue in AR Environments. In Technology Enabled Ergonomic Design; Nature: Singapore, 2022; pp. 329–338. [Google Scholar] [CrossRef]
  36. Begum, S.; Ahmed, M.U.; Funk, P.; Filla, R. Mental state monitoring system for the professional drivers based on Heart Rate Variability analysis and Case- Based Reasoning. In Proceedings of the 2012 Federated Conference on Computer Science and Information Systems (FedCSIS), Wroclaw, Poland, 9–12 September 2012; pp. 35–42. [Google Scholar]
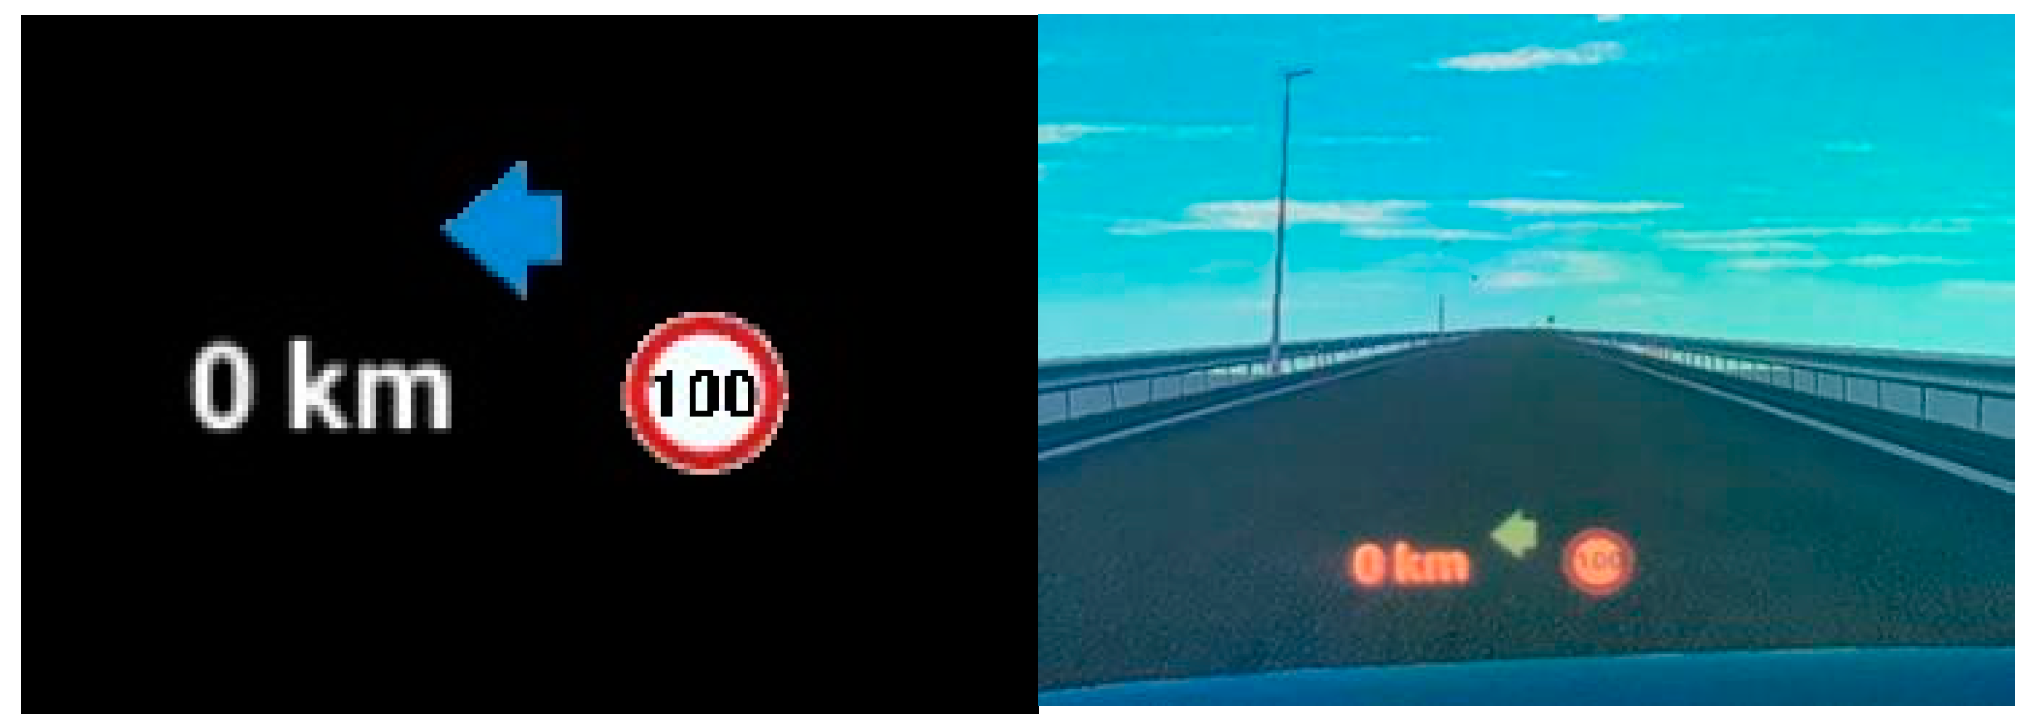
Figure 1. Single Depth.
Applsci 14 06441 g001
Figure 2. Dual Depth.
Applsci 14 06441 g002
Figure 3. Real car specifications.
Applsci 14 06441 g003
Figure 4. Driving simulator specifications.
Applsci 14 06441 g004
Figure 5. Experimental scenes (urban).
Applsci 14 06441 g005
Figure 6. Experimental scenes (one-line road).
Applsci 14 06441 g006
Figure 7. Experimental process.
Applsci 14 06441 g007
Figure 8. Time activity diagram of the driving process over time.
Applsci 14 06441 g008
Figure 9. Blink number difference time change chart.
Applsci 14 06441 g009
Figure 10. NASA-TLX working load comparison chart.
Applsci 14 06441 g010
Table 1. EEG energy intensity statistics.
Mean ± SD
Single-DepthDual-Depthp
F32.212 ± 0.5172.209 ± 0.5110.982
F41.968 ± 0.3901.949 ± 0.4070.208
P32.108 ± 0.5432.030 ± 0.5800.004 **
P45.499 ± 2.1805.621 ± 2.2410.253
O11.988 ± 0.3721.982 ± 0.4380.511
O22.084 ± 0.4832.160 ± 0.4740.000 ***
** p < 0.01, *** p < 0.001.
Table 2. NASA-TLX workload statistics.
Mean ± SD
Single-DepthDual-Depth
45.73 ± 12.1940.97 ± 17.06
Table 3. Blink count time change statistics table.
Mean ± SD
Single-DepthDual-Depthp
1–45 min2.981 ± 1.5952.789 ± 1.2360.432
46–90 min2.842 ± 1.2502.904 ± 0.7830.783
Disclaimer/Publisher’s Note: The statements, opinions and data contained in all publications are solely those of the individual author(s) and contributor(s) and not of MDPI and/or the editor(s). MDPI and/or the editor(s) disclaim responsibility for any injury to people or property resulting from any ideas, methods, instructions or products referred to in the content.