Article

An Effective Biochar Application for Reducing Nitrogen Emissions from Buffalo Digestate Storage Tank

by
Ester Scotto di Perta
1,
Paola Giudicianni
2,*,
Antonio Mautone
1,
Corinna Maria Grottola
2,
Elena Cervelli
1,
Raffaele Ragucci
2 and
Stefania Pindozzi
1,3,*
1
Department of Agricultural Sciences, University of Naples Federico II, 80055 Portici, Italy
2
Istituto di Scienze e Tecnologie per l’Energia e la Mobilità Sostenibili-CNR, 80125 Naples, Italy
3
BAT Center-Interuniversity Center for Studies on Bioinspired Agro-Environmental Technology, University of Naples Federico II, 80055 Portici, Italy
*
Authors to whom correspondence should be addressed.
Appl. Sci. 2024, 14(15), 6456; https://doi.org/10.3390/app14156456
Submission received: 25 June 2024 / Revised: 17 July 2024 / Accepted: 20 July 2024 / Published: 24 July 2024
(This article belongs to the Section Agricultural Science and Technology)

Abstract

:
Open manure storage contributes to the release of ammonia (NH3) into the atmosphere. Tank floating covers represent an effective technique to reduce NH3 emissions and biochar has been gain attention as a floating cover and as manure additive. Nevertheless, the mechanisms involved in the process still need to be elucidated since they are influenced by the biochar specific properties, application methods and dose. This work aims to study: (i) the biochar adsorption performances in an NH3 aqueous solution under conditions relevant to manure storage and (ii) the effect of different biochar application methods and dosage on NH3 emissions from buffalo digestate storage. The results show that a 43% reduction in NH3 emissions can be achieved by using biochar as a floating cover of 2 cm rather than as an additive. Moreover, the results show that the biochar produced at 550 °C acts as an adsorbent material for both NH4+ and NH3, by being adsorbed on the biochar surface in the form of NH4+ after H+ abstraction from the acid groups. A minimum cover height of 2 cm is required to give compactness and provide an additional resistance to the gas transfer, which is even more relevant than the adsorption in reducing NH3 emissions.

1. Introduction

Manure storage is one of the pillars of building systems on modern farms. Proper storage facilities are required to handle the increasing volumes of manure due to intensive livestock farming operations [1], which accounted for an annual European production of 1400 million tonnes of manure in 2013 [2].
Open manure storage is a common practice; however, the continuous N losses, mainly of ammonia (NH3), require farmers to take measures to save nutrients and reduce environmental risks [3] in compliance with EU Directive 2016/2284, also known as the National Emission Ceilings (NEC) Directive, such as by applying additives to manure or covering storage tanks.
Biochar is the carbon-rich solid product of biomass pyrolysis [4]. In general, biochar has been shown to be effective in reducing gas emissions from manure composting and in recovering nutrients from wastewater due to its sorption capacity [5]. However, it is only recently that biochar has been explored both as a manure additive [6] and a floating cover for storage tanks [7,8,9], thanks to its tuneable porosity, pH and surface chemistry [10]. Indeed, by acting on the pyrolysis conditions, depending on the initial feedstock composition, it is possible to direct the process toward conditions producing biochar with favourable characteristics for reducing ammonia emissions [11,12]. Kalus et al. [6] summarized the positive effects of biochar addition to different types of animal manure such as dairy cattle slurry and poultry litter in terms of reduction in greenhouse gases emission and retainment of nutrients. Similarly, many authors showed promising results when biochar is used as storage tank cover. Holly and Larson [13] reported a reduction of 96% of NH3 emissions covering the 16 L dairy digestate for a storage period of 7 weeks. Maurer et al. [14] recorded a reduction ranging between 13 and 23% with biochar application on swine manure surface of 2.28–4.56 kg/m2, respectively. Scotto di Perta et al. [8] found that a 2 cm layer of biochar can reduce up to about 80% of the NH3 emissions from manure storage tank in lab conditions. Covali et al. [15] obtained an NH3 emissions reduction of 48% with biochar application on digestate surface.
Biochar interacts with ammonia nitrogen dynamically through different mechanisms: (i) adsorbing NH4+ in the liquid phase onto the biochar layer partially immersed in the liquid at the top layer of the tank, (ii) adsorbing gaseous NH3 devolatilizing from the manure tank, (iii) altering the NH4+/NH3 equilibrium in the top layer of the liquid due to its typically basic pH, and (iv) providing a physical barrier at the liquid–surface interface, which reduces the gas transport between the manure surface and the atmosphere [16]. This is even more effective in the presence of adverse weather conditions (e.g., high wind speed) [16]. As reported by [17] in the presence of NH4+, electrostatic interaction and cation exchange are the main mechanisms involved. The presence of oxygen-containing functional groups, the negative charge on the biochar surface and the high Cation Exchange Capacity (CEC) [18] are found to be conductive to NH4+ adsorption. A positive correlation between CEC of pig manure derived biochar and NH4+ adsorption was found [19]. Although some authors have indicated that there is no direct correlation between the porosity and surface area of biochar and NH4+ adsorption [19], the microporous structure of biochar increases its selectivity towards NH4+ compared to larger molecules in real wastewater systems [20]. In case of gaseous NH3 adsorption it was observed that physio-sorption is the prevalent mechanism, with respect to chemio-sorption [21]. Biochar improves its adsorption performance as the presence of oxygen-containing functional groups acidic sites increases [22]. This observation was confirmed also in the case of polymer-based adsorbents (Lee et al., 2017) and Metal Organic Frameworks (MOFs) [23]. pH changes induced on the top layer by the presence of biochar are limited due to the high buffering capacity of manure, thus having negligible effects on the equilibrium shift towards NH4+ [24].
In the case of manure storage tank covers, all mechanisms coexist, and their relative importance depends firstly on the characteristics of biochar. It is therefore necessary to understand the relationship between biochar properties and NH4+-N and NH3 sorption, so that biochar production can be directed towards higher ammonia sorption, or existing biochars with specific properties can be selected for this purpose [25].
However, the method of biochar application also proved important, i.e., as a bio-mix [26] or bio-cover [27]. For example, it is likely that the role of biochar in adsorbing NH4+ from the manure top layer or altering manure pH can be minimized by the buoyancy of the biochar on the manure surface and by its hydrophobicity [15], whereas the thickness of the biochar layer can promote its role in adsorbing gaseous NH3 and creating a physical barrier. Moreover, the relative importance of the physical barrier offered by the biochar layer and the change induced by the biochar in the chemistry and biological activity at the manure–atmosphere interface is a relevant point to be addressed [28].
In this study a commercial biochar has been used to assess the role of the different mechanisms involved in the mitigation of NH3 emissions from manure digestate storage tank. To this aim, a preliminary evaluation of the biochar adsorption performances in an ammonia aqueous solution under different conditions relevant to manure storage has been carried out. Then, a lab-scale experimental design, including different biochar applications methods and dosage, has been performed to measure the performance of the biochar in mitigating NH3 emission. To this purpose, buffalo manure digestate storage was simulated, since buffalo breeding plays a central role in southern Italy for the production of top-quality products, such as mozzarella cheese [29].
The results give indications relevant to the development of optimal biochar application methods and support the use of biochar as a smart approach to promote environmental benefits and efficient resource use in the management of modern farms.

2. Materials and Methods

2.1. Characteristics of Materials

2.1.1. Livestock Digestate Characterization

The digestate used in these experiments was collected from a centralized biogas plant(managed by Power Rinasce Srl in S. Maria La Fossa) in Southern Italy (Caserta province, Campania region), receiving buffalo manure from surrounding local livestock farms. This area, together with the province of Salerno, represents 56% of the territory of the Campania region, where the highest number of buffalo heads are concentrated (more than 290,000 in 2019) in the whole of Italy [30].
Representative digestate samples were collected and pH, Dry Matter (DM), Total Ammoniacal Nitrogen (TAN) and Total Kjeldahl Nitrogen (TKN) were measured according to the standard method [31].

2.1.2. Biochar Characterization

Biochar was purchased from Nera Biochar S.r.l and was produced via pyrolysis (30 min) at 550 °C, using as feedstock mixed wood chips from Piedmont: elm tree, ash tree, chestnut and conifers. The choice of using a commercial biochar was dictated by the possibility of applying, after the storage period, the biochar cover mixed with digestate in the field as soil conditioner and fertilizer. This approach would provide significant benefits in the context of regenerative agriculture as recognized in the REDII-Implementing Regulation. Several European countries have aligned their regulations on the application of biochar as a soil conditioner, with the European Biochar Certificate indicating an H/Corg value of 0.7, a value met by the biochar used in the present work. The technical specifications provided by the biochar producer reported a C, H, N and ash content equal to 74.6, 2.0, 0.7, and 3.4 wt% dry basis (db), respectively. Oxygen content, calculated as difference, was 19.3 wt% db, whereas pH was ~10 and Brunauer–Emmett–Teller (BET) surface was 350 m2 g−1.
The concentration of total OH groups was measured adopting the Bohem titration procedure and provided a value of 0.0697 mmol g−1. The pH at point of zero charge (pHPZC) was evaluated using the salt addition method adapting the procedure described in [32]. A 0.1 M solution of NaNO3 at 30 °C was used as an electrolyte. The initial pH (pHi) was adjusted in a range of 2 to 12 using NaOH and HNO3 0.1 M solutions. A biochar dose of 5 g L−1 was used. The final pH values (pHf) were recorded in the remaining suspensions after shaking in a magnetic stirrer for 24 h at 400 rpm. The pHPZC, corresponding to the point where the difference between pHi and pHf was equal to 0, was 8.38.

2.2. Ammonia Emissions Assessment from Digestate Storage

Digestate storage was reproduced under laboratory conditions, employing cylindrical glass containers of 5 L and 16 cm diameter. To reduce the parameters influencing the emissions, the experiments were conducted inside a climate-controlled room at 20 °C. Temperature and humidity were checked once a day for the whole experimental period. Glass containers were filled with 3.5 L of digestate. Three different biochar application methods were adopted and compared. In the first test, 140 g of biochar, representing 4 wt% of the liquid digestate sample and about 7 kg m−2, were applied on the surface of the digestate to form a cover 2 cm thick; in the second test a similar configuration was adopted using 70 g of biochar forming a cover 1 cm thick; finally, 140 g of biochar was mixed with the liquid digestate and placed in the jar without any cover. Table 1 summarizes the three different conditions considered and their abbreviations.
Three replicates were made for each treatment for a total of 9 jars.
Ammonia emissions and pH values were monitored for the whole storing period of 84 days. To measure the pH, an access tube was placed in each jar in order to place the pH meter probe (MT51302523, Mettler Toledo (https://www.mt.com/it/it/home/products/Laboratory_Analytics_Browse/pH-meter/pH-meters/SG23-Meter.html, accessed on 24 June 2024)) below the manure surface without damaging the superficial layer of the biochar.
Ammonia emissions were measured with the dynamic chamber technique, as described by [9]. Specifically, the containers were closed only during the measurement activity to ventilate the headspace of the container once per minute. The airflow rate was adjusted by a flow meter. The containers were closed using a screw lid designed to let air in and to connect the container to an expansion chamber. The air exchange of 1.5 L min−1 was performed with a vacuum pump. Before the ammonia sampling, the pump was turned on for 20 min to create a steady condition. Real-time ammonia detection was run for 15 min with a gas-sensitive semiconductor and electrochemical sensors (Aeroqual, https://www.aeroqual.com/s-series-portable-air-monitors/series-500-portable-air-pollution-monitor, accessed on 24 June 2024).
The fluxes were evaluated as follows:
F = Q (Cout − Cin) A−1,
where Cin is the gas concentration of air inlet into the chamber in mg m−3; Cout is the gas concentration of air outlet from the chamber in mg m−3; Q is the airflow rate through the chamber in m3 h−1; and A the area of the emitting surface in m2.
Simultaneously, as suggested by [14], visual surface monitoring was performed every day, to macroscopically observe the cover performance during the storage period.
NH4+ adsorbed by the biochar after each storage trial was indirectly estimated using the method described in [33]. For this purpose, the biochar collected from each jar was mixed for homogenization. About 10 g of biochar were collected and washed with 1 l of distilled water to remove digestate residues from the biochar surface and then dried for 48 h at ambient temperature, avoiding possible ammoniacal nitrogen desorption. Then, 1 g of biochar was separated and dried for two hours at 105 °C to measure the residual moisture content needed for further calculations. At the same time, 5 g of biochar samples underwent desorption tests, adapted from [33], by adding 40 mL of 2 M KCl solution and placing the suspension on a magnetic stirrer for 2 h. Then, the suspension was filtered with a Büchner funnel, and the TAN of the filtered solution was measured. The desorbed NH4+ was compared to the potential adsorption capacity of the biochar (see Section 2.3).

2.3. Biochar Adsorption Mechanisms Study

Different adsorption tests were performed on biochar to determine the maximum adsorption capacity (qmax) and to assess the ability of biochar in adsorbing NH4+ or NH3 from an aqueous solution resembling the conditions established in the digestate storage tests 1B and Bm. The conditions of the adsorption tests are summarized in Table 2 and described in Section 2.3.1 and Section 2.3.2.

2.3.1. NH4+ Maximum Adsorption Capacity

The maximum adsorption capacity (qmax) was detected under laboratory batch adsorption experiments at room temperature using NH4Cl aqueous solutions at different concentrations, adapting the procedure described in [33]. A quantity of 0.5 g of the dried biochar was added into five Polyethylene (PE) vessels containing 40 mL of solution with 0, 5, 10, 50, or 100 mg/L of N-NH4+, respectively. Each solution was characterized in terms of initial N-NH4+ concentration. A biochar suspension in distilled water without NH4Cl was used as a blank run. The vessels containing the suspensions were closed to avoid evaporation and shaken at 400 rpm in a magnetic stirrer for 16 h. Then, the biochar was separated from the aqueous solution by vacuum filtration with MF-Millipore membrane filters, 3 µm pore size. Finally, the filtered solutions were analysed for determining TAN concentration using the spectrophotometric procedure of the indophenol blue method [34]. Adsorbed nitrogen was determined as the difference between the nitrogen concentration of the aqueous solutions before and after the adsorption tests.

2.3.2. Adsorption Tests Using Different Biochar Application Methods

Two adsorption tests were conducted using an NH4Cl aqueous solution simulating the conditions established in the manure storage experiments in terms of temperature, pH, NH4+ concentration and biochar dosage. Two different biochar application methods were used to assess separately the biochar ability to adsorb NH4+ (trial M) and NH3 (trial Bc). A schematic representation of the two application methods is reported in Figure 1.
Two open beakers were filled with 40 mL of an NH4Cl aqueous solution with an initial ammoniacal N concentration of 1 g L−1 and maintained ad 20 °C using a thermostatic bath for 48 h. The initial pH was adjusted to 8.8 using NaOH, to simulate the digestate conditions. Finally, a biochar load of 4% wt was applied in both experiments. In the first beaker, biochar was added to the liquid solution and continuously mixed on a magnetic stirrer at 400 rpm in order to maintain the biochar in contact with the liquid solution for the duration of the experiment. Under these conditions biochar could adsorb ammoniacal N present in the liquid solution mainly in form of NH4+, according to the NH3/NH4+ equilibrium established at 20 °C and pH = 8.8. In the second beaker, biochar was placed on a Teflon grid at the top of the vessel at a distance of 1 cm from the free surface of the solution, which was continuously stirred at 400 rpm. Under this configuration, any contact between the biochar cover and the liquid solution was avoided and only the volatilized NH3 could be adsorbed by the biochar cover during the experiment. After 48 h the pH was measured in both cases and the experiments were stopped. In the trial M, the biochar was separated from the suspension through vacuum filtration and dried for 48 h at ambient temperature to remove most of the moisture, avoiding possible ammoniacal N desorption. Then, it was subjected to NH4+ desorption experiments using the same procedure described in 2.2. The biochar used for the trial Bc was subjected to two subsequent desorption procedures. The first procedure was applied to detect possible physiosorbed NH3 [21]. This consisted in purging a biochar column with a 3 NL min−1 of N2 flow at 25 °C as described in [22] and detecting the desorbed NH3 through an FTIR analyser (Sick GME700, detection limits 0–4000 ppm) placed at the end of the biochar column. Then, the purified biochar was retrieved and subjected to the NH4+ desorption procedure described in Section 2.2 to detect NH3 adsorbed in NH4+ form on acidic functional groups present on the biochar surface [35].

3. Results

3.1. Storage Tests: Digestate Characteristics, NH3 Emissions, Surface Monitoring and Biochar Adsorption

After the storage tests, a representative sample of the digestate in each vessel was analyzed in three replicates (Table 3).
Compared to the initial digestate, the dry matter content increased, highlighting a reduction in the water content of the samples, especially for Bm, whose DM content is almost double the initial value. On the other hand, both TAN and TKN contents were found to decrease after the test. 2B showed the best behaviour, reducing its TAN content by half compared to the initial value.
In Figure 2 the NH3 emission rates are presented along with pH variations as function of time for the different storage tests performed when applying different biochar application methods.
For all the treatments, the ammonia emission rates decreased gradually, tending to zero approximately after 84 days. Initially, for 1B and 2B, NH3 emissions were very close to zero until the day 2 and 5, respectively, when an increase in the emission rates was reported, from 0.8 to 4.9 mg NH3 m−2 h−1 and from 0.4 to1.5, respectively. Differently, for Bm the emission rate was high even at the beginning of the test and monotonically decreases over time. The test 2B was characterized by a lower cumulative NH3 emission (10.38 ± 0.57 g NH3 m−2), while the cumulative NH3 emissions are 14.98 ± 0.43 and 18.08 ± 1.31 g NH3 m−2 for 1B and Bm, respectively. All treatments were significantly different (p < 0.05).
No significant difference was found for the pH trend during the experiment, which varied between 7.9–9.2, 7.9–9 and 7.9–8.9 for 2B, 1B and Bm respectively.
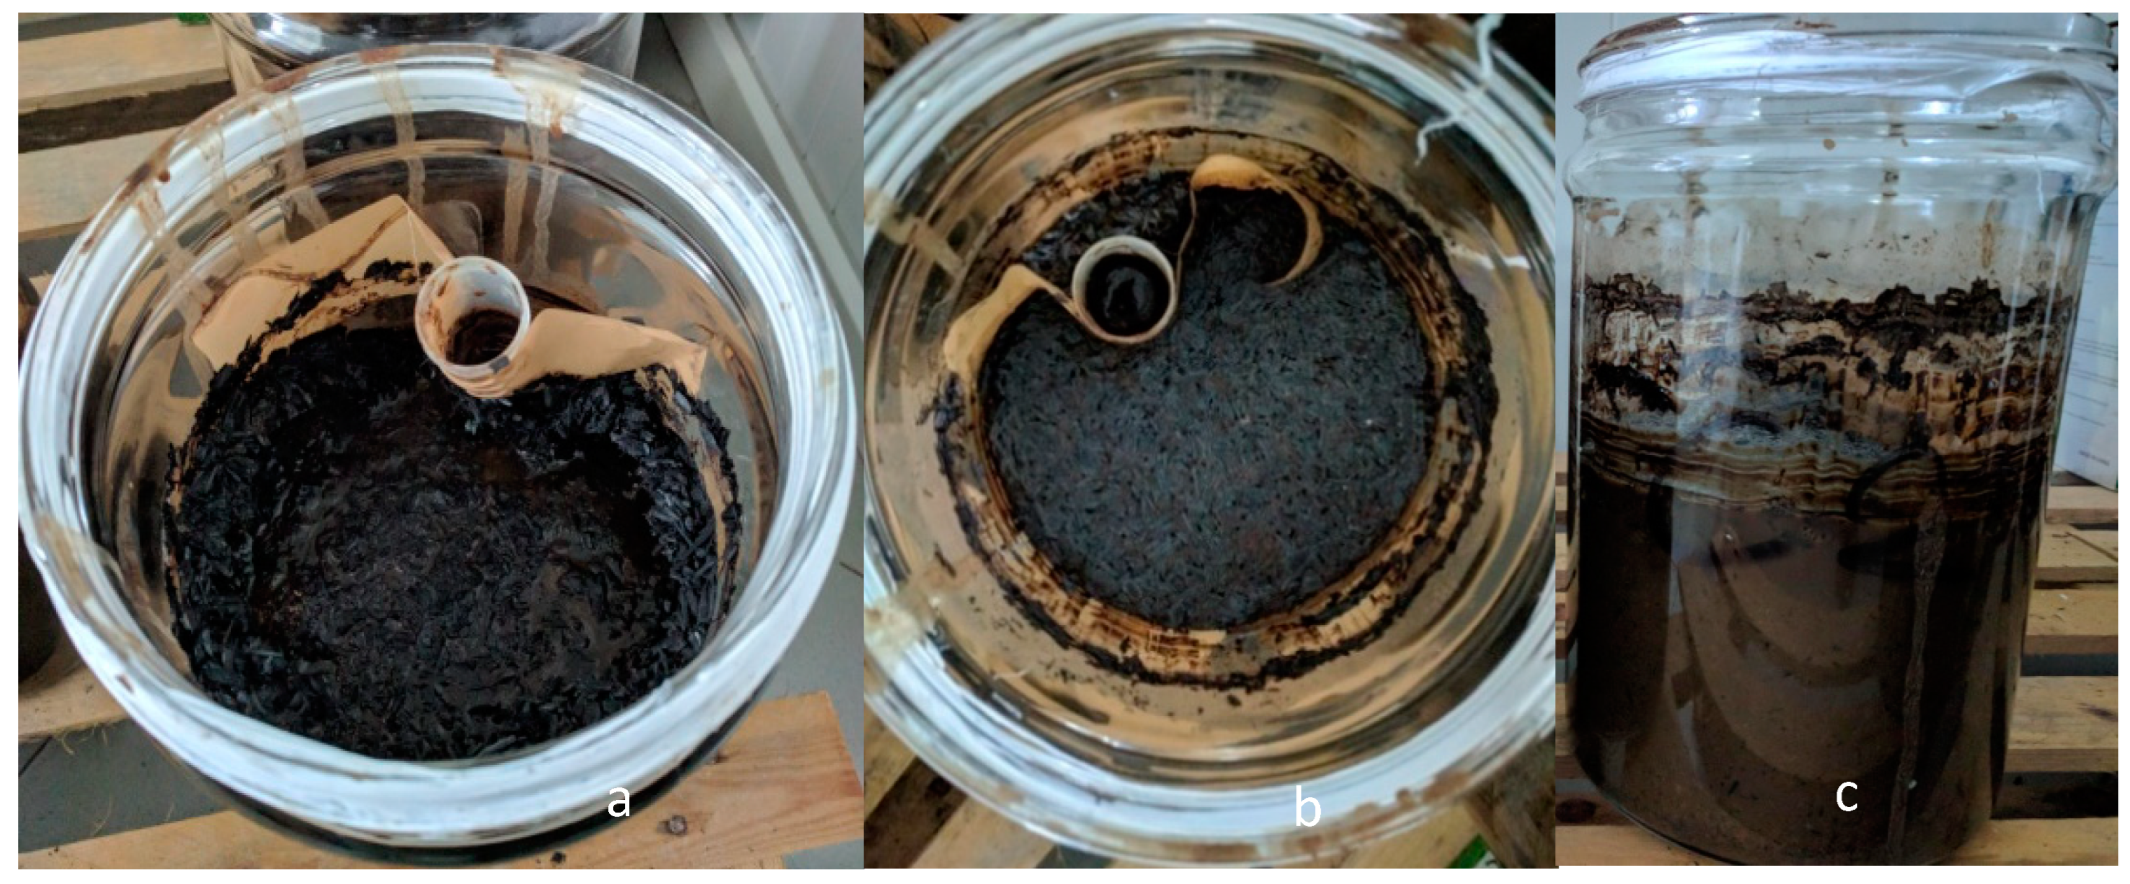
The surface of the digestate in each type of storage test changed substantially during the study. The 1B cover started breaking in the middle of the vessel and sinking after 21 days (in one of the replicates) consistently with the thinner and less resistant biochar layer (Figure 3a). At the same time, a slight increase in ammonia emissions was observed in one sample, from an average of 9.9 on day 16 to 13.1 g NH3 m−2 in the following days. During the following weeks, the other replicates went through the same process, resulting in an average emission rate of 11.8 g NH3 m−2.
After the first 21 days, Bm showed the formation of a crust made up of biochar previously mixed into the digestate (Figure 3b). The biochar started floating and formed a crust that thickened as time goes by. In this test, a reduction of the digestate volume/level was also noted, consistently with the water evaporation (Figure 3c) and the consequent increase in DM content at the end of the trial (Table 3).
The 2B cover remained almost intact until week 9. At the same time, a pick of 6.8 mg NH3 m−2 h−1 in the NH3 emission rate curve was observed; then the biochar cover started to be increasingly submerged by the liquid.
Biochar ammonia adsorption during the storage tests was assessed applying a N-NH4 desorption procedure. As a matter of fact, biochar from the test 2B desorbed 0.122 mg N-NH4 g−1biochar, while biochar from 1B desorbed 0.069 mg N-NH4 g−1biochar, consistently with the lower amount of thickness of the latter. A similar amount of adsorbed N was observed for Bm, which accounts for 0.075 mg N-NH4 g−1biochar, although the biochar amount in this test is the same as the test 2B.

3.2. Biochar Adsorption Mechanisms Study

3.2.1. NH4+ Biochar Adsorption Capacity

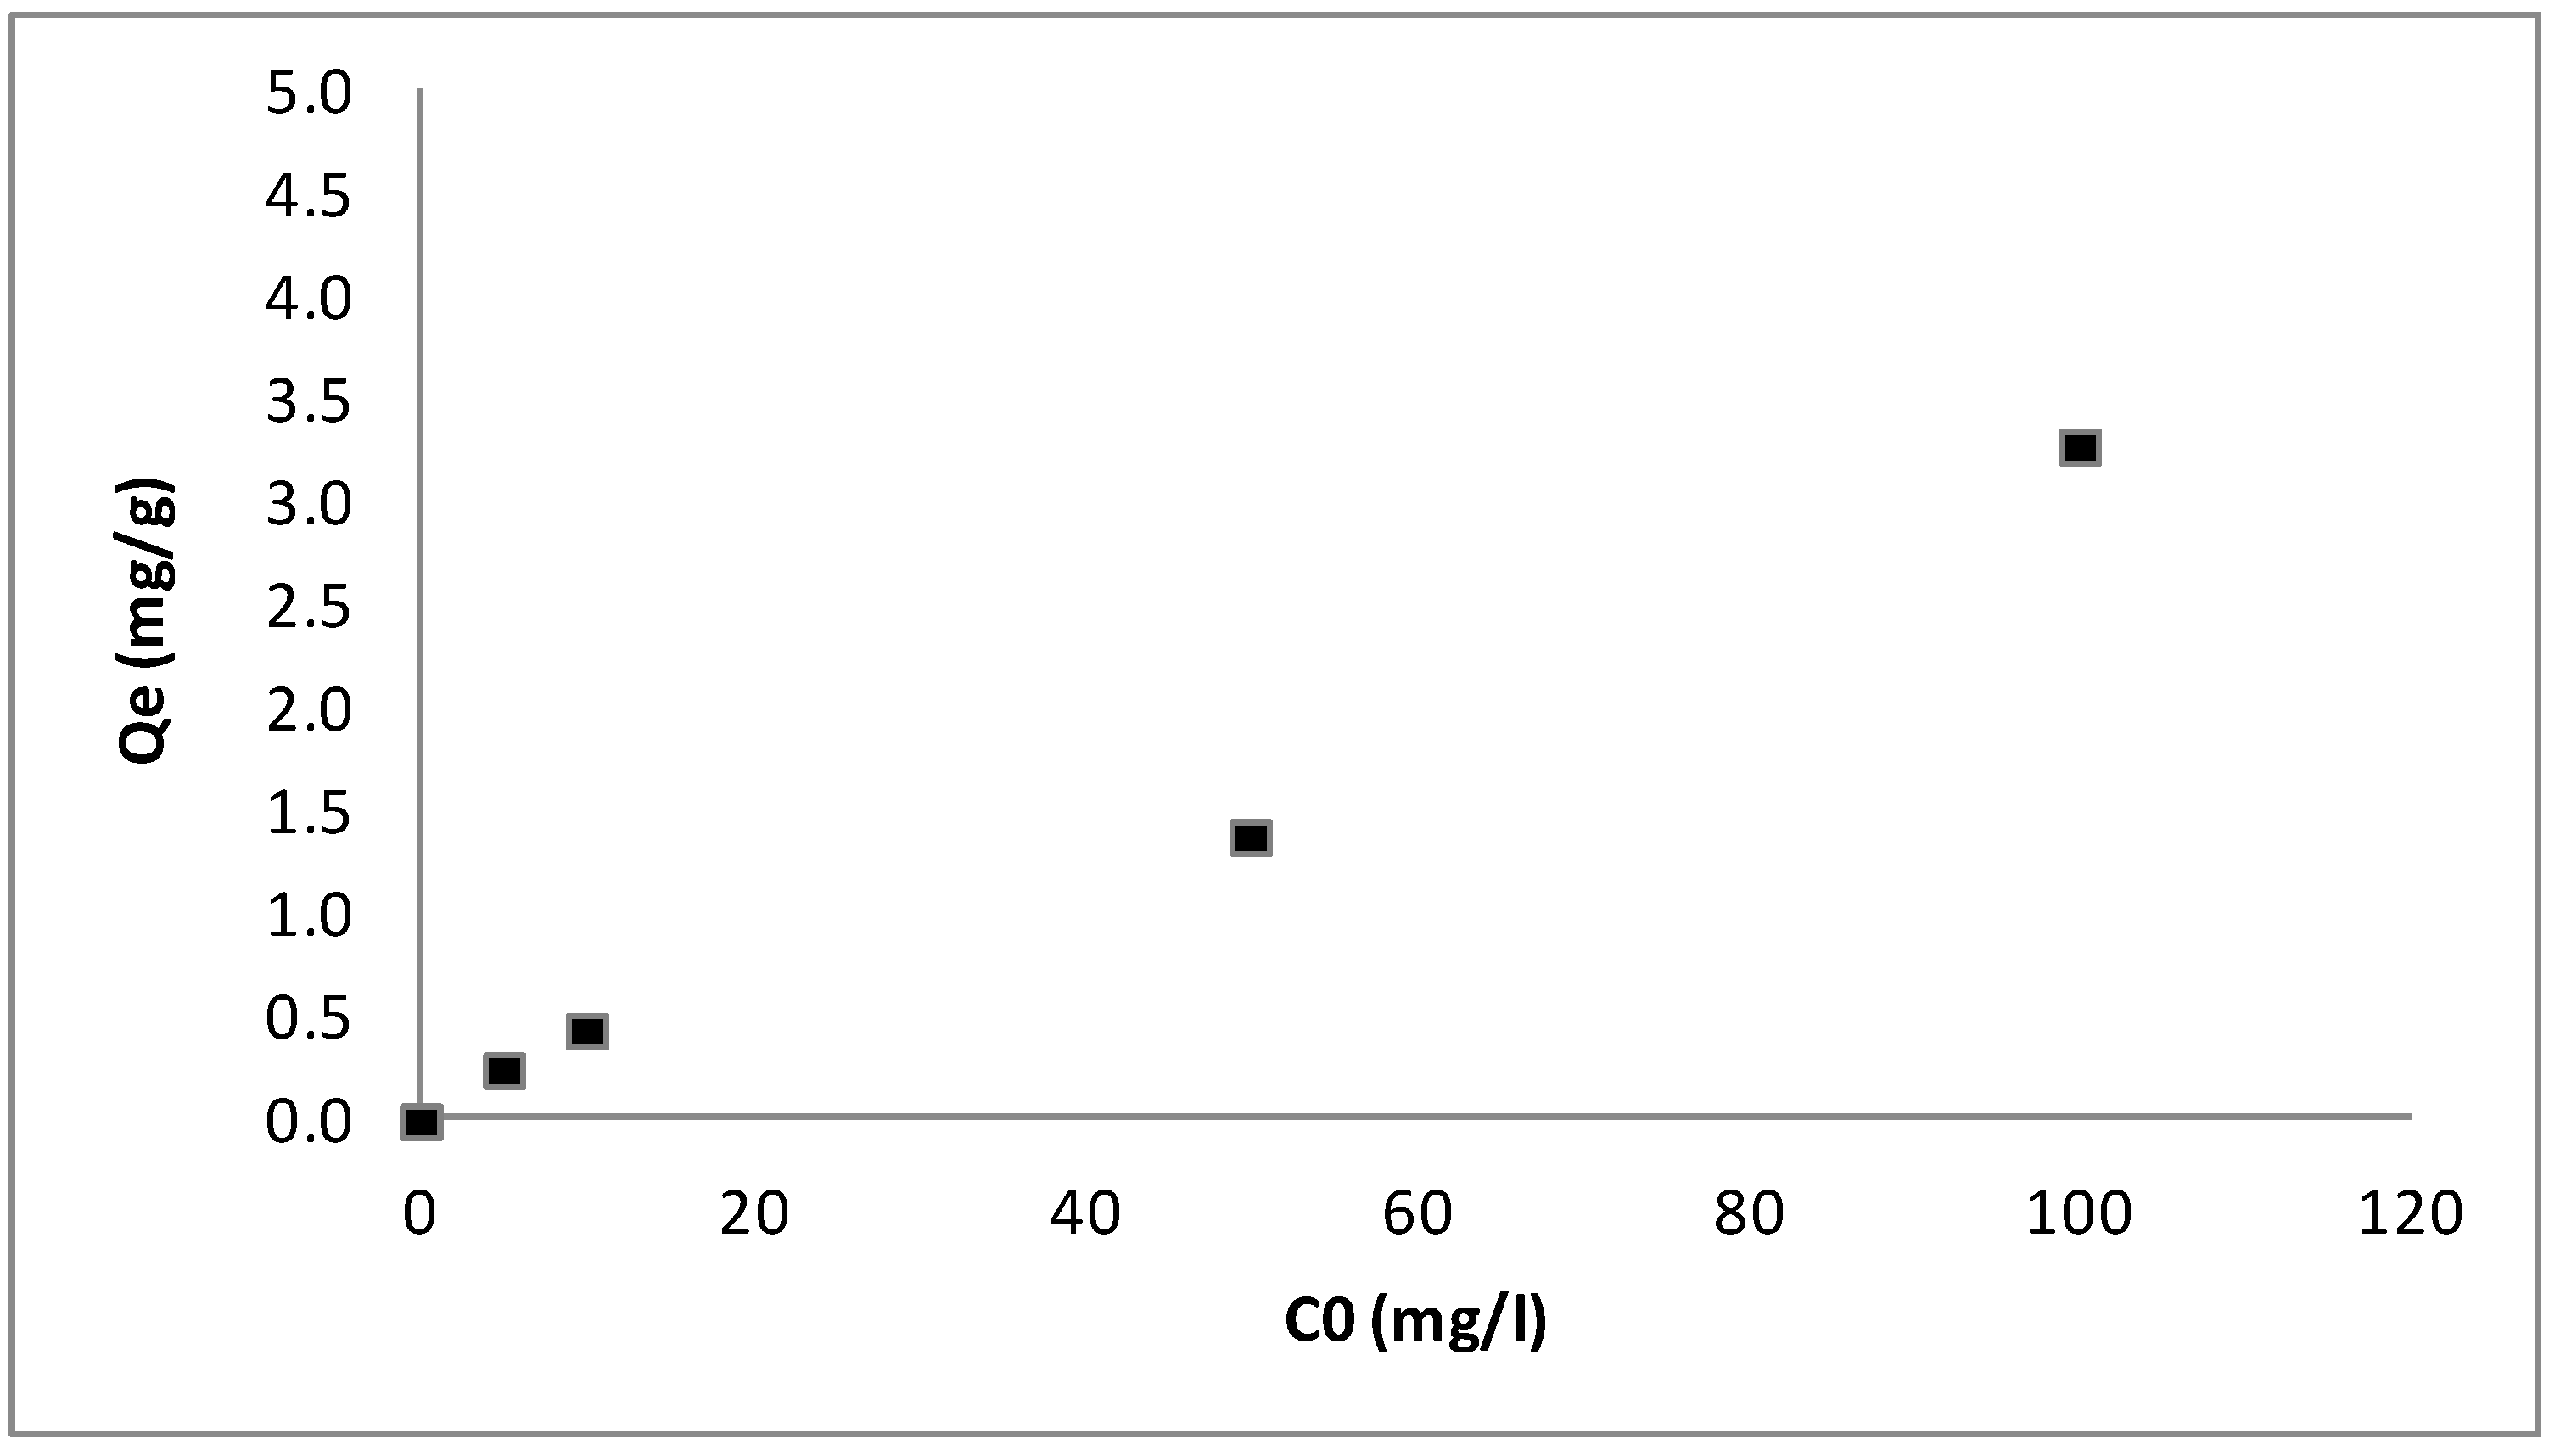
The effect of the initial concentration of N-NH4+ (C0) on the biochar equilibrium adsorption capacity (Qe) is reported in Figure 4. During the procedure, the pH of the solutions decreased from 6.3 to 5.7 as the N-NH4+ concentration increased from 5 to 100 mg/L. Biochar addition caused the increase of pH to values higher than 7.5. As shown, the adsorption capacity increased linearly as C0 increased, indicating that the saturation of the adsorption sites was not achieved in the investigated C0 range.

3.2.2. Assessment of Biochar Ammoniacal N Adsorption Mechanisms

The results of adsorption tests in aqueous NH4+Cl solutions using different biochar application methods are reported in Table 4. The ammoniacal N potentially adsorbed represents the difference between the ammoniacal N amounts in the M and Bc solutions before and after the adsorption tests reported on a biochar weight basis. Concentrations of N-NH3 and N-NH4+, expressed as mg/gbiochar, represent the actual amount of the different forms of ammoniacal N measured through the different desorption procedures. More specifically, concentrations of N-NH3 and N-NH4+ account for physically and chemically adsorbed N, respectively.
The loss of ammoniacal N in the M test is more than sixfold higher than that in the Bc test. On the other hand, the adsorption of ammoniacal N in form of NH4+ is higher in the Bc than in the M test, whereas no N-NH3 adsorption was detected in both tests.

4. Discussion

4.1. Ammonia Emissions

Biochar application during digestate storage reduced NH3 emission differently depending on biochar application methods and doses in agreement with the literature, where a wide variation range of NH3 reduction, from 0 to 96%, was reported for different application methods, doses, biochar characteristics and manure/digestate type. A summary of the literature data is reported in Table 5.
In some studies, mixing biochar with manure [5,28] or using it as a floating cover [14] had no positive effect on reducing NH3 volatilisation, suggesting that biochar did not significantly alter the pH and N dynamics in the stored manure [14,28], or if an increase in emission was observed, this may be due to the low adsorption capacity of biochar and the high TAN content of the manure [5]. In this study, lower NH3 emissions were observed for the 2B test (2 cm biochar layer), while in the 1B (1 cm biochar layer) and Bm (biochar mixed with digestate) tests, digestate emitted 44% and 74% of ammonia more than in the 2B case. These results confirm the findings reported by [13], which showed lower ammonia emissions when biochar was applied on the surface, with a maximum reduction with respect to the control of 96% obtained with wood biochar. On the other hand, opposite results were obtained by [15], reporting a greater emission mitigation (52%) in the case of biochar incorporated into digestate with respect to that in which biochar was applied on the surface. However, in this case, a low temperature biochar was used, which is, presumably, richer in oxygen containing functional groups typically involved in ammonia adsorption. In this study, the difference between the tests 2B and Bm, where the amount of biochar applied is the same, can be mainly attributed to the formation of a physical barrier in the test 2B. This hypothesis is confirmed by the final values of ammoniacal N concentrations in the digestate in the two tests which are in good agreement with the ammonia emissions reduction. The effect of the physical barrier is evident also in the highest water evaporation corresponding to the highest dry matter increase in absence of biochar surface layer. The effect of biochar cover in reducing ammonia emissions is more efficient when the mechanical resistance to surface cracks is higher due to the greater thickness, as results when comparing the emissions and the ammoniacal N in the digestate after the storage test in cases 2B and 1B. This observation was also supported by the different ammonia emissions observed in the NH4Cl aqueous solution resembling the digestate storage tests. In that case, NH3 devolatilization in Bc is significantly reduced by the presence of the biochar cover, probably due to the achievement of the equilibrium pressure in the headspace at the interface between the free NH3 dissolved in the solution and NH3 in air, according to Henry’s law [36]. On the contrary, in the M test, ammoniacal N is mostly released due to NH3 devolatilization, as confirmed by the reduction in pH of the solution from 8.8 to 7.6 observed during the test.

4.2. Biochar Adsorption Mechanisms

The biochar performance in terms of maximum adsorption capacity was not so notable, due to pH values lower than pHPZC (8.38). Under the conditions of the tests, NH4+/NH3 equilibrium was mainly shifted towards NH4+ and the charge distribution on the biochar surface was positive due to pH lower than pHPZC. In these conditions, the ammoniacal N adsorption through cation exchange between NH4+ and H+ on the biochar surface was not favoured due to the high concentration of H+ in the aqueous solution and the electrostatic repulsion between NH4+ and the positively charged biochar surface. However, when the conditions established during the manure storage tests (T = 20 °C, pH in the range 8–9 and ammoniacal N concentration equal to 1 g/L) were reproduced in the NH4Cl aqueous solution (tests M and Bc), according to NH4+/NH3 equilibrium at 20 °C, free NH3 concentration ranges between 4 and 29% and when pH is higher than 8.38 the charge distribution on the biochar surface shifts from positive to negative. Different mechanisms can occur under these conditions such as: (i) physio-sorption of gaseous NH3 in the biochar micropores [37], (ii) reaction of NH3 at the oxygen groups on the biochar surface leading to the formation of amines and amides [38], (iii) NH3 protonation at the acid functional groups on the biochar surface followed by NH4+ adsorption [38], (iv) NH4+ adsorption through cation exchange [37].
Table 5. Biochar application at storage in the literature.
Biochar CharacteristicsLiquid Stored CharacteristicsNH3 Emissions Reduction (%)Storage DurationRef.
Feedstock OriginPyrolisys Temperature (°C)pHpHPZCApplicationDoseTypeT (°C)pHDMTKN
corn stover5009.28.42One-Time surface Application2 kg/m2deep pit swine manure--4.6–8.2%4340–7350 mg/L338 weeks[39]
One-Time surface Application4 kg/m225
Bi-Weekly surface Reapplication2 kg/m253
red oak5007.56.75One-Time surface Application1.65 kg/m2swine manure-7.472.64%16.10%194 weeks[24]
84.07%13.37%21
7.552.6%11.88%39
corn stover5009.28.42One-Time surface Application2 kg/m27.472.64%16.10%18
84.07%13.37%21
7.552.6%11.88%4
blueleaf (softwood)4508.6_mixing with manure0, 2.5, 5, 10, and 25% biochar by volumeliquid swine217.449 g/kg11.1 mgN/Lno reduction21 days[28]
dairy slurry7.538 g/kg20.4 mgN/L
solid poultry manure9.4591 g/kg44.5 mgN/L
dynamotive (hardwood)7507.4_liquid swine7.449 g/kg11.1 mgN/L
dairy slurry7.538 g/kg20.4 mgN/L
solid poultry manure9.4591 g/kg44.5 mgN/L
pine495–5057.28_One-Time surface Application2.28 kg/m2swine manure12.588.50%10.6 g N/Lno reduction30 days[40]
4.56 kg/m212.7
two surface-applied biochar1.14 kg/m27.87.7%9.9 g N/Lno reduction35 days
2.28 kg/m2no reduction
reed canary3006.4_One-Time surface Application5% by weightdigestate-8.24.06%6.87%48240 days[15]
mixing with manure52
white birch4007.7_One-Time surface Application3.6% by weight (5 cm)Digested dairy manure20–217.741 g/kg46 g N/kg96%7 weeks[13]
_mixing with manure3.6% by weight (5 cm)7.728 g/kg88 g N/kg<96%
cob9.88_One-Time surface Application2.4% by weight (5 cm)7.727 g/kg54 g N/kg<<96%
_mixing with manure2.4% by weight (5 cm)7.742 g/kg50 g N/kg<<<96%
walnut shell
coconut shell
coal
50010.34
7.54
7.61
-mixing with manure5% by weightLiquid pig manure-6.16-28.0 gN/kgDMincreased the NH3 emissions by 4.00, 3.87, and 1.23 times,68 days[5]
wood chips: elm tree, ash tree, chestnut and conifers550108.38One-Time surface Application7 kg/m2 (2 cm)Digested buffalo manure208.146.22 g/kg20.63 g N/kg DMcontrol84 daysthis study
3.5 kg/m2 (1 cm)44% > control
mixing with manure7 kg/m274% > control
In this study, the physio-sorption of gaseous NH3 was not observed (see Table 4) since, as suggested by [17], NH3 physical interaction with the surface of the biochar is expected to be very weak due to the small size of the molecule. The results of the Bc test indicated that all the volatilized NH3 is adsorbed on the biochar surface in the form of NH4+ after H+ abstraction (NH3 protonation) from the acid groups on the biochar surface, whose presence is confirmed by the measured total acidity (0.0697 mmol/g). In this case, only a small reduction of pH from 8.8 to 8.4 is observed from the beginning to the end of the test, in agreement with the low amount of volatilized NH3. These findings are in good agreement also with [22], which showed similar ammoniacal N adsorption (0.84 mg/gbiochar) on wood shaving derived biochar produced at 500 °C. As observed by other authors [41,42], the greater the number of acidic functional groups (especially hydroxyl and carbonyl groups), the greater the NH3 adsorption capacity of the biochar.
Finally, the results of the M test showed that, under the conditions resembling the digestate storage tests, NH4+ adsorption through cation exchange was negligible. Indeed, only 2% of the ammoniacal N lost is adsorbed on the biochar surface in form of N-NH4+, and ammoniacal N is mostly released due to NH3 devolatilization. This result can be explained considering that the pH reduction from 8.8 to 7.6 determines a shift towards the NH4+ form of the ammoniacal nitrogen and a net positive charge on the biochar surface exerting an electrostatic repulsion against the NH4+ ions.
These observations are useful in elucidating the mechanisms occurring in the real case of digestate storage tests. In case of biochar cover remaining intact for all the storage test (case 2B), biochar adsorbed higher amount of N-NH4 than biochar mixed with digestate (case Bm), similarly to what has been observed for the tests with NH4Cl aqueous solutions, thus suggesting that the biochar used in this study has a greater ability to adsorb NH3 than NH4+. Differently from the NH4Cl aqueous solution in the case of biochar incorporation into the liquid (case M), in the real case of digestate test, given the buffering ability of digestate, the pH of the digestate remained higher and close to the pHPZC under conditions more favourable to NH4+ adsorption. However, in the real case. different ions other than H+ are in the water solution, which can interact with the biochar, affecting its adsorption selectivity towards ammoniacal N [43], as suggested by the lower N-NH4+ adsorbed by the biochar in the test Bm compared to the test M (i.e., 0.075 and 0.1 mg g−1, respectively). Moreover, in the real case, the macropores of the biochar, which represent the access routes of ammoniacal N to the adsorption sites, could be obstructed by digestate particles after the mixing of biochar and digestate, thus limiting the adsorption potential of the biochar [13].
When the biochar cover cracks and is submerged by the liquid digestate (case 1B), the adsorption ability is comparable to that of biochar mixed with the digestate, due to the reduced exposure of biochar to gaseous NH3.

5. Conclusions

In this study, the performance of a commercial biochar in mitigating the ammonia emissions from digestate storage tanks was evaluated and the main mechanisms involved have been discussed. The results of this study suggested that:
  • the biochar acts as an adsorbent material, both for NH4+ and NH3;
  • the main adsorption mechanism involves NH3 protonation on the biochar by H+ abstraction from the acid group’s surface to form NH4+. The adsorption of NH4+ through cation exchange is less relevant, whereas the physio-sorption of gaseous NH3 does not occur. Moreover, in this case there is not any issue related to digestate pH and to the possible competition with other cations in the liquid digestate;
  • when the biochar layer is floating and compact, it introduces an additional resistance to the gas transfer. This aspect is even more impacting than the NH3 adsorption on the NH3 emissions reduction. Nevertheless, it would be interesting to investigate biochar activation, which may increase the adsorption capacity of biochar, and test the possibility of further improving ammonia emission reduction.
Overall, the results show that a 43% reduction in NH3 emissions can be achieved by using biochar as a floating cover of 2 cm rather than as an additive. These findings suggests that biochar application as a cover should be preferred to its mixing with digestate, since the mitigation of ammonia emissions is mainly due to the increase of mass transfer resistance and gaseous NH3 adsorption. These thinner layers of biochar were considered to compete with conventional floating cover materials, which require greater thickness (10–20 cm). A greater thickness of biochar could be even more effective, but its economic viability should be investigated. However, further research into the durability of biochar layers in terms of resistance to weathering at farm scale would be of interest. Finally, a systematic study on the effect of surface chemistry is needed to clarify if the findings of this study can be extended to other types of biochars.

Author Contributions

Conceptualization, E.S.d.P., S.P. and P.G.; methodology, E.S.d.P., S.P. and P.G.; formal analysis, E.S.d.P., P.G., A.M. and C.M.G.; investigation, E.S.d.P., P.G., A.M. and C.M.G.; data curation, E.S.d.P. and P.G.; writing—original draft preparation, E.S.d.P. and P.G; writing—review and editing, E.S.d.P., P.G., A.M., C.M.G., R.R., E.C. and S.P.; supervision, S.P.; funding acquisition, S.P. All authors have read and agreed to the published version of the manuscript.

Funding

This study was carried out within the Next Generation EU Contributo alla spesa a valere sulla Missione 4–Componente 2. Dalla Ricerca all’Impresa-Investimento 1.1 Fondo per il Programma Nazionale della Ricerca (PNR) e Progetti di Ricerca di Rilevante Interesse Nazionale (PRIN): “Limit DGGas” funded by Italian Miur, CUP E53D23010780006 and received funding from the European Union Next-Generation EU (PIANO NAZIONALE DI RIPRESA E RESILIENZA (PNRR) —MISSIONE 4 COMPONENTE 2, INVESTIMENTO 1.4—D.D. 1032 17/06/2022, CN00000022). Agritech National Research Center. HORIZON-EIC-2022-PATHFINDERCHALLENGES-01-01–MINICOR-Project N. 101115506–MILD Combustion with Nitrogen and Carbon Dioxide Reforming. This manuscript reflects only the authors’ views and opinions, neither the European Union nor the European Commission can be considered responsible for them. Moreover, this study was carried out under the agreement “SPORFASS” (CUP B22D24000060002) of Campania Region, funded under the Rural Development, Program for 2014–2020.

Institutional Review Board Statement

Not applicable.

Informed Consent Statement

Not applicable.

Data Availability Statement

The original contributions presented in the study are included in the article; further inquiries can be directed to the corresponding author/s.

Acknowledgments

This study was carried out within the Next Generation EU Contributo alla spesa a valere sulla Missione 4–Componente 2. Dalla Ricerca all’Impresa-Investimento 1.1 Fondo per il Programma Nazionale della Ricerca (PNR) e Progetti di Ricerca di Rilevante Interesse Nazionale (PRIN): “Limit DGGas” funded by Italian Miur, CUP E53D23010780006 and the Agritech National Research Center, HORIZON-EIC-2022-PATHFINDERCHALLENGES-01-01–MINICOR-Project N. 101115506–MILD Combustion with Nitrogen and Carbon Dioxide Reforming and received funding from the European Union Next-Generation EU (PIANO NAZIONALE DI RIPRESA E RESILIENZA (PNRR)—MISSIONE 4 COMPONENTE 2, INVESTIMENTO 1.4—D.D. 1032 17/06/2022, CN00000022). This manuscript only reflects the authors’ views and opinions, and neither the European Union nor the European Commission can be considered responsible for them. Authors want to thank Campania Region, for the financial support under the agreement Sporfass.

Conflicts of Interest

The authors declare no conflicts of interest.

References

  1. Meiirkhanuly, Z.; Koziel, J.A.; Bialowiec, A.; Banik, C.; Brown, R.C. The Proof-of-the Concept of Biochar Floating Cover Influence on Swine Manure PH: Implications for Mitigation of Gaseous Emissions From Area Sources. Front. Chem. 2020, 8, 656. [Google Scholar] [CrossRef] [PubMed]
  2. Flotats, X.; Bonmatí, A.; Palatsi, J.; Foged, H.L. Trends on Manure Processing in Europe. In Proceedings of the 2nd International Conference of WASTES: Solutions, Treatments and Opportunities, Braga, Portugal, 11–13 September 2013; pp. 587–592. [Google Scholar]
  3. Finzi, A.; Riva, E.; Bicoku, A.; Guido, V.; Shallari, S.; Provolo, G. Comparison of Techniques for Ammonia Emission Mitigation during Storage of Livestock Manure and Assessment of Their Effect in the Management Chain. J. Agric. Eng. 2019, 50, 12–19. [Google Scholar] [CrossRef]
  4. Amin, F.R.; Huang, Y.; He, Y.; Zhang, R.; Liu, G.; Chen, C. Biochar Applications and Modern Techniques for Characterization. Clean. Technol. Environ. Policy 2016, 18, 1457–1473. [Google Scholar] [CrossRef]
  5. Liu, M.; Liu, C.; Liao, W.; Xie, J.; Zhang, X.; Gao, Z. Impact of Biochar Application on Gas Emissions from Liquid Pig Manure Storage. Sci. Total Environ. 2021, 771, 145454. [Google Scholar] [CrossRef]
  6. Kalus, K.; Koziel, J.A.; Opaliński, S. A Review of Biochar Properties and Their Utilization in Crop Agriculture and Livestock Production. Appl. Sci. 2019, 9, 3494. [Google Scholar] [CrossRef]
  7. Dougherty, B.; Gray, M.; Johnson, M.G.; Kleber, M. Can Biochar Covers Reduce Emissions from Manure Lagoons While Capturing Nutrients? J. Env. Environ. Qual. 2017, 46, 659–666. [Google Scholar] [CrossRef]
  8. Scotto di Perta, E.; Cervelli, E.; Di Nardo, B.; Caro, S.; Faugno, S.; Pindozzi, S. Monitoring of Ammonia Emissions from Stored Buffalo Digestate Covered with Biochar. In European Biomass Conference and Exhibition; ETA Florence: Florence, Italy, 2020; pp. 860–863. [Google Scholar] [CrossRef]
  9. Scotto di Perta, E.; Mautone, A.; Oliva, M.; Cervelli, E.; Pindozzi, S. Influence of Treatments and Covers on NH3 Emissions from Dairy Cow and Buffalo Manure Storage. Sustainability 2020, 12, 2986. [Google Scholar] [CrossRef]
  10. Giudicianni, P.; Pindozzi, S.; Grottola, C.M.; Stanzione, F.; Faugno, S.; Fagnano, M.; Fiorentino, N.; Ragucci, R. Pyrolysis for Exploitation of Biomasses Selected for Soil Phytoremediation: Characterization of Gaseous and Solid Products. Waste Manag. 2017, 61, 288–299. [Google Scholar] [CrossRef]
  11. Mandal, S.; Donner, E.; Vasileiadis, S.; Skinner, W.; Smith, E.; Lombi, E. The Effect of Biochar Feedstock, Pyrolysis Temperature, and Application Rate on the Reduction of Ammonia Volatilisation from Biochar-Amended Soil. Sci. Total Environ. 2018, 627, 942–950. [Google Scholar] [CrossRef]
  12. Zhang, J.; Wang, Q. Sustainable Mechanisms of Biochar Derived from Brewers’ Spent Grain and Sewage Sludge for Ammonia–Nitrogen Capture. J. Clean. Prod. 2016, 112, 3927–3934. [Google Scholar] [CrossRef]
  13. Holly, M.A.; Larson, R.A. Thermochemical Conversion of Biomass Storage Covers to Reduce Ammonia Emissions from Dairy Manure. Water Air Soil. Pollut. 2017, 228, 434. [Google Scholar] [CrossRef]
  14. Maurer, D.; Koziel, J.; Kalus, K.; Andersen, D.; Opalinski, S. Pilot-Scale Testing of Non-Activated Biochar for Swine Manure Treatment and Mitigation of Ammonia, Hydrogen Sulfide, Odorous Volatile Organic Compounds (VOCs), and Greenhouse Gas Emissions. Sustainability 2017, 9, 929. [Google Scholar] [CrossRef]
  15. Covali, P.; Raave, H.; Escuer-Gatius, J.; Kaasik, A.; Tõnutare, T.; Astover, A. The Effect of Untreated and Acidified Biochar on NH3-N Emissions from Slurry Digestate. Sustainability 2021, 13, 837. [Google Scholar] [CrossRef]
  16. Sommer, S.G.; Christensen, M.L.; Schmidt, T.; Jensen, L.S. Animal Manure Recycling: Treatment and Management. In Animal Manure Recycling: Treatment and Management; John Wiley & Sons: Hoboken, NJ, USA, 2013; pp. 1–364. [Google Scholar] [CrossRef]
  17. Han, B.; Butterly, C.; Zhang, W.; He, J.Z.; Chen, D. Adsorbent Materials for Ammonium and Ammonia Removal: A Review. J. Clean. Prod. 2021, 283, 124611. [Google Scholar] [CrossRef]
  18. Wang, Z.; Li, J.; Zhang, G.; Zhi, Y.; Yang, D.; Lai, X.; Ren, T. Characterization of Acid-Aged Biochar and Its Ammonium Adsorption in an Aqueous Solution. Materials 2020, 13, 2270. [Google Scholar] [CrossRef] [PubMed]
  19. Yu, Q.; Xia, D.; Li, H.; Ke, L.; Wang, Y.; Wang, H.; Zheng, Y.; Li, Q. Effectiveness and Mechanisms of Ammonium Adsorption on Biochars Derived from Biogas Residues. RSC Adv. 2016, 6, 88373–88381. [Google Scholar] [CrossRef]
  20. Tu, Y.; Feng, P.; Ren, Y.; Cao, Z.; Wang, R.; Xu, Z. Adsorption of Ammonia Nitrogen on Lignite and Its Influence on Coal Water Slurry Preparation. Fuel 2019, 238, 34–43. [Google Scholar] [CrossRef]
  21. Ramlogan, M.V.; Rabinovich, A.; Rouff, A.A. Thermochemical Analysis of Ammonia Gas Sorption by Struvite from Livestock Wastes and Comparison with Biochar and Metal-Organic Framework Sorbents. Environ. Sci. Technol. 2020, 54, 13264–13273. [Google Scholar] [CrossRef] [PubMed]
  22. Ro, K.S.; Lima, I.M.; Reddy, G.B.; Jackson, M.A.; Gao, B. Removing Gaseous NH3 Using Biochar as an Adsorbent. Agriculture 2015, 5, 991–1002. [Google Scholar] [CrossRef]
  23. Moribe, S.; Chen, Z.; Alayoglu, S.; Syed, Z.H.; Islamoglu, T.; Farha, O.K. Ammonia Capture within Isoreticular Metal-Organic Frameworks with Rod Secondary Building Units. ACS Mater. Lett. 2019, 1, 476–480. [Google Scholar] [CrossRef]
  24. Meiirkhanuly, Z.; Koziel, J.A.; Chen, B.; Białowiec, A.; Lee, M.; Wi, J.; Banik, C.; Brown, R.C.; Bakshi, S. Mitigation of Gaseous Emissions from Swine Manure with the Surficial Application of Biochars. Atmosphere 2020, 11, 1179. [Google Scholar] [CrossRef]
  25. Viaene, J.; Peiren, N.; Vandamme, D.; Lataf, A.; Cuypers, A.; Jozefczak, M.; Amery, F.; Vandecasteele, B. Screening Tests for N Sorption Allow to Select and Engineer Biochars for N Mitigation during Biomass Processing. Waste Manag. 2023, 155, 230–239. [Google Scholar] [CrossRef] [PubMed]
  26. Viaene, J.; Peiren, N.; Vandamme, D.; Lataf, A.; Cuypers, A.; Jozefczak, M.; Vandecasteele, B. Biochar Amendment to Cattle Slurry Reduces NH3 Emissions during Storage without Risk of Higher NH3 Emissions after Soil Application of the Solid Fraction. Waste Manag. 2023, 167, 39–45. [Google Scholar] [CrossRef] [PubMed]
  27. Baral, K.R.; McIlroy, J.; Lyons, G.; Johnston, C. The Effect of Biochar and Acid Activated Biochar on Ammonia Emissions during Manure Storage. Environ. Pollut. 2023, 317, 120815. [Google Scholar] [CrossRef] [PubMed]
  28. Hung, C.Y.; Hussain, N.; Husk, B.R.; Whalen, J.K. Ammonia Volatilization from Manure Mixed with Biochar1. Can. J. Soil Sci. 2021, 102, 177–186. [Google Scholar] [CrossRef]
  29. Esposito, L.; Vecchio, C.; Cattaneo, G.; Gu, Z.; Scotto di Perta, E. Addressing Challenges and Outcomes in the Biogas Sector: An Analysis of Efficiency, Economic Savings, and Environmental Impacts Using an Advanced SWOT Model. Energies 2023, 16, 7413. [Google Scholar] [CrossRef]
  30. Scotto di Perta, E.; Cervelli, E.; Grieco, R.; Mautone, A.; Pindozzi, S. GIS-Based Analysis to Assess Biogas Energy Potential as Support for Manure Management in Southern Italy. Acta IMEKO 2024, 13, 1–6. [Google Scholar] [CrossRef]
  31. Apha, A. Standard Methods for the Examination of Water and Wastewater; American Public Health Association: Washington, DC, USA; American Water Works Association: Washington, DC, USA; Water Environment Federation: Alexandria, VA, USA, 2005; Volume 21. [Google Scholar]
  32. Mahmood, T.; Saddique, M.T.; Naeem, A.; Westerhoff, P.; Mustafa, S.; Alum, A. Comparison of Different Methods for the Point of Zero Charge Determination of NiO. Ind. Eng. Chem. Res. 2011, 50, 10017–10023. [Google Scholar] [CrossRef]
  33. Wang, B.; Lehmann, J.; Hanley, K.; Hestrin, R.; Enders, A. Adsorption and Desorption of Ammonium by Maple Wood Biochar as a Function of Oxidation and PH. Chemosphere 2015, 138, 120–126. [Google Scholar] [CrossRef]
  34. Grasshoff, K.; Johannsen, H. A New Sensitive and Direct Method for the Automatic Determination of Ammonia in Sea Water. ICES J. Mar. Sci. 1972, 34, 516–521. [Google Scholar] [CrossRef]
  35. Taghizadeh-Toosi, A.; Clough, T.J.; Sherlock, R.R.; Condron, L.M. Biochar Adsorbed Ammonia Is Bioavailable. Plant Soil 2011, 350, 57–69. [Google Scholar] [CrossRef]
  36. Sommer, S.G.; Hutchings, N.J. Ammonia Emission from Field Applied Manure and Its Reduction—Invited Paper. Eur. J. Agron. 2001, 15, 1–15. [Google Scholar] [CrossRef]
  37. Mandal, S.; Thangarajan, R.; Bolan, N.S.; Sarkar, B.; Khan, N.; Ok, Y.S.; Naidu, R. Biochar-Induced Concomitant Decrease in Ammonia Volatilization and Increase in Nitrogen Use Efficiency by Wheat. Chemosphere 2016, 142, 120–127. [Google Scholar] [CrossRef]
  38. Spokas, K.A.; Novak, J.M.; Venterea, R.T. Biochar’s Role as an Alternative N-Fertilizer: Ammonia Capture. Plant Soil 2011, 350, 35–42. [Google Scholar] [CrossRef]
  39. Chen, B.; Koziel, J.A.; Banik, C.; Ma, H.; Lee, M.; O’brien, S.C.; Li, P.; Andersen, D.S.; Białowiec, A.; Brown, R.C. Mitigation of Gaseous Emissions from Stored Swine Manure with Biochar: Effect of Dose and Reapplication on a Pilot-Scale. Atmosphere 2021, 12, 96. [Google Scholar] [CrossRef]
  40. Chen, W.; Liao, X.; Wu, Y.; Liang, J.B.; Mi, J.; Huang, J.; Zhang, H.; Wu, Y.; Qiao, Z.; Li, X.; et al. Effects of Different Types of Biochar on Methane and Ammonia Mitigation during Layer Manure Composting. Waste Manag. 2017, 61, 506–515. [Google Scholar] [CrossRef]
  41. Chen, T.L.; Chen, L.H.; Lin, Y.J.; Yu, C.P.; Ma, W.H.; Chiang, P.C. Advanced Ammonia Nitrogen Removal and Recovery Technology Using Electrokinetic and Stripping Process towards a Sustainable Nitrogen Cycle: A Review. J. Clean. Prod. 2021, 309, 127369. [Google Scholar] [CrossRef]
  42. Shan, X.M.; Zhu, S.Q.; Zhang, W.H. Effect of Surface Modification of Activated Carbon on Its Adsorption Capacity for NH3. J. China Univ. Min. Technol. 2008, 18, 261–274. [Google Scholar] [CrossRef]
  43. Tan, X.; Liu, Y.; Zeng, G.; Wang, X.; Hu, X.; Gu, Y.; Yang, Z. Application of Biochar for the Removal of Pollutants from Aqueous Solutions. Chemosphere 2015, 125, 70–85. [Google Scholar] [CrossRef] [PubMed]
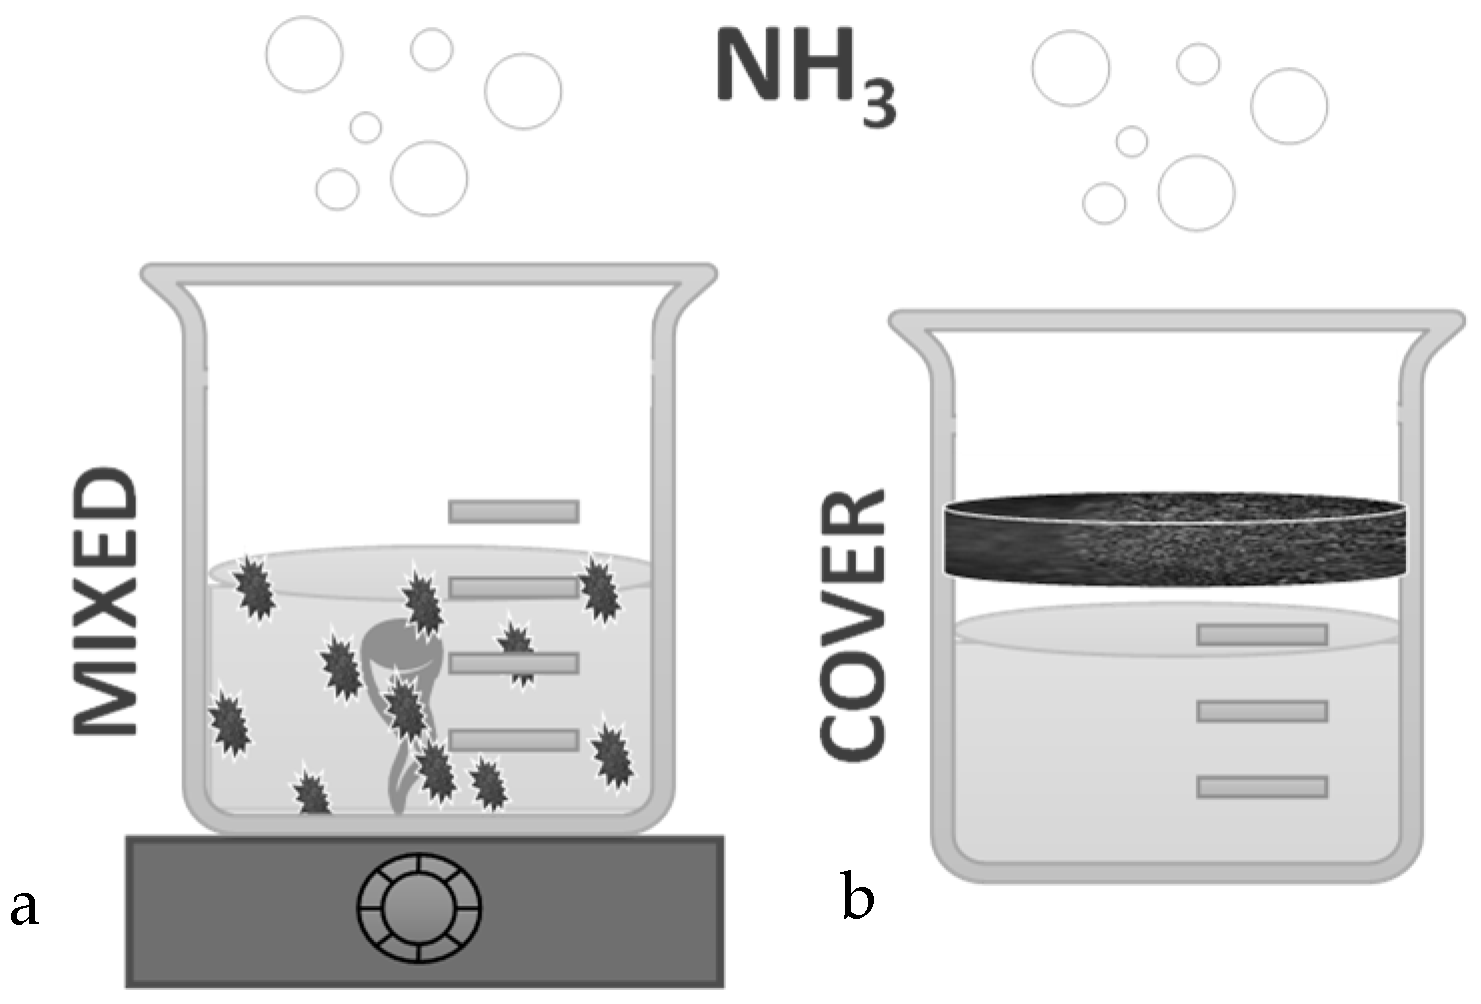
Figure 1. (a) Biochar mixed with the liquid solution (M) and (b) a biochar layer placed as a suspended cover on the liquid surface (Bc).
Applsci 14 06456 g001
Figure 2. NH3 emission rates and pH as function of time for 2B (2 cm biochar layer), 1B (1 cm biochar layer) and Bm (biochar mixed with digestate).
Applsci 14 06456 g002
Figure 3. (a) The 1B cover breaking and sinking after 21 days; (b) Biochar floating and forming a crust after 3 weeks; (c) Volume reduction consequent to water evaporation after 50 days.
Applsci 14 06456 g003
Figure 4. Biochar equilibrium adsorption capacity of NH4+ (Qe) at increasing concentrations of N-NH4+ (C0) (T = 25 °C).
Applsci 14 06456 g004
Table 1. Experimental set-up.
TreatmentN SourcepHT (°C)DurationReplicatesAbbreviation of Treatments
Biochar cover 2 cm thick Liquid fraction of digestate8–92084 days32B
Biochar cover 1 cm thick 1B
No cover, biochar mixed with the liquid solution Bm
Table 2. Synoptic list of adsorption tests.
AimBiochar ConditionSolutionAdsorbed Nitrogen AssessmentpHT (°C)DurationTest
To evaluate the maximum NH4+ adsorption capacity Biochar mixed with a NH4Cl solution in a closed batch experiment0, 5, 10, 50, and 100 mg/L of N-NH4+Differences in NH4+ concentrations before and after the trialunadjustedroom temperature16 hn.a.
To discriminate N adsorption as NH3 or NH4+Biochar mixed with a NH4Cl solution, in an open batch experiment1 g/L N-NH4Cl aqueous solution
  • Differences in NH4+ concentrations before and after the trial;
  • NH4+ desorbed from biochar.
8.82048 hM
Biochar as cover suspended 1 cm over the surface of a NH4Cl solution
  • Differences in NH4+ concentrations before and after the trial;
  • Detecting possible physisorbed NH3, purging biochar with N2;
  • NH4+ desorbed from biochar.
Bc
Table 3. Digestate characteristics before and after the treatments.
TreatmentDM
(g·kg−1)
TAN
(g·N·kgDM−1)
TKN
(g·N·kgDM−1)
No treatment46.22 ± 1.2320.63 ± 0.5747.46 ± 1.43
2B62.05 ± 1.2310.40 ± 1.0939.28 ± 2.78
1B66.78 ± 3.946.53 ± 0.5337.75 ± 0.86
Bm79.84 ± 2.856.34 ± 0.2233.57 ± 1.85
Table 4. N-NH3 and NH4 adsorbed in test 3.
TestsMBc
Ammoniacal N potentially adsorbed
(mg gbiochar−1)
5.13.4
N-NH3 (mg gbiochar−1)n.d.n.d.
N-NH4+ (mg gbiochar−1)0.11.2
Disclaimer/Publisher’s Note: The statements, opinions and data contained in all publications are solely those of the individual author(s) and contributor(s) and not of MDPI and/or the editor(s). MDPI and/or the editor(s) disclaim responsibility for any injury to people or property resulting from any ideas, methods, instructions or products referred to in the content.